Attached files
| file | filename |
|---|---|
| 8-K - 8-K - CITIZENS FINANCIAL GROUP INC/RI | d315713d8k.htm |
| EX-99.3 - EX-99.3 - CITIZENS FINANCIAL GROUP INC/RI | d315713dex993.htm |
| EX-99.1 - EX-99.1 - CITIZENS FINANCIAL GROUP INC/RI | d315713dex991.htm |
 4Q16 and FY2016 Financial Results
January 20, 2017
Exhibit 99.2 |
 Forward-looking statements and use of key performance metrics and Non-GAAP
Financial Measures 2
This document contains forward-looking statements within the Private Securities Litigation Reform Act of 1995. Any statement that does not describe historical or current facts is a forward-looking statement. These statements often include the words “believes,” “expects,” “anticipates,” “estimates,” “intends,” “plans,” “goals,” “targets,” “initiatives,” “potentially,” “probably,” “projects,” “outlook” or similar expressions or future conditional verbs such as “may,” “will,” “should,” “would,” and “could.” Forward-looking statements are based upon the current beliefs and expectations of management, and on information currently available to management. Our statements speak as of the date hereof, and we do not assume any obligation to update these statements or to update the reasons why actual results could differ from those contained in such statements in light of new information or future events. We caution you, therefore, against relying on any of these forward-looking statements. They are neither statements of historical fact nor guarantees or assurances of future performance. While there is no assurance that any list of risks and uncertainties or risk factors is complete, important factors that could cause actual results to differ materially from those in the forward-looking statements include the following, without limitation: negative economic conditions that adversely affect the general economy, housing prices, the job market, consumer confidence and spending habits which may affect, among other things, the level of nonperforming assets, charge-offs and provision expense; the rate of growth in the economy and employment levels, as well as general business and economic conditions; our ability to implement our strategic plan, including the cost savings and efficiency components, and achieve our indicative performance targets; our ability to remedy regulatory deficiencies and meet supervisory requirements and expectations; liabilities and business restrictions resulting from litigation and regulatory investigations; our capital and liquidity requirements (including under regulatory capital standards, such as the Basel III capital standards) and our ability to generate capital internally or raise capital on favorable terms; the effect of the current low interest rate environment or changes in interest rates on our net interest income, net interest margin and our mortgage originations, mortgage servicing rights and mortgages held for sale; changes in interest rates and market liquidity, as well as the magnitude of such changes, which may reduce interest margins, impact funding sources and affect the ability to originate and distribute financial products in the primary and secondary markets; the effect of changes in the level of checking or savings account deposits on our funding costs and net interest margin; financial services reform and other current, pending or future legislation or regulation that could have a negative effect on our revenue and businesses, including the Dodd-Frank Act and other legislation and regulation relating to bank products and services; a failure in or breach of our operational or security systems or infrastructure, or those of our third party vendors or other service providers, including as a result of cyber attacks; and management’s ability to identify and manage these and other risks. In addition to the above factors, we also caution that the amount and timing of any future common stock dividends or share repurchases will depend on our financial condition, earnings, cash needs, regulatory constraints, capital requirements (including requirements of our subsidiaries), and any other factors that our board of directors deems relevant in making such a determination. Therefore, there can be no assurance that we will pay any dividends to holders of our common stock, or as to the amount of any such dividends. More information about factors that could cause actual results to differ materially from those described in the forward-looking statements can be found under “Risk Factors” in Part I, Item 1A in our Annual Report on Form 10-K for the year ended December 31, 2015, filed with the United States Securities and Exchange Commission on February 26, 2016. Key performance metrics and Non-GAAP Financial Measures Key performance metrics: Our management team uses our key performance metrics (“KPMs”) to gauge our performance and progress over time in achieving our strategic and operational goals and also in comparing our performance against our peers. In connection with our path to becoming an independent public company, we established the following financial targets, in addition to others, as KPMs. These KPMs are utilized by our management in measuring our progress against financial goals and as a tool in helping assess performance for compensation purposes. These KPMs can largely be found in our Registration Statements on Form S-1 and our periodic reports, which are filed with the Securities and Exchange Commission, and are supplemented from time to time with additional information in connection with our quarterly earnings releases. Our key performance metrics include: Return on average tangible common equity (“ROTCE”); Return on average total tangible assets (“ROTA”); Efficiency ratio; Operating leverage; and Common equity tier 1 capital ratio (Basel III fully phased-in basis). In establishing goals for these KPMs, we determined that they would be measured on a management-reporting basis, or an operating basis, which we refer to externally as “Adjusted” results. We believe that these “Adjusted” results, which exclude restructuring charges, special items and and/or notable items, as applicable, provide the best representation of our underlying financial progress toward these goals as they exclude items that our management does not consider indicative of our on-going financial performance. We have consistently shown these metrics on this basis to investors since our initial public offering in September of 2014. Adjusted KPMs are considered Non-GAAP Financial Measures. Non-GAAP Financial Measures: This document contains Non-GAAP Financial Measures. The tables in the appendix present reconciliations of our Non-GAAP Financial Measures. These reconciliations exclude restructuring charges, special items and/or notable items, which are included, where applicable, in the financial results presented in accordance with GAAP. Restructuring charges and special items include expenses related to our efforts to improve processes and enhance efficiencies, as well as rebranding, separation from RBS and regulatory expenses. Notable items include certain revenue or expense items that may occur in a reporting period, which management does not consider indicative of on-going financial performance. The Non-GAAP Financial Measures presented in the appendix include “noninterest income”, “total revenue”, “noninterest expense”, “pre-provision profit”, “income before income tax expense”, “income tax expense”, “net income”, “net income available to common stockholders”, “other income”, “salaries and employee benefits”, “outside services”, “occupancy”, “equipment expense”, “other operating expense”, “net income per average common share”, “return on average common equity” and “return on average total assets.” We believe these Non-GAAP Financial Measures provide useful information to investors because these are among the measures used by our management team to evaluate our operating performance and make day-to-day operating decisions. In addition, we believe restructuring charges, special items and/or notable items in any period do not reflect the operational performance of the business in that period and, accordingly, it is useful to consider these line items with and without restructuring charges, special items and/or notable items. We believe this presentation also increases comparability of period-to-period results. Other companies may use similarly titled Non-GAAP Financial Measures that are calculated differently from the way we calculate such measures. Accordingly, our Non-GAAP Financial Measures may not be comparable to similar measures used by other companies. We caution investors not to place undue reliance on such Non-GAAP Financial Measures, but instead to consider them with the most directly comparable GAAP measure. Non-GAAP Financial Measures have limitations as analytical tools and should not be considered in isolation, or as a substitute for our results as reported under GAAP. |
 Table of contents
3 page 4Q16 highlights 4 4Q16 Adjusted financial summary 7 Adjusted FY2016 performance vs. guidance 25 FY2017 outlook 26 1Q17 outlook 31 Appendix 1 – Additional 2016 information 33 Appendix 2 – Key performance metrics, Non-GAAP Financial Measures and reconciliations 41 |
 Provision expense of $102 million increased $16 million from 3Q16, largely
reflecting lower recoveries Overall credit quality continues to
improve; NPLs decreased 6% QoQ to 97 bps of loans NPL coverage
ratio of 118% vs. 112% in 3Q16 and 115% in 4Q15 Allowance to
loans and leases of 1.15% vs. 1.18% in 3Q16 and 1.23% in 4Q15 reflects proactive effort to improve underlying credit quality Generated 8% YoY average loan growth, with strength in both commercial and retail
NII up 13% YoY and 4% QoQ
NIM of 2.90% improved 6 bps from 3Q16 and 13 bps YoY, driven largely by
improved loan yields Consumer
Banking initiatives – Solid deposit and loan growth, improvement in conforming mortgage volume, and strong sales force expansion, with a record 43 net mortgage loan officer hires during the quarter, as well as 12
financial consultants. Checkup has resulted in ~400,000 scheduled appointments
YTD Commercial
Banking initiatives – Strong loan growth of 10% YoY; capital markets fees remain at near record levels with continued momentum in global markets and treasury solutions 4Q16 highlights 4 1) Please see important information on Key Performance Metrics and Non-GAAP Financial Measures at the beginning of this presentation for
an explanation of their use and the appendix for their calculation
and/or reconciliation to GAAP Financial Measures, as applicable. Adjusted results exclude restructuring charges, special items and/or notable items, as applicable. 2) Current-period regulatory capital ratios are preliminary. Basel III ratios assume that certain definitions impacting qualifying Basel
III capital will phase in through 2019. Improving
profitability and
returns Strong capital, liquidity and funding Excellent credit quality Continued progress on strategic growth, efficiency and balance sheet optimization initiatives Robust capital levels with a common equity tier 1 ratio of 11.2% (2) ; TBV per share of $25.69, up 4% from 4Q15 Repurchased $180 million of common shares during the quarter at an average price of $28.71
4Q16 average deposits increased $7.8 billion, or 8% vs. 4Q15; average
loan-to-deposit ratio of 98% Diluted
EPS of $0.55 up 31% from 4Q15; down 2% from 3Q16 and up 6% from Adjusted 3Q16 levels Revenue of $1.4 billion, up 11% YoY and down 1% QoQ; Adjusted revenue up 4% QoQ Positive operating leverage YoY of 6% - efficiency ratio improved ~3.6 percentage points YoY to 62% (1) Continued progress with ROTCE of 8.4% compared to 6.7% in 4Q15 and 8.6%, or 8.0% on an Adjusted basis, in 3Q16 (1) (1) (1) |
 Restructuring charges, special items and/or notable items
5 $s in millions, except per share data 1) Please see important information on Key Performance Metrics and Non-GAAP Financial Measures at the beginning of this presentation for
an explanation of their use and the appendix for their calculation
and/or reconciliation to GAAP Financial Measures, as applicable. Adjusted results exclude restructuring charges, special items and/or notable items, as applicable. 2016 GAAP results include a net $19 million after-tax benefit tied to the 3Q16 TDR Transaction gain, partially offset by other costs associated with Asset Finance repositioning, TOP III efficiency initiatives and operational items. 2015 GAAP results were reduced by a net $31 million after tax in restructuring charges and special items related to enhancing efficiencies and improving processes across the organization and separation from The Royal Bank of Scotland Group plc (“RBS”). Restructuring charges, special items and/or notable items (1) 4Q16 change 2016 change ($s in millions, except per share data) 4Q16 3Q16 from 3Q16 2016 2015 from 2015 Pre-tax net noninterest income — $ 67 $ (67) $
67 $ — $ 67 $
After-tax noninterest income
— 41 (41) 41 — 41 Pre-tax total noninterest expense — (36) 36 (36) (50) 14 After-tax total noninterest expense — (22) 22 (22) (31) 9 Pre-tax restructuring charges, special items and notable items — 31 (31) 31 (50) 81 After-tax restructuring charges, special items and notable items — 19 (19) 19 (31) 50 Diluted EPS impact — $ 0.04 $ (0.04) $
0.04 $ (0.06) $ 0.10 $
|
 GAAP financial summary
6 1) Please see important information on Key Performance Metrics and Non-GAAP Financial Measures at the beginning of this presentation for
an explanation of their use and the appendix for their calculation
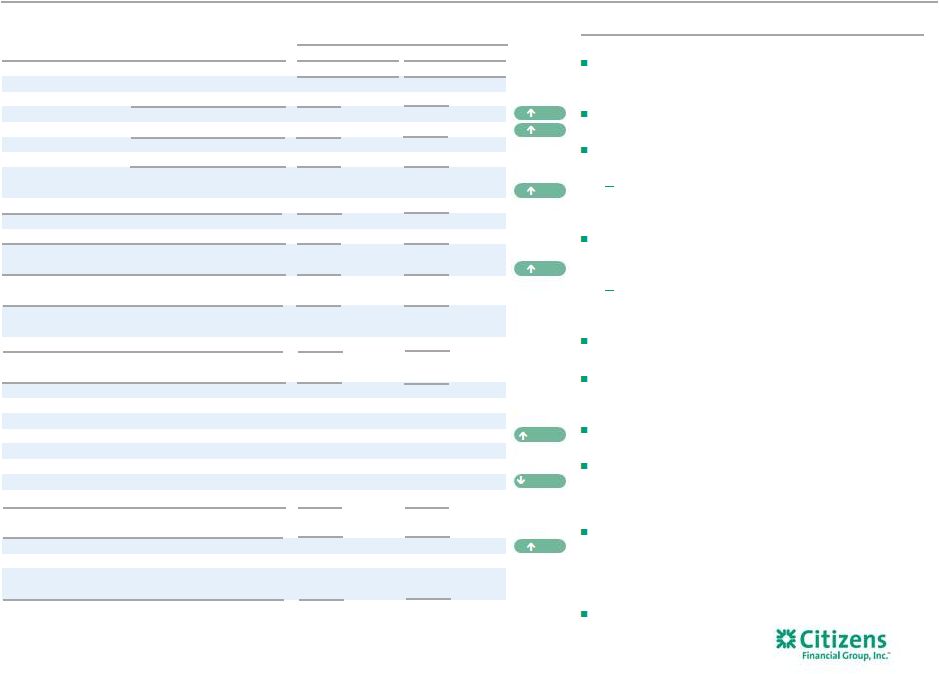
and/or reconciliation to GAAP Financial Measures, as applicable. Adjusted results exclude restructuring charges, special items and/or notable items, as applicable. 2) Includes held for sale. Loan-to-deposit ratio is period end. 3) Full-time equivalent employees. Linked quarter: Net income available to common stockholders down 3% and EPS down 2% from 3Q16 levels that included a net $19 million in after-tax notable items NII up $41 million, or 4%, reflecting 2% average loan growth and a 6 bp improvement in NIM given higher loan yields and rates Noninterest income decreased $58 million from 3Q16 levels that included a $72 million net TDR gain Noninterest expense decreased $20 million from 3Q16 levels that included $36 million of notable items in salaries and benefits, outside services and other Provision for credit losses increased $16 million Prior-year quarter: Net income available to common stockholders up 28%, reflecting strong revenue growth and expense discipline coupled with investments to drive future growth; diluted EPS up 31% NII up $116 million, or 13%, reflecting 8% average loan growth and a 13 bp improvement in NIM given higher loan yields Noninterest income up $15 million, largely reflecting growth in capital markets, mortgage banking, other income and FX & LC fees partially offset by the card reward accounting change impact and lower trust and investment services fees Noninterest expense up $37 million driven by growth in salaries and employee benefits, largely incentive compensation tied to revenue, as well as higher other expense, amortization of software, occupancy and equipment expense partially offset by lower outside services Provision for credit losses increased $11 million Highlights 4% 113 bps LQ excluding notable Items 2% 5% 4% 6% 41 bps 4Q16 change from $s in millions 4Q16 3Q16 4Q15 3Q16 4Q15 $ % $ % Net interest income 986 $ 945 $ 870 $ 41 $ 4 % 116 $ 13 % Noninterest income 377 435 362 (58) (13) 15 4 Total revenue 1,363 1,380 1,232 (17) (1) 131 11 Noninterest expense 847 867 810 (20) (2) 37 5 Pre-provision profit 516 513 422 3 1 94 22 Provision for credit losses 102 86 91 16 19 11 12 Income before income tax expense 414 427 331 (13) (3) 83 25 Income tax expense 132 130 110 2 2 22 20 Net income 282 $ 297 $ 221 $ (15) $ (5) 61 $ 28 Preferred dividends — $ 7 $ — $ (7) $ (100) — $ — Net income available to common stockholders 282 $ 290 $ 221 $ (8) $ (3) % 61 $ 28 % $s in billions Average interest-earning assets 135 $ 132 $ 124 $ 3 $ 2 % 11 $ 8 % Average deposits 109 $ 107 $ 101 $ 2 $ 2 % 8 $ 8 % Key performance metrics (1) Net interest margin 2.90 % 2.84 % 2.77 % 6 bps 13 bps Loan-to-deposit ratio (2) 98.6 97.9 96.9 77 168 ROACE 5.7 5.8 4.5 (12) 119 ROTCE 8.4 8.6 6.7 (15) 168 ROA 0.8 0.8 0.6 (6) 12 ROTA 0.8 0.9 0.7 (7) 12 Efficiency ratio 62.2 % 62.9 % 65.8 % (70) bps (358) bps FTEs (3) 17,639 17,625 17,714 14 0 % (75) (0) % Per common share Diluted earnings 0.55 $ 0.56 $ 0.42 $ (0.01) $ (2) % 0.13 $ 31 % Tangible book value (1) 25.69 $ 26.20 $ 24.63 $ (0.51) $ (2) % 1.06 $ 4 % Average diluted shares outstanding (in millions) 513.9 521.1 530.3 (7.2) (1) % (16.4) (3) % Growth in interest-rate products and leasing fees, mortgage banking income, FX & LC fees and securities gains largely offset by lower card fees Adjusted results (1) reflect lower salaries and benefits, more than offset by higher other expense, outside services and equipment expense (1) |
 7 1) Please see important information on Key Performance Metrics and Non-GAAP Financial Measures at the beginning of this presentation for
an explanation of their use and the appendix for their calculation
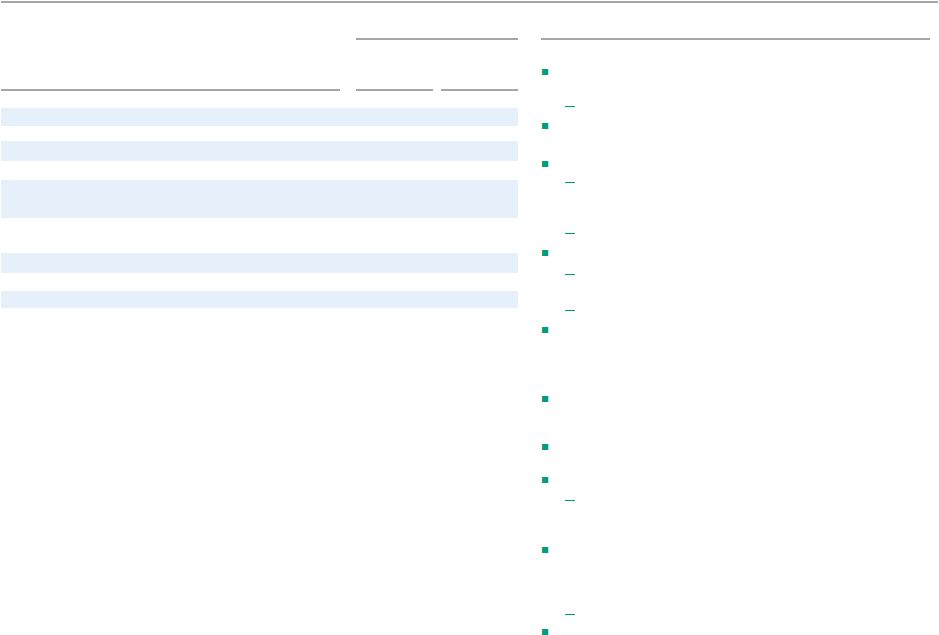
and/or reconciliation to GAAP Financial Measures, as applicable. Adjusted results exclude restructuring charges, special items and/or notable items, as applicable. Highlights Linked quarter: Net income available to common stockholders (1) of $282 million increased $11 million, or 4%, from Adjusted 3Q16 levels (1) NII up $41 million, or 4%, reflecting 2% average loan growth and a 6 bp
improvement in NIM given higher loan yields and rates
Adjusted noninterest income (1) increased $9 million, or 2% Adjusted noninterest expense (1) increased $16 million, or 2% Provision for credit losses up $16 million driven by higher net charge-offs tied to a $14 million reduction in recoveries and a $7 million increase tied to a one-time methodology change in auto Prior-year quarter: Net income available to common stockholders of $282 million increased $61 million, or 28%, reflecting 6.0% positive operating leverage. Diluted EPS of $0.55 increased 31% NII up $116 million, or 13%, reflecting 8% average loan growth and a 13 bp increase in NIM given higher loan yields and rates Noninterest income (1) increased $15 million, or 4% Noninterest expense (1) up $37 million, or 5%, driven by an increase in salaries and employee benefits, largely incentive compensation tied to
revenue as well as increased amortization of software and other
expense Provision for credit losses increased $11 million 4Q16 Adjusted financial summary (1) 4Q16 (1) change from $s in millions 4Q16 Reported 3Q16 Adjusted (1) Reported 4Q15 Adjusted 3Q16 Reported 4Q15 Net interest income 986 $ 945 $ 870 $ 4 % 13 % Noninterest income 377 368 362 2 4 Total revenue 1,363 1,313 1,232 4 11 Noninterest expense 847 831 810 2 5 Net income available to common stockholders 282 $ 271 $ 221 $ 4 % 28 % Key performance metrics (1) ROTCE (1) 8.4 % 8.0 % 6.7 % 41 bps 168 bps Efficiency ratio (1) 62.2 % 63.3 % 65.8 % (113) bps (358) bps Diluted EPS 0.55 $ 0.52 $ 0.42 $ 6 % 31 % Diluted EPS of $0.55 increased 6% (1) Reflecting growth in interest-rate products and leasing fees, mortgage banking income, FX & LC fees, partially offset by lower card fees Capital markets fees stable with strong 3Q16 results Lower salaries and benefits more than offset by higher other expense, outside services and equipment expense Adjusted efficiency ratio improved ~113 bps (1) Strength in capital markets, mortgage banking, other income and FX & LC fees were partially offset by the card reward accounting change impact and lower trust and investment services fees Efficiency ratio improved 358 bps (1) |
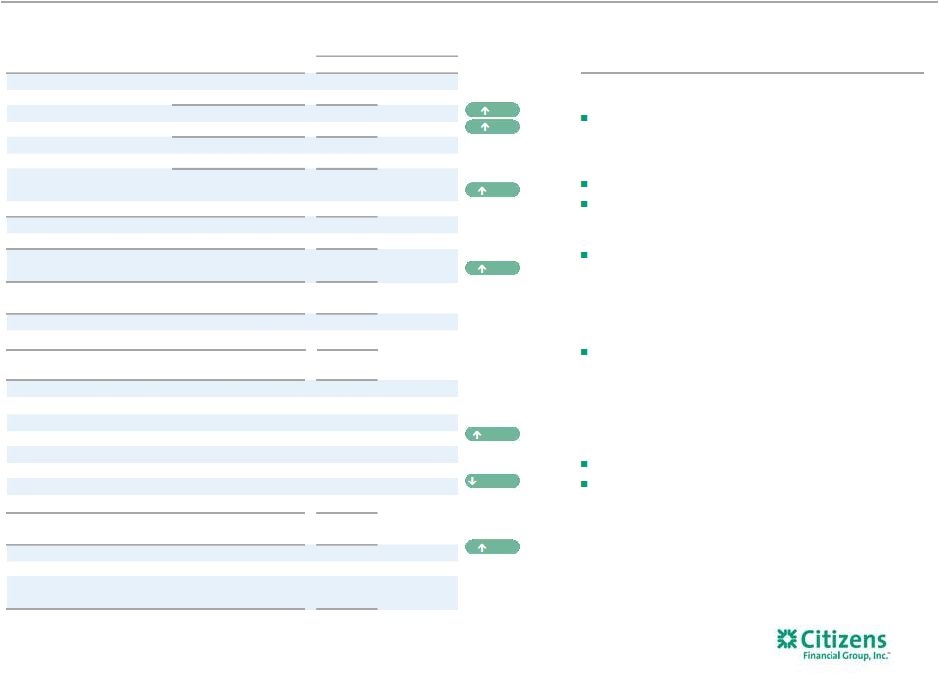 FY16 vs FY15: Net income available to common stockholders up $198 million, or 24%, from 2015. Includes a $50 million after-tax net benefit tied to the change in net restructuring charges, special items and notable items Diluted EPS of $1.97, up $0.42, or 27% NII up $356 million, reflecting 8% average loan growth and the benefit of balance sheet optimization strategies and higher rates Noninterest income increased $75 million, reflecting $67 million of notable items — Underlying results driven by strength in capital markets fees, service charges and fees and mortgage fees, partially offset by the card reward accounting change impact, lower securities gains and trust and investment services fees Noninterest expense increased $93 million from 2015 levels that included $50 million in restructuring charges, special items and notable items, $14 million more than in 2016 — Underlying results reflect higher salaries and employee benefits , amortization of software, equipment expense, occupancy and outside services, partially offset by lower other operating expense Provision for credit losses increased $67 million TBV per share of $25.69, up 4% 2016 GAAP financial summary 8 1) Please see important information on Key Performance Metrics and Non-GAAP Financial Measures at the beginning of this presentation for
an explanation of their use and the appendix for their calculation
and/or reconciliation to GAAP Financial Measures, as applicable. Adjusted results exclude restructuring charges, special items and/or notable items, as applicable. 2) Includes held for sale. Loan-to-deposit ratio is period end. 3) Full-time equivalent employees. Highlights 8% 260 bps YoY excluding restructuring charges/ notable 3% 14% 17% 20% 91 bps 2016 change from 2015 $s in millions 2016 2015 $ % Net interest income 3,758 $ 3,402 $ 356 $ 10 % Noninterest income 1,497 1,422 75 5 Total revenue 5,255 4,824 431 9 Noninterest expense 3,352 3,259 93 3 Pre-provision profit 1,903 1,565 338 22 Provision for credit losses 369 302 67 22 Income before income tax expense 1,534 1,263 271 21 Income tax expense 489 423 66 16 Net income 1,045 $ 840 $ 205 $ 24 Preferred dividends 14 $
7 $
7 $
100 Net income available to common stockholders 1,031 $ 833 $ 198 $ 24 % $s in billions Average interest-earning assets 131 $ 123 $ 8 $
6 % Average deposits (2) 105 $ 99 $
6 $
6 % Key metrics Net interest margin 2.86 % 2.75 % 11 bps Loan-to-deposit ratio (2) 98.6 96.9 168 ROACE 5.2 4.3 93 ROTCE 7.7 6.4 129 ROA 0.7 0.6 11 ROTA 0.8 0.7 11 Efficiency ratio 63.8 % 67.6 % (376) bps FTEs (3) 17,639 17,714 (75) (0) % Per common share Diluted earnings 1.97 $ 1.55 $ 0.42 $ 27 % Tangible book value (1) 25.69 $ 24.63 $ 1.06 $ 4 % Average diluted shares outstanding (in millions) 523.9 538.2 (14.3) (3) % items (1) |
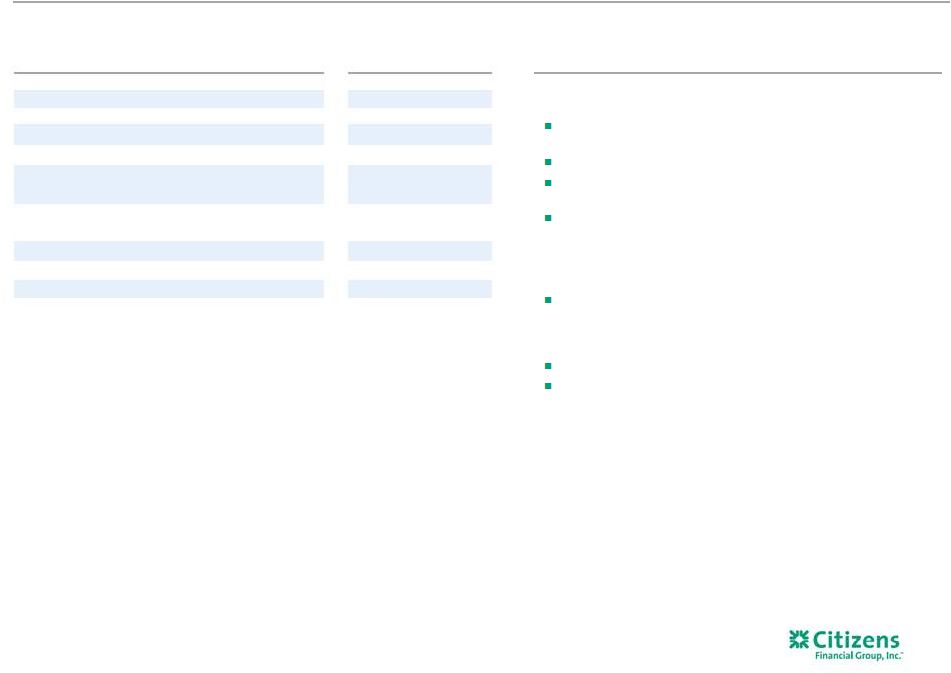 FY16 vs FY15: Net income available to common stockholders up $148 million, or 17%, from 2015 Diluted EPS of $1.93, up $0.32, or 20% NII up $356 million, reflecting 8% average loan growth and the benefit of
balance sheet optimization strategies and higher rates
Noninterest income increased 1% relative to 2015
— Strength in capital markets fees, service charges and fees and mortgage fees, was partially offset by the card reward accounting change impact, lower securities gains and trust and investment services fees Noninterest expense increased $107 million, or 3%, from 2015 levels — Results reflect higher salaries and employee benefits, amortization of software, equipment expense, outside services, and occupancy partially offset by lower other operating expense Provision for credit losses increased $67 million Efficiency ratio improved by 2.6%; positive operating leverage of 4.2% 9 Highlights 1) Please see important information on Key Performance Metrics and Non-GAAP Financial Measures at the beginning of this presentation for
an explanation of their use and the appendix for their calculation
and/or reconciliation to GAAP Financial Measures, as applicable. Adjusted results exclude restructuring charges, special items and/or notable items, as applicable. Adjusted 2016 financial summary (1) 2016 2015 2016 change from 2015 $s in millions Adjusted (1) Adjusted (1) $ % Net interest income 3,758 $ 3,402 $ 356 $ 10 % Noninterest income 1,430 1,422 8 1 Total revenue 5,188 4,824 364 8 Noninterest expense 3,316 3,209 107 3 Net income available to common stockholders 1,012 $ 864 $ 148 $ 17 % Key performance metrics (1) ROTCE (1) 7.6 % 6.7 % 91 bps Efficiency ratio (1) 63.9 % 66.5 % (260) bps Diluted EPS 1.93 $ 1.61 $ 0.32 $ 20 % |
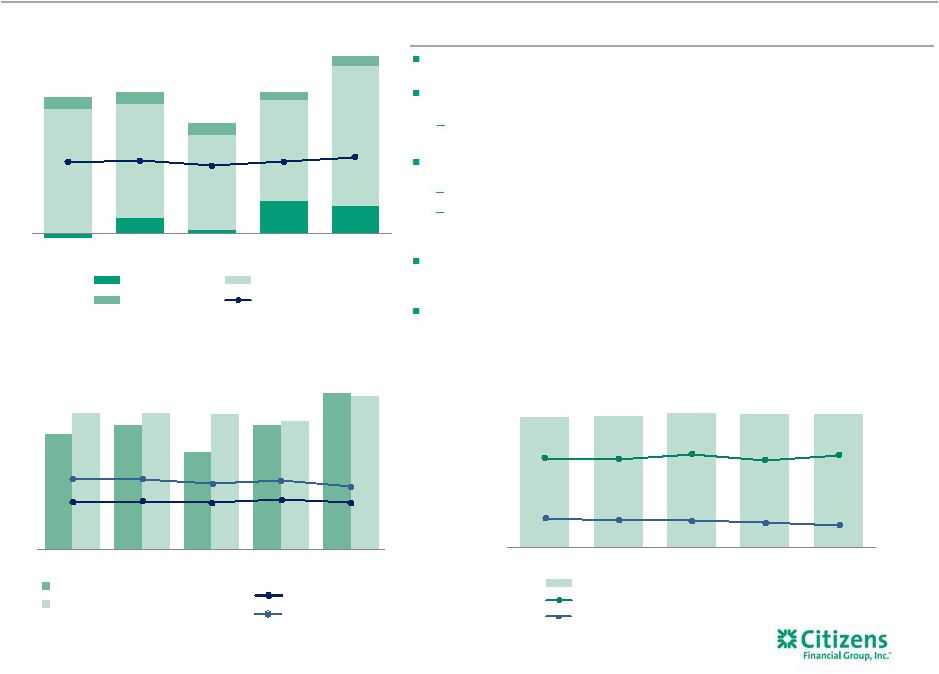
 Net interest income
10 Highlights 1) Includes interest-bearing cash and due from banks and deposits in banks.
Linked quarter:
NII up $41 million, or 4%
Reflects 2% average loan growth driven by commercial,
mortgage, other unsecured retail and student loans
NIM of 2.90% improved 6 bps from the third quarter 2016
Improved commercial and consumer loan yields, including the
benefit of an increase in LIBOR, as well as lower pay-fixed swap
costs, partially offset by an increase in deposit costs and the
impact of an increase in investment portfolio
balances Prior-year quarter:
NII up $116 million, or 13%, with NIM up 13 bps
8% average loan growth
Growth in NIM driven by improved loan yields, reflecting
continued pricing and portfolio-optimization initiatives, the
benefit from higher interest rates and a reduction in
pay-fixed swap costs
NIM benefits were partially offset by a reduction in investment
portfolio yields, which included a reduction in Federal Reserve
Bank stock dividends, as well as increased funding costs
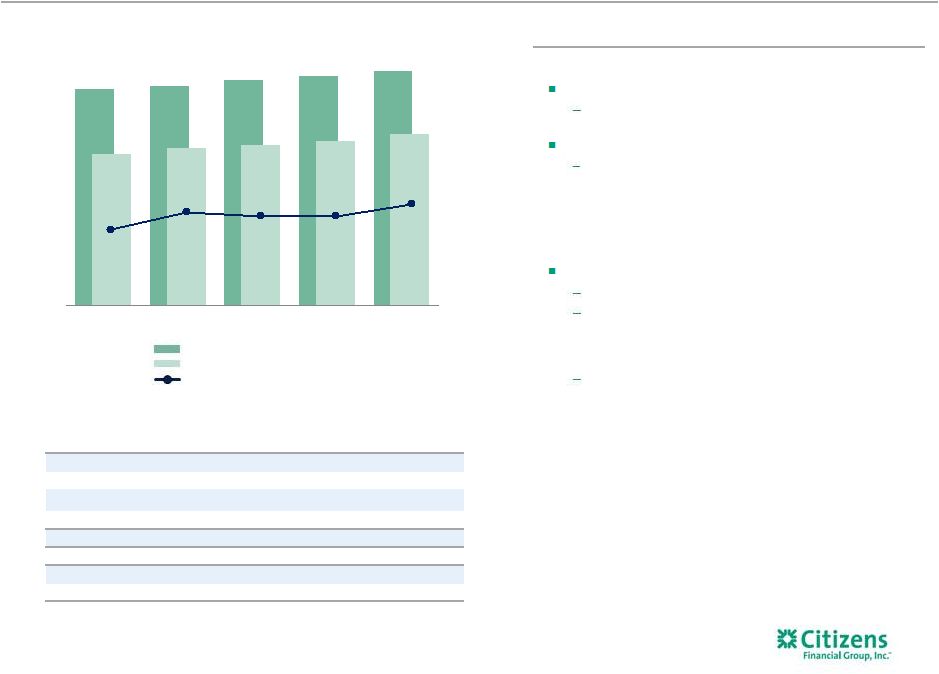
Net interest income
$s in millions,
except earning assets Average interest-earning assets Average interest-earning assets Net interest income Net interest margin $s in billions 4Q15 1Q16 2Q16 3Q16 4Q16 Retail loans 52.4 $ 53.2 $ 53.5 $ 54.3 $ 55.5 $ Commercial loans 45.8 47.0 49.1 49.7 51.0 Investments and cash (1) 25.7 25.5 26.0 27.1 27.7 Loans held for sale 0.3 0.4 0.8 0.5 0.6 Total interest-earning assets 124.2 $ 126.2 $ 129.5 $ 131.7 $ 134.8 $ Loan yields 3.34% 3.46% 3.48% 3.52% 3.58% Total cost of funds 0.41% 0.40% 0.42% 0.44% 0.44% $124B $126B $129B $132B $135B 870 904 923 945 986 4Q15 1Q16 2Q16 3Q16 4Q16 2.77% 2.86% 2.84% 2.84% 2.90% |
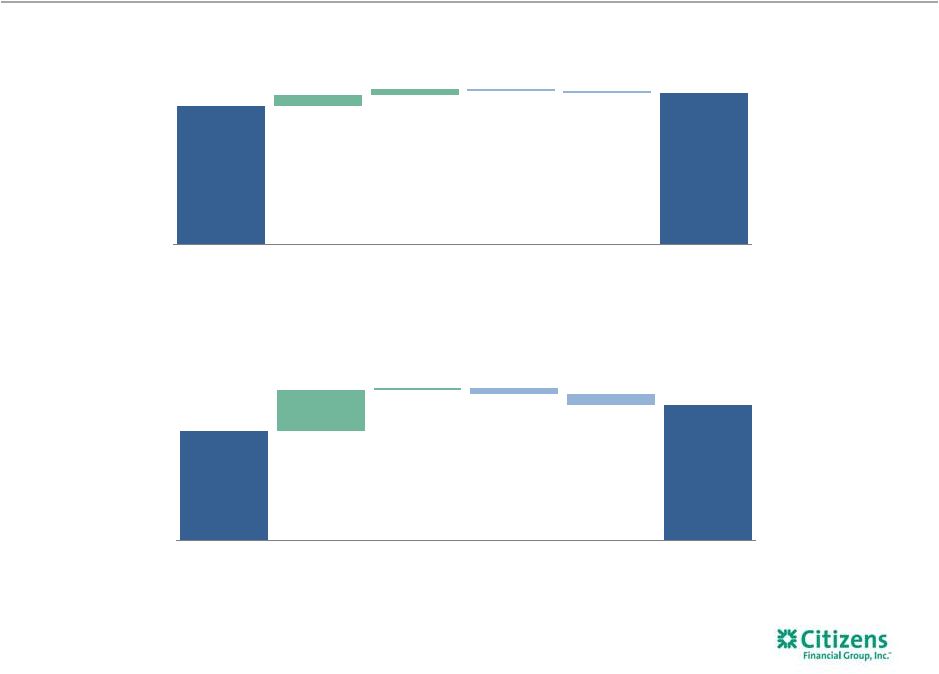 2.77% 2.90% 0.21% 0.01% (0.03)% (0.06)% 4Q15 NIM% Loan yields Borrowing costs/other Deposit costs Investment portfolio yield/growth 4Q16 NIM% 2.84% 2.90% 0.05% 0.03% (0.01)% (0.01)% 3Q16 NIM% Loan yields Borrowing costs/other Deposit costs Investment portfolio yield/growth 4Q16 NIM% Net interest margin 11 NIM walk 4Q15 to 4Q16 NIM walk 3Q16 to 4Q16 |
 1) Please see important information on Key Performance Metrics and Non-GAAP Financial Measures at the beginning of this presentation for
an explanation of their use and the appendix for their calculation
and/or reconciliation to GAAP Financial Measures, as applicable. Adjusted results exclude restructuring charges, special items and/or notable items, as applicable. $377 $368 $362 4Q16 3Q16 4Q15 Service charges and fees Card fees Trust and inv services FX & LC fees Mortgage banking fees Capital markets fee income Securities gains (losses) Adjusted other income Noninterest income Linked quarter: Noninterest income decreased $58 million, or 13%, from 3Q16 levels that included a $67 million benefit from notable items in other income Adjusted noninterest income (1) increased $9 million, or 2% Service charges and fees were up slightly Card fees declined modestly reflecting seasonally lower foreign ATM fees Mortgage banking fees increased $3 million reflecting improved mortgage servicing rights (“MSR”) valuation partially offset by lower
loan sales gains
Capital markets fees were flat, in line with near-record 3Q16 levels with
continued strong loan-syndications activity
FX & LC fees improved $2 million with continued momentum from
expanded capabilities
Securities gains of $3 million tied to portfolio adjustments
Prior-year quarter:
Noninterest income increased $15 million, or 4%
Capital markets fees increased $19 million, reflecting healthier market
conditions and ongoing momentum as we continue to broaden our
capabilities
Mortgage banking fees grew $16 million, reflecting higher application
and origination volumes with improved secondary mix, increased
loan sales and spreads and improved MSR valuation
Service charges and fees decreased $3 million on lower commercial
categories, including loan prepayment fees
Card fees were down $10 million from 4Q15 levels, largely reflecting
the card reward accounting change impact
Other income up $3 million from 4Q15 levels, driven by an increase in
interest-rate product revenue
12 Highlights $s in millions 4Q16 change from 4Q16 3Q16 4Q15 3Q16 4Q15 $ % $ % Service charges and fees 153 $ 152 $ 156 $ 1 $ 1 % (3) $ (2) % Card fees 50 52 60 (2) (4) (10) (17) Trust & investment services fees 34 37 39 (3) (8) (5) (13) Mortgage banking fees 36 33 20 3 9 16 80 Capital markets fees 34 34 15 — — 19 127 FX & LC fees 25 23 23 2 9 2 9 Securities gains, net
3 — 10 3 100 (7) (70) Other income 42 104 39 (62) (60) 3 8 Reported noninterest income
377 $ 435 $ 362 $ (58) $ (13) % 15 $ 4 % Restructuring charges, special items and/or notable items (1) — 67 — (67) (100) — NM Adjusted noninterest income (1) 377 $ 368 $ 362 $ 9 $ 2 % 15 $ 4 % Note: Other income includes bank-owned life insurance and other income.
(1) |
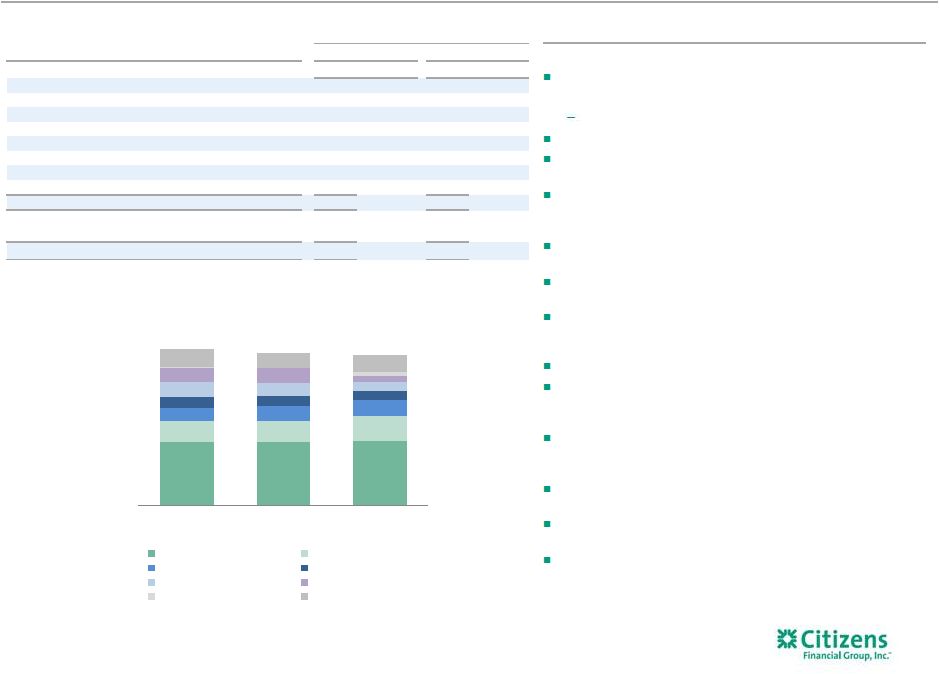
 4Q16 change from
4Q16 3Q16 4Q15 3Q16 4Q15 $ % $ % Salaries and benefits 420 $ 432 $ 402 $ (12) $ (3) % 18 $ 4 % Occupancy 77 78 74 (1) (1) 3 4 Equipment expense 69 65 67 4 6 2 3 Outside services 98 102 104 (4) (4) (6) (6) Amortization of software 44 46 38 (2) (4) 6 16 Other expense 139 144 125 (5) (3) 14 11 Reported noninterest expense 847 $ 867 $ 810 $ (20) $ (2) % 37 $ 5 % Adjusted salaries and benefits (1) 420 $ 421 $ 404 $ (1) $ (0) % 16 $ 4 % Occupancy 77 78 74 (1) (1) 3 4 Equipment expense 69 65 67 4 6 2 3 Adjusted outside services (1) 98 94 102 4 4 (4) (4) Adjusted amortization of software (1) 44 43 38 1 2 6 16 Adjusted other expense (1) 139 130 125 9 7 14 11 Adjusted noninterest expense (1) 847 $ 831 $ 810 $ 16 $ 2 % 37 $ 5 % Noninterest expense 13 Highlights (1) (1) (1) $s in millions Full-time equivalents (FTEs) 17,639 17,625 17,714 Linked quarter: Noninterest expense decreased $20 million, or 2%, from 3Q16 levels that included $36 million of notable items Adjusted noninterest expense (1) increased $16 million, or 2% Salaries and employee benefits expense decreased $12 million from 3Q16 levels and remained stable on an Adjusted basis (1) , as higher revenue-based incentives were largely offset by a reduction in benefits FTEs increased 14, as efficiency reductions largely offset strategic hiring Equipment expense increased $4 million, reflecting increased vendor contract license and maintenance costs Outside services down $4 million; increased $4 million on an Adjusted basis (1) , largely tied to consumer loan origination and servicing costs Amortization of software decreased $2 million Other expense decreased $5 million; up $9 million on an Adjusted basis (1) , reflecting higher fraud, legal and regulatory costs Prior-year quarter: Noninterest expense increased $37 million, or 5%, reflecting higher salaries and benefits, other expense and software amortization expense partially offset by the card reward accounting change impact Salaries and employee benefits up $16 million from Adjusted 4Q15 (1) , reflecting merit increases and higher revenue-based incentives FTEs decreased 75, reflecting the benefit of our our efficiency initiatives which more than offset sales force and strategic hiring Outside services decreased $4 million from Adjusted 4Q15 (1) , related to lower regulatory costs Amortization of software was up $6 million reflecting increased technology investments Other expense increased $14 million related to higher FDIC insurance expense and higher fraud, legal and regulatory costs 1) Please see important information on Key Performance Metrics and Non-GAAP Financial Measures at the beginning of this presentation for
an explanation of their use and the appendix for their calculation
and/or reconciliation to GAAP Financial Measures, as applicable. Adjusted results exclude restructuring charges, special items and/or notable items, as applicable. (1) $847 $831 $810 62% 63% 66% 4Q16 3Q16 4Q15 Adjusted all other Occupancy & equipment Adjusted salary and benefits Adjusted efficiency ratio |
 4Q16 change from
$s in billions 4Q16 3Q16 4Q15 3Q16 4Q15 $ % $ % Investments and interest bearing deposits 27.7 $ 27.1 $ 25.7 $ 0.6 $ 2 % 2.0 $ 8 % Total commercial loans 51.0 49.7 45.8 1.3 3 5.2 11 Total retail loans 55.5 54.3 52.4 1.2 2 3.1 6 Total loans and leases
106.5 104.0 98.2 2.5 2 8.3 8 Loans held for sale
0.6 0.5 0.3 0.0 3 0.2 65 Total interest-earning assets 134.8 131.7 124.2 3.1 2 10.6 8 Total noninterest-earning assets
12.6 12.7 12.1 (0.2) (1) 0.5 4 Total assets 147.3 $ 144.4 $ 136.3 $ 2.9 $ 2 11.0 $ 8 Low-cost core deposits
(1) 57.5 56.2 52.7 1.3 2 4.9 9 Money market deposits
38.4 37.6 36.5 0.8 2 1.9 5 Term deposits
13.2 12.8 12.2 0.4 3 1.0 8 Total deposits 109.1 $ 106.6 $ 101.4 $ 2.5 $ 2 7.8 $ 8 Total borrowed funds 15.2 14.4 12.6 0.8 6 2.6 21 Total liabilities 127.4 $ 124.3 $ 116.7 $ 3.1 $ 2 10.7 $ 9 Total stockholders' equity 19.9 20.1 19.6 (0.2) (1) 0.3 1 Total liabilities and equity
147.3 $ 144.4 $ 136.3 $ 2.9 $ 2 % 11.0 $ 8 % Consolidated average balance sheet Linked quarter: Total earning assets up $3.1 billion, or 2%, with loan growth of $2.5 billion, or 2% — Retail loans up $1.2 billion, or 2%, driven by growth in Home Mortgage, Education Finance and Consumer Unsecured, partially offset by Home Equity — Commercial loans up $1.3 billion, or 3%, on continued strength in Mid-corporate and Industry Verticals and Commercial Real Estate Total deposits increased $2.5 billion, or 2%, driven by growth in demand deposits, money market and term deposits Borrowed funds increased $831 million, reflecting an increase in short-term borrowings at quarter-end Prior-year quarter: Total earning assets up $10.6 billion, or 8%, with loan growth of $8.3 billion, or 8% — Commercial loans up $5.2 billion, or 11%, driven by strength in Mid-corporate and Industry Verticals, Commercial Real Estate, and Franchise Finance, partially offset by lower Asset Finance balances — Retail loans up $3.1 billion, or 6%, driven by strength in Education Finance, Home Mortgage, and Consumer Unsecured, partially offset by lower Home Equity balances Total deposits up $7.8 billion, or 8%, due to growth in low-cost core deposits Borrowed funds increased $2.6 billion, reflecting growth in long-term senior debt and incremental long- term FHLB borrowings as we continue to strengthen our term funding profile 14 Highlights Note: Loan portfolio trends reflect non-core portfolio impact not included in segment results on pages 15 and 16.
1) Low-cost core deposits include demand, checking with interest and regular savings.
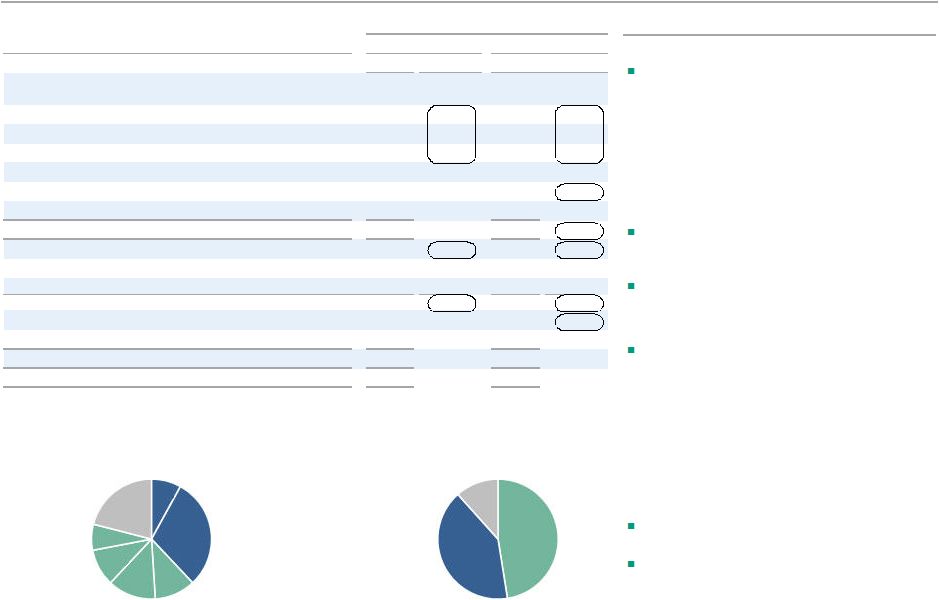
$134.8 billion Interest-earning assets $124.3 billion Deposits/borrowed funds Total Retail 41% Total Commercial 38% CRE Other Commercial Residential mortgage Total home equity Automobile Other Retail Investments and interest-bearing deposits Retail / Personal Commercial/ Municipal/ Wholesale Borrowed funds 8% 30% 11% 13% 10% 7% 21% 47% 41% 12% |
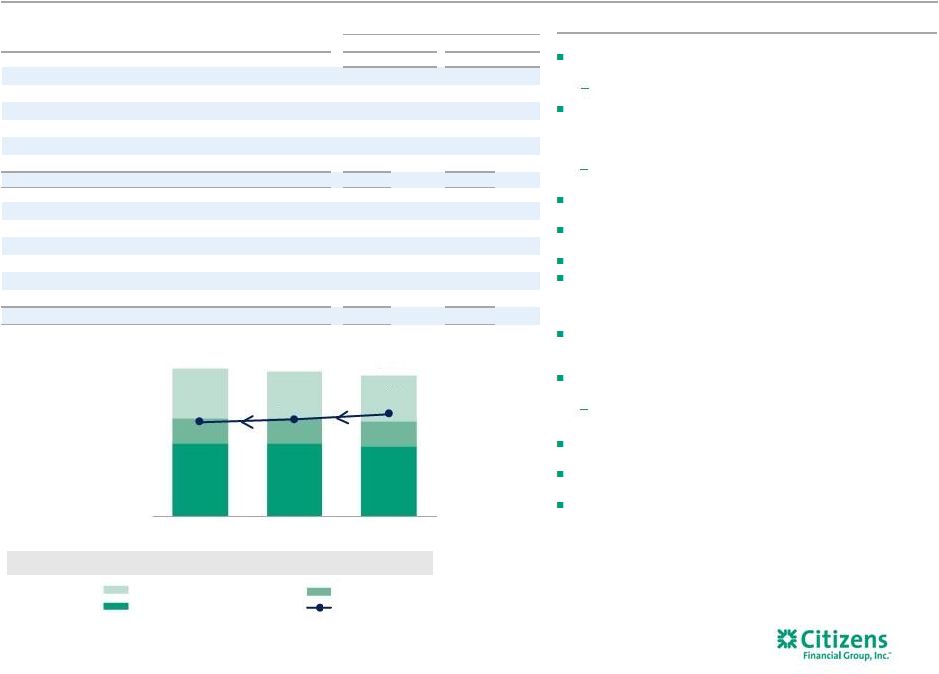
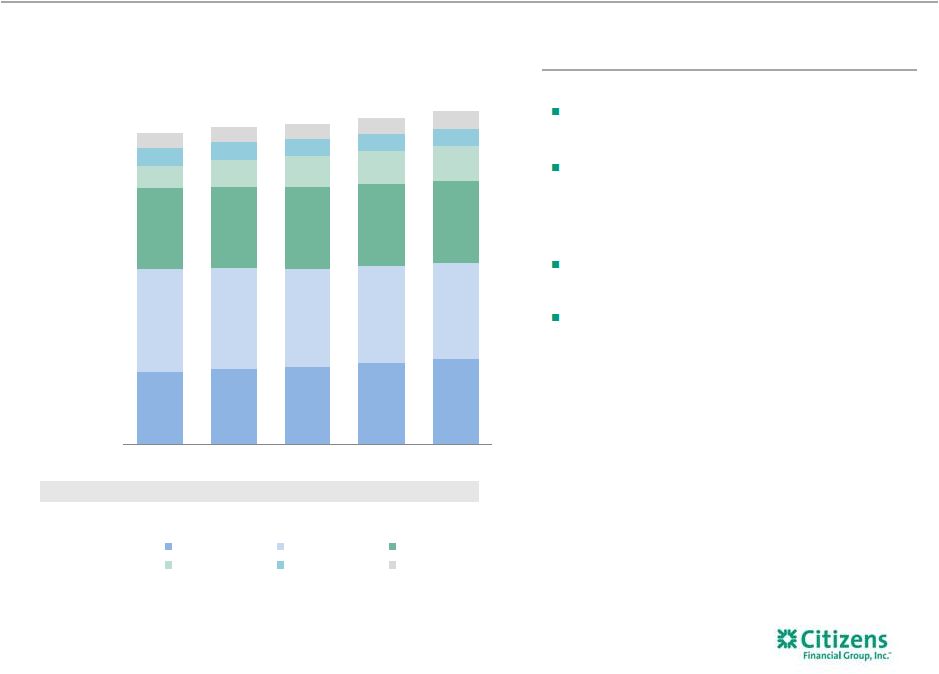 $12.2 $12.7 $12.9 $13.6 $14.4 $17.2 $17.0 $16.6 $16.3 $16.0 $13.8 $13.8 $14.0 $14.1 $14.0 $3.7 $4.5 $5.1 $5.5 $5.9 $3.0 $3.0 $2.9 $2.9 $2.9 $2.6 $2.5 $2.5 $2.6 $3.0 $52.5B $53.5B $54.0B $55.0B $56.2B 4Q15 1Q16 2Q16 3Q16 4Q16 Mortgage Home Equity Auto Student Business Banking Other Consumer Banking average loans and leases 15 1) Other includes Credit Card, RV, Marine, Other. $s in billions Linked quarter: Average loans increased $1.2 billion, or 2%, largely reflecting growth in residential mortgages, student and other unsecured retail loans, partially offset by lower home equity balances Consumer loan yields up 5 bps, reflecting the benefit of continued improvement in mix toward student and other unsecured retail Prior-year quarter: Average loans increased $3.7 billion, or 7%, driven by student loans, residential mortgages and unsecured retail loans partially offset by lower home equity outstandings Consumer loan yields up 23 bps, reflecting initiatives to improve risk-adjusted returns, along with higher interest rates Highlights Average loans and leases (1) Yields 3.73% 3.84% 3.88% 3.91% 3.96% |
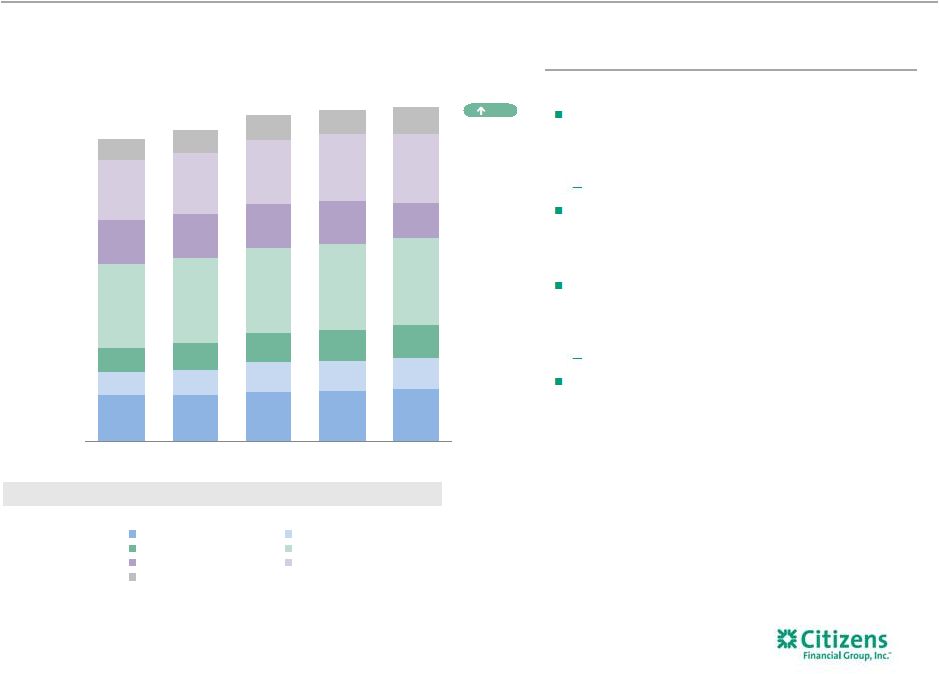 Yields 2.57% 2.75% 2.80% 2.82% 2.93% $6.5 $6.4 $6.9 $7.0 $7.3 $3.1 $3.5 $4.1 $4.2 $4.3 $3.5 $3.9 $4.2 $4.5 $4.7 $11.8 $11.9 $11.9 $12.0 $12.2 $6.1 $6.2 $6.1 $6.0 $4.9 $8.5 $8.7 $9.2 $9.5 $9.8 $3.0 $3.2 $3.5 $3.3 $3.7 $42.5B $43.8B $45.9B $46.5B $46.9B 4Q15 1Q16 2Q16 3Q16 4Q16 Mid-corporate Industry Verticals Franchise Finance Middle Market Asset Finance Commercial Real Estate Other Commercial Banking average loans and leases Linked quarter: Average loans up $371 million, or 1%, as continued strength in Mid-corporate and Industry Verticals and Commercial Real Estate was partially offset by the impact of the 3Q16 transfer of $1.2 billion of leases and loans to non-core Underlying average loans up 3% Loan yields improved 11 bps given higher short-term LIBOR rates Prior-year quarter: Average loans up $4.4 billion, or 10%, on strength in Mid- corporate and Industry Verticals, Commercial Real Estate , Franchise Finance and partially offset by the impact of the 3Q16 transfer to non-core Underlying average loans up 13% Loan yields increased 36 bps, reflecting improved mix and higher rates 16 1) Other includes Business Capital, Govt, Corporate Finance, Treasury Solutions, Corporate and Commercial Banking Admin.
Highlights $s in billions Average loans and leases (1) 3% Growth rate excluding 3Q16 impact of lease portfolio move to non-core (1) |
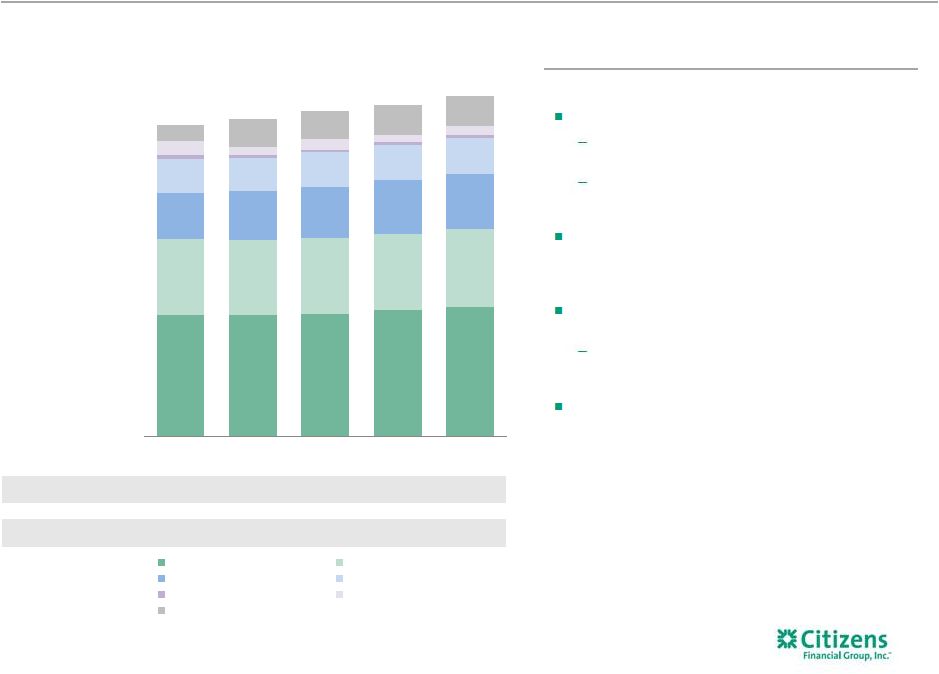 $44.6 $44.6 $44.9 $46.4 $47.2 $27.5 $27.2 $27.5 $27.5 $28.4 $17.1 $18.0 $19.0 $20.0 $20.3 $12.2 $12.2 $12.6 $12.8 $13.2 $1.6 $0.9 $1.0 $0.9 $1.0 $5.0 $3.1 $3.7 $2.6 $3.2 $6.0 $9.9 $10.3 $10.9 $11.0 $114.0B $115.9B $119.0B $121.0B $124.3B 4Q15 1Q16 2Q16 3Q16 4Q16 Money market & savings DDA Checking with interest Term deposits Total fed funds & repo Short-term borrowed funds Total long-term borrowings Deposit cost of funds 0.24% 0.24% 0.24% 0.27% 0.28% Total cost of funds 0.41% 0.40% 0.42% 0.44% 0.44% Average funding and cost of funds Linked quarter: Total average deposits up $2.5 billion, or 2% Largely growth in demand deposits, money market and term deposits Total deposit costs of 0.28% increased 1 bp, driven by higher incremental commercial deposit growth and rising short-term interest rates Total cost of funds remained stable Prior-year quarter: Total average deposits increased $7.8 billion, or 8%, on strength across all deposit categories Total deposit costs increased 4 bps, driven by higher short-term rates, which was largely offset by continued pricing discipline Total borrowed funds cost increase reflects continued shift away from short-term funding 17 Highlights Average interest-bearing liabilities and DDA $s in billions |
 1,216 1,224 1,246 1,240 1,236 115% 113% 119% 112% 118% 4Q15 1Q16 2Q16 3Q16 4Q16 Allowance for loan and lease losses NPL coverage ratio ($3) $9 $2 $19 $16 $73 $67 $56 $59 $82 $7 $7 $7 $5 $6 $77 $83 $65 $83 $104 0.31% 0.33% 0.25% 0.32% 0.39% 4Q15 1Q16 2Q16 3Q16 4Q16 Commercial Retail SBO Net c/o ratio $77 $83 $65 $83 $104 $91 $91 $90 $86 $102 $1.1B $1.1B $1.0B $1.1B $1.0B 4Q15 1Q16 2Q16 3Q16 4Q16 Net charge-offs Provision for credit losses 1.23% 1.21% 1.20% 1.18% 1.15% Allowance to loan coverage ratio Overall credit quality continued to improve, reflecting the benefit of growth in high quality lower
risk retail loans and stabilization in commercial
NPLs to total loans and leases improved to 0.97% compared from 1.05% in 3Q16
and 1.07% in 4Q15
NPLs decreased $62 million, reflecting a $53 million decrease in retail and a
$9 million decrease in commercial
Net charge-offs of $104 million, or 0.39% of average loans and leases,
increased $21 million from 3Q16
Commercial net charge-offs of $16 million decreased $3 million from
3Q16 Retail net charge-offs of $88 million increased $24
million due to increases in Auto and Home Equity, driven by
lower recoveries and a $7 million increase tied to a one-time
methodology change in auto
Provision for credit losses of $102 million increased $16 million, largely
driven by a $14 million reduction in recoveries of
prior-period charge-offs from relatively high third quarter levels; YoY reflects impact of credit normalization and loan growth Allowance to total loans and leases of 1.15% vs. 1.18% in 3Q16 and 1.23% in 4Q15 reflects
proactive efforts to improve underlying credit quality
Strong credit-quality trends
continue 18
Highlights 1) Allowance for loan and lease losses to nonperforming loans and leases. $s in millions Net charge-offs (recoveries) NPLs to loans and leases NPLs (1) 1.07% 1.07% 1.01% 1.05% 0.97% Provision for credit losses, charge-offs, NPLs Allowance for loan and lease losses |
 as of $s in billions (period-end) 4Q15 1Q16 2Q16 3Q16 4Q16 Basel III transitional basis (1,2) Common equity tier 1 capital 13.4 $ 13.6 $ 13.8 $ 13.8 $ 13.8 $ Risk-weighted assets 114.1 $ 116.6 $ 119.5 $ 121.6 $ 123.9 $ Common equity tier 1 ratio 11.7 % 11.6 % 11.5 % 11.3 % 11.2 % Total capital ratio 15.3 % 15.1 % 14.9 % 14.2 % 14.0 % Basel III fully phased-in (1,3) Common equity tier 1 ratio 11.7% 11.6% 11.5% 11.3% 11.1% 15.3% 15.1% 14.9% 14.2% 14.0% 11.7% 11.6% 11.5% 11.3% 11.2% 4Q15 1Q16 2Q16 3Q16 4Q16 Total capital ratio Common equity tier 1 ratio 97% 99% 98% 98% 99% 4Q15 1Q16 2Q16 3Q16 4Q16 Capital and liquidity remain strong 19 Highlights 1) Current-reporting period regulatory capital ratios are preliminary. 2) Basel III ratios assume that certain definitions impacting qualifying Basel III capital will phase in through 2019. Ratios also reflect
the required U.S. Standardized methodology for calculating RWAs,
effective January 1, 2015.
3) Please see important information on Key Performance Metrics and Non-GAAP Financial Measures at the beginning of this presentation for
an explanation of their use and the appendix for their calculation
and/or reconciliation to GAAP Financial Measures, as applicable. Adjusted results exclude restructuring charges, special items and/or notable items, as applicable. 4) Based on the September 2014 release of the U.S. version of the Liquidity Coverage Ratio (LCR). Note that as a modified LCR company,
CFG’s minimal LCR requirement of 90% began January 2016.
Reflects current understanding of Net Stable Funding Ratio (NSFR).
5) Period end includes held for sale. Capital levels remain above regional peers 4Q16 Basel III common equity tier 1 ratio (transitional basis) down ~16 basis points from 3Q16 Net income: ~23 bps increase RWA growth: ~21 bps decrease Dividends, treasury stock and other: ~18 bps decrease LDR of 99% increased 77 bps from 3Q16 Fully compliant with LCR and current understanding of NSFR (4) 2016 CCAR plan reflects continued commitment toward prudent return of capital with $690 million in share repurchases Repurchased $180 million, or 6.3 million common shares, during the quarter at an average price of $28.71 Loan-to-deposit ratio (5) Capital ratio trend (1,2) (1,2) |
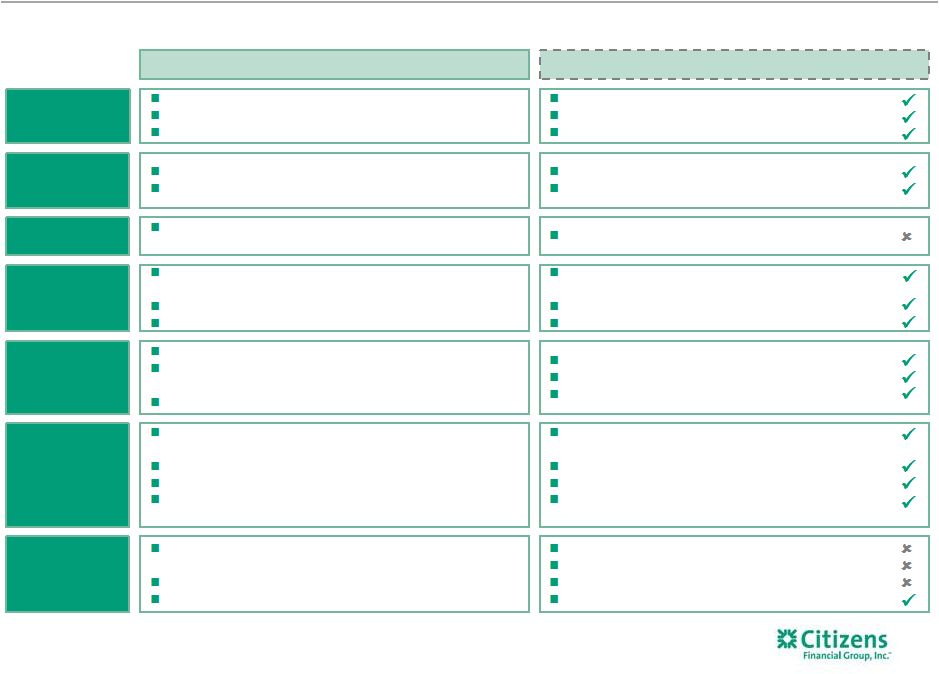
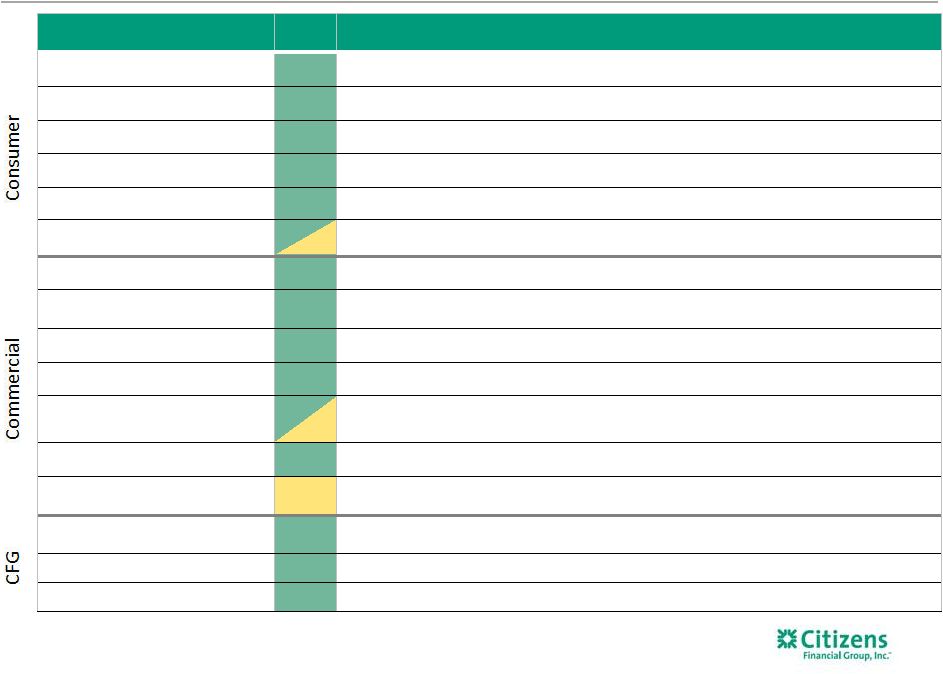 Initiative FY16 Status Commentary Reenergize household growth Primary HHs up YoY. Citizens Checkup helped drive ~400,000 appointments in FY16 with focus on deepening
relationships with mass affluent and affluent customers.
Expand mortgage sales force
Strong momentum in scaling the business; LOs up 96 in FY16 to 538,
originations up 36% FY16 and 56% in 4Q16 vs. 4Q15; conforming
mix surpassed 40% in 4Q16. Optimize Auto
Continue to optimize returns of business through focus on most profitable
dealers and increased pricing. Reducing portfolio growth to make
room for more attractive student and unsecured assets. Grow
Student/Installment Credit Sustained momentum in Student with
total loan balances up 60% compared to 4Q15 driven by steady growth in Ed Refi. Apple program continues to grow; expanding unsecured platform through marketing and new partners.
Expand Business Banking
Increasing focus on deposits, cash management, and other fee income streams,
with deposits up 6% vs. 4Q15. Cost of deposits remains
relatively stable at 11 bps and continues to provide attractive source of funds. Expand Wealth sales force Financial consultants up 13% in FY16 to 362. Total investment sales volume increased 10% vs. FY15 driven by
53% increase in fee-based sales. Revenue growth continues to take longer
due to shift to fee-based business. Build out Mid-Corp &
verticals Overall
loan growth of over 20% vs. 4Q15, driven by Healthcare and Technology industry verticals, which had loan growth of 39% vs. 4Q15. Fee income growth up $21 million, or 17% vs. FY15.
Continue development of Capital
and Global Markets activities
Continue to gain market share, fee income up 30% in FY16. Growth driven by
robust syndications and expanded capabilities
in interest rate and FX products. Middle Market bookrunner rank improved YoY from #9 to #7 (1) . Build out Treasury Solutions Fees up 11% in FY16 reflecting pricing increase, improving sales activity and 14% YoY increase in commercial
card with purchase volume up 14% YoY. Grow Franchise Finance Loans up 24% YoY and 6% QoQ. Added 64 net new clients in 2016, with continued focus on quick service, fast
casual, and retail petrol franchise concepts.
Expand Middle Market
Reinvigorated
growth in business with origination volumes up 24% in FY16 vs. FY15 and 16%
QoQ; however, loan
portfolio relatively flat, with initiatives underway to grow the overall portfolio. Deposits up $575 million, or 8%, and fee income up 12% vs. FY15 driven by efforts to deepen relationships with customers. Grow CRE Continue to deepen client penetration with top developers in core geographies, while moderating growth in a number of select areas. CRE loans grew 17% in FY16 to $9.3 billion. Reposition Asset Finance Continue to realign product offering and strategy towards core Middle Market and Mid-Corp customers to drive
improved spread and fees. Origination volume grew QoQ.
Balance Sheet Optimization
Continued execution of balance sheet strategies led to NIM increase of ~3 bps (total of 6 bps including yield curve impact), driven by improved mix and pricing, with relatively stable deposit costs. TOP II Achieved $105 million of P&L benefit in FY16. Initiatives largely completed.
TOP III TOP III Program underway and on track to meet FY17 benefit of $100-$115 million.
Summary of progress on strategic initiatives
1) Thomson Reuters LPC, FY16 data as of 12/31/16 based on number of deals for Overall Middle Market (defined as Borrower Revenues
<$500MM and Deal Size <$500MM). 1)
Thomson Reuters LPC, FY16 data as of 12/31/16 based on number of deals for
Overall Middle Market (defined as Borrower Revenues <$500MM and Deal Size <$500MM). 20 |
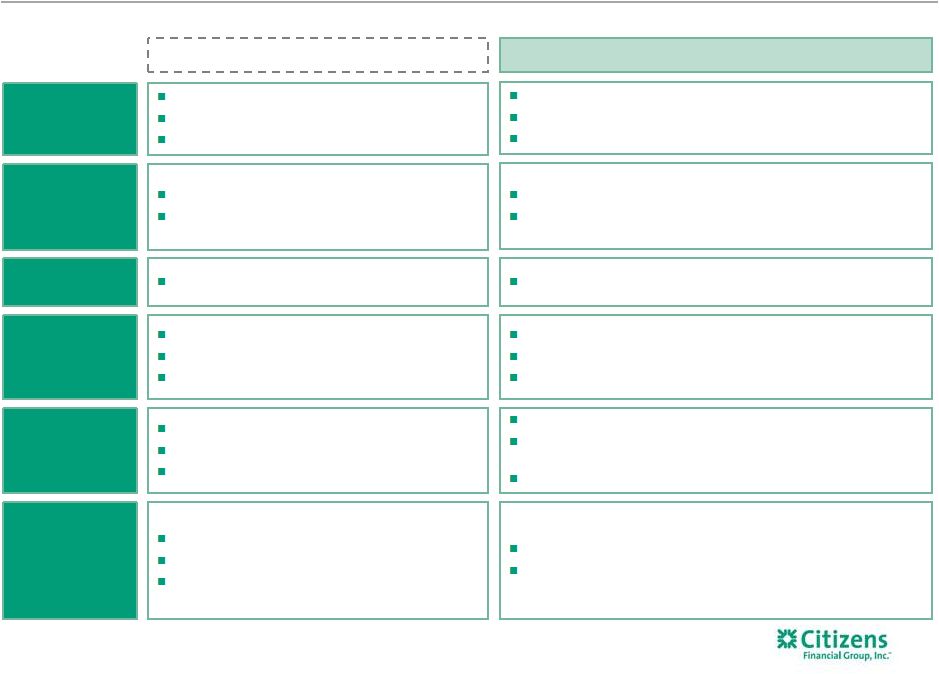
 TOP II Program TOP II Program TOP III Program TOP III Program Revenue initiatives Delivered over $60 million Citizens Checkup: Launched with ~400,000 appointments
scheduled to-date; customer satisfaction has been positive with
78% very to completely satisfied
Consumer Retention: Initiative underway and showing strength in deposit retention; successful platinum launch driving retention with the Mass Affluent customer segment Middle Market Share of Wallet: Opportunity pipeline remains
~2X larger than historical levels
(1) leading to stronger capital markets penetration Commercial Pricing: Re-priced 12,000 cash management
accounts; improved loan pricing discipline and increased lending
revenue by 13% and improved IRP spreads
(2) Revenue initiatives Delivered over $60 million Citizens Checkup: Launched with ~400,000 appointments
scheduled to-date; customer satisfaction has been positive with
78% very to completely satisfied
Consumer Retention: Initiative underway and showing strength in deposit retention; successful platinum launch driving retention with the Mass Affluent customer segment Middle Market Share of Wallet: Opportunity pipeline remains
~2X larger than historical levels
(1) leading to stronger capital markets penetration Commercial Pricing: Re-priced 12,000 cash management
accounts; improved loan pricing discipline and increased lending
revenue by 13% and improved IRP spreads
(2) Expense initiatives Delivered ~$40 million Operations Transformation: Streamlining of organization
complete; focused on next wave of opportunities
Supply Chain Services: 2016 run-rate savings achieved driven
by reduction in external resources and tightening of internal
travel and office supplies policies
Expense initiatives
Delivered ~$40 million
Operations Transformation: Streamlining of
organization complete; focused on next wave of
opportunities Supply Chain
Services: 2016 run-rate savings achieved driven
by reduction in external resources and tightening of
internal travel and office supplies policies
Revenue initiatives
Target ~$25-$30 million
Commercial Attrition: Predictive tool is now in the hands of our RMs that identifies at-risk clients and allows them to proactively develop retention plans for those clients Unsecured Lending: Initiative launched with good initial
customer responses; early read on performance is positive
Business Banking Share of
Wallet: Realignment of
salesforce complete; executing on plans to deepen
relationships Revenue initiatives
Target ~$25-$30 million
Commercial Attrition: Predictive tool is now in the hands of our RMs that identifies at-risk clients and allows them to proactively develop retention plans for those clients Unsecured Lending: Initiative launched with good initial
customer responses; early read on performance is positive
Business Banking Share of
Wallet: Realignment of
salesforce complete; executing on plans to deepen
relationships Expense initiatives
Target ~$55-$65 million
Consumer Efficiencies: First phase of
streamlining non-revenue staff is complete; focus on branch optimization and efficiencies in the mortgage business Commercial Efficiencies: Streamlining end-to-end processing and portfolio management; actions are largely complete Functional Efficiencies: Good progress on reengineering
processes; streamlining forecasting and reporting in
finance and recruiting and training in HR
Fraud: Project underway; initial focus on improving algorithms and enhancing chargeback processes Expense initiatives Target ~$55-$65 million Consumer Efficiencies: First phase of streamlining
non-revenue staff is complete; focus on branch optimization and efficiencies in the mortgage business Commercial Efficiencies: Streamlining end-to-end processing and portfolio management; actions are largely complete Functional Efficiencies: Good progress on reengineering
processes; streamlining forecasting and reporting in
finance and recruiting and training in HR
Fraud: Project underway; initial focus on improving algorithms and enhancing chargeback processes Tax efficiencies Target ~$20 million (3) Tax-Rate Optimization: Aligning tax rate to peer levels; began
to see benefit in 3Q16
and showing strength in investment and
historic tax credits
Tax efficiencies
Target ~$20 million
(3) Tax-Rate Optimization: Aligning tax rate to peer levels; began
to see benefit in 3Q16
and showing strength in investment and
historic tax credits
Launched mid 2015 —
Delivered $105 million in annual pre-tax
benefit for 2016
Launched mid 2016 —
Targeted run-rate
benefit of $100-$115 million by end of 2017
21 Tapping Our Potential (TOP) programs remain on track Self funding necessary investments through our efficiency initiatives 1) Represents opportunities per product specialist as of December 2016 vs. March 2015.
2) Improved lending revenue and IRP (interest-rate products) pricing, as well as improved lending revenue on in-scope deals,
which exclude syndicated transactions, select franchise finance
customers, asset-based lending deals and letters of credit.
3) ~$20 million pre-tax benefit; noninterest income pre-tax impact ~($20) million; tax expense benefit of ~$40 million on a
pre-tax equivalent basis. |
 Consumer Consumer Commercial Commercial 22 Consistently enhancing our capabilities and gaining market share Continued strong focus on customer experience — Consistent customer branch experience; scores 10% above surveyed banks; (1) — Top 5 JD Power recognition in mortgage servicing and origination; building
multi-channel
service capabilities (2) — Top 5 Greenwich study in Business Banking (3) Enhancing competitive offerings to gain share — 2016 mortgage origination volumes up 36%, versus ~13% industry growth (4) — Continued momentum in student lending with ~6% national market share, up 1% from prior year (5) — Innovative unsecured offerings through partnerships with global industry leaders Introducing targeted product offerings tailored for key segments — Premier Banking solutions offer strong value proposition with comprehensive
program that entitles clients to dedicated relationship manager
— Continued hiring of Premier relationship managers augments retirement planning, business expertise and lending solutions platform Leading with enhanced digital capabilities — Expanding digital investment advice through SigFig partnership — Launching small business automated application and underwriting process
through Fundation
partnership — Streamlining account-opening experiences across channels Continued investment in data analytics to deepen customer relationships — Customer analytics team delivered strong marketing and efficiency results, delivering a 32% increase in response rates Citizens Checkup program continues to yield results — ~400,000 scheduled appointments in 2016 — Needs-based approach adds value through service and helps build and
maintain relationships
Continued leading customer satisfaction scores
(6) — Overall satisfaction indicates continued progress in serving customers needs;
overall satisfaction score of 93% (Top 2 box score)
— Satisfaction with relationship managers at 97% (Top-2 Box score) Commenced operations of Citizens Capital Markets, Inc. — Serves customers through strategic advice for M&A, capital structure, valuation
and capital raises via pubic offerings and private placements; expect to drive
deeper share of wallet with existing credit relationships and
attract new relationships
Enhanced infrastructure and analytics
— Introduced new interest rate products- and foreign exchange-platform that facilitates risk monitoring and client delivery
— Expanded asset-based and restructuring capabilities to help clients through
the cycle — Developed client-profitability reporting to provide enhanced portfolio view to
augment relationship management
— Building digital onboarding capabilities and CRM tools for relationship managers
to continue to improve sales effectiveness
Continued strength in loan syndications
— $9.7 billion of loan syndications, with 122 transactions as lead left or joint lead
arranger; growth of 26% and 22% versus 2015
— Ranked fifth in loan overall middle market deals in 4Q16; improved from tenth
versus prior year (7) — Growth driven by thought leadership initiatives, with particular strength in
healthcare, technology, franchise finance and leveraged finance
Continued improvement in Treasury Solutions products
— Investing in new commercial online banking platform to improve cash management and other offerings — Will continue to focus on expansion of product penetration to existing base,
cross-sell to new lending customers and customer-retention efforts to
drive sustainable fee growth
1) JD Power survey results reflect 2015 – 2016 assessment period and derive from JD Power branch servicing assessment score. 2) JD Power survey results reflect 2015-2016 assessment period. 3) Greenwich survey period from October 1, 2015 to September 30, 2016. 4) 2016 CFG mortgage volumes versus 2016 MBA Mortgage Finance Forecast as of December 14, 2016.
5) Source: MeaureOne based upon 2015-2016 Academic year. 6) Source: Barlow 2015 Voice of the Customer Survey. 7) Thomson Reuters LPC, Loan syndications 3Q16 ranking based on number of deals for Overall Middle Market (defined as Borrower Revenues <
$500MM and Deal Size < $500MM) as of 12/31/2016. |
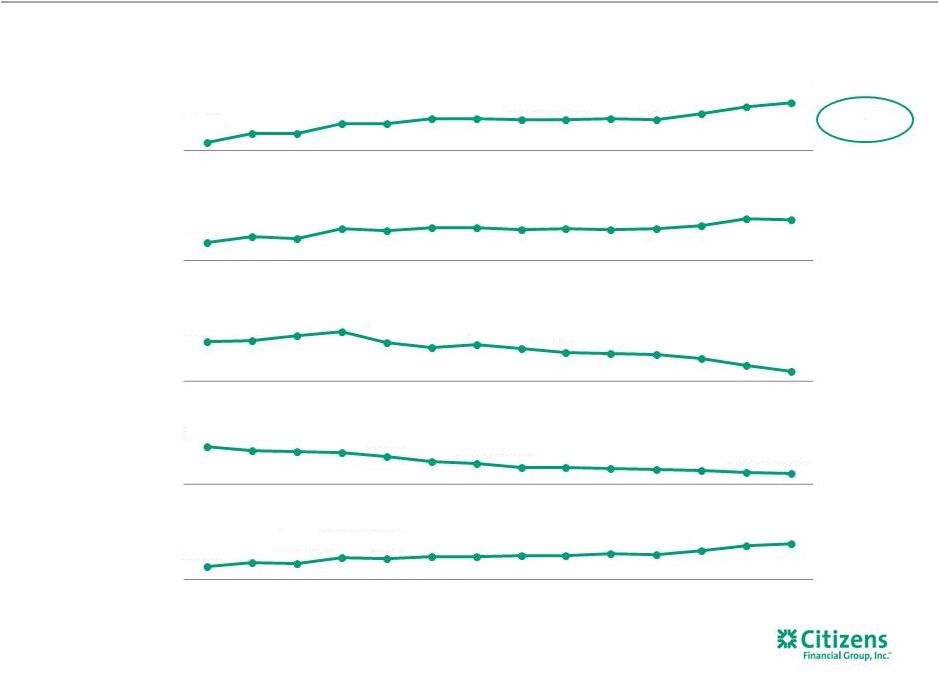 Goal is to deliver a 10%+ run-rate ROTCE in the medium term
23 1.0%+ Adjusted efficiency ratio (1) ~60% 10%+ Making consistent progress against our financial goals Medium-term Targets Key Indicators Adjusted ROTCE (1) Adjusted return on average total tangible assets (1) EPS Adjusted Diluted EPS (1) Common equity tier 1 ratio (2) 1) Please see important information on Key Performance Metrics and Non-GAAP Financial Measures at the beginning of this presentation for
an explanation of their use and the appendix for their calculation
and/or reconciliation to GAAP Financial Measures, as applicable. Adjusted results exclude restructuring charges, special items and/or notable items, as applicable. 2) Common equity tier 1 ("CET1") capital under Basel III replaced tier 1 common capital under Basel I effective January 1,
2015. 3)
Commencement of separation effort from RBS.
(3) 4.34% 5.24% 5.24% 6.28% 6.22% 6.76% 6.73% 6.67% 6.60% 6.75% 6.61% 7.30% 8.02% 8.43% 0.52% 0.59% 0.57% 0.68% 0.66% 0.69% 0.69% 0.67% 0.68% 0.67% 0.68% 0.72% 0.80% 0.79% 68% 68% 69% 70% 68% 67% 68% 67% 66% 66% 66% 65% 63% 62% 13.9% 13.5% 13.4% 13.3% 12.9% 12.4% 12.2% 11.8% 11.8% 11.7% 11.6% 11.5% 11.3% 11.2% $0.26 $0.30 $0.30 $0.37 $0.36 $0.39 $0.39 $0.40 $0.40 $0.42 $0.41 $0.46 $0.52 $0.55 3Q13 4Q13 1Q14 2Q14 3Q14 4Q14 1Q15 2Q15 3Q15 4Q15 1Q16 2Q16 3Q16 4Q16 |
 Keys to successful 2017 financial performance
24 Expect improved economic environment with steady GDP growth, solid loan demand, and gradual rate hikes
Drive strong, prudent loan growth across consumer and commercial
Deliver improving NIM with continued focus on asset optimization and gathering
low-cost deposits Achieve improved noninterest income growth
through realization on investments in key areas Home Mortgage,
Wealth Management, Capital Markets and Treasury Solutions
Maintain strong expense discipline while continuing to fund investments in technology, products and services Strong focus on continuous improvement and delivering benefits from TOP efficiency programs
Deliver 3-5% positive operating leverage
Will be the key to continued net income and EPS growth, must offset gradual
normalization in provision expense
Continue efforts to normalize capital ratios and drive enhanced shareholder
returns |
 Adjusted FY2016 guidance vs. Adjusted FY2015
(1,2) FY2016 performance vs. guidance 25 Adjusted FY2016 actual results vs. Adjusted FY2015 (1) Results reflect strong execution against targets 1) Please see important information on Key Performance Metrics and Non-GAAP Financial Measures at the beginning of this presentation for
an explanation of their use and the appendix for their calculation
and/or reconciliation to GAAP Financial Measures, as applicable. Adjusted results exclude restructuring charges, special items and/or notable items, as applicable. 2) Guidance as provided on 4Q15 January 22, 2016 earnings call. 3) Reflects impacts linked to higher revenues. Net interest income, net interest margin Operating leverage, efficiency ratio Credit trends, tax rate Capital, liquidity and funding Key economic assumptions Balance sheet growth Noninterest income Net interest income growth of 7-10% NIM improvement of 6-12 bps Expense growth of 2.5-3.5%*; 1.3-2.3% including the impact of the card reward accounting change Target 3-5% of positive operating leverage* Efficiency ratio improves to 63-65%* Provision expense $375-$425 million Charge-off rates normalize modestly from unusually low levels with modest reserve build to fund loan growth Tax rate of ~33% Targeting dividend payout ratio in the 25-30% range, common stock buyback TBD with CCAR Year-end Basel III common equity tier 1 ratio 11.2-11.5% Loan-to-deposit ratio ~98% Continue to diversify funding sources with modest amount of senior debt issuance YE 2016: fed funds rate of ~85-90 bps (rate increases in July and December), 10-year Treasury rate of ~2.40%-2.50% range Full-year GDP growth in the 2%-3% range YE-2016 unemployment rate in the 4%-5% range 5-6% average earning asset growth 6-8% average loan growth 5-7% average deposit growth 5-7% noninterest income growth*; 2.5-4% including the impact of the card reward accounting change Net interest income growth of 10% NIM improvement of 11 bps Expense growth of 3% 4.2% positive operating leverage Efficiency ratio improved to 64% (1) Provision expense of $369 million Charge-off rate of 32 bps up modestly from 30 bps Tax rate of 31.7% Dividend payout ratio of 24%, common stock buyback Year-end Basel III common equity tier 1 ratio of 11.2% Loan-to-deposit ratio of 99% We issued $1.75 billion senior bank debt to broaden our market access and diversify funding sources YE 2016: fed funds rate of 75 bps 10-year Treasury rate of 2.00% Full-year GDP growth of 1.6% YE-2016 unemployment rate of 4.7% 6% average earning asset growth 8% average loan growth 6% average deposit growth Growth in noninterest income of 1% *Before the estimated effect of a prospective card reward accounting change.
(3) |
 FY2017 outlook 26 Net interest income, net interest margin Net interest income growth of 8-9% NIM improvement of 8-10 bps Operating leverage, efficiency ratio Credit trends, tax rate Expense growth of 3-3.5% Target 3-5% of positive operating leverage Efficiency ratio improves to 61-62% Provision expense $425-$475 million Charge-off rates normalize modestly with additional reserve build to fund loan
growth Tax rate of ~32% FY2017 expectations vs. Adjusted FY2016 (1) Capital, liquidity and funding Targeting dividend payout ratio in the 30-35% range, common stock buyback TBD with CCAR Year-end Basel III common equity tier 1 ratio 10.7-10.9% Loan-to-deposit ratio ~98% Key economic assumptions YE 2017: fed funds rate of ~1.25% (rate increase in June & November/December),
10-year Treasury rate of ~2.50-2.75% range
Full-year GDP growth in the 2-2.5% range
YE-2017 unemployment rate 4.5-4.7%
Balance sheet growth 5.5-6.5% average earning asset growth 5.5-7% average loan growth 5.5-7% average deposit growth Noninterest income 3-5% noninterest income growth (2) 1) Please see important information on Key Performance Metrics and Non-GAAP Financial Measures at the beginning of this presentation for
an explanation of their use and the appendix for their calculation
and/or reconciliation to GAAP Financial Measures, as applicable. Adjusted results exclude restructuring charges, special items and/or notable items, as applicable. 2) Tax credit investments nets down by 1% $3,758 million net interest income 2.86% NIM $3,316 million noninterest expense 4% operating leverage 63.9% efficiency ratio $369 million provision expense 32 bps of net charge-offs 31.7% tax rate 24% dividend payout ratio 11.2% CET1 ratio 99% loan-to-deposit ratio YE 2016: fed funds rate of 75 bps Full-year GDP growth of 1.6% YE-2016 unemployment rate of 4.7% $130.5 billion average earning assets $103.4 billion average loans $105.4 billion average deposits $1,430 million noninterest income Adjusted FY2016 (1) |
 FY2017 outlook compared with 2016
27 Net interest income, net interest margin Operating leverage, efficiency ratio Credit trends, tax rate Capital, liquidity and funding Adjusted 2016 vs. Adjusted 2015 (1) FY2017 expectations vs. Adjusted 2016 (1) Balance sheet growth 5.5-6.5% average earning asset growth 5.5-7.0% average loan growth 5.5-7.0% average deposit growth Noninterest income 3-5% noninterest income growth (1) Net interest income growth of 10% NIM improvement of 11 bps Expense growth of 3% 4.2% positive operating leverage (1) Efficiency ratio improved to 64% (1) Provision expense of $369 million Charge-off rate of 32 bps up modestly from 30 bps Tax rate of 31.7% Dividend payout ratio of 24%, common stock buyback Year-end Basel III common equity tier 1 ratio of 11.2% Loan-to-deposit ratio of 99% 6% average earning asset growth 8% average loan growth 6% average deposit growth Stable noninterest income 1) Please see important information on Key Performance Metrics and Non-GAAP Financial Measures at the beginning of this presentation for
an explanation of their use and the appendix for their calculation
and/or reconciliation to GAAP Financial Measures, as applicable. Adjusted results exclude restructuring charges, special items and/or notable items, as applicable. Net interest income growth of 8-9% NIM improvement of 8-10 bps Expense growth of 3-3.5% 3-5% operating leverage Efficiency ratio improves to 61-62% Provision expense of $425-$475 million Charge-off rates normalize modestly with additional reserve build to
fund loan growth
Tax rate of ~32%
10.7-10.9% Basel III CET1
~98% LDR |
 NIM drivers and growth
28 Comments Earning asset mix and yields Some additional benefit from shift in loan mix to higher return products
Reduced back book runoff helping to mitigate
competitive commercial
pricing dynamics
Deposit/ funding
costs Enhanced customer product offerings targeted at mass affluent and affluent deposit segments Ongoing customer segmentation strategies helping to limit pricing pressures from higher-than-peer deposit-growth targets Yield curve and rate hike benefits Dec 2016 rate increase expected to contribute $45-55 million to NII, or 3-4 bps to NIM (1) Steepening yield curve expected to contribute $20-30 million to NII, or
~2 bps to NIM
(1) Two rate increases anticipated in 2017 June rate increase expected to contribute $25-35 million to NII, or 2-3 bps to NIM (1) November/December rate increase expected to contribute ~$5 million to NII (1) 1) Assumes December 31, 2016 implied forward curve. |
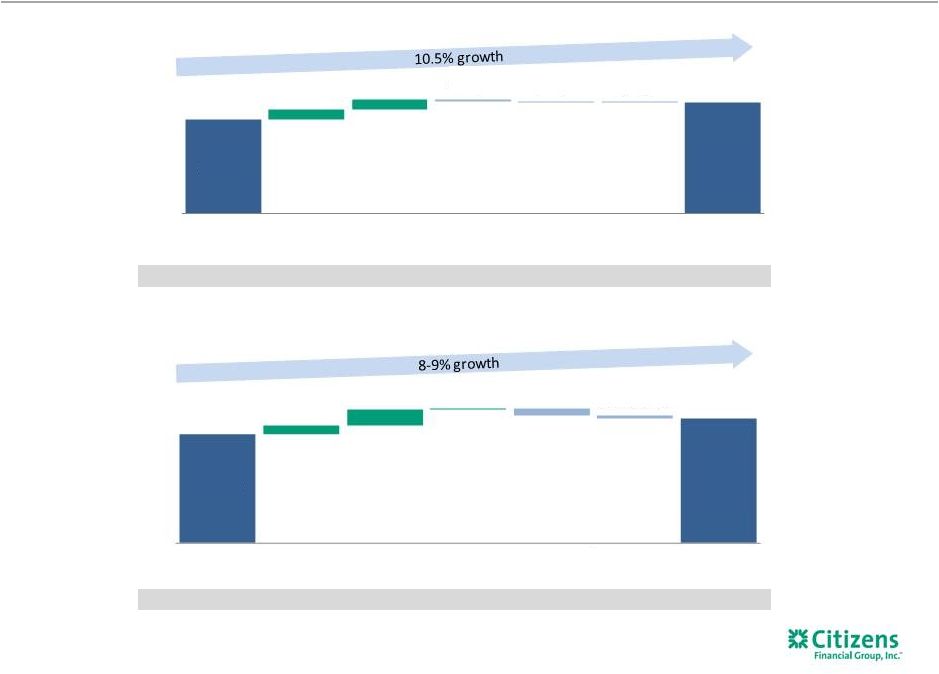 NIM% 2.86% (~1) bps +21-27 bps 0 bps (11-13) bps Strong growth in net interest income 29 Net interest income outlook 2016-2017 (2) NIM% (1) bp 0 bps 2.75% 2.86% +16 bps (3) bps (1) bps (1) Net interest income growth 2015-2016 2.94–2.96% (1-3) bps $3,402 $3,758 6.1% 6.2% (1.2)% (0.4)% (0.3)% 2015 Loan growth Loan mix/ yields Investment portfolio Deposit costs Borrowings/ other 2016 $3,758 8-9% growth range 4.5-5.5% 8.0-9.0% 0.5-1.5% (4.0-5.0%) (1.0-2.0%) 2016 Loan growth Loan mix/ yields & other Investment portfolio Deposit costs Borrowings/ other 2017 outlook Other includes funding costs broadly offset by the benefit of swaps. Assumes December 31, 2016 implied forward curve. December 2016 rate increase expected to contribute $65-$85 million to NII, or 5-6
bps to NIM. Two 2017 rate increases contribute $30-$40 million
to NII or 2-3 bps to NIM. 1)
2) (1) |
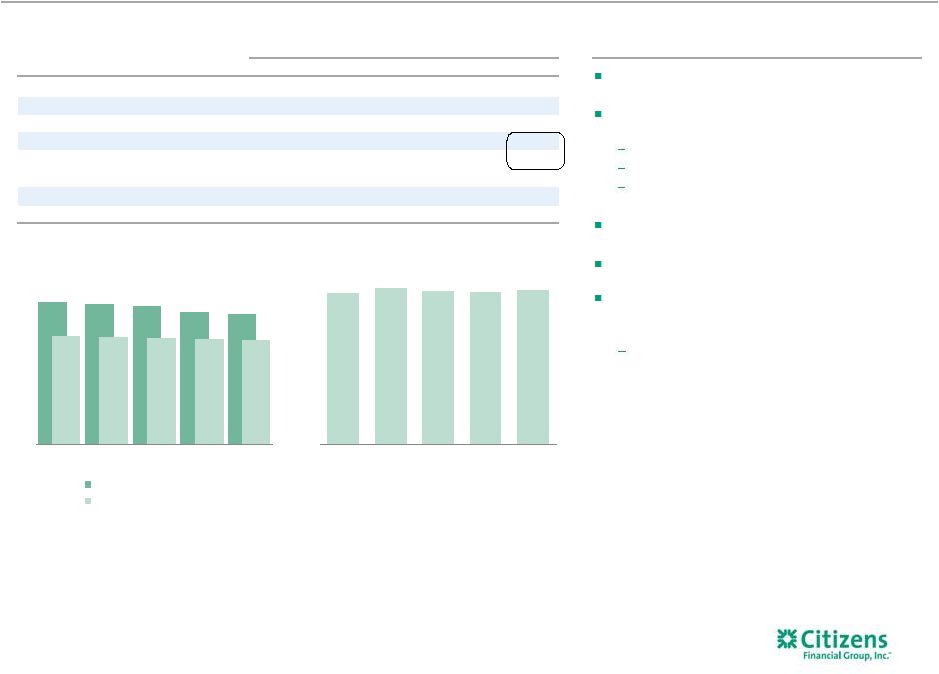
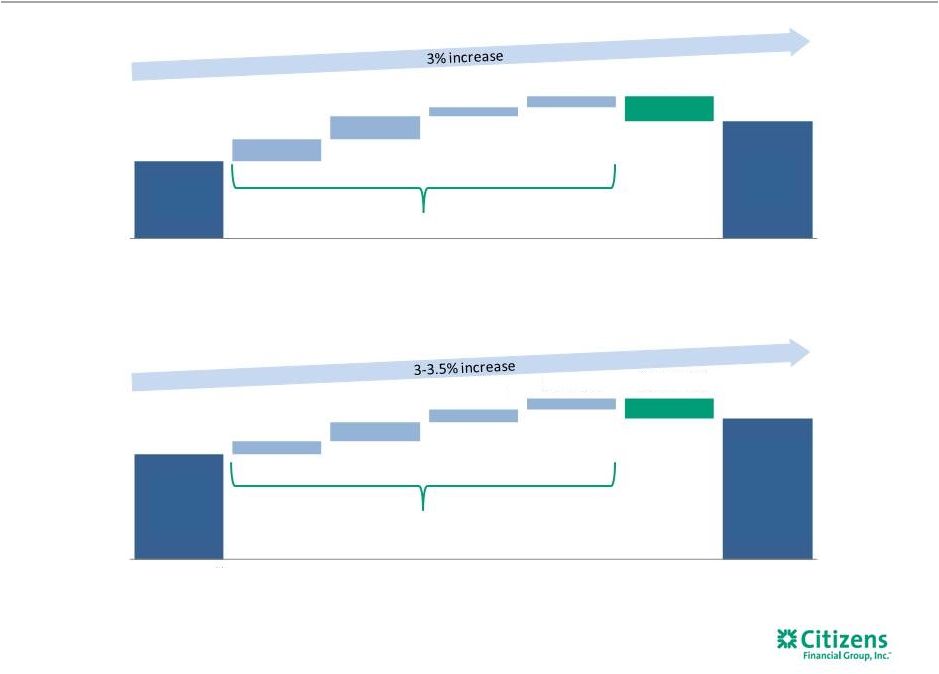 Noninterest expense remains well controlled
30 Adjusted noninterest expense (1) trend 2015-2016 Noninterest expense outlook 2016-2017 (1) (1) $s in millions 5.5% 1) Please see important information on Key Performance Metrics and Non-GAAP Financial Measures at the beginning of this presentation for
an explanation of their use and the appendix for their calculation
and/or reconciliation to GAAP Financial Measures, as applicable. Adjusted results exclude restructuring charges, special items and/or notable items, as applicable. Midpoint of 5.1% (1) $3,209 $3,316 1.8% 2.0% 0.7% 0.9% (2.1)% Adjusted 2015 Other salaries & employee benefits expense Business growth initiatives Outside services, occupancy & other expense Equipment and amortization of software expense Efficiency initiatives Adjusted 2016 $3,316 3.0-3.5% growth range 1.1-1.3% 1.6-1.9% 1.0-1.2% 0.9-1.1% (1.7-1.9%) Adjusted 2016 Other salaries & employee benefits expense Business growth initiatives Outside services, occupancy & other expense Equipment and amortization of software expense Efficiency initiatives 2017 outlook |
 1Q17 outlook 31 Net interest income, net interest margin Noninterest expense Credit trends, tax rate ~1.5% loan growth Expect ~2-3 basis point improvement in net interest margin given recent rate rise
Day count impact of ~$14 million decrease to NII
Up 1-2% given seasonal compensation impacts
Provision expense stable, lower NCOs
Tax rate of 30-31%
1Q17 expectations vs. 4Q16
Capital, liquidity
and funding Quarter-end Basel III common equity tier 1 ratio ~11.1% Loan-to-deposit ratio of ~98% Preferred stock dividend of $7 million Noninterest income Seasonally lower, particularly capital markets and service charges and fees, as well
as rate impact on mortgage banking |
 Key messages 32 Citizens once again delivered strong results in 4Q16 Strong EPS growth, robust operating leverage, improving efficiency ratio and active capital management
ROTCE of 8.4% up from 4.3% three years ago in 3Q13
Delivering against strategic initiatives with strong growth in Capital Markets
and improving results in Mortgage Banking
Continued execution on growing attractive return portfolios and lower cost
deposits Prudent loan growth with continued improvement in credit
quality Tangible book value per share of $25.69 at quarter end,
up 4% from 4Q15 Strong focus on continuous improvement and
delivering benefits from TOP efficiency programs Well positioned
as we enter 1Q17 to capitalize on improving economic environment and rising rates Key to financial results is to grow the balance sheet smartly with continued focus on building out fee
businesses and delivering positive operating leverage
Capital and credit position remain strong
Peer-leading CET1 ratio permits both strong loan growth and returns to
shareholders Focused on delivering enhanced shareholder
returns 1)
Please see important information on Key Performance Metrics and Non-GAAP
Financial Measures at the beginning of this presentation for an explanation of their use and the appendix for their calculation and/or reconciliation to GAAP Financial Measures, as applicable. Adjusted results exclude restructuring charges, special items
and/or notable items, as applicable. |
 Appendix 1 –
Additional 2016 information
33 |
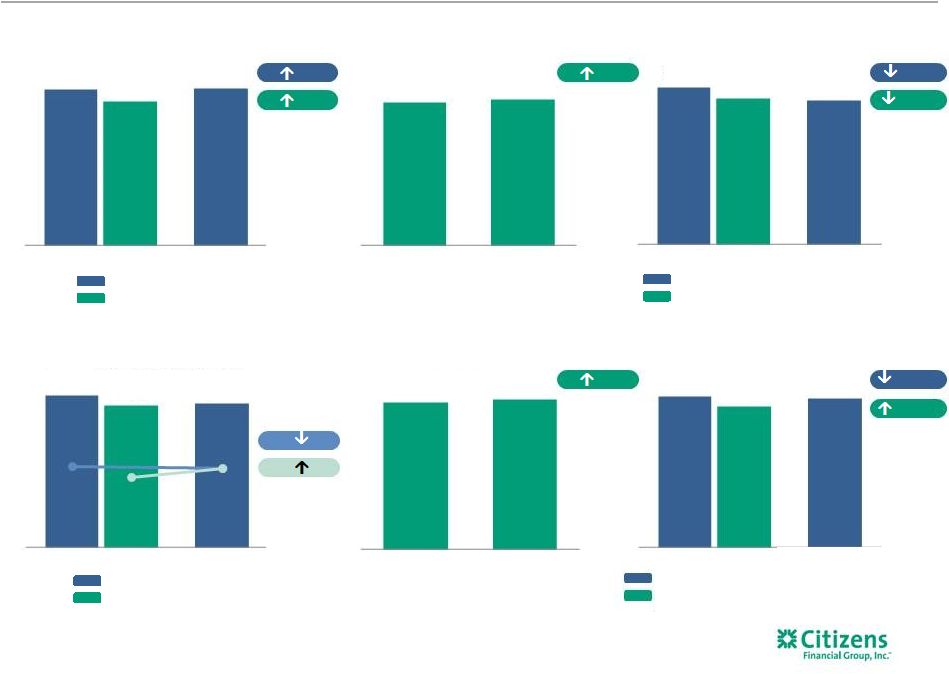 Linked-quarter results
34 Period-end loans $s in billions (2) 2% 1% 1% 7% Net income and EPS $s in millions, except per share data Equity return metrics Period-end deposits $s in billions (1) GAAP results Adjusted results (1) Return on average total tangible assets Adjusted return on average total tangible assets (1) Return on average tangible common equity Adjusted return on average tangible common equity EPS 2% EPS 6% 7 bps 1 bps 15 bps 41 bps Asset return metrics $0.56 $0.52 $0.55 1) Please see important information on Key Performance Metrics and Non-GAAP Financial Measures at the beginning of this presentation for
an explanation of their use and the appendix for their calculation
and/or reconciliation to GAAP Financial Measures, as applicable. Adjusted results exclude restructuring charges, special items and/or notable items, as applicable. 2) Excludes loans held for sale. Pre-provision profit $s in millions (1) GAAP results Adjusted results (1) 4Q16 4Q16 4Q16 4Q16 $513 $516 $482 3Q16 $105.5 $107.7 3Q16 4Q16 0.86% 0.79% 0.80% 3Q16 8.6% 8.4% 8.0% 3Q16 $297 $282 $278 3Q16 $108.3 $109.8 3Q16 4Q16 |
 Quarter-over-quarter results
35 Pre-provision profit $s in millions Return on average total tangible assets $s in billions Net income and EPS $s in millions, except per share data Return on average tangible common equity $s in billions 22% Period-end loans $s in billions Period-end deposits $s in billions (1) 9% 7% $0.42 $0.55 EPS 31% 12 bps 168 bps 1) Excludes loans held for sale. $221 $282 4Q15 4Q16 $422 $516 4Q15 4Q16 $99.0 $107.7 4Q15 4Q16 0.67% 0.79% 4Q15 4Q16 $102.5 $109.8 4Q15 4Q16 6.7% 8.4% 4Q15 4Q16 |
 Full-year results
36 Pre-provision profit $s in millions Asset return metrics Net income and EPS $s in millions, except per share data Equity return metrics 22% Period-end loans $s in billions Period-end deposits $s in billions (2) (1) 9% 7% 16% GAAP results Adjusted results (1) GAAP results Adjusted results $1.55 $1.61 $1.97 $1.93 EPS 27% EPS 20% 11 bps 7 bps 129 bps 91 bps 1) Please see important information on Key Performance Metrics and Non-GAAP Financial Measures at the beginning of this presentation for
an explanation of their use and the appendix for their calculation
and/or reconciliation to GAAP Financial Measures, as applicable. Adjusted results exclude restructuring charges, special items and/or notable items, as applicable. 2) Excludes loans held for sale. (1) Return on average tangible common equity Adjusted return on average tangible common equity (1) (1) Return on average total tangible assets Adjusted return on average total tangible assets $1,565 $1,903 $1,615 $1,872 2015 2016 $99.0 $107.7 2015 2016 0.65% 0.76% 0.68% 0.75% 2015 2016 6.4% 7.7% 6.7% 7.6% 2015 2016 $102.5 $109.8 2015 2016 $840 $1,045 $871 $1,026 2015 2016 |
 Consumer Banking segment
37 - - Highlights Linked quarter: Net income was relatively flat Net interest income up $18 million, or 3%, led by higher mortgage, student and unsecured retail loans and improved loan yields, partially offset by higher deposit costs Average loans up $1.3 billion, or 2%, and average deposits up $1 billion, or 1%, from 3Q16 Noninterest income was relatively stable as higher mortgage banking fees, driven by improved MSR valuations, despite lower sale gains, was more than offset by lower trust and investment fees and a seasonal reduction in card fees Noninterest expense decreased modestly from 3Q16 levels that included $7 million of home equity notable items. (1) Results excluding these items were largely driven by higher fraud and regulatory and legal costs and increased equipment and outside services costs offsetting lower salaries and benefits, nonperforming asset costs and occupancy expense Provision for credit losses up $17 million Prior-year quarter: Net income up $25 million, or 37% Net interest income up $74 million, led by higher student, mortgage and unsecured retail balances as well as improved loan yields and deposit spreads Average loans up $4.0 billion, or 8%, and average deposits up $2.2 billion, or 3%, from 4Q15 Noninterest income was relatively stable, driven by higher mortgage banking fees tied to wider gain on sale spreads, secondary volume and an MSR valuation increase, partially offset by the impact of the card reward accounting change Noninterest expense increased $25 million, or 4%, driven by higher fraud, regulatory and legal costs, insurance costs and salaries and benefits expense, partially offset by the card reward accounting change impact Provision for credit losses up $9 million, largely driven by higher net
charge-offs in auto related to a one-time
methodology change
4Q16 change from
$s in millions 4Q16 3Q16 4Q15 3Q16 4Q15 $ % $ % Net interest income 639 $ 621 $ 565 $ 18 $ 3 % 74 $ 13 % Noninterest income 227 229 226 (2) (1) 1 — Total revenue 866 850 791 16 2 75 9 Noninterest expense 649 650 624 (1) — 25 4 Pre-provision profit 217 200 167 17 9 50 30 Provision for credit losses 74 57 65 17 30 9 14 Income before income tax expense 143 143 102 — — 41 40 Income tax expense 51 51 35 — — 16 46 Net income 92 $ 92 $ 67 $ — $ — % 25 $ 37 % Average balances $s in billions Total loans and leases (2) 57 $ 55 $ 53 $ 1 $
2 % 4 $
8 % Total deposits 73 $ 72 $ 71 $ 1 $
1 % 2 $
3 % Mortgage Banking metrics Originations 2,220 $ 2,187 $ 1,426 $ 33 $ 2 % 794 $ 56 % Origination Pipeline 1,868 2,835 1,684 (967) (34) % 184 11 % Gain on sale of secondary originations 1.81% 2.77% 1.77% (96) bps 4 bps Key performance metrics ROTCE (1,3) 7.0% 7.0% 5.5% (7) bps 147 bps Efficiency ratio (1) 75% 76% 79% (156) bps (395) bps 1) Please see important information on Key Performance Metrics and Non-GAAP Financial Measures at the end of this release for an
explanation of our use of these metrics and Non- GAAP Financial
Measures and their reconciliation to GAAP financial measures. Adjusted results exclude restructuring charges, special items and/or notable items, as applicable. 2) Includes held for sale. 3) Operating segments are allocated capital on a risk-adjusted basis considering economic and regulatory capital requirements. We
approximate that regulatory capital is equivalent to a sustainable
target level for tier 1 common equity and then allocate that approximation to the segments based on economic capital. |
 Commercial Banking segment
38 1) Please see important information on Key Performance Metrics and Non-GAAP Financial Measures at the end of this release for an
explanation of our use of these metrics and Non-GAAP
Financial Measures and their reconciliation to GAAP financial measures. Adjusted results exclude restructuring charges, special items and/or notable items, as applicable.
2) Includes held for sale. 3) Operating segments are allocated capital on a risk-adjusted basis considering economic and regulatory capital requirements. We
approximate that regulatory capital is equivalent to a
sustainable target level for tier 1 common equity and then allocate that approximation to the segments based on economic capital. Highlights Linked quarter: Commercial Banking net income increased $10 million, or 6% Total revenue increased $19 million, or 4%, driven by higher loan and deposit growth as well as improved spreads Average loans up $400 million; deposits up $1.6 billion Loan growth driven by strength in Mid-corporate and Industry Verticals and Commercial Real Estate, partially offset a $994 million average decrease related to the Asset Finance lean and loan portfolio transfer to non-core at the end of 3Q16 Noninterest income remained stable as modest growth in FX and L/C fees and interest rate products was offset by reductions in other income, including lower leasing fees related to the Asset Finance lease portfolio transfer to non-core Noninterest expense increased $6 million, largely reflecting higher operational losses, higher salaries and benefits expense tied to incentive compensation and higher insurance costs, partially offset by lower depreciation expense related to the Asset Finance lease and loan portfolio transfer to non-core Provision for credit losses up slightly Prior-year quarter: Net income increased $20 million, or 13% Net interest income was up $46 million, or 15%, driven by strong loan and deposit growth and the benefit of higher interest rates Noninterest income increased $15 million, largely reflecting strength in capital markets, interest rate products and FX fees, partially offset by lower leasing income related to the Asset Finance lease and loan portfolio transfer to non-core Noninterest expense increased $7 million, largely reflecting higher salaries and employee benefits tied to incentive compensation and higher benefits cost, partially offset by lower outside services and lower depreciation expense related to the Asset Finance lease- portfolio transfer to non-core Provision for credit losses increased $22 million, driven by increased losses largely related to higher charge-offs. 4Q16 change from $s in millions 4Q16 3Q16 4Q15 3Q16 4Q15 $ % $ % Net interest income 347 $ 327 $ 301 $ 20 $ 6 % 46 $ 15 % Noninterest income 122 123 107 (1) (1) 15 14 Total revenue 469 450 408 19 4 61 15 Noninterest expense 187 181 180 6 3 7 4 Pre-provision profit 282 269 228 13 5 54 24 Provision for credit losses 20 19 (2) 1 5 22 NM Income before income tax expense 262 250 230 12 5 32 14 Income tax expense 90 88 78 2 2 12 15 Net income 172 $ 162 $ 152 $ 10 $ 6 % 20 $ 13 % Average balances $s in billions Total loans and leases (2) 47 $ 47 $ 43 $ 0 $ 1 % 4 $ 10 % Total deposits 29 $ 28 $ 25 $ 2 $ 6 % 5 $ 20 % Key performance metrics ROTCE (1,3) 12.9% 12.5% 12.6% 44 bps 37 bps Efficiency ratio (1) 40% 40% 44% (38) bps (419) bps |
 Other 39 Linked quarter: Other recorded net income of $18 million, down $25 million, largely driven by the net impact of notable items recorded in 3Q16 Other recorded no net interest income, an increase of $3 million,
largely driven by higher investment income and higher non-core
interest income related to the transfer of a $1.2 billion
Asset Finance lease and loan portfolio in 3Q16 and lower legacy
swap expense
Noninterest income of $28 million
decreased $55 million, largely
reflecting the impact of the TDR Transaction gain in 3Q16
Noninterest expense of $11 million decreased $25 million, driven
by the absence of notable items impact in 3Q16 Provision for credit losses of $8 million decreased $2 million Prior-year quarter: Other net income increased $16 million, driven by a $20 million decrease in provision for credit losses Net interest income decreased $4 million, reflecting higher borrowed funds costs Noninterest income remained relatively stable Noninterest expense up $5 million from 4Q15, largely reflecting increased deprecation expense related to the Asset Finance lease and loan portfolio transfer to non-core Provision for credit losses down $20 million, driven by a $2 million reserve release compared to a $14 million reserve build in 4Q15 Highlights 1) Please see important information on Key Performance Metrics and Non-GAAP Financial Measures at the end of this release for an
explanation of our use of these metrics and Non-GAAP
Financial Measures and their reconciliation to GAAP financial measures. Adjusted results exclude restructuring charges, special items and/or notable items, as applicable.
4Q16 change from
$s in millions 4Q16 3Q16 4Q15 3Q16 4Q15 $ % $ % Net interest income — $ (3) $ 4 $ 3 $ 100 % (4) $ (100) % Noninterest income 28 83 29 (55) (66) (1) (3) Total revenue 28 80 33 (52) (65) (5) (15) Noninterest expense 11 36 6 (25) (69) 5 83 Pre-provision profit (loss) 17 44 27 (27) (61) (10) (37) Provision for credit losses 8 10 28 (2) (20) (20) (71) Income (loss) before income tax expense (benefit) 9 34 (1) (25) (74) 10 NM Income tax expense (benefit) (9) (9) (3) — — (6) (200) Net income (loss) 18 $ 43 $ 2 $ (25) $ (58) % 16 $ NM % Average balances $s in billions Total loans and leases 3 $ 3 $ 3 $ 1 $ 30 % — $ 7 % Total deposits 7 $ 7 $ 6 $ — $ (1) % 1 $ 13 % (1) (1) |
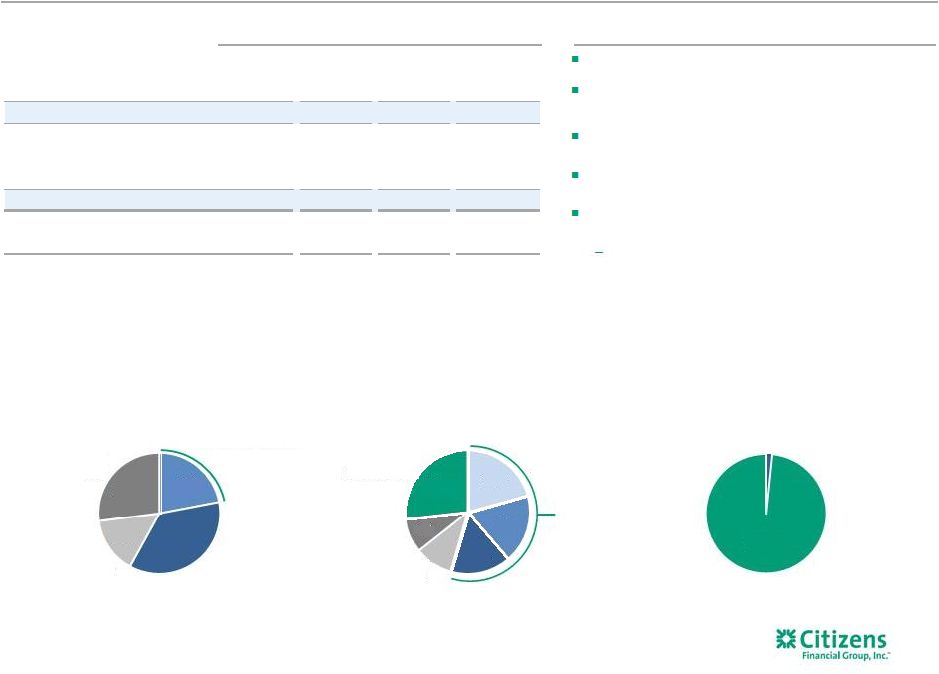 $s in millions
Total O/S Utilized % Criticized % Nonaccrual status Less price-sensitive total 752 $ 61% 4% 2 $
Upstream 268 72% Oilfield Services 297 72% Reserve-based lending (RBL) 348 58% More price-sensitive total 914 66% 54% 158 Total Oil & Gas
1,666 $ 64% 31% 160 $ Total Oil & Gas ex. Aircraft 1,340 $ 58% 39% 158 $ B- and lower Oil & Gas portfolio overview 40 Highlights Total loans outstanding (2) Oil & Gas All other loans BBB+ to BBB- BB+ to BB- B+ to B 22% investment grade ~$900 million more sensitive to declining oil prices Midstream Integrated Downstream Reserve-based lending (RBL) Upstream, Non-RBL Oil Field Services Oil & Gas portfolio by Sub-sector (2) Oil & Gas portfolio by Investment grade-equivalent risk rating (2) 4Q16 Oil & Gas outstandings (1) Well-diversified portfolio with ~100 clients Includes $326 million of corporate aircraft leases arising from Asset Finance Nonperforming loans down $33 million from 3Q16, largely reflecting pay downs on RBL portfolio Existing RBL commitments declined by 7% due to 4Q16 borrowing base redeterminations and restructuring activity Oil and gas portfolio loan loss reserves of $52 million as of 12/31/16 Reserves to total more price-sensitive loans of 7% remained stable with 3Q16 (3) 1) Includes Downstream, Integrated and Midstream sub-categories. 2) Portfolio balances, risk rating and industry sector stratifications as of December 31, 2016.
3) Reserves/(More price-sensitive Oil & Gas portfolio outstandings -
leases secured by aircraft ($129 million)).
1.6% 98.4% 21% 18% 16% 10% 9% 26% 22% 36% 15% 27% |
 Appendix 2 – Key performance metrics, Non-GAAP Financial Measures and reconciliations 41 |
 Key performance metrics, Non-GAAP Financial Measures and reconciliations
42
(Adjusted excluding restructuring charges, special items and/or notable
items) $s in millions, except per share data
4Q16 3Q16 2Q16 1Q16 4Q15 2016 2015 $ % $ % $ % Noninterest income, adjusted: Noninterest income (GAAP) $377 $435 $355 $330 $362 ($58) (13%) $15 4 % $1,497 $1,422 $75 5 % Less: Special items — — — — — — — — — — — — — Less: Notable items — 67 — — — (67) (100) — — 67 — 67 100 Noninterest income, adjusted (non-GAAP) $377 $368 $355 $330 $362 $9 2 % $15 4 % $1,430 $1,422 $8 1 % Total revenue, adjusted: Total revenue (GAAP) A $1,363 $1,380 $1,278 $1,234 $1,232 ($17) (1%) $131 11 % $5,255 $4,824 $431 9 % Less: Special items — — — — — — — — — — — — — Less: Notable items — 67 — — — (67) (100) — — 67 — 67 100 Total revenue, adjusted (non-GAAP) B $1,363 $1,313 $1,278 $1,234 $1,232 $50 4 % $131 11 % $5,188 $4,824 $364 8 % Noninterest expense, adjusted: Noninterest expense (GAAP) C $847 $867 $827 $811 $810 ($20) (2%) $37 5 % $3,352 $3,259 $93 3 % Less: Restructuring charges and special items — — — — — — — — — — 50 (50) (100) Less: Notable items — 36 — — — (36) (100) — — 36 — 36 100 Noninterest expense, adjusted (non-GAAP) D $847 $831 $827 $811 $810 $16 2 % $37 5 % $3,316 $3,209 $107 3 % Pre-provision profit, adjusted: Total revenue, adjusted (non-GAAP) $1,363 $1,313 $1,278 $1,234 $1,232 $50 4 % $131 11 % $5,188 $4,824 $364 8 % Less: Noninterest expense, adjusted (non-GAAP) 847 831 827 811 810 16 2 37 5 3,316 3,209 107 3 Pre-provision profit, adjusted (non-GAAP) $516 $482 $451 $423 $422 $34 7 % $94 22 % $1,872 $1,615 $257 16 % Income before income tax expense, adjusted: Income before income tax expense (GAAP) $414 $427 $361 $332 $331 ($13) (3%) $83 25 % $1,534 $1,263 $271 21 % Less: Income before income tax expense (benefit) related to restructuring charges and special items — — — — — — — — — — (50) 50 100 Less: Income before income tax expense (benefit) related to notable items — 31 — — — (31) (100) — — 31 — 31 100 Income before income tax expense, adjusted (non-GAAP) $414 $396 $361 $332 $331 $18 5 % $83 25 % $1,503 $1,313 $190 14 % Income tax expense, adjusted: Income tax expense (GAAP) $132 $130 $118 $109 $110 $2 2 % $22 20 % $489 $423 $66 16 % Less: Income tax expense (benefit) related to restructuring charges and special items — — — — — — — — — — (19) 19 100 Less: Income tax expense (benefit) related to notable items — 12 — — — (12) (100) — — 12 — 12 100 Income tax expense, adjusted (non-GAAP) $132 $118 $118 $109 $110 $14 12 % $22 20 % $477 $442 $35 8 % Net income, adjusted: Net income (GAAP) E $282 $297 $243 $223 $221 ($15) (5%) $61 28 % $1,045 $840 $205 24 % Add: Restructuring charges and special items, net of income tax expense (benefit) — — — — — — — — — — 31 (31) (100) Add: Notable items, net of income tax expense (benefit) — (19) — — — 19 100 — — (19) — (19) (100) Net income, adjusted (non-GAAP) F $282 $278 $243 $223 $221 $4 1 % $61 28 % $1,026 $871 $155 18 % Net income available to common stockholders, adjusted: Net income available to common stockholders (GAAP) G $282 $290 $243 $216 $221 ($8) (3%) $61 28 % $1,031 $833 $198 24 % Add: Restructuring charges and special items, net of income tax expense (benefit) — — — — — — — — — — 31 (31) (100) Add: Notable items, net of income tax expense (benefit) — (19) — — — 19 100 — — (19) — (19) (100) Net income available to common stockholders, adjusted (non- GAAP) H $282 $271 $243 $216 $221 $11 4 % $61 28 % $1,012 $864 $148 17 % Effective income tax rate, adjusted: Effective income tax rate 31.9% 33.5% Effective income tax rate, adjusted: 31.7 33.7 QUARTERLY TRENDS FULL YEAR 4Q16 Change 2016 Change 3Q16 4Q15 2015 |
 Key performance metrics, Non-GAAP Financial Measures and reconciliations
43
(Adjusted excluding restructuring charges, special items and/or notable
items) $s in millions, except per share data
4Q16 3Q16 2Q16 1Q16 4Q15 2016 2015 $/bps % $/bps % $/bps % Operating leverage: Total revenue (GAAP) A $1,363 $1,380 $1,278 $1,234 $1,232 ($17) (1.23%) $131 10.63 % $5,255 $4,824 $431 8.93 % Less: Noninterest expense (GAAP) C 847 867 827 811 810 (20) (2.31) 37 4.57 3,352 3,259 93 2.85 Operating leverage 1.08 % 6.06 % 6.08 % Operating leverage, adjusted: Total revenue, adjusted (non-GAAP) B $1,363 $1,313 $1,278 $1,234 $1,232 $50 3.81 % $131 10.63 % $5,188 $4,824 $364 7.55 % Less: Noninterest expense, adjusted (non-GAAP) D 847 831 827 811 810 16 1.93 37 4.57 3,316 3,209 107 3.33 Operating leverage, adjusted (non-GAAP) 1.88 % 6.06 % 4.22 % Efficiency ratio and efficiency ratio, adjusted: Efficiency ratio C/A 62.18 % 62.88 % 64.71 % 65.66 % 65.76 % (70) bps (358) bps 63.80 % 67.56 % (376) bps Efficiency ratio, adjusted (non-GAAP) D/B 62.18 63.31 64.71 65.66 65.76 (113) bps (358) bps 63.92 66.52 (260) bps Return on average common equity and return on average common equity, adjusted:
Average common equity (GAAP)
I $19,645 $19,810 $19,768 $19,567 $19,359 ($165) (1%) $286 1 % $19,698 $19,354 $344 2 % Return on average common equity G/I 5.70 % 5.82 % 4.94 % 4.45 % 4.51 % (12) bps 119 bps 5.23 % 4.30 % 93 bps Return on average common equity, adjusted (non-GAAP) H/I 5.70 5.44 4.94 4.45 4.51 26 bps 119 bps 5.14 4.46 68 bps Return on average tangible common equity and return on average tangible common equity,
adjusted: Average common equity (GAAP) I $19,645 $19,810 $19,768 $19,567 $19,359 ($165) (1%) $286 1 % $19,698 $19,354 $344 2 % Less: Average goodwill (GAAP) 6,876 6,876 6,876 6,876 6,876 — — — — 6,876 6,876 — — Less: Average other intangibles (GAAP) 1 1 2 3 3 — — (2) (67) 2 4 (2) (50) Add: Average deferred tax liabilities related to goodwill (GAAP) 523 509 496 481 468 14 3 55 12 502 445 57 13 Average tangible common equity J $13,291 $13,442 $13,386 $13,169 $12,948 ($151) (1%) $343 3 % $13,322 $12,919 $403 3 % Return on average tangible common equity G/J 8.43 % 8.58 % 7.30 % 6.61 % 6.75 % (15) bps 168 bps 7.74 % 6.45 % 129 bps Return on average tangible common equity, adjusted (non-GAAP) H/J 8.43 8.02 7.30 6.61 6.75 41 bps 168 bps 7.60 6.69 91 bps Return on average total assets and return on average total assets, adjusted:
Average total assets (GAAP)
K $147,315 $144,399 $142,179 $138,780 $136,298 $2,916 2 % $11,017 8 % $143,183 $135,070 $8,113 6 % Return on average total assets E/K 0.76 % 0.82 % 0.69 % 0.65 % 0.64 % (6) bps 12 bps 0.73 % 0.62 % 11 bps Return on average total assets, adjusted (non-GAAP) F/K 0.76 0.77 0.69 0.65 0.64 (1) bps 12 bps 0.72 0.64 8 bps Return on average total tangible assets and return on average total tangible assets, adjusted:
Average total assets (GAAP)
K $147,315 $144,399 $142,179 $138,780 $136,298 $2,916 2 % $11,017 8 % $143,183 $135,070 $8,113 6 % Less: Average goodwill (GAAP) 6,876 6,876 6,876 6,876 6,876 — — — — 6,876 6,876 — — Less: Average other intangibles (GAAP) 1 1 2 3 3 — — (2) (67) 2 4 (2) (50) Add: Average deferred tax liabilities related to goodwill (GAAP) 523 509 496 481 468 14 3 55 12 502 445 57 13 Average tangible assets L $140,961 $138,031 $135,797 $132,382 $129,887 $2,930 2 % $11,074 9 % $136,807 $128,635 $8,172 6 % Return on average total tangible assets E/L 0.79 % 0.86 % 0.72 % 0.68 % 0.67 % (7) bps 12 bps 0.76 % 0.65 % 11 bps Return on average total tangible assets, adjusted (non-GAAP) F/L 0.79 0.80 0.72 0.68 0.67 (1) bps 12 bps 0.75 0.68 7 bps QUARTERLY TRENDS FULL YEAR 4Q16 Change 2016 Change 3Q16 4Q15 2015 |
 Key performance metrics, Non-GAAP Financial Measures and reconciliations
44
1) Basel III ratios assume certain definitions impacting qualifying Basel III capital, which otherwise will phase in through 2019, are fully
phased-in. Ratios also reflect the required US Standardized
methodology for calculating RWAs, effective January 1, 2015.
(Adjusted excluding restructuring charges, special items and/or notable
items) $s in millions, except per share data
4Q16 3Q16 2Q16 1Q16 4Q15 2016 2015 $/bps % $/bps % $/bps % Tangible book value per common share: Common shares - at end of period (GAAP) M 511,954,871 518,148,345 529,094,976 528,933,727 527,774,428 (6,193,474) (1%) (15,819,557) (3%) 511,954,871 527,774,428 (15,819,557) (3%) Common stockholders' equity (GAAP) $19,499 $19,934 $19,979 $19,718 $19,399 ($435) (2) $100 1 $19,499 $19,399 $100 1 Less: Goodwill (GAAP) 6,876 6,876 6,876 6,876 6,876 — — — — 6,876 6,876 — — Less: Other intangible assets (GAAP) 1 1 2 3 3 — — (2) (67) 1 3 (2) (67) Add: Deferred tax liabilities related to goodwill (GAAP) 532 519 507 494 480 13 3 52 11 532 480 52 11 Tangible common equity N $13,154 $13,576 $13,608 $13,333 $13,000 ($422) (3%) $154 1 % $13,154 $13,000 $154 1 % Tangible book value per common share N/M $25.69 $26.20 $25.72 $25.21 $24.63 ($0.51) (2%) $1.06 4 % $25.69 $24.63 $1.06 4 % Net income per average common share - basic and diluted, adjusted: Average common shares outstanding - basic (GAAP) O 512,015,920 519,458,976 528,968,330 528,070,648 527,648,630 (7,443,056) (1%) (15,632,710) (3%) 522,093,545 535,599,731 (13,506,186) (3%) Average common shares outstanding - diluted (GAAP) P 513,897,085 521,122,466 530,365,203 530,446,188 530,275,673 (7,225,381) (1) (16,378,588) (3) 523,930,718 538,220,898 (14,290,180) (3) Net income available to common stockholders (GAAP) G $282 $290 $243 $216 $221 ($8) (3) $61 28 $1,031 $833 $198 24 Net income per average common share - basic (GAAP) G/O 0.55 0.56 0.46 0.41 0.42 (0.01) (2) 0.13 31 1.97 1.55 0.42 27 Net income per average common share - diluted (GAAP) G/P 0.55 0.56 0.46 0.41 0.42 (0.01) (2) 0.13 31 1.97 1.55 0.42 27 Net income available to common stockholders, adjusted (non-GAAP) H 282 271 243 216 221 11 4 61 28 1,012 864 148 17 Net income per average common share - basic, adjusted (non-GAAP) H/O 0.55 0.52 0.46 0.41 0.42 0.03 6 0.13 31 1.94 1.61 0.33 20 Net income per average common share - diluted, adjusted (non-GAAP) H/P 0.55 0.52 0.46 0.41 0.42 0.03 6 0.13 31 1.93 1.61 0.32 20 Pro forma Basel III fully phased-in common equity tier 1 capital ratio
1 : Common equity tier 1 (regulatory) $13,822 $13,763 $13,768 $13,570 $13,389 Less: Change in DTA and other threshold deductions (GAAP) — — 1 1 2 Pro forma Basel III fully phased-in common equity tier 1 Q $13,822 $13,763 $13,767 $13,569 $13,387 Risk-weighted assets (regulatory general risk weight approach) $123,857 $121,612 $119,492 $116,591 $114,084 Add: Net change in credit and other risk-weighted assets (regulatory)
244 228 228 232 244 Pro forma Basel III standardized approach risk-weighted assets R $124,101 $121,840 $119,720 $116,823 $114,328 Pro forma Basel III fully phased-in common equity tier 1 capital ratio
1 Q/R 11.1 % 11.3 % 11.5 % 11.6 % 11.7 % 4Q16 Change 2016 Change QUARTERLY TRENDS FULL YEAR 3Q16 4Q15 2015 |
 Key performance metrics, Non-GAAP Financial Measures and reconciliations
45
(Adjusted excluding restructuring charges, special items and/or notable
items) $s in millions, except per share data
4Q16 3Q16 2Q16 1Q16 4Q15 2016 2015 $ % $ % $ % Other income, adjusted Other income (GAAP) $28 $90 $18 $16 $23 ($62) (69%) $5 22 % $152 $94 $58 62 % Less: Special items — — — — — — — — — — — — — Less: Notable items — 67 — — — (67) (100) — — 67 — 67 100 Other income, adjusted (non-GAAP) $28 $23 $18 $16 $23 $5 22 % $5 22% $85 $94 ($9) (10%) Salaries and employee benefits, adjusted: Salaries and employee benefits (GAAP) $420 $432 $432 $425 $402 ($12) (3%) $18 4 % $1,709 $1,636 $73 4 % Less: Restructuring charges and special items — — — — (2) — — 2 100 — 3 (3) (100) Less: Notable items — 11 — — — (11) (100) — — 11 — 11 100 Salaries and employee benefits, adjusted (non-GAAP) $420 $421 $432 $425 $404 ($1) 0% $16 4 % $1,698 $1,633 $65 4 % Outside services, adjusted: Outside services (GAAP) $98 $102 $86 $91 $104 ($4) (4%) ($6) (6%) $377 $371 $6 2 % Less: Restructuring charges and special items — — — — 2 — — (2) (100) — 26 (26) (100) Less: Notable items — 8 — — — (8) (100) — — 8 — 8 100 Outside services, adjusted (non-GAAP) $98 $94 $86 $91 $102 $4 4 % ($4) (4%) $369 $345 $24 7 % Occupancy, adjusted: Occupancy (GAAP) $77 $78 $76 $76 $74 ($1) (1%) $3 4 % $307 $319 ($12) (4%) Less: Restructuring charges and special items — — — — — — — — — — 17 (17) (100) Less: Notable items — — — — — — — — — — — — — Occupancy, adjusted (non-GAAP) $77 $78 $76 $76 $74 ($1) (1%) $3 4 % $307 $302 $5 2 % Equipment expense, adjusted: Equipment expense (GAAP) $69 $65 $64 $65 $67 $4 6 % $2 3 % $263 $257 $6 2 % Less: Restructuring charges and special items — — — — — — — — — — 1 (1) (100) Less: Notable items — — — — — — — — — — — — — Equipment expense, adjusted (non-GAAP) $69 $65 $64 $65 $67 $4 6 % $2 3 % $263 $256 $7 3 % Amortization of software, adjusted: Amortization of software (GAAP) $44 $46 $41 $39 $38 ($2) (4%) $6 16 % $170 $146 $24 16 % Less: Restructuring charges and special items — — — — — — — — — — — — — Less: Notable items — 3 — — — (3) (100) — — 3 — 3 100 Amortization of software, adjusted (non-GAAP) $44 $43 $41 $39 $38 $1 2 % $6 16 % $167 $146 $21 14 % Other operating expense, adjusted: Other operating expense (GAAP) $139 $144 $128 $115 $125 ($5) (3%) $14 11 % $526 $530 ($4) (1%) Less: Restructuring charges and special items — — — — — — — — — — 3 (3) (100) Less: Notable items — 14 — — — (14) (100) — — 14 — 14 100 Other operating expense, adjusted (non-GAAP) $139 $130 $128 $115 $125 $9 7 % $14 11% $512 $527 ($15) (3%) Restructuring charges, special expense items and notable expense items include:
Restructuring charges
$— $— $— $— $— $— —% $— —% $— $26 ($26) (100)% Special items — — — — — — — — — — 24 (24) (100) Notable items — 36 — — — (36) (100) — — 36 — 36 100 Restructuring charges, special expense items and notable expense items $— $36 $— $— $— ($36) (100%) $— —% $36 $50 ($14) (28%) 3Q16 4Q15 2015 QUARTERLY TRENDS FULL YEAR 4Q16 Change 2016 Change |
 Key performance metrics, Non-GAAP Financial Measures and reconciliations
46
$s in millions Consumer Banking Commercial Banking Other Consolidated Consumer Banking Commercial Banking Other Consolidated Consumer Banking Commercial Banking Other Consolidated Net income available to common stockholders: Net income (loss) (GAAP) A $92 $172 $18 $282 $92 $162 $43 $297 $90 $164 ($11) $243 Less: Preferred stock dividends — — — — — — 7 7 — — — — Net income available to common stockholders B $92 $172 $18 $282 $92 $162 $36 $290 $90 $164 ($11) $243 Return on average tangible common equity: Average common equity (GAAP) $5,275 $5,278 $9,092 $19,645 $5,190 $5,172 $9,448 $19,810 $5,110 $5,040 $9,618 $19,768 Less: Average goodwill (GAAP) — — 6,876 6,876 — — 6,876 6,876 — — 6,876 6,876 Average other intangibles (GAAP) — — 1 1 — — 1 1 — — 2 2 Add: Average deferred tax liabilities related to goodwill (GAAP) — — 523 523 — — 509 509 — — 496 496 Average tangible common equity C $5,275 $5,278 $2,738 $13,291 $5,190 $5,172 $3,080 $13,442 $5,110 $5,040 $3,236 $13,386 Return on average tangible common equity B/C 6.97 % 12.94 % NM 8.43 % 7.04 % 12.50 % NM 8.58 % 7.09 % 13.04 % NM 7.30 % Return on average total tangible assets: Average total assets (GAAP) $58,066 $48,024 $41,225 $147,315 $56,689 $47,902 $39,808 $144,399 $55,660 $47,388 $39,131 $142,179 Less: Average goodwill (GAAP) — — 6,876 6,876 — — 6,876 6,876 — — 6,876 6,876 Average other intangibles (GAAP) — — 1 1 — — 1 1 — — 2 2 Add: Average deferred tax liabilities related to goodwill (GAAP) — — 523 523 — — 509 509 — — 496 496 Average tangible assets D $58,066 $48,024 $34,871 $140,961 $56,689 $47,902 $33,440 $138,031 $55,660 $47,388 $32,749 $135,797 Return on average total tangible assets A/D 0.63 % 1.42 % NM 0.79 % 0.64 % 1.35 % NM 0.86 % 0.65 % 1.39 % NM 0.72 % Efficiency ratio: Noninterest expense (GAAP) E $649 $187 $11 $847 $650 $181 $36 $867 $632 $186 $9 $827 Net interest income (GAAP) 639 347 — 986 621 327 (3) 945 602 314 7 923 Noninterest income (GAAP) 227 122 28 377 229 123 83 435 219 122 14 355 Total revenue (GAAP) F $866 $469 $28 $1,363 $850 $450 $80 $1,380 $821 $436 $21 $1,278 Efficiency ratio E/F 74.90 % 39.83 % NM 62.18 % 76.46 % 40.21 % NM 62.88 % 76.98 % 42.88 % NM 64.71 % Consumer Banking Commercial Banking Other Consolidated Consumer Banking Commercial Banking Other Consolidated Net income available to common stockholders: Net income (loss) (GAAP) A $71 $133 $19 $223 $67 $152 $2 $221 Less: Preferred stock dividends — — 7 7 — — — — Net income available to common stockholders B $71 $133 $12 $216 $67 $152 $2 $221 Return on average tangible common equity: Average common equity (GAAP) $5,089 $4,790 $9,688 $19,567 $4,831 $4,787 $9,741 $19,359 Less: Average goodwill (GAAP) — — 6,876 6,876 — — 6,876 6,876 Average other intangibles (GAAP) — — 3 3 — — 3 3 Add: Average deferred tax liabilities related to goodwill (GAAP) — — 481 481 — — 468 468 Average tangible common equity C $5,089 $4,790 $3,290 $13,169 $4,831 $4,787 $3,330 $12,948 Return on average tangible common equity B/C 5.59 % 11.19 % NM 6.61 % 5.50 % 12.57 % NM 6.75 % Return on average total tangible assets: Average total assets (GAAP) $55,116 $45,304 $38,360 $138,780 $54,065 $43,835 $38,398 $136,298 Less: Average goodwill (GAAP) — — 6,876 6,876 — — 6,876 6,876 Average other intangibles (GAAP) — — 3 3 — — 3 3 Add: Average deferred tax liabilities related to goodwill (GAAP) — — 481 481 — — 468 468 Average tangible assets D $55,116 $45,304 $31,962 $132,382 $54,065 $43,835 $31,987 $129,887 Return on average total tangible assets A/D 0.52 % 1.18 % NM 0.68 % 0.49 % 1.37 % NM 0.67 % Efficiency ratio: Noninterest expense (GAAP) E $616 $187 $8 $811 $624 $180 $6 $810 Net interest income (GAAP) 581 300 23 904 565 301 4 870 Noninterest income (GAAP) 208 99 23 330 226 107 29 362 Total revenue (GAAP) F $789 $399 $46 $1,234 $791 $408 $33 $1,232 Efficiency ratio E/F 78.08 % 46.74 % NM 65.66 % 78.85 % 44.02 % NM 65.76 % THREE MONTHS ENDED DEC 31, THREE MONTHS ENDED SEPT 30, THREE MONTHS ENDED JUNE 30, 2016 2016 2016 THREE MONTHS ENDED MAR 31, THREE MONTHS ENDED DEC 31, 2016 2015 |
 Key performance metrics, Non-GAAP Financial Measures and reconciliations
47
$s in millions
Consumer Banking Commercial Banking Other Consolidated Consumer Banking Commercial Banking Other Consolidated Net income available to common stockholders: Net income (loss) (GAAP) A $345 $631 $69 $1,045 $262 $579 ($1) $840 Less: Preferred stock dividends — — 14 14 — — 7 7 Net income available to common stockholders B $345 $631 $55 $1,031 $262 $579 ($8) $833 Return on average tangible common equity: Average common equity (GAAP) $5,166 $5,071 $9,461 $19,698 $4,739 $4,666 $9,949 $19,354 Less: Average goodwill (GAAP) — — 6,876 6,876 — — 6,876 6,876 Average other intangibles (GAAP) — — 2 2 — — 4 4 Add: Average deferred tax liabilities related to goodwill (GAAP) — — 502 502 — — 445 445 Average tangible common equity C $5,166 $5,071 $3,085 $13,322 $4,739 $4,666 $3,514 $12,919 Return on average tangible common equity B/C 6.68 % 12.44 % NM 7.74 % 5.53 % 12.41 % NM 6.45 % Return on average total tangible assets: Average total assets (GAAP) $56,388 $47,159 $39,636 $143,183 $52,848 $42,800 $39,422 $135,070 Less: Average goodwill (GAAP) — — 6,876 6,876 — — 6,876 6,876 Average other intangibles (GAAP) — — 2 2 — — 4 4 Add: Average deferred tax liabilities related to goodwill (GAAP) — — 502 502 — — 445 445 Average tangible assets D $56,388 $47,159 $33,260 $136,807 $52,848 $42,800 $32,987 $128,635 Return on average total tangible assets A/D 0.61 % 1.34 % NM 0.76 % 0.50 % 1.35 % NM 0.65 % Efficiency ratio: Noninterest expense (GAAP) E $2,547 $741 $64 $3,352 $2,456 $709 $94 $3,259 Net interest income (GAAP) 2,443 1,288 27 3,758 2,198 1,162 42 3,402 Noninterest income (GAAP) 883 466 148 1,497 910 415 97 1,422 Total revenue (GAAP) F $3,326 $1,754 $175 $5,255 $3,108 $1,577 $139 $4,824 Efficiency ratio E/F 76.57 % 42.26 % NM 63.80 % 79.02 % 44.94 % NM 67.56 % FULL YEAR 2016 2015 |
 Net income per average common share - diluted, adjusted (non-GAAP)
Key performance metrics, Non-GAAP Financial Measures and
reconciliations 48
$s in millions
DEC. 31, SEP. 30, JUNE 30, MAR. 31, DEC. 31, SEP. 30, JUNE 30, MAR. 31, DEC. 31, SEP. 30, JUNE 30, MAR. 31, DEC. 31, SEP. 30, 2016 2016 2016 2016 2015 2015 2015 2015 2014 2014 2014 2014 2013 2013 Total revenue, adjusted: Total revenue (GAAP) A $1,363 $1,380 $1,278 $1,234 $1,232 $1,209 $1,200 $1,183 $1,179 $1,161 $1,473 $1,166 $1,158 $1,153 Less: Special items — — — — — — — — — — 288 — — — Less: Notable items — 67 — — — — — — — — — — — — Total revenues, adjusted (non-GAAP) B $1,363 $1,313 $1,278 $1,234 $1,232 $1,209 $1,200 $1,183 $1,179 $1,161 $1,185 $1,166 $1,158 $1,153 Noninterest expense, adjusted: Noninterest expense (GAAP) C $847 $867 $827 $811 $810 $798 $841 $810 $824 $810 $948 $810 $818 $788 Less: Restructuring charges and special items — — — — — — 40 10 33 21 115 — 26 — Less: Notable items — 36 — — — — — — — — — — — — Noninterest expense, adjusted (non-GAAP) D $847 $831 $827 $811 $810 $798 $801 $800 $791 $789 $833 $810 $792 $788 Efficiency ratio and efficiency ratio, adjusted: Efficiency ratio C/A 62 % 63 % 65 % 66 % 66 % 66 % 70 % 68 % 70 % 70 % 64 % 69 % 71 % 68 % Efficiency ratio, adjusted (non-GAAP) D/B 62 63 65 66 66 66 67 68 67 68 70 69 68 68 Net income, adjusted: Net income (GAAP) E $282 $297 $243 $223 $221 $220 $190 $209 $197 $189 $313 $166 $152 $144 Add: Restructuring charges and special items, net of income tax expense (benefit) — — — — — — 25 6 20 13 (108) — 17 — Add: Notable items, net of income tax expense (benefit) — (19) — — — — — — — — — — — — Net income, adjusted (non-GAAP) F $282 $278 $243 $223 $221 $220 $215 $215 $217 $202 $205 $166 $169 $144 average common share - diluted, adjusted Net income available to common stockholders (GAAP) G $282 $290 $243 $216 $221 $213 $190 $209 $197 $189 $313 $166 $152 $144 Add: Restructuring charges and special items, net of income tax expense (benefit) — — — — — — 25 6 20 13 (108) — 17 — Add: Notable items, net of income tax expense (benefit) — (19) — — — — — — — — — — — — Net income available to common stockholders, adjusted (non-GAAP) H $282 $271 $243 $216 $221 $213 $215 $215 $217 $202 $205 $166 $169 $144 Average common shares outstanding - diluted (GAAP) P 513,897,085 521,122,466 530,365,203 530,446,188 530,275,673 533,398,158 539,909,366 549,798,717 550,676,298 560,243,747 559,998,324 559,998,324 559,998,324 559,998,324 Net income per average common share - diluted G/P $0.55 $0.56 $0.46 $0.41 $0.42 $0.40 $0.35 $0.38 $0.36 $0.34 $0.56 $0.30 $0.27 $0.26 H/P 0.55 0.52 0.46 0.41 0.42 0.40 0.40 0.39 0.39 0.36 0.37 0.30 0.30 0.26 Return on average tangible common equity and return on average tangible common equity, adjusted: Average common equity (GAAP) $19,645 $19,810 $19,768 $19,567 $19,359 $19,261 $19,391 $19,407 $19,209 $19,411 $19,607 $19,370 $19,364 $19,627 Less: Average goodwill (GAAP) 6,876 6,876 6,876 6,876 6,876 6,876 6,876 6,876 6,876 6,876 6,876 6,876 6,876 6,876 Less: Average other intangibles (GAAP) 1 1 2 3 3 4 5 5 6 6 7 7 8 9 Add: Average deferred tax liabilities related to goodwill (GAAP) 523 509 496 481 468 453 437 422 403 384 369 351 342 325 Average tangible common equity J $13,291 $13,442 $13,386 $13,169 $12,948 $12,834 $12,947 $12,948 $12,730 $12,913 $13,093 $12,838 $12,822 $13,067 Return on average tangible common equity G/J 8.43 % 8.58 % 7.30 % 6.61 % 6.75 % 6.60 % 5.90 % 6.53 % 6.12 % 5.81 % 9.59 % 5.24 % 4.71 % 4.34 % Return on average tangible common equity, adjusted (non-GAAP) H/J 8.43 8.02 7.30 6.61 6.75 6.60 6.67 6.73 6.76 6.22 6.28 5.24 5.24 4.34 Return on average total tangible assets and return on average total tangible assets, adjusted: Average total assets (GAAP) K $147,315 $144,399 $142,179 $138,780 $136,298 $135,103 $135,521 $133,325 $130,671 $128,691 $127,148 $123,904 $120,393 $117,386 Less: Average goodwill (GAAP) 6,876 6,876 6,876 6,876 6,876 6,876 6,876 6,876 6,876 6,876 6,876 6,876 6,876 6,876 Less: Average other intangibles (GAAP) 1 1 2 3 3 4 5 5 6 6 7 7 8 9 Add: Average deferred tax liabilities related to goodwill (GAAP) 523 509 496 481 468 453 437 422 403 384 369 351 342 325 Average tangible assets L $140,961 $138,031 $135,797 $132,382 $129,887 $128,676 $129,077 $126,866 $124,192 $122,193 $120,634 $117,372 $113,851 $110,826 Return on average total tangible assets E/L 0.79 % 0.86 % 0.72 % 0.68 % 0.67 % 0.68 % 0.59 % 0.67 % 0.63 % 0.61 % 1.04 % 0.57 % 0.53 % 0.52 % Return on average total tangible assets, adjusted (non-GAAP) F/L 0.79 0.80 0.72 0.68 0.67 0.68 0.67 0.69 0.69 0.66 0.68 0.57 0.59 0.52 FOR THE THREE MONTHS ENDED Net income per average common share - diluted, and net income per |
 49 |