Attached files
| file | filename |
|---|---|
| EX-99.1 - PRESS RELEASE - Cable One, Inc. | ex99-1.htm |
| 8-K - CURRENT REPORT - Cable One, Inc. | form8k.htm |
Exhibit 99.2
Acquisition of NewWaveJanuary 2017
Disclaimer 1 This presentation has been prepared by Cable One, Inc. (Cable ONE). The information contained in this presentation is for informational purposes only. The information contained in this presentation is not investment or financial product advice and is not intended to be used as the basis for making an investment decision. This presentation has been prepared without taking into account the investment objectives, financial situation or particular needs of any particular person.No representation or warranty, expressed or implied, is made as to the fairness, accuracy, completeness or correctness of the information, opinions or conclusions contained in this presentation. To the maximum extent permitted by law, none of Cable ONE, its directors, employees or agents, nor any other person, accepts any liability, including, without limitation, any liability arising out of fault or negligence for any loss arising from the use of the information contained in this presentation.This presentation contains “forward-looking statements” that involve risks and uncertainties. These statements can be identified by the fact that they do not relate strictly to historical or current facts, but rather are based on current expectations, estimates, assumptions and projections about the cable industry and our business and financial results. Forward-looking statements often include words such as “anticipates,” “estimates,” “expects,” “projects,” “intends,” “plans,” “believes” and words and terms of similar substance in connection with discussions of future operating or financial performance. As with any projection or forecast, forward-looking statements are inherently susceptible to uncertainty and changes in circumstances. Our actual results may vary materially from those expressed or implied in our forward-looking statements. Accordingly, undue reliance should not be placed on any forward-looking statement made by us or on our behalf. Important factors that could cause our actual results to differ materially from those in our forward-looking statements include government regulation, economic, strategic, political and social conditions and the following factors: uncertainties as to the timing of the acquisition of NewWave Communications (NewWave) and the risk that the transaction may not be completed in a timely manner or at all; the possibility that any or all of the various conditions to the consummation of the acquisition of NewWave may not be satisfied or waived, including failure to receive any required regulatory approvals (or any conditions, limitations or restrictions placed in connection with such approvals); risks regarding the failure to obtain the necessary financing to complete the transaction; the effect of the announcement or pendency of the transaction on our and NewWave's ability to retain and hire key personnel and our and NewWave’s ability to maintain relationships with customers, suppliers and other business partners; risks related to diverting management’s attention from our ongoing business operations; uncertainties as to our ability and the amount of time necessary to realize the expected synergies and other benefits of the transaction; our ability to integrate NewWave’s operations into our own; rising levels of competition from historical and new entrants in our markets; recent and future changes in technology; our ability to continue to grow our business services product; increases in programming costs and retransmission fees; our ability to obtain support from vendors; the effects of any significant acquisitions by us; adverse economic conditions; the integrity and security of our network and information systems; legislative and regulatory efforts to impose new legal requirements on our data services; changing and additional regulation of our data, video and voice services; our ability to renew cable system franchises; increases in pole attachment costs; the failure to meet earnings expectations; the adequacy of our risk management framework; changes in tax and other laws and regulations; changes in GAAP or other applicable accounting policies; and the other risks and uncertainties detailed in the section titled “Risk Factors” in our Annual Report on Form 10-K as filed with the SEC on March 7, 2016.Any forward-looking statements made by us in this communication speak only as of the date on which they are made. We are under no obligation to, and expressly disclaim any obligation to, update or alter our forward-looking statements, whether as a result of new information, subsequent events or otherwise.Except as otherwise expressly provided, all information herein speaks only as of (1) the date hereof, in the case of information about Cable ONE, or (2) the date of such information, in the case of information from persons other than Cable ONE. Cable ONE undertakes no duty to update or revise the information contained herein, publicly or otherwise. Estimates regarding Cable ONE’s or NewWave's industry and end markets are based on sources we believe to be reliable, however there can be no assurance these forecasts and estimates will prove accurate in whole or in part.The financial results for NewWave in this presentation have been derived from the unaudited financial statements prepared by NewWave, without adjustment to conform to the accounting policies and methodologies used by Cable ONE. The accounting policies and methodologies used by NewWave differ in certain respects from those used by Cable ONE, but Cable ONE does not believe these differences are material to the combined company.
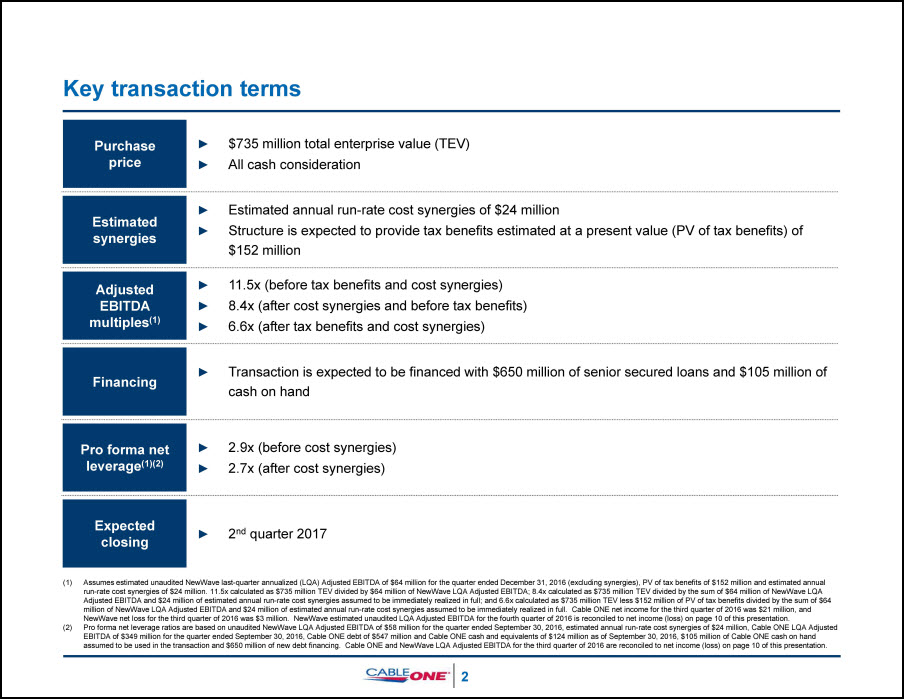
Key transaction terms 2 Purchase price Estimated synergies Adjusted EBITDA multiples(1) Financing Pro forma net leverage(1)(2) Expected closing $735 million total enterprise value (TEV)All cash consideration Estimated annual run-rate cost synergies of $24 millionStructure is expected to provide tax benefits estimated at a present value (PV of tax benefits) of $152 million 11.5x (before tax benefits and cost synergies)8.4x (after cost synergies and before tax benefits)6.6x (after tax benefits and cost synergies) Transaction is expected to be financed with $650 million of senior secured loans and $105 million of cash on hand 2.9x (before cost synergies)2.7x (after cost synergies) 2nd quarter 2017 Assumes estimated unaudited NewWave last-quarter annualized (LQA) Adjusted EBITDA of $64 million for the quarter ended December 31, 2016 (excluding synergies), PV of tax benefits of $152 million and estimated annual run-rate cost synergies of $24 million. 11.5x calculated as $735 million TEV divided by $64 million of NewWave LQA Adjusted EBITDA; 8.4x calculated as $735 million TEV divided by the sum of $64 million of NewWave LQA Adjusted EBITDA and $24 million of estimated annual run-rate cost synergies assumed to be immediately realized in full; and 6.6x calculated as $735 million TEV less $152 million of PV of tax benefits divided by the sum of $64 million of NewWave LQA Adjusted EBITDA and $24 million of estimated annual run-rate cost synergies assumed to be immediately realized in full. Cable ONE net income for the third quarter of 2016 was $21 million, and NewWave net loss for the third quarter of 2016 was $3 million. NewWave estimated unaudited LQA Adjusted EBITDA for the fourth quarter of 2016 is reconciled to net income (loss) on page 10 of this presentation.Pro forma net leverage ratios are based on unaudited NewWave LQA Adjusted EBITDA of $58 million for the quarter ended September 30, 2016, estimated annual run-rate cost synergies of $24 million, Cable ONE LQA Adjusted EBITDA of $349 million for the quarter ended September 30, 2016, Cable ONE debt of $547 million and Cable ONE cash and equivalents of $124 million as of September 30, 2016, $105 million of Cable ONE cash on hand assumed to be used in the transaction and $650 million of new debt financing. Cable ONE and NewWave LQA Adjusted EBITDA for the third quarter of 2016 are reconciled to net income (loss) on page 10 of this presentation.
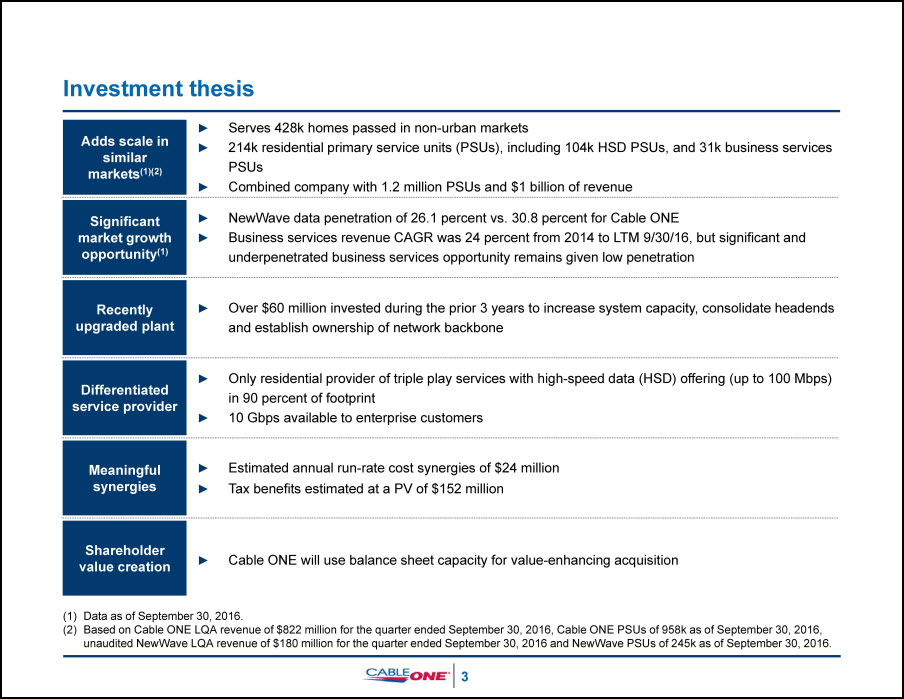
Investment thesis 3 Adds scale in similar markets(1)(2) Significant market growth opportunity(1) Recently upgraded plant Differentiated service provider Meaningful synergies Shareholder value creation Serves 428k homes passed in non-urban markets214k residential primary service units (PSUs), including 104k HSD PSUs, and 31k business services PSUsCombined company with 1.2 million PSUs and $1 billion of revenue NewWave data penetration of 26.1 percent vs. 30.8 percent for Cable ONEBusiness services revenue CAGR was 24 percent from 2014 to LTM 9/30/16, but significant and underpenetrated business services opportunity remains given low penetration Over $60 million invested during the prior 3 years to increase system capacity, consolidate headends and establish ownership of network backbone Only residential provider of triple play services with high-speed data (HSD) offering (up to 100 Mbps) in 90 percent of footprint10 Gbps available to enterprise customers Estimated annual run-rate cost synergies of $24 millionTax benefits estimated at a PV of $152 million Cable ONE will use balance sheet capacity for value-enhancing acquisition Data as of September 30, 2016.Based on Cable ONE LQA revenue of $822 million for the quarter ended September 30, 2016, Cable ONE PSUs of 958k as of September 30, 2016, unaudited NewWave LQA revenue of $180 million for the quarter ended September 30, 2016 and NewWave PSUs of 245k as of September 30, 2016.
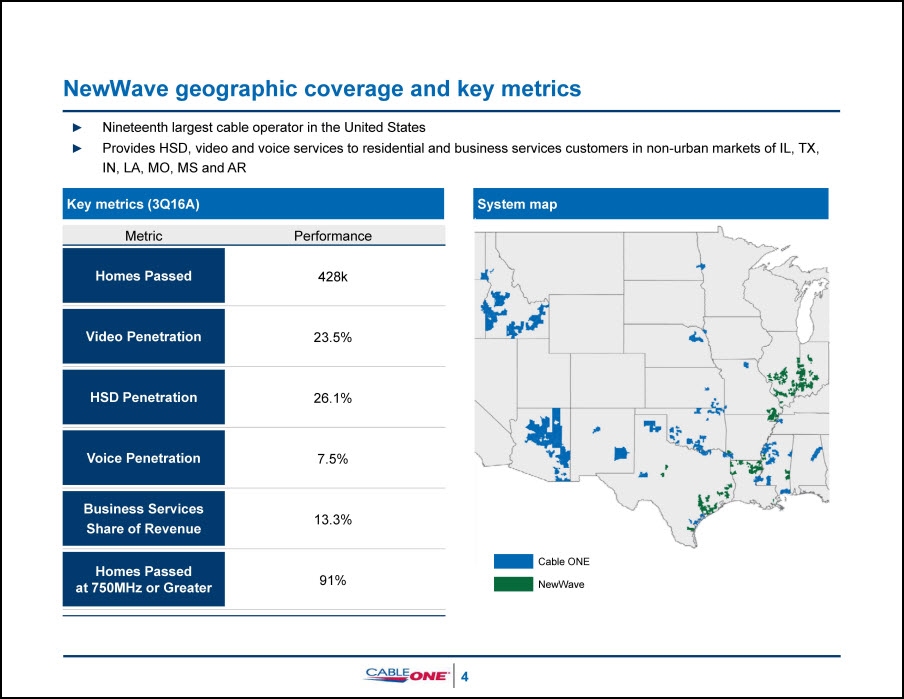
NewWave geographic coverage and key metrics 4 Nineteenth largest cable operator in the United StatesProvides HSD, video and voice services to residential and business services customers in non-urban markets of IL, TX, IN, LA, MO, MS and AR Key metrics (3Q16A) System map Metric Performance Homes Passed 428k Video Penetration 23.5% HSD Penetration 26.1% Voice Penetration 7.5% Business ServicesShare of Revenue 13.3% Homes Passedat 750MHz or Greater 91% Cable ONE NewWave
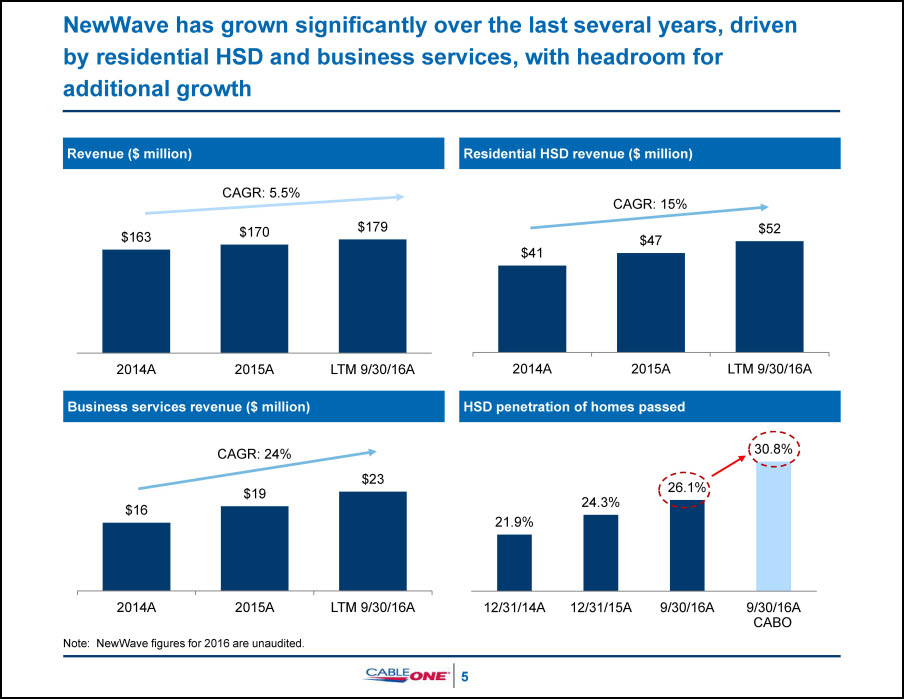
NewWave has grown significantly over the last several years, driven by residential HSD and business services, with headroom for additional growth 5 Revenue ($ million) Residential HSD revenue ($ million) HSD penetration of homes passed CAGR: 5.5% Business services revenue ($ million) Note: NewWave figures for 2016 are unaudited. CAGR: 15% CAGR: 24% CABO
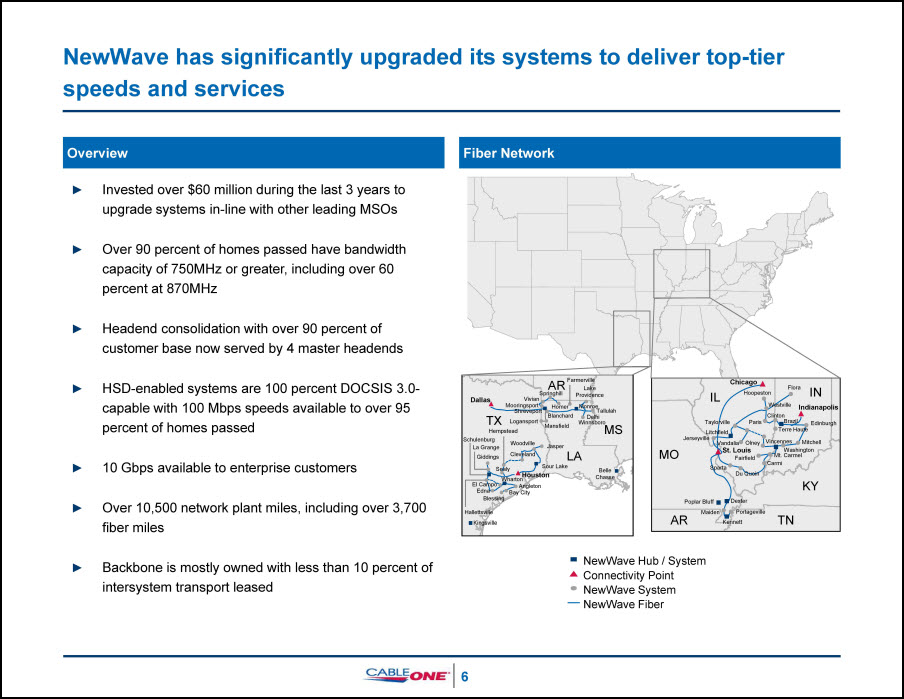
NewWave has significantly upgraded its systems to deliver top-tier speeds and services 6 Invested over $60 million during the last 3 years to upgrade systems in-line with other leading MSOsOver 90 percent of homes passed have bandwidth capacity of 750MHz or greater, including over 60 percent at 870MHzHeadend consolidation with over 90 percent of customer base now served by 4 master headendsHSD-enabled systems are 100 percent DOCSIS 3.0-capable with 100 Mbps speeds available to over 95 percent of homes passed 10 Gbps available to enterprise customersOver 10,500 network plant miles, including over 3,700 fiber milesBackbone is mostly owned with less than 10 percent of intersystem transport leased Overview Fiber Network Dallas Houston Lake Providence Tallulah Jasper Woodville Cleveland Sour Lake Hempstead Sealy Giddings La Grange Schulenburg Hallettsville El Campo Edna Blessing Kingsville Angleton Wharton Bay City Belle Chasse Delhi Winnsboro Logansport Mansfield Blanchard Monroe Farmerville Homer Springhill Vivian Mooringsport Shreveport Chicago Indianapolis St. Louis Edinburgh Mitchell Washington Mt. Carmel Carmi Flora Kennett Portageville Maiden Poplar Bluff Dexter Du Quoin Sparta Fairfield Jerseyville Litchfield Taylorville Vandalia Brazil Olney Vincennes Terre Haute Paris Westville Hoopeston Clinton TX AR MS LA AR MO IL IN KY TN NewWave Hub / System Connectivity Point NewWave System NewWave Fiber
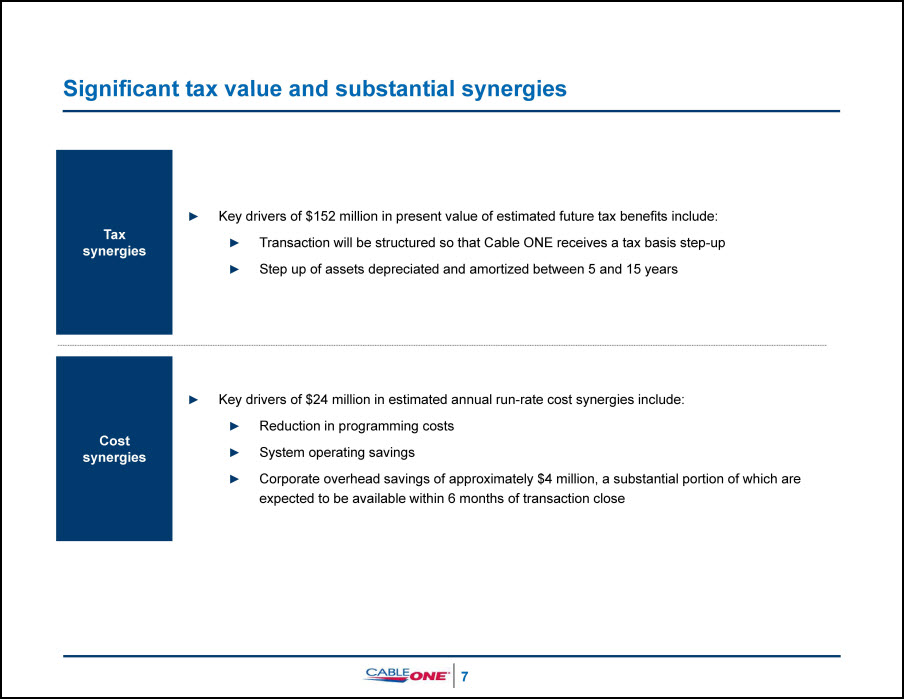
7 Significant tax value and substantial synergies Key drivers of $152 million in present value of estimated future tax benefits include: Transaction will be structured so that Cable ONE receives a tax basis step-upStep up of assets depreciated and amortized between 5 and 15 years Key drivers of $24 million in estimated annual run-rate cost synergies include: Reduction in programming costsSystem operating savingsCorporate overhead savings of approximately $4 million, a substantial portion of which are expected to be available within 6 months of transaction close Taxsynergies Costsynergies
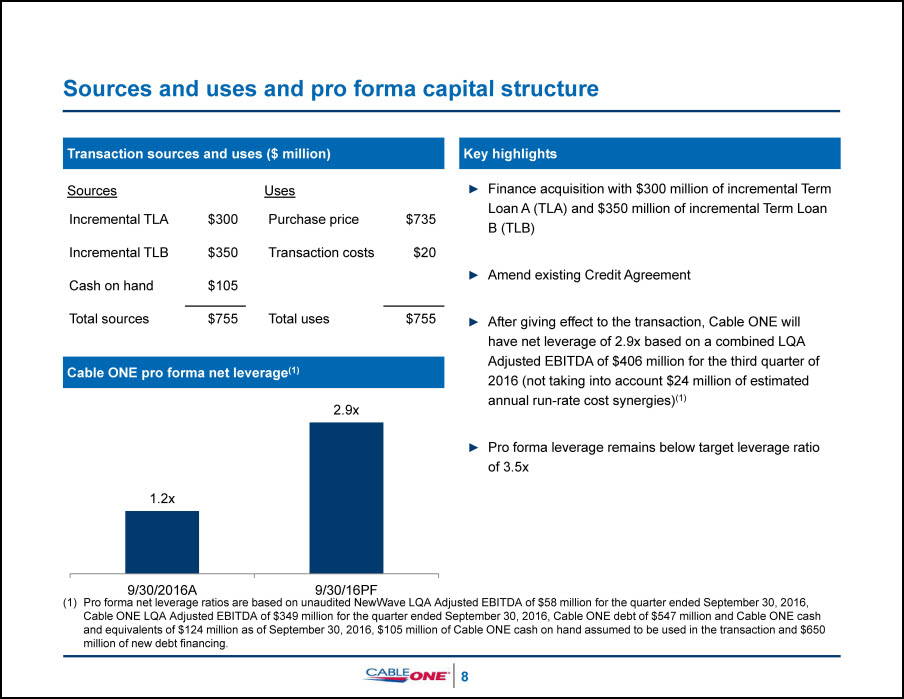
Key highlights Transaction sources and uses ($ million) Sources and uses and pro forma capital structure 8 Sources Uses Finance acquisition with $300 million of incremental Term Loan A (TLA) and $350 million of incremental Term Loan B (TLB)Amend existing Credit AgreementAfter giving effect to the transaction, Cable ONE will have net leverage of 2.9x based on a combined LQA Adjusted EBITDA of $406 million for the third quarter of 2016 (not taking into account $24 million of estimated annual run-rate cost synergies)(1)Pro forma leverage remains below target leverage ratio of 3.5x Cable ONE pro forma net leverage(1) Incremental TLA $300 Incremental TLB $350 Cash on hand $105 Total sources $755 Purchase price $735 Transaction costs $20 Total uses $755 Pro forma net leverage ratios are based on unaudited NewWave LQA Adjusted EBITDA of $58 million for the quarter ended September 30, 2016, Cable ONE LQA Adjusted EBITDA of $349 million for the quarter ended September 30, 2016, Cable ONE debt of $547 million and Cable ONE cash and equivalents of $124 million as of September 30, 2016, $105 million of Cable ONE cash on hand assumed to be used in the transaction and $650 million of new debt financing.
9 Cable ONE uses certain measures that are not defined by generally accepted accounting principles in the United States (GAAP) to evaluate various aspects of its business. Adjusted EBITDA is a non-GAAP financial measure and should be considered in addition to, not as a substitute for, net income (loss) reported in accordance with GAAP. This term, as defined by Cable ONE, may not be comparable to similarly titled measures reported by other companies. Adjusted EBITDA is reconciled to net income (loss) on page 10.“Adjusted EBITDA” is defined as net income (loss) plus net interest expense, provision for income taxes, depreciation and amortization, equity-based compensation expense, loss on deferred compensation, other income, net, acquisition-related costs, loss on disposal of fixed assets and other unusual operating expenses. As such, it eliminates the significant non-cash depreciation and amortization expense that results from the capital-intensive nature of Cable ONE’s business as well as other non-cash or special items and is unaffected by Cable ONE’s capital structure or investment activities. This measure is limited in that it does not reflect the periodic costs of certain capitalized tangible and intangible assets used in generating revenues and Cable ONE’s cash cost of financing. These costs are evaluated through other financial measures.Cable ONE uses Adjusted EBITDA to assess its performance. In addition, Adjusted EBITDA generally correlates to the leverage ratio calculation under Cable ONE’s credit facilities and outstanding 5.75% senior unsecured notes due 2022 to determine compliance with the covenants contained in the facilities and notes. For the purpose of calculating compliance with leverage covenants, Cable ONE uses a measure similar to Adjusted EBITDA, as presented. Adjusted EBITDA is also a significant performance measure used by Cable ONE in its annual incentive compensation program. Adjusted EBITDA does not take into account cash used for mandatory debt service requirements or other non-discretionary expenditures, and thus does not represent residual funds available for discretionary uses.Cable ONE believes Adjusted EBITDA is useful to investors in evaluating the operating performance of Cable ONE.Adjusted EBITDA and similar measures with similar titles are common measures used by investors, analysts and peers to compare performance in Cable ONE’s industry, although Cable ONE’s measure of Adjusted EBITDA may not be directly comparable to similarly titled measures reported by other companies.The financial results for NewWave in this presentation have been derived from the unaudited financial statements prepared by NewWave, without adjustment to conform to the accounting policies and methodologies used by Cable ONE. The accounting policies and methodologies used by NewWave differ in certain respects from those used by Cable ONE, but Cable ONE does not believe these differences are material to the combined company. Use of Non-GAAP Financial Metrics
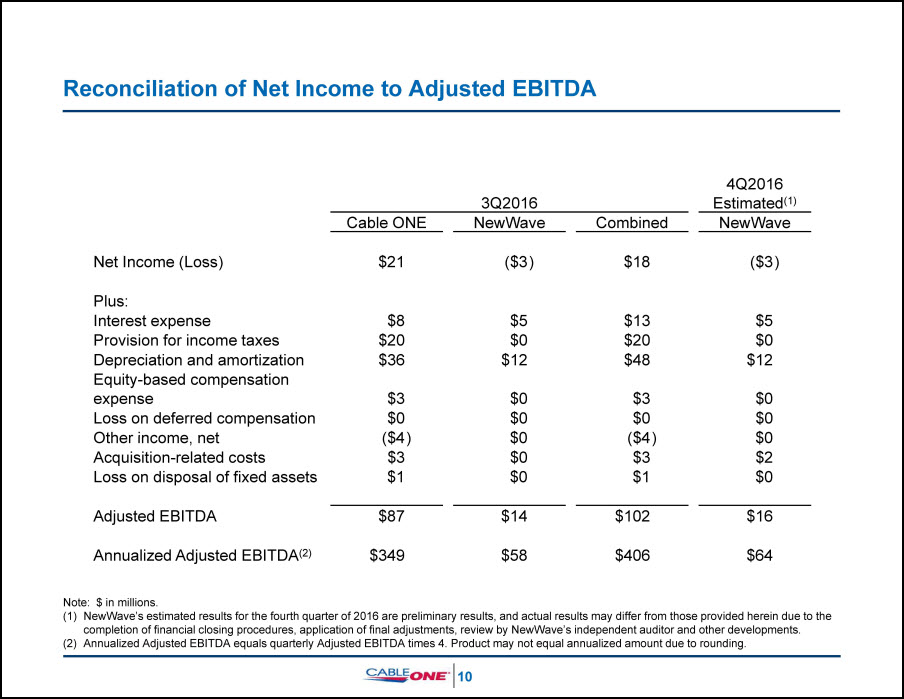
Reconciliation of Net Income to Adjusted EBITDA 10 Note: $ in millions.NewWave’s estimated results for the fourth quarter of 2016 are preliminary results, and actual results may differ from those provided herein due to the completion of financial closing procedures, application of final adjustments, review by NewWave’s independent auditor and other developments.Annualized Adjusted EBITDA equals quarterly Adjusted EBITDA times 4. Product may not equal annualized amount due to rounding. 3Q2016 4Q2016Estimated(1) Cable ONE NewWave Combined NewWave Net Income (Loss) $21 ($3 ) $18 ($3 ) Plus: Interest expense $8 $5 $13 $5 Provision for income taxes $20 $0 $20 $0 Depreciation and amortization $36 $12 $48 $12 Equity-based compensation expense $3 $0 $3 $0 Loss on deferred compensation $0 $0 $0 $0 Other income, net ($4 ) $0 ($4 ) $0 Acquisition-related costs $3 $0 $3 $2 Loss on disposal of fixed assets $1 $0 $1 $0 Adjusted EBITDA $87 $14 $102 $16 Annualized Adjusted EBITDA(2) $349 $58 $406 $64