Attached files
| file | filename |
|---|---|
| EX-99.1 - EXHIBIT 99.1 - DOVER Corp | a201701128-kexhibit991.htm |
| 8-K - 8-K - DOVER Corp | a201701128-k.htm |

Dover Investor Presentation
January 12, 2017
Bob Livingston
President & Chief Executive Officer

2
Forward looking statements
We want to remind everyone that our comments may contain forward-looking
statements that are inherently subject to uncertainties and risks. We caution
everyone to be guided in their analysis of Dover by referring to the documents
we file from time to time with the SEC, including our Form 10-K for 2015 and our
Form 10-Q for the third quarter of 2016, for a list of factors that could cause our
results to differ from those anticipated in any such forward-looking statements.
We would also direct your attention to our website, www.dovercorporation.com,
where considerably more information can be found.

3
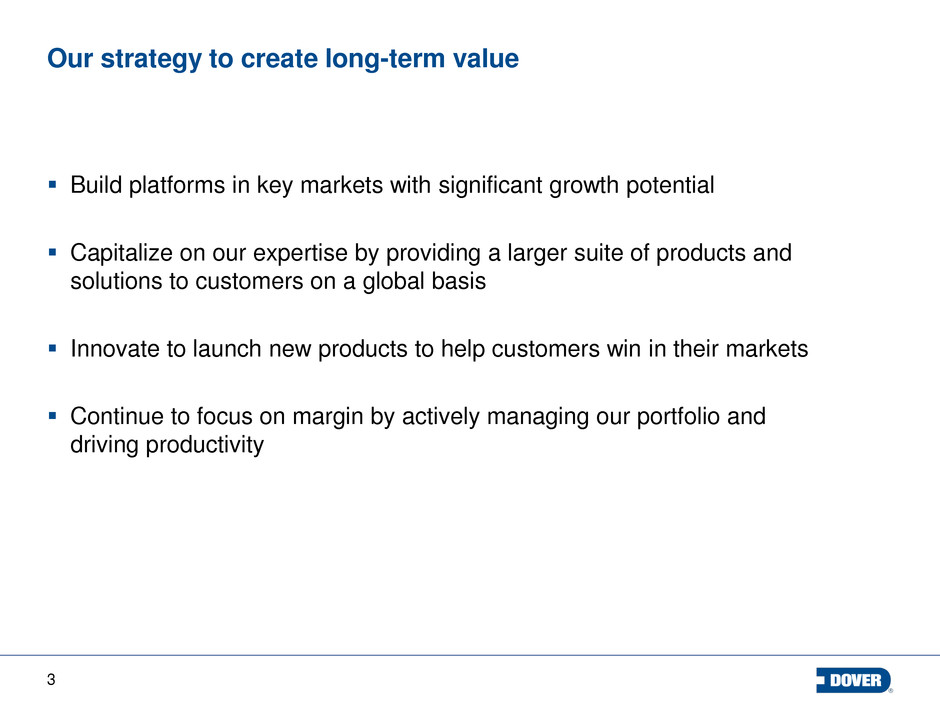
Our strategy to create long-term value
Build platforms in key markets with significant growth potential
Capitalize on our expertise by providing a larger suite of products and
solutions to customers on a global basis
Innovate to launch new products to help customers win in their markets
Continue to focus on margin by actively managing our portfolio and
driving productivity
3

4
$1.3
$2.5 $2.2
$1.6
2017F Revenue
Refrigeration & Food Equipment
• Retail refrigeration
• Food equipment
• Heat transfer solutions
Fluids
• Retail fueling
• Hygienic & Pharma
• Polymer processing
equipment
• Specialty industrial pumps
Engineered Systems
• Marking & Coding
• Digital Printing
• Refuse collection,
compaction & processing
• Auto service equipment
Energy
Refrigeration &
Food Equip.
Applying performance
management systems to
incentivize Opcos to maintain and
improve margin and ROIC
Fostering a unique culture where
Opcos embrace their
responsibility of helping our
customers win
Segments, key platforms, and unique capabilities
Energy
• Drilling & Artificial Lift
• Automation
• Bearings & Compression
$ in billions
Engineered
Systems Fluids
Using in-depth knowledge of
customers and opportunities to
identify attractive companies in our
markets
≈
≈
≈
≈

5
Select growth markets at a glance - Energy
Estimated
market size $8.0B $4.0B
2017 – 2019
est. market
CAGR
Key
competitors
Drilling &
Artificial Lift
(USS, DAL)
Bearings &
Compression
(Waukesha, Cook)
2017F DOV
revenues ~$725M ~$140M
high potential growth tied
to rig count growth and
new well completions
Key growth
drivers
• Oil price stability/growth
• NA rig count growth
• Increased well completion
activity
• Shale activity growth
• New product introduction
Automation
(DEA)
$4.0B
~$290M
low-singles
• Increasing use of natural gas
in power gen
• Growing installed base of
reciprocating and rotating
machinery
• Global energy demand and
gas production
high potential growth tied
to well completions and
productivity spend
• Oil price stability/growth
• Focus on productivity
• New products
• Customer adoption

6
Select growth markets at a glance - Engineered Systems
Text
Estimated
market size
$2.0B $3.5B
2017 – 2019
est. market
CAGR
double-
digits
Key
competitors
Digital Printing
(MS & JK)
Refuse collection,
compaction & processing
(ESG)
$3.0B
Auto service
equipment
(VSG)
2017F DOV
revenues
~$835M <$200M ~$440M ~$525M
$5.5B
Marking & Coding
(MI)
mid-singles low-to-mid
singles
Key growth
drivers
• Growing consumerism
in developing
economies
• Food safety concerns
• Logistics
• New packaging
designs and materials
• Growth in fast
fashion
• Water conservation
• Print quality and
consistency
• Flexibility
• Productivity
• Productivity
• Safety
• Reduced availability
of landfills
• Growth in recycling
• Addition of Ravaglioli
(RAV)
• Increasing average age
of vehicles
• Growing global car park
• New materials used in
auto manufacturing
low-to-mid
singles

7
Select growth markets at a glance - Fluids
Estimated
market size
$2B $7B
2017 – 2019
est. market
CAGR
Key
competitors
2017F DOV
revenues
~$1.3B ~$250M
Retail Fueling
(OPW, Wayne,Tokheim,
Fairbanks)
low-to-mid
singles, plus
EMV lift
mid-to-high
singles
Key growth
drivers
Hygenic & Pharma
(Hydro, CPC, certain
PSG brands)
• Recent acquisitions
• EMV upgrade cycle
• Environmental and safety
regulations
• Remote monitoring and SaaS
• Increasing miles driven
• Auto growth in developing
markets
• Health and safety
concerns
• Growing single use
adoption
• Expanding applications
• Aging demographics
Polymer
Equipment
(Maag)
$5B
~$275M
low-to-mid
singles
• Significant global
petrochemical investment
• Low feedstock prices
• Worldwide growth of
plastics usage

8
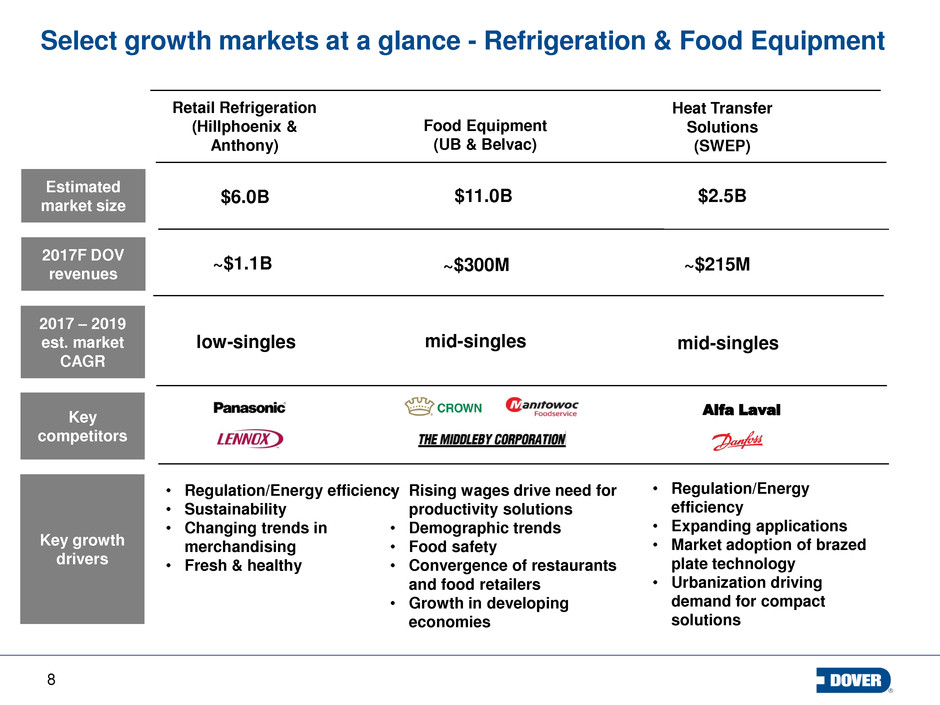
Select growth markets at a glance - Refrigeration & Food Equipment
Estimated
market size
$6.0B $2.5B $11.0B
2017 – 2019
est. market
CAGR
Key
competitors
Retail Refrigeration
(Hillphoenix &
Anthony)
2017F DOV
revenues
~$300M ~$1.1B ~$215M
Food Equipment
(UB & Belvac)
low-singles mid-singles mid-singles
Key growth
drivers
Heat Transfer
Solutions
(SWEP)
• Regulation/Energy efficiency
• Sustainability
• Changing trends in
merchandising
• Fresh & healthy
• Rising wages drive need for
productivity solutions
• Demographic trends
• Food safety
• Convergence of restaurants
and food retailers
• Growth in developing
economies
• Regulation/Energy
efficiency
• Expanding applications
• Market adoption of brazed
plate technology
• Urbanization driving
demand for compact
solutions
Alfa Laval

9
Building the Dover Fueling Solutions platform
Pre 2013
• Hanging hardware
• Valves
• Car wash systems
• Fleet fueling
systems
2013
• Containment
systems
• Access & fill covers
• European style
piping
2016
• Dispensers
• Automation &
POS systems
• Wireless tank
gauges
• Cloud-based
/remote
monitoring
/SaaS
• Dispensers
• Automation &
POS systems
Strong market characteristics, including: steady growth, strong after-
market, periodic tailwinds, favorable customer-to-supplier ratio
Developed detailed acquisition roadmap comprising products and
geographies
Initial focus on product expansion
2016 acquisitions build out the industry’s only global end-to-end
solution
2017F Retail Fueling revenue: ≈ $1.3B

10
Dover Fueling Solutions - Wayne Fueling acquisition
Dispensers, POS systems and
service for global retail fueling
markets; strong US position
Completes end-to-end global retail
fueling solution
Full participation in US EMV upgrade
cycle
Highly synergistic with Tokheim
2017F Revenue: ≈ $600M
2017 – 2020 growth rate: high singles
New 3 year synergy target: ≈ $35 million
Costs to achieve synergy: ≈ $25 million
2017F EPS: $0.18 - $0.20
Strategic fit Key metrics

11
Q4 update
Solid fourth quarter activity
Overall operating performance within previous guidance range
– Early cycle oil & gas related end-markets showing sequential improvement
– Printing & Identification platform remains strong
– Industrial businesses generally performing at/near expectations
– Continued weakness in later cycle oil & gas markets
– Refrigeration margins remain challenged as we implement manufacturing changes;
results also impacted by product mix
Portfolio actions
– $0.31 net benefit on disposition of
business
– $0.05 impact from Wayne acquisition,
excluding financing costs
Anticipated early 2017 voluntary product
recall has $0.09 impact
11
Prior 2016 EPS Guidance: $3.00 - $3.05
Plus: Net benefit on Q4 disposition: ≈$0.31
Less: Q4 Wayne related costs: ≈($0.05)
Less: Q4 Product recall charge: ≈($0.09)
Updated 2016 EPS Guidance $3.17 - $3.22

12
2017 preview
Organic growth outlook
Significant revenue and accretion from 2016 acquisitions
Meaningful carryover benefits from prior restructuring and lower 2017 restructuring
costs
Offsets from compensation & investment, interest and corporate expense, and FX
Modest core margin* improvement at the mid-point
12
2017F EPS from continuing operations:
$3.40 to $3.60
* Core margin adjusted for the impact of completed acquisitions and dispositions, deal costs and restructuring costs for 2016E and 2017F

13
Revenue drivers in 2017
Energy (up 13% to 16%*)
– Growth in North American rig count
– Capex increases drive well completion activity
Engineered Systems (up 1% to 3%*)
‒ Completed acquisitions
‒ Continued adoption of digital printing technology; Strong Printing & Coding markets
‒ Modest industrial markets
Fluids (flat to 2%*)
– Completed acquisitions
– Solid activity in petrochemical & polymers and hygienic & pharma markets
– Challenging longer cycle oil & gas applications, including tank & rail car
Refrigeration & Food Equipment (flat to 2%*)
– Growing glass door and specialty case activity
– Strong backlog in can-shaping equipment
– Standard case and system activity remains subdued
13
* Growth rates represent forecasted organic growth rate. See appendix chart for additional information

14
2017 summary
Fully leverage recovery in North American oil & gas markets
Capture significant acquisition growth in Fluids and Engineered Systems
Core margin improvement
Acquisition integration
14

15
$-
$400
$800
$1,200
$1,600
Acquisitions Capex Dividends Share
Repurchase
$ in millions
2012 2013 2014 2015 2016E
Return to investors
Capital allocation
Invest in growth; acquisitions
and capex ≈ 60% over 5 years
Consistently return cash to
shareholders; dividends and
repurchases ≈ 40% over 5 years
We expect to continue our
longstanding record of raising
the annual dividend
Continuous focus on FCF
generation; expected to be 11%
of revenue in 2017
15
Growth
Capital Deployed 2012 – 2016E

16
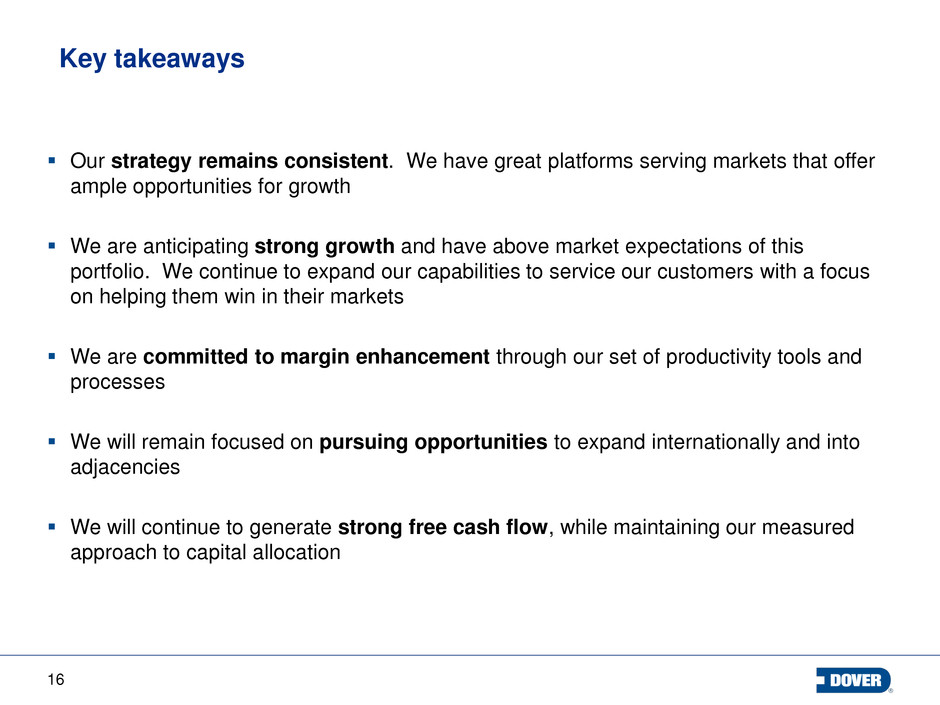
Key takeaways
Our strategy remains consistent. We have great platforms serving markets that offer
ample opportunities for growth
We are anticipating strong growth and have above market expectations of this
portfolio. We continue to expand our capabilities to service our customers with a focus
on helping them win in their markets
We are committed to margin enhancement through our set of productivity tools and
processes
We will remain focused on pursuing opportunities to expand internationally and into
adjacencies
We will continue to generate strong free cash flow, while maintaining our measured
approach to capital allocation


18
Appendix

19
FY 2016 guidance update
19
Prior 2016 EPS Guidance – Continuing Ops (GAAP) $3.00 - $3.05
– Plus: Net benefit on disposition(1): ≈$0.31
– Less: Q4 Wayne related acquisition costs(2): ≈($0.05)
– Less: Q4 Product recall costs: ≈($0.09)
Updated 2016 EPS Guidance – Continuing Ops (GAAP) $3.17 - $3.22
(2) Reflects Q4 operating performance, deal costs and purchase accounting amortization associated with Wayne, totaling ($0.05) EPS
(1) Reflects Q4 net benefit on sale of Tipper Tie
Expected Q4 2016 GAAP EPS: $0.95 - $1.00 (3)
(3) Includes Q4 operating performance, deal costs and purchase accounting amortization associated with Wayne, totaling ($0.05) EPS, $0.31 EPS
associated with net benefit on disposition of Tipper Tie, and charge of $0.09 for expected product recall

20
FY 2017 Guidance – Revenue & margin by segment
2017F
Energy
Engineered
Systems
Fluids
Refrigeration
& Food Equip
Total
Organic rev. 13% - 16% 1% - 3% 0% - 2% 0% - 2% 3% - 5%
Acquisitions - ≈ 7% ≈ 31% - ≈ 10%
Dispositions - (1%) - (5%) (1%)
Currency (1%) (2%) (2%) (1%) (2%)
Total revenue 12% - 15% 5% - 7% 29% - 31% (6% - 4%) 10% - 12%
2017F
Energy
Engineered
Systems
Fluids
Refrigeration
& Food Equip
Total
Margin - midpoint ≈11.6% ≈15.8% ≈13.3% ≈13.3% ≈13.7%
Chg. vs 2016 up
> 600 bps
down
< 75 bps(b)
up
> 150 bps
down
< 400 bps(b)
up
> 10 bps
Chg. vs 2016 -
adjusted core(a)
up
> 450 bps
down
< 70 bps
down
< 300 bps(c)
up
> 100 bps
up
≈ 10 bps
(a) Adjusted for the impact of completed acquisitions and dispositions, deal costs, restructuring costs and recall charges for 2016E and 2017F
(c) Reflects the impact of Tokheim, which is now treated as organic for purposes of organic revenue and adjusted core margin
(b) Includes the impact of the gains on the 2016 dispositions of Texas Hydraulics in DES, and the disposition of Tipper Tie in DFRE

21
FY 2017F Guidance
Revenue
– Organic revenue: 3% - 5%
– Completed acquisitions: ≈10%
– Dispositions: (1%)
– FX impact: (2%)
– Total revenue: 10% - 12%
Corporate expense: ≈ $125 million
Net interest expense: ≈ $133 million
Full-year tax rate: ≈ 28%
Capital expenditures: ≈ 2.3% of revenue
FY free cash flow: ≈ 11% of revenue

22
2017F EPS Guidance – Bridge
2016E EPS – Continuing Ops (GAAP) – Mid-point: $3.19
– Less 2016 gain on dispositions(1): (0.40)
– Less 2016 earnings from dispositions(2) : (0.05)
– Plus 2016 charges related to expected recall: 0.09
2016E Adjusted EPS $2.83
– Net restructuring(3): 0.08 - 0.10
– Performance including restructuring benefits: 0.80 – 0.94
– Compensation & investment: (0.15 - 0.13)
– Interest / Corp. / Tax rate / Shares / Other (net): (0.16 - 0.14)
2017F EPS – Continuing Ops $3.40 - $3.60
(2) Includes 2016 operating earnings from THI and Tipper Tie
(3) Includes restructuring costs of approximately $0.19 in FY 2016 and $0.09 - $0.11 in FY 2017F
(1) Includes $0.07 gain on the disposition THI in Q1 2016 and $0.33 gain on disposition of Tipper Tie in Q4 2016

23
Energy commentary
Segment revenue driven by pace of rig count and capex spending
(influenced by oil price dynamics)
‒ Directly impacts drilling, artificial lift and automation markets (two-thirds
of segment revenue)
Drilling more correlated with rig count
Artificial lift and automation more tied to oil well completion activity
Base case assumptions:
– Drilling, artificial lift and automation up: ≈ 20%*
– 2017 average US rig count: ≈ 680 - 700
– 2017 average WTI: ≈ $55
* Represents forecasted organic growth rate
