Attached files
| file | filename |
|---|---|
| EX-32.2 - EXHIBIT 32.2 - Corvus Gold Inc. | exh_322.htm |
| EX-32.1 - EXHIBIT 32.1 - Corvus Gold Inc. | exh_321.htm |
| EX-31.2 - EXHIBIT 31.2 - Corvus Gold Inc. | exh_312.htm |
| EX-31.1 - EXHIBIT 31.1 - Corvus Gold Inc. | exh_311.htm |
| EX-23.2 - EXHIBIT 23.2 - Corvus Gold Inc. | exh_232.htm |
| EX-23.1 - EXHIBIT 23.1 - Corvus Gold Inc. | exh_231.htm |
UNITED STATES
SECURITIES AND EXCHANGE COMMISSION
Washington, D.C. 20549
FORM 10-Q
| ☒ | QUARTERLY REPORT PURSUANT TO SECTION 13 OR 15(d) OF THE SECURITIES EXCHANGE ACT OF 1934 | |
| For the quarterly period ended November 30, 2016 | ||
| OR | ||
| TRANSITION REPORT PURSUANT TO SECTION 13 OR 15(d) OF THE SECURITIES EXCHANGE ACT OF 1934 | ||
For the transition period from to
| Commission file number: 000-55447 |
![]()
CORVUS GOLD INC.
(Exact Name of Registrant as Specified in its Charter)
| British Columbia, Canada | 98-0668473 |
| (State or other jurisdiction of incorporation or organization) | (I.R.S. Employer Identification No.) |
| 1750-700 West Pender Street | |
| Vancouver, British Columbia, Canada, | V6C 1G8 |
| (Address of Principal Executive Offices) | (Zip code) |
Registrant’s telephone number, including area code:
(604) 638-3246
Indicate by check mark whether the registrant (1) has filed all reports required to be filed by Section 13 or 15(d) of the Securities Exchange Act of 1934 during the preceding 12 months (or for such shorter period that the registrant was required to file such reports), and (2) has been subject to such filing requirements for the past 90 days.
Yes ☒ No ☐
Indicate by check mark whether the registrant has submitted electronically and posted on its corporate Web site, if any, every Interactive Data File required to be submitted and posted pursuant to Rule 405 of Regulation S-T (§232.405 of this chapter) during the preceding 12 months (or for such shorter period that the registrant was required to submit and post such files).
Yes ☒ No ☐
Indicate by check mark whether the registrant is a large accelerated filer, an accelerated filer, a non-accelerated filer, or a smaller reporting company. See the definitions of “large accelerated filer,” “accelerated filer” and “smaller reporting company” in Rule 12b-2 of the Exchange Act. (Check one):
| Large Accelerated Filer ☐ | Accelerated Filer ☐ | |
| Non-Accelerated filer ☐ | Small Reporting company ☒ | |
| (Do not check if a smaller reporting company) | ||
Indicate by check mark whether the registrant is a shell company (as defined in Rule 12b-2 of the Exchange Act). Yes ☐ No ☒
As of January 12, 2017, the registrant had 92,369,582 Common Shares outstanding.
Table of Contents
CORVUS GOLD INC.
CONDENSED INTERIM CONSOLIDATED BALANCE SHEETS
(Expressed in Canadian dollars)
| November 30, 2016 | May 31, 2016 | |||||||
| (Unaudited) | ||||||||
| ASSETS | ||||||||
| Current assets | ||||||||
| Cash and cash equivalents | $ | 5,026,115 | $ | 4,783,519 | ||||
| Accounts receivable | 37,703 | 28,810 | ||||||
| Prepaid expenses | 134,520 | 166,853 | ||||||
| Total current assets | 5,198,338 | 4,979,182 | ||||||
| Property and equipment (note 3) | 80,436 | 82,051 | ||||||
| Capitalized acquisition costs (note 4) | 4,466,261 | 4,261,680 | ||||||
| Total assets | $ | 9,745,035 | $ | 9,322,913 | ||||
| LIABILITIES AND SHAREHOLDERS’ EQUITY | ||||||||
| Current liabilities | ||||||||
| Accounts payable and accrued liabilities (note 6) | $ | 327,445 | $ | 236,861 | ||||
| Total current liabilities | 327,445 | 236,861 | ||||||
| Asset retirement obligations (note 4) | 300,722 | 293,578 | ||||||
| Total liabilities | 628,167 | 530,439 | ||||||
| Shareholders’ equity | ||||||||
| Share capital (note 5) | 72,670,170 | 69,890,670 | ||||||
| Contributed surplus (note 5) | 12,213,488 | 11,977,459 | ||||||
| Accumulated other comprehensive income - cumulative translation differences | 1,311,411 | 1,168,386 | ||||||
| Deficit accumulated during the exploration stage | (77,078,201 | ) | (74,244,041 | ) | ||||
| Total shareholders’ equity | 9,116,868 | 8,792,474 | ||||||
| Total liabilities and shareholders’ equity | $ | 9,745,035 | $ | 9,322,913 | ||||
Nature and continuance of operations (note 1)
Approved on behalf of the Directors:
| “Jeffrey Pontius” | Director | |
| “Anton Drescher” | Director | |
These accompanying notes form an integral part of these condensed
interim consolidated financial statements
| 3 |
CORVUS GOLD INC.
CONDENSED INTERIM CONSOLIDATED STATEMENTS OF OPERATIONS AND COMPREHENSIVE LOSS
(Unaudited)
(Expressed in Canadian dollars)
| Three months ended November 30, | Six months ended November 30, | |||||||||||||||
| 2016 | 2015 | 2016 | 2015 | |||||||||||||
| Expenses | ||||||||||||||||
| Administration | $ | 92 | $ | 1,850 | $ | 453 | $ | 4,625 | ||||||||
| Consulting fees (notes 5 and 6) | 130,396 | 150,226 | 291,662 | 342,619 | ||||||||||||
| Depreciation (note 3) | 5,685 | 6,498 | 11,007 | 12,798 | ||||||||||||
| Exploration expenditures (notes 4 and 5) | 576,163 | 1,104,399 | 1,229,669 | 1,894,458 | ||||||||||||
| Insurance | 28,834 | 31,129 | 58,316 | 62,189 | ||||||||||||
| Investor relations (notes 5 and 6) | 194,543 | 197,262 | 340,023 | 362,036 | ||||||||||||
| Office and miscellaneous | 33,228 | 30,064 | 62,113 | 68,686 | ||||||||||||
| Professional fees (notes 5 and 6) | 58,761 | 94,248 | 123,923 | 164,730 | ||||||||||||
| Regulatory | 9,026 | 13,004 | 31,855 | 39,985 | ||||||||||||
| Rent | 23,465 | 28,132 | 52,348 | 54,432 | ||||||||||||
| Travel | 65,489 | 50,795 | 84,318 | 68,470 | ||||||||||||
| Wages and benefits (notes 5 and 6) | 222,922 | 269,705 | 563,008 | 848,715 | ||||||||||||
| Total operating expenses | (1,348,604 | ) | (1,977,312 | ) | (2,848,695 | ) | (3,923,743 | ) | ||||||||
| Other income (expense) | ||||||||||||||||
| Interest income | 9,566 | 4,103 | 18,330 | 9,668 | ||||||||||||
| Gain on sale of capitalized acquisition costs (note 4(b)) | - | - | - | 25,728 | ||||||||||||
| Write-off of capitalized acquisition costs (note 4(a)) | - | (677,695 | ) | - | (677,695 | ) | ||||||||||
| Foreign exchange gain (loss) | 10,815 | 27,804 | (3,795 | ) | 121,650 | |||||||||||
| Total other income (loss) | 20,381 | (645,788 | ) | 14,535 | (520,649 | ) | ||||||||||
| Net loss for the period | (1,328,223 | ) | (2,623,100 | ) | (2,834,160 | ) | (4,444,392 | ) | ||||||||
| Other comprehensive income | ||||||||||||||||
| Exchange difference on translating foreign operations | 123,143 | 81,138 | 143,025 | 403,228 | ||||||||||||
| Comprehensive loss for the period | $ | (1,205,080 | ) | $ | (2,541,962 | ) | $ | (2,691,135 | ) | $ | (4,041,164 | ) | ||||
| Basic and diluted loss per share | $ | (0.01 | ) | $ | (0.03 | ) | $ | (0.03 | ) | $ | (0.05 | ) | ||||
| Weighted average number of shares outstanding | 92,348,153 | 84,381,058 | 91,723,407 | 82,263,484 | ||||||||||||
These accompanying notes form an integral part of these condensed interim consolidated financial statements
| 4 |
CORVUS GOLD INC.
CONDENSED INTERIM CONSOLIDATED STATEMENTS OF CASH FLOWS
(Unaudited)
(Expressed in Canadian dollars)
SIX MONTHS ENDED NOVEMBER 30,
| 2016 | 2015 | |||||||
| Operating activities | ||||||||
| Net loss for the period | $ | (2,834,160 | ) | $ | (4,444,392 | ) | ||
| Add items not affecting cash: | ||||||||
| Depreciation | 11,007 | 12,798 | ||||||
| Stock-based compensation (note 5) | 314,083 | 456,469 | ||||||
| Write-off of capitalized acquisition costs (note 4(a)) | - | 677,695 | ||||||
| Gain on sale of capitalized acquisition costs (note 4(b)) | - | (25,728 | ) | |||||
| Loss (gain) on foreign exchange | 3,795 | (121,650 | ) | |||||
| Changes in non-cash items: | ||||||||
| Accounts receivable | (8,893 | ) | 11,090 | |||||
| Prepaid expenses | 32,333 | 52,548 | ||||||
| Accounts payable and accrued liabilities | 90,584 | (121,048 | ) | |||||
| Cash used in operating activities | (2,391,251 | ) | (3,502,218 | ) | ||||
| Financing activities | ||||||||
| Cash received from issuance of shares | 2,701,000 | 2,000,000 | ||||||
| Share issuance costs | (17,554 | ) | (13,401 | ) | ||||
| Cash provided by financing activities | 2,683,446 | 1,986,599 | ||||||
| Investing activities | ||||||||
| Expenditures on property and equipment | (7,739 | ) | - | |||||
| Cash received from sale of capitalized acquisition costs (note 4(b)) | - | 25,728 | ||||||
| Capitalized acquisition costs | (66,876 | ) | (32,594 | ) | ||||
| Cash used in investing activities | (74,615 | ) | (6,866 | ) | ||||
| Effect of foreign exchange on cash | 25,016 | 199,278 | ||||||
| Increase (decrease) in cash and cash equivalents | 242,596 | (1,323,207 | ) | |||||
| Cash and cash equivalents, beginning of the period | 4,783,519 | 5,159,962 | ||||||
| Cash and cash equivalents, end of the period | $ | 5,026,115 | $ | 3,836,755 | ||||
Supplemental cash flow information (note 9)
These accompanying notes form an integral part of these condensed interim consolidated financial statements
| 5 |
CORVUS GOLD INC.
CONDENSED INTERIM CONSOLIDATED STATEMENT OF CHANGES IN EQUITY
(Unaudited)
(Expressed in Canadian dollars)
| Number of shares | Amount | Contributed Surplus | Accumulated Other Comprehensive Income(Loss) – Cumulative Translation Differences | Deficit | Total | |||||||||||||||||||
| Balance, May 31, 2016 | 89,594,582 | $ | 69,890,670 | $ | 11,977,459 | $ | 1,168,386 | $ | (74,244,041 | ) | $ | 8,792,474 | ||||||||||||
| Net loss for the period | - | - | - | - | (2,834,160 | ) | (2,834,160 | ) | ||||||||||||||||
| Shares issued for cash | ||||||||||||||||||||||||
| Private placement | 2,550,000 | 2,601,000 | - | - | - | 2,601,000 | ||||||||||||||||||
| Exercise of stock options | 200,000 | 100,000 | - | - | - | 100,000 | ||||||||||||||||||
| Shares issued for capitalized acquisition costs | 25,000 | 18,000 | - | - | - | 18,000 | ||||||||||||||||||
| Other comprehensive income | ||||||||||||||||||||||||
| Exchange difference on translating foreign operations | - | - | - | 143,025 | - | 143,025 | ||||||||||||||||||
| Share issuance costs | - | (17,554 | ) | - | - | - | (17,554 | ) | ||||||||||||||||
| Reclassification of contributed surplus on exercise of stock options | - | 78,054 | (78,054 | ) | - | - | - | |||||||||||||||||
| Stock-based compensation | - | - | 314,083 | - | - | 314,083 | ||||||||||||||||||
| Balance, November 30, 2016 | 92,369,582 | $ | 72,670,170 | $ | 12,213,488 | $ | 1,311,411 | $ | (77,078,201 | ) | $ | 9,116,868 | ||||||||||||
These accompanying notes form an integral part of these condensed interim consolidated financial statements
| 6 |
| 1. | NATURE AND CONTINUANCE OF OPERATIONS |
On August 25, 2010, International Tower Hill Mines Ltd. (“ITH”) completed a Plan of Arrangement (the “Arrangement”) whereby its existing Alaska mineral properties (other than the Livengood project) and related assets and the North Bullfrog mineral property and related assets in Nevada (collectively, the “Nevada and Other Alaska Business”) were indirectly spun out into a new public company, being Corvus Gold Inc. (“Corvus” or the “Company”). As part of the Arrangement, ITH transferred its wholly-owned subsidiary Corvus Gold Nevada Inc. (“Corvus Nevada”) (which held the North Bullfrog property), to Corvus and a wholly-owned Alaskan subsidiary of ITH, Talon Gold Alaska, Inc. sold to Raven Gold Alaska Inc. (“Raven Gold”), a wholly-owned Alaskan subsidiary of Corvus, the Terra, Chisna, LMS and West Pogo properties. As a consequence of the completion of the Arrangement, the Terra, Chisna, LMS, West Pogo and North Bullfrog properties were transferred to Corvus.
The Company was incorporated on April 13, 2010 under the Business Corporations Act (British Columbia). These consolidated financial statements reflect the cumulative operating results of the predecessor, as related to the mineral properties that were transferred to the Company from June 1, 2006.
The Company is engaged in the business of acquiring, exploring and evaluating mineral properties, and either joint venturing or developing these properties further or disposing of them when the evaluation is completed. At November 30, 2016, the Company had interests in a property in Nevada, U.S.A.
The business of mining and exploration involves a high degree of risk and there can be no assurance that current exploration programs will result in profitable mining operations. The Company has no source of revenue, and has significant cash requirements to meet its administrative overhead and maintain its mineral property interests. The recoverability of amounts shown for mineral properties is dependent on several factors. These include the discovery of economically recoverable reserves, the ability of the Company to obtain the necessary financing to complete the development of these properties, and future profitable production or proceeds from disposition of mineral properties. The carrying value of the Company’s mineral properties does not reflect current or future values.
These condensed interim consolidated financial statements have been prepared on a going concern basis, which presume the realization of assets and discharge of liabilities in the normal course of business for the foreseeable future.
In assessing whether the going concern assumption is appropriate, management takes into account all available information about the future within one year from the date the condensed interim consolidated financial statements are issued.
The Company has sustained losses from operations, has negative cash flows, and has an ongoing requirement for capital investment to explore its mineral properties. As at November 30, 2016, the Company had working capital of $4,870,893 compared to working capital of $4,742,321 as at May 31, 2016. On July 15, 2016, the Company closed a non-brokered private placement equity financing and issued 2,550,000 common shares at a price of $1.02 per common share for gross proceeds of $2,601,000. Based on its current plans, budgeted expenditures, and cash requirements, the Company has sufficient cash to finance its current plans for the 12 months from the date the condensed interim consolidated financial statement are issued.
The Company expects that it will need to raise substantial additional capital to accomplish its business plan over the next several years. There is no assurance that additional capital or other types of financing will be available if needed or that these financings will be on terms at least as favourable to the Company as those previously obtained, or at all. Should such financing not be available in that time-frame, the Company will be required to reduce its activities and will not be able to carry out all of its presently planned exploration and development activities on its currently anticipated scheduling.
These condensed interim consolidated financial statements do not include any adjustments to the amounts and classification of assets and liabilities that might be necessary should the Company be unable to continue in business.
| 2. | SIGNIFICANT ACCOUNTING POLICIES |
Basis of presentation
These unaudited condensed consolidated interim financial statements have been prepared in accordance with accounting principles generally accepted in the United States (“U.S. GAAP”) for interim financial information and with the instructions to Form 10-Q and Article 10 of Regulation S-X under the Securities Exchange Act of 1934, as amended. Accordingly, they do not include all of the information and footnotes required by U.S. GAAP for annual financial statements. These unaudited condensed interim consolidated financial statements should be read in conjunction with the audited consolidated financial statements for the year ended May 31, 2016 as filed in our Annual Report on Form 10-K. In the opinion of the Company’s management these financial statements reflect all adjustments, consisting of normal recurring adjustments, necessary to present fairly the Company’s financial position at November 30, 2016 and the results of its operations for the six months then ended. Operating results for the six months ended November 30, 2016 are not necessarily indicative of the results that may be expected for the year ending May 31, 2017. The 2016 year-end balance sheet data was derived from audited financial statements but does not include all disclosures required by U.S. GAAP.
| 7 |
The preparation of financial statements in conformity with US GAAP requires management to make judgments, estimates and assumptions that affect the reported amounts of assets and liabilities and disclosure of contingent assets and liabilities at the date of the financial statements, and the reported amounts of revenues and expenses during the period. These judgments, estimates and assumptions are continuously evaluated and are based on management’s experience and knowledge of the relevant facts and circumstances. While management believes the estimates to be reasonable, actual results could differ from those estimates and could impact future results of operations and cash flows.
Basis of consolidation
These unaudited condensed interim consolidated financial statements include the accounts of the Company and its wholly-owned subsidiaries (collectively, the “Group”), Corvus Gold (USA) Inc. (“Corvus USA”) (a Nevada corporation), Corvus Nevada (a Nevada corporation), Raven Gold (an Alaska corporation) and SoN Land and Water LLC (“SoN”) (a Nevada limited liability company). All intercompany transactions and balances were eliminated upon consolidation.
Earnings (loss) per share
Basic loss per share is calculated using the weighted average number of common shares outstanding during the period. The Company uses the treasury stock method to compute the dilutive effect of options, warrants and similar instruments. Under this method, the dilutive effect on earnings (loss) per share is calculated presuming the exercise of outstanding options, warrants and similar instruments. It assumes that the proceeds of such exercise would be used to repurchase common shares at the average market price during the period. However, the calculation of diluted loss per share excludes the effects of various conversions and exercise of options and warrants that would be anti-dilutive. For the period ended November 30, 2016, 8,896,900 outstanding stock options (2015 – 8,226,334) were not included in the calculation of diluted earnings (loss) per share as their inclusion was anti-dilutive.
| 3. | PROPERTY AND EQUIPMENT |
| Computer Equipment | Vehicles | Tent | Total | |||||||||||||
| Cost | ||||||||||||||||
| Balance, May 31, 2016 | $ | 68,885 | $ | 89,434 | $ | 65,550 | $ | 223,869 | ||||||||
| Additions | 7,739 | - | - | 7,739 | ||||||||||||
| Currency translation adjustments | 1,398 | 2,176 | 1,595 | 5,169 | ||||||||||||
| Balance, November 30, 2016 | $ | 78,022 | $ | 91,610 | $ | 67,145 | $ | 236,777 | ||||||||
| Depreciation | ||||||||||||||||
| Balance, May 31, 2016 | $ | 43,495 | $ | 70,529 | $ | 27,794 | $ | 141,818 | ||||||||
| Depreciation for the period | 4,392 | 2,837 | 3,778 | 11,007 | ||||||||||||
| Currency translation adjustments | 968 | 1,783 | 765 | 3,516 | ||||||||||||
| Balance, November 30, 2016 | $ | 48,855 | $ | 75,149 | $ | 32,337 | $ | 156,341 | ||||||||
| Carrying amounts | ||||||||||||||||
| Balance, May 31, 2016 | $ | 25,390 | $ | 18,905 | $ | 37,756 | $ | 82,051 | ||||||||
| Balance, November 30, 2016 | $ | 29,167 | $ | 16,461 | $ | 34,808 | $ | 80,436 | ||||||||
| 8 |
| 4. | MINERAL PROPERTIES |
The Company had the following activity related to capitalized acquisition costs:
| North Bullfrog | Total | |||||||
| (note 4(d)) | ||||||||
| Balance, May 31, 2016 | $ | 4,261,680 | $ | 4,261,680 | ||||
| Acquisition costs | 84,876 | 84,876 | ||||||
| Currency translation adjustments | 119,705 | 119,705 | ||||||
| Balance, November 30, 2016 | $ | 4,466,261 | $ | 4,466,261 | ||||
The following table presents costs incurred for exploration and evaluation activities for the six months ended November 30, 2016:
| North Bullfrog | Total | |||||||
| (note 4(d)) | ||||||||
| Exploration costs: | ||||||||
| Assay | $ | 186,196 | $ | 186,196 | ||||
| Drilling | 443,525 | 443,525 | ||||||
| Equipment rental | 20,506 | 20,506 | ||||||
| Field costs | 82,119 | 82,119 | ||||||
| Geological/ Geophysical | 131,501 | 131,501 | ||||||
| Land maintenance & tenure | 233,874 | 233,874 | ||||||
| Permits | 3,427 | 3,427 | ||||||
| Studies | 95,570 | 95,570 | ||||||
| Travel | 32,951 | 32,951 | ||||||
| Total expenditures for the period | $ | 1,229,669 | $ | 1,229,669 | ||||
The following table presents costs incurred for exploration and evaluation activities for the six months ended November 30, 2015:
| West Pogo | Chisna | North Bullfrog | LMS | Total | ||||||||||||||||
| (note 4(b)) | (note 4(a)) | (note 4(d)) | (note 4(c)) | |||||||||||||||||
| Exploration costs: | ||||||||||||||||||||
| Assay | $ | - | $ | - | $ | 515,224 | $ | - | $ | 515,224 | ||||||||||
| Drilling | - | - | 574,485 | - | 574,485 | |||||||||||||||
| Equipment rental | - | - | 26,336 | - | 26,336 | |||||||||||||||
| Field costs | 181 | 247 | 66,444 | 407 | 67,279 | |||||||||||||||
| Geological/ Geophysical | - | 6,210 | 226,762 | 714 | 233,686 | |||||||||||||||
| Land maintenance & tenure | - | 13,534 | 239,552 | 32,900 | 285,986 | |||||||||||||||
| Permits | - | - | 632 | - | 632 | |||||||||||||||
| Studies | - | - | 284,991 | - | 284,991 | |||||||||||||||
| Transportation | - | - | - | 1,714 | 1,714 | |||||||||||||||
| Travel | - | 913 | 39,270 | - | 40,183 | |||||||||||||||
| 181 | 20,904 | 1,973,696 | 35,735 | 2,030,516 | ||||||||||||||||
| Cost recovery | (23,802 | ) | (7,418 | ) | - | (104,838 | ) | (136,058 | ) | |||||||||||
| Total expenditures (recovery) for the period | $ | (23,621 | ) | $ | 13,486 | $ | 1,973,696 | $ | (69,103 | ) | $ | 1,894,458 | ||||||||
| a) | Chisna Property, Alaska |
The Chisna property is located in the eastern Alaska Range, Alaska, and is comprised of unpatented mineral claims owned 100% by the Company and fee simple lands leased from Ahtna Incorporated (“Ahtna”).
On November 2, 2009, ITH and Talon Gold Alaska, Inc. (ITH’s wholly-owned Alaskan subsidiary) entered into an agreement (as amended) with Ocean Park Ventures Corp. (“OPV”). Pursuant to the agreement, an Alaskan subsidiary of OPV and Raven Gold formed a joint venture for the purpose of exploring and developing the Chisna property.
| 9 |
On November 7, 2012, OPV withdrew from the joint venture and thereby returned 100% of the Chisna Project to the Company.
On March 24, 2010, Raven Gold entered into a Mineral Exploration Agreement with Option to Lease with Ahtna, an Alaska Native Regional Corporation, concerning approximately 26,516 hectares of fee simple lands in the Athell Area of Alaska surrounding or adjacent to some of the blocks of mineral claims owned by Raven Gold.
During the year ended May 31, 2015, the Company gave notification and terminated the Ahtna lease.
During the year ended May 31, 2016, the Company wrote off the Chisna property as the Company, at the time, had reduced the Chisna property to 36 core claims. On April 5, 2016, Raven Gold completed a transaction with Millrock Resources Inc. (“Millrock”) on the Chisna property. The ownership of the property was sold for USD 25,000 and a retained net smelter return (“NSR”) royalty of 1% on precious metals and 1% on base metals.
| b) | West Pogo Property, Alaska |
The West Pogo property is located approximately 50 kilometres north of Delta Junction, Alaska, and consists of unpatented mineral claims owned 100% by the Company.
During the year ended May 31, 2014, the Company wrote off the West Pogo property, as there had been a delay in exploration work on the property for an extended period of time.
During the year ended May 31, 2016, Raven Gold completed a transaction with Millrock Resources Inc. (“Millrock”) on the West Pogo and Goodpaster database projects in Alaska. The ownership position was sold for $25,728 (USD 20,000) and the Goodpaster database project was sold for $136,058 (USD 100,000) and reflected as cost recovery for the West Pogo and LMS project. For the West Pogo project, the Company retained net smelter return (“NSR”) royalties of 3% on precious metals and 1% on base metals with 1% of the precious metal royalty buy down for USD 2 million and a further 1% for an additional USD 5 million. For the Goodpaster database, the Company retained NSR royalty of 1% on all new claims acquired within the defined Area of Interest which totals some 1,500 square kilometres covering the largest gold producing District in Alaska. One half of the royalty can be purchased for USD 2 million.
| c) | LMS Property, Alaska |
The LMS property consists of unpatented mineral claims owned 100% by the Company. During the year ended May 31, 2016, the Company sold the LMS property for a consideration of $473,585 (USD 350,000) and was granted a retained NSR royalty of 3% on precious metals and 1% on base metals with a 1% on buy down of the precious metal royalty for USD$4,000,000.
| d) | North Bullfrog Project, Nevada |
The Company’s North Bullfrog project consists of certain leased patented lode mining claims and federal unpatented mining claims owned 100% by the Company.
| (i) | Interests acquired from Redstar Gold Corp. |
On October 9, 2009, a US subsidiary of ITH at the time (Corvus Nevada) completed the acquisition of all of the interests of Redstar Gold Corp. (“Redstar”) and Redstar Gold U.S.A. Inc. (“Redstar US”) in the North Bullfrog project, which consisted of the following leases:
| (1) | Pursuant to a mining lease and option to purchase agreement made effective October 27, 2008 between Redstar and an arm’s length limited liability company, Redstar has leased (and has the option to purchase) 12 patented mining claims referred to as the “Connection” property. The ten-year, renewable mining lease requires advance minimum royalty payments (recoupable from production royalties, but not applicable to the purchase price if the option to purchase is exercised) of USD 10,800 (paid) on signing and annual payments for the first three anniversaries of USD 10,800 (paid) and USD 16,200 for every year thereafter (paid to October 27, 2016). Redstar has an option to purchase the property (subject to the NSR royalty below) for USD 1,000,000 at any time during the life of the lease. Production is subject to a 4% NSR royalty, which may be purchased by the lessee for USD 1,250,000 per 1% (USD 5,000,000 for the entire royalty). |
| 10 |
| (2) | Pursuant to a mining lease made and entered into as of May 8, 2006 between Redstar and two arm’s length individuals, Redstar has leased 3 patented mining claims which form part of the North Bullfrog project holdings. The lease is for an initial term of 10 years, and for so long thereafter as mining activities continue on the claims or contiguous claims held by the lessee. The lessee is required to pay advance minimum royalty payments (recoupable from production royalties) of USD 4,000 on execution, USD 3,500 on each of May 8, 2007, 2008 and 2009 (paid), USD 4,500 on May 8, 2010 and each anniversary thereafter, adjusted for inflation (paid to May 8, 2016). The lessor is entitled to receive a 2% NSR royalty on all production, which may be purchased by the lessee for USD 1,000,000 per 1% (USD 2,000,000 for the entire royalty). |
| (3) | Pursuant to a mining lease made and entered into as of May 8, 2006 between Redstar and an arm’s length private Nevada corporation, Redstar has leased 2 patented mining claims which form part of the North Bullfrog project holdings. The lease is for an initial term of 10 years, and for so long thereafter as mining activities continue on the claims or contiguous claims held by the lessee. The lessee is required to pay advance minimum royalty payments (recoupable from production royalties) of USD 2,000 on execution, USD 2,000 on each of May 8, 2007, 2008 and 2009 (paid), USD 3,000 on May 8, 2010 and each anniversary thereafter, adjusted for inflation (paid to May 8, 2016). The lessor is entitled to receive a 3% NSR royalty on all production, which may be purchased by the lessee for USD 850,000 per 1% (USD 2,550,000 for the entire royalty). On May 29, 2014, the parties signed a First Amendment Agreement whereby the Lease is amended to provide that in addition to the Advance Minimum Royalty payments payable in respect of the Original Claims, the lessee will now pay to the lessor Advance Minimum Royalty payments in respect of the Yellow Rose Claims of USD 2,400 on execution, USD 2,400 on each of May 29, 2015, 2016 and 2017 (paid to May 29, 2016), USD 3,600 on May 29, 2018 and each anniversary thereafter. The Lessor is entitled to receive a 3% NSR royalty on all production from the Yellow Rose claims, which may be purchased by the lessee for USD 770,000 per 1% (USD 2,310,000 for the entire royalty). |
| (4) | Pursuant to a mining lease made and entered into as of May 16, 2006 between Redstar and an arm’s length individual, Redstar has leased 12 patented mineral claims which form part of the North Bullfrog project holdings. The lease is for an initial term of 10 years, and for so long thereafter as mining activities continue on the claims or contiguous claims held by the lessee. The lessee is required to pay advance minimum royalty payments (recoupable from production royalties) of USD 20,500 on execution and USD 20,000 on each anniversary thereafter (paid to May 16, 2016). The lessor is entitled to receive a 4% NSR royalty on all production, which may be purchased by the lessee for USD 1,000,000 per 1% (USD 4,000,000 for the entire royalty). |
| (5) | Pursuant to a mining lease made and entered into as of May 22, 2006 between Redstar and two arm’s length individuals, Redstar has leased 3 patented mineral claims which form part of the North Bullfrog project holdings. The lease is for an initial term of 10 years, and for so long thereafter as mining activities continue on the claims or contiguous claims held by the lessee. The lessee is required to pay advance minimum royalty payments (recoupable from production royalties) of USD 8,000 on execution, USD 4,800 on each of May 22, 2007, 2008 and 2009 (paid), USD 7,200 on May 22, 2010 and each anniversary thereafter, adjusted for inflation (paid to May 22, 2016). The lessor is entitled to receive a 2% NSR royalty on all production, which may be purchased by the lessee for USD 1,000,000 per 1% (USD 2,000,000 for the entire royalty). |
| (6) | Pursuant to a mining lease made and entered into as of June 16, 2006 between Redstar and an arm’s length individual, Redstar has leased one patented mineral claims which form part of the North Bullfrog project holdings. The lease is for an initial term of 10 years, and for so long thereafter as mining activities continue on the claims or contiguous claims held by the lessee. The lessee is required to pay advance minimum royalty payments (recoupable from production royalties) of USD 2,000 on execution, USD 2,000 on each of June 16, 2007, 2008 and 2009 (paid), USD 3,000 on June 16, 2010 and each anniversary thereafter, adjusted for inflation (paid to June 16, 2016). The lessor is entitled to receive a 2% NSR royalty on all production, which may be purchased by the lessee for USD 1,000,000 per 1% (USD 2,000,000 for the entire royalty). |
As a consequence of the acquisition of Redstar and Redstar US’s interest in the foregoing leases, Corvus Nevada is now the lessee under all of such leases.
| 11 |
| (ii) | Interests acquired directly by Corvus Nevada |
| (1) | Pursuant to a mining lease and option to purchase agreement made effective December 1, 2007 between Corvus Nevada and a group of arm’s length limited partnerships, Corvus Nevada has leased (and has the option to purchase) patented mining claims referred to as the “Mayflower” claims which form part of the North Bullfrog project. The terms of the lease/option are as follows: |
| ☐ | Terms: Initial term of five years, commencing December 1, 2007, with the option to extend the lease for an additional five years. The lease will continue for as long thereafter as the property is in commercial production or, alternatively, for an additional three years if Corvus Nevada makes advance minimum royalty payments of USD 100,000 per year (which are recoupable against actual production royalties). |
| ☐ | Lease Payments: USD 5,000 (paid) and 25,000 common shares of ITH (delivered) following regulatory acceptance of the transaction; and an additional USD 5,000 and 20,000 common shares on each of the first through fourth lease anniversaries (paid and issued). Pursuant to an agreement with the lessors, in lieu of the 20,000 ITH shares due December 1, 2010, Corvus Nevada paid USD 108,750 on November 10, 2010 and delivered 46,250 common shares of the Company on December 2, 2010. If Corvus Nevada elects to extend the lease for a second five-year term, it will pay USD 10,000 and deliver 50,000 common shares of ITH upon election being made, and an additional 50,000 common shares of ITH on each of the fifth through ninth anniversaries (USD 10,000 paid on October 31, 2012 and 50,000 common shares of ITH delivered on October 25, 2012 paid with cash of $126,924; and USD 10,000 paid on November 13, 2013 and 50,000 common shares of ITH delivered on November 25, 2013 paid with cash of $35,871; and USD 10,000 paid on November 17, 2014 and 50,000 common shares of ITH delivered on November 7, 2014 paid with cash of $21,200; and USD 10,000 paid on November 23, 2015 and 50,000 common shares of ITH delivered on November 5, 2015 paid with cash of $19,237; and USD 10,000 paid on November 17, 2016 and 50,000 common shares of ITH, purchased for $53,447 in the market by the Company, were delivered on November 10, 2016). |
| ☐ | Anti-Dilution: Pursuant to an amended agreement agreed to by the lessors in March 2015, the Company shall deliver a total of 85,000 common shares (issued) of the Company for the years 2011 to 2014 (2011: 10,000 common shares; 2012 to 2014: 25,000 common shares each year). All future payments will be satisfied by the delivery of an additional ½ common shares of the Company for each of the ITH shares due per the original agreement (issued 25,000 shares of the Company on November 18, 2015 and 25,000 shares of the Company on November 18, 2016). |
| ☐ | Work Commitments: USD 100,000 per year for the first three years (incurred), USD 200,000 per year for the years 4 – 6 (incurred) and USD 300,000 for the years 7 – 10 (incurred to year 9). Excess expenditures in any year may be carried forward. If Corvus Nevada does not incur the required expenditures in year one, the deficiency is required to be paid to the lessors. |
| ☐ | Retained Royalty: Corvus Nevada will pay the lessors a NSR royalty of 2% if the average gold price is USD 400 per ounce or less, 3% if the average gold price is between USD 401 and USD 500 per ounce and 4% if the average gold price is greater than USD 500 per ounce. |
| (2) | Pursuant to a mining lease and option to purchase made effective March 1, 2011 between Corvus Nevada and an arm’s length individual, Corvus Nevada has leased, and has the option to purchase, 2 patented mineral claims which form part of the North Bullfrog project holdings. The lease is for an initial term of 10 years, subject to extension for an additional 10 years (provided advance minimum royalties are timely paid), and for so long thereafter as mining activities continue on the claims. The lessee is required to pay advance minimum royalty payments (recoupable from production royalties, but not applicable to the purchase price if the option to purchase is exercised) of USD 20,000 on execution (paid), USD 25,000 on each of March 1, 2012 (paid), 2013 (paid) and 2014 (paid), USD 30,000 on March 1, 2015 and each anniversary thereafter (paid to March 1, 2016), adjusted for inflation. The lessor is entitled to receive a 2% NSR royalty on all production. The lessee may purchase the royalty for USD 1,000,000 per 1%. If the lessee purchases the entire royalty (USD 2,000,000) the lessee will also acquire all interest of the lessor in the subject property. |
| 12 |
| (3) | Pursuant to a purchase agreement made effective March 28, 2013, Corvus Nevada agreed to purchase the surface rights of five patented mining claims owned by two arm’s length individuals for USD 160,000 paid on closing (March 28, 2013). The terms include payment by Corvus Nevada of a fee of USD 0.02 per ton of overburden to be stored on the property, subject to payment for a minimum of 12 million short tons. The minimum tonnage fee (USD 240,000) bears interest at 4.77% per annum from closing and is evidenced by a promissory note due on the sooner of the commencing of use of the property for waste materials storage or December 31, 2015 (balance paid December 17, 2015). As a result, the Company recorded $406,240 (USD 400,000) in acquisition costs with $157,408 paid in cash and the remaining $248,832 (USD 240,000) in promissory note payable during the year ended May 31, 2013. |
| (4) | In December 2013, SoN completed the purchase of a parcel of land approximately 30 km north of the North Bullfrog project which carries with it 1,600 acre feet of irrigation water rights. The cost of the land and associated water rights was cash payment of $1,100,118 (USD 1,034,626). |
| (5) | On March 30, 2015, Lunar Landing, LLC signed a lease agreement with Corvus Nevada to lease private property containing the three patented Sunflower claims to Corvus Nevada, which are adjacent to the Yellow Rose claims leased in 2014. The term of the lease is 3 years with provision to extend the lease for an additional 7 years, and an advance minimum royalty payment of USD 5,000 per year with USD 5,000 paid upon signing (paid to March 2016). The lease includes a 4% NSR royalty on production, with an option to purchase the royalty for USD 500,000 per 1% or USD 2,000,000 for the entire 4% royalty. The lease also includes the option to purchase the property for USD 300,000. |
Acquisitions
The acquisition of title to mineral properties is a detailed and time-consuming process. The Company has taken steps, in accordance with industry norms, to verify title to mineral properties in which it has an interest. Although the Company has taken every reasonable precaution to ensure that legal title to its properties is properly recorded in the name of the Company (or, in the case of an option, in the name of the relevant optionor), there can be no assurance that such title will ultimately be secured.
Environmental Expenditures
The operations of the Company may in the future be affected from time to time in varying degrees by changes in environmental regulations, including those for future removal and site restoration costs. Both the likelihood of new regulations and their overall effect upon the Company vary greatly and are not predictable. The Company’s policy is to meet or, if possible, surpass standards set by relevant legislation by application of technically proven and economically feasible measures.
Environmental expenditures that relate to ongoing environmental and reclamation programs are charged against earnings as incurred or capitalized and amortized depending on their future economic benefits. Estimated future removal and site restoration costs, when the ultimate liability is reasonably determinable, are charged against earnings over the estimated remaining life of the related business operation, net of expected recoveries.
The Company has estimated the fair value of the liability for asset retirement that arose as a result of exploration activities to be $300,722 (USD 224,000) (May 31, 2016 - $293,578 (USD 224,000)). The fair value of the liability was determined to be equal to the estimated remediation costs. Due to the early stages of the project, and that extractive activities have not yet begun, the Company is unable to predict with any precision the timing of the cash flow related to the reclamation activities.
| 5. | SHARE CAPITAL |
Authorized
Unlimited common shares without par value.
| 13 |
Share issuances
During the period ended November 30, 2016:
| a) | On November 18, 2016, the Company issued 25,000 common shares in connection with the lease on the Mayflower property (note 4d)(ii)(1), with a fair value of $18,000. |
| b) | On July 15, 2016, the Company closed a non-brokered private placement equity financing and issued 2,550,000 common shares at a price of $1.02 per share for gross proceeds of $2,601,000. In connection with the financing, the Company paid an additional $17,554 in share issuance costs. |
| c) | An aggregate of 200,000 shares were issued on exercise of 200,000 stock options for gross proceeds of $100,000. |
Stock options
Stock options awarded to employees and non-employees by the Company are measured and recognized in the Condensed Interim Consolidated Statement of Operations and Comprehensive Loss over the vesting period.
The Company has adopted an incentive stock option plan, first adopted in 2010 and then amended in 2013 (the “Amended 2010 Plan”). The essential elements of the Amended 2010 Plan provide that the aggregate number of common shares of the Company’s share capital that may be made issuable pursuant to options granted under the Amended 2010 Plan (together with any other shares which may be issued under other share compensation plans of the Company) may not exceed 10% of the number of issued shares of the Company at the time of the granting of the options. Options granted under the Amended 2010 Plan will have a maximum term of ten years. The exercise price of options granted under the Amended 2010 Plan will not be less than the greater of the market price of the common shares (as defined by TSX, currently defined as the 5 day volume weighted average price for the 5 trading days immediately preceding the date of grant) or the closing market price of the Company’s common shares for the trading day immediately preceding the date of grant), or such other price as may be agreed to by the Company and accepted by the TSX. Options granted under the Amended 2010 Plan vest immediately, unless otherwise determined by the directors at the date of grant.
A summary of the status of the stock option plan as of November 30, and May 31, 2016, and changes during the periods are presented below:
| Six months ended November 30, 2016 | Year ended May 31, 2016 | |||||||||||||||
| Number of Options | Weighted Average Exercise Price | Number of Options | Weighted Average Exercise Price | |||||||||||||
| Balance, beginning of the period | 7,981,000 | $ | 0.85 | 7,396,334 | $ | 0.94 | ||||||||||
| Granted | 1,135,000 | 1.02 | 1,650,000 | 0.48 | ||||||||||||
| Exercised | (200,000 | ) | (0.50 | ) | (245,334 | ) | (0.50 | ) | ||||||||
| Expired | (19,100 | ) | (0.50 | ) | (820,000 | ) | (0.94 | ) | ||||||||
| Balance, end of the period | 8,896,900 | $ | 0.87 | 7,981,000 | $ | 0.85 | ||||||||||
The weighted average remaining contractual life of options outstanding at November 30, 2016 was 2.33 years (May 31, 2016 – 2.42 years).
| 14 |
Stock options outstanding are as follows:
| November 30, 2016 | May 31, 2016 | |||||||||||||||||||||||
| Expiry Date | Exercise Price | Number of Options | Exercisable at Period- End | Exercise Price | Number of Options | Exercisable at Year- End | ||||||||||||||||||
| September 19, 2016 | $ | - | - | - | $ | 0.50 | 219,100 | 219,100 | ||||||||||||||||
| November 17, 2016* | $ | 0.67 | 210,000 | 210,000 | $ | 0.67 | 210,000 | 210,000 | ||||||||||||||||
| January 23, 2017 | $ | 1.10 | 50,000 | 50,000 | $ | 1.10 | 50,000 | 50,000 | ||||||||||||||||
| May 1, 2017 | $ | 0.73 | 50,000 | 50,000 | $ | 0.73 | 50,000 | 50,000 | ||||||||||||||||
| May 29, 2017 | $ | 0.92 | 300,000 | 300,000 | $ | 0.92 | 300,000 | 300,000 | ||||||||||||||||
| September 19, 2017 | $ | 0.96 | 2,016,900 | 2,016,900 | $ | 0.96 | 2,016,900 | 2,016,900 | ||||||||||||||||
| October 29, 2017 | $ | 0.96 | 100,000 | 100,000 | $ | 0.96 | 100,000 | 100,000 | ||||||||||||||||
| August 16, 2018 | $ | 0.76 | 2,120,000 | 2,120,000 | $ | 0.76 | 2,120,000 | 2,120,000 | ||||||||||||||||
| September 8, 2019 | $ | 1.40 | 1,265,000 | 1,265,000 | $ | 1.40 | 1,265,000 | 842,490 | ||||||||||||||||
| September 9, 2020 | $ | 0.46 | 640,000 | 426,240 | $ | 0.46 | 640,000 | 213,120 | ||||||||||||||||
| November 13, 2020 | $ | 0.49 | 1,010,000 | 672,660 | $ | 0.49 | 1,010,000 | 336,330 | ||||||||||||||||
| June 22, 2018 | $ | 1.02 | 50,000 | 16,650 | $ | - | - | - | ||||||||||||||||
| September 15, 2021 | $ | 0.91 | 1,085,000 | 361,305 | $ | - | - | - | ||||||||||||||||
| 8,896,900 | 7,588,755 | 7,981,000 | 6,457,940 | |||||||||||||||||||||
*The Company’s share trading policy (the “Policy”) requires that all restricted persons and others who are subject to the Policy refrain from conducting any transactions involving the purchase or sale of the Company’s securities, during the period in any quarter commencing 30 days prior to the scheduled issuance of the next quarter or year-end public disclosure of the financial results. In accordance with the terms of the Amended 2010 Plan, since the stock options were not exercised prior to the 30 day restriction, they did not expire but instead will be available for exercise for 10 days after such restrictions are lifted.
The Company uses the fair value method for determining stock-based compensation for all options granted during the periods. The fair value of options granted was $691,819 (2015 - $420,866), determined using the Black-Scholes option pricing model based on the following weighted average assumptions:
| For the six months ended November 30, | 2016 | 2015 | ||||||
| Risk-free interest rate | 0.71 | % | 0.88 | % | ||||
| Expected life of options (years) | 4.87 | 5 | ||||||
| Annualized volatility | 85.96 | % | 72.33 | % | ||||
| Dividend yield | 0 | % | 0 | % | ||||
| Exercise price | $ | 0.91 | $ | 0.48 | ||||
| Fair value per share | $ | 0.61 | $ | 0.26 | ||||
Annualized volatility was determined by reference to historic volatility of the Company.
Stock-based compensation has been allocated as follows:
| For the period ended November 30, | 2016 | 2015 | ||||||
| Consulting fees | $ | 166,162 | $ | 221,119 | ||||
| Exploration expenditures – Geological/geophysical | 13,521 | 9,260 | ||||||
| Investor relations | 37,743 | 55,465 | ||||||
| Professional fees | 3,486 | 11,008 | ||||||
| Wages and benefits | 93,171 | 159,617 | ||||||
| $ | 314,083 | $ | 456,469 | |||||
| 15 |
| 6. | RELATED PARTY TRANSACTIONS |
During the period ended November 30, 2016, the Company entered into the following transactions with related parties:
| For the period ended November 30, | 2016 | 2015 | ||||||
| Consulting fees to CFO | $ | 40,000 | $ | 36,000 | ||||
| Wages and benefits to CEO and COO | 295,204 | 292,421 | ||||||
| Wages and benefits to former President | - | 234,997 | ||||||
| Directors fees (included in consulting fees) | 67,500 | 67,500 | ||||||
| Fees to Vice President of Corporate Communications (included in investor relations) | 75,000 | 75,000 | ||||||
| Stock-based compensation to related parties | 261,564 | 352,272 | ||||||
| $ | 739,268 | $ | 1,058,190 | |||||
As at November 30, 2016, included in accounts payable and accrued liabilities was $10,976 (May 31, 2016 – $7,628) in expenses owing to companies related to officers and officers of the Company.
These amounts were unsecured, non-interest bearing and had no fixed terms or terms of repayment. Accordingly, fair value could not be readily determined.
The Company has also entered into change of control agreements with officers of the Company. In the case of termination, the officers are entitled to an amount equal to a multiple (ranging from two times to three times) of the sum of the annual base salary then payable to the officer, the aggregate amount of bonus(es) (if any) paid to the officer within the calendar year immediately preceding the Effective Date of Termination, and an amount equal to the vacation pay which would otherwise be payable for the one year period next following the Effective Date of Termination.
| 7. | GEOGRAPHIC SEGMENTED INFORMATION |
The Company operates in one industry segment, the mineral resources industry, and in two geographical segments, Canada and the United States. All current exploration activities are conducted in the United States and Canada. The significant asset categories identifiable with these geographical areas are as follows:
| Canada | United States | Total | ||||||||||
| November 30, 2016 | ||||||||||||
| Capitalized acquisition costs | $ | - | $ | 4,466,261 | $ | 4,466,261 | ||||||
| Property and equipment | $ | 9,817 | $ | 70,619 | $ | 80,436 | ||||||
| May 31, 2016 | ||||||||||||
| Capitalized acquisition costs | $ | - | $ | 4,261,680 | $ | 4,261,680 | ||||||
| Property and equipment | $ | 8,068 | $ | 73,983 | $ | 82,051 | ||||||
| For the period ended November 30, | 2016 | 2015 | ||||||
| Net loss for the period – Canada | $ | (985,692 | ) | $ | (1,009,198 | ) | ||
| Net loss for the period – United States | (1,848,468 | ) | (3,435,194 | ) | ||||
| Net loss for the period | $ | (2,834,160 | ) | $ | (4,444,392 | ) | ||
| 16 |
| 8. | SUBSIDIARIES |
Significant subsidiaries for the six months ended November 30, 2016 and 2015 are:
| Country of Incorporation | Principal Activity | The Company’s effective interest for 2016 | The Company’s effective interest for 2015 | |||||||||||||
| Corvus Gold (USA) Inc. | USA | Holding company | 100 | % | 100 | % | ||||||||||
| Raven Gold Alaska Inc. | USA | Exploration company | 100 | % | 100 | % | ||||||||||
| Corvus Gold Nevada Inc. | USA | Exploration company | 100 | % | 100 | % | ||||||||||
| SoN Land & Water LLC | USA | Exploration company | 100 | % | 100 | % | ||||||||||
| 9. | SUPPLEMENTAL CASH FLOW INFORMATION |
| For the six months ended November 30, | 2016 | 2015 | ||||||
| Non-cash financing and investing transactions | ||||||||
| Shares issued to acquire mineral properties | $ | 18,000 | $ | 11,250 | ||||
| 17 |
ITEM 2. MANAGEMENT’S DISCUSSION AND ANALYSIS OF FINANCIAL CONDITION AND RESULTS OF OPERATIONS
The following discussion and analysis should be read in conjunction with our unaudited condensed interim consolidated financial statements for the six months ended November 30, 2016, and the related notes thereto, which have been prepared in accordance with generally accepted accounting principles in the United States (“U.S. GAAP”). This discussion and analysis contains forward-looking statements and forward-looking information that involve risks, uncertainties and assumptions. Our actual results may differ materially from those anticipated in these forward-looking statements and information as a result of many factors. See section heading “Note Regarding Forward-Looking Statements” below. All currency amounts are stated in Canadian dollars unless noted otherwise.
CAUTIONARY NOTE TO U.S. INVESTORS REGARDING ESTIMATES OF MEASURED, INDICATED AND INFERRED RESOURCES AND PROVEN AND PROBABLE RESERVES
Corvus Gold Inc. (“we”, “us”, “our,” “Corvus” or the “Company”) is a mineral exploration company engaged in the acquisition and exploration of mineral properties. The mineral estimates in the Technical Report (as defined below) referenced in this Quarterly Report on Form 10-Q have been prepared in accordance with the requirements of the securities laws in effect in Canada, which differ from the requirements of United States securities laws. As used in the Technical Report referenced in this Quarterly Report on Form 10-Q, the terms “mineral reserve”, “proven mineral reserve” and “probable mineral reserve” are Canadian mining terms as defined in accordance with Canadian National Instrument 43-101 “Standards of Disclosure for Mineral Projects” (“NI 43-101”) and the Canadian Institute of Mining, Metallurgy and Petroleum (the “CIM”) CIM Definition Standards on Mineral Resources and Mineral Reserves, adopted by the CIM Council, as amended. These definitions differ from the definitions in the United States Securities and Exchange Commission (“SEC”) Industry Guide 7 (“SEC Industry Guide 7”). Under SEC Industry Guide 7 standards, a “final” or “bankable” feasibility study is required to report reserves, the three-year historical average price is used in any reserve or cash flow analysis to designate reserves, and the primary environmental analysis or report must be filed with the appropriate governmental authority.
In addition, the terms “mineral resource”, “measured mineral resource”, “indicated mineral resource” and “inferred mineral resource” are defined in and required to be disclosed by NI 43-101; however, these terms are not defined terms under SEC Industry Guide 7 and are normally not permitted to be used in reports and registration statements filed with the SEC. Investors are cautioned not to assume that all or any part of a mineral deposit in these categories will ever be converted into reserves. “Inferred mineral resources” have a great amount of uncertainty as to their existence, and great uncertainty as to their economic and legal feasibility. It cannot be assumed that all, or any part, of an inferred mineral resource will ever be upgraded to a higher category. Under Canadian rules, estimates of inferred mineral resources may not form the basis of feasibility or pre-feasibility studies, except in rare cases. Investors are cautioned not to assume that all or any part of an inferred mineral resource exists or is economically or legally mineable. Disclosure of “contained ounces” in a resource is permitted disclosure under Canadian regulations; however, the SEC normally only permits issuers to report mineralization that does not constitute “reserves” by SEC standards as in place tonnage and grade without reference to unit measures.
Accordingly, information contained in the Technical Report referenced in this report contain descriptions of our mineral deposits that may not be comparable to similar information made public by U.S. companies subject to the reporting and disclosure requirements under the United States federal securities laws and the rules and regulations thereunder.
CAUTIONARY NOTE TO ALL INVESTORS CONCERNING ECONOMIC ASSESSMENTS THAT INCLUDE INFERRED RESOURCES
The Company currently holds or has the right to acquire interests in an advanced stage exploration project in Nye County, Nevada referred to as the North Bullfrog Project (the “NBP”). Mineral resources that are not mineral reserves have no demonstrated economic viability. The preliminary economic assessment included in the Technical Report on the NBP is preliminary in nature and includes “inferred mineral resources” that have a great amount of uncertainty as to their existence, and are considered too speculative geologically to have economic considerations applied to them that would enable them to be categorized as mineral reserves. It cannot be assumed that all, or any part, of an inferred mineral resource will ever be upgraded to a higher category. Under Canadian rules, estimates of inferred mineral resources may not form the basis of feasibility or pre-feasibility studies. There is no certainty that such inferred mineral resources at the NBP will ever be realized. Mineral resources that are not mineral reserves do not have demonstrated economic viability. Investors are cautioned not to assume that all or any part of an inferred mineral resource exists or is economically or legally mineable. Readers should refer to the Technical Report for additional information.
| 18 |
NOTE REGARDING FORWARD-LOOKING STATEMENTS
This Quarterly Report on Form 10-Q and the exhibits attached hereto contain “forward-looking statements” within the meaning of the United States Private Securities Litigation Reform Act of 1995, as amended, and “forward-looking information” within the meaning of applicable Canadian securities legislation, collectively “forward-looking statements”. Such forward-looking statements concern our anticipated results and developments in the operations of the Company in future periods, planned exploration activities, the adequacy of the Company’s financial resources and other events or conditions that may occur in the future. Forward-looking statements are frequently, but not always, identified by words such as “expects,” “anticipates,” “believes,” “intends,” “estimates,” “potential,” “possible” and similar expressions, or statements that events, conditions or results “will,” “may,” “could” or “should” (or the negative and grammatical variations of any of these terms) occur or be achieved. These forward-looking statements may include, but are not limited to, statements concerning:
| • | the Company’s strategies and objectives, both generally and in respect of its specific mineral properties; |
| • | the timing of decisions regarding the timing and costs of exploration programs with respect to, and the issuance of the necessary permits and authorizations required for, the Company’s exploration programs, including for the NBP; |
| • | the Company’s estimates of the quality and quantity of the mineral resources at its mineral properties; |
| • | the timing and cost of planned exploration programs of the Company and its joint venture partners (as applicable), and the timing of the receipt of results therefrom; |
| • | the Company’s future cash requirements and use of proceeds of sales of none-core assets; |
| • | general business and economic conditions; |
| • | the Company’s ability to meet its financial obligations as they come due, and to be able to raise the necessary funds to continue operations; |
| • | the Company’s expectation that it will be able to add additional mineral projects of merit to its assets; |
| • | the potential for the existence or location of additional high-grade veins at the NBP; |
| • | the potential to expand the high-grade gold and silver at the YellowJacket target, and the potential to expand the higher grade bulk tonnage at the Sierra Blanca target, at the NBP; |
| • | the potential for any delineation of higher grade mineralization at the NBP; |
| • | the potential for there to be one or more additional vein zone(s) to the west and northeast of the current YellowJacket high grade zone; |
| • | the potential discovery and delineation of mineral deposits/resources/reserves and any expansion thereof beyond the current estimate; |
| • | the potential for the NBP mineralization system to continue to grow and/or to develop into a major new higher-grade, bulk tonnage, Nevada gold discovery; and |
| • | the Company’s expectation that it will be able to build itself into a non-operator gold producer with significant carried interests and royalty exposure. |
Such forward-looking statements reflect the Company’s current views with respect to future events and are subject to certain known and unknown risks, uncertainties and assumptions. Many factors could cause actual results, performance or achievements to be materially different from any future results, performance or achievements that may be expressed or implied by such forward-looking statements, including, among others, risks related to:
| • | our requirement of significant additional capital; | |
| • | our limited operating history; | |
| • | our history of losses; | |
| • | cost increases for our exploration and, if warranted, development projects; | |
| • | our property being in the exploration stage; | |
| • | mineral exploration and production activities; | |
| • | our lack of mineral production from our property; | |
| • | estimates of mineral resources; | |
| • | changes in mineral resource estimates; | |
| • | differences in United States and Canadian mineral reserve and mineral resource reporting; | |
| • | our exploration activities being unsuccessful; | |
| • | fluctuations in gold, silver and other metal prices; | |
| • | our ability to obtain permits and licenses for production; | |
| • | government and environmental regulations that may increase our costs of doing business or restrict our operations; | |
| • | proposed legislation that may significantly affect the mining industry; | |
| • | land reclamation requirements; | |
| • | competition in the mining industry; | |
| • | equipment and supply shortages; | |
| • | current and future joint ventures and partnerships; | |
| • | our ability to attract qualified management; | |
| 19 |
| • | the ability to enforce judgment against certain of our Directors; | |
| • | currency fluctuations; | |
| • | claims on the title to our property; | |
| • | surface access on our property; | |
| • | potential future litigation; | |
| • | our lack of insurance covering all our operations; | |
| • | our status as a “passive foreign investment company” under US federal tax code; and | |
| • | the Common Shares. |
Should one or more of these risks or uncertainties materialize, or should underlying assumptions prove incorrect, actual results may vary materially from those described herein. This list is not exhaustive of the factors that may affect any of the Company’s forward-looking statements. Forward-looking statements are statements about the future and are inherently uncertain, and actual achievements of the Company or other future events or conditions may differ materially from those reflected in the forward-looking statements due to a variety of risks, uncertainties and other factors, including without limitation those discussed in Part I, Item 1A, Risk Factors, of our Annual Report on Form 10-K, as filed with the SEC on August 22, 2016, which are incorporated herein by reference, as well as other factors described elsewhere in this report and the Company’s other reports filed with the SEC.
The Company’s forward-looking statements contained in this Quarterly Report on Form 10-Q are based on the beliefs, expectations and opinions of management as of the date of this report. The Company does not assume any obligation to update forward-looking statements if circumstances or management’s beliefs, expectations or opinions should change, except as required by law. For the reasons set forth above, investors should not attribute undue certainty to or place undue reliance on forward-looking statements.
Current Business Activities
General
The Company’s material mineral property is the NBP, an advanced exploration stage project in Nevada which has a number of high-priority, bulk tonnage and high-grade vein targets (held through Corvus Gold Nevada Inc. (“Corvus Nevada”), a Nevada subsidiary).
The primary focus of the Company will be to leverage its exploration expertise to expand its existing deposits and discover major new gold deposits. Other than with respect to the ongoing exploration of the NBP, the Company’s strategy is to leverage its other non-core assets by maintaining a retained royalty.
Highlights of activities during the period and to the date of this MD&A include:
| • | NBP Exploration: The 2016 Phase II drilling program began in mid-October with the initial drilling to the north and west in the Swale Zone and to the east in the Liberator Zone. A total of 8,000 m of reverse circulation drilling is planned for Phase II. |
| • | Results for the final four holes drilled in the 2016 Phase I drilling program were received during the period. Intercepts from these holes added to number of intercepts drilled in the Swale target which appear to be controlled by north and northeast trending structures with higher grade mineralization. |
| • | Results from the first two holes drilled in Phase II program were received, with one of the holes in the YellowJacket extension targets intercepting the broadest zone of mineralization encountered at North Bullfrog to date. |
| • | Metallurgical testing of 11 samples from Phase I was begun during the period. |
| • | Baseline characterization activities continued and the results for water quality samples collected from NBP water monitoring wells and springs during September 2016 were received. |
Nevada Property
North Bullfrog Project
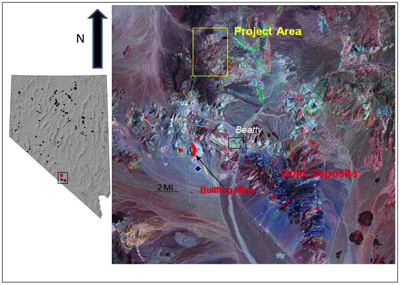
Our principal mineral property is the NBP, a gold exploration project located in northwestern Nye County, Nevada, in the Northern Bullfrog Hills about 15 km north of the town of Beatty. The NBP does not have any known proven or probable reserves under SEC Industry Guide 7 and the project is exploratory in nature. A NI 43-101 technical report entitled “Technical Report and Preliminary Economic Assessment for Combined Mill and Heap Leach Processing at the North Bullfrog Project Bullfrog Mining District, Nye County, Nevada” with an effective date of June 16, 2015, as amended and restated on May 18, 2016, (the “Technical Report”) is available under Corvus Gold’s SEDAR profile at www.sedar.com and EDGAR profile at www.sec.gov. The Technical Report is referred to herein for informational purposes only and is not incorporated herein by reference. The Technical Report contains disclosure regarding mineral resources that are not Guide 7 compliant proven or probable reserves, see “Cautionary Note to U.S. Investors Regarding Estimates of Measured, Indicated and Inferred Resources and Proven and Probable Reserves” above.
| 20 |
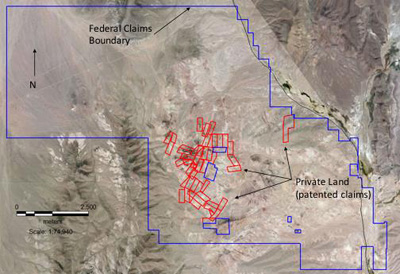
The NBP is located in the Bullfrog Hills of northwestern Nye County, Nevada (Figure 1). The NBP covers about 7,223 hectares of patented and unpatented mining claims in Sections 20, 21, 25, 26, 27, 28, 29, 32, 33, 34, 35, and 36 of T10S, R46E; sections 1, 2, 11, 12, 13, and 14 of T11S, R46E; section 31 of T10S, R47E; and sections 6, 9, 15, 16, and 17 T11S, R47E, MDBM. We have a total of nine option/lease agreements in place that give us control of an aggregate of 51 patented lode mining claims (Figure 2). Corvus Nevada owns an additional 5 patented claims (the Millman claims) and a 430 acre property with 1600 acre-feet of water rights located north of NBP in the Sacrobatus hydrographic basin (Basin 146).
 |
||
| Figure 1. Property Map showing the Location of the North Bullfrog Project. |
 |
||
Figure 2. Property Map of the North Bullfrog Project, Blue outline shows the NBP boundary and red areas are the Leased Private Land (UTm NAD 27 Zone 11). |
Phase I 2016 Drilling Results
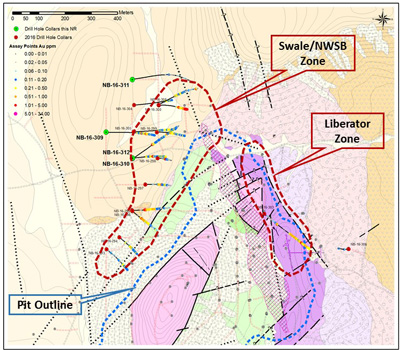
A total of 6,250 metres of Reverse Circulation (RC) drilling was completed during 2016 Phase I drilling. Drilling was concentrated around the Swale target. Results for the final four holes of the 2016 Phase I drill program were released in early September 2016 (Figure 3). Drilling was concentrated around the Swale target located at a major intersection of the northwest trending YellowJacket zone and the northeast trending NWSB zone. Results have returned a number of higher grade (+1 g/t gold) structural zones within a 500 by 200 metre target area.
| 21 |
Results from final four holes drilled in the Phase I drill program include NB-16-310 with 13.7m @ 1.18 g/t Au and NB-16-312 with 4.6m @ 1.08 g/t Au & 6.1m @ 1.2 g/t Au. Drill intercepts are listed in Table1 and the locations are shown in Figure 3. All four holes were within the Swale target and included two holes which intersected broad zones of +1 g/t gold that were surrounded by thick low-grade zones along north-south trending structures (Table 1). This large area of low-grade mineralization is prospective for additional mill grade mineralization and lies immediately north of the current pit boundary design. This target area will be an area of focus during the Phase II, resource development drilling.
 |
||
| Figure 3. Drill hole locations map for 2016 Phase I, North Bullfrog project. |
Table 1
Drill Results Swale Targets
(Reported drill intercepts are not true widths. At this time, there is insufficient data with respect to the shape of the mineralization to calculate its true orientation in space.)
| Swale Target | From (m) | To (m) | Length (m)* | Gold (g/t) | Silver (g/t) | ||
| NB-16-309 | 239.27 | 259.08 | 19.81 | 0.19 | 0.61 | ||
| AZ 087 dip-60 | 263.65 | 329.18 | 65.53 | 0.40 | 0.67 | ||
| inc | 280.42 | 281.94 | 1.52 | 0.58 | 0.34 | ||
| inc | 294.13 | 304.8 | 10.67 | 0.69 | 0.96 | ||
| inc | 309.37 | 313.94 | 4.57 | 0.65 | 1.60 | ||
| 339.85 | 352.04 | 12.19 | 0.14 | 0.55 | |||
| 356.62 | 365.76 | 9.14 | 0.13 | 0.44 | |||
|
hole ended in mineralization
| |||||||
| 22 |
| NB-16-310 | From (m) | To (m) | Length (m)* | Gold (g/t) | Silver (g/t) | ||
| AZ 085 dip -55 | 100.58 | 164.59 | 64.01 | 0.49 | 1.48 | ||
| inc | 108.2 | 109.73 | 1.52 | 0.67 | 2.75 | ||
| inc | 132.59 | 140.21 | 7.62 | 0.61 | 1.05 | ||
| inc | 149.35 | 163.07 | 13.72 | 1.18 | 2.22 | ||
| 214.88 | 220.98 | 6.1 | 0.20 | 0.39 | |||
| 227.08 | 294.13 | 67.05 | 0.24 | 0.96 | |||
| inc | 275.84 | 277.37 | 1.52 | 0.82 | 0.75 | ||
| inc | 289.56 | 292.61 | 3.05 | 0.61 | 1.09 | ||
| hole ended in mineralization | |||||||
| NB-16-311 | No significant results | ||||||
| AZ 080 dip-50 | |||||||
| NB-16-312 | From (m) | To (m) | Length (m)* | Gold (g/t) | Silver (g/t) | ||
| AZ 055 dip-45 | 137.16 | 240.79 | 103.63 | 0.24 | 0.68 | ||
| inc | 138.68 | 143.26 | 4.58 | 1.08 | 1.87 | ||
| inc | 152.4 | 153.92 | 1.52 | 0.53 | 1.03 | ||
| inc | 227.08 | 228.6 | 1.52 | 0.58 | 1.21 | ||
| 266.7 | 335.28 | 68.58 | 0.31 | 0.71 | |||
| inc | 272.8 | 278.89 | 6.09 | 1.20 | 1.28 | ||
| inc | 323.09 | 324.61 | 1.52 | 0.55 | 1.22 | ||
| 339.85 | 358.14 | 18.29 | 0.16 | 0.41 | |||
| 364.24 | 371.86 | 7.62 | 0.17 | 0.36 | |||
| hole ended in mineralization | |||||||
Swale Target
Two of the final four holes drilled in the Phase I program targeted the northern extension of mineralization intersected in hole NB-16-298 (23m @ 1.69 g/t Au, NR16-09, June 7, 2016) and returned encouraging intercepts such as NB-16-310 with 13.7m @ 1.18 g/t Au and NB-16-312 with 4.6m @ 1.08 g/t Au & 6.1m @ 1.2 g/t Au. These intervals are surrounded by over 100 metres of low-grade mineralization indicating the system remains very strong to the north of the currently defined Sierra Blanca/YellowJacket deposit. The current interpretation of the higher grade mineralization in this area indicates it is controlled by a series of north and northeast trending structures and structural intersections with the major northeast structural zone hosting the mineralization in hole NB-16-298.
Hole NB-16-309 tested the Swale system 200 metres to the southwest of hole NB-16-300 (18m @ 1.8 g/t Au, NR16-09, June 7, 2016) and returned several broad intercepts of low-grade mineralization including 65.5m @ 0.40 g/t Au. This broad zone of gold mineralization from the currently farthest west hole drilled in this area, indicates the system remains open and suggests that potential exists in this direction for other feeder zones.
Holes NB-16-311 was drilled north of hole NB-16-308 (3.1m @ 2.24 g/t Au, NR16-11, August 2, 2016) but failed to hit the favorable host rock package or any significant mineralization.
Phase II Drill Program
Corvus Gold began its 2016 Phase II drill program in mid-September, 2016 with the start-up of drilling being delayed by availability of the drilling equipment. The program is scheduled for approximately 9,000 metres of reverse circulation drilling, designed to address resource expansion potential for the Sierra Blanca/YellowJacket deposit to the north and west in the Swale Zone and to the east in the Liberator Zone. In addition, two new exploration/new discovery targets will be tested at North Jolly Jane and Cat Hill. The program is planned to extend into February 2017. All of the planned exploration and development programs for 2016 and 2017 as well as anticipated corporate and general administrative costs are fully funded.
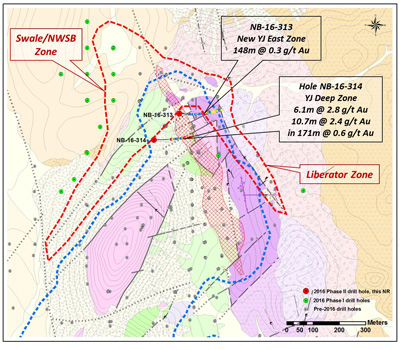
Results from the Phase II drill program at the North Bullfrog property in Nevada (Table 2) have been received for the initial two holes targeted for expansion potential at the north end of the YellowJacket system, both at depth and laterally to the current deposit (Figure 4). Drill hole NB-16-314 intercepted the broadest gold mineralization discovered to date at the YellowJacket deposit with 170.7 metres @ 0.60 g/t gold, including new depth extensions to the West Splay Vein (6.1 metres @ 2.8 g/t gold) and the main YellowJacket Vein (10.7 metres @ 2.4 g/t gold). These new intercepts indicate that the YellowJacket and the surrounding new vein systems at Liberator and NWSB may be strengthening to the north, in the area which is the focus of the ongoing Phase II resource expansion drill program.
| 23 |
Table 2
Drill Results YellowJacket Extension Targets
(Reported drill intercepts are not true widths. At this time, there is insufficient data with respect to the shape of the mineralization to calculate its true orientation in space.)
| From (m) | To (m) | Length (m)* | Gold (g/t) | Silver (g/t) | |||
| NB-16-313 | 57.91 | 73.15 | 15.24 | 0.34 | 2.6 | ||
| AZ 090 dip-50 | inc | 57.91 | 59.44 | 1.52 | 1.88 | 12.0 | |
| 80.77 | 99.06 | 18.29 | 0.20 | 1.0 | |||
| 108.2 | 256.03 | 147.83 | 0.29 | 1.0 | |||
| inc | 143.26 | 144.78 | 1.52 | 5.22 | 2.9 | ||
|
*hole ended in mineralization
| |||||||
| NB-16-314 | From (m) | To (m) | Length (m)* | Gold (g/t) | Silver (g/t) | ||
| AZ 085 dip -55 | 131.06 | 301.75 | 170.69 | 0.60 | 1.9 | ||
| inc | 132.59 | 138.68 | 6.09 | 2.80 | 4.7 | ||
| inc | 227.08 | 237.74 | 10.66 | 2.41 | 9.7 | ||
| inc | 252.98 | 286.51 | 33.53 | 0.86 | 1.9 | ||
* Mineralized thickness calculated @ 0.10 g/t Au cutoff with internal vein calculated @ 1.0 g/t Au cutoff
 |
||
Figure 4. Drill hole locations map for 2016 Phase II, North Bullfrog project. Current pit design outlined in blue. |
| 24 |
YellowJacket Extension
The initial two holes from the 2016 Phase II program were designed to assess the expansion potential of the north end of the existing YellowJacket deposit.
Drill hole NB-16-313 was targeted at the up-dip extension of the YellowJacket vein system and to evaluate an additional zone of mineralization to the east in between the YellowJacket and Liberator systems. The hole initially intercepted mineralization about 40m vertically below the surface (15m @ 0.34 g/t Au with 1.5m @ 1.88 g/t Au) which indicates we are defining the top of the system. The broad (148m @ 0.29 g/t Au with 1.5m @ 5.2 g/t Au) lower zone of gold mineralization in this hole is encouraging in that it is defining a wider and stronger part of the system to the north which may be merging with the new Liberator and Rhyolite zones. This may indicate that the overall system may become larger and more dynamic as Corvus approaches the major intersection of the NW trending YellowJacket-Liberator systems with the NE trending NWSB-Rhyolite systems at the current north end of the YellowJacket deposit.
Drill hole NB-16-314 was designed to test the deeper part of the YellowJacket system in the north end of the deposit. The results have shown a much broader zone of mineralization in this north end that returned 171 metres at 0.6 g/t gold which included the West Splay Vein with 6.1 metres at 2.8 g/t gold and the YellowJacket vein with 10.7 metres at 2.4 g/t gold. This broad zone of mineralization around two expanding vein zones suggests that the system may be becoming stronger to the north
Project Development Activities
Monitoring programs to develop baseline characterization data for support of future permitting activities continued during the period. The results for water quality samples were collected from NBP monitoring wells and surrounding areal springs in September were received during the period. Meteorological monitoring continued with the quarterly report submitted to NDEP. Planning to recondition and test the water production well at the Sacrobatus Property was completed during the period with a pump-out test scheduled for calendar Q1 2017.
A group of 11 metallurgical samples from the Phase I drilling program were submitted for testing during the period.
Qualified Person and Quality Control/Quality Assurance
Jeffrey A. Pontius (CPG 11044), a qualified person as defined by National Instrument 43-101, has supervised the preparation of the scientific and technical information that forms the basis for the NBP disclosure in this Quarterly Report on Form 10-Q and has approved the disclosure in this Quarterly Report on Form 10-Q related thereto. Mr. Pontius is not independent of the Company, as he is the CEO and holds common shares and incentive stock options.
The exploration program at the NBP was designed and supervised by Mark Reischman, Nevada Exploration Manager, who is responsible for all aspects of the work, including the quality control/quality assurance program. On-site personnel at the project log and track all samples prior to sealing and shipping. All sample shipments are sealed and shipped to ALS Minerals in Reno, Nevada, for preparation and then on to ALS Minerals in Reno, Nevada, or Vancouver, B.C., for assay. McClelland Laboratories Inc. prepared composites from duplicated RC sample splits collected during drilling. Bulk samples were sealed on site and delivered to McClelland Laboratories Inc. by ALS Minerals or Corvus personnel. All metallurgical testing reported here was conducted or managed by McClelland Laboratories Inc.
Carl Brechtel (Colorado PE 23212 and Nevada PE 8744), a qualified person as defined by National Instrument 43-101, has supervised the NBP metallurgical testing program and has approved the disclosure in this Quarterly Report on Form 10-Q related thereto. Mr. Brechtel is not independent of the Company, as he is the Chief Operating Officer and holds common shares and incentive stock options.
ALS Minerals’ quality system complies with the requirements for the International Standards ISO 9001:2000 and ISO 17025:1999. Analytical accuracy and precision are monitored by the analysis of reagent blanks, reference material and replicate samples. Quality control is further assured by the use of international and in-house standards. Finally, representative blind duplicate samples are forwarded to ALS Minerals and an ISO compliant third party laboratory for additional quality control.
For additional information on the NBP project, including information relating to exploration, data verification and the mineral resource estimates, see the Technical Report, which is available under Corvus Gold’s SEDAR profile at www.sedar.com and EDGAR profile at www.sec.gov. The Technical Report is referred to herein for informational purposes only and is not incorporated herein by reference. The Technical Report contains disclosure regarding mineral resources that are not Guide 7 compliant proven or probable reserves, see “Cautionary Note to U.S. Investors Regarding Estimates of Measured, Indicated and Inferred Resources and Proven and Probable Reserves” above.
| 25 |
Results of Operations
Six months ended November 30, 2016 Compared to Six months ended November 30, 2015
For the six months ended November 30, 2016, the Company had a net loss of $2,834,160 compared to a net loss of $4,444,392 in the comparative period of the prior year. Included in net loss was $314,083 (2015 - $456,469) in stock-based compensation charges which is a result of stock options granted during the period and previously granted stock options which vested during the period. The decrease in loss of $1,610,232 in the six month period of the current year was due to a combination of factors discussed below.
The primary factor for the decrease in the net loss was the exploration expenditures of $1,229,669 incurred in the current period compared to $1,894,458 in the comparative period of the prior year. The exploration activities of the Company decreased mainly due to less funding being available in the current period compared with the comparative period of the prior year offset by an increase in stock-based compensation charges of $13,521 in the current period compared to $9,260 in the prior period.
Consulting fees decreased to $291,662 (2015 - $342,619) mainly due to decreased stock-based compensation charges of $166,162 during the current period compared to $221,119 in the comparative period of the prior year..
Investor relations expenses decreased to $340,023 (2015- $362,036) due to decreased stock-based compensation charges of $37,743 during the current period compared to $55,465 in the comparative period of the prior year and a decrease of $4,291in investor relations-related travel, and advertising and marketing during the current period as part of the Company’s efforts to decrease costs until the Company secures additional financing.
Professional fees decreased to $123,923 (2015 - $164,730) due to decreased stock-based compensation charges of $3,486 during the current prior compared to $11,008 in the comparative period of the prior year and a decrease of $33,285 in legal and accounting fees in the current period compared to the comparative period of the prior year as a result of the Company registering its securities in the United States in the comparative period of the prior year.
Travel expenses increased to $84,318 (2015 - $68,470) mainly due to more conferences attended during the current period as part of the Company’s efforts to secure additional financing.
Wages and benefits decreased to $563,008 (2015 - $848,715) mainly due to decreased stock-based compensation charges of $93,171 during the current period compared to $159,617 in the comparative period of the prior year and a decrease of $219,261 in wages and benefits in the current period mainly as a result of adjustment in wages of several senior executive officers and the severance pay to the former President in the comparative period of the prior year.
Other expense categories that reflected only moderate change period over period were administration expenses of $453 (2015 - $4,625), depreciation expenses of $11,007 (2015 - $12,798), insurance expenses of $58,316 (2015 - $62,189), office expenses of $62,113 (2015 - $68,686), regulatory expenses of $31,855 (2015 - $39,985), and rent expenses of $52,348 (2015 - $54,432).
Other items amounted to an income of $14,535 compared to a loss of $520,649 in the prior period. There was a gain on sale of the Company’s interest in the West Pogo property of $25,728 in the comparative period of the prior year and a write-off of the Company’s interest in the Chisna property of $677,695 in the comparative period of the prior year. There was a decrease in foreign exchange to a loss of $3,795 (2015 - gain of $121,650), which is the result of factors outside of the Company’s control and an increase in interest income of $18,330 (2015 - $9,668) as a result of less investment in cashable GIC’s during the current period.
Three months ended November 30, 2016 Compared to Three months ended November 30, 2015
For the three months ended November 30, 2016, the Company had a net loss of $1,328,223 compared to a net loss of $2,623,100 in the comparative period of the prior year. Included in net loss was $137,845 (2015 - $161,588) in stock-based compensation charges which is a result of stock options granted during the period and previously granted stock options which vested during the period. The decrease in loss of $1,294,877 in the three month period of the current year was due to a combination of factors discussed below.
Exploration expenditures of $576,163 incurred in the current period compared to $1,104,399 in the comparative period of the prior year. The exploration activities of the Company decreased mainly due to less funding being available in the current period compared with the comparative period of the prior year offset by an increase in stock-based compensation charges of $8,886 in the current period compared to $3,805 in the prior period.
Consulting fees decreased to $130,396 (2015 - $150,226) mainly due to decreased stock-based compensation charges of $67,646 during the current period compared to $89,476 in the prior period.
| 26 |
Professional fees decreased to $58,761 (2015 - $94,248) due to decreased stock-based compensation charges of $1,578 during the current period compared to $2,771 in the prior period and a decrease of $34,294 in legal and accounting fees in the current period compared to the prior period as a result of the Company registering its securities in the United States.
Travel expenses increased to $65,489 (2015 - $50,795) due to more conferences were attended during the current period as part of the Company’s effort to secure additional financing.
Wages and benefits decreased to $222,922 (2015 - $269,705) mainly due to a decrease in stock-based compensation charges of $42,526 in the current period compared to $48,972 in the prior period and a decrease of $40,337 in wages and benefits in the current period mainly as a result of the departure of the former President in the prior year of the comparative period.
Other expense categories that reflected only moderate change period over period were administration expenses of $92 (2015 - $1,850), depreciation expenses of $5,685 (2015 - $6,498), insurance expenses of $28,834 (2015 - $31,129), investor relations expenses of $194,543 (2015 - $197,262), office expenses of $33,228 (2015 - $30,064), regulatory expenses of $9,026 (2015 - $13,004), and rent expenses of $23,465 (2015 – $28,132).
Other items amounted to an income of $20,381 compared to a loss of $645,788 in the prior period. This was mainly due to the write-off of the Company’s interest in the Chisna property of $677,695 in the comparative period of the prior year. There was a decrease in foreign exchange to a gain of $10,815 (2015 - gain of $27,804), which is the result of factors outside of the Company’s control and an increase in interest income of $9,566 (2015 - 4,103) as a result of less investment in cashable GIC’s during the current period.
Liquidity and Capital Resources
The Company has no revenue generating operations from which it can internally generate funds. To date, the Company’s ongoing operations have been financed by the sale of its equity securities by way of public offerings, private placements and the exercise of incentive stock options and share purchase warrants. The Company believes that it will be able to secure additional private placements and public financings in the future, although it cannot predict the size or pricing of any such financings. In addition, the Company can raise funds through the sale of interests in its mineral properties, although current market conditions have substantially reduced the number of potential buyers/acquirers of any such interest(s). This situation is unlikely to change until such time as the Company can develop a bankable feasibility study on one of its projects. When acquiring an interest in mineral properties through purchase or option, the Company will sometimes issue common shares to the vendor or optionee of the property as partial or full consideration for the property interest in order to conserve its cash.
The Company reported cash and cash equivalents of $5,026,115 as at November 30, 2016 compared to $4,783,519 as at May 31, 2016. The change in cash position was the net result of $2,391,251 used for operating activities, $7,739 used on property and equipment, $66,876 used on capitalized acquisition costs, $2,683,446 received from the private placement of common shares in July of 2016 (net of share issue costs) and exercise of stock options during the six months ended November 30, 2016.
As at November 30, 2016, the Company had working capital of $4,870,893 compared to working capital of $4,742,321 as at May 31, 2016. The Company expects that it will operate at a loss for the foreseeable future and believes the current cash and cash equivalents will be sufficient for it to maintain its currently held properties, and fund its currently anticipated general and administrative costs until May 31, 2019. Following May 31, 2019, the Company will need to scale back anticipated activities and costs or raise additional financing to fund operations through the year ending May 31, 2020. The Company’s current anticipated operating expenses are $3,171,000 until May 31, 2017 and $4,105,000 until November 30, 2017. The Company’s anticipated monthly burn rate averages approximately $529,000 for December 2016 to May 2017, where approximately $376,000 is for administrative purposes and approximately $153,000 is for planned exploration expenditures related to the completion of the ongoing Phase II exploration program at the NBP. From December 2016 to November 2017, the Company’s anticipated monthly burn rate averages approximately $342,000, of which $235,000 is for administrative purposes and approximately $107,000 is for planned exploration expenditures related to the ongoing Phase II exploration program at the NBP. In any event, the Company will be required to raise additional funds, again through public or private equity financings, prior to the end of September 2019 in order to continue in business. Should such financing not be available in that time-frame, the Company will be required to reduce its activities and will not be able to carry out all of its presently planned exploration and development activities at the NBP on its currently anticipated scheduling.
The Company currently has no further funding commitments or arrangements for additional financing at this time (other than the potential exercise of incentive stock options) and there is no assurance that the Company will be able to obtain additional financing on acceptable terms, if at all. There is significant uncertainty that the Company will be able to secure any additional financing in the current equity markets. The quantity of funds to be raised and the terms of any proposed equity financing that may be undertaken will be negotiated by management as opportunities to raise funds arise.
| 27 |
The Company has no exposure to any asset-backed commercial paper. Other than cash held by its subsidiaries for their immediate operating needs in Alaska and Nevada, all of the Company’s cash reserves are on deposit with a major Canadian chartered bank. The Company does not believe that the credit, liquidity or market risks with respect thereto have increased as a result of the current market conditions. However, in order to achieve greater security for the preservation of its capital, the Company has, of necessity, been required to accept lower rates of interest, which has also lowered its potential interest income.
Off-Balance Sheet Arrangements
The Company has no off-balance sheet arrangements.
Environmental Regulations
The operations of the Company may in the future be affected from time to time in varying degrees by changes in environmental regulations, including those for future removal and site restoration costs. Both the likelihood of new regulations and their overall effect upon the Company vary greatly and are not predictable. The Company’s policy is to meet or, if possible, surpass standards set by relevant legislation by application of technically proven and economically feasible measures.
Certain U.S. Federal Income Tax Considerations for U.S. Holders
The Company has been a “passive foreign investment company” (“PFIC”) for U.S. federal income tax purposes in recent years and expects to continue to be a PFIC in the future. Current and prospective U.S. shareholders should consult their tax advisors as to the tax consequences of PFIC classification and the U.S. federal tax treatment of PFICs. Additional information on this matter is included in the Company’s Annual Report on Form 10-K as filed with the SEC on August 22, 2016, under “Certain United States Federal Income Tax Considerations”.
Emerging Growth Company Status
We qualify as an “emerging growth company” as defined in Section 101 of the Jumpstart our Business Startups Act (“JOBS Act”) as we do not have more than $1,000,000,000 in annual gross revenue and did not have such amount as of May 31, 2016, being the last day of our last fiscal year.
We may lose our status as an emerging growth company on the last day of our fiscal year during which (i) our annual gross revenue exceeds $1,000,000,000 or (ii) we issue more than $1,000,000,000 in non-convertible debt in a three-year period. We will lose our status as an emerging growth company if at any time we are deemed to be a large accelerated filer. We will lose our status as an emerging growth company on the last day of our fiscal year following the fifth anniversary of the date of the first sale of common equity securities pursuant to an effective registration statement (August 28, 2019).
As an emerging growth company, we are exempt from Section 404(b) of the Sarbanes-Oxley Act of 2002 and Section 14A (a) and (b) of the Securities Exchange Act of 1934. Such sections are provided below:
| • | Section 404(b) of the Sarbanes-Oxley Act of 2002 requires a public company’s auditor to attest to, and report on, management's assessment of its internal controls. |
| • | Sections 14A(a) and (b) of the Securities and Exchange Act, implemented by Section 951 of the Dodd-Frank Act, require companies to hold shareholder advisory votes on executive compensation and golden parachute compensation. |
As long as we qualify as an emerging growth company, we will not be required to comply with the requirements of Section 404(b) of the Sarbanes-Oxley Act of 2002 and Section 14A(a) and (b) of the Securities Exchange Act of 1934, we may however determine to voluntarily comply with such requirements in our discretion.
ITEM 3. QUANTITATIVE AND QUALITATIVE DISCLOSURES ABOUT MARKET RISK
Not applicable.
| 28 |
ITEM 4. CONTROLS AND PROCEDURES
Disclosure Controls and Procedures
As of November 30, 2016, an evaluation was carried out under the supervision of and with the participation of the Company’s management, including the Chief Executive Officer (the principal executive officer) and Chief Financial Officer (the principal financial officer and accounting officer), of the effectiveness of the design and operation of the Company’s disclosure controls and procedures (as defined in Rules 13a-15I and 15d-15(e) of the Exchange Act). Based on the evaluation, the Chief Executive Officer and the Chief Financial Officer have concluded that, as of November 30, 2016, the Company’s disclosure controls and procedures were effective in ensuring that: (i) information required to be disclosed in reports filed or submitted to the SEC under the Exchange Act is recorded, processed, summarized and reported within the time periods specified in applicable rules and forms and (ii) material information required to be disclosed in our reports filed under the Exchange Act is accumulated and communicated to management, including the Chief Executive Officer and Chief Financial Officer, in a manner that allows for accurate and timely decisions regarding required disclosures.
The effectiveness of our or any system of disclosure controls and procedures, however well designed and operated, can provide only reasonable assurance that the objectives of the system will be met and is subject to certain limitations, including the exercise of judgement in designing, implementing and evaluating controls and procedures and the assumptions used in identifying the likelihood of future events.
Changes in Internal Control over Financial Reporting
There were no changes in internal control over financial reporting during the period ended November 30, 2016 that have materially, or are reasonably likely to materially affect, the Company’s internal control over financial reporting.
| 29 |
None.
There have been no material changes from the risk factors set forth in our Annual Report on Form 10-K as filed with the SEC on August 22, 2016.
ITEM 2. UNREGISTERED SALES OF EQUITY SECURITIES AND USE OF PROCEEDS
Unregistered Sales of Equity Securities
Except as disclosed below, all sales of unregistered equity securities during the period covered by this report were previously reported on Form 8-K.
The table below sets forth sales of unregistered equity securities in the period covered by this Quarterly Report on Form 10-Q that weren’t previously reported on Form 8-K.
| Date | Description (A) | Number | Purchaser | Proceeds ($) | Consideration | Exemption (B) | |||||||||||||
| November 2016 | Common Shares | 25,000 | Private Investor | N/A | Property Lease | Private Offering | |||||||||||||
| A – | On November 18, 2016, the Company issued 25,000 common shares in connection with the lease on the Mayflower property (see note 4d)(ii)(1) in the accompanying financial statements), with a fair value of $18,000. |
| B – | “Private Offering” above means that the common shares were offered and sold to private investors pursuant to exemptions from the registration requirements under the United States Securities Act of 1933, as amended (the “Securities Act”), provided by Section 4(a)(2) thereof on the basis of representations and warranties of the private investors provided to the Company at the time of exercise regarding certain factual matters. |
Repurchase of Securities
None
ITEM 3. DEFAULTS UPON SENIOR SECURITIES
None.
ITEM 4. MINE SAFETY DISCLOSURES
Pursuant to Section 1503(a) of the Dodd-Frank Act, issuers that are operators, or that have a subsidiary that is an operator, of a coal or other mine in the United States are required to disclose specified information about mine health and safety in their periodic reports. These reporting requirements are based on the safety and health requirements applicable to mines under the Federal Mine Safety and Health Act of 1977 (the “Mine Act”) which is administered by the U.S. Department of Labor’s Mine Safety and Health Administration (“MSHA”). During the six month period ended November 30, 2016, the Company and its subsidiaries and their properties or operations were not subject to regulation by MSHA under the Mine Act and thus no disclosure is required under Section 1503(a) of the Dodd-Frank Act.
None.
| 30 |
| 2.1 | Arrangement Agreement and Plan of Arrangement with International Tower Hill Mines Ltd., incorporated by reference to Exhibit 2.1 to the Company’s DRS filing as filed with the SEC on May 12, 2014 |
| 3.1 | Notice of Articles, dated April 13, 2010, incorporated by reference to Exhibit 3.1 to the Company’s DRS filing as filed with the SEC on May 12, 2014 |
| 3.2 | Articles, dated April 12, 2010, incorporated by reference to Exhibit 3.2 to the Company’s DRS filing as filed with the SEC on May 12, 2014 |
| 23.1 | Consent of Carl Brechtel |
| 23.2 | Consent of Jeffrey Pontius |
|
31.1
|
Certification of Chief Executive Officer pursuant to Exchange Act Rules 13a-14(a) and 15d-14(a), as adopted pursuant to Section 302 of the Sarbanes-Oxley Act of 2002. |
|
31.2
|
Certification of Chief Financial Officer pursuant to Exchange Act Rules 13a-14(a) and 15d-14(a), as adopted pursuant to Section 302 of the Sarbanes-Oxley Act of 2002. |
|
32.1 |
Certification of the Chief Executive Officer pursuant to 18 U.S.C. Section 1350, as adopted pursuant to Section 906 of the Sarbanes-Oxley Act of 2002. |
| 32.2 | Certification of the Chief Financial Officer pursuant to 18 U.S.C. Section 1350, as adopted pursuant to Section 906 of the Sarbanes-Oxley Act of 2002. |
| 101.INS(1) | XBRL Instance Document |
| 101.SCH(1) | XBRL Taxonomy Extension – Schema |
| 101.CAL(1) | XBRL Taxonomy Extension – Calculations |
| 101.DEF(1) | XBRL Taxonomy Extension – Definitions |
| 101.LAB(1) | XBRL Taxonomy Extension – Labels |
| 101.PRE(1) | XBRL Taxonomy Extension – Presentations |
| (1) | Submitted Electronically Herewith. Attached as Exhibit 101 to this report are the following formatted in XBRL (Extensible Business Reporting Language): (i) the Condensed Interim Consolidated Balance Sheets at November 30, 2016 and May 31, 2016, (ii) the Condensed Interim Consolidated Statements of Operations and Comprehensive Loss for the Six Months ended November 30, 2016 and November 30, 2015, (iii) the Condensed Interim Consolidated Statements of Cash Flows for the Six Months Ended November 30, 2016 and November 30, 2015, (iv) the Condensed Interim Consolidated Statement of Changes in Equity for the Six Months Ended November 30, 2016, (v) the Notes to the Condensed Interim Consolidated Financial Statements. |
| 31 |
Pursuant to the requirements of Section 13 or 15(d) of the Securities Exchange Act of 1934, the registrant has duly caused this report to be signed on its behalf by the undersigned, thereunto duly authorized.
CORVUS GOLD INC.
(the Registrant)
| By: | /s/ Jeffrey Pontius | |
| Jeffrey Pontius | ||
| Chief Executive Officer | ||
| (Principal Executive Officer) | ||
| Date: | January 12, 2017 | |
| By: | /s/ Peggy Wu | |
| Peggy Wu | ||
| Chief Financial Officer | ||
| (Principal Financial and Accounting Officer) | ||
| Date: | January 12, 2017 |
32