Attached files
| file | filename |
|---|---|
| EX-32.2 - EXHIBIT 32.2 - Cornerstone Building Brands, Inc. | a2016exhibit32_2.htm |
| EX-32.1 - EXHIBIT 32.1 - Cornerstone Building Brands, Inc. | a2016exhibit32_1.htm |
| EX-31.2 - EXHIBIT 31.2 - Cornerstone Building Brands, Inc. | a2016exhibit31_2.htm |
| EX-31.1 - EXHIBIT 31.1 - Cornerstone Building Brands, Inc. | a2016exhibit31_1.htm |
| EX-24.1 - EXHIBIT 24.1 - Cornerstone Building Brands, Inc. | a2016exhibit24_1.htm |
| EX-23.1 - EXHIBIT 23.1 - Cornerstone Building Brands, Inc. | a2016exhibit23_1.htm |
| EX-21.1 - EXHIBIT 21.1 - Cornerstone Building Brands, Inc. | a2016exhibit21_1.htm |
| EX-10.1 - EXHIBIT 10.1 - Cornerstone Building Brands, Inc. | a2016exhibit10_1.htm |
UNITED STATES
SECURITIES AND EXCHANGE COMMISSION
Washington, D.C. 20549
__________________________
Form 10-K
__________________________
(Mark One) | |
ý | ANNUAL REPORT PURSUANT TO SECTION 13 OR 15(d) OF THE SECURITIES EXCHANGE ACT OF 1934 |
For the fiscal year ended October 30, 2016
or
o | TRANSITION REPORT PURSUANT TO SECTION 13 OR 15(d) OF THE SECURITIES EXCHANGE ACT OF 1934 |
For the transition period from to .
Commission file number 1-14315
__________________________
NCI BUILDING SYSTEMS, INC.
(Exact name of registrant as specified in its charter)
__________________________
Delaware | 76-0127701 |
(State or other jurisdiction of incorporation or organization) | (I.R.S. Employer Identification No.) |
10943 North Sam Houston Parkway West, Houston, TX | 77064 |
(Address of principal executive offices) | (zip code) |
Registrant’s telephone number, including area code: (281) 897-7788
__________________________
Securities registered pursuant to Section 12(b) of the Act:
Title of Each Class | Name of Each Exchange on Which Registered | |
Common Stock, $0.01 par value | New York Stock Exchange | |
Securities registered pursuant to Section 12(g) of the Act: None
__________________________
Indicate by check mark if the registrant is a well-known seasoned issuer, as defined in Rule 405 of the Securities Act.Yes o No ý
Indicate by check mark if the registrant is not required to file reports pursuant to Section 13 or Section 15(d) of the Act.Yes o No ý
Indicate by check mark whether the registrant (1) has filed all reports required to be filed by Section 13 or 15(d) of the Securities Exchange Act of 1934 during the preceding 12 months (or for such shorter period that the registrant was required to file such reports), and (2) has been subject to such filing requirements for the past 90 days.Yes ý No o
Indicate by check mark whether the registrant has submitted electronically and posted on its corporate Web site, if any, every Interactive Data File required to be submitted and posted pursuant to Rule 405 of Regulation S-T (§232.405 of this chapter) during the preceding 12 months (or for such shorter period that the registrant was required to submit and post such files).Yes ý No o
Indicate by check mark if disclosure of delinquent filers pursuant to Item 405 of Regulation S-K is not contained herein, and will not be contained, to the best of the registrant’s knowledge, in definitive proxy or information statements incorporated by reference in Part III of this Form 10-K or any amendment to this Form 10-K. ý
Indicate by check mark whether the registrant is a large accelerated filer, an accelerated filer, a non-accelerated filer, or a smaller reporting company. See definition of “large accelerated filer,” “accelerated filer” and “smaller reporting company” in Rule 12b-2 of the Exchange Act.
Large accelerated filer o | Accelerated filer ý |
Non-accelerated filer o (Do not check if a smaller reporting company) | Smaller reporting company o |
Indicate by check mark whether the registrant is a shell company (as defined in Rule 12b-2 of the Act).Yes o No ý
The aggregate market value of the voting and non-voting common stock held by non-affiliates of the registrant on May 1, 2016 was $418,251,380, which aggregate market value was calculated using the closing sales price reported by the New York Stock Exchange as of the last business day of the registrant’s most recently completed second fiscal quarter.
APPLICABLE ONLY TO CORPORATE ISSUERS
Indicate the number of shares outstanding of each of the issuer’s classes of common stock, as of the latest practicable date.
The number of shares of common stock of the registrant outstanding on December 28, 2016 was 70,875,084.
__________________________
DOCUMENTS INCORPORATED BY REFERENCE
Certain information required by Part III of this Annual Report is incorporated by reference from the registrant’s definitive proxy statement for its 2017 annual meeting of shareholders to be filed with the Securities and Exchange Commission within 120 days of October 30, 2016.
TABLE OF CONTENTS
Item 1. | ||
Item 1A. | ||
Item 1B. | ||
Item 2. | ||
Item 3. | ||
Item 5. | ||
Item 6. | ||
Item 7. | ||
Item 7A. | ||
Item 8. | ||
Item 9. | ||
Item 9A. | ||
Item 9B. | ||
Item 10. | ||
Item 11. | ||
Item 12. | ||
Item 13. | ||
Item 14. | ||
Item 15. | ||
Item 16. | ||
i
FORWARD LOOKING STATEMENTS
This Annual Report includes statements concerning our expectations, beliefs, plans, objectives, goals, strategies, future events or performance and underlying assumptions and other statements that are not historical facts. These statements are “forward-looking statements” within the meaning of the Private Securities Litigation Reform Act of 1995. Actual results may differ materially from those expressed or implied by these statements. In some cases, our forward-looking statements can be identified by the words “anticipate,” “believe,” “continue,” “could,” “estimate,” “expect,” “forecast,” “goal,” “intend,” “may,” “objective,” “plan,” “potential,” “predict,” “projection,” “should,” “will” or other similar words. We have based our forward-looking statements on our management’s beliefs and assumptions based on information available to our management at the time the statements are made. We caution you that assumptions, beliefs, expectations, intentions and projections about future events may and often do vary materially from actual results. Therefore, we cannot assure you that actual results will not differ materially from those expressed or implied by our forward-looking statements. Accordingly, investors are cautioned not to place undue reliance on any forward-looking information, including any earnings guidance, if applicable. Although we believe that the expectations reflected in the forward-looking statements are reasonable, these expectations and the related statements are subject to risks, uncertainties and other factors that could cause the actual results to differ materially from those projected. These risks, uncertainties and other factors include, but are not limited to:
• | industry cyclicality and seasonality and adverse weather conditions; |
• | challenging economic conditions affecting the nonresidential construction industry; |
• | volatility in the United States (“U.S.”) economy and abroad, generally, and in the credit markets; |
• | substantial indebtedness and our ability to incur substantially more indebtedness; |
• | our ability to generate significant cash flow required to service or refinance our existing debt, including the 8.25% senior notes due 2023, and obtain future financing; |
• | our ability to comply with the financial tests and covenants in our existing and future debt obligations; |
• | operational limitations or restrictions in connection with our debt; |
• | increases in interest rates; |
• | recognition of asset impairment charges; |
• | commodity price increases and/or limited availability of raw materials, including steel; |
• | our ability to make strategic acquisitions accretive to earnings; |
• | retention and replacement of key personnel; |
• | our ability to carry out our restructuring plans and to fully realize the expected cost savings; |
• | enforcement and obsolescence of intellectual property rights; |
• | fluctuations in customer demand; |
• | costs related to environmental clean-ups and liabilities; |
• | competitive activity and pricing pressure; |
• | increases in energy prices; |
• | volatility of the Company’s stock price; |
• | dilutive effect on the Company’s common stockholders of potential future sales of the Company’s Common Stock held by our sponsor; |
• | substantial governance and other rights held by our sponsor; |
• | breaches of our information system security measures and damage to our major information management systems; |
• | hazards that may cause personal injury or property damage, thereby subjecting us to liabilities and possible losses, which may not be covered by insurance; |
• | changes in laws or regulations, including the Dodd–Frank Act; |
1
• | costs and other effects of legal and administrative proceedings, settlements, investigations, claims and other matters; |
• | timing and amount of any stock repurchases; and |
• | other risks detailed under the caption “Risk Factors” in Item 1A of this report. |
A forward-looking statement may include a statement of the assumptions or bases underlying the forward-looking statement. We believe that we have chosen these assumptions or bases in good faith and that they are reasonable. However, we caution you that assumed facts or bases almost always vary from actual results, and the differences between assumed facts or bases and actual results can be material, depending on the circumstances. When considering forward-looking statements, you should keep in mind the risk factors and other cautionary statements in this report, including those described under the caption “Risk Factors” in Item 1A of this report. We expressly disclaim any obligations to release publicly any updates or revisions to these forward-looking statements to reflect any changes in our expectations unless the securities laws require us to do so.
2
PART I
Item 1. Business.
General
NCI Building Systems, Inc. (together with its subsidiaries, unless the context requires otherwise, the “Company,” “NCI,” “we,” “us” or “our”) is one of North America’s largest integrated manufacturers and marketers of metal products for the nonresidential construction industry. Of the approximate $224 billion nonresidential construction industry, we primarily serve the low-rise nonresidential construction market (five stories or less) which, according to Dodge Data & Analytics (“Dodge”), represented approximately 85% of the total nonresidential construction industry during our fiscal year 2016. Our broad range of products are used primarily in new construction and in repair and retrofit activities, mostly in North America.
We design, engineer, manufacture and market what we believe is one of the most comprehensive lines of metal components and engineered building systems in the industry, with a reputation for high quality and superior engineering and design. We go to market with well-recognized brands, which allow us to compete effectively within a broad range of end-user markets including industrial, commercial, institutional and agricultural. Our service versatility allows us to support the varying needs of our diverse customer base, which includes general contractors and sub-contractors, developers, manufacturers, distributors and a current network of approximately 3,200 authorized builders across North America in our engineered building systems segment, over 1,000 dealer partners for our insulated metal panel (“IMP”) products and approximately 5,500 architects. We also provide metal coil coating services for commercial and construction applications, servicing both internal and external customers.
As of October 30, 2016, we operated 41 manufacturing facilities located in the United States, Mexico, Canada and China, with additional sales and distribution offices throughout the United States and Canada. Our broad geographic footprint, along with our hub-and-spoke distribution system, allows us to efficiently supply a broad range of customers with high-quality customer service and reliable deliveries.
The Company was founded in 1984 and reincorporated in Delaware in 1991. In 1998, we acquired Metal Building Components, Inc. (“MBCI”) and doubled our revenue base. As a result of the acquisition of MBCI, we became the largest domestic manufacturer of nonresidential metal components. In 2006, we acquired Robertson-Ceco II Corporation (“RCC”) which operates the Ceco Building Systems, Star Building Systems and Robertson Building Systems divisions and is a leader in the metal buildings industry. The RCC acquisition created an organization with greater product and geographic diversification, a stronger customer base and a more extensive distribution network than either company had individually, prior to the acquisition.
Since 2011, we have executed on a strategy to become the leading provider of IMP products in North America through our acquisitions of Metl-Span LLC (‘‘Metl-Span’’) in 2012 and CENTRIA, a Pennsylvania general partnership (‘‘CENTRIA’’), in 2015. We believe the IMP market remains underpenetrated in North America. IMP products possess several physical and cost-effective attributes, such as energy efficiency, that make them compelling alternatives to competing building materials, in particular due to the adoption of stricter standards and codes by numerous states in the United States that are expected to increase the use of IMP products in construction projects. Given these factors, we believe that growth within the IMP market will continue to outpace the broader metal building sector and the nonresidential construction industry as a whole.
The engineered building systems, metal components and metal coil coating businesses, and the construction industry in general, are seasonal in nature. Sales normally are lower in the first half of each fiscal year compared to the second half of each fiscal year because of unfavorable weather conditions for construction and typical business planning cycles affecting construction.
The nonresidential construction industry is highly sensitive to national and regional macroeconomic conditions. One of the primary challenges we face is that the United States economy is slowly recovering from a recession and a period of relatively low nonresidential construction activity, which began in the third quarter of 2008 and reduced demand for our products and adversely affected our business. In addition, the tightening of credit in financial markets over the same period adversely affected the ability of our customers to obtain financing for construction projects. As a result, we experienced a decrease in orders and cancellations of orders for our products. While economic growth has either resumed or remained flat, the nonresidential construction industry continues to be below previous cyclical troughs.
Current market estimates continue to show uneven activity across the nonresidential construction markets. According to Dodge, low-rise nonresidential construction starts, as measured in square feet and comprising buildings of up to five stories, were down as much as approximately 8% in our fiscal 2016 as compared to our fiscal 2015. However, Dodge typically revises initial reported figures, and we expect this metric will be revised upwards over time. Leading indicators for low-rise, nonresidential construction activity indicate positive momentum into fiscal 2017.
3
The leading indicators that we follow and that typically have the most meaningful correlation to nonresidential low-rise construction starts are the American Institute of Architects’ (“AIA”) Architecture Mixed Use Index, Dodge Residential single family starts and the Conference Board Leading Economic Index (“LEI”). Historically, there has been a very high correlation to the Dodge low-rise nonresidential starts when the three leading indicators are combined and then seasonally adjusted. The combined forward projection of these metrics, based on a 9 to 14-month historical lag for each metric, indicates low single digit growth for new low-rise nonresidential construction starts in fiscal 2017, with the majority of that growth occurring in the second half of our fiscal year.
On October 20, 2009, we completed a financial restructuring that resulted in a change of control of the Company. As part of the restructuring, Clayton, Dubilier & Rice Fund VIII, L.P. and CD&R Friends & Family Fund VIII, L.P. (together, the “CD&R Funds”), purchased an aggregate of 250,000 shares of a newly created class of our convertible preferred stock, designated the Series B Cumulative Convertible Participating Preferred Stock (the “Convertible Preferred Stock,” and shares thereof, the “Preferred Shares”), then representing approximately 68.4% of the voting power and Common Stock of the Company on an as-converted basis (the “Equity Investment”). On May 14, 2013, the CD&R Funds delivered a formal notice requesting the conversion of all of their Preferred Shares into shares of our Common Stock (the “Conversion”). In connection with the Conversion request, we issued the CD&R Funds 54,136,817 shares of our Common Stock, representing 72.4% of the Common Stock of the Company then outstanding. Under the terms of the Preferred Shares, no consideration was required to be paid by the CD&R Funds to the Company in connection with the Conversion of the Preferred Shares. As a result of the Conversion, the CD&R Funds no longer have rights to dividends or default dividends as specified in the Certificate of Designations for the Convertible Preferred Stock. The Conversion eliminated all the outstanding Convertible Preferred Stock and increased stockholders’ equity by nearly $620.0 million, returning our stockholders’ equity to a positive balance during fiscal 2013.
On May 2, 2012, we entered into an Amended Asset-Based Lending Facility (“Amended ABL Facility”) to (i) permit the acquisition of Metl-Span, the entry by the Company into the Credit Agreement and the incurrence of debt thereunder and the repayment of existing indebtedness under NCI’s existing Term Loan, (ii) increase the amount available for borrowing thereunder to $150 million (subject to a borrowing base), (iii) increase the amount available for letters of credit thereunder to $30 million, and (iv) extend the final maturity thereunder.
On June 22, 2012, we completed the acquisition of Metl-Span (the “Metl-Span Acquisition”) acquiring all of its outstanding membership interests for approximately $145.7 million in cash, which included $4.7 million of cash acquired. Upon the closing of the Metl-Span Acquisition, Metl-Span became a direct, wholly-owned subsidiary of NCI Group, Inc. Metl-Span’s operations are conducted through NCI Group, Inc. and its results are included in the results of our metal components segment. The Metl-Span Acquisition strengthened our position as a leading fully integrated supplier to the nonresidential building products industry in North America, providing our customers a comprehensive suite of building products.
On June 22, 2012, in connection with the Metl-Span Acquisition, the Company entered into a Credit Agreement (the “Credit Agreement”) among the Company, as Borrower, Credit Suisse AG, Cayman Islands Branch, as Administrative Agent and Collateral Agent and the lenders party thereto. The Credit Agreement provided for a term loan credit facility in an aggregate principal amount of $250.0 million. Proceeds from borrowings under the Credit Agreement were used, together with cash on hand, (i) to finance the Metl-Span Acquisition, (ii) to extinguish the existing amended and restated credit agreement, due April 2014 (the “Refinancing”), and (iii) to pay fees and expenses incurred in connection with the Metl-Span Acquisition and the Refinancing.
On June 24, 2013, the Company entered into Amendment No. 1 (the “Amendment”) to its existing Credit Agreement (the “Credit Agreement”), dated as of June 22, 2012, between NCI, as borrower, and Credit Suisse AG, Cayman Islands Branch, as administrative agent and collateral agent and the other financial institutions party thereto from time to time (the “Term Loan Facility”), primarily to extend the maturity date and reduce the interest rate applicable to all of the outstanding term loans under the Term Loan Facility.
Pursuant to the Amendment, the maturity date of the $238 million of outstanding term loans (the “Initial Term Loans”) was extended and such loans were converted into a new tranche of term loans (the “Tranche B Term Loans”) that will mature on June 24, 2019 and, prior to such date, will amortize in nominal quarterly installments equal to one percent of the aggregate initial principal amount thereof per annum. Pursuant to the Amendment, the Tranche B Term Loans will bear interest at a floating rate measured by reference to, at NCI’s option, either (i) an adjusted LIBOR not less than 1.00% plus a borrowing margin of 3.25% per annum or (ii) an alternate base rate plus a borrowing margin of 2.25% per annum.
On January 6, 2014, NCI entered into an agreement with the CD&R Funds to repurchase 1.15 million shares of its Common Stock at a price per share equal to the price per share paid by the underwriters to the CD&R Funds in the underwritten offering (the “2014 Stock Repurchase”). The 2014 Stock Repurchase, which was completed at the same time as the 2014 Secondary Offering (as defined below), represented a private, non-underwritten transaction between NCI and the
4
CD&R Funds that was approved and recommended by the Affiliate Transactions Committee of NCI’s board of directors. Following completion of the 2014 Stock Repurchase, NCI canceled the shares repurchased from the CD&R Funds, resulting in a $19.7 million decrease in both additional paid-in capital and treasury stock.
On January 15, 2014, the CD&R Funds completed a registered underwritten offering, in which the CD&R Funds offered 8.5 million shares of Common Stock at a price to the public of $18.00 per share (the “2014 Secondary Offering”). The underwriters also exercised their option to purchase 1.275 million additional shares of Common Stock. The aggregate offering price for the 9.775 million shares sold in the 2014 Secondary Offering was approximately $167.6 million, net of underwriting discounts and commissions. The CD&R Funds received all of the proceeds from the 2014 Secondary Offering and no shares in the 2014 Secondary Offering were sold by NCI or any of its officers or directors (although certain of our directors are affiliated with the CD&R Funds).
On November 7, 2014, the Company, Steelbuilding.com, LLC (together with the Company, the “Guarantors”) and the Company’s subsidiaries NCI Group, Inc. and Robertson-Ceco II Corporation (each a “Borrower” and collectively, the “Borrowers”) entered into Amendment No. 3 to the Loan and Security Agreement (the “ABL Loan and Security Agreement”) among the Borrowers, the Guarantors, Wells Fargo Capital Finance, LLC, as administrative agent and co-collateral agent, Bank of America, N.A., as co-collateral agent and syndication agent, and certain other lenders under the ABL Loan and Security Agreement, in order to amend the ABL Loan and Security Agreement to (i) permit the acquisition of CENTRIA (“CENTRIA Acquisition”), (ii) permit the entry by the Company into documentation with respect to certain debt financing to be incurred in connection with the CENTRIA Acquisition and the incurrence of debt with respect thereto, (iii) extend the maturity date to June 24, 2019, (iv) decrease the applicable margin with respect to borrowings thereunder and (v) make certain other amendments and modifications to provide greater operational and financial flexibility.
On January 16, 2015, the Company issued $250.0 million in aggregate principal amount of 8.25% senior notes due 2023 (the “Notes”) to fund the CENTRIA Acquisition. Interest on the Notes accrues at the rate of 8.25% per annum and is payable semi-annually in arrears on January 15 and July 15. The Notes are guaranteed on a senior unsecured basis by all of the Company’s existing and future domestic subsidiaries that guarantee the Company’s obligations (including by reason of being a borrower under the senior secured asset-based revolving credit facility on a joint and several basis with the Company or a guarantor subsidiary) under the senior secured credit facilities. The Notes are unsecured senior indebtedness and rank equally in right of payment with all of the Company’s existing and future senior indebtedness and senior in right of payment to all of its future subordinated obligations. In addition, the Notes and guarantees are structurally subordinated to all existing and future indebtedness and other liabilities of the Company’s non-guarantor subsidiaries.
The Company may redeem the Notes at any time prior to January 15, 2018, at a price equal to 100% of the principal amount thereof, plus accrued and unpaid interest, if any, to the redemption date, plus the applicable make-whole premium. On or after January 15, 2018, the Company may redeem all or a part of the Notes at redemption prices (expressed as percentages of principal amount thereof) equal to 106.188% for the twelve-month period beginning on January 15, 2018, 104.125% for the twelve-month period beginning on January 15, 2019, 102.063% for the twelve-month period beginning on January 15, 2020 and 100.000% for the twelve-month period beginning on January 15, 2021 and at any time thereafter, plus accrued and unpaid interest, if any, to the applicable redemption date of the Notes. In addition, prior to January 15, 2018, the Company may redeem the Notes in an aggregate principal amount equal to up to 40.0% of the original aggregate principal amount of the Notes with funds in an equal aggregate amount not exceeding the aggregate proceeds of one or more equity offerings, at a redemption price of 108.250%, plus accrued and unpaid interest, if any, to the applicable redemption date of the Notes.
On July 18, 2016, the Company entered into an agreement with the CD&R Funds to repurchase 2.9 million shares of our Common Stock at a price per share equal to the price per share paid by the underwriters to the CD&R Funds in the underwritten offering (the “2016 Stock Repurchase”). The 2016 Stock Repurchase, which was completed concurrently with the 2016 Secondary Offering (as defined below), represented a private, non-underwritten transaction between the Company and the CD&R Funds that was approved and recommended by the Affiliate Transactions Committee of our board of directors. Following completion of the 2016 Stock Repurchase, the Company canceled the shares repurchased from the CD&R Funds, resulting in a $45.0 million decrease in both additional paid in capital and treasury stock. The 2016 Stock Repurchase was funded by the Company’s cash on hand.
On July 25, 2016, the CD&R Funds completed a registered underwritten offering, in which the CD&R Funds offered 9.0 million shares of our Common Stock at a price to the public of $16.15 per share (the “2016 Secondary Offering”). The underwriters also exercised their option to purchase 1.35 million additional shares of our Common Stock from the CD&R Funds. The aggregate offering price for the 10.35 million shares sold in the 2016 Secondary Offering was approximately $160.1 million, net of underwriting discounts and commissions. The CD&R Funds received all of the proceeds from the 2016 Secondary Offering and no shares in the 2016 Secondary Offering were sold by the Company or any of its officers or directors (although certain of our directors are affiliated with the CD&R Funds). In connection with the 2016 Secondary
5
Offering and 2016 Stock Repurchase, we incurred approximately $0.7 million in expenses, which were included in engineering, selling, general and administrative expenses in the consolidated statements of operations for the fiscal year ended October 30, 2016.
Our principal offices are located at 10943 North Sam Houston Parkway West, Houston, Texas 77064, and our telephone number is (281) 897-7788.
We file annual, quarterly and current reports and other information with the Securities and Exchange Commission (the “SEC”). Our annual reports on Form 10-K, quarterly reports on Form 10-Q and current reports on Form 8-K, along with any amendments to those reports, are available free of charge at our corporate website at http://www.ncibuildingsystems.com as soon as practicable after such material is electronically filed with, or furnished to, the SEC. In addition, our website includes other items related to corporate governance matters, including our corporate governance guidelines, charters of various committees of our board of directors and the code of business conduct and ethics applicable to our employees, officers and directors. You may obtain copies of these documents, free of charge, from our corporate website. However, the information on our website is not incorporated by reference into this Form 10-K.
Operating Segments
Operating segments are defined as components of an enterprise that engage in business activities and by which discrete financial information is available that is evaluated on a regular basis by the chief operating decision maker to make decisions about how to allocate resources to the segment and assess the performance of the segment. We have three operating segments: engineered building systems; metal components; and metal coil coating. All operating segments operate primarily in the nonresidential construction market. Sales and earnings are influenced by general economic conditions, the level of nonresidential construction activity, metal roof repair and retrofit demand and the availability and terms of financing available for construction. Our operating segments are vertically integrated and benefit from using similar basic raw materials. The metal coil coating segment consists of cleaning, treating, painting and slitting continuous steel coils before the steel is fabricated for use by construction and industrial users. The metal components segment products include metal roof and wall panels, doors, metal partitions, metal trim, IMP products and other related accessories. The engineered building systems segment includes the manufacturing of main frames, Long Bay® Systems and value-added engineering and drafting, which are typically not part of metal components or metal coil coating products or services. The manufacturing and distribution activities of our segments are effectively coupled through the use of our nationwide hub-and-spoke manufacturing and distribution system, which supports and enhances our vertical integration. The operating segments follow the same accounting policies used for our consolidated financial statements.
We evaluate a segment’s performance based primarily upon operating income before corporate expenses. Intersegment sales are recorded based on standard material costs plus a standard markup to cover labor and overhead and consist of: (i) hot-rolled, light gauge painted, and slit material and other services provided by the metal coil coating segment to both the metal components and engineered building systems segments; (ii) building components provided by the metal components segment to the engineered building systems segment; and (iii) structural framing provided by the engineered building systems segment to the metal components segment.
Corporate assets consist primarily of cash but also include deferred financing costs, deferred taxes and property, plant and equipment associated with our headquarters in Houston, Texas. These items (and income and expenses related to these items) are not allocated to the operating segments. Corporate unallocated expenses include share-based compensation expenses, and executive, legal, finance, tax, treasury, human resources, information technology, purchasing, marketing and corporate travel expenses. Additional unallocated amounts include interest income, interest expense, debt extinguishment costs and other (expense) income.
Our total sales, external sales, operating income and total assets attributable to these operating segments were as follows for the fiscal years indicated (in thousands):
6
2016 | % | 2015 | % | 2014 | % | |||||||||||||||
Total sales: | ||||||||||||||||||||
Engineered building systems | $ | 672,235 | 39.9 | $ | 667,166 | 42.7 | $ | 669,843 | 48.9 | |||||||||||
Metal components | 1,044,040 | 62.0 | 920,845 | 58.9 | 694,858 | 50.7 | ||||||||||||||
Metal coil coating | 247,736 | 14.7 | 231,732 | 14.8 | 246,582 | 18.0 | ||||||||||||||
Intersegment sales | (279,083 | ) | (16.6 | ) | (256,050 | ) | (16.4 | ) | (240,743 | ) | (17.6 | ) | ||||||||
Total net sales | $ | 1,684,928 | 100.0 | $ | 1,563,693 | 100.0 | $ | 1,370,540 | 100.0 | |||||||||||
External sales: | ||||||||||||||||||||
Engineered building systems | $ | 652,471 | 38.7 | $ | 647,881 | 41.4 | $ | 649,344 | 47.4 | |||||||||||
Metal components | 925,863 | 55.0 | 815,310 | 52.1 | 607,594 | 44.3 | ||||||||||||||
Metal coil coating | 106,594 | 6.3 | 100,502 | 6.5 | 113,602 | 8.3 | ||||||||||||||
Total net sales | $ | 1,684,928 | 100.0 | $ | 1,563,693 | 100.0 | $ | 1,370,540 | 100.0 | |||||||||||
Operating income: | ||||||||||||||||||||
Engineered building systems | $ | 62,046 | $ | 51,410 | $ | 32,525 | ||||||||||||||
Metal components | 102,495 | 50,541 | 33,306 | |||||||||||||||||
Metal coil coating | 25,289 | 19,080 | 23,982 | |||||||||||||||||
Corporate | (81,051 | ) | (64,200 | ) | (64,717 | ) | ||||||||||||||
Total operating income | $ | 108,779 | $ | 56,831 | $ | 25,096 | ||||||||||||||
Unallocated other expense | (29,815 | ) | (30,041 | ) | (12,421 | ) | ||||||||||||||
Income before income taxes | $ | 78,964 | $ | 26,790 | $ | 12,675 | ||||||||||||||
Total assets: | ||||||||||||||||||||
Engineered building systems | $ | 229,422 | 21.7 | $ | 218,646 | 20.3 | $ | 209,281 | 27.6 | |||||||||||
Metal components | 654,534 | 61.9 | 654,762 | 60.6 | 365,874 | 48.2 | ||||||||||||||
Metal coil coating | 87,194 | 8.2 | 81,456 | 7.5 | 84,519 | 11.1 | ||||||||||||||
Corporate | 87,146 | 8.2 | 124,865 | 11.6 | 99,009 | 13.1 | ||||||||||||||
$ | 1,058,296 | 100.0 | $ | 1,079,729 | 100.0 | $ | 758,683 | 100.0 | ||||||||||||
Engineered Building Systems.
Products. Engineered building systems consist of engineered structural members and panels that are fabricated and roll-formed in a factory. These systems are custom designed and engineered to meet project requirements and then shipped to a construction site complete and ready for assembly with no additional field welding required. Engineered building systems manufacturers design an integrated system that meets applicable building code and designated end use requirements. These systems consist of primary structural framing, secondary structural members (purlins and girts) and metal roof and wall systems or conventional wall materials manufactured by others, such as masonry and concrete tilt-up panels.
Engineered building systems typically consist of three systems:
Primary structural framing. Primary structural framing, fabricated from heavy-gauge plate steel, supports the secondary structural framing, roof, walls and all externally applied loads. Through the primary framing, the force of all applied loads is structurally transferred to the foundation.
Secondary structural framing. Secondary structural framing is designed to strengthen the primary structural framing and efficiently transfer applied loads from the roof and walls to the primary structural framing. Secondary structural framing consists of medium-gauge, roll-formed steel components called purlins and girts. Purlins are attached to the primary frame to support the roof. Girts are attached to the primary frame to support the walls.
Metal roof and wall systems. Metal roof and wall systems not only lock out the weather but may also contribute to the structural integrity of the overall building system. Roof and wall panels are fabricated from light-gauge, roll-formed steel in many architectural configurations.
Accessory components complete the engineered building system. These components include doors, windows, specialty trims, gutters and interior partitions.
The following characteristics of engineered building systems distinguish them from other methods of construction:
7
Shorter construction time. In many instances, it takes less time to construct an engineered building than other building types. In addition, because most of the work is done in the factory, the likelihood of weather interruptions is reduced.
More efficient material utilization. The larger engineered building systems manufacturers use computer-aided analysis and design to fabricate structural members with high strength-to-weight ratios, minimizing raw materials costs.
Lower construction costs. The in-plant manufacture of engineered building systems, coupled with automation, allows the substitution of less expensive factory labor for much of the skilled on-site construction labor otherwise required for traditional building methods.
Greater ease of expansion. Engineered building systems can be modified quickly and economically before, during or after the building is completed to accommodate all types of expansion. Typically, an engineered building system can be expanded by removing the end or side walls, erecting new framework and adding matching wall and roof panels.
Lower maintenance costs. Unlike wood, metal is not susceptible to deterioration from cracking, rotting or insect damage. Furthermore, factory-applied roof and siding panel coatings resist cracking, peeling, chipping, chalking and fading.
Environmentally friendly. Our buildings utilize between 30% and 60% recycled content and our roofing and siding utilize painted surfaces with high reflectance and emissivity, which help conserve energy and operating costs.
Manufacturing. As of October 30, 2016, we operated 8 facilities for manufacturing and distributing engineered building systems throughout the United States and in Monterrey, Mexico.
After we receive an order, our engineers design the engineered building system to meet the customer’s requirements and to satisfy applicable building codes and zoning requirements. To expedite this process, we use computer-aided design and engineering systems to generate engineering and erection drawings and a bill of materials for the manufacture of the engineered building system. From time to time, depending on our volume, we outsource portions of our drafting requirements to third parties.
Once the specifications and designs of the customer’s project have been finalized, the manufacturing of frames and other building systems begins at one of our frame manufacturing facilities. Fabrication of the primary structural framing consists of a process in which steel plates are punched and sheared and then routed through an automatic welding machine and sent through further fitting and welding processes. The secondary structural framing and the covering system are roll-formed steel products that are manufactured at our full manufacturing facilities as well as our components plants.
Upon completion of the manufacturing process, structural framing members and metal roof and wall systems are shipped to the job site for assembly. Since on-site construction is performed by an unaffiliated, independent general contractor, usually one of our authorized builders, we generally are not responsible for claims by end users or owners attributable to faulty on-site construction. The time elapsed between our receipt of an order and shipment of a completed building system has typically ranged from six to twelve weeks, although delivery varies depending on engineering and drafting requirements and the length of the permitting process.
Sales, Marketing and Customers. We are one of the largest domestic suppliers of engineered building systems. We design, engineer, manufacture and market engineered building systems and self-storage building systems for all nonresidential markets including commercial, industrial, agricultural, governmental and community.
Throughout the twentieth century, the applications of metal buildings have significantly evolved from small, portable structures that prospered during World War II into fully customizable building solutions spanning virtually every commercial low-rise end-use market.
We believe the cost of an engineered building system, excluding the cost of the land, generally represents approximately 15% to 20% of the total cost of constructing a building, which includes such elements as labor, plumbing, electricity, heating and air conditioning systems, installation and interior finish. Technological advances in products and materials, as well as significant improvements in engineering and design techniques, have led to the development of structural systems that are compatible with more traditional construction materials. Architects and designers now often combine an engineered building system with masonry, concrete, glass and wood exterior facades to meet the aesthetic requirements of end users while preserving the inherent characteristics of engineered building systems. As a result, the uses for engineered building systems now include office buildings, showrooms, retail shopping centers, banks, schools, places of worship, warehouses, factories, distribution centers, government buildings and community centers for which aesthetics and architectural features are important considerations of the end users. In addition, advances in our products such as insulated steel panel systems for roof and wall applications give buildings the desired balance of strength, thermal efficiency and aesthetic attractiveness.
8
We sell engineered building systems to builders, general contractors, developers and end users nationwide under the brand names “Metallic,” “Mid-West Steel,” “A & S,” “All American,” “Mesco,” “Star,” “Ceco,” “Robertson,” “Garco,” “Heritage” and “SteelBuilding.com.” We market engineered building systems through an in-house sales force to authorized builder networks of approximately 3,200 builders. We also sell engineered building systems via direct sale to owners and end users as well as through private label companies. In addition to a traditional business-to-business channel, we sell small custom-engineered metal buildings through two other consumer-oriented marketing channels targeting end-use purchasers and small general contractors. We sell through Heritage Building Systems (“Heritage”), which is a direct-response, phone-based sales organization, and Steelbuilding.com, which allows customers to design, price and buy small metal buildings online. During fiscal 2016, our largest customer for engineered building systems accounted for less than 1% of our total consolidated sales and external sales of our engineered building systems segment accounted for 38.7% of total consolidated sales for the fiscal year.
The majority of our sales of engineered building systems are made through our authorized builder networks. We enter into an authorized builder agreement with independent general contractors that market our products and services to users. These agreements generally grant the builder the non-exclusive right to market our products in a specified territory. Generally, the agreement is cancelable by either party with between 30 and 60 days’ notice. The agreement does not prohibit the builder from marketing engineered building systems of other manufacturers. In some cases, we may defray a portion of the builder’s advertising costs and provide volume purchasing and other pricing incentives to encourage those businesses to deal exclusively or principally with us. The builder is required to maintain a place of business in its designated territory, provide a sales organization, conduct periodic advertising programs and perform construction, warranty and other services for customers and potential customers. An authorized builder usually is hired by an end-user to erect an engineered building system on the customer’s site and provide general contracting, subcontracting and/or other services related to the completion of the project. We sell our products to the builder, which generally includes the price of the building as a part of its overall construction contract with its customer. We rely upon maintaining a satisfactory business relationship for continuing job orders from our authorized builders.
Metal Components.
Products. Metal components include metal roof and wall systems, metal partitions, metal trim, doors and other related accessories. These products are used in new construction and in repair and retrofit applications for industrial, commercial, institutional, agricultural and rural uses. Metal components are used in a wide variety of construction applications, including purlins and girts, roofing, standing seam roofing, walls, doors, trim and other parts of traditional buildings, as well as in architectural applications and engineered building systems. Although precise market data is limited, we estimate the metal components market, including roofing applications, to be a multi-billion dollar market. We believe that metal products have gained and continue to gain a greater share of new construction and repair and retrofit markets due to increasing acceptance and recognition of the benefits of metal products in building applications.
Our metal components consist of individual components, including secondary structural framing, metal roof and wall systems and associated metal trims. We sell directly to contractors or end users for use in the building industry, including the construction of metal buildings. We also stock and market metal component parts for use in the maintenance and repair of existing buildings. Specific component products we manufacture include metal roof and wall systems, purlins, girts, partitions, header panels and related trim and screws. We are continually developing and marketing new products such as our Soundwall™, Nu-Roof™ system and Energy Star cool roofing. We believe we offer the widest selection of metal components in the building industry. We custom produce purlins and girts for our customers and offer one of the widest selections of sizes and profiles in the United States. Metal roof and wall systems protect the rest of the structure and the contents of the building from the weather. They may also contribute to the structural integrity of the building.
Metal roofing systems have several advantages over conventional roofing systems, including the following:
Lower life cycle cost. The total cost over the life of metal roofing systems is lower than that of conventional roofing systems for both new construction and retrofit roofing. For new construction, the cost of installing metal roofing is greater than the cost of conventional roofing. However, the longer life and lower maintenance costs of metal roofing make the cost more attractive. For retrofit roofing, although installation costs are higher for metal roofing due to the need for a sloping support system, over time the lower ongoing costs more than offset the initial cost.
Increased longevity. Metal roofing systems generally last for a minimum of 20 years without requiring major maintenance or replacement. This compares to five to ten years for conventional roofs. The cost of leaks and roof failures associated with conventional roofing can be very high, including damage to building interiors and disruption of the functional usefulness of the building. Metal roofing prolongs the intervals between costly and time-consuming repair work.
9
Attractive aesthetics and design flexibility. Metal roofing systems allow architects and builders to integrate colors and geometric design into the roofing of new and existing buildings, providing an increasingly fashionable means of enhancing a building’s aesthetics. Conventional roofing material is generally tar paper or a gravel surface, and building designers tend to conceal roofs made with these materials.
Our metal roofing products are attractive and durable. We use standing seam roof technology to replace traditional built-up and single-ply roofs as well as to provide a distinctive look to new construction.
Manufacturing. As of October 30, 2016, we operated 27 facilities (25 in the United States, 1 in Canada and 1 in China) to manufacture metal components for the nonresidential construction industry, including 3 facilities for our door operations and 9 facilities for our IMP products.
Metal component products are roll-formed or fabricated at each plant using roll-formers and other metal working equipment. In roll-forming, pre-finished coils of steel are unwound and passed through a series of progressive forming rolls that form the steel into various profiles of medium-gauge structural shapes and light-gauge roof and wall panels.
Sales, Marketing and Customers. We are one of the largest domestic suppliers of metal components to the nonresidential building industry. We design, manufacture, sell and distribute one of the widest selections of components for a variety of new construction applications as well as for repair and retrofit uses.
We manufacture and design metal roofing systems for sales to regional metal building manufacturers, general contractors and subcontractors. We believe we have the broadest line of standing seam roofing products in the building industry. In addition, we have granted 21 non-exclusive, on-going license agreements to 18 companies, both domestic and international, relating to our standing seam roof technology.
These licenses, for a fee, are provided with MBCI’s technical know-how relating to the marketing, sales, testing, engineering, estimating, manufacture and installation of the licensed product. The licensees buy their own roll forming equipment to manufacture the roof panels and typically buy accessories for the licensed roof system from MBCI.
We estimate that metal roofing currently accounts for less than 10% of total roofing material volume. However, metal roofing accounts for a significant portion of the overall metal components market. As a result, we believe that significant opportunities exist for metal roofing, with its advantages over conventional roofing materials, to increase its overall share of this market.
One of our strategic objectives and a major part of our “green” initiative is to expand our IMP product lines, which are increasingly desirable because of their energy efficiency, noise reduction and aesthetic qualities. Our IMP product line manufacturing facilities in the United States, Canada and China provide the nonresidential building products market with cost-effective and energy efficient insulated metal wall and roof panels.
Our “green” initiative enables us to capitalize on increasing consumer preferences for environmentally-friendly construction. We believe this will allow us to further service the needs of our existing customer base and to gain new customers.
We sell metal components directly to regional manufacturers, contractors, subcontractors, distributors, lumberyards, cooperative buying groups and other customers under the brand names “MBCI”, “American Building Components” (“ABC”), “Eco-ficient”, “Metl-Span”, “CENTRIA” and “Metal Depots.” In addition to metal roofing systems, we manufacture roll-up doors and sell interior and exterior walk doors for use in the self-storage industry and metal and other buildings. Roll-up doors, interior and exterior doors, interior partitions and walls, header panels and trim are sold directly to contractors and other customers under the brand “Doors and Buildings Components” (“DBCI”). These components also are produced for integration into self-storage and engineered building systems sold by us. In addition to a traditional business-to-business channel, we sell components through Metal Depots, which has eight retail stores throughout the United States and specifically targets end-use consumers and small general contractors.
We market our components products primarily within six market segments: commercial/industrial, architectural, standing seam roof systems, agricultural, residential and cold storage. In addition, our IMP product lines service each of our six market segments. Customers include small, medium and large contractors, specialty roofers, regional fabricators, regional engineered building fabricators, post frame contractors, material resellers and end users. Commercial and industrial businesses, including self-storage, are heavy users of metal components and metal buildings systems. Standing seam roof and architectural customers have emerged as an important part of our customer base. As metal buildings become a more acceptable building alternative and aesthetics become an increasingly important consideration for end users of metal buildings, we believe that architects will participate more in the design and purchase decisions and will use metal components to a greater extent. Wood frame builders also purchase our metal components through distributors, lumberyards, cooperative buying groups and chain stores for various uses, including agricultural buildings.
10
Our metal components sales operations are organized into geographic regions. Each region is headed by a general sales manager supported by individual regional sales managers. Each local sales office is staffed by a direct sales force responsible for contacting customers and architects and a sales coordinator who supervises the sales process from the time the order is received until it is shipped and invoiced. The regional and local focus of our customers requires extensive knowledge of local business conditions. During fiscal 2016, our largest customer for metal components accounted for approximately 1% of our total consolidated sales and external sales of our metal components segment accounted for 55.0% of total consolidated sales for the fiscal year.
Metal Coil Coating.
Products. Metal coil coating consists of cleaning, treating and painting various flat-rolled metals, in coil form, as well as slitting and/or embossing the metal, before the metal is fabricated for use by various industrial users. Light gauge and heavy gauge metal coils that are painted, either for decorative or corrosion protection purposes, are utilized in the building industry by manufacturers of metal components and engineered building systems. In addition, these painted metal coils are utilized by manufacturers of other products, such as water heaters, lighting fixtures, ceiling grids, HVAC and appliances. We clean, treat and coat both heavy gauge (hot-rolled) and light gauge metal coils for our other operating segments and for third party customers, who utilize them in a variety of applications, including construction products, heating and air conditioning systems, water heaters, lighting fixtures, ceiling grids, office furniture, appliances and other products. We provide toll coating services under which the customer provides the metal coil and we provide only the coil coating process. We also provide a painted metal package under which we sell both the metal coil and the coil coating service together.
We believe that pre-painted metal coils provide manufacturers with a higher quality, environmentally cleaner and more cost-effective solution to operating their own in-house painting operations. Pre-painted metal coils also offer manufacturers the opportunity to produce a broader and more aesthetically pleasing range of products.
Manufacturing. As of October 30, 2016, we operated 6 metal coil coating facilities located in the United States. Two of our facilities coat hot-rolled, heavy gauge metal coils and four of our facilities coat light gauge metal coils.
Our coil coating processes have multiple stages. In the first stage, the metal surface is cleaned and a chemical pretreatment is applied. The pretreatment is designed to promote adhesion of the paint system and enhance the corrosion resistance of the metal. After the pretreatment stage, a paint system is roll-applied to the metal surface, then baked at a high temperature to cure the coating and achieve a set of physical properties that not only make the metal more attractive, but also allows it to be formed into a manufactured product, all while maintaining the integrity of the paint system so that it can endure the final end use requirements. After the coating system has been cured, the metal substrate is rewound into a finished metal coil and packaged for shipment. Slitting and embossing processes can also be performed on the finished coil in accordance with customer specifications, prior to shipment.
Sales, Marketing and Customers. We process metal coils to supply substantially all the coating requirements of our own metal components and engineered building systems operating segments. We also process metal coils to supply external customers in a number of different industries.
We market our metal coil coating products and processes under the brand names “Metal Coaters” and “Metal Prep”. Each of our metal coil coating facilities has an independent sales staff.
We sell our products and processes principally to original equipment manufacturer customers who utilize pre-painted metal, including other manufacturers of engineered building systems and metal components. Our customer base also includes steel mills, metal service centers and painted coil distributors who in-turn supply various manufacturers of engineered building systems, metal components, lighting fixtures, ceiling grids, water heaters, appliances and other manufactured products. During fiscal 2016, the largest customer of our metal coil coating segment accounted for less than 2% of our total consolidated sales and external sales of our metal coil coating segment represented 6.3% of total consolidated sales for the fiscal year.
Business Strategy
We intend to expand our business, enhance our market position and increase our sales and profitability by focusing on the implementation of a number of key initiatives that we believe will help us grow and reduce costs. Our current strategy focuses primarily on organic initiatives, but also considers the use of opportunistic acquisitions to achieve our growth objectives:
• | Corporate-Wide Initiatives. We will continue our focus on leveraging technology, automation and supply chain efficiencies to be one of the lowest cost producers, reduce ESG&A expenses and improve plant utilization through expanded use of our integrated business model and facility re-alignment. To further distinguish the value of our products and services, our manufacturing platform has been reorganized into a single, integrated organization, to rapidly incorporate the benefits of lean manufacturing best practices and efficiencies across all of our facilities. |
11
• | Engineered Building Systems Segment. We intend to enhance the performance of our differentiated brands by aligning our operations to achieve the best total value building solution, delivered complete and on-time, every time. We are focused on providing industry leading cycle times, service and quality, while improving customer satisfaction. |
• | Metal Components Segment. We intend to maintain our leading positions in these markets and seek opportunities to profitably expand our customer base by providing industry leading customer service. In addition, we intend to drive increased IMP sales through all commercial channels. |
• | Metal Coil Coating Segment. Through diversification of our external customer base and national footprint, we plan to grow non-construction sales as a supply chain partner to national manufacturers. We will continue to leverage efficiency improvements to be one of the lowest cost producers. |
Restructuring
We have developed plans to improve cost efficiency and optimize our combined manufacturing plant footprint considering our recent acquisitions and restructuring efforts. During the fiscal year ended October 30, 2016, we incurred severance related charges of $3.6 million associated with restructuring actions, including $1.0 million and $1.7 million in our engineered building systems segment and metal components segment, respectively, and the remaining amount of $0.9 million at corporate. These charges included severance related costs associated with the consolidation and closing of two manufacturing facilities in our metal components segment during fiscal 2016. We also incurred approximately $0.6 million of other costs associated with restructuring actions during fiscal 2016.
The Company believes that the successful execution of these plans in phases over the next 24 months will result in annual cost savings ranging between $30.0 million and $40.0 million when completed, of which between approximately $18.0 million and $28.0 million represents the aggregate expected incremental cost savings to be realized in fiscal years 2017 and 2018. We are currently unable to make a good faith determination of cost estimates, or range of cost estimates, for actions associated with these plans. Restructuring charges will be recorded for these plans as they become estimable and probable.
Raw Materials
The principal raw material used in manufacturing of our metal components and engineered building systems is steel which we purchase from multiple steel producers. Our various products are fabricated from steel produced by mills including bars, plates, structural shapes, hot-rolled coils and galvanized or Galvalume®-coated coils (Galvalume® is a registered trademark of BIEC International, Inc.).
Our raw materials on hand increased to $145.1 million at October 30, 2016 from $109.5 million at November 1, 2015 due to rising input costs and to support higher levels of business activity in fiscal 2016.
The price and supply of steel impacts our business. The steel industry is highly cyclical in nature, and steel prices have been volatile in recent years and may remain volatile in the future. Steel prices are influenced by numerous factors beyond our control, including general economic conditions domestically and internationally, currency fluctuations, the availability of raw materials, competition, labor costs, freight and transportation costs, production costs, import duties and other trade restrictions. We believe the CRU North American Steel Price Index, published by the CRU Group since 1994, reasonably depicts the volatility we have experienced in steel prices. See “Item 7A. Quantitative and Qualitative Disclosures About Market Risk — Steel Prices.” During fiscal 2016 and 2015, steel prices fluctuated due to market conditions ranging from a low point of 113 to a high point of 174 on the CRU Index in fiscal 2016 and from a low point of 127 to a high point of 174 on the CRU Index in fiscal 2015. Based on the cyclical nature of the steel industry, we expect steel prices will continue to be volatile.
Although we have the ability to purchase steel from a number of suppliers, a production cutback by one or more of our current suppliers could create challenges in meeting delivery schedules to our customers. Because we have periodically adjusted our contract prices, particularly in the engineered building systems segment, we have generally been able to pass increases in our raw material costs through to our customers. We normally do not maintain an inventory of steel in excess of our current production requirements. However, from time to time, we may purchase steel in advance of announced steel price increases. For additional information about the risks of our raw material supply and pricing, see “Item 1A. Risk Factors.”
Backlog
At October 30, 2016 and November 1, 2015, the total backlog of orders, primarily consisting of engineered building systems’ orders, for our products we believe to be firm was $515.8 million and $496.1 million, respectively. Job orders included in backlog are generally cancellable by customers at any time for any reason; however, cancellation charges may be assessed. Occasionally, orders in the backlog are not completed and shipped for reasons that include changes in the requirements of the customers and the inability of customers to obtain necessary financing or zoning variances. We anticipate that less than 19% of this backlog will extend beyond one year.
12
Competition
We and other manufacturers of metal components and engineered building systems compete in the building industry with all other alternative methods of building construction such as tilt-wall, concrete and wood, single-ply and built up, all of which may be perceived as more traditional, more aesthetically pleasing or having other advantages over our products. We compete with all manufacturers of building products, from small local firms to large national firms.
In addition, competition in the metal components and engineered building systems market of the building industry is intense. We believe it is based primarily on:
• | quality; |
• | service; |
• | on-time delivery; |
• | ability to provide added value in the design and engineering of buildings; |
• | price; |
• | speed of construction; and |
• | personal relationships with customers. |
We compete with a number of other manufacturers of metal components and engineered building systems for the building industry, ranging from small local firms to large national firms. Many of these competitors operate on a regional basis. We have two primary nationwide competitors in the engineered building systems market and three primary nationwide competitors in the metal components market. However, the metal components market is more fragmented than the engineered building systems market.
As of October 30, 2016, we operated 41 manufacturing facilities located in the United States, Mexico, Canada and China, with additional sales and distribution offices throughout the United States and Canada. These facilities are used primarily for the manufacturing of metal components and engineered building systems for the building industry. We believe this broad geographic distribution gives us an advantage over our metal components and engineered building systems competitors because major elements of a customer’s decision are the speed and cost of delivery from the manufacturing facility to the product’s ultimate destination. We operate a fleet of trucks to deliver our products to our customers in a more timely manner than most of our competitors.
We compete with a number of other providers of metal coil coating services to manufacturers of metal components and engineered building systems for the building industry, ranging from small local firms to large national firms. Most of these competitors operate on a regional basis. Competition in the metal coil coating industry is intense and is based primarily on quality, service, delivery and price.
Consolidation
Over the last several years, there has been a consolidation of competitors within the industries of the engineered building systems, metal components and metal coil coating segments, which include many small local and regional firms. We believe that these industries will continue to consolidate, driven by the needs of manufacturers to increase anticipated long-term manufacturing capacity, achieve greater process integration, add geographic diversity to meet customers’ product and delivery needs, improve production efficiency and manage costs. When beneficial to our long-term goals and strategy, we have sought to consolidate our business operations with other companies. The resulting synergies from these consolidation efforts have allowed us to reduce costs while continuing to serve our customers’ needs. For more information, see “Acquisitions” below.
In addition to the consolidation of competitors within the industries of the engineered building systems, metal components and metal coil coating segments, in recent years there has been consolidation between those industries and steel producers. Several of our competitors have been acquired by steel producers, and further similar acquisitions are possible. For a discussion of the possible effects on us of such consolidations, see “Item 1A. Risk Factors.”
Acquisitions
We have a history of making acquisitions within our industry, and we regularly evaluate growth opportunities both through acquisitions and internal investment. We believe that there remain opportunities for growth through consolidation in the metal buildings and components segments, and our goal is to continue to grow organically and through opportunistic strategic acquisitions.
13
Consistent with our growth strategy, we frequently engage in discussions with potential sellers regarding the possible purchase by us of businesses, assets and operations that are strategic and complementary to our existing operations. Such assets and operations include engineered building systems and metal components, but may also include assets that are closely related to, or intertwined with, these business lines, and enable us to leverage our asset base, knowledge base and skill sets. Such acquisition efforts may involve participation by us in processes that have been made public, involve a number of potential buyers and are commonly referred to as “auction” processes, as well as situations in which we believe we are the only party or one of the very limited number of potential buyers in negotiations with the potential seller. These acquisition efforts often involve assets that, if acquired, would have a material effect on our financial condition and results of operations.
We also evaluate from time to time possible dispositions of assets or businesses when such assets or businesses are no longer core to our operations and do not fit into our long-term strategy.
The Credit Agreement and the Notes contain a number of covenants that, among other things, limit or restrict the ability of the Company and its subsidiaries to dispose of assets, make acquisitions and engage in mergers. See “Item 7. Management’s Discussion and Analysis of Financial Condition and Results of Operations — Liquidity and Capital Resources — Debt.”
Environmental Matters
The operation of our business is subject to stringent and complex laws and regulations pertaining to health, safety and the environment. As an owner or operator of manufacturing facilities, we must comply with these laws and regulations at the federal, state and local levels. These laws and regulations can restrict or impact our business activities in many ways, such as:
• | requiring investigative or remedial action to mitigate or control certain environmental conditions that may have been caused by our operations or practices, or historically caused by former owners or operators at properties we have acquired; or |
• | enjoining or restricting the operations of facilities found to be out of compliance with environmental laws and regulations, permits or other legal authorizations issued pursuant to such laws or regulations. |
The trend in environmental regulation is to place more restrictions and requirements on activities that potentially impact human health and welfare or the environment. As a result, there can be no assurance as to the amount or timing of future expenditures for environmental compliance or corrective action, and actual future expenditures may differ from what we presently anticipate. However, we strategically anticipate future regulatory requirements that might be imposed and plan accordingly to meet and maintain compliance with such environmental laws and regulations. We do so with the goal of minimizing the associated costs of compliance while not intruding on our ability to comply.
Failure to comply with environmental laws and regulations may trigger a variety of administrative, civil or criminal enforcement measures, including the assessment of monetary penalties, the imposition of investigative or remedial requirements, the issuance of orders enjoining or limiting current or future operations, or the denial or revocation of permits or other legal authorizations. Certain environmental statutes impose strict, joint and several liability for costs required to clean up and restore sites where hazardous substances or industrial wastes have been mismanaged or otherwise released. Moreover, neighboring landowners or other third parties may file claims for personal injury and property damage allegedly caused by the release of substances or contaminants into the environment.
We do not believe that compliance with federal, state or local environmental laws and regulations will have a material adverse effect on our business, financial position or results of operations. In addition, we believe that the various environmental compliance activities we are presently engaged in are not expected to materially interrupt or diminish our operational ability to manufacture our products. We cannot assure, however, that future events, such as changes in existing laws, the promulgation of new laws, or the development or discovery of new facts or conditions related to our operations will not cause us to incur significant costs.
The following are representative environmental and safety requirements relating to our business:
Air Emissions. Our operations are subject to the federal Clean Air Act Amendments of 1990, or CAAA, and comparable state laws and regulations. These laws and regulations govern emissions of air pollutants from industrial stationary sources (including our manufacturing facilities) and impose various permitting, monitoring, record keeping and reporting requirements. Such laws and regulations may require us to: obtain pre-approval for the construction or modification of applicable projects or facility changes that have the potential to produce new or increased air emissions; obtain and comply with operating permits that limit air emissions or certain operational parameters; or employ best available emission control technologies to minimize or destruct emissions from our facilities.
Our failure to comply with these requirements could subject us to monetary penalties, injunctions, restrictions on operations, and potential administrative, civil or criminal enforcement actions. We may be required to incur certain capital
14
expenditures in the future for air pollution control equipment in conjunction with obtaining and complying with pre-construction authorizations or operating permits for air emissions. We do not believe that our operations will be materially adversely affected by such requirements.
Greenhouse Gases. More stringent laws and regulations relating to climate change and greenhouse gases, or GHGs, may be adopted in the future and could cause us to incur additional operating costs or reduced demand for our products. On December 15, 2009, the federal Environmental Protection Agency, or EPA, published its findings that emissions of carbon dioxide, methane, and other GHGs present an endangerment to public health, the economy and the environment because emissions of such gases contribute to the warming of the earth’s atmosphere and other climate changes. These findings allowed the EPA to adopt and implement regulations that would restrict emissions of GHGs under existing provisions of the federal CAAA.
The EPA adopted regulations that would require a reduction in emissions of GHGs and could trigger permit review for GHGs produced from certain industrial stationary sources. In June 2010, the EPA adopted the Prevention of Significant Deterioration (“PSD”) and Title V Greenhouse Gas Tailoring Rule, which phases in permitting requirements for stationary sources of GHGs beginning January 2, 2011. This rule “tailors” these permitting programs to apply to certain significant stationary sources of GHG emissions in using a multistep process, with the largest sources first subjected to permitting. In June 2014, the Supreme Court restricted applicability of the Tailoring Rule to GHG-emitting stationary sources that also emit conventional non-GHG National Ambient Air Quality Standard criteria pollutants at levels greater than PSD and Title V threshold amounts.
Several North American state and multi-state climate change initiatives are either actively assessing, or have already implemented, measures to reduce GHG emissions, primarily through the development of emission source performance standards, GHG tracking systems and GHG emission cap-and-trade programs. These programs typically require major sources of GHGs to acquire and surrender emission allowances and offsets, with the number of allowances available for purchase incrementally reduced each year until an overall GHG emission reduction goal is achieved.
In October 2011, the California Air Resources Board adopted a cap-and-trade program that will require the state to reduce GHG emissions to 1990-levels by 2020. This program, along with mandatory GHG reporting and other complementary measures, was authorized by the California Global Warming Solutions Act (AB 32) of 2006. Effective January 1, 2013, cap-and-trade regulations applied to all major industrial sources and electricity generators, and expanded in 2015 to cover the distributors of transportation fuels, natural gas and other fuels. The amount of allowances available to these sources is set to decline by about three percent each year through 2020 as the cap is lowered and emissions are reduced.
Although it is not possible to accurately predict how new GHG legislation or regulations would impact our business, any new federal, regional or state restrictions on emissions of carbon dioxide or other GHGs that may be imposed in areas where we conduct business could result in increased compliance costs or additional operating restrictions on our facilities, raw material and energy suppliers, the transportation and distribution of our products, and our customers. Such restrictions could potentially make our products more expensive and thus reduce their demand, which could have a material adverse effect on our business.
Hazardous and Solid Industrial Waste. Our operations generate industrial solid wastes, including some hazardous wastes that are subject to the federal Resource Conservation and Recovery Act, or RCRA, and comparable state laws. RCRA imposes requirements for the handling, storage, treatment and disposal of hazardous waste. Industrial waste we generate, such as paint waste, spent solvents and used oils, may be regulated as hazardous waste, although RCRA has provisions to exempt some of our waste from classification as hazardous waste. However, our non-hazardous or exempted industrial waste is still regulated under state law or the less stringent industrial solid waste requirements of RCRA. We do not believe that our operations will be materially adversely affected by such requirements.
Site Remediation. The Comprehensive Environmental Response, Compensation and Liability Act of 1980, as amended, or CERCLA, and comparable state laws impose liability, without regard to fault or the legality of the original conduct, on certain classes of persons responsible for the release of hazardous substances into the environment. Such classes of persons include the current and past owners or operators of sites where a hazardous substance was released, and companies that disposed or arranged for disposal of hazardous substances at off-site locations such as landfills. In the course of our typical operations, we use materials and generate industrial solid wastes that fall within the definition of a “hazardous substance.”
CERCLA authorizes the EPA and, in some cases, third parties to take actions in response to threats to the public health and welfare or the environment and seek to recover from the responsible parties the costs incurred for remedial activities or other corrective actions. Under CERCLA, we could be subject to joint and several liability for: the full or partial costs of cleaning up and restoring sites where hazardous substances historically generated by us have been released; damages to natural resources; and the costs of risk assessment studies and containment measures.
15
We currently own or lease, and have in the past owned or leased, numerous properties that for many decades have been used for industrial manufacturing operations. Hazardous substances or industrial wastes may have been mismanaged, disposed of or released on or under the properties owned or leased by us, or on or under other locations where such wastes have been transported for disposal. In addition, some of these properties have been operated by third parties or previous owners whose management, release or disposal of hazardous substances or wastes were not under our control. These properties and the substances disposed or released on them may be subject to CERCLA, RCRA and analogous state laws.
Under such laws, we could be required to remove hazardous substances or previously disposed of industrial wastes (including wastes disposed by prior owners or operators); to investigate or remediate contaminated property (including contaminated soil and groundwater, whether from prior owners or operators or other historic activities or releases); or perform remedial closure activities to control or prevent future contamination. Moreover, neighboring landowners and other affected parties may file claims for personal injury and property damage allegedly caused by the release of hazardous substances into the environment.
Wastewater Discharges. Our operations are subject to the federal Water Pollution Control Act of 1972, as amended, also known as the Clean Water Act (“CWA”) and analogous state laws and regulations. These laws and regulations impose requirements and strict controls regarding the discharge of pollutants from industrial activity into waters of the United States. Such laws and regulations may require that we obtain and comply with categorical industrial waste water standards and pretreatment or discharge permits containing limits on various water pollutant and discharge parameters.
The Clean Water Rule, a rule jointly developed by the EPA and the U.S. Army Corps of Engineers that further defines the term “waters of the United States” for regulatory protection by the CWA through the addition of certain classes and categories of waters such as smaller streams, tributaries and wetlands, became effective on August 28, 2015. This rule could subject our facilities to new or more stringent water permitting requirements.
Our failure to comply with CWA requirements could subject us to monetary penalties, injunctions, restrictions on operations, and potential, administrative, civil or criminal enforcement actions. We may be required to incur certain capital expenditures in the future for wastewater discharge or storm water runoff treatment technology in connection with maintaining compliance with wastewater permits and water quality standards. Any unauthorized release of pollutants to waters of the United States from our facilities could result in administrative, civil or criminal penalties as well as associated corrective action obligations. We do not believe that our operations will be materially adversely affected by these requirements.
Employee Health and Safety. We are subject to the requirements of the Occupational Safety and Health Act, or OSHA, and comparable state laws that regulate the protection of the health and safety of our workers. In addition, the OSHA hazard communication standard requires that information about hazardous materials used or produced by our operations be maintained and is available to our employees, state and local government authorities, and citizens. We do not expect that our operations will be materially adversely affected by these requirements.
Zoning and Building Code Requirements
The engineered building systems and components we manufacture must meet zoning, building code and uplift requirements adopted by local governmental agencies. We believe that our products are in substantial compliance with applicable zoning, code and uplift requirements. Compliance does not have a material adverse effect on our business.
Patents, Licenses and Proprietary Rights
We have a number of United States patents, pending patent applications and other proprietary rights, including those relating to metal roofing systems, metal overhead doors, our pier and header system, our Long Bay® System and our building estimating and design system. The patents on our Long Bay® System expire in 2021. We also have several registered trademarks and pending registrations in the United States.
Research and Development Costs
Total expenditures for research and development were $3.7 million, $2.7 million and $1.6 million for fiscal years 2016, 2015 and 2014, respectively. We incur research and development costs to develop new products, improve existing products and improve safety factors of our products in the metal components segment. These products include building and roofing systems, insulated panels, clips, purlins and fasteners.
Employees
As of October 30, 2016, we have approximately 5,500 employees, of whom approximately 4,100 are manufacturing and engineering personnel. We regard our employee relations as satisfactory. Approximately 14% of our workforce, including the employees at our subsidiary in Mexico, are represented by a collective bargaining agreement or union.
16
Item 1A. Risk Factors.
Our industry is cyclical and highly sensitive to macroeconomic conditions. Our industry is currently experiencing a prolonged downturn which, if sustained, will materially and adversely affect the outlook for our business, liquidity and results of operations.
The nonresidential construction industry is highly sensitive to national and regional macroeconomic conditions. The United States and global economies are currently undergoing a period of slowdown and unprecedented volatility, which is having an adverse effect on our business.
Current market estimates continue to show uneven activity across the nonresidential construction markets. According to Dodge, low-rise nonresidential construction starts, as measured in square feet and comprising buildings of up to five stories, were down as much as approximately 8% in our fiscal 2016 as compared to our fiscal 2015. However, Dodge typically revises initial reported figures, and we expect this metric will be revised upwards over time. Leading indicators for low-rise, nonresidential construction activity indicate positive momentum into fiscal 2017.
The leading indicators that we follow and that typically have the most meaningful correlation to nonresidential low-rise construction starts are the AIA Architecture Mixed Use Index, Dodge Residential single family starts and the LEI. Historically, there has been a very high correlation to the Dodge low-rise nonresidential starts when the three leading indicators are combined and then seasonally adjusted. The combined forward projection of these metrics, based on a 9 to 14-month historical lag for each metric, indicates low single digit growth for new low-rise nonresidential construction starts in fiscal 2017, with the majority of that growth occurring in the second half of our fiscal year.
However, continued uncertainty about current economic conditions has had a negative effect on our business, and will continue to pose a risk to our business as our customers may postpone spending in response to tighter credit, negative financial news and/or declines in income or asset values, which could have a material negative effect on the demand for our products. Other factors that could influence demand include fuel and other energy costs, conditions in the nonresidential real estate markets, labor and healthcare costs, access to credit and other macroeconomic factors. From time to time, our industry has also been adversely affected in various parts of the country by declines in nonresidential construction starts, including but not limited to, high vacancy rates, changes in tax laws affecting the real estate industry, high interest rates and the unavailability of financing. Sales of our products may be adversely affected by continued weakness in demand for our products within particular customer groups, or a continued decline in the general construction industry or particular geographic regions. These and other economic factors could have a material adverse effect on demand for our products and on our financial condition and operating results.
We cannot predict the timing or severity of any future economic or industry downturns. A prolonged economic downturn, particularly in states where many of our sales are made, would have a material adverse effect on our results of operations and financial condition, including potential asset impairments.
The ongoing uncertainty and volatility in the financial markets and the state of the worldwide economic recovery may adversely affect our operating results.
The markets in which we compete are sensitive to general business and economic conditions in the United States and worldwide, including availability of credit, interest rates, fluctuations in capital, credit and mortgage markets and business and consumer confidence. Additionally, political issues in the United States resulting in discord, conflict or lack of compromise between the legislative and executive branches of the U.S. government may affect the national debt, debt ceiling limit or federal government budget, which could in turn adversely affect our results of operations. Adverse developments in global financial markets and general business and economic conditions, including through recession, downturn or otherwise, could have a material adverse effect on our business, financial condition, results of operations and cash flows, including our ability and the ability of our customers and suppliers to access capital. There was a significant decline in economic growth, both in the United States and worldwide, that began in the second half of 2007 and continued through 2009. In addition, volatility and disruption in the capital markets during that period reached unprecedented levels, with stock markets falling dramatically and credit becoming very expensive or unavailable to many companies without regard to those companies’ underlying financial strength. Although there have been some indications of stabilization in the general economy and certain industries and markets in which we operate, there can be no guarantee that any improvement in these areas will continue or be sustained.
Global financial markets continue to experience disruptions, including increased volatility, and diminished liquidity and credit availability. In recent years, certain Euro Zone countries have faced uncertainty regarding their ability to service their sovereign debt, which in turn created volatility in the global capital markets. If global economic and market conditions, or economic conditions in Europe, the U.S. or other key markets, remain uncertain, persist, or deteriorate further, our customers may respond by suspending, delaying or reducing their purchases of our metal products, which may adversely affect our cash flows and results of operations.
17
Regulation from the Dodd-Frank Wall Street Reform and Consumer Protection Act (the “Dodd-Frank Act”) could adversely affect our business or financial results.
Changes in regulatory requirements, such as the reporting requirements relating to conflict minerals originating in the Democratic Republic of Congo or adjoining countries included in the Dodd-Frank Act, or evolving interpretations of existing regulatory requirements, may result in increased compliance cost, capital expenditures and other financial obligations that could adversely affect our business or financial results.
Our business may be impacted by external factors that we may not be able to control.
War, civil conflict, terrorism, natural disasters and public health issues including domestic or international pandemic have caused and could cause damage or disruption to domestic or international commerce by creating economic or political uncertainties. Additionally, any volatility in the financial markets could negatively impact our business. These events could result in a decrease in demand for our products, make it difficult or impossible to deliver orders to customers or receive materials from suppliers, affect the availability or pricing of energy sources or result in other severe consequences that may or may not be predictable. As a result, our business, financial condition and results of operations could be materially adversely affected.
We have substantial debt and may incur substantial additional debt, which could adversely affect our financial health, reduce our profitability, limit our ability to obtain financing in the future and pursue certain business opportunities and make payments on our indebtedness.
We have substantial indebtedness, which increased as a result of the CENTRIA Acquisition. As of October 30, 2016, we had total indebtedness of approximately $404.1 million.
The amount of our debt or such other obligations could have important consequences for us, including, but not limited to:
• | a substantial portion of our cash flow from operations must be dedicated to the payment of principal and interest on our indebtedness, thereby reducing the funds available to us for other purposes; |
• | our ability to obtain additional financing for working capital, capital expenditures, acquisitions, debt service requirements or general corporate purposes and our ability to satisfy our obligations with respect to our outstanding indebtedness may be impaired in the future; |
• | we are exposed to the risk of increased interest rates because a portion of our borrowings is at variable rates of interest; |
• | we may be at a competitive disadvantage compared to our competitors with less debt or with comparable debt at more favorable interest rates and that, as a result, may be better positioned to withstand economic downturns; |
• | our ability to refinance indebtedness may be limited or the associated costs may increase; |
• | our ability to engage in acquisitions without raising additional equity or obtaining additional debt financing may be impaired in the future; |
• | it may be more difficult for us to satisfy our obligations to our creditors, resulting in possible defaults on and acceleration of such indebtedness; |
• | we may be more vulnerable to general adverse economic and industry conditions; and |
• | our flexibility to adjust to changing market conditions and our ability to withstand competitive pressures could be limited, or we may be prevented from making capital investments that are necessary or important to our operations in general, growth strategy and efforts to improve operating margins of our business units. |
If we cannot service our debt, we will be forced to take actions such as reducing or delaying acquisitions and/or capital expenditures, selling assets, restructuring or refinancing our debt or seeking additional equity capital. We can give you no assurance that we can do any of these things on satisfactory terms or at all.
The Amended ABL Facility, the Term Loan Facility and the indenture governing the Notes contain restrictions and limitations that could significantly impact our ability and the ability of most of our subsidiaries to engage in certain business and financial transactions.
Indenture Governing the Notes.
The indenture governing the Notes contains restrictive covenants that, among other things, limit our ability and the ability of our restricted subsidiaries to:
18
• | incur additional indebtedness or issue certain preferred shares; |
• | pay dividends, redeem stock or make other distributions; |
• | voluntarily repurchase, prepay or redeem subordinated indebtedness; |
• | make investments; |
• | create liens; |
• | transfer or sell assets; |
• | create restrictions on the ability of our restricted subsidiaries to pay dividends to us or make other intercompany transfers; |
• | consolidate, merge, sell or otherwise dispose of all or substantially all of our assets; |
• | enter into certain transactions with our affiliates; and |
• | designate subsidiaries as unrestricted subsidiaries. |
Term Loan Facility and Amended ABL Facility.
The Term Loan Facility and the Amended ABL Facility contain a number of covenants that limit our ability and the ability of our restricted subsidiaries (in the case of the Term Loan Facility) or subsidiaries (in the case of the ABL Facility) to:
• | incur additional indebtedness or issue certain preferred shares; |
• | pay dividends, redeem stock or make other distributions; |
• | voluntarily repurchase, prepay or redeem subordinated indebtedness or, in the case of the Amended ABL Facility, any indebtedness; |
• | make investments; |
• | create liens; |
• | transfer or sell assets; |
• | create restrictions on the ability of our subsidiaries (in the case of the Amended ABL Facility) and our restricted subsidiaries (in the case of the Term Loan Facility) to pay dividends to us or make other intercompany transfers; |
• | make negative pledges; |
• | consolidate, merge, sell or otherwise dispose of all or substantially all of our assets; |
• | enter into certain transactions with affiliates; and |
• | in the case of the Term Loan Facility, designate subsidiaries as unrestricted subsidiaries. |
We are required to make mandatory pre-payments under the Term Loan Facility upon the occurrence of certain events including the sale of assets and the issuance of debt, in each case subject to certain limitations and conditions set forth in our Term Loan Facility.
Under the Amended ABL Facility, a “Dominion Event” occurs if either an event of default is continuing or excess availability falls below certain levels, during which period, and for certain periods thereafter, the administrative agent may apply all amounts in NCI’s concentration account to the repayment of the loans outstanding under the Amended ABL Facility, subject to an intercreditor agreement between the lenders under the Term Loan Facility and the Amended ABL Facility. In addition, during a Dominion Event, we are required to make mandatory repayments on the Amended ABL Facility upon the occurrence of certain events, including the sale of assets and the issuance of debt, in each case subject to certain limitations and conditions set forth in the Amended ABL Facility and the intercreditor agreement. If excess availability under the Amended ABL Facility falls below certain levels, our asset-based loan facility also requires us to satisfy set financial tests relating to our fixed charge coverage ratio.
These restrictions could limit our ability to plan for or react to market conditions or meet extraordinary capital needs or otherwise could restrict our activities. In addition, under certain circumstances and subject to the limitations set forth in the Term Loan Facility, the Term Loan Facility requires us to pay down our term loan to the extent we generate excess positive cash flow each fiscal year. These restrictions could also adversely affect our ability to finance our future operations or capital needs or to engage in other business activities that would be in our interest.
19
Our failure to comply with obligations under the indenture governing the Notes, the Amended ABL Facility or the Term Loan Facility would result in an event of default under the indenture, the Amended ABL Facility or the Term Loan Facility, as applicable. A default, if not cured or waived, may permit acceleration of our indebtedness. If our indebtedness is accelerated, we cannot be certain that we will have sufficient funds available to pay the accelerated indebtedness or that we will have the ability to refinance the accelerated indebtedness on terms favorable to us or at all.
Despite our indebtedness levels, we and our subsidiaries may be able to incur substantially more indebtedness, which may increase the risks to our financial condition created by our substantial indebtedness.
The terms of the Amended ABL Facility, the Term Loan Facility and the indenture governing the Notes provide us and our subsidiaries with the flexibility to incur a substantial amount of indebtedness in the future, which indebtedness may be secured or unsecured. As of October 30, 2016, we had total indebtedness of approximately $404.1 million. In particular, if we or our subsidiaries are in compliance with certain incurrence ratios set forth in the Amended ABL Facility, the Term Loan Facility and the indenture governing the Notes, we may be able to incur substantial additional indebtedness. Any such incurrence of additional indebtedness may increase the risks created by our current substantial indebtedness. As of October 30, 2016, we were able to borrow up to approximately $140.9 million under the Amended ABL Facility. All of these borrowings under the Amended ABL Facility would be secured.
We may not be able to repurchase the Notes upon a change of control.
Upon the occurrence of a change of control event specified in the indenture governing the Notes, we will be required to offer to repurchase all outstanding Notes (unless otherwise redeemed) at a price equal to 101% of the principal amount thereof, plus accrued and unpaid interest and additional interest, if any, to the date of repurchase. It is possible, however, that we will not have sufficient funds available at the time of the change of control to make the required repurchase of Notes. We may be unable to repay all of that indebtedness or to obtain such consent. Any requirement to offer to repurchase outstanding Notes may therefore require us to refinance our other outstanding debt, which we may not be able to do on commercially reasonable terms, if at all. A change of control may constitute an event of default under the Term Loan Facility and the Amended ABL Facility. In addition, our failure to repurchase the Notes after a change of control in accordance with the terms of the indenture governing the Notes would constitute an event of default under such indenture, which in turn would result in a default under the Amended ABL Facility and the Term Loan Facility, and could ultimately result in the acceleration of the indebtedness represented by the Notes and under the Term Loan Facility and the Amended ABL Facility.
An increase in interest rates would increase the cost of servicing our debt and could reduce our profitability, decrease our liquidity and impact our solvency.
Our indebtedness under the Amended ABL Facility will bear interest at variable rates and, to the extent LIBOR exceeds 1.00%, our indebtedness under the Term Loan Facility will bear interest at variable rates. As a result, increases in interest rates could increase the cost of servicing such debt and materially reduce our profitability and cash flows. As of October 30, 2016, assuming all Amended ABL Facility revolving loans were fully drawn and LIBOR exceeded 1.00%, each one percent change in interest rates would result in approximately a $2.9 million change in annual interest expense on the Term Loan Facility and the Amended ABL Facility. The impact of such an increase would be more significant for us than it would be for some other companies because of our substantial debt.
A downgrade, suspension or withdrawal of the rating assigned by a rating agency to us or the Notes, if any, could cause the liquidity or market value of the Notes to decline.
The Notes have been rated by nationally recognized rating agencies and may in the future be rated by additional rating agencies. In determining our credit ratings, the rating agencies consider a number of both quantitative and qualitative factors. These factors include earnings, fixed charges such as interest, cash flows, total debt outstanding, total secured debt, off balance sheet obligations and other commitments, total capitalization and various ratios calculated from these factors. Our debt securities, including the Notes, and our debt facilities may in the future be rated by additional rating agencies. We cannot assure you that any rating so assigned will remain for any given period of time or that a rating will not be lowered or withdrawn entirely by a rating agency if, in that rating agency’s judgment, circumstances relating to the basis of the rating, such as an adverse change to our business, so warrant. The interest rates and other terms within our current credit agreements are not impacted by rating agency actions. Any downgrade, suspension or withdrawal of a rating by a rating agency (or any anticipated downgrade, suspension or withdrawal) could reduce the liquidity or market value of our outstanding Notes and make our ability to raise new funds or renew maturing debt more difficult.
We may have future capital needs and may not be able to obtain additional financing on acceptable terms.
Although we believe that our current cash position and the additional committed funding available under our Amended ABL Facility is sufficient for our current operations, any reductions in our available borrowing capacity, or our inability to renew or replace our debt facilities, when required or when business conditions warrant, could have a material adverse effect
20
on our business, financial condition and results of operations. The economic conditions, credit market conditions and economic climate affecting our industry, as well as other factors, may constrain our financing abilities. Our ability to secure additional financing, if available, and to satisfy our financial obligations under indebtedness outstanding from time to time will depend upon our future operating performance, the availability of credit generally, economic conditions and financial, business and other factors, many of which are beyond our control. The market conditions and the macroeconomic conditions that affect our industry could have a material adverse effect on our ability to secure financing on favorable terms, if at all.
We may be unable to secure additional financing or financing on favorable terms or our operating cash flow may be insufficient to satisfy our financial obligations under the indebtedness outstanding from time to time. Furthermore, if financing is not available when needed, or is available on unfavorable terms, we may be unable to take advantage of business opportunities or respond to competitive pressures, any of which could have a material adverse effect on our business, financial condition and results of operations. If we raise additional funds through further issuances of equity, convertible debt securities or other securities convertible into equity, our existing stockholders could suffer significant dilution.
Our ability to access future financing also may be dependent on regulatory restrictions applicable to banks and other institutions subject to U.S. federal banking regulations, even if the market would otherwise be willing to provide such financing.
We have obligations incident to being a public company, including with respect to the requirements of and related rules under the Sarbanes-Oxley Act of 2002. Fulfilling these obligations is expensive and time-consuming, and any delays or difficulties in satisfying these obligations could have a material adverse effect on our future results of operations.
We completed our initial public offering in fiscal 1992. As a public company, we are subject to the reporting and corporate governance requirements, New York Stock Exchange (“NYSE”) listing standards and the Sarbanes-Oxley Act of 2002, that apply to issuers of listed equity, which imposes certain compliance costs and obligations upon us. Being a public company entails higher auditing, accounting and legal fees and expenses, investor relations expenses, directors’ fees and director and officer liability insurance costs, registrar and transfer agent fees and listing fees, as well as other expenses, than for a non-public company.
We have identified material weaknesses in our internal control over financial reporting relating to CENTRIA and to the allocation of total contract consideration in multiple element revenue arrangements within the Company’s engineered building systems segment. These material weaknesses led to a conclusion that our internal control over financial reporting was not effective as of October 30, 2016. Our ability to remediate these material weaknesses, our discovery of additional weaknesses, or our inability to achieve and maintain effective internal control over financial reporting, could adversely affect our results of operations, our stock price and investor confidence in our company.
Section 404 of the Sarbanes-Oxley Act of 2002 requires that we evaluate and report on our system of internal control over financial reporting. In addition, our independent registered public accounting firm must report on its evaluation of those controls. As disclosed in more detail under “Controls and Procedures” in Part II, Item 9A of this Report, we have identified material weaknesses as of October 30, 2016 in our internal control over financial reporting resulting from (1) our failure to maintain an effective control environment at CENTRIA, which we acquired in January 2015, and (2) gaps in the design of controls, including general IT and other IT-related controls, over the monitoring and review of the estimated selling price that was allocated to each separate unit of accounting for revenue arrangements within our engineered building systems segment. A material weakness in internal control over financial reporting is a deficiency, or combination of deficiencies, in internal control over financial reporting, such that there is a reasonable possibility that a material misstatement of the annual or interim financial statements will not be prevented or detected on a timely basis.
In light of the identified material weaknesses, the Company performed additional review and other procedures at CENTRIA and with respect to multiple element revenue arrangements within the Company’s engineered building systems segment prior to filing this Annual Report on Form 10-K. We concluded no adjustments to the consolidated financial statements as of and for the fiscal year ended October 30, 2016 were required.
Failure to have effective internal control over financial reporting could result in a misstatement of our financial statements. If, as a result of deficiencies in our internal control over financial reporting, we cannot provide reliable financial statements, our business decision processes may be adversely affected, our business and results of operations could be harmed, investors could lose confidence in our reported financial information, our stock price may decline and our ability to obtain additional financing, or additional financing on favorable terms, could be adversely affected. In addition, failure to maintain effective internal control over financial reporting could result in investigations or sanctions by the SEC or other regulatory authorities. In addition, because of the inherent limitations in all control systems, no evaluation of controls can provide absolute assurance that all control issues or instances of fraud, if any, within the Company have been detected.
Management has identified actions that the Company intends to implement immediately in order to remediate these material weaknesses. If these measures prove to be insufficient to remediate the material weaknesses, the accuracy of our
21
financial statements could be adversely affected, resulting in reputational harm, distractions to management and our board of directors, disruptions to our business and loss of confidence by investors in the reliability of our financial statements. Further, any failure to implement required new or improved controls, or difficulties encountered in their implementation, could harm our operating results or cause us to fail to meet our reporting obligations. Additional details regarding the initial remediation efforts are disclosed under “Controls and Procedures” in Part II, Item 9A of this Report.
We may recognize goodwill or other intangible asset impairment charges.
Future triggering events, such as declines in our cash flow projections, may cause impairments of our goodwill or intangible assets based on factors such as our stock price, projected cash flows, assumptions used, control premiums or other variables.
We completed our annual assessment of the recoverability of goodwill and indefinite lived intangibles in the fourth quarter of fiscal 2016 and determined that no impairments of our goodwill or long-lived intangibles were required.
Our businesses are seasonal, and our results of operations during our first two fiscal quarters may be adversely affected by weather conditions.
The engineered building systems, metal components and metal coil coating businesses, and the construction industry in general, are seasonal in nature. Sales normally are lower in the first half of each fiscal year compared to the second half of the fiscal year because of unfavorable weather conditions for construction and typical business planning cycles affecting construction. This seasonality adversely affects our results of operations for the first two fiscal quarters. Prolonged severe weather conditions can delay construction projects and otherwise adversely affect our business.
Price volatility and supply constraints in the steel market could prevent us from meeting delivery schedules to our customers or reduce our profit margins.
Our business is heavily dependent on the price and supply of steel. The steel industry is highly cyclical in nature, and steel prices have been volatile in recent years and may remain volatile in the future. Steel prices are influenced by numerous factors beyond our control, including general economic conditions domestically and internationally, currency fluctuations, the availability of raw materials, competition, labor costs, freight and transportation costs, production costs, import duties and other trade restrictions. Given the level of steel industry consolidation, the anticipated additional domestic market capacity, generally low inventories in the industry and slow economic recovery, a sudden increase in demand could affect our ability to purchase steel and result in rapidly increasing steel prices.
We normally do not maintain an inventory of steel in excess of our current production requirements. However, from time to time, we may purchase steel in advance of announced steel price increases. In addition, it is our current practice to purchase all steel inventory that has been ordered but is not in our possession. If demand for our products declines, our inventory may increase. We can give you no assurance that steel will remain available, that prices will not continue to be volatile or that we will be able to purchase steel on favorable or commercially reasonable terms. While most of our sales contracts have escalation clauses that allow us, under certain circumstances, to pass along all or a portion of increases in the price of steel after the date of the contract but prior to delivery, we may, for competitive or other reasons, not be able to pass such price increases along. If the available supply of steel declines, we could experience price increases that we are not able to pass on to our customers, a deterioration of service from our suppliers or interruptions or delays that may cause us not to meet delivery schedules to our customers. Any of these problems could adversely affect our results of operations and financial condition. For more information about steel pricing trends in recent years, see “Item 1. Business — Raw Materials” and “Item 7A. Quantitative and Qualitative Disclosures about Market Risk — Steel Prices.”
Failure to retain or replace key personnel could hurt our operations.
Our success depends to a significant degree upon the efforts, contributions and abilities of our senior management, plant managers and other highly skilled personnel, including our sales executives. These executives and managers have many accumulated years of experience in our industry and have developed personal relationships with our customers that are important to our business. If we do not retain the services of our key personnel or if we fail to adequately plan for the succession of such individuals, our customer relationships, results of operations and financial condition may be adversely affected.
If we are unable to enforce our intellectual property rights, or if such intellectual property rights become obsolete, our competitive position could be adversely affected.
We utilize a variety of intellectual property rights in our services. We have a number of United States copyrights, patents, foreign patents, pending patent and copyright applications and other proprietary rights, including those relating to metal roofing systems, metal overhead doors, our pier and header system, our Long Bay® System and our building estimating and design system. CENTRIA also has a number of U.S. patents, including for its composite joinery apparatus. We and
22
CENTRIA also have a number of registered trademarks and pending registrations in the United States. In addition, CENTRIA has exclusively licensed certain metal building cladding technology from Proclad Enterprises Ltd., which, under certain circumstances, may be converted to a non-exclusive license. We view this portfolio of owned and licensed process and design technologies as one of our competitive strengths. We may not be able to successfully preserve these intellectual property rights in the future and these rights could be invalidated, circumvented, or challenged.
There can be no assurance that the efforts we have taken to protect our proprietary rights will be sufficient or effective, that any pending or future patent and trademark applications will lead to issued patents and registered trademarks in all instances, that others will not develop or patent similar or superior technologies, products or services, or that our patents, trademarks and other intellectual property will not be challenged, invalidated, misappropriated or infringed by others. If we are unable to protect and maintain our intellectual property rights or those acquired from CENTRIA, or if there are any successful intellectual property challenges or infringement proceedings against us, including in connection with intellectual property of CENTRIA, our business and revenue could be materially and adversely affected.
We may also be subject to future claims and legal proceedings regarding alleged infringement by us of the patents, trademarks and other intellectual property rights of third parties. If there is a claim against us for infringement, misappropriation, misuse or other violation of third party intellectual property rights, and we are unable to obtain sufficient rights or develop non-infringing intellectual property or otherwise alter our business practices on a timely or cost-efficient basis, our business and competitive position may be adversely affected.
We incur costs to comply with environmental laws and have liabilities for environmental investigations, cleanups and claims.
Because we emit and discharge pollutants into the environment, own and operate real property that has historically been used for industrial purposes and generate and handle hazardous substances and industrial wastes, we incur costs and liabilities to comply with environmental laws and regulations. We may incur significant additional costs as those laws and regulations or their enforcement change in the future if we discover a release of hazardous substances into the environment, or if a historical release of hazardous substances, industrial wastes or other contamination is identified.
The operations of our manufacturing facilities are subject to stringent and complex federal, state and local environmental laws and regulations. These include, for example, (i) the federal Clean Air Act and comparable state laws and regulations that impose obligations related to air emissions; (ii) the federal Clean Water Act and comparable state laws and regulations that impose obligations related to wastewater and storm water discharges; (iii) the federal Resource Conservation and Recovery Act and comparable state laws that impose requirements for the storage, treatment, handling and disposal of industrial wastes from our facilities; and (iv) the Comprehensive Environmental Response, Compensation and Liability Act of 1980 and comparable state laws that impose liability for the investigation and cleanup of hazardous substances or industrial wastes that may have been released at properties currently or previously owned or operated by us, or at locations to which we have sent industrial waste for disposal.
Failure to comply with these laws and regulations may trigger a variety of administrative, civil and criminal enforcement measures, including the assessment of monetary penalties; the imposition of investigative or remedial requirements; personal injury, property or natural resource damages claims; and the issuance of orders enjoining current or future operations, or the denial or revocation of permits or other legal authorizations. For more information about the effect of environmental laws and regulations on our business, see “Item 1. Business — Environmental Matters.”
The industries in which we operate are highly competitive.
We compete with all other alternative methods of building construction, which may be viewed as more traditional, more aesthetically pleasing or having other advantages over our products. In addition, competition in the metal components and metal buildings markets of the building industry and in the metal coil coating segment is intense. It is based primarily on:
• | quality; |
• | service; |
• | on-time delivery; |
• | ability to provide added value in the design and engineering of buildings; |
• | price; |
• | speed of construction in buildings and components; and |
• | personal relationships with customers. |
23
We compete with a number of other manufacturers of metal components and engineered building systems and providers of coil coating services ranging from small local firms to large national firms. In addition, we and other manufacturers of metal components and engineered building systems compete with alternative methods of building construction. If these alternative building methods compete successfully against us, such competition could adversely affect us.
In addition, several of our competitors have been acquired by steel producers. Competitors owned by steel producers may have a competitive advantage on raw materials that we do not enjoy. Steel producers may prioritize deliveries of raw materials to such competitors or provide them with more favorable pricing, both of which could enable them to offer products to customers at lower prices or accelerated delivery schedules.
Our stock price has been and may continue to be volatile.
The trading price of our Common Stock has fluctuated in the past and is subject to significant fluctuations in response to the following factors, some of which are beyond our control:
• | variations in quarterly operating results; |
• | deviations in our earnings from publicly disclosed forward-looking guidance; |
• | variability in our revenues; |
• | changes in earnings estimates by analysts; |
• | our announcements of significant contracts, acquisitions, strategic partnerships or joint ventures; |
• | general conditions in the metal components and engineered building systems industries; |
• | uncertainty about current global economic conditions; |
• | sales of our Common Stock by our sponsor; |
• | fluctuations in stock market price and volume; and |
• | other general economic conditions. |
During fiscal 2016, our stock price on the NYSE ranged from a high of $17.85 per share to a low of $9.07 per share. In recent years, the stock market in general has experienced extreme price and volume fluctuations that have affected the market price for many companies in industries similar to ours. Some of these fluctuations have been unrelated to the operating performance of the affected companies. These market fluctuations may decrease the market price of our Common Stock in the future.
Acquisitions may be unsuccessful if we incorrectly predict operating results or are unable to identify and complete future acquisitions and integrate acquired assets or businesses.
We have a history of expansion through acquisitions, and we believe that if our industry continues to consolidate, our future success may depend, in part, on our ability to successfully complete acquisitions. Growing through acquisitions and managing that growth will require us to continue to invest in operational, financial and management information systems and to attract, retain, motivate and effectively manage our employees. Pursuing and integrating acquisitions involves a number of risks, including:
• | the risk of incorrect assumptions or estimates regarding the future results of the acquired business or expected cost reductions or other synergies expected to be realized as a result of acquiring the business; |
• | diversion of management’s attention from existing operations; |
• | unexpected losses of key employees, customers and suppliers of the acquired business; |
• | integrating the financial, technological and management standards, processes, procedures and controls of the acquired business with those of our existing operations; and |
• | increasing the scope, geographic diversity and complexity of our operations. |
Although the majority of our growth strategy is organic in nature, if we do pursue opportunistic acquisitions, we can provide no assurance that we will be successful in identifying or completing any acquisitions or that any businesses or assets that we are able to acquire will be successfully integrated into our existing business. We cannot predict the effect, if any, that any announcement or consummation of an acquisition would have on the trading prices of our securities.
24
Acquisitions subject us to numerous risks that could adversely affect our results of operations.
If we pursue further acquisitions, depending on conditions in the acquisition market, it may be difficult or impossible for us to identify businesses or operations for acquisition, or we may not be able to make acquisitions on terms that we consider economically acceptable. Even if we are able to identify suitable acquisition opportunities, our acquisition strategy depends upon, among other things, our ability to obtain financing and, in some cases, regulatory approvals, including under the Hart-Scott-Rodino Act.
Our incurrence of additional debt, contingent liabilities and expenses in connection with any future acquisitions could have a material adverse effect on our financial condition and results of operations. Furthermore, our financial position and results of operations may fluctuate significantly from period to period based on whether significant acquisitions are completed in particular periods. Competition for acquisitions is intense and may increase the cost of, or cause us to refrain from, completing acquisitions. In addition, we may be unable to consummate any acquisition once announced and may be liable for termination fees.
Restructuring our operations may harm our profitability, financial condition and results of operations. Our ability to fully achieve the estimated cost savings is uncertain.
We have developed plans to improve cost efficiency and optimize our combined manufacturing plant footprint considering our recent acquisitions and restructuring efforts. Future charges related to the plans may harm our profitability in the periods incurred. Additionally, if we were to incur unexpected charges related to the plans, our financial condition and results of operations may suffer.
Implementation of these plans carry significant risks, including:
• | actual or perceived disruption of service or reduction in service levels to our customers; |
• | failure to preserve supplier relationships and distribution, sales and other important relationships and to resolve conflicts that may arise |
• | potential adverse effects on our internal control environment and an inability to preserve adequate internal controls; |
• | diversion of management attention from ongoing business activities and other strategic objectives; and |
• | failure to maintain employee morale and retain key employees. |
Because of these and other factors, we cannot predict whether we will fully realize the cost savings from these plans. If we do not fully realize the expected cost savings from these plans, our business and results of operations may be negatively affected. Also, if we were to experience any adverse changes to our business, additional restructuring activities may be required in the future.
In connection with the Equity Investment, we entered into a stockholders agreement with the CD&R Funds pursuant to which the CD&R Funds have substantial governance and other rights and setting forth certain terms and conditions regarding the Equity Investment and the ownership of the CD&R Funds’ shares of Common Stock.
Pursuant to the stockholders agreement with the CD&R Funds, subject to certain ownership and other requirements and conditions, the CD&R Funds have the right to appoint directors to our board of directors proportionate to their ownership, including the “Lead Director” or Chairman of the Executive Committee of our board of directors, and have consent rights over a variety of significant corporate and financing matters, including, subject to certain customary exceptions and specified baskets, sales and acquisitions of assets, issuances and redemptions of equity, incurrence of debt, the declaration or payment of extraordinary distributions or dividends and changes to the Company’s line of business. In addition, the CD&R Funds are granted subscription rights under the terms and conditions of the stockholders agreement.
Transactions engaged in by the CD&R Funds or our directors or executives involving our Common Stock may have an adverse effect on the price of our stock.
Our officers, directors and the CD&R Funds collectively own approximately 44.2% of our issued and outstanding Common Stock. On April 8, 2016, the SEC declared effective our shelf registration statement on Form S-3 which registered the resale by the CD&R Funds, the shares of our Common Stock then issuable to the CD&R Funds upon conversion of their Convertible Preferred Stock. On July 25, 2016, the CD&R Funds completed the 2016 Secondary Offering of 10,350,000 shares of our Common Stock pursuant to our shelf registration statement. In addition, we completed the 2016 Stock Repurchase of 2,910,054 shares of our Common Stock from the CD&R Funds concurrently with the 2016 Secondary Offering. See Note 12 — CD&R Funds in the notes to the consolidated financial statements for more information on the 2016 Secondary Offering and 2016 Stock Repurchase. Future sales of our shares by these stockholders could have the effect of lowering our stock price. The perceived risk associated with the possible sale of a large number of shares by these stockholders could cause some of our stockholders to sell their stock, thus causing the price of our stock to decline. In
25
addition, actual or anticipated downward pressure on our stock price due to actual or anticipated sales of stock by our directors or officers could cause other institutions or individuals to engage in short sales of our Common Stock, which may further cause the price of our stock to decline.
From time to time our directors, executive officers, or the CD&R Funds may sell shares of our Common Stock on the open market or otherwise, for a variety of reasons, which may be related or unrelated to the performance of our business. These sales will be publicly disclosed in filings made with the SEC. Our stockholders may perceive these sales as a reflection on management’s view of the business which may result in a drop in the price of our stock or cause some stockholders to sell their shares of our Common Stock.
Volatility in energy prices may impact our operating costs, and we may be unable to pass any resulting increases to our customers in the form of higher prices for our products.
Volatility in energy prices may increase our operating costs and may reduce our profitability and cash flows if we are unable to pass any resulting increases to our customers. We use energy in the manufacture and transport of our products. In particular, our manufacturing plants use considerable amounts of electricity and natural gas. Consequently, our operating costs typically increase if energy costs rise. During periods of higher energy costs, we may not be able to recover our operating cost increases through price increases without reducing demand for our products. To the extent we are not able to recover these cost increases through price increases or otherwise, our profitability and cash flow will be adversely impacted. We partially hedge our exposure to higher prices via fixed forward positions.
The adoption of climate change legislation or regulations restricting emissions of greenhouse gases could increase our operating costs or reduce demand for our products.
More stringent laws and regulations relating to climate change and greenhouse gases, or GHGs, may be adopted in the future and could cause us to incur additional operating costs or reduced demand for our products. On December 15, 2009, the federal Environmental Protection Agency, or EPA, published its findings that emissions of carbon dioxide, methane, and other GHGs present an endangerment to public health, the economy and the environment because emissions of such gases, according to the EPA, contribute to the warming of the earth’s atmosphere and other climate changes. These findings allowed the EPA to adopt and implement regulations that would restrict emissions of GHGs under existing provisions of the federal CAAA.
Several North American state and multi-state climate change initiatives are either actively studying, or have already implemented, measures to reduce GHG emissions, primarily through the development of emission source performance standards, GHG tracking systems and GHG emission cap-and-trade programs. These programs typically require major sources of GHGs to acquire and surrender emission allowances and offsets, with the number of allowances available for purchase reduced each year until an overall GHG emission reduction goal is achieved.
In October 2011, the California Air Resources Board adopted a cap-and-trade program that will require the state to reduce GHG emissions to 1990-levels by 2020. This program, along with mandatory GHG reporting and other complementary measures, was authorized by the California Global Warming Solutions Act (AB 32) of 2006. Effective January 1, 2013, cap-and-trade regulations apply to all major industrial sources and electricity generators, and expanded in 2015 to cover the distributors of transportation fuels, natural gas and other fuels. The amount of allowances available to these sources is set to decline by about three percent each year through 2020 as the cap is lowered and emissions are reduced.
Although it is not possible to accurately predict how new GHG legislation or regulations would impact our business, any new federal, regional or state restrictions on emissions of carbon dioxide or other GHGs that may be imposed in areas where we conduct business could result in increased compliance costs or additional operating restrictions on our facilities, raw material suppliers, the transportation and distribution of our products and our customers. Such restrictions could potentially make our products more expensive and thus reduce their demand, which could have a material adverse effect on our business.
Breaches of our information system security measures could disrupt our internal operations.
We are dependent upon information technology for the distribution of information internally and also to our customers and suppliers. This information technology is subject to theft, damage or interruption from a variety of sources, including but not limited to malicious computer viruses, security breaches and defects in design. Various measures have been implemented to manage our risks related to information system and network disruptions, but a system failure or breach of these measures could negatively impact our operations and financial results.
Damage to our computer infrastructure and software systems could harm our business.
The unavailability of any of our primary information management systems for any significant period of time could have an adverse effect on our operations. In particular, our ability to deliver products to our customers when needed, collect our receivables and manage inventory levels successfully largely depend on the efficient operation of our computer hardware and
26
software systems. Through information management systems, we provide inventory availability to our sales and operating personnel, improve customer service through better order and product reference data and monitor operating results. Difficulties associated with upgrades, installations of major software or hardware, and integration with new systems could lead to business interruptions that could harm our reputation, increase our operating costs and decrease our profitability. In addition, these systems are vulnerable to, among other things, damage or interruption from power loss, computer system and network failures, loss of telecommunications services, operator negligence, physical and electronic loss of data, or security breaches and computer viruses.
We have contracted with third-party service providers that provide us with redundant data center services in the event that our major information management systems are damaged. The backup data centers and other protective measures we take could prove to be inadequate. Our inability to restore data completely and accurately could lead to inaccurate and/or untimely filings of our periodic reports with the SEC, tax filings with the IRS or other required filings, all of which could have a significant negative impact on our corporate reputation and could negatively impact our stock price or result in fines or penalties that could impact our financial results.
Our operations are subject to hazards that may cause personal injury or property damage, thereby subjecting us to liabilities and possible losses, which may not be covered by insurance.
Our workers are subject to the usual hazards associated with work in manufacturing environments. Operating hazards can cause personal injury and loss of life, as well as damage to or destruction of business personal property, and possible environmental impairment. We are subject to either deductible or self-insured retention (SIR) amounts, per claim or occurrence, under our Property/Casualty insurance programs, as well as an individual stop-loss limit per claim under our group medical insurance plan. We maintain insurance coverage to transfer risk, with aggregate and per-occurrence limits and deductible or retention levels that we believe are consistent with industry practice. The transfer of risk through insurance cannot guarantee that coverage will be available for every loss or liability that we may incur in our operations.
Exposures that could create insured (or uninsured) liabilities are difficult to assess and quantify due to unknown factors, including but not limited to injury frequency and severity, natural disasters, terrorism threats, third-party liability, and claims that are incurred but not reported (“IBNR”). Although we engage third-party actuarial professionals to assist us in determining our probable future loss exposure, it is possible that claims or costs could exceed our estimates or our insurance limits, or could be uninsurable. In such instances we might be required to use working capital to satisfy these losses rather than to maintain or expand our operations, which could materially and adversely affect our operating results and our financial condition.
Due to the international nature of our business, we could be adversely affected by violations of certain laws.
In addition to the United States, we operate our business in Canada, Mexico and China, and make sales in certain other jurisdictions. The policies of our business mandate compliance with certain U.S. and international laws, such as import/export laws and regulations, anti-boycott laws, economic sanctions, laws and regulations, the U.S. Foreign Corrupt Practices Act and similar anti-bribery laws. We operate in parts of the world that have experienced governmental corruption to some degree and, in certain circumstances, strict compliance with anti-bribery laws may conflict with local customs and practices. We cannot provide assurance that our internal controls and procedures will always prevent reckless or criminal acts by our employees or agents, or that the operations of acquired businesses will have been conducted in accordance with our policies and applicable regulations. If we are found to be liable for violations of these laws (either due to our own acts, out of inadvertence or due to the acts or inadvertence of others), we could suffer criminal or civil penalties or other sanctions, including limitations on our ability to conduct our business, which could have a material and adverse effect on our results of operations, financial condition and cash flows.
27
Item 1B. Unresolved Staff Comments.
There are no unresolved staff comments outstanding with the Securities and Exchange Commission at this time.
Item 2. Properties.
As of October 30, 2016, we conducted manufacturing operations at the following facilities:
Facility | Products | Square Feet | Owned or Leased | |||
Domestic: | ||||||
Chandler, Arizona | Doors and related metal components | 37,000 | Leased | |||
Tolleson, Arizona | Metal components(1) | 70,551 | Owned | |||
Sheridan, Arkansas | Metal components(8) | 215,000 | Owned | |||
Atwater, California | Engineered building systems(2) | 219,870 | Owned | |||
Rancho Cucamonga, California | Metal coil coating | 98,137 | Owned | |||
Adel, Georgia | Metal components(1) | 78,809 | Owned | |||
Lithia Springs, Georgia | Metal components(3) | 118,446 | Owned | |||
Douglasville, Georgia | Doors and related metal components | 87,811 | Owned | |||
Marietta, Georgia | Metal coil coating | 205,000 | Leased/Owned | |||
Mattoon, Illinois | Metal components(8) | 124,800 | Owned | |||
Shelbyville, Indiana | Metal components(1) | 70,200 | Owned | |||
Shelbyville, Indiana | Metal components(8) | 108,300 | Leased | |||
Monticello, Iowa | Engineered building systems(4) | 231,966 | Owned | |||
Mount Pleasant, Iowa | Engineered building systems(4) | 218,500 | Owned | |||
Frankfort, Kentucky | Metal components(8) | 270,000 | Owned | |||
Nicholasville, Kentucky | Metal components(5) | 55,000 | Owned | |||
Jackson, Mississippi | Metal coil coating | 354,350 | Owned | |||
Hernando, Mississippi | Metal components(1) | 129,682 | Owned | |||
Omaha, Nebraska | Metal components(5) | 56,716 | Owned | |||
Las Vegas, Nevada | Metal components(8) | 126,400 | Leased | |||
Rome, New York | Metal components(5) | 53,700 | Owned | |||
Cambridge, Ohio | Metal coil coating | 200,000 | Owned | |||
Middletown, Ohio | Metal coil coating | 170,000 | Owned | |||
Oklahoma City, Oklahoma | Metal components(5) | 59,400 | Leased | |||
Ambridge, Pennsylvania | Metal coil coating | 32,000 | Leased | |||
Elizabethton, Tennessee | Engineered building systems(4) | 228,113 | Owned | |||
Lexington, Tennessee | Engineered building systems(6) | 140,504 | Owned | |||
Memphis, Tennessee | Metal coil coating | 65,895 | Owned | |||
Houston, Texas | Metal components(3) | 264,641 | Owned | |||
Houston, Texas | Metal coil coating | 40,000 | Owned | |||
Houston, Texas | Engineered building systems(4)(7) | 615,064 | Owned | |||
Houston, Texas | Doors and related metal components | 42,572 | Owned | |||
Lewisville, Texas | Metal components(8) | 91,800 | Owned | |||
Lubbock, Texas | Metal components(1) | 95,376 | Owned | |||
Midlothian, Texas | Metal components(9) | 60,000 | Owned | |||
Salt Lake City, Utah | Metal components(3) | 84,800 | Owned | |||
Prince George, Virginia | Metal components(8) | 101,400 | Owned | |||
Spokane, Washington | Engineered building systems(4) | 150,560 | Owned | |||
Foreign: | ||||||
Monterrey, Mexico | Engineered building systems(6) | 246,196 | Owned | |||
Hamilton, Ontario, Canada | Metal components(8) | 100,000 | Leased | |||
Shanghai, China | Metal components(8) | 75,000 | Leased | |||
(1) | Secondary structures and metal roof and wall systems. |
28
(2) | End walls, secondary structures and metal roof and wall systems for components and engineered building systems. |
(3) | Full components product range. |
(4) | Primary structures, secondary structures and metal roof and wall systems for engineered building systems. |
(5) | Metal roof and wall systems. |
(6) | Primary structures for engineered building systems. |
(7) | Structural steel. |
(8) | Insulated panel systems. |
(9) | Polystyrene. |
We also operate eight Metal Depots facilities in our metal components segment that sell our products directly to the public. We also maintain several drafting office facilities in various states. We have short-term leases for these additional facilities. We believe that our present facilities are adequate for our current and projected operations.
Additionally, we own approximately seven acres of land in Houston, Texas and have a 60,000 square foot facility that is used as our principal executive and administrative offices. We also own approximately ten acres of land at another location in Houston adjacent to one of our manufacturing facilities. We own approximately 14 acres of undeveloped land adjacent to our Garco facility in Spokane, Washington.
Item 3. Legal Proceedings.
As a manufacturer of products primarily for use in nonresidential building construction, we are inherently exposed to various types of contingent claims, both asserted and unasserted, in the ordinary course of business. As a result, from time to time, we and/or our subsidiaries become involved in various legal proceedings or other contingent matters arising from claims, or potential claims. We insure against these risks to the extent deemed prudent by our management and to the extent insurance is available. Many of these insurance policies contain deductibles or self-insured retentions in amounts we deem prudent and for which we are responsible for payment. In determining the amount of self-insurance, it is our policy to self-insure those losses that are predictable, measurable and recurring in nature, such as claims for automobile liability and general liability. The Company regularly reviews the status of on-going proceedings and other contingent matters along with legal counsel. Liabilities for such items are recorded when it is probable that the liability has been incurred and when the amount of the liability can be reasonably estimated. Liabilities are adjusted when additional information becomes available. Management believes that the ultimate disposition of these matters will not have a material adverse effect on the Company’s results of operations, financial position or cash flows. However, such matters are subject to many uncertainties and outcomes are not predictable with assurance.
29
PART II
Item 5. Market for Registrant’s Common Equity, Related Stockholder Matters and Issuer Purchases of Equity Securities.
PRICE RANGE OF COMMON STOCK
Our Common Stock is listed on the NYSE under the symbol “NCS.” As of December 28, 2016, there were 35 holders of record and an estimated 7,500 beneficial owners of our Common Stock. The following table sets forth the quarterly high and low sale prices of our Common Stock, as reported by the NYSE, for the prior two fiscal years. We have never paid dividends on our Common Stock and the terms of our Credit Agreement, Amended ABL Facility and Notes either limit or restrict our ability to do so.
Fiscal Year 2016 Quarter Ended | High | Low | ||||||
January 31 | $ | 13.01 | $ | 9.25 | ||||
May 1 | $ | 15.50 | $ | 9.07 | ||||
July 31 | $ | 17.59 | $ | 14.46 | ||||
October 30 | $ | 17.85 | $ | 13.90 | ||||
Fiscal Year 2015 Quarter Ended | High | Low | ||||||
February 1 | $ | 20.85 | $ | 15.39 | ||||
May 3 | $ | 17.82 | $ | 15.22 | ||||
August 2 | $ | 16.11 | $ | 12.23 | ||||
November 1 | $ | 13.13 | $ | 9.55 | ||||
ISSUER PURCHASES OF EQUITY SECURITIES
The following table shows our purchases of our Common Stock during the fourth quarter of fiscal 2016:
Period | (a) Total Number of Shares Purchased(1) | (b) Average Price Paid per Share | (c) Total Number of Shares Purchased as Part of Publicly Announced Programs | (d) Maximum Dollar Value of Shares that May Yet be Purchased Under Publicly Announced Programs(2) (in thousands) | |||||||||
August 1, 2016 to August 28, 2016 | — | $ | — | — | $ | 50,000 | |||||||
August 29, 2016 to September 25, 2016 | — | $ | — | — | $ | 50,000 | |||||||
September 26, 2016 to October 30, 2016 | 460,790 | $ | 14.32 | 460,732 | $ | 43,403 | |||||||
Total | 460,790 | $ | 14.32 | 460,732 | |||||||||
(1) | The total number of shares purchased includes our Common Stock repurchased under the programs described below as well as shares of restricted stock that were withheld to satisfy minimum tax withholding obligations arising in connection with the vesting of awards of restricted stock. The required withholding is calculated using the closing sales price on the previous business day prior to the vesting date as reported by the NYSE. |
(2) | On September 8, 2016, our board of directors authorized a stock repurchase program for the repurchase of up to an aggregate of $50.0 million of the Company’s outstanding Common Stock. Under this repurchase program, the Company is authorized to repurchase shares, if at all, at times and in amounts that we deem appropriate in accordance with all applicable securities laws and regulations. Shares repurchased are usually retired. There is no time limit on the duration of the program. At October 30, 2016, approximately $43.4 million remained available for stock repurchases under the program. |
30
STOCK PERFORMANCE CHART
The following chart compares the yearly percentage change in the cumulative stockholder return on our Common Stock from October 30, 2011 to the end of the fiscal year ended October 30, 2016 with the cumulative total return on the (i) S&P SmallCap 600 Index and (ii) S&P Smallcap Building Products peer group. The comparison assumes $100 was invested on October 30, 2011 in our Common Stock and in each of the foregoing indices and assumes reinvestment of dividends.
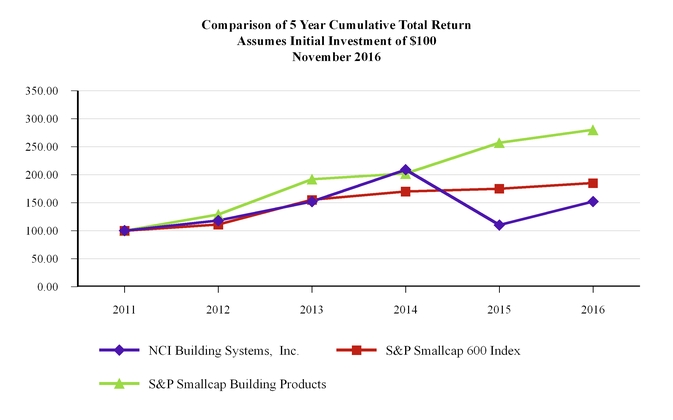
In accordance with the rules and regulations of the SEC, the above stock performance chart shall not be deemed to be “soliciting material” or to be “filed” with the SEC or subject to Regulations 14A or 14C of the Securities Exchange Act of 1934 (the “Exchange Act”) or to the liabilities of Section 18 of the Exchange Act and shall not be deemed to be incorporated by reference into any filing under the Securities Act of 1933 or the Exchange Act, except to the extent we specifically incorporate it by reference into such filing.
31
Item 6. Selected Financial Data.
The selected financial data for each of the three fiscal years ended October 30, 2016, November 1, 2015 and November 2, 2014 has been derived from the audited consolidated financial statements included elsewhere herein. The selected financial data for the fiscal years ended November 3, 2013 and October 28, 2012 and certain consolidated balance sheet data as of November 2, 2014 and November 3, 2013 have been derived from audited consolidated financial statements not included herein. The following data should be read in conjunction with “Item 7. Management’s Discussion and Analysis of Financial Condition and Results of Operations” and the audited consolidated financial statements and the notes thereto included under “Item 8. Financial Statements and Supplementary Data.”
2016 | 2015 | 2014 | 2013(4) | 2012 | ||||||||||||||||||||
(In thousands, except per share data) | ||||||||||||||||||||||||
Sales | $ | 1,684,928 | $ | 1,563,693 | $ | 1,370,540 | $ | 1,308,395 | $ | 1,154,010 | ||||||||||||||
Net income (loss) | $ | 51,027 | (1) | $ | 17,818 | (2) | $ | 11,185 | (3) | $ | (12,885 | ) | (5) | $ | 4,913 | (7) | ||||||||
Net income (loss) applicable to common shares | $ | 50,638 | (1) | $ | 17,646 | (2) | $ | 11,085 | (3) | $ | (12,885 | ) | (5) | $ | (72,120 | ) | (7) | |||||||
Earnings (loss) per common share: | ||||||||||||||||||||||||
Basic | $ | 0.70 | $ | 0.24 | $ | 0.15 | $ | (0.29 | ) | $ | (3.81 | ) | ||||||||||||
Diluted | $ | 0.70 | (1) | $ | 0.24 | (2) | $ | 0.15 | (3) | $ | (0.29 | ) | (5) | $ | (3.81 | ) | (7) | |||||||
Cash flow from operating activities | $ | 68,768 | $ | 105,040 | $ | 33,566 | $ | 64,142 | $ | 47,722 | ||||||||||||||
Total assets | $ | 1,058,296 | $ | 1,079,729 | $ | 758,683 | $ | 780,263 | $ | 751,484 | ||||||||||||||
Total debt | $ | 404,147 | $ | 444,147 | $ | 235,387 | $ | 237,775 | $ | 236,944 | (8) | |||||||||||||
Convertible Preferred Stock | $ | — | $ | — | $ | — | $ | — | $ | 619,950 | ||||||||||||||
Stockholders’ equity (deficit) | $ | 281,317 | $ | 271,976 | $ | 246,542 | $ | 252,758 | $ | (370,528 | ) | |||||||||||||
Diluted average common shares | 72,857 | 73,923 | 74,709 | 44,761 | (6) | 18,932 | ||||||||||||||||||
Note: The Company calculated the after-tax amounts below by applying the applicable statutory tax rate for the respective period to each applicable item.
(1) | Includes gain on sale of assets and asset recovery of $1.6 million ($1.0 million after tax), restructuring and impairment charges of $4.3 million ($2.6 million after tax), strategic development and acquisition related costs of $2.7 million ($1.6 million after tax), and gain from bargain purchase of $1.9 million (non-taxable). |
(2) | Includes gain on legal settlements of $3.8 million ($2.3 million after tax), strategic development and acquisition related costs of $4.2 million ($2.6 million after tax), restructuring and impairment charges of $11.3 million ($6.9 million after tax), fair value adjustments to inventory of $2.4 million ($1.5 million after tax), and amortization of acquisition fair value adjustments of $8.4 million ($5.1 million after tax). |
(3) | Includes gain on insurance recovery of $1.3 million ($0.8 million after tax), secondary offering costs of $0.8 million ($0.5 million after tax), foreign exchange losses of $1.1 million ($0.7 million after tax), strategic development and acquisition related costs of $5.0 million ($3.1 million after tax) and reversal of Canadian deferred tax valuation allowance of $2.7 million in fiscal 2014. |
(4) | Fiscal 2013 includes 53 weeks of operating activity. |
(5) | Includes debt extinguishment costs of $21.5 million ($13.2 million after tax) and proceeds from insurance recovery of $1.0 million ($0.6 million after tax) and unreimbursed business interruption costs of $0.5 million ($0.3 million after tax) in fiscal 2013. |
(6) | In May 2013, the CD&R Funds converted all of their Preferred Shares into 54.1 million shares of our Common Stock. |
(7) | Includes strategic development and acquisition related costs of $5.0 million ($3.7 million after tax), debt extinguishment costs of $6.4 million ($4.0 million after tax), actuarial determined general liability self-insurance of $1.9 million ($1.2 million after tax) and executive retirement costs of $0.5 million ($0.3 million after tax) in fiscal 2012. |
(8) | Includes debt discount of $11.8 million. |
32
Item 7. Management’s Discussion and Analysis of Financial Condition and Results of Operations.
OVERVIEW
We are one of North America’s largest integrated manufacturers and marketers of metal products for the nonresidential construction industry. We provide metal coil coating services and design, engineer, manufacture and market metal components and engineered building systems primarily for nonresidential construction use. We manufacture and distribute extensive lines of metal products for the nonresidential construction market under multiple brand names through a nationwide network of plants and distribution centers. We sell our products for both new construction and repair and retrofit applications.
Metal components offer builders, designers, architects and end-users several advantages, including lower long-term costs, longer life, attractive aesthetics and design flexibility. Similarly, engineered building systems offer a number of advantages over traditional construction alternatives, including shorter construction time, more efficient use of materials, lower construction costs, greater ease of expansion and lower maintenance costs.
We use a 52/53 week year with our fiscal year end on the Sunday closest to October 31.
We assess performance across our operating segments by analyzing and evaluating, among other indicators, gross profit, operating income and whether or not each segment has achieved its projected sales goals. In assessing our overall financial performance, we regard return on adjusted operating assets, as well as growth in earnings, as key indicators of shareholder value.
Fiscal 2016 Overview
Our fiscal 2016 financial performance showed year-over-year improvement in revenue, gross margin, net income and Adjusted EBITDA. This improved financial performance was the result of focused execution across our commercial, manufacturing and supply chain groups. We continue to focus on growing and integrating IMP products into our building and components businesses. We realized the benefits of focused and integrated execution across our commercial, manufacturing, and supply chain activities, and our investments to improve our manufacturing productivity and overall cost efficiency. We also maintained commercial pricing discipline in an environment of volatile steel prices.
Consolidated revenues increased by approximately 7.8% from the prior fiscal year. The year-over-year improvement was primarily driven by tonnage volume growth across all operating segments. Revenue growth was lower than the underlying increase in volumes due to the pass-through of lower steel costs.
All operating segments achieved underlying gross margin growth through increased tonnage volume, commercial discipline and manufacturing efficiencies. Gross margin in fiscal 2016 increased by 160 basis points from the prior fiscal year to 25.4%. Engineering, selling, general and administrative expenses as a percentage of revenues decreased by 30 basis points to 18.0% compared to the prior fiscal year, as we executed on our strategic initiatives.
Net income increased by $33.2 million to $51.0 million for fiscal 2016, compared to $17.8 million in the prior year. Diluted earnings per share was $0.70, while adjusted net income per diluted common share was $0.71. Adjusted EBITDA increased to $166.1 million, representing an approximately 27.7% increase over the prior year, as we took advantage of the operating leverage created by volume increases and realized benefits from our improvement initiatives.
Due to the strong growth in Adjusted EBITDA and focused management of our working capital, we made voluntary prepayments on our existing term loan facility of approximately $40.0 million and we used $62.9 million to repurchase shares of our Common Stock in fiscal 2016, including the 2016 Stock Repurchase. These additional debt paydowns, combined with improved Adjusted EBITDA, have enabled us to reduce our net debt leverage ratio below the pre-CENTRIA acquisition level. Our pro forma net debt leverage ratio at the end of the fourth fiscal quarter improved to 2.0x, compared to the pre-CENTRIA acquisition leverage of 2.2x.
Overall, we delivered net income, Adjusted EBITDA, diluted earnings per share and adjusted diluted earnings per share in fiscal 2016 that exceeded the prior year’s results. We remain focused on increasing our operating leverage and manufacturing efficiency by continuing to pursue our cost and efficiency initiatives. Our objective is to continue to execute on our strategic initiatives in order to increase market penetration and deliver top-line growth above nonresidential market growth during fiscal 2017 in both our legacy businesses and our IMP products through our multiple sales channels.
Industry Conditions
Our sales and earnings are subject to both seasonal and cyclical trends and are influenced by general economic conditions, interest rates, the price of steel relative to other building materials, the level of nonresidential construction activity, roof repair and retrofit demand and the availability and cost of financing for construction projects. Our sales normally are lower in the first half of each fiscal year compared to the second half because of unfavorable weather conditions for construction and typical business planning cycles affecting construction.
33
The nonresidential construction industry is highly sensitive to national and regional macroeconomic conditions. Following a significant downturn in 2008 and 2009, the current recovery of low-rise construction has been uneven and slow. The annual volume of new construction starts remains below previous cyclical trough levels of activity from the last 50 years. However, we believe that the economy is recovering and that the nonresidential construction industry will return to mid-cycle levels of activity over the next several years.
The graph below shows the annual nonresidential new construction starts, measured in square feet, since 1968 as compiled and reported by Dodge:
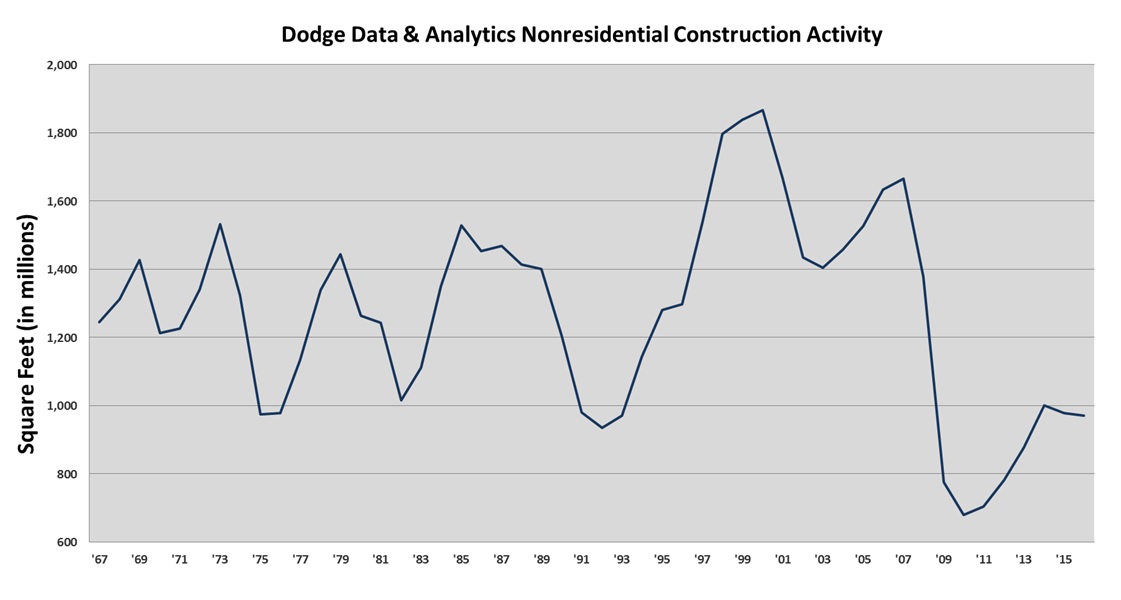
Current market estimates continue to show uneven activity across the nonresidential construction markets. According to Dodge, low-rise nonresidential construction starts, as measured in square feet and comprising buildings of up to five stories, were down as much as approximately 8% in our fiscal 2016 as compared to our fiscal 2015. However, Dodge typically revises initial reported figures, and we expect this metric will be revised upwards over time. Leading indicators for low-rise, nonresidential construction activity indicate positive momentum into fiscal 2017.
The leading indicators that we follow and that typically have the most meaningful correlation to nonresidential low-rise construction starts are the American Institute of Architects’ (“AIA”) Architecture Mixed Use Index, Dodge Residential single family starts and the Conference Board Leading Economic Index (“LEI”). Historically, there has been a very high correlation to the Dodge low-rise nonresidential starts when the three leading indicators are combined and then seasonally adjusted. The combined forward projection of these metrics, based on a 9 to 14-month historical lag for each metric, indicates low single digit growth for low-rise new construction starts in fiscal 2017, with the majority of that growth occurring in the second half of our fiscal year.
We normally do not maintain an inventory of steel in excess of our current production requirements. However, from time to time, we may purchase steel in advance of announced steel price increases. We can give no assurance that steel will be readily available or that prices will not continue to be volatile. While most of our sales contracts have escalation clauses that allow us, under certain circumstances, to pass along all or a portion of increases in the price of steel after the date of the contract but prior to delivery, for competitive or other reasons we may not be able to pass such price increases along. If the available supply of steel declines, we could experience price increases that we are not able to pass on to the end users, a deterioration of service from our suppliers or interruptions or delays that may cause us not to meet delivery schedules to our customers. Any of these problems could adversely affect our results of operations and financial condition. For additional discussion, please see “Item 7A. Quantitative and Qualitative Disclosures About Market Risk — Steel Prices.”
34
RESULTS OF OPERATIONS
The following table presents, as a percentage of sales, certain selected consolidated financial data for the periods indicated:
Fiscal year ended | ||||||||
October 30, 2016 | November 1, 2015 | November 2, 2014 | ||||||
Sales | 100.0 | % | 100.0 | % | 100.0 | % | ||
Cost of sales | 74.7 | 76.0 | 78.8 | |||||
Gain on sale of assets and asset recovery | (0.1 | ) | — | — | ||||
Fair value adjustment of acquired inventory | — | 0.2 | — | |||||
Gain on insurance recovery | — | — | (0.1 | ) | ||||
Gross profit | 25.4 | 23.8 | 21.3 | |||||
Engineering, selling, general and administrative expenses | 18.0 | 18.3 | 18.8 | |||||
Intangible asset amortization | 0.6 | 1.1 | 0.3 | |||||
Strategic development and acquisition related costs | 0.2 | 0.3 | 0.4 | |||||
Restructuring and impairment charges | 0.3 | 0.7 | — | |||||
Gain on legal settlements | — | (0.2 | ) | — | ||||
Income from operations | 6.5 | 3.6 | 1.8 | |||||
Interest income | — | — | — | |||||
Interest expense | (1.8 | ) | (1.8 | ) | (0.9 | ) | ||
Foreign exchange loss | (0.1 | ) | (0.1 | ) | (0.1 | ) | ||
Gain from bargain purchase | 0.1 | — | — | |||||
Other income, net | — | — | 0.1 | |||||
Income before income taxes | 4.7 | 1.7 | 0.9 | |||||
Provision for income taxes | 1.7 | 0.6 | 0.1 | |||||
Net income | 3.0 | % | 1.1 | % | 0.8 | % | ||
35
SUPPLEMENTARY OPERATING SEGMENT INFORMATION
Operating segments are defined as components of an enterprise that engage in business activities and by which discrete financial information is available that is evaluated on a regular basis by the chief operating decision maker to make decisions about how to allocate resources to the segment and assess the performance of the segment. We have three operating segments: (i) engineered building systems; (ii) metal components; and (iii) metal coil coating. All operating segments operate primarily in the nonresidential construction market. Sales and earnings are influenced by general economic conditions, the level of nonresidential construction activity, metal roof repair and retrofit demand and the availability and terms of financing available for construction. Our operating segments are vertically integrated and benefit from using similar basic raw materials. The metal coil coating segment consists of cleaning, treating, painting and slitting continuous steel coils before the steel is fabricated for use by construction and industrial users. The metal components segment products include metal roof and wall panels, doors, metal partitions, metal trim, insulated panels and other related accessories. CENTRIA is included in the metal components segment. The engineered building systems segment includes the manufacturing of main frames, Long-Bay® Systems and value-added engineering and drafting, which are typically not part of metal components or metal coil coating products or services. The manufacturing and distribution activities of our segments are effectively coupled through the use of our nationwide hub-and-spoke manufacturing and distribution system, which supports and enhances our vertical integration. The operating segments follow the same accounting policies used for our consolidated financial statements.
We evaluate a segment’s performance based primarily upon operating income before corporate expenses. Intersegment sales are recorded based on standard material costs plus a standard markup to cover labor and overhead and consist of: (i) structural framing provided by the engineered building systems segment to the metal components segment; (ii) building components provided by the metal components segment to the engineered building systems segment; and (iii) hot-rolled, light gauge painted, and slit material and other services provided by the metal coil coating segment to both the engineered building systems and metal components segments.
Corporate assets consist primarily of cash but also include deferred financing costs, deferred taxes and property, plant and equipment associated with our headquarters in Houston, Texas. These items (and income and expenses related to these items) are not allocated to the operating segments. Corporate unallocated expenses include share-based compensation expenses, and executive, legal, finance, tax, treasury, human resources, information technology, purchasing, marketing and corporate travel expenses. Additional unallocated amounts include interest income, interest expense, debt extinguishment costs and other income (expense). Segment information is included in Note 20 to our consolidated financial statements.
The following table represents total sales, external sales and operating income attributable to these operating segments for the periods indicated (in thousands, except percentages):
2016 | % | 2015 | % | 2014 | % | |||||||||||||||
Total sales: | ||||||||||||||||||||
Engineered building systems | $ | 672,235 | 39.9 | $ | 667,166 | 42.7 | $ | 669,843 | 48.9 | |||||||||||
Metal components | 1,044,040 | 62.0 | 920,845 | 58.9 | 694,858 | 50.7 | ||||||||||||||
Metal coil coating | 247,736 | 14.7 | 231,732 | 14.8 | 246,582 | 18.0 | ||||||||||||||
Intersegment sales | (279,083 | ) | (16.6 | ) | (256,050 | ) | (16.4 | ) | (240,743 | ) | (17.6 | ) | ||||||||
Total net sales | $ | 1,684,928 | 100.0 | $ | 1,563,693 | 100.0 | $ | 1,370,540 | 100.0 | |||||||||||
External sales: | ||||||||||||||||||||
Engineered building systems | $ | 652,471 | 38.7 | $ | 647,881 | 41.4 | $ | 649,344 | 47.4 | |||||||||||
Metal components | 925,863 | 55.0 | 815,310 | 52.1 | 607,594 | 44.3 | ||||||||||||||
Metal coil coating | 106,594 | 6.3 | 100,502 | 6.5 | 113,602 | 8.3 | ||||||||||||||
Total net sales | $ | 1,684,928 | 100.0 | $ | 1,563,693 | 100.0 | $ | 1,370,540 | 100.0 | |||||||||||
Operating income: | ||||||||||||||||||||
Engineered building systems | $ | 62,046 | $ | 51,410 | $ | 32,525 | ||||||||||||||
Metal components | 102,495 | 50,541 | 33,306 | |||||||||||||||||
Metal coil coating | 25,289 | 19,080 | 23,982 | |||||||||||||||||
Corporate | (81,051 | ) | (64,200 | ) | (64,717 | ) | ||||||||||||||
Total operating income | $ | 108,779 | $ | 56,831 | $ | 25,096 | ||||||||||||||
Unallocated other expense | (29,815 | ) | (30,041 | ) | (12,421 | ) | ||||||||||||||
Income before income taxes | $ | 78,964 | $ | 26,790 | $ | 12,675 | ||||||||||||||
36
RESULTS OF OPERATIONS FOR FISCAL 2016 COMPARED TO FISCAL 2015
Consolidated sales increased by 7.8%, or $121.2 million for fiscal 2016, compared to fiscal 2015. The increase was driven by higher tonnage volumes in all of our segments, especially in our metal components and metal coil coating segments. Additionally, CENTRIA was included in the full current period and contributed an incremental $51.2 million of external sales during fiscal 2016. These increases were partially offset by the impact of lower steel prices during fiscal 2016 as compared to fiscal 2015.
Consolidated cost of sales, excluding the gain on sale of assets and asset recovery and the fair value adjustment of acquired inventory, increased by 5.9%, or $69.7 million for fiscal 2016, compared to fiscal 2015. This increase was the result of the increase in consolidated sales, partially offset by lower materials cost driven in part by the impact of lower steel prices during fiscal 2016 as compared to fiscal 2015.
Fair value adjustment of acquired inventory for fiscal 2015 was $2.4 million associated with the CENTRIA acquisition completed on January 15, 2015. There was no corresponding amount recorded during fiscal 2016.
Gross margin, including the gain on sale of assets and asset recovery and the fair value adjustment of acquired inventory was 25.4% for fiscal 2016 compared to 23.8% for fiscal 2015. The increase in gross margin was primarily a result of commercial discipline in all operating segments, lower materials cost, more favorable product mix and the inclusion of CENTRIA in the full current period. Additionally, we recognized a $1.6 million gain (recovery) on the sale of certain idled facilities in our engineered building systems segment in fiscal 2016.
Engineered building systems sales increased 0.8%, or $5.1 million to $672.2 million in fiscal 2016, compared to $667.2 million in fiscal 2015. The increase in sales is a result of higher tonnage volume and commercial discipline, partially offset by the pass-through effect of lower steel prices. Sales to third parties for fiscal 2016 increased $4.6 million to $652.5 million from $647.9 million in the prior fiscal year.
Operating income of the engineered building systems segment increased to $62.0 million in fiscal 2016 compared to $51.4 million in the prior fiscal year. The $10.6 million increase resulted from improvements in commercial discipline, supply chain management and manufacturing efficiencies. We also recognized a $1.6 million gain (recovery) on the sale of certain idled facilities in fiscal 2016.
Metal components sales increased 13.4%, or $123.2 million to $1.0 billion in fiscal 2016, compared to $920.8 million in fiscal 2015. The increase was driven in part by the inclusion of CENTRIA in the full current period, which contributed an incremental $51.2 million of external sales during fiscal 2016. The increase was also due to higher tonnage volume and more favorable product mix, primarily from our IMP products. Sales to third parties for fiscal 2016 increased $110.6 million to $925.9 million from $815.3 million in the prior fiscal year.
Operating income of the metal components segment increased to $102.5 million in fiscal 2016, compared to $50.5 million in the prior fiscal year. The $52.0 million increase was driven by the increased sales discussed in the immediately preceding paragraph, as well as improved product mix, primarily from our IMP products. CENTRIA was included in the full current period and contributed an incremental $17.1 million in operating income for fiscal 2016.
Metal coil coating sales increased by 6.9%, or $16.0 million to $247.7 million in fiscal 2016, compared to $231.7 million in the same period in the prior year. The increase in sales was primarily the result of higher tonnage volume. Lower steel prices generally have an unfavorable impact on our coating business, primarily in our package sales that are more sensitive to the price of steel. Package sales include both the toll processing services and the sale of the steel coil, while toll processing services include only the toll processing service performed on the steel coil already in the customer’s ownership. Metal coil coating third party sales increased $6.1 million to $106.6 million from $100.5 million in the prior fiscal year and accounted for 6.3% of total consolidated third party sales for fiscal 2016.
Operating income of the metal coil coating segment increased to $25.3 million in fiscal 2016, compared to $19.1 million in the prior fiscal year. The $6.2 million increase was driven by the increase in sales discussed above and lower materials cost in fiscal 2016.
Consolidated engineering, selling, general and administrative expenses increased to $302.6 million in fiscal 2016, compared to $286.8 million in the same period in the prior year. As a percentage of sales, engineering, selling, general and administrative expenses were 18.0% for fiscal 2016 as compared to 18.3% for fiscal 2015. The $15.7 million increase in expenses was primarily due to the higher tonnage volume and to higher incentive compensation costs from overall improvement in operating results in the current period, partially offset by cost reductions resulting from execution of strategic initiatives. The increase was also partially due to the inclusion of CENTRIA in the full current period, which contributed an incremental $5.6 million of selling and general and administrative expenses in fiscal 2016.
37
Consolidated intangible asset amortization decreased to $9.6 million during fiscal 2016, compared to $16.9 million in fiscal 2015. The prior fiscal year amount included short-lived intangible assets from the CENTRIA Acquisition that were fully amortized in fiscal 2015.
Consolidated strategic development and acquisition related costs decreased to $2.7 million during fiscal 2016, compared to $4.2 million in the prior fiscal year. These non-operational costs are related to acquisition-related activities that support our future growth targets and performance goals and generally include external legal, financial and due diligence costs incurred to pursue specific acquisition targets or costs directly associated with integrating previous acquisitions. These costs also included $0.7 million in expenses we incurred in connection with the 2016 Secondary Offering and 2016 Stock Repurchase.
Consolidated restructuring and impairment charges for fiscal 2016 were $4.3 million. These charges relate to our efforts to streamline our management, engineering and drafting and manufacturing structures as well as to optimize our manufacturing footprint. We incurred severance-related charges associated with these activities, including in connection with the closure of two facilities in our metal components segment in fiscal 2016. Restructuring and impairment charges in fiscal 2015 of $11.3 million were associated with the closing of a facility in Caryville, Tennessee, severance costs of $3.9 million associated with the streamlining of our commercial and manufacturing cost structure and asset impairment charges of $5.8 million incurred during the fourth quarter of 2015.
Consolidated gain on legal settlements for fiscal 2015 was $3.8 million and consisted of proceeds received from the settlement of certain legal cases where the Company was the plaintiff. There was no corresponding amount recorded for fiscal 2016.
Consolidated interest expense increased to $31.0 million for fiscal 2016, compared to $28.5 million for fiscal 2015. This increase is attributable to the inclusion of a full fiscal year of interest expense associated with the $250.0 million in aggregate principal amount of 8.25% senior notes due 2023 issued in connection with the CENTRIA Acquisition in fiscal 2015.
Consolidated foreign exchange loss decreased to $1.4 million for fiscal 2016, compared to $2.2 million for the same period of the prior year primarily due to the fluctuations in the exchange rate between the Canadian dollar and U.S. dollar in the current period.
Consolidated provision for income taxes was $27.9 million for fiscal 2016, compared to $9.0 million for the prior fiscal year, primarily as a result of higher pre-tax income in fiscal 2016. The effective tax rate for fiscal 2016 was 35.4% compared to 33.5% for fiscal 2015.
Diluted income per common share improved to $0.70 per diluted common share for fiscal 2016, compared to $0.24 per diluted common share for fiscal 2015. The improvement in diluted income per common share was primarily due to the $33.0 million increase in net income applicable to common shares resulting from the factors described above in this section.
RESULTS OF OPERATIONS FOR FISCAL 2015 COMPARED TO FISCAL 2014
Consolidated sales increased by 14.1%, or $193.2 million for fiscal 2015, compared to fiscal 2014. These results were driven by the inclusion of CENTRIA, which contributed $179.4 million of external sales since January 16, 2015 when CENTRIA was acquired. This increase also resulted from higher tonnage volumes in our metal components segment, specifically for our single-skin products. In general, this increase was partially offset by the decline in steel prices experienced during fiscal 2015, which unfavorably impacted our consolidated sales.
Consolidated cost of sales, excluding the fair value adjustment of acquired inventory and the gain on insurance recovery, increased by 10.1%, or $109.0 million for fiscal 2015, compared to fiscal 2014. This increase was the result of the increase in consolidated sales, partially offset by lower underlying material costs driven in part by the decrease in steel prices experienced during fiscal 2015.
Fair value adjustment of acquired inventory for fiscal 2015 was $2.4 million associated with the CENTRIA acquisition. There was no corresponding amount recorded during fiscal 2014.
Consolidated gain on insurance recovery was $1.3 million in fiscal 2014. On August 6, 2013, our metal coil coating segment facility in Jackson, Mississippi, experienced a fire caused by an exhaust fan failure that damaged the roof and walls of two curing ovens. During the fourth quarter of fiscal 2013, the ovens were repaired. We received insurance proceeds of approximately $1.3 million during fiscal 2014 from claims submitted. These insurance proceeds were classified as a gain on insurance recovery in the consolidated statements of operations. There was no corresponding amount in fiscal 2015.
Gross margin, including the fair value adjustment of acquired inventory and the gain on insurance recovery, was 23.8% for fiscal 2015 compared to 21.3% for the same period in the prior year. The increase in gross margin was the result of commercial discipline in both the metal components and engineered building systems segments and higher margin product mix as well as the inclusion of CENTRIA.
38
Engineered building systems sales decreased 0.4%, or $2.7 million to $667.2 million in fiscal 2015, compared to $669.8 million in the same period in the prior year. The decrease in sales was the result of the pass-through effect of lower steel prices and reductions in certain erection services, partially offset by increased tonnage volume and value oriented pricing. Sales to third parties for fiscal 2015 decreased $1.5 million to $647.9 million from $649.3 million in the same period in the prior year.
Operating income of the engineered building systems segment increased to $51.4 million in fiscal 2015 compared to $32.5 million in the same period in the prior year. This $18.9 million increase resulted from improved product mix, lower material costs and lower transportation costs.
Metal components sales increased 32.5%, or $226.0 million to $920.8 million in fiscal 2015, compared to $694.9 million in the same period in the prior year. The results were driven in part by the inclusion of CENTRIA, which contributed $179.4 million of external sales since January 16, 2015 when CENTRIA was acquired. The increase was also due to higher volume of single skin products shipped and higher margin product mix, primarily in our insulated metal panel products. Sales to third parties for fiscal 2015 increased $207.7 million to $815.3 million from $607.6 million in the same period in the prior year.
Operating income of the metal components segment increased to $50.5 million in fiscal 2015, compared to $33.3 million in the same period in the prior year. The $17.2 million increase was driven by the increased sales discussed above, as well as improved product mix.
Metal coil coating sales decreased by 6.0%, or $14.9 million to $231.7 million in fiscal 2015, compared to $246.6 million in the same period in the prior year. This decrease in sales is primarily the result of a decrease in external tons shipped. Package sales include both the toll processing services and the sale of the steel coil while toll processing services include only the toll processing service performed on the steel coil already in the customer’s ownership. Lower steel prices generally have an unfavorable impact on our coating business, primarily in our package sales that are more sensitive to the price of steel.
Operating income of the metal coil coating segment decreased to $19.1 million in fiscal 2015, compared to $24.0 million in the same period in the prior year. The $4.9 million decrease was driven by the decreased sales discussed in the immediately preceding paragraph.
Consolidated engineering, selling, general and administrative expenses increased to $286.8 million in fiscal 2015, compared to $257.6 million in the same period in the prior year. As a percentage of sales, engineering, selling, general and administrative expenses were 18.3% for fiscal 2015 as compared to 18.8% for fiscal 2014. The $29.2 million increase in engineering, selling, general and administrative expenses was primarily due to the inclusion of CENTRIA, which contributed $30.1 million of engineering, selling, general and administrative expenses since January 16, 2015 when CENTRIA was acquired. Engineering, selling, general and administrative costs excluding the impact of CENTRIA decreased $0.9 million during fiscal 2015 compared to the same period in the prior year.
Consolidated intangible asset amortization increased to $16.9 million during fiscal 2015, compared to $4.1 million in the same period in the prior year. This increase was directly related to the valuation of intangible assets related to the CENTRIA Acquisition. Intangible amortization during fiscal 2014 related to prior acquisitions.
Consolidated strategic development and acquisition related costs decreased to $4.2 million during fiscal 2015, compared to $5.0 million in the same period in the prior year. These non-operational costs are related to acquisition-related activities that support our future growth targets and performance goals and generally include external legal, financial and due diligence costs incurred to pursue specific acquisition targets.
Consolidated restructuring and impairment charges for fiscal 2015 were $11.3 million and consists of costs of $1.6 million associated with the closing of our Caryville, Tennessee, facility, severance costs of $3.9 million associated with the streamlining of our commercial and manufacturing cost structure and asset impairment charges of $5.8 million incurred during the fourth quarter of 2015. There was an insignificant amount of restructuring and impairment charges recorded in fiscal 2014.
Consolidated gain on legal settlements for fiscal 2015 was $3.8 million and consisted of proceeds received from the settlement of certain legal cases where the Company was the plaintiff. There was no corresponding amount recorded for fiscal 2014.
Consolidated interest expense increased to $28.5 million for fiscal 2015, compared to $12.5 million for the same period of the prior year. This increase was attributable to the $250.0 million in aggregate principal amount of 8.25% senior notes due 2023 issued in connection with the CENTRIA Acquisition.
39
Consolidated foreign exchange loss increased to $2.2 million for fiscal 2015, compared to $1.1 million for the same period of the prior year primarily due to fluctuations in the Canadian dollar relative to the U.S. dollar exchange rate in fiscal 2015.
Consolidated provision for income taxes was $9.0 million for fiscal 2015, compared to $1.5 million for the same period in the prior year. The effective tax rate for fiscal 2015 was 33.5% compared to 11.8% for the same period in the prior year. The 2014 tax provision included a $2.7 million benefit for the release of a valuation allowance. During 2014, after evaluating historical and future financial trends in our Canadian business, we determined that it was more likely than not that we would utilize all of our current tax loss carryforwards, which if unused would begin to expire in 2026.
Diluted income per common share improved to $0.24 per diluted common share for fiscal 2015, compared to income of $0.15 per diluted common share for the same period in the prior year. The improvement in diluted income per common share was primarily due to the $6.6 million increase in net income applicable to common shares resulting from the factors described above in this section.
LIQUIDITY AND CAPITAL RESOURCES
General
Our cash and cash equivalents decreased from $99.7 million to $65.4 million during fiscal 2016. The following table summarizes our consolidated cash flows for fiscal 2016 and fiscal 2015 (in thousands):
Fiscal Year Ended | |||||||
October 30, 2016 | November 1, 2015 | ||||||
Net cash provided by operating activities | $ | 68,768 | $ | 105,040 | |||
Net cash used in investing activities | (9,950 | ) | (267,778 | ) | |||
Net cash (used in) provided by financing activities | (92,752 | ) | 196,004 | ||||
Effect of exchange rate changes on cash and cash equivalents | (325 | ) | (255 | ) | |||
Net (decrease) increase in cash and cash equivalents | (34,259 | ) | 33,011 | ||||
Cash and cash equivalents at beginning of period | 99,662 | 66,651 | |||||
Cash and cash equivalents at end of period | $ | 65,403 | $ | 99,662 | |||
Operating Activities
Our business is both seasonal and cyclical and cash flows from operating activities may fluctuate during the year and from year to year due to economic conditions. We generally rely on cash as well as short-term borrowings, when needed, to meet cyclical and seasonal increases in working capital needs. These needs generally rise during periods of increased economic activity or increasing raw material prices due to higher levels of inventory and accounts receivable. During economic slowdowns, or periods of decreasing raw material costs, working capital needs generally decrease as a result of the reduction of inventories and accounts receivable.
Net cash provided by operating activities was $68.8 million during fiscal 2016 compared to $105.0 million during fiscal 2015. The change was driven by a significant increase in earnings in the current fiscal year as compared to the prior fiscal year, partially offset by net cash used for working capital as described below.
Net cash used in accounts payable was $1.6 million for the fiscal year ended October 30, 2016, whereas net cash provided by accounts payable was $11.5 million for the fiscal year ended November 1, 2015. Our vendor payments can fluctuate significantly based on the timing of disbursements, inventory purchases and vendor payment terms. Our trailing 90-days payable outstanding (“DPO”) at October 30, 2016 was 34.0 days compared to 38.3 days at November 1, 2015.
The change in cash relating to inventory was $33.7 million and resulted primarily from higher inventory purchases to support higher sales, and the movement in steel prices during the current fiscal year as compared to the prior fiscal year. Our trailing 90-days inventory on-hand (“DIO”) was 47.7 days at October 30, 2016 as compared to 44.5 days at November 1, 2015.
Net cash used in accounts receivable was $18.1 million for the fiscal year ended October 30, 2016, whereas net cash provided by accounts receivable was $7.6 million for the fiscal year ended November 1, 2015. The increase in accounts receivable as of October 30, 2016 as compared to the prior fiscal year was primarily the result of strong revenue growth during the current period. Our trailing 90-days sales outstanding (“DSO”) was approximately 33.6 days at October 30, 2016 as compared to 34.8 days at November 1, 2015.
40
Investing Activities
Cash used in investing activities of $10.0 million during fiscal 2016 was lower than the $267.8 million used in the prior fiscal year. The cash used in investing activities in fiscal 2016 included $21.0 million for capital expenditures, $2.1 million for the final payment of the post-close working capital adjustment related to the CENTRIA Acquisition, and $2.2 million for the acquisition of the Hamilton operations. These were partially offset by $10.0 million in cash proceeds from insurance for an involuntary loss on conversion of a facility in our metal components segment and $5.4 million in cash received for the sale of assets that had been classified as held for sale in our engineered building systems segment. In fiscal 2015, the $267.8 million was related primarily to the use of $247.1 million, net of cash acquired of $8.7 million, for the acquisition of CENTRIA in January 2015.
Financing Activities
Cash used in financing activities was $92.8 million in fiscal 2016 and cash provided by financing activities was $196.0 million in the prior fiscal year. During fiscal 2016, we used $62.9 million to repurchase shares of our Common Stock under our authorized stock repurchase programs (including $45.0 million for the 2016 Stock Repurchase from the CD&R Funds), $1.2 million for purchases of shares related to restricted stock that were withheld to satisfy minimum tax withholding obligations arising in connection with the vesting of restricted stock awards and units, and $40.0 million to make voluntary principal prepayments on borrowings under our Credit Agreement. We received $12.6 million in cash proceeds from exercises of stock options.
The $196.0 million provided by financing activities during fiscal 2015 was primarily attributable to the issuance of $250.0 million in aggregate principal amount of 8.25% senior notes due 2023 to fund the CENTRIA Acquisition. This increase was partially offset by prepayments of approximately $41.2 million made on our Credit Agreement.
We invest our excess cash in various overnight investments which are issued or guaranteed by the federal government.
Equity Investment
On August 14, 2009, the Company entered into an Investment Agreement (as amended, the “Investment Agreement”), by and between the Company and Clayton, Dubilier & Rice Fund VIII L.P. (“CD&R Fund VIII”). In connection with the Investment Agreement and the Stockholders Agreement dated October 20, 2009 (the “Stockholders Agreement”), the CD&R Fund VIII and the Clayton, Dubilier & Rice Friends & Family Fund VIII, L.P. (collectively, the “CD&R Funds”) purchased convertible preferred stock, which was later converted to shares of our Common Stock on May 14, 2013.
On January 15, 2014, the CD&R Funds completed a registered underwritten offering, in which the CD&R Funds offered 8.5 million shares of Common Stock at a price to the public of $18.00 per share (the “2014 Secondary Offering”). The underwriters also exercised their option to purchase 1.275 million additional shares of Common Stock. The aggregate offering price for the 9.775 million shares sold in the 2014 Secondary Offering was approximately $167.6 million, net of underwriting discounts and commissions. The CD&R Funds received all of the proceeds from the 2014 Secondary Offering and no shares in the 2014 Secondary Offering were sold by NCI or any of its officers or directors (although certain of our directors are affiliated with the CD&R Funds). In connection with the 2014 Secondary Offering and the 2014 Stock Repurchase (as defined below), we incurred approximately $0.8 million in expenses, which were included in engineering, selling, general and administrative expenses in the consolidated statement of operations for the fiscal year ended November 2, 2014.
On January 6, 2014, the Company entered into an agreement with the CD&R Funds to repurchase 1.15 million shares of its Common Stock at the price per share equal to the price per share paid by the underwriters to the CD&R Funds in the underwritten offering (the “2014 Stock Repurchase”). The 2014 Stock Repurchase, which was completed at the same time as the 2014 Secondary Offering, represented a private, non-underwritten transaction between NCI and the CD&R Funds that was approved and recommended by the Affiliate Transactions Committee of our board of directors. Following completion of the 2014 Stock Repurchase, NCI canceled the shares repurchased from the CD&R Funds, resulting in a $19.7 million decrease in both additional paid-in capital and treasury stock during the fiscal year ended November 2, 2014.
On July 25, 2016, the CD&R Funds completed a registered underwritten offering, in which the CD&R Funds offered 9.0 million shares of our Common Stock at a price to the public of $16.15 per share (the “2016 Secondary Offering”). The underwriters also exercised their option to purchase 1.35 million additional shares of our Common Stock from the CD&R Funds. The aggregate offering price for the 10.35 million shares sold in the 2016 Secondary Offering was approximately $160.1 million, net of underwriting discounts and commissions. The CD&R Funds received all of the proceeds from the 2016 Secondary Offering and no shares in the 2016 Secondary Offering were sold by the Company or any of its officers or directors (although certain of our directors are affiliated with the CD&R Funds). In connection with the 2016 Secondary Offering and 2016 Stock Repurchase (as defined below), we incurred approximately $0.7 million in expenses, which were
41
included in engineering, selling, general and administrative expenses in the consolidated statements of operations for the fiscal year ended October 30, 2016.
On July 18, 2016, the Company entered into an agreement with the CD&R Funds to repurchase approximately 2.9 million shares of our Common Stock at the price per share equal to the price per share paid by the underwriters to the CD&R Funds in the underwritten offering (the “2016 Stock Repurchase”). The 2016 Stock Repurchase, which was completed concurrently with the 2016 Secondary Offering, represented a private, non-underwritten transaction between the Company and the CD&R Funds that was approved and recommended by the Affiliate Transactions Committee of our board of directors. See Note 18 — Stock Repurchase Program.
At October 30, 2016 and November 1, 2015, the CD&R Funds owned approximately 42.3% and 58.4%, respectively, of the outstanding shares of our Common Stock.
As a result of the 2016 Secondary Offering and 2016 Stock Repurchase discussed above, and the resulting decrease in the CD&R Funds’ ownership percentage, the Company no longer qualifies as a “controlled company” within the meaning of the New York Stock Exchange (“NYSE”). Consequently, under the NYSE corporate governance rules, we are required to (i) have a majority of independent directors on our board of directors within one year of the date we no longer qualified as a “controlled company,” (ii) appoint a majority of independent directors to each of the compensation and nominating and corporate governance committees within 90 days of the date we no longer qualified as a “controlled company”, which we did in October 2016, and such committees be composed entirely of independent directors within one year of such date and (iii) have an annual performance evaluation of the nominating and corporate governance and compensation committees.
In addition, pursuant to Section 3.1(b)(i) of the Stockholders Agreement, by and between the Company and the CD&R Funds, the CD&R Funds currently have the right to nominate a number of directors to the Company’s board in proportion to its voting interest, rounded to the nearest whole number. Prior to the 2016 Secondary Offering and 2016 Stock Repurchase, the CD&R Funds’ approximate 58.4% interest permitted the CD&R Funds to nominate for election 6 of the 11 directors on the Company’s board. As a result of the decrease in CD&R Funds’ ownership percentage to approximately 42.3%, the CD&R Funds are currently permitted to nominate for election 5 of the 11 directors on the Company’s board.
Debt
On January 16, 2015, the Company issued $250.0 million in aggregate principal amount of 8.25% senior notes due 2023 (the “Notes”) to fund the CENTRIA Acquisition. Interest on the Notes accrues at the rate of 8.25% per annum and is payable semi-annually in arrears on January 15 and July 15. The Notes are guaranteed on a senior unsecured basis by all of the Company’s existing and future domestic subsidiaries that guarantee the Company’s obligations (including by reason of being a borrower under the senior secured asset-based revolving credit facility on a joint and several basis with the Company or a guarantor subsidiary) under the senior secured credit facilities.
On June 24, 2013, the Company entered into Amendment No. 1 (the “Amendment”) to its existing Credit Agreement (the “Credit Agreement”), dated as of June 22, 2012, between NCI, as borrower, and Credit Suisse AG, Cayman Islands Branch, as administrative agent and collateral agent and the other financial institutions party thereto from time to time (the “Term Loan Facility”), primarily to extend the maturity date and reduce the interest rate applicable to all of the outstanding term loans under the Term Loan Facility. At October 30, 2016 and November 1, 2015, amounts outstanding under the Credit Agreement were $154.1 million and $194.1 million, respectively.
Pursuant to the Amendment, the maturity date of the $238 million of outstanding term loans (the “Initial Term Loans”) was extended and such loans were converted into a new tranche of term loans (the “Tranche B Term Loans”) that will mature on June 24, 2019 and, prior to such date, will amortize in nominal quarterly installments equal to one percent of the aggregate initial principal amount thereof per annum. At both October 30, 2016 and November 1, 2015, the interest rate on the term loan under our Credit Agreement was 4.25%.
In addition to our Credit Agreement, we have entered into the Amended ABL Facility which allows aggregate maximum borrowings of up to $150.0 million. Borrowing availability on the Amended ABL Facility is determined by a monthly borrowing base collateral calculation that is based on specified percentages of the value of qualified cash, eligible inventory and eligible accounts receivable, less certain reserves and subject to certain other adjustments. The Amended ABL Facility includes borrowing capacity of up to $30 million for letters of credit and up to $10 million for swingline borrowings. On November 7, 2014, the Company entered into Amendment No. 3 to the Loan and Security Agreement (the “ABL Loan and Security Agreement”) to amend the ABL Loan and Security Agreement to permit the CENTRIA Acquisition and associated financing, extend the maturity date of the Amended ABL Facility to June 24, 2019, decrease the applicable margin with respect to borrowings thereunder and make certain other amendments and modifications to provide greater operational and financial flexibility.
42
8.25% Senior Notes Due January 2023. On January 16, 2015, the Company issued $250.0 million in aggregate principal amount of 8.25% senior notes due 2023 to fund the CENTRIA Acquisition. Interest on the Notes accrues at the rate of 8.25% per annum and is payable semi-annually in arrears on January 15 and July 15. The Notes are guaranteed on a senior unsecured basis by all of the Company’s existing and future domestic subsidiaries that guarantee the Company’s obligations (including by reason of being a borrower under the senior secured asset-based revolving credit facility on a joint and several basis with the Company or a guarantor subsidiary) under the senior secured credit facilities. The Notes are unsecured senior indebtedness and rank equally in right of payment with all of the Company’s existing and future senior indebtedness and senior in right of payment to all of its future subordinated obligations. In addition, the Notes and guarantees are structurally subordinated to all existing and future indebtedness and other liabilities of the Company’s non-guarantor subsidiaries.
The Company may redeem the Notes at any time prior to January 15, 2018, at a price equal to 100% of the principal amount thereof, plus accrued and unpaid interest, if any, to the redemption date, plus the applicable make-whole premium. On or after January 15, 2018, the Company may redeem all or a part of the Notes at redemption prices (expressed as percentages of principal amount thereof) equal to 106.188% for the twelve-month period beginning on January 15, 2018, 104.125% for the twelve-month period beginning on January 15, 2019, 102.063% for the twelve-month period beginning on January 15, 2020 and 100.000% for the twelve-month period beginning on January 15, 2021 and at any time thereafter, plus accrued and unpaid interest, if any, to the applicable redemption date of the Notes. In addition, prior to January 15, 2018, the Company may redeem the Notes in an aggregate principal amount equal to up to 40.0% of the original aggregate principal amount of the Notes with funds in an equal aggregate amount not exceeding the aggregate proceeds of one or more equity offerings, at a redemption price of 108.250%, plus accrued and unpaid interest, if any, to the applicable redemption date of the Notes. The Company incurred $9.2 million in transaction costs related to this issuance, which are being amortized over 8 years.
Credit Agreement. On June 22, 2012, in connection with the acquisition of Metl-Span LLC, a Texas limited liability company (the “Metl-Span Acquisition”), the Company entered into a Credit Agreement among the Company, as Borrower, Credit Suisse AG, Cayman Islands Branch, as Administrative Agent and Collateral Agent (the “Term Agent”), and the lenders party thereto. The Credit Agreement provided for a term loan credit facility in an aggregate principal amount of $250.0 million. The Credit Agreement was issued at 95% of face value, which resulted in a note discount of $12.5 million. Prior to the Amendment, the note discount was amortized over the life of the loan through May 2, 2018 using the effective interest method.
The Company’s obligations under the Credit Agreement and designated cash management arrangements and hedging agreements, if any, will be irrevocably and unconditionally guaranteed on a joint and several basis by each direct and indirect wholly owned domestic subsidiary of the Company (other than any domestic subsidiary that is a foreign subsidiary holding company or a subsidiary of a foreign subsidiary and certain other excluded subsidiaries).
The obligations under the Credit Agreement and the designated cash management arrangements and hedging agreements, if any, and the guarantees thereof are secured pursuant to a guarantee and collateral agreement, dated as of June 22, 2012 (the “Guarantee and Collateral Agreement”), made by the Company and other Grantors (as defined therein), in favor of the Term Agent, by (i) all of the capital stock of all direct domestic subsidiaries owned by the Company and the guarantors, (ii) up to 65% of the capital stock of certain direct foreign subsidiaries owned by the Company or any guarantor (it being understood that a foreign subsidiary holding company or a domestic subsidiary of a foreign subsidiary will be deemed a foreign subsidiary), and (iii) substantially all other tangible and intangible assets owned by the Company and each guarantor, in each case to the extent permitted by applicable law and subject to certain exceptions.
The Credit Agreement contains a number of covenants that, among other things, will limit or restrict the ability of the Company and its subsidiaries to dispose of assets, incur additional indebtedness, make dividends and other restricted payments, create liens securing indebtedness, engage in mergers and other fundamental transactions, enter into restrictive agreements, amend certain documents in respect of other indebtedness, change the nature of their business and engage in certain transactions with affiliates.
On June 24, 2013, the Company entered into the Amendment to the Credit Agreement, dated as of June 22, 2012, between NCI, as borrower, and Credit Suisse AG, Cayman Islands Branch, as administrative agent and collateral agent and the other financial institutions party thereto from time to time (the “Term Loan Facility”), primarily to extend the maturity date and reduce the interest rate applicable to all of the outstanding term loans under the Term Loan Facility. At October 30, 2016 and November 1, 2015, amounts outstanding under the Credit Agreement were $154.1 million and $194.1 million, respectively. As a result of the Amendment, in fiscal 2013, we recognized a one-time debt extinguishment charge of approximately $21.5 million related to the write-off of non-cash existing deferred issuance costs, non-cash initial debt discount write-off, pre-payment penalty and fees to the creditors.
Pursuant to the Amendment, the maturity date of the $238 million of outstanding Initial Term Loans was extended and such loans were converted into the Tranche B Term Loans that will mature on June 24, 2019 and, prior to such date, will
43
amortize in nominal quarterly installments equal to one percent of the aggregate initial principal amount thereof per annum. Pursuant to the Amendment, the Tranche B Term Loans will bear interest at a floating rate measured by reference to, at the Company’s option, either (i) an adjusted LIBOR not less than 1.00% plus a borrowing margin of 3.25% per annum or (ii) an alternate base rate plus a borrowing margin of 2.25% per annum. At both October 30, 2016 and November 1, 2015, the interest rate on the term loan under our Credit Agreement was 4.25%. Overdue amounts will bear interest at a rate that is 2% higher than the rate otherwise applicable.
The Tranche B Term Loans are secured by the same collateral and guaranteed by the same guarantors as the Initial Term Loans under the Term Loan Facility. Voluntary prepayments of the Tranche B Term Loans are permitted at any time, in minimum principal amounts, without premium or penalty, subject to a 1.00% premium payable in connection with certain repricing transactions within the first six months.
Pursuant to the Amendment, the Company will no longer be subject to a financial covenant requiring us to maintain a specified consolidated secured debt to EBITDA leverage ratio for specified periods. The Amendment also includes certain other changes to the Term Loan Facility.
Subject to certain exceptions, the term loan under the Amendment will be subject to mandatory prepayment in an amount equal to:
• | the net cash proceeds of (1) certain asset sales, (2) certain debt offerings, and (3) certain insurance recovery and condemnation events; and |
• | 50% of annual excess cash flow (as defined in the Amendment), subject to reduction to 0% if specified leverage ratio targets are met. |
The Credit Agreement contains customary events of default, including non-payment of principal, interest or fees, violation of covenants, material inaccuracy of representations or warranties, cross default and cross acceleration to certain other material indebtedness, certain bankruptcy events, certain ERISA events, material invalidity of security interest, material judgments, and change of control.
The Credit Agreement also provides that the Company has the right at any time to request incremental commitments under one or more incremental term loan facilities or incremental revolving loan facilities, subject to compliance with a pro forma consolidated secured net debt to EBITDA leverage ratio. The lenders under the Credit Agreement will not be under any obligation to provide any such incremental commitments, and any such addition of or increase in commitments will be subject to pro forma compliance with customary conditions.
In connection with the execution of the Credit Agreement the Company, certain of the Company’s subsidiaries, Wells Fargo Capital Finance, LLC, as administrative agent (the “ABL Agent”) under the Company’s Amended ABL Facility (as defined below), and the Term Agent entered into an amendment (the “Intercreditor Agreement Amendment”) to the Company’s existing Intercreditor Agreement, dated as of October 20, 2009, providing for, among other things, the obligations under the Credit Agreement to become subject to the provisions of the Intercreditor Agreement.
Amended ABL Facility. On May 2, 2012, we entered into the Amended Asset-Based Lending Facility (the “Amended ABL Facility”) to (i) permit the acquisition, the entry by the Company into the Credit Agreement and the incurrence of debt thereunder and the repayment of existing indebtedness under NCI’s existing Term Loan, (ii) increase the amount available for borrowing thereunder to $150.0 million (subject to a borrowing base), (iii) increase the amount available for letters of credit thereunder to $30.0 million, and (iv) extend the final maturity thereunder.
On November 7, 2014, the Company, Steelbuilding.com, Inc. (together with the Company, the “Guarantors”) and the Company’s subsidiaries NCI and Robertson-Ceco II Corporation (each a “Borrower” and collectively, the “Borrowers”) entered into Amendment No. 3 to the Loan and Security Agreement (the “Loan and Security Agreement”) among the Borrowers, the Guarantors, Wells Fargo Capital Finance, LLC as administrative agent and co-collateral agent, Bank of America, N.A. as co-collateral agent and syndication agent and certain other lenders under the Loan and Security Agreement, in order to amend the Loan and Security Agreement to (i) permit the CENTRIA Acquisition, (ii) permit the entry by the Company into documentation with respect to certain debt financing to be incurred in connection with the CENTRIA Acquisition and the incurrence of debt with respect thereto, (iii) extend the maturity date to June 24, 2019, (iv) decrease the applicable margin with respect to borrowings thereunder and (v) make certain other amendments and modifications to provide greater operational and financial flexibility.
The Amended ABL Facility provides for an asset-based revolving credit facility which allows aggregate maximum borrowings by NCI Group, Inc. and Robertson-Ceco II Corporation of up to $150.0 million. Borrowing availability under the Amended ABL Facility is determined by a monthly borrowing base collateral calculation that is based on specified percentages of the value of qualified cash, eligible inventory and eligible accounts receivable, less certain reserves and subject to certain other adjustments. At October 30, 2016 and November 1, 2015, our excess availability under the Amended
44
ABL Facility was $140.9 million and $131.0 million, respectively. At both October 30, 2016 and November 1, 2015, we had no revolving loans outstanding under the Amended ABL Facility. In addition, at October 30, 2016 and November 1, 2015, standby letters of credit related to certain insurance policies totaling approximately $9.1 million and $8.7 million, respectively, were outstanding but undrawn under the Amended ABL Facility.
An unused commitment fee is paid monthly on the Amended ABL Facility at an annual rate of 0.50% based on the amount by which the maximum credit exceeds the average daily principal balance of outstanding loans and letter of credit obligations. Additional customary fees in connection with the Amended ABL Facility also apply.
The obligations of the borrowers under the Amended ABL Facility are guaranteed by the Company and each direct and indirect domestic subsidiary of the Company (other than any domestic subsidiary that is a foreign subsidiary holding company or a subsidiary of a foreign subsidiary that is insignificant) that is not a borrower under the Amended ABL Facility. The obligations of the Company under certain specified bank products agreements are guaranteed by each borrower and each other direct and indirect domestic subsidiary of the Company and the other guarantors. These guarantees are made pursuant to a guarantee agreement, dated as of October 20, 2009, entered into by the Company and each other guarantor with Wells Fargo Capital Finance, LLC (formerly known as Wells Fargo Foothill, LLC), as administrative agent. In connection with the Metl-Span Acquisition, Metl-Span became a borrower under the ABL Facility, and the Company, certain subsidiaries of the Company, and the ABL Agent entered into an amendment (the “ABL Guaranty Amendment”) to the Company’s existing Guaranty Agreement, dated as of October 20, 2009, providing for, among other things, the guarantee of the obligations of Metl-Span under the Amended ABL Facility.
The obligations under the Amended ABL Facility, and the guarantees thereof, are secured by a first priority lien on our accounts receivable, inventory, certain deposit accounts, associated intangibles and certain other specified assets of the Company and a second priority lien on the assets securing the term loan under the Credit Agreement on a first-lien basis, in each case subject to certain exceptions.
The Amended ABL Facility contains a number of covenants that, among other things, limit or restrict our ability to dispose of assets, incur additional indebtedness, incur guarantee obligations, engage in sale and leaseback transactions, prepay other indebtedness, modify organizational documents and certain other agreements, create restrictions affecting subsidiaries, make dividends and other restricted payments, create liens, make investments, make acquisitions, engage in mergers, change the nature of our business and engage in certain transactions with affiliates.
Under the Amended ABL Facility, a “Dominion Event” occurs if either an event of default is continuing or excess availability falls below certain levels, during which period, and for certain periods thereafter, the administrative agent may apply all amounts in the Company’s, the borrowers’ and the other guarantors’ concentration accounts to the repayment of the loans outstanding under the Amended ABL Facility, subject to the Intercreditor Agreement and certain specified exceptions. In addition, during such Dominion Event, we are required to make mandatory payments on our Amended ABL Facility upon the occurrence of certain events, including the sale of assets and the issuance of debt, in each case subject to certain limitations and conditions set forth in the Amended ABL Facility.
The Amended ABL Facility includes a minimum fixed charge coverage ratio of one to one, which will apply if we fail to maintain a specified minimum borrowing capacity. The minimum level of borrowing capacity as of October 30, 2016 and November 1, 2015 was $21.1 million and $19.7 million, respectively. Although our Amended ABL Facility did not require any financial covenant compliance, at October 30, 2016 and November 1, 2015, our fixed charge coverage ratio as of those dates, which is calculated on a trailing twelve month basis, was 2.86:1.00 and 3.54:1.00, respectively. These ratios include the pro forma impact of the CENTRIA Acquisition.
Loans under the Amended ABL Facility bear interest, at our option, as follows:
(1) | Base Rate loans at the Base Rate plus a margin. “Base Rate” is defined as the higher of the Wells Fargo Bank, N.A. prime rate and the overnight Federal Funds rate plus 0.5% and “LIBOR” is defined as the applicable London Interbank Offered Rate adjusted for reserves. The margin ranges from 0.75% to 1.25% depending on the quarterly average excess availability under such facility, and |
(2) | LIBOR loans at LIBOR plus a margin. The margin ranges from 1.75% to 2.25% depending on the quarterly average excess availability under such facility. |
During an event of default, loans under the Amended ABL Facility will bear interest at a rate that is 2% higher than the rate otherwise applicable.
45
Cash Flow
We periodically evaluate our liquidity requirements, capital needs and availability of resources in view of inventory levels, expansion plans, debt service requirements and other operating cash needs. To meet our short- and long-term liquidity requirements, including payment of operating expenses and repaying debt, we rely primarily on cash from operations. Beyond cash generated from operations, most of our Amended ABL Facility is undrawn with $140.9 million available at October 30, 2016 and $65.4 million of cash as of October 30, 2016. However, we have in the past sought to raise additional capital.
We expect to contribute $2.0 million to our defined benefit plans in fiscal 2017.
We expect that, for the next 12 months, cash generated from operations and our Amended ABL Facility will be sufficient to provide us the ability to fund our operations, provide the increased working capital necessary to support our strategy and fund planned capital expenditures between approximately $25.0 million and $30.0 million for fiscal 2017 and expansion when needed.
Our corporate strategy seeks potential acquisitions that would provide additional synergies in our engineered building systems, metal components and metal coil coating segments. From time to time, we may enter into letters of intent or agreements to acquire assets or companies in these business lines. The consummation of these transactions could require substantial cash payments and/or issuance of additional debt. On November 3, 2015, we acquired manufacturing operations in Hamilton, Ontario, Canada for $2.2 million in cash. This acquisition allows us to service customers more competitively within the Canadian and Northeastern United States IMP markets. We funded the acquisition with cash on hand.
During fiscal 2016, we repurchased an aggregate of $62.9 million of our Common Stock under the authorized stock repurchase programs (including $45.0 million from the CD&R Funds under the 2016 Stock Repurchase). At October 30, 2016, approximately $43.4 million remained available for stock repurchases under the stock repurchase program authorized in September 2016. We also withheld shares of restricted stock to satisfy minimum tax withholding obligations arising in connection with the vesting of awards of restricted stock related to our 2003 Long-Term Stock Incentive Plan.
The Company may repurchase or otherwise retire the Company’s debt and take other steps to reduce the Company’s debt or otherwise improve the Company’s financial position. These actions could include open market debt repurchases, negotiated repurchases, other retirements of outstanding debt and opportunistic refinancing of debt. The amount of debt that may be repurchased or otherwise retired, if any, will depend on market conditions, trading levels of the Company’s debt, the Company’s cash position, compliance with debt covenants and other considerations. Affiliates of the Company may also purchase the Company’s debt from time to time, through open market purchases or other transactions. In such cases, the Company’s debt may not be retired, in which case the Company would continue to pay interest in accordance with the terms of the debt, and the Company would continue to reflect the debt as outstanding in its consolidated balance sheets. During fiscal 2016, we made voluntary principal repayments totaling $40.0 million on the Term Loan.
46
NON-GAAP MEASURES
Set forth below are certain non-GAAP measures which include “adjusted” operating income (loss), adjusted EBITDA, “adjusted” net income (loss) per diluted common share and “adjusted” net income (loss) applicable to common shares. We define adjusted EBITDA as net income (loss) before interest expense, income tax expense (benefit) and depreciation and amortization, adjusted for items broadly consisting of selected items which management does not consider representative of our ongoing operations and certain non-cash items of the Company. Such measurements are not prepared in accordance with U.S. GAAP and should not be construed as an alternative to reported results determined in accordance with U.S. GAAP. Management believes the use of such non-GAAP measures on a consolidated and operating segment basis assists investors in understanding the ongoing operating performance by presenting the financial results between periods on a more comparable basis. You are encouraged to evaluate these adjustments and the reasons we consider them appropriate for supplemental analysis. In evaluating these measures, you should be aware that in the future we may incur expenses that are the same as, or similar to, some of the adjustments in these non-GAAP measures. In addition, certain financial covenants related to our Credit Agreement, Amended ABL Facility, and Notes are based on similar non-GAAP measures. The non-GAAP information provided is unique to the Company and may not be consistent with the methodologies used by other companies.
The following tables reconcile adjusted operating income (loss) to operating income (loss) for the periods indicated (in thousands):
Fiscal Three Months Ended October 30, 2016 | |||||||||||||||||||
Engineered Building Systems | Metal Components | Metal Coil Coating | Corporate | Consolidated | |||||||||||||||
Operating income (loss), GAAP basis | $ | 22,830 | $ | 31,059 | $ | 7,018 | $ | (21,515 | ) | $ | 39,392 | ||||||||
Restructuring and impairment charges | 211 | 506 | — | 98 | 815 | ||||||||||||||
Strategic development and acquisition related costs | — | — | — | 590 | 590 | ||||||||||||||
Loss on sale of assets and asset recovery | 62 | — | — | — | 62 | ||||||||||||||
Adjusted operating income (loss) | $ | 23,103 | $ | 31,565 | $ | 7,018 | $ | (20,827 | ) | $ | 40,859 | ||||||||
Fiscal Three Months Ended November 1, 2015 | |||||||||||||||||||
Engineered Building Systems | Metal Components | Metal Coil Coating | Corporate | Consolidated | |||||||||||||||
Operating income (loss), GAAP basis | $ | 25,473 | $ | 18,239 | $ | 7,208 | $ | (14,421 | ) | $ | 36,499 | ||||||||
Restructuring and impairment charges | 959 | 6,365 | — | 287 | 7,611 | ||||||||||||||
Strategic development and acquisition related costs | — | — | — | 1,143 | 1,143 | ||||||||||||||
(Gain) on legal settlements | — | — | — | (3,765 | ) | (3,765 | ) | ||||||||||||
Amortization of short lived acquired intangibles | — | 2,343 | — | — | 2,343 | ||||||||||||||
Adjusted operating income (loss) | $ | 26,432 | $ | 26,947 | $ | 7,208 | $ | (16,756 | ) | $ | 43,831 | ||||||||
Fiscal Year Ended October 30, 2016 | |||||||||||||||||||
Engineered Building Systems | Metal Components | Metal Coil Coating | Corporate | Consolidated | |||||||||||||||
Operating income (loss), GAAP basis | $ | 62,046 | $ | 102,495 | $ | 25,289 | $ | (81,051 | ) | $ | 108,779 | ||||||||
Restructuring and impairment charges | 966 | 1,661 | 39 | 1,586 | 4,252 | ||||||||||||||
Strategic development and acquisition related costs | — | 403 | — | 2,267 | 2,670 | ||||||||||||||
(Gain) on sale of assets and asset recovery | (1,642 | ) | — | — | — | (1,642 | ) | ||||||||||||
Adjusted operating income (loss) | $ | 61,370 | $ | 104,559 | $ | 25,328 | $ | (77,198 | ) | $ | 114,059 | ||||||||
47
Fiscal Year Ended November 1, 2015 | |||||||||||||||||||
Engineered Building Systems | Metal Components | Metal Coil Coating | Corporate | Consolidated | |||||||||||||||
Operating income (loss), GAAP basis | $ | 51,410 | $ | 50,541 | $ | 19,080 | $ | (64,200 | ) | $ | 56,831 | ||||||||
Restructuring and impairment charges | 2,756 | 7,866 | 254 | 430 | 11,306 | ||||||||||||||
Strategic development and acquisition related costs | — | — | — | 4,201 | 4,201 | ||||||||||||||
(Gain) on legal settlements | — | — | — | (3,765 | ) | (3,765 | ) | ||||||||||||
Fair value adjustment of acquired inventory | — | 2,358 | — | — | 2,358 | ||||||||||||||
Amortization of short lived acquired intangibles | — | 8,400 | — | — | 8,400 | ||||||||||||||
Adjusted operating income (loss) | $ | 54,166 | $ | 69,165 | $ | 19,334 | $ | (63,334 | ) | $ | 79,331 | ||||||||
The following tables reconcile adjusted EBITDA to net income (loss) for the periods indicated (in thousands):
1st Quarter January 31, 2016 | 2nd Quarter May 1, 2016 | 3rd Quarter July 31, 2016 | 4th Quarter October 30, 2016 | Trailing 12 Months October 30, 2016 | |||||||||||||||
Net income (loss) | $ | 5,892 | $ | 2,420 | $ | 23,715 | $ | 19,001 | $ | 51,028 | |||||||||
Depreciation and amortization | 10,747 | 10,765 | 10,595 | 9,817 | 41,924 | ||||||||||||||
Consolidated interest expense, net | 7,847 | 7,792 | 7,685 | 7,548 | 30,872 | ||||||||||||||
Provision for income taxes | 2,453 | 1,209 | 11,627 | 12,649 | 27,938 | ||||||||||||||
Restructuring and impairment charges | 1,510 | 1,149 | 778 | 815 | 4,252 | ||||||||||||||
(Gain) from bargain purchase | (1,864 | ) | — | — | — | (1,864 | ) | ||||||||||||
Strategic development and acquisition related costs | 681 | 579 | 819 | 590 | 2,669 | ||||||||||||||
Share-based compensation | 2,582 | 2,468 | 2,661 | 3,181 | 10,892 | ||||||||||||||
(Gain) loss on sale of assets and asset recovery | (725 | ) | (927 | ) | (52 | ) | 62 | (1,642 | ) | ||||||||||
Adjusted EBITDA | $ | 29,123 | $ | 25,455 | $ | 57,828 | $ | 53,663 | $ | 166,069 | |||||||||
1st Quarter February 1, 2015 | 2nd Quarter May 3, 2015 | 3rd Quarter August 2, 2015 | 4th Quarter November 1, 2015 | Trailing 12 Months November 1, 2015 | |||||||||||||||
Net income (loss) | $ | (320 | ) | $ | (7,489 | ) | $ | 7,220 | $ | 18,407 | $ | 17,818 | |||||||
Depreciation and amortization | 9,731 | 13,766 | 14,541 | 13,354 | 51,392 | ||||||||||||||
Consolidated interest expense, net | 3,980 | 8,280 | 8,135 | 7,993 | 28,388 | ||||||||||||||
Provision (benefit) for income taxes | (490 | ) | (4,087 | ) | 3,520 | 10,029 | 8,972 | ||||||||||||
Restructuring and impairment charges | 1,477 | 1,714 | 504 | 7,611 | 11,306 | ||||||||||||||
Strategic development and acquisition related costs | 1,729 | 628 | 701 | 1,143 | 4,201 | ||||||||||||||
(Gain) on legal settlements | — | — | — | (3,765 | ) | (3,765 | ) | ||||||||||||
Fair value adjustment of acquired inventory | 583 | 775 | 1,000 | — | 2,358 | ||||||||||||||
Share-based compensation | 2,933 | 2,201 | 2,568 | 1,677 | 9,379 | ||||||||||||||
Adjusted EBITDA | $ | 19,623 | $ | 15,788 | $ | 38,189 | $ | 56,449 | $ | 130,049 | |||||||||
48
The following tables reconcile adjusted diluted income per common share to income per diluted common share and adjusted income applicable to common shares to income applicable to common shares for the periods indicated (in thousands):
Fiscal Three Months Ended | Fiscal Year Ended | ||||||||||||||
October 30, 2016 | November 1, 2015 | October 30, 2016 | November 1, 2015 | ||||||||||||
Net income per diluted common share, GAAP basis | $ | 0.27 | $ | 0.25 | $ | 0.70 | $ | 0.24 | |||||||
Restructuring and impairment charges | 0.01 | 0.10 | 0.06 | 0.15 | |||||||||||
Strategic development and acquisition related costs | 0.01 | 0.02 | 0.04 | 0.06 | |||||||||||
Loss (gain) on sale of assets and asset recovery | — | — | (0.02 | ) | — | ||||||||||
(Gain) from bargain purchase | — | — | (0.03 | ) | — | ||||||||||
(Gain) on legal settlements | — | (0.05 | ) | — | (0.05 | ) | |||||||||
Fair value adjustment of acquired inventory | — | — | — | 0.03 | |||||||||||
Amortization of short lived acquired intangible | — | 0.03 | — | 0.11 | |||||||||||
Tax effect of applicable non-GAAP adjustments(1) | (0.01 | ) | (0.04 | ) | (0.03 | ) | (0.12 | ) | |||||||
Adjusted net income per diluted common share | $ | 0.28 | $ | 0.31 | $ | 0.71 | $ | 0.42 | |||||||
Fiscal Three Months Ended | Fiscal Year Ended | ||||||||||||||
October 30, 2016 | November 1, 2015 | October 30, 2016 | November 1, 2015 | ||||||||||||
Net income applicable to common shares, GAAP basis | $ | 18,896 | $ | 18,186 | $ | 50,638 | $ | 17,646 | |||||||
Restructuring and impairment charges | 815 | 7,611 | 4,252 | 11,306 | |||||||||||
Strategic development and acquisition related costs | 590 | 1,143 | 2,670 | 4,201 | |||||||||||
Loss (gain) on sale of assets and asset recovery | 62 | — | (1,642 | ) | — | ||||||||||
(Gain) from bargain purchase | — | — | (1,864 | ) | — | ||||||||||
(Gain) on legal settlements | — | (3,765 | ) | — | (3,765 | ) | |||||||||
Fair value adjustment of acquired inventory | — | — | — | 2,358 | |||||||||||
Amortization of short lived acquired intangible | — | 2,343 | — | 8,400 | |||||||||||
Tax effect of applicable non-GAAP adjustments(1) | (572 | ) | (2,859 | ) | (2,059 | ) | (8,775 | ) | |||||||
Adjusted net income applicable to common shares | $ | 19,791 | $ | 22,659 | $ | 51,995 | $ | 31,371 | |||||||
(1) | The Company calculated the tax effect of non-GAAP adjustments by applying the applicable statutory tax rate for the period to each applicable non-GAAP item. |
OFF-BALANCE SHEET ARRANGEMENTS
As part of our ongoing business, we do not participate in transactions that generate relationships with unconsolidated entities or financial partnerships, such as entities often referred to as structured finance or special purpose entities (“SPEs”), which would have been established for the purpose of facilitating off-balance sheet arrangements or other contractually narrow or limited purposes. As of October 30, 2016, we were not involved in any unconsolidated SPE transactions.
CONTRACTUAL OBLIGATIONS
The following table shows our contractual obligations as of October 30, 2016 (in thousands):
Payments due by period | ||||||||||||||||||||
Contractual Obligation | Total | Less than 1 year | 1 – 3 years | 4 – 5 years | More than 5 years | |||||||||||||||
Total debt(1) | $ | 404,147 | $ | — | $ | 154,147 | $ | — | $ | 250,000 | ||||||||||
Interest payments on debt(2) | 144,112 | 27,176 | 72,248 | 41,250 | 3,438 | |||||||||||||||
Operating leases | 43,591 | 11,967 | 18,294 | 4,464 | 8,866 | |||||||||||||||
Projected pension obligations(3) | 16,958 | 1,296 | 4,450 | 4,088 | 7,124 | |||||||||||||||
Total contractual obligations | $ | 608,808 | $ | 40,439 | $ | 249,139 | $ | 49,802 | $ | 269,428 | ||||||||||
49
(1) | Reflects amounts outstanding under the Credit Agreement, the Amended ABL Facility and the Notes. |
(2) | Interest payments were calculated based on rates in effect at October 30, 2016 for variable rate obligations. |
(3) | Amounts represent our estimate of the minimum funding requirements as determined by government regulations. Amounts are subject to change based on numerous assumptions, including the performance of the assets in the plans and bond rates. Includes obligations with respect to the Company’s Defined Benefit Plans and the OPEB Plans. |
CONTINGENT LIABILITIES AND COMMITMENTS
Our insurance carriers require us to secure standby letters of credit as a collateral requirement for our projected exposure to future period claims growth and loss development which includes IBNR claims. For all insurance carriers, the total standby letters of credit are approximately $9.1 million and $8.7 million at October 30, 2016 and November 1, 2015, respectively.
CRITICAL ACCOUNTING POLICIES
Our consolidated financial statements are prepared in accordance with accounting principles generally accepted in the United States, which require us to make estimates and assumptions that affect the reported amounts of assets and liabilities and related disclosure of contingent assets and liabilities. On an ongoing basis, we evaluate our estimates, including those estimates that may have a significant effect on our financial condition and results of operations. Our significant accounting policies are disclosed in Note 2 to our consolidated financial statements. The following discussion of critical accounting policies addresses those policies that are both important to the portrayal of our financial condition and results of operations and require significant judgment and estimates. We base our estimates and judgment on historical experience and on various other factors that are believed to be reasonable under the circumstances. Actual results may differ from these estimates under different assumptions or conditions.
Revenue recognition. We recognize revenues when all of the following conditions are met: persuasive evidence of an arrangement exists, delivery has occurred or services have been rendered, the price is fixed or determinable, and collectability is reasonably assured. Generally, these criteria are met at the time product is shipped or services are complete. In instances where an order is partially shipped, we recognize revenue based on the relative sales value of the materials shipped. Provisions are made upon the sale for estimated product returns. Costs associated with shipping and handling our products are included in cost of sales.
Insurance accruals. We have a self-funded Administrative Services Only (“ASO”) arrangement for our employee group health insurance. We purchase individual stop-loss protection to cap our medical claims liability at $355,000 per claim. Each reporting period, we record the costs of our health insurance plan, including paid claims, an estimate of the change in in IBNR claims, taxes and administrative fees, when applicable, (collectively the “Plan Costs”) as general and administrative expenses and cost of sales in our consolidated statements of operations. The estimated IBNR claims are based upon (i) a recent average level of paid claims under the plan, (ii) an estimated claims lag factor and (iii) an estimated claims growth factor to provide for those claims that have been incurred but not yet paid. We have deductible programs for our Workers Compensation/Employer Liability and Auto Liability insurance policies, and a self-insured retention (“SIR”) arrangement for our General Liability insurance policy. The Workers Compensation deductible is $250,000 per occurrence. The Property and Auto Liability deductibles are $50,000 and $250,000, respectively, per occurrence. The General Liability has a self-insured retention of $1,000,000 per occurrence. For workers’ compensation costs, we monitor the number of accidents and the severity of such accidents to develop appropriate estimates for expected costs to provide both medical care and indemnity benefits, when applicable, for the period of time that an employee is incapacitated and unable to work. These accruals are developed using third-party insurance adjuster reserve estimates of the expected cost for medical treatment, and length of time an employee will be unable to work based on industry statistics for the cost of similar disabilities and statutory impairment ratings. For general liability and automobile claims, accruals are developed based on third-party insurance adjuster reserve estimates of the expected cost to resolve each claim, including damages and defense costs, based on legal and industry trends, and the nature and severity of the claim. Accruals also include estimates for IBNR claims, and taxes and administrative fees, when applicable. This statistical information is trended by a third-party actuary to provide estimates of future expected costs based on loss development factors derived from our period-to-period growth of our claims costs to full maturity (ultimate), versus original estimates.
We believe that the assumptions and information used to develop these accruals provide the best basis for these estimates each quarter because, as a general matter, the accruals historically have proved to be reasonable and accurate. However, significant changes in expected medical and health care costs, negative changes in the severity of previously reported claims or changes in laws that govern the administration of these plans could have an impact on the determination of the amount of these accruals in future periods. Our methodology for determining the amount of health insurance accrual considers claims growth and claims lag, which is the length of time between the incurred date and processing date. For the health insurance accrual, a change of 10% above expected outstanding claims would result in a financial impact of $0.5 million.
50
Share-Based Compensation. Under FASB Accounting Standards Codification (“ASC”) Topic 718, Compensation — Stock Compensation, the fair value and compensation expense of each option award is estimated as of the date of grant using a Black-Scholes-Merton option pricing formula. The fair value and compensation expense of the performance share units (“PSUs”) grant is estimated based on the Company’s stock price as of the date of grant using a Monte Carlo simulation. Expected volatility is based on historical volatility of our stock over a preceding period commensurate with the expected term of the option. The expected volatility considers factors such as the volatility of our share price, implied volatility of our share price, length of time our shares have been publicly traded, appropriate and regular intervals for price observations and our corporate and capital structure. For the fiscal years ended October 30, 2016 and November 1, 2015, the forfeiture rate in our calculation of share-based compensation expense is based on historical experience and is estimated at 7.5% for our non-officers and 0% for our officers. The risk-free rate for the expected term of the option is based on the U.S. Treasury yield curve in effect at the time of grant. Expected dividend yield was not considered in the option pricing formula since we historically have not paid dividends on our common shares and have no current plans to do so in the future. We granted an immaterial amount of options during the fiscal years ended October 30, 2016, November 1, 2015 and November 2, 2014.
Long-term incentive awards granted to our senior executives generally have a three-year performance period. Long-term incentive awards include restricted stock units and PSUs representing 40% and 60% of the total value, respectively. The restricted stock units vest upon continued employment. Vesting of the PSUs is contingent upon continued employment and the achievement of targets with respect to the following metrics, as defined by management: (1) cumulative free cash flow (weighted 40%); (2) cumulative earnings per share (weighted 40%); and (3) total shareholder return (weighted 20%), in each case during the performance period. At the end of the performance period, the number of actual shares to be awarded varies between 0% and 200% of target amounts. The PSUs vest pro rata if an executive’s employment terminates prior to the end of the performance period due to death, disability, or termination by the Company without cause or by the executive for good reason. If an executive’s employment terminates for any other reason prior to the end of the performance period, all outstanding unvested PSUs, whether earned or unearned, will be forfeited and cancelled. If a change in control occurs prior to the end of the performance period, the PSU payout will be calculated and paid assuming that the maximum benefit had been achieved. If an executive’s employment terminates due to death or disability while any of the restricted stock is unvested, then all of the unvested restricted stock will become vested. If an executive’s employment is terminated by the Company without cause or after reaching normal retirement age, the unvested restricted stock will be forfeited. If a change in control occurs prior to the end of the performance period, the restricted stock will fully vest. The PSUs granted in December 2014 to our senior executives vest one-half on December 15, 2016 and one-half on December 15, 2017. The PSUs granted in December 2015 to our senior executives cliff vest at the end of the three-year performance period. The fair value of the awards is based on the Company’s stock price as of the date of grant. During the fiscal years ended October 30, 2016 and November 1, 2015, we granted PSUs with fair values of approximately $4.7 million and $3.6 million, respectively.
Performance Share Awards granted to our key employees are paid 50% in cash and 50% in stock. Vesting of Performance Share Awards is contingent upon continued employment and the achievement of free cash flow and earnings per share targets, as defined by management, over a three-year period. At the end of the performance period, the number of actual shares to be awarded varies between 0% and 150% of target amounts. However, a minimum of 50% of the awards will vest upon continued employment over the three-year period if the minimum targets are not met. The Performance Share Awards vest earlier upon death, disability or a change of control. A portion of the awards also vests upon termination without cause or after reaching normal retirement age prior to the vesting date, as defined by the agreements governing such awards. The fair value of Performance Share Awards is based on the Company’s stock price as of the date of grant. During the fiscal years ended October 30, 2016, November 1, 2015 and November 2, 2014, we granted Performance Share Awards with an equity fair value of $2.4 million, $1.5 million and $2.2 million, respectively.
We granted 0.3 million, 0.4 million and 0.2 million restricted shares during the fiscal years ended October 30, 2016, November 1, 2015 and November 2, 2014, respectively. The restricted stock units granted in December 2014 to our senior executives vest two-thirds on December 15, 2016 and one-third on December 15, 2017. For the restricted stock units granted in December 2015 to our senior executives, one-third vests annually.
The compensation cost related to share-based awards is recognized over the requisite service period. The requisite service period is generally the period during which an employee is required to provide service in exchange for the award. For awards with performance conditions, the amount of share-based compensation expense recognized is based upon the probable outcome of the performance conditions, as defined and determined by management. Our option awards and restricted stock awards are subject to graded vesting over a service period, which is typically three or four years. We generally recognize compensation cost for these awards on a straight-line basis over the requisite service period for the entire award. In addition, certain of our awards provide for accelerated vesting upon qualified retirement. We recognize compensation cost for such awards over the period from grant date to the date the employee first becomes eligible for retirement.
51
Income taxes. The determination of our provision for income taxes requires significant judgment, the use of estimates and the interpretation and application of complex tax laws. Our provision for income taxes reflects a combination of income earned and taxed in the various U.S. federal and state, Canadian federal and provincial, Mexican federal, and other jurisdictions. Jurisdictional tax law changes, increases or decreases in permanent differences between book and tax items, accruals or adjustments of accruals for tax contingencies or valuation allowances, and the change in the mix of earnings from these taxing jurisdictions all affect the overall effective tax rate.
As of October 30, 2016, the $4.3 million net operating loss and tax credit carryforward included $0.5 million for U.S. state loss carryforwards and $3.4 million for foreign loss carryforward. The state net operating loss carryforwards will expire in 1 to 19 years, if unused.
Accounting for acquisitions, intangible assets and goodwill. Accounting for the acquisition of a business requires the allocation of the purchase price to the various assets and liabilities of the acquired business. For most assets and liabilities, purchase price allocation is accomplished by recording the asset or liability at its estimated fair value. The most difficult estimations of individual fair values are those involving property, plant and equipment and identifiable intangible assets. We use all available information to make these fair value determinations and, for major business acquisitions, typically engage an outside appraisal firm to assist in the fair value determination of the acquired long-lived assets.
The Company has approximately $154.3 million of goodwill as of October 30, 2016, of which approximately $14.3 million pertains to our engineered building systems segment and $140.0 million pertains to our metal components segment. The Company also has $13.5 million of other intangible assets with indefinite lives as of October 30, 2016 pertaining to our engineered building systems segment. We perform an annual impairment assessment of goodwill and indefinite-lived intangibles. Additionally, we assess goodwill and indefinite-lived intangibles for impairment whenever events or changes in circumstances indicate that the fair values may be below the carrying values of such assets. Unforeseen events, changes in circumstances and market conditions and material differences in the value of intangible assets due to changes in estimates of future cash flows could negatively affect the fair value of our assets and result in a non-cash impairment charge. Some factors considered important that could trigger an impairment review include the following: significant underperformance relative to expected historical or projected future operating results, significant changes in the manner of our use of the acquired assets or the strategy for our overall business and significant sustained negative industry or economic trends.
The fair value of our reporting units is based on a blend of estimated discounted cash flows, publicly traded company multiples and transaction multiples. The results from each of these models are then weighted and combined into a single estimate of fair value for our reporting units. Estimated discounted cash flows are based on projected sales and related cost of sales. Publicly traded company multiples and acquisition multiples are derived from information on traded shares and analysis of recent acquisitions in the marketplace, respectively, for companies with operations similar to ours. The primary assumptions used in these various models include earnings multiples of acquisitions in a comparable industry, future cash flow estimates of each of the reporting units, weighted average cost of capital, working capital and capital expenditure requirements. Management did not make any material changes in its impairment assessment methodology during fiscal 2016. Management does not believe the estimates used in the analysis are reasonably likely to change materially in the future but we will continue to assess the estimates in the future based on the expectations of the reporting units. Changes in assumptions used in the fair value calculation could result in an estimated reporting unit fair value that is below the carrying value, which may result in an impairment of goodwill.
We completed our annual goodwill impairment test in the fourth quarter for each of our reporting units. We have the option of performing an assessment of certain qualitative factors (“Step 0”) to determine if it is more likely than not that the fair value of a reporting unit is less than its carrying value or proceeding directly to a quantitative impairment test (“Step 1”).
Our reporting units within the engineered building systems and metal components segments generally had a fair value in excess of 20% of their respective carrying value as of the most recent Step 1 test (performed within the last three years) or were valued recently in connection with the CENTRIA Acquisition. For each of the reporting units, we evaluated and weighed the events and circumstances to determine whether it was more likely than not that the fair value was below the carrying amount. Examples of qualitative factors that management assesses in the Step 0 test include the Company’s financial performance, market and competitive factors in the nonresidential construction industry, the amount of excess fair value over the carrying value of each reporting unit evident in prior years, the length of time since the most recent quantitative impairment test and other events specific to our reporting units.
Management considered factors that could impact the reporting unit fair values as estimated using the market and income approaches in the most recent Step 1 test. Management compared current year actual results to the projected results and reviewed current projections of cash flows, comparing those current projections to the projections included in the most recent Step 1 test. Also, management evaluated current macroeconomic factors as well as factors specific to the Company and the reporting units that have occurred and determined that they were not more likely than not to significantly affect the discount rates and other inputs and assumptions used in the valuation of the reporting units.
52
Based on management’s evaluation and weighting of the events and circumstances that have occurred since the most recent Step 1 test, we concluded that the events and circumstances identified as having a negative effect on the fair value outweighed those having a positive effect for a reporting unit within the metal components segment. As such, management proceeded with Step 1 of the goodwill impairment test for that reporting unit in fiscal 2016 and determined that the fair value of the reporting unit exceeded the carrying amount. Goodwill for that reporting unit was not considered impaired. For all other reporting units in our engineered building systems and metal components segments, management concluded that it was not more likely than not that the fair value of each reporting unit was below its carrying amount. Therefore, management determined that it was not necessary to perform a Step 1 goodwill impairment test for these reporting units in fiscal 2016.
Management performed the annual impairment test of indefinite-lived intangibles using the Step 0 test during the fiscal fourth quarter. The assessment included evaluating whether any facts or circumstances indicated that the useful lives of those intangibles was no longer indefinite. If, due to changes in facts and circumstances, management determines that these intangible assets have definite useful lives, amortization will commence at that time on a prospective basis. No such changes in facts or circumstances were determined to exist. The key inputs and assumptions that most significantly affect the fair value of the indefinite-lived intangibles and require management’s judgment are typically the discount rate, projected sales and estimated royalty rate (under the relief-from-royalty method). Management concluded that it was not more likely than not that the fair value of the indefinite-lived intangibles was below the carrying amount.
Allowance for doubtful accounts. Our allowance for doubtful accounts reflects reserves for customer receivables to reduce receivables to amounts expected to be collected. Management uses significant judgment in estimating uncollectible amounts. In estimating uncollectible accounts, management considers factors such as current overall economic conditions, industry-specific economic conditions, historical customer performance and anticipated customer performance. While we believe these processes effectively address our exposure for doubtful accounts and credit losses have historically been within expectations, changes in the economy, industry, or specific customer conditions may require adjustments to the allowance for doubtful accounts. In fiscal 2016, 2015 and 2014, we established new reserves for doubtful accounts of $1.3 million, $0.1 million and $0.3 million, respectively. In fiscal years 2016, 2015 and 2014, we wrote off uncollectible accounts, net of recoveries, of $1.6 million, $0.1 million and $0.2 million, respectively, all of which had been previously reserved.
Inventory valuation. In determining the valuation of inventory, we record an allowance for obsolete inventory using the specific identification method for steel coils and other raw materials. Management also reviews the carrying value of inventory for lower of cost or market. Our primary raw material is steel coils which have historically shown significant price volatility. We generally manufacture to customers’ orders, and thus maintain raw materials with a variety of ultimate end uses. We record a lower of cost or market charge to cost of sales when the net realizable value (selling price less estimated cost of disposal), based on our intended end usage, is below our estimated product cost at completion. Estimated net realizable value is based upon assumptions of targeted inventory turn rates, future demand, anticipated finished goods sales prices, management strategy and market conditions for steel. If projected end usage or projected sales prices change significantly from management’s current estimates or actual market conditions are less favorable than those projected by management, inventory write-downs may be required.
Property, plant and equipment valuation. We assess the recoverability of the carrying amount of property, plant and equipment for assets held and used at the lowest level asset grouping for which cash flows can be separately identified, which may be at an individual asset level, plant level or divisional level depending on the intended use of the related asset, if certain events or changes in circumstances indicate that the carrying value of such asset groups may not be recoverable and the undiscounted cash flows estimated to be generated by those asset groups are less than the carrying amount of those asset groups. Events and circumstances which indicate an impairment include (a) a significant decrease in the market value of the asset groups; (b) a significant change in the extent or manner in which an asset group is being used or in its physical condition; (c) a significant change in our business conditions; (d) an accumulation of costs significantly in excess of the amount originally expected for the acquisition or construction of an asset group; (e) a current-period operating or cash flow loss combined with a history of operating or cash flow losses or a projection that demonstrates continuing losses associated with the use of an asset group; or (f) a current expectation that, more likely than not, an asset group will be sold or otherwise disposed of significantly before the end of its previously estimated useful life. We assess our asset groups for any indicators of impairment on at least a quarterly basis.
If we determine that the carrying value of an asset group is not recoverable based on expected undiscounted future cash flows, excluding interest charges, we record an impairment loss equal to the excess of the carrying amount of the asset group over its fair value. The fair value of asset groups is determined based on prices of similar assets adjusted for their remaining useful life.
Contingencies. We establish reserves for estimated loss contingencies when we believe a loss is probable and the amount of the loss can be reasonably estimated. Our contingent liability reserves are related primarily to litigation and environmental matters. Legal costs for uninsured claims are accrued as part of the ultimate settlement. Revisions to
53
contingent liability reserves are reflected in income in the period in which there are changes in facts and circumstances that affect our previous assumptions with respect to the likelihood or amount of loss. Reserves for contingent liabilities are based upon our assumptions and estimates regarding the probable outcome of the matter. We estimate the probable cost by evaluating historical precedent as well as the specific facts relating to each particular contingency (including the opinion of outside advisors, professionals and experts). Should the outcome differ from our assumptions and estimates or other events result in a material adjustment to the accrued estimated reserves, revisions to the estimated reserves for contingent liabilities would be required and would be recognized in the period the new information becomes known.
RECENT ACCOUNTING PRONOUNCEMENTS
In May 2014, the FASB issued ASU 2014-09, Revenue from Contracts with Customers (Topic 606). ASU 2014-09 supersedes the revenue recognition requirements in ASC Topic 605, Revenue Recognition, and most industry-specific guidance. The core principle of the guidance is that an entity should recognize revenue to depict the transfer of promised goods or services to customers in an amount that reflects the consideration to which the entity expects to be entitled in exchange for those goods or services. The FASB has also issued ASU 2016-08, Revenue from Contracts with Customers: Principal versus Agent Considerations (Reporting Revenue Gross versus Net); ASU 2016-10, Revenue from Contracts with Customers: Identifying Performance Obligations and Licensing; ASU 2016-11, Rescission of SEC Guidance Because of Accounting Standards Updates 2014-09 and 2014-16 Pursuant to Staff Announcements at the March 3, 2016 EITF Meeting; and ASU 2016-12, Revenue from Contracts with Customers: Narrow-Scope Improvements and Practical Expedients, all of which were issued to improve and clarify the guidance in ASU 2014-09. These ASUs are effective for our fiscal year ending November 3, 2019, including interim periods within that fiscal year, and will be adopted using either a full or modified retrospective approach. We are currently assessing the potential effects of these changes to our consolidated financial statements.
In June 2014, the FASB issued ASU 2014-12, Accounting for Share-Based Payments When the Terms of an Award Provide That a Performance Target Could Be Achieved after the Requisite Service Period. ASU 2014-12 requires that a performance target that affects vesting and could be achieved after the requisite service period be treated as a performance condition. A reporting entity should apply existing guidance in ASC Topic 718, Compensation — Stock Compensation, as it relates to such awards. ASU 2014-12 is effective for our first quarter in fiscal 2017, with early adoption permitted. We do not expect that the adoption of this guidance will have a material impact on our consolidated financial statements.
In April 2015, the FASB issued ASU 2015-03, Interest - Imputation of Interest (Subtopic 835-30): Simplifying the Presentation of Debt Issuance Costs. ASU 2015-03 requires debt issuance costs related to a recognized debt liability be presented on the balance sheet as a direct deduction from the carrying amount of the related debt liability instead of being presented as a separate asset. The update requires retrospective application and is effective for our fiscal year ending October 29, 2017, including interim periods within that fiscal year. In August 2015, FASB issued ASU 2015-15, Interest - Imputation of Interest (Subtopic 835-30) - Presentation and Subsequent Measurement of Debt Issuance Costs Associated with Line-of-Credit Arrangements (Amendments to SEC Paragraphs Pursuant to Staff Announcement at June 18, 2015 EITF Meeting), to provide further clarification to ASU 2015-03 as it relates to the presentation and subsequent measurement of debt issuance costs associated with line of credit arrangements. Upon adoption of this guidance, we expect to reclassify approximately $8 million in deferred financing costs as a reduction of the carrying amount of the debt liability.
In April 2015, the FASB issued ASU 2015-05, Intangibles — Goodwill and Other — Internal-Use Software (Subtopic 350-40): Customer’s Accounting for Fees Paid in a Cloud Computing Arrangement. ASU 2015-05 provides guidance to customers about whether a cloud computing arrangement includes a software license. If a cloud computing arrangement includes a software license, the guidance specifies that the customer should account for the software license element of the arrangement consistent with the acquisition of other software licenses. ASU 2015-05 further specifies that the customer should account for a cloud computing arrangement as a service contract if the arrangement does not include a software license. The guidance is effective for our fiscal year ending October 29, 2017, including interim periods within that fiscal year. We are currently assessing the impact of this guidance on our consolidated financial statements. We anticipate that we will adopt the guidance on a prospective basis.
In July 2015, the FASB issues ASU 2015-11, Inventory (Topic 330): Simplifying the Measurement of Inventory. ASU 2015-11 requires that inventory that has historically been measured using first-in, first-out (FIFO) or average cost method should now be measured at the lower of cost and net realizable value. The update requires prospective application and is effective for our fiscal year ending October 28, 2018, including interim periods within that fiscal year. We do not expect that the adoption of this guidance will have a material impact on our consolidated financial statements.
In November 2015, the FASB issued ASU 2015-17, Balance Sheet Classification of Deferred Taxes. ASU 2015-17 requires all deferred tax assets and liabilities to be presented on the balance sheet as noncurrent. ASU 2015-17 is effective for our fiscal year ending October 28, 2018, including interim periods within that fiscal year. Upon adoption, we will present the
54
net deferred tax assets as noncurrent and reclassify any current deferred tax assets and liabilities in our consolidated financial position on a retrospective basis.
In February 2016, the FASB issued ASU 2016-02, Leases, which will require lessees to record most leases on the balance sheet and modifies the classification criteria and accounting for sales-type leases and direct financing leases for lessors. ASU 2016-02 is effective for our fiscal year ending November 1, 2020, including interim periods within that fiscal year. The guidance requires entities to use a modified retrospective approach for leases that exist or are entered into after the beginning of the earliest comparative period in the financial statements. We are evaluating the impact that the adoption of this guidance will have on our consolidated financial statements.
In March 2016, the FASB issued ASU 2016-09, Improvements to Employee Share-Based Payment Accounting, which is intended to simplify certain aspects of the accounting for share-based payment award transactions, including income tax effects when awards vest or settle, repurchase of employees’ shares to satisfy statutory tax withholding obligations, an option to account for forfeitures as they occur, and classification of certain amounts on the statement of cash flows. ASU 2016-09 is effective for our fiscal year ending October 28, 2018, including interim periods within that fiscal year. We are evaluating the impact that the adoption of this ASU will have on our consolidated financial statements.
In June 2016, the FASB issued ASU 2016-13, Financial Instruments—Credit Losses (Topic 326): Measurement of Credit Losses on Financial Instruments. This ASU requires measurement and recognition of expected credit losses for financial assets held, including trade receivables. ASU 2016-13 is effective for our fiscal year ending October 31, 2021, including interim periods within that fiscal year. We are evaluating the impact that the adoption of this ASU will have on our consolidated financial position, result of operations and cash flows.
In August 2016, the FASB issued ASU No. 2016-15, Statement of Cash Flows (Topic 230): Classification of Certain Cash Receipts and Cash Payments, which provides guidance on eight cash flow classification issues with the objective of reducing differences in practice. We will be required to adopt the amendments in this ASU in annual and interim periods for our fiscal year ending November 3, 2019, with early adoption permitted. Adoption is required to be on a retrospective basis, unless impracticable for any of the amendments, in which case a prospective application is permitted. We are in the process of evaluating the impact that ASU 2016-15 will have on our consolidated financial statements.
In October 2016, the FASB issued ASU 2016-16, Income Taxes (Topic 740): Intra-Entity Transfers of Assets Other than Inventory, which eliminates the exception that prohibits the recognition of current and deferred income tax effects for intra-entity transfers of assets other than inventory until the asset has been sold to an outside party. We will be required to adopt the amendments in this ASU in the annual and interim periods for our fiscal year ending November 3, 2019, with early adoption permitted. The application of the amendments will require the use of a modified retrospective basis through a cumulative-effect adjustment to retained earnings as of the beginning of the period of adoption. We are evaluating the standard and the impact it will have on our consolidated financial statements.
Item 7A. Quantitative and Qualitative Disclosures About Market Risk.
Steel Prices
We are subject to market risk exposure related to volatility in the price of steel. For the fiscal year ended October 30, 2016, material costs (predominantly steel costs) constituted approximately 68% of our cost of sales. Our business is heavily dependent on the price and supply of steel. Our various products are fabricated from steel produced by mills to forms including bars, plates, structural shapes, sheets, hot-rolled coils and galvanized or Galvalume®-coated coils (Galvalume® is a registered trademark of BIEC International, Inc.). The steel industry is highly cyclical in nature, and steel prices have been volatile in recent years and may remain volatile in the future. Steel prices are influenced by numerous factors beyond our control, including general economic conditions domestically and internationally, the availability of raw materials, competition, labor costs, freight and transportation costs, production costs, import duties and other trade restrictions. Based on the cyclical nature of the steel industry, we expect steel prices will continue to be volatile.
Although we have the ability to purchase steel from a number of suppliers, a production cutback by one or more of our current suppliers could create challenges in meeting delivery schedules to our customers. Because we have periodically adjusted our contract prices, particularly in the engineered building systems segment, we have generally been able to pass increases in our raw material costs through to our customers. The graph below shows the monthly CRU Index data for the North American Steel Price Index over the historical five-year period. The CRU North American Steel Price Index has been published by the CRU Group since 1994 and we believe this index appropriately depicts the volatility we have experienced in steel prices. The index, based on a CRU survey of industry participants, is now commonly used in the settlement of physical and financial contracts in the steel industry. The prices surveyed are purchases for forward delivery, according to lead time, which will vary. For example, the October index would pertain to our fiscal December steel purchase deliveries based on current lead-times. The volatility in this steel price index is comparable to the volatility we experienced in our average cost of steel.
55
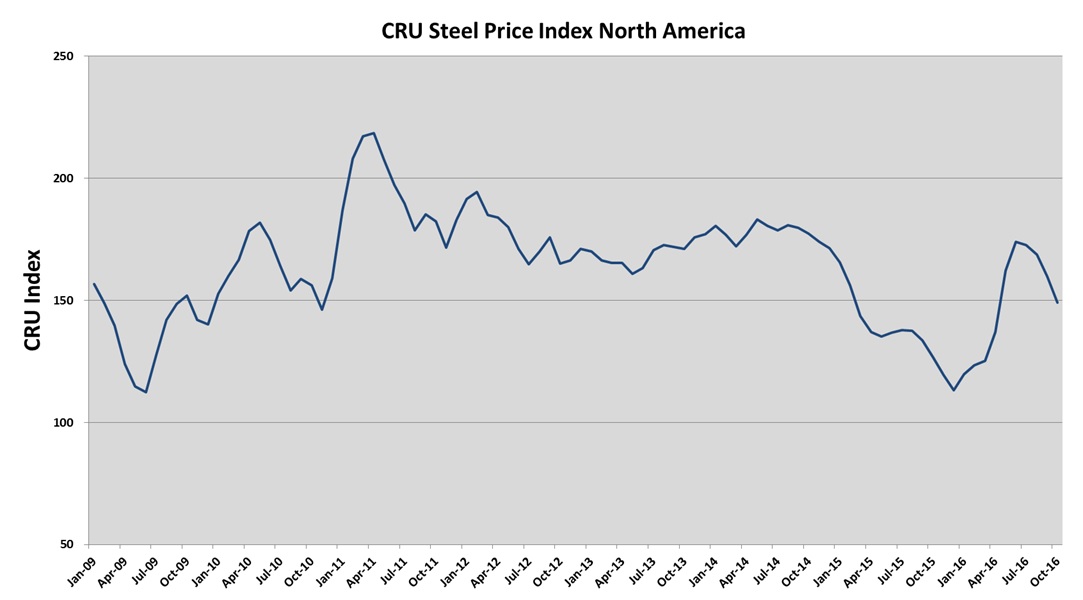
We normally do not maintain an inventory of steel in excess of our current production requirements. However, from time to time, we may purchase steel in advance of announced steel price increases. In addition, it is our current practice to purchase all steel inventory that has been ordered but is not in our possession. Therefore, our inventory may increase if demand for our products declines. We can give no assurance that steel will remain available or that prices will not continue to be volatile.
With material costs (predominantly steel costs) accounting for approximately 68% of our cost of sales for fiscal 2016, a one percent change in the cost of steel could have resulted in a pre-tax impact on cost of sales of approximately $8.5 million for our fiscal year ended October 30, 2016. The impact to our financial results of operations would be significantly dependent on the competitive environment and the costs of other alternative building products, which could impact our ability to pass on these higher costs.
Other Commodity Risks
In addition to market risk exposure related to the volatility in the price of steel, we are subject to market risk exposure related to volatility in the price of natural gas. As a result, we occasionally enter into both index-priced and fixed-price contracts for the purchase of natural gas. We have evaluated these contracts to determine whether the contracts are derivative instruments. Certain contracts that meet the criteria for characterization as a derivative instrument may be exempted from hedge accounting treatment as normal purchases and normal sales and, therefore, these forward contracts are not marked to market. At October 30, 2016, all our contracts for the purchase of natural gas met the scope exemption for normal purchases and normal sales.
Interest Rates
We are subject to market risk exposure related to changes in interest rates on our Credit Agreement and Amended ABL Facility. These instruments bear interest at an agreed upon percentage point spread from either the prime interest rate or LIBOR. Under our Credit Agreement, we may, at our option, fix the interest rate for certain borrowings based on a spread over LIBOR for 30 days to six months. At October 30, 2016, we had $154.1 million outstanding under our Credit Agreement. Based on this balance, an immediate change of one percent in the interest rate would cause a change in interest expense of approximately $1.5 million on an annual basis. The fair value of our Credit Agreement, due June 2019, at October 30, 2016 and November 1, 2015 was approximately $154.1 million and $193.7 million, respectively, compared to the face value of $154.1 million and $194.1 million, respectively.
See Note 11 — Long-Term Debt and Note Payable in the notes to the consolidated financial statements for more information on the material terms of our long-term debt.
56
The table below presents scheduled debt maturities and related weighted average interest rates for each of the fiscal years relating to debt obligations as of October 30, 2016. Weighted average variable rates are based on LIBOR rates assuming a 1.00% LIBOR floor at October 30, 2016, plus applicable margins.
Scheduled Maturity Date(1) | Fair Value | |||||||||||||||||||||||||||||||
2017 | 2018 | 2019 | 2020 | 2021 | Thereafter | Total | 10/30/2016 | |||||||||||||||||||||||||
(In millions, except interest rate percentages) | ||||||||||||||||||||||||||||||||
Total Debt: | ||||||||||||||||||||||||||||||||
Fixed Rate | $ | — | $ | — | $ | — | $ | — | $ | — | $ | 250.0 | $ | 250.0 | $ | 272.5 | (2) | |||||||||||||||
Interest Rate | — | — | — | — | — | 8.25 | % | 8.25 | % | |||||||||||||||||||||||
Variable Rate | $ | — | $ | — | $ | 154.1 | $ | — | $ | — | $ | — | $ | 154.1 | $ | 154.1 | (2) | |||||||||||||||
Average interest rate | — | — | 4.25 | % | — | — | — | 4.25 | % | |||||||||||||||||||||||
(1) | Expected maturity date amounts are based on the face value of debt and do not reflect fair market value of the debt. |
(2) | Based on recent trading activities of comparable market instruments. |
Foreign Currency Exchange Rates
We are exposed to the effect of exchange rate fluctuations on the U.S. dollar value of foreign currency denominated operating revenue and expenses. The functional currency for our Mexico operations is the U.S. dollar. Adjustments resulting from the re-measurement of the local currency financial statements into the U.S. dollar functional currency, which uses a combination of current and historical exchange rates, are included in net income in the current period. Net foreign currency re-measurement gains (losses) were $(0.8) million, $(1.8) million and $(0.9) million for the fiscal years ended October 30, 2016, November 1, 2015 and November 2, 2014, respectively.
The functional currency for our Canadian operations is the Canadian dollar. Translation adjustments resulting from translating the functional currency financial statements into U.S. dollar equivalents are reported separately in accumulated other comprehensive income in stockholders’ equity. The net foreign currency exchange losses included in net income for the fiscal years ended October 30, 2016, November 1, 2015 and November 2, 2014 was $(0.6) million, $(0.4) million and $(0.2) million, respectively. Net foreign currency translation adjustment, net of tax, and included in other comprehensive income was $(0.3) million, $0.1 million and $(0.4) million for the fiscal years ended October 30, 2016, November 1, 2015 and November 2, 2014, respectively.
As a result of the CENTRIA Acquisition, we have operations in China and are exposed to fluctuations in the foreign currency exchange rate between the U.S. dollar and Chinese yuan. The functional currency for our China operations is the Chinese yuan. The net foreign currency translation adjustment was insignificant for the fiscal years ended October 30, 2016 and November 1, 2015.
57
Item 8. Financial Statements and Supplementary Data.
INDEX TO FINANCIAL STATEMENTS
Financial Statements: | |
58
MANAGEMENT’S REPORT ON INTERNAL CONTROL OVER FINANCIAL REPORTING
Management of NCI Building Systems, Inc. (the “Company” or “our”) is responsible for establishing and maintaining adequate internal control over financial reporting for the Company as defined in Rules 13a-15(f) and 15d-15(f) under the Securities Exchange Act of 1934. The Company’s internal control system was designed to provide reasonable assurance to the Company’s management and board of directors regarding the reliability of financial reporting and the preparation of financial statements for external purposes in accordance with U.S. generally accepted accounting principles.
Internal control over financial reporting includes the controls themselves, monitoring (including internal auditing practices), and actions taken to correct deficiencies as identified.
Internal control over financial reporting has inherent limitations and may not prevent or detect misstatements. The design of an internal control system is also based in part upon assumptions and judgments made by management about the likelihood of future events, and there can be no assurance that an internal control will be effective under all potential future conditions. Therefore, even those systems determined to be effective can provide only reasonable, not absolute, assurance with respect to the financial statement preparation and presentation. Further, because of changes in conditions, the effectiveness of internal control over financial reporting may vary over time.
Management assessed the effectiveness of the Company’s internal control over financial reporting as of October 30, 2016. In making this assessment, management used the criteria for internal control over financial reporting described in Internal Control — Integrated Framework by the Committee of Sponsoring Organizations of the Treadway Commission (2013 framework). Management’s assessment included an evaluation of the design of the Company’s internal control over financial reporting and testing of the operating effectiveness of its internal control over financial reporting.
A material weakness in internal control over financial reporting is a deficiency, or combination of deficiencies, in internal control over financial reporting, such that there is a reasonable possibility that a material misstatement of the annual or interim financial statements will not be prevented or detected on a timely basis.
Management reviewed the results of its assessment with the Audit Committee of the Company’s Board of Directors. Based on this assessment, management has concluded that, as of October 30, 2016, the Company’s internal control over financial reporting was ineffective because of the material weaknesses relating to (1) the control environment of the CENTRIA subsidiary, which the Company acquired in January 2015, and (2) the design of controls over the allocation of total contract consideration in multiple element revenue arrangements within the Company’s engineered building systems segment. The material weakness at CENTRIA specifically related to i) the lack of effective control procedures to support the preparation, analysis and review of certain significant account reconciliations required to assess the appropriateness of account balances at period end and ii) limitations in the ability of the accounting system to produce complete and accurate reports to support the timely performance of key controls and the analysis of changes, or lack thereof, in certain account balances. The material weakness associated with the allocation of total contract consideration in multiple element revenue arrangements specifically resulted from gaps in the design of controls, including general IT and other IT-related controls, over the monitoring and review of the estimated selling price that was allocated to each separate unit of accounting for multiple element revenue arrangements within the Company’s engineered building systems segment.
Ernst & Young LLP, the independent registered public accounting firm that has audited the Company’s consolidated financial statements, has audited the effectiveness of the Company’s internal control over financial reporting as of October 30, 2016, as stated in their report included elsewhere herein.
59
REPORT OF INDEPENDENT REGISTERED PUBLIC ACCOUNTING FIRM
The Board of Directors and Shareholders of NCI Building Systems, Inc.
We have audited the internal control over financial reporting of NCI Building Systems, Inc. (the “Company”) as of October 30, 2016, based on criteria established in Internal Control—Integrated Framework issued by the Committee of Sponsoring Organizations of the Treadway Commission (2013 framework) (the “COSO criteria”). NCI Building Systems, Inc.’s management is responsible for maintaining effective internal control over financial reporting, and for its assessment of the effectiveness of internal control over financial reporting included in the accompanying Management’s Report on Internal Control over Financial Reporting. Our responsibility is to express an opinion on the Company’s internal control over financial reporting based on our audit.
We conducted our audit in accordance with the standards of the Public Company Accounting Oversight Board (United States). Those standards require that we plan and perform the audit to obtain reasonable assurance about whether effective internal control over financial reporting was maintained in all material respects. Our audit included obtaining an understanding of internal control over financial reporting, assessing the risk that a material weakness exists, testing and evaluating the design and operating effectiveness of internal control based on the assessed risk, and performing such other procedures as we considered necessary in the circumstances. We believe that our audit provides a reasonable basis for our opinion.
A company’s internal control over financial reporting is a process designed to provide reasonable assurance regarding the reliability of financial reporting and the preparation of financial statements for external purposes in accordance with generally accepted accounting principles. A company’s internal control over financial reporting includes those policies and procedures that (1) pertain to the maintenance of records that, in reasonable detail, accurately and fairly reflect the transactions and dispositions of the assets of the company; (2) provide reasonable assurance that transactions are recorded as necessary to permit preparation of financial statements in accordance with generally accepted accounting principles, and that receipts and expenditures of the company are being made only in accordance with authorizations of management and directors of the company; and (3) provide reasonable assurance regarding prevention or timely detection of unauthorized acquisition, use, or disposition of the company’s assets that could have a material effect on the financial statements.
Because of its inherent limitations, internal control over financial reporting may not prevent or detect misstatements. Also, projections of any evaluation of effectiveness to future periods are subject to the risk that controls may become inadequate because of changes in conditions, or that the degree of compliance with the policies or procedures may deteriorate.
A material weakness is a deficiency, or combination of deficiencies, in internal control over financial reporting, such that there is a reasonable possibility that a material misstatement of the company’s annual or interim financial statements will not be prevented or detected on a timely basis. The following material weaknesses have been identified and included in management’s assessment. Management has identified a material weakness in the control environment at the CENTRIA subsidiary. This material weakness specifically related to i) the lack of effective control procedures to support the preparation, analysis and review of certain significant account reconciliations required to assess the appropriateness of account balances at period end and ii) limitations in the ability of the accounting system to produce complete and accurate reports to support the timely performance of key controls and the analysis of changes, or lack thereof, in certain account balances. Management has also identified a material weakness related to the allocation of total contract consideration in multiple element revenue arrangements within the Company’s engineered building systems segment. This material weakness specifically resulted from gaps in the design of controls, including general IT and other IT-related controls, over the monitoring and review of the estimated selling price that was allocated to each separate unit of accounting for multiple element revenue arrangements within the Company’s engineered building systems segment. We also have audited, in accordance with the standards of the Public Company Accounting Oversight Board (United States), the consolidated balance sheets of NCI Building Systems, Inc. as of October 30, 2016 and November 1, 2015, and the related consolidated statements of operations, comprehensive income (loss), stockholders’ equity and cash flows for each of the three years in the period ended October 30, 2016 of NCI Building Systems, Inc. These material weaknesses were considered in determining the nature, timing and extent of audit tests applied in our audit of the fiscal year 2016 financial statements, and this report does not affect our report dated January 9, 2017, which expressed an unqualified opinion on those financial statements.
60
In our opinion, because of the effect of the material weaknesses described above on the achievement of the objectives of the control criteria, NCI Building Systems, Inc. has not maintained effective internal control over financial reporting as of October 30, 2016, based on the COSO criteria.
/s/ Ernst & Young LLP
Houston, Texas
January 9, 2017
61
REPORT OF INDEPENDENT REGISTERED PUBLIC ACCOUNTING FIRM
The Board of Directors and Shareholders of NCI Building Systems, Inc.
We have audited the accompanying consolidated balance sheets of NCI Building Systems, Inc. (the “Company”) as of October 30, 2016 and November 1, 2015, and the related consolidated statements of operations, comprehensive income (loss), stockholders’ equity and cash flows for each of the three years in the period ended October 30, 2016. These financial statements are the responsibility of the Company’s management. Our responsibility is to express an opinion on these financial statements based on our audits.
We conducted our audits in accordance with the standards of the Public Company Accounting Oversight Board (United States). Those standards require that we plan and perform the audit to obtain reasonable assurance about whether the financial statements are free of material misstatement. An audit includes examining, on a test basis, evidence supporting the amounts and disclosures in the financial statements. An audit also includes assessing the accounting principles used and significant estimates made by management, as well as evaluating the overall financial statement presentation. We believe that our audits provide a reasonable basis for our opinion.
In our opinion, the financial statements referred to above present fairly, in all material respects, the consolidated financial position of NCI Building Systems, Inc. at October 30, 2016 and November 1, 2015, and the consolidated results of its operations and its cash flows for each of the three years in the period ended October 30, 2016, in conformity with U.S. generally accepted accounting principles.
We also have audited, in accordance with the standards of the Public Company Accounting Oversight Board (United States), NCI Building Systems, Inc.’s internal control over financial reporting as of October 30, 2016, based on criteria established in Internal Control—Integrated Framework issued by the Committee of Sponsoring Organizations of the Treadway Commission (2013 framework) and our report dated January 9, 2017 expressed an adverse opinion thereon.
/s/ Ernst & Young LLP
Houston, Texas
January 9, 2017
62
CONSOLIDATED STATEMENTS OF OPERATIONS
NCI BUILDING SYSTEMS, INC.
Fiscal Year Ended | |||||||||||
October 30, 2016 | November 1, 2015 | November 2, 2014 | |||||||||
(In thousands, except per share data) | |||||||||||
Sales | $ | 1,684,928 | $ | 1,563,693 | $ | 1,370,540 | |||||
Cost of sales | 1,258,680 | 1,189,019 | 1,080,027 | ||||||||
Gain on sale of assets and asset recovery | (1,642 | ) | — | — | |||||||
Fair value adjustment of acquired inventory | — | 2,358 | — | ||||||||
Gain on insurance recovery | — | — | (1,311 | ) | |||||||
Gross profit | 427,890 | 372,316 | 291,824 | ||||||||
Engineering, selling, general and administrative expenses | 302,551 | 286,840 | 257,635 | ||||||||
Intangible asset amortization | 9,638 | 16,903 | 4,053 | ||||||||
Strategic development and acquisition related costs | 2,670 | 4,201 | 4,998 | ||||||||
Restructuring and impairment charges | 4,252 | 11,306 | 42 | ||||||||
Gain on legal settlements | — | (3,765 | ) | — | |||||||
Income from operations | 108,779 | 56,831 | 25,096 | ||||||||
Interest income | 146 | 72 | 126 | ||||||||
Interest expense | (31,019 | ) | (28,460 | ) | (12,455 | ) | |||||
Foreign exchange loss | (1,401 | ) | (2,152 | ) | (1,097 | ) | |||||
Gain from bargain purchase | 1,864 | — | — | ||||||||
Other income, net | 595 | 499 | 1,005 | ||||||||
Income before income taxes | 78,964 | 26,790 | 12,675 | ||||||||
Provision for income taxes | 27,937 | 8,972 | 1,490 | ||||||||
Net income | $ | 51,027 | $ | 17,818 | $ | 11,185 | |||||
Net income allocated to participating securities | (389 | ) | (172 | ) | (100 | ) | |||||
Net income applicable to common shares | $ | 50,638 | $ | 17,646 | $ | 11,085 | |||||
Income per common share: | |||||||||||
Basic | $ | 0.70 | $ | 0.24 | $ | 0.15 | |||||
Diluted | $ | 0.70 | $ | 0.24 | $ | 0.15 | |||||
Weighted average number of common shares outstanding: | |||||||||||
Basic | 72,411 | 73,271 | 73,079 | ||||||||
Diluted | 72,857 | 73,923 | 74,709 | ||||||||
See accompanying notes to the consolidated financial statements.
63
CONSOLIDATED STATEMENTS OF COMPREHENSIVE INCOME (LOSS)
NCI BUILDING SYSTEMS, INC.
Fiscal Year Ended | |||||||||||
October 30, 2016 | November 1, 2015 | November 2, 2014 | |||||||||
(In thousands) | |||||||||||
Comprehensive income: | |||||||||||
Net income | $ | 51,027 | $ | 17,818 | $ | 11,185 | |||||
Other comprehensive income (loss), net of tax: | |||||||||||
Foreign exchange translation (losses) gains and other (net of income tax of $0 in 2016, 2015 and 2014) | (325 | ) | 80 | (367 | ) | ||||||
Unrecognized actuarial gains (losses) on pension obligation (net of income tax of $1,245 in 2016, $(243) in 2015 and $2,452 in 2014) | (1,948 | ) | 379 | (3,936 | ) | ||||||
Other comprehensive income (loss) | (2,273 | ) | 459 | (4,303 | ) | ||||||
Comprehensive income | $ | 48,754 | $ | 18,277 | $ | 6,882 | |||||
See accompanying notes to the consolidated financial statements.
64
CONSOLIDATED BALANCE SHEETS
NCI BUILDING SYSTEMS, INC.
October 30, 2016 | November 1, 2015 | ||||||
(In thousands, except share data) | |||||||
ASSETS | |||||||
Current assets: | |||||||
Cash and cash equivalents | $ | 65,403 | $ | 99,662 | |||
Restricted cash | 310 | 682 | |||||
Accounts receivable, net | 182,258 | 166,800 | |||||
Inventories, net | 186,824 | 157,828 | |||||
Income taxes receivable | 982 | — | |||||
Deferred income taxes | 29,104 | 27,390 | |||||
Investments in debt and equity securities, at market | 5,748 | 5,890 | |||||
Prepaid expenses and other | 29,971 | 31,834 | |||||
Assets held for sale | 4,256 | 6,261 | |||||
Total current assets | 504,856 | 496,347 | |||||
Property, plant and equipment, net | 242,212 | 257,892 | |||||
Goodwill | 154,271 | 158,026 | |||||
Intangible assets, net | 146,769 | 156,395 | |||||
Other assets, net | 10,188 | 11,069 | |||||
Total assets | $ | 1,058,296 | $ | 1,079,729 | |||
LIABILITIES AND STOCKHOLDERS’ EQUITY | |||||||
Current liabilities: | |||||||
Note payable | $ | 460 | $ | 513 | |||
Accounts payable | 142,913 | 145,917 | |||||
Accrued compensation and benefits | 72,612 | 62,200 | |||||
Accrued interest | 7,165 | 6,389 | |||||
Accrued income taxes | — | 9,296 | |||||
Other accrued expenses | 103,384 | 97,309 | |||||
Total current liabilities | 326,534 | 321,624 | |||||
Long-term debt | 404,147 | 444,147 | |||||
Deferred income taxes | 24,804 | 20,807 | |||||
Other long-term liabilities | 21,494 | 21,175 | |||||
Total long-term liabilities | 450,445 | 486,129 | |||||
Stockholders’ equity: | |||||||
Common stock, $.01 par value, 100,000,000 shares authorized; 71,581,273 and 74,529,750 shares issued in 2016 and 2015, respectively; and 70,806,202 and 74,082,324 shares outstanding in 2016 and 2015, respectively | 715 | 745 | |||||
Additional paid-in capital | 603,120 | 640,767 | |||||
Accumulated deficit | (302,706 | ) | (353,733 | ) | |||
Accumulated other comprehensive loss, net | (10,553 | ) | (8,280 | ) | |||
Treasury stock, at cost (775,071 and 447,426 shares in 2016 and 2015, respectively) | (9,259 | ) | (7,523 | ) | |||
Total stockholders’ equity | 281,317 | 271,976 | |||||
Total liabilities and stockholders’ equity | $ | 1,058,296 | $ | 1,079,729 | |||
See accompanying notes to the consolidated financial statements.
65
CONSOLIDATED STATEMENTS OF CASH FLOWS
NCI BUILDING SYSTEMS, INC.
Fiscal Year Ended | |||||||||||
October 30, 2016 | November 1, 2015 | November 2, 2014 | |||||||||
(In thousands) | |||||||||||
Cash flows from operating activities: | |||||||||||
Net income | $ | 51,027 | $ | 17,818 | $ | 11,185 | |||||
Adjustments to reconcile net income to net cash provided by operating activities: | |||||||||||
Depreciation and amortization | 41,924 | 51,392 | 35,876 | ||||||||
Amortization of deferred financing costs and debt discount | 1,908 | 1,483 | 1,076 | ||||||||
Share-based compensation expense | 10,892 | 9,379 | 10,168 | ||||||||
(Gain) losses on assets, net | (2,673 | ) | (15 | ) | 123 | ||||||
Asset impairment | — | 5,876 | 42 | ||||||||
(Gain) on insurance recovery | — | — | (1,311 | ) | |||||||
Provision for doubtful accounts | 1,343 | 110 | 256 | ||||||||
Provision (benefit) for deferred income taxes | 1,318 | 5,368 | (3,423 | ) | |||||||
Excess tax shortfalls (benefits) from share-based compensation arrangements | 289 | (745 | ) | (538 | ) | ||||||
Changes in operating assets and liabilities, net of effect of acquisitions: | |||||||||||
Accounts receivable | (18,141 | ) | 7,610 | (1,811 | ) | ||||||
Inventories | (29,054 | ) | 4,604 | (9,391 | ) | ||||||
Income tax receivable | (1,953 | ) | (2,634 | ) | 1,599 | ||||||
Prepaid expenses and other | 671 | (267 | ) | (4,579 | ) | ||||||
Accounts payable | (1,598 | ) | 11,475 | (26,394 | ) | ||||||
Accrued expenses | 12,656 | (6,052 | ) | 19,949 | |||||||
Other, net | 159 | (362 | ) | 739 | |||||||
Net cash provided by operating activities | 68,768 | 105,040 | 33,566 | ||||||||
Cash flows from investing activities: | |||||||||||
Acquisitions, net of cash acquired | (4,343 | ) | (247,123 | ) | — | ||||||
Capital expenditures | (21,024 | ) | (20,683 | ) | (18,020 | ) | |||||
Proceeds from insurance | 10,000 | — | 1,311 | ||||||||
Proceeds from sale of property, plant and equipment | 5,417 | 28 | 14 | ||||||||
Net cash used in investing activities | (9,950 | ) | (267,778 | ) | (16,695 | ) | |||||
Cash flows from financing activities: | |||||||||||
Decrease in restricted cash | 370 | 298 | — | ||||||||
Proceeds from stock options exercised | 12,612 | 354 | — | ||||||||
Issuance of debt | — | 250,000 | — | ||||||||
Excess tax (shortfalls) benefits from share-based compensation arrangements | (289 | ) | 745 | 538 | |||||||
Proceeds from Amended ABL facility | — | — | 72,000 | ||||||||
Payments on Amended ABL facility | — | — | (72,000 | ) | |||||||
Payments on term loan | (40,000 | ) | (41,240 | ) | (2,388 | ) | |||||
Payments on note payable | (1,430 | ) | (1,616 | ) | (1,590 | ) | |||||
Payment of financing costs | — | (9,217 | ) | (51 | ) | ||||||
Purchase of treasury stock | (64,015 | ) | (3,320 | ) | (23,798 | ) | |||||
Net cash (used in) provided by financing activities | (92,752 | ) | 196,004 | (27,289 | ) | ||||||
Effect of exchange rate changes on cash and cash equivalents | (325 | ) | (255 | ) | (367 | ) | |||||
Net (decrease) increase in cash and cash equivalents | (34,259 | ) | 33,011 | (10,785 | ) | ||||||
Cash and cash equivalents at beginning of period | 99,662 | 66,651 | 77,436 | ||||||||
Cash and cash equivalents at end of period | $ | 65,403 | $ | 99,662 | $ | 66,651 | |||||
Supplemental disclosure of cash flow information: | |||||||||||
Interest paid, net of amounts capitalized | $ | 28,063 | $ | 22,210 | $ | 11,508 | |||||
Taxes paid, net of amounts refunded | $ | 36,073 | $ | 7,462 | $ | 911 | |||||
See accompanying notes to the consolidated financial statements.
66
CONSOLIDATED STATEMENTS OF STOCKHOLDERS’ EQUITY
NCI BUILDING SYSTEMS, INC.
Common Stock | Additional Paid-In Capital | Retained Earnings (Deficit) | Accumulated Other Comprehensive (Loss) Income | Treasury Stock | Stockholders’ Equity | ||||||||||||||||||||||||
Shares | Amount | Shares | Amount | ||||||||||||||||||||||||||
(In thousands, except share data) | |||||||||||||||||||||||||||||
Balance, November 3, 2013 | 74,793,249 | $ | 748 | $ | 639,297 | $ | (382,735 | ) | $ | (4,436 | ) | (7,523 | ) | $ | (116 | ) | $ | 252,758 | |||||||||||
Treasury stock purchases | — | — | — | — | — | (1,381,277 | ) | (23,804 | ) | (23,804 | ) | ||||||||||||||||||
Retirement of treasury shares | (1,150,000 | ) | (12 | ) | (19,705 | ) | — | — | 1,150,000 | 19,717 | — | ||||||||||||||||||
Issuance of restricted stock | 125,846 | 1 | (1 | ) | — | — | — | — | — | ||||||||||||||||||||
Excess tax benefits from share-based compensation arrangements | — | — | 538 | — | — | — | — | 538 | |||||||||||||||||||||
Foreign exchange translation losses and other, net of taxes | — | — | — | — | (367 | ) | — | — | (367 | ) | |||||||||||||||||||
Unrecognized actuarial losses on pension obligations | — | — | — | — | (3,936 | ) | — | — | (3,936 | ) | |||||||||||||||||||
Share-based compensation | — | — | 10,168 | — | — | — | — | 10,168 | |||||||||||||||||||||
Net income | — | — | — | 11,185 | — | — | — | 11,185 | |||||||||||||||||||||
Balance, November 2, 2014 | 73,769,095 | $ | 737 | $ | 630,297 | $ | (371,550 | ) | $ | (8,739 | ) | (238,800 | ) | $ | (4,203 | ) | $ | 246,542 | |||||||||||
Treasury stock purchases | — | — | — | — | — | (208,626 | ) | (3,320 | ) | (3,320 | ) | ||||||||||||||||||
Issuance of restricted stock | 720,655 | 7 | (7 | ) | — | — | — | — | — | ||||||||||||||||||||
Stock options exercised | 40,000 | 1 | 353 | — | — | — | — | 354 | |||||||||||||||||||||
Excess tax benefits from share-based compensation arrangements | — | — | 745 | — | — | — | — | 745 | |||||||||||||||||||||
Foreign exchange translation gains and other, net of taxes | — | — | — | — | 80 | — | — | 80 | |||||||||||||||||||||
Unrecognized actuarial gains on pension obligations | — | — | — | — | 379 | — | — | 379 | |||||||||||||||||||||
Share-based compensation | — | — | 9,379 | — | — | — | — | 9,379 | |||||||||||||||||||||
Net income | — | — | — | 17,818 | — | — | — | 17,818 | |||||||||||||||||||||
Balance, November 1, 2015 | 74,529,750 | $ | 745 | $ | 640,767 | $ | (353,732 | ) | $ | (8,280 | ) | (447,426 | ) | $ | (7,523 | ) | $ | 271,976 | |||||||||||
Treasury stock purchases | — | — | — | — | — | (4,589,576 | ) | (64,015 | ) | (64,015 | ) | ||||||||||||||||||
Retirement of treasury shares | (4,423,564 | ) | (44 | ) | (62,235 | ) | — | — | 4,423,564 | 62,279 | — | ||||||||||||||||||
Issuance of restricted stock | 56,868 | — | — | — | — | (161,633 | ) | — | — | ||||||||||||||||||||
Stock options exercised | 1,418,219 | 14 | 12,598 | — | — | — | — | 12,612 | |||||||||||||||||||||
Excess tax (shortfall) benefits from share-based compensation arrangements | — | — | (289 | ) | — | — | — | — | (289 | ) | |||||||||||||||||||
Foreign exchange translation losses and other, net of taxes | — | — | — | — | (325 | ) | — | — | (325 | ) | |||||||||||||||||||
Deferred compensation obligation | — | — | 1,387 | — | — | — | — | 1,387 | |||||||||||||||||||||
Unrecognized actuarial losses on pension obligations | — | — | — | — | (1,948 | ) | — | — | (1,948 | ) | |||||||||||||||||||
Share-based compensation | — | — | 10,892 | — | — | — | — | 10,892 | |||||||||||||||||||||
Net income | — | — | — | 51,027 | — | — | — | 51,027 | |||||||||||||||||||||
Balance, October 30, 2016 | 71,581,273 | $ | 715 | $ | 603,120 | $ | (302,706 | ) | $ | (10,553 | ) | (775,071 | ) | $ | (9,259 | ) | $ | 281,317 | |||||||||||
See accompanying notes to the consolidated financial statements.
67
1. NATURE OF BUSINESS AND BASIS OF PRESENTATION
Nature of Business
NCI Building Systems, Inc. (together with its subsidiaries, unless otherwise indicated, the “Company,” “we,” “us” or “our”) is one of North America’s largest integrated manufacturers and marketers of metal products for the nonresidential construction industry. We provide metal coil coating services and design, engineer, manufacture and market metal components and engineered building systems primarily used in nonresidential construction. We manufacture and distribute extensive lines of metal products for the nonresidential construction market under multiple brand names through a broad network of manufacturing facilities and distribution centers. We sell our products primarily for use in new construction activities and also in repair and retrofit activities, mostly in North America.
We have three operating segments: engineered building systems, metal components and metal coil coating. Operating segments are defined as components of an enterprise that engage in business activities and for which discrete financial information is available that is evaluated on a regular basis by the chief operating decision maker to make decisions about how to allocate resources to the segment and assess the performance of the segment. We market the products in each of our operating segments nationwide primarily through a direct sales force and, in the case of our engineered building systems segment, through authorized builder networks.
Basis of Presentation
Our consolidated financial statements include the accounts of the Company and all majority-owned subsidiaries. All intercompany accounts, transactions and profits arising from consolidated entities have been eliminated in consolidation.
Fiscal Year
We use a 52/53 week fiscal year ending on the Sunday closest to October 31. The year end for fiscal 2016 is October 30, 2016. Fiscal years 2016, 2015, and 2014 were 52-week fiscal years.
2. SUMMARY OF SIGNIFICANT ACCOUNTING POLICIES
(a) Use of Estimates. The preparation of financial statements in conformity with accounting principles generally accepted in the United States requires management to make estimates and assumptions that affect the reported amounts of assets and liabilities, disclosure of contingent assets and liabilities at the date of the financial statements, and the reported amounts of revenues and expenses during the reporting period. Examples include provisions for bad debts and inventory reserves, accounting for business combinations, valuation of reporting units for purposes of assessing goodwill and other indefinite-lived intangible assets for impairment, valuation of asset groups for impairment testing, accruals for employee benefits, general liability insurance, warranties and certain contingencies. We base our estimates on historical experience, market participant fair value considerations, projected future cash flows, and various other factors that are believed to be reasonable under the circumstances. Actual results could differ from those estimates.
(b) Cash and Cash Equivalents. Cash equivalents are stated at cost plus accrued interest, which approximates fair value. Cash equivalents are highly liquid debt instruments with an original maturity of three months or less and may consist of time deposits with a number of commercial banks with high credit ratings, money market instruments, certificates of deposit and commercial paper. Our policy allows us to also invest excess funds in no-load, open-end, management investment trusts (“mutual funds”). The mutual funds invest exclusively in high quality money market instruments. As of October 30, 2016, our cash and cash equivalents were only invested in cash.
We previously entered into a cash collateral agreement with PNC Bank to backstop existing CENTRIA letters of credit until they expire. The restricted cash is held in a bank account with PNC Bank as the secured party. As of October 30, 2016 and November 1, 2015, we had restricted cash in the amount of approximately $0.2 million and $0.7 million, respectively, as collateral related to our letters of credit for international projects with CENTRIA, exclusive of letters of credit under our Amended ABL Facility. See Note 11 — Long-Term Debt and Note Payable for more information on the material terms of our Amended ABL Facility. Restricted cash as of October 30, 2016 is classified as current as the underlying letters of credit expire within one year of the balance sheet date. Any renewal or replacement of the CENTRIA letters of credit is expected to occur under our Amended ABL Facility.
(c) Accounts Receivable and Related Allowance. We report accounts receivable net of the allowance for doubtful accounts. Trade accounts receivable are the result of sales of building systems, components and coating services to customers throughout the United States and Canada and affiliated territories, including international builders who resell to end users.
68
NOTES TO CONSOLIDATED FINANCIAL STATEMENTS
NCI BUILDING SYSTEMS, INC.
2. SUMMARY OF SIGNIFICANT ACCOUNTING POLICIES - (continued)
Sales are primarily denominated in U.S. dollars. Credit sales do not normally require a pledge of collateral; however, various types of liens may be filed to enhance the collection process.
We establish reserves for doubtful accounts on a customer by customer basis when we believe the required payment of specific amounts owed is unlikely to occur. In establishing these reserves, we consider changes in the financial position of a customer, availability of security, lien rights and bond rights as well as disputes, if any, with our customers. Our allowance for doubtful accounts reflects reserves for customer receivables to reduce receivables to amounts expected to be collected. We determine past due status as of the contractual payment date. Interest on delinquent accounts receivable is included in the trade accounts receivable balance and recognized as interest income when earned and collectability is reasonably assured. Uncollectible accounts are written off when a settlement is reached for an amount that is less than the outstanding historical balance or we have exhausted all collection efforts. The following table represents the rollforward of our uncollectible accounts for the fiscal years ended October 30, 2016, November 1, 2015 and November 2, 2014 (in thousands):
October 30, 2016 | November 1, 2015 | November 2, 2014 | |||||||||
Beginning balance | $ | 7,695 | $ | 6,076 | $ | 6,055 | |||||
Provision for bad debts | 1,343 | 110 | 256 | ||||||||
Amounts charged against allowance for bad debts, net of recoveries | (1,625 | ) | (114 | ) | (235 | ) | |||||
Allowance for bad debts of acquired company at date of acquisition | — | 1,623 | — | ||||||||
Ending balance | $ | 7,413 | $ | 7,695 | $ | 6,076 | |||||
(d) Inventories. Inventories are stated at the lower of cost or market value less allowance for inventory obsolescence, using First-In, First-Out Method (FIFO) for steel coils and other raw materials.
The components of inventory are as follows (in thousands):
October 30, 2016 | November 1, 2015 | ||||||
Raw materials | $ | 145,060 | $ | 109,455 | |||
Work in process and finished goods | 41,764 | 48,373 | |||||
$ | 186,824 | $ | 157,828 | ||||
The following table represents the rollforward of reserve for obsolete materials and supplies activity for the fiscal years ended October 30, 2016, November 1, 2015 and November 2, 2014 (in thousands):
October 30, 2016 | November 1, 2015 | November 2, 2014 | |||||||||
Beginning balance | $ | 3,749 | $ | 1,743 | $ | 1,769 | |||||
Provisions | 1,463 | 943 | 648 | ||||||||
Dispositions | (1,228 | ) | (552 | ) | (674 | ) | |||||
Reserve of acquired company at date of acquisition | — | 1,615 | — | ||||||||
Ending balance | $ | 3,984 | $ | 3,749 | $ | 1,743 | |||||
The principal raw material used in the manufacturing of our metal components and engineered building systems segments is steel which we purchase from multiple steel producers.
(e) Assets Held for Sale. We record assets held for sale at the lower of the carrying value or fair value less costs to sell. The following criteria are used to determine if property is held for sale: (i) management has the authority and commits to a plan to sell the property; (ii) the property is available for immediate sale in its present condition; (iii) there is an active program to locate a buyer and the plan to sell the property has been initiated; (iv) the sale of the property is probable within one year; (v) the property is being actively marketed at a reasonable sale price relative to its current fair value; and (vi) it is unlikely that the plan to sell will be withdrawn or that significant changes to the plan will be made.
In determining the fair value of the assets less cost to sell, we consider factors including current sales prices for comparable assets in the area, recent market analysis studies, appraisals and any recent legitimate offers. If the estimated fair value less cost to sell of an asset is less than its current carrying value, the asset is written down to its estimated fair value less
69
NOTES TO CONSOLIDATED FINANCIAL STATEMENTS
NCI BUILDING SYSTEMS, INC.
2. SUMMARY OF SIGNIFICANT ACCOUNTING POLICIES - (continued)
cost to sell. During fiscal 2016, we reclassified $2.9 million from property, plant and equipment to assets held for sale for an idled facility in our engineering building systems segment that met the held for sale criteria. The total carrying value of assets held for sale is $4.3 million and $6.3 million at October 30, 2016 and November 1, 2015, respectively, and these amounts are included in the engineered building systems segment. All of these assets continue to be actively marketed for sale at October 30, 2016.
During the fiscal year ended October 30, 2016, we sold certain idled facilities in our engineered building systems segment, along with related equipment, which previously had been classified as held for sale. In connection with the sales of these assets, during the fiscal year ended October 30, 2016, we received net cash proceeds of $5.4 million and recognized a net gain of $1.6 million, which is included in gain on sale of assets and asset recovery in the consolidated statements of operations.
Due to uncertainties in the estimation process, it is reasonably possible that actual results could differ from the estimates used in our historical analysis. Our assumptions about property sales prices require significant judgment because the current market is highly sensitive to changes in economic conditions. We determined the estimated fair values of assets held for sale based on current market conditions and assumptions made by management, which may differ from actual results and may result in impairments if market conditions deteriorate.
(f) Property, Plant and Equipment and Leases. Property, plant and equipment are stated at cost and depreciated using the straight-line method over their estimated useful lives. Leasehold improvements are capitalized and amortized using the straight-line method over the shorter of their estimated useful lives or the term of the underlying lease. Computer software developed or purchased for internal use is depreciated using the straight-line method over its estimated useful life. Depreciation and amortization are recognized in cost of sales and engineering, selling, general and administrative expenses based on the nature and use of the underlying asset(s). Operating leases are expensed using the straight-line method over the term of the underlying lease.
Depreciation expense for fiscal 2016, 2015 and 2014 was $32.3 million, $34.5 million and $31.7 million, respectively. Of this depreciation expense, $6.4 million, $7.5 million and $8.2 million was related to software depreciation for fiscal 2016, 2015 and 2014.
Property, plant and equipment consists of the following (in thousands):
October 30, 2016 | November 1, 2015 | ||||||
Land | $ | 19,707 | $ | 20,277 | |||
Buildings and improvements | 187,173 | 182,831 | |||||
Machinery, equipment and furniture | 314,477 | 331,113 | |||||
Transportation equipment | 4,635 | 4,458 | |||||
Computer software and equipment | 114,191 | 107,341 | |||||
Construction in progress | 21,673 | 22,656 | |||||
661,856 | 668,676 | ||||||
Less accumulated depreciation | (419,644 | ) | (410,784 | ) | |||
$ | 242,212 | $ | 257,892 | ||||
Estimated useful lives for depreciation are:
Buildings and improvements | 15 | – | 39 years |
Machinery, equipment and furniture | 3 | – | 15 years |
Transportation equipment | 4 | – | 10 years |
Computer software and equipment | 3 | – | 7 years |
We capitalize interest on capital invested in projects in accordance with ASC Topic 835, Interest. For fiscal 2016, 2015 and 2014, the total amount of interest capitalized was $0.2 million, $0.3 million and $0.2 million, respectively. Upon commencement of operations, capitalized interest, as a component of the total cost of the asset, is amortized over the estimated useful life of the asset.
70
NOTES TO CONSOLIDATED FINANCIAL STATEMENTS
NCI BUILDING SYSTEMS, INC.
2. SUMMARY OF SIGNIFICANT ACCOUNTING POLICIES - (continued)
Involuntary conversions result from the loss of an asset because of an unforeseen event (e.g., destruction due to fire). Some of these events are insurable and result in property damage insurance recovery. Amounts the Company receives from insurance carriers are net of any deductibles related to the covered event. The Company records a receivable from insurance to the extent it recognizes a loss from an involuntary conversion event and the likelihood of recovering such loss is deemed probable at the balance sheet date. To the extent that any of the Company’s insurance claim receivables are later determined not probable of recovery (e.g., due to new information), such amounts are expensed. The Company recognizes gains on involuntary conversions when the amount received from insurers exceeds the net book value of the impaired asset(s). In addition, the Company does not recognize a gain related to insurance recoveries until the contingency related to such proceeds has been resolved, through either receipt of a non-refundable cash payment from the insurers or by execution of a binding settlement agreement with the insurers that clearly states that a non-refundable payment will be made. To the extent that an asset is rebuilt or new assets are acquired, the associated expenditures are capitalized, as appropriate, in the consolidated balance sheets and presented as capital expenditures in the Company’s consolidated statements of cash flows. With respect to business interruption insurance claims, the Company recognizes income only when non-refundable cash proceeds are received from insurers, which are presented in the Company’s consolidated statements of operations as a component of gross profit or operating income and in the consolidated statements of cash flows as an operating activity.
In June 2016, the Company experienced a fire at a facility in the metal components segment. We estimated that fixed assets with a net book value of approximately $6.7 million were impaired as a result of the fire. The Company received proceeds of $10.0 million from our insurers during the fourth quarter of fiscal 2016, of which approximately $7.5 million was recognized as an offset to the estimated loss on involuntary conversion and for cost of sales and general and administrative costs incurred to date at October 30, 2016. The remaining $2.5 million is recorded in other accrued expenses on the consolidated balance sheets until the contingencies related to such proceeds are resolved. The Company anticipates additional insurance recoveries will be received for both property damage and business interruption.
(g) Internally Developed Software. Internally developed software is stated at cost less accumulated amortization and is amortized using the straight-line method over its estimated useful life ranging from 3 to 7 years. Software assets are reviewed for impairment when events or circumstances indicate the carrying value may not be recoverable over the remaining lives of the assets. During the software application development stage, capitalized costs include external consulting costs, cost of software licenses and internal payroll and payroll related costs for employees who are directly associated with a software project. Upgrades and enhancements are capitalized if they result in added functionality which enable the software to perform tasks it was previously incapable of performing. Software maintenance, training, data conversion and business process reengineering costs are expensed in the period in which they are incurred.
(h) Goodwill and Other Intangible Assets. We review the carrying values of goodwill and identifiable intangibles whenever events or changes in circumstances indicate that such carrying values may not be recoverable and annually for goodwill and indefinite lived intangible assets as required by ASC Topic 350, Intangibles — Goodwill and Other. This guidance provides the option to first assess qualitative factors to determine whether it is more likely than not that the fair value of a reporting unit is less than its carrying value, a “Step 0” analysis. If, based on a review of qualitative factors, it is more likely than not that the fair value of a reporting unit is less than its carrying value, we perform “Step 1” of the two-step goodwill impairment test by comparing the fair value of a reporting unit with its carrying amount. If the carrying value exceeds the fair value, we measure the amount of impairment loss, if any, by comparing the implied fair value of the reporting unit goodwill to its carrying amount.
Unforeseen events, changes in circumstances, market conditions and material differences in the value of intangible assets due to changes in estimates of future cash flows could negatively affect the fair value of our assets and result in a non-cash impairment charge. Some factors considered important that could trigger an impairment review include the following: significant underperformance relative to expected historical or projected future operating results, significant changes in the manner of our use of acquired assets or the strategy for our overall business and significant negative industry or economic trends.
(i) Revenue Recognition. We recognize revenues when the following conditions are met: persuasive evidence of an arrangement exists, delivery has occurred or services have been rendered, the price is fixed or determinable, and collectability is reasonably assured. Generally, these criteria are met at the time product is shipped or services are complete. A portion of our revenue, exclusively within our engineered building systems segment, includes multiple-element revenue arrangements due to multiple deliverables. Each deliverable is generally determined based on customer-specific manufacturing and delivery requirements.
71
NOTES TO CONSOLIDATED FINANCIAL STATEMENTS
NCI BUILDING SYSTEMS, INC.
2. SUMMARY OF SIGNIFICANT ACCOUNTING POLICIES - (continued)
Because the separate deliverables have value to the customer on a stand-alone basis, they are typically considered separate units of accounting. A portion of the entire job order value is allocated to each unit of accounting. Revenue allocated to each deliverable is recognized upon shipment. We use estimated selling price (“ESP”) based on underlying cost plus a reasonable margin to determine how to separate multiple-element revenue arrangements into separate units of accounting, and how to allocate the arrangement consideration among those separate units of accounting. We determine ESP based on our normal pricing and discounting practices.
Our sales arrangements do not include a general right of return of the delivered product(s). In certain cases, the cancellation terms of a job order provide us with the opportunity to bill for certain incurred costs. In those instances, revenue is not recognized until all revenue recognition criteria are met, including reasonable assurance of collectability.
In our metal coil coating segment, our revenue activities broadly consist of cleaning, treating, painting and packaging various flat rolled metals as well as slitting and/or embossing the metal. We enter into two types of sales arrangements with our customers: toll processing sales and package sales. The primary distinction between these two arrangements relates to ownership of the underlying metal coil during treatment. In toll processing arrangements, we do not maintain ownership of the underlying metal coil during treatment and only recognize revenue for the toll processing activities, typically, cleaning, painting, slitting, embossing and packaging. In package sales arrangements, we have ownership of the metal coil during treatment and recognize revenue on both the toll processing activities and the sale of the underlying metal coil. Under either arrangement, revenue and the related direct and indirect costs are recognized when all of the recognition criteria are met, which is generally when the products are shipped to the customer.
(j) Equity Raising and Deferred Financing Costs. Equity raising costs are recorded as a reduction to additional paid in capital upon the execution of an equity transaction. Deferred financing costs are capitalized as incurred and amortized using the straight-line method, which approximates the effective interest method, over the expected life of the associated debt. At October 30, 2016 and November 1, 2015, the unamortized balance in deferred financing costs was $9.1 million and $11.1 million, respectively, and was included in other assets, net on the consolidated balance sheets.
(k) Cost of Sales. Cost of sales includes the cost of inventory sold during the period, including costs for manufacturing, inbound freight, receiving, inspection, warehousing, and internal transfers less vendor rebates. Costs associated with shipping and handling our products are included in cost of sales. Cost of sales is exclusive of fair value adjustment of acquired inventory, gain on sale of assets and asset recovery, net and gain on insurance recovery because these items are shown below cost of sales on our consolidated statement of operations. Purchasing costs and engineering and drafting costs are included in engineering, selling, general and administrative expense. Purchasing costs were $5.3 million, $4.6 million and $3.8 million and engineering and drafting costs were $44.2 million, $46.9 million and $44.9 million in each of fiscal 2016, 2015 and 2014, respectively. Approximately $2.6 million and $3.0 million of these engineering, selling, general and administrative costs were capitalized and remained in inventory at the end of fiscal 2016 and 2015, respectively.
(l) Warranty. We sell weathertightness warranties to our customers for protection from leaks in our roofing systems related to weather. These warranties range from two years to twenty years. We sell two types of warranties, standard and Single Source™, and three grades of coverage for each. The type and grade of coverage determines the price to the customer. For standard warranties, our responsibility for leaks in a roofing system begins after 24 consecutive leak-free months. For Single Source™ warranties, the roofing system must pass our inspection before warranty coverage will be issued. Inspections are typically performed at three stages of the roofing project: (i) at the project start-up; (ii) at the project mid-point; and (iii) at the project completion. These inspections are included in the cost of the warranty. If the project requires or the customer requests additional inspections, those inspections are billed to the customer. Upon the sale of a warranty, we record the resulting revenue as deferred revenue, which is included in other accrued expenses in our consolidated balance sheets. See Note 10 — Warranty.
(m) Insurance. Group medical insurance is purchased through Blue Cross Blue Shield (“BCBS”). The plans include a Preferred Provider Organization Plan (“PPO”) and a Consumer Driven Health Plan (“CDHP”). These plans are managed-care plans utilizing networks to achieve discounts through negotiated rates with the providers within these networks. The claims incurred under these plans are self-funded for the first $355,000 of each claim. We purchase individual stop loss reinsurance to limit our claims liability to $355,000 per claim. BCBS administers all claims, including claims processing, utilization review and network access charges.
Insurance is purchased for workers compensation and employer liability, general liability, property and auto liability/auto physical damage. We utilize either deductibles or self-insurance retentions (“SIR”) to limit our exposure to catastrophic loss.
72
NOTES TO CONSOLIDATED FINANCIAL STATEMENTS
NCI BUILDING SYSTEMS, INC.
2. SUMMARY OF SIGNIFICANT ACCOUNTING POLICIES - (continued)
The workers compensation insurance has a $250,000 per-occurrence deductible. The property and auto liability insurances have per-occurrence deductibles of $50,000 and $250,000, respectively. The general liability insurance has a $1,000,000 SIR. Umbrella insurance coverage is purchased to protect us against claims that exceed our per-occurrence or aggregate limits set forth in our respective policies. All claims are adjusted utilizing a third-party claims administrator and insurance carrier claims adjusters.
Each reporting period, we record the costs of our health insurance plan, including paid claims, an estimate of the change in incurred but not reported (“IBNR”) claims, taxes and administrative fees, when applicable, (collectively the “Plan Costs”) as general and administrative expenses on our consolidated statements of operations. The estimated IBNR claims are based upon (i) a recent average level of paid claims under the plan, (ii) an estimated lag factor and (iii) an estimated growth factor to provide for those claims that have been incurred but not yet reported and paid. We use an actuary to determine the claims lag and estimated liability for IBNR claims.
For workers’ compensation costs, we monitor the number of accidents and the severity of such accidents to develop appropriate estimates for expected costs to provide both medical care and indemnity benefits, when applicable, for the period of time that an employee is incapacitated and unable to work. These accruals are developed using independent third-party actuarial estimates of the expected cost for medical treatment, and length of time an employee will be unable to work based on industry statistics for the cost of similar disabilities, to include statutory impairment ratings. For general liability and automobile claims, accruals are developed based on independent third-party actuarial estimates of the expected cost to resolve each claim, including damages and defense costs, based on legal and industry trends and the nature and severity of the claim. Accruals also include estimates for IBNR claims, and taxes and administrative fees, when applicable. Each reporting period, we record the costs of our workers’ compensation, general liability and automobile claims, including paid claims, an estimate of the change in IBNR claims, taxes and administrative fees as general and administrative expenses on our consolidated statements of operations.
(n) Advertising Costs. Advertising costs are expensed as incurred. Advertising expense was $7.1 million, $8.6 million and $7.6 million in fiscal 2016, 2015 and 2014, respectively.
(o) Impairment of Long-Lived Assets. We assess impairment of property, plant and equipment at an asset group level in accordance with the provisions of ASC Topic 360, Property, Plant and Equipment. We assess the recoverability of the carrying amount of property, plant and equipment if certain events or changes in circumstances indicate that the carrying value of such asset groups may not be recoverable, such as a significant decrease in market value of the asset groups or a significant change in our business conditions. If we determine that the carrying value of an asset group is not recoverable based on expected undiscounted future cash flows, excluding interest charges, we record an impairment loss equal to the excess of the carrying amount of the asset group over its fair value. The fair value of an asset group is determined based on prices of similar assets adjusted for their remaining useful life. We recorded asset impairment charges of $5.8 million in fiscal 2015. See Note 5 — Restructuring and Asset Impairments.
(p) Share-Based Compensation. Compensation expense is recorded for restricted stock awards under the fair value method. Compensation expense for performance stock units (“PSUs”) granted to our senior executives and Performance Share Awards granted to our key employees is recorded based on the probable outcome of the performance conditions associated with the respective shares, as determined by management. We recorded pre-tax compensation expense relating to restricted stock awards, Performance Share Awards, stock options and performance share unit awards of $10.9 million, $9.4 million and $10.2 million for fiscal 2016, 2015 and 2014, respectively. See Note 7 — Share-Based Compensation.
(q) Foreign Currency Re-measurement and Translation. The functional currency for our Mexico operations is the U.S. dollar. Adjustments resulting from the re-measurement of the local currency financial statements into the U.S. dollar functional currency, which uses a combination of current and historical exchange rates, are included in other income in the current period. Net foreign currency re-measurement losses were $(0.8) million, $(1.8) million and $(0.9) million for the fiscal years ended October 30, 2016, November 1, 2015 and November 2, 2014, respectively.
The functional currency for our Canadian operations is the Canadian dollar. Translation adjustments resulting from translating the functional currency financial statements into U.S. dollar equivalents are reported separately in accumulated other comprehensive income in stockholders’ equity. The net foreign currency losses included in other income for the fiscal years ended October 30, 2016, November 1, 2015 and November 2, 2014 were $(0.6) million, $(0.4) million and $(0.2) million, respectively. Net foreign currency translation adjustments, net of tax, and included in other comprehensive income
73
NOTES TO CONSOLIDATED FINANCIAL STATEMENTS
NCI BUILDING SYSTEMS, INC.
2. SUMMARY OF SIGNIFICANT ACCOUNTING POLICIES - (continued)
were $(0.3) million, $0.1 million and $(0.4) million for the fiscal years ended October 30, 2016, November 1, 2015 and November 2, 2014, respectively.
(r) Contingencies. We establish reserves for estimated loss contingencies and unasserted claims when we believe a loss is probable and the amount of the loss can be reasonably estimated. Our contingent liability reserves are related primarily to litigation and environmental matters. Revisions to contingent liability reserves are reflected in income in the period in which there are changes in facts and circumstances that affect our previous assumptions with respect to the likelihood or amount of loss. Reserves for contingent liabilities are based upon our assumptions and estimates regarding the probable outcome of the matter. We estimate the probable cost by evaluating historical precedent as well as the specific facts relating to each particular contingency (including the opinion of outside advisors, professionals and experts). Should the outcome differ from our assumptions and estimates or other events result in a material adjustment to the accrued estimated reserves, revisions to the estimated reserves for contingent liabilities would be required and would be recognized in the period the new information becomes known.
(s) Income taxes. The determination of our provision for income taxes requires significant judgment, the use of estimates and the interpretation and application of complex tax laws. Our provision for income taxes reflects a combination of income earned and taxed in the various U.S. federal and state, Canadian federal and provincial, Mexican federal and other jurisdictions. Jurisdictional tax law changes, increases or decreases in permanent differences between book and tax items, accruals or adjustments of accruals for tax contingencies or valuation allowances, and the change in the mix of earnings from these taxing jurisdictions all affect the overall effective tax rate.
In assessing the realizability of deferred tax assets, we must consider whether it is more likely than not that some portion, or all, of the deferred tax assets will not be realized. We consider all available evidence, both positive and negative, in determining whether a valuation allowance is required. Such evidence includes the scheduled reversal of deferred tax liabilities, projected future taxable income and tax planning strategies in making this assessment, and judgment is required in considering the relative weight of negative and positive evidence. The fiscal 2014 income tax provision includes a $2.7 million benefit for the release of a valuation allowance that had previously been recorded on the deferred tax assets of Robertson Building Systems Ltd., our Canadian subsidiary. During 2014, after evaluating historical and future financial trends in our Canadian operations, we determined that it is more likely than not that we will utilize all of our current tax loss carryforwards, which if unused would begin to expire in 2026.
(t) Reclassifications. Certain reclassifications have been made to the prior period amounts in our consolidated balance sheets, consolidated cash flows and notes to the consolidated financial statements to conform to the current presentation. The net effect of these reclassifications was not material to our consolidated financial statements.
3. ACCOUNTING PRONOUNCEMENTS
Adopted Accounting Pronouncements
In April 2014, the FASB issued ASU 2014-08, Presentation of Financial Statements (Topic 205) and Property, Plant, and Equipment (Topic 360): Reporting Discontinued Operations and Disclosures of Disposals of Components of an Entity. ASU 2014-08, which changed the requirement for reporting discontinued operations. We adopted ASU 2014-08 prospectively in our first quarter in fiscal 2016. The adoption of ASU 2014-08 did not have a material impact on our consolidated financial statements.
Recent Accounting Pronouncements
In May 2014, the FASB issued ASU 2014-09, Revenue from Contracts with Customers (Topic 606). ASU 2014-09 supersedes the revenue recognition requirements in ASC Topic 605, Revenue Recognition, and most industry-specific guidance. The core principle of the guidance is that an entity should recognize revenue to depict the transfer of promised goods or services to customers in an amount that reflects the consideration to which the entity expects to be entitled in exchange for those goods or services. The FASB has also issued ASU 2016-08, Revenue from Contracts with Customers: Principal versus Agent Considerations (Reporting Revenue Gross versus Net); ASU 2016-10, Revenue from Contracts with Customers: Identifying Performance Obligations and Licensing; ASU 2016-11, Rescission of SEC Guidance Because of Accounting Standards Updates 2014-09 and 2014-16 Pursuant to Staff Announcements at the March 3, 2016 EITF Meeting; and ASU 2016-12, Revenue from Contracts with Customers: Narrow-Scope Improvements and Practical Expedients, all of which were issued to improve and clarify the guidance in ASU 2014-09. These ASUs are effective for our fiscal year ending November 3, 2019, including interim periods within that fiscal year, and will be adopted using either a full or modified
74
NOTES TO CONSOLIDATED FINANCIAL STATEMENTS
NCI BUILDING SYSTEMS, INC.
3. ACCOUNTING PRONOUNCEMENTS - (continued)
retrospective approach. We are currently assessing the potential effects of these changes to our consolidated financial statements.
In June 2014, the FASB issued ASU 2014-12, Accounting for Share-Based Payments When the Terms of an Award Provide That a Performance Target Could Be Achieved after the Requisite Service Period. ASU 2014-12 requires that a performance target that affects vesting and could be achieved after the requisite service period be treated as a performance condition. A reporting entity should apply existing guidance in ASC Topic 718, Compensation — Stock Compensation, as it relates to such awards. ASU 2014-12 is effective for our first quarter in fiscal 2017, with early adoption permitted. We do not expect that the adoption of this guidance will have a material impact on our consolidated financial statements.
In April 2015, the FASB issued ASU 2015-03, Interest - Imputation of Interest (Subtopic 835-30): Simplifying the Presentation of Debt Issuance Costs. ASU 2015-03 requires debt issuance costs related to a recognized debt liability be presented on the balance sheet as a direct deduction from the carrying amount of the related debt liability instead of being presented as a separate asset. The update requires retrospective application and is effective for our fiscal year ending October 29, 2017, including interim periods within that fiscal year. In August 2015, FASB issued ASU 2015-15, Interest - Imputation of Interest (Subtopic 835-30) - Presentation and Subsequent Measurement of Debt Issuance Costs Associated with Line-of-Credit Arrangements (Amendments to SEC Paragraphs Pursuant to Staff Announcement at June 18, 2015 EITF Meeting), to provide further clarification to ASU 2015-03 as it relates to the presentation and subsequent measurement of debt issuance costs associated with line of credit arrangements. Upon adoption of this guidance, we expect to reclassify approximately $8 million in deferred financing costs as a reduction of the carrying amount of the debt liability.
In April 2015, the FASB issued ASU 2015-05, Intangibles — Goodwill and Other — Internal-Use Software (Subtopic 350-40): Customer’s Accounting for Fees Paid in a Cloud Computing Arrangement. ASU 2015-05 provides guidance to customers about whether a cloud computing arrangement includes a software license. If a cloud computing arrangement includes a software license, the guidance specifies that the customer should account for the software license element of the arrangement consistent with the acquisition of other software licenses. ASU 2015-05 further specifies that the customer should account for a cloud computing arrangement as a service contract if the arrangement does not include a software license. The guidance is effective for our fiscal year ending October 29, 2017, including interim periods within that fiscal year. We are currently assessing the impact of this guidance on our consolidated financial statements. We anticipate that we will adopt the guidance on a prospective basis.
In July 2015, the FASB issued ASU 2015-11, Inventory (Topic 330): Simplifying the Measurement of Inventory. ASU 2015-11 requires that inventory that has historically been measured using first-in, first-out (FIFO) or average cost method should now be measured at the lower of cost and net realizable value. The update requires prospective application and is effective for our fiscal year ending October 28, 2018, including interim periods within that fiscal year. We do not expect that the adoption of this guidance will have a material impact on our consolidated financial statements.
In November 2015, the FASB issued ASU 2015-17, Balance Sheet Classification of Deferred Taxes. ASU 2015-17 requires all deferred tax assets and liabilities to be presented on the balance sheet as noncurrent. ASU 2015-17 is effective for our fiscal year ending October 28, 2018, including interim periods within that fiscal year. Upon adoption, we will present the net deferred tax assets as noncurrent and reclassify any current deferred tax assets and liabilities in our consolidated financial position on a retrospective basis.
In February 2016, the FASB issued ASU 2016-02, Leases, which will require lessees to record most leases on the balance sheet and will modify the classification criteria and accounting for sales-type leases and direct financing leases for lessors. ASU 2016-02 is effective for our fiscal year ending November 1, 2020, including interim periods within that fiscal year. The guidance requires entities to use a modified retrospective approach for leases that exist or are entered into after the beginning of the earliest comparative period in the financial statements. We are evaluating the impact that the adoption of this guidance will have on our consolidated financial statements.
In March 2016, the FASB issued ASU 2016-09, Improvements to Employee Share-Based Payment Accounting, which is intended to simplify certain aspects of the accounting for share-based payment award transactions, including income tax effects when awards vest or settle, repurchase of employees’ shares to satisfy statutory tax withholding obligations, an option to account for forfeitures as they occur, and classification of certain amounts on the statement of cash flows. ASU 2016-09 is effective for our fiscal year ending October 28, 2018, including interim periods within that fiscal year. We are evaluating the impact that the adoption of this ASU will have on our consolidated financial statements.
75
NOTES TO CONSOLIDATED FINANCIAL STATEMENTS
NCI BUILDING SYSTEMS, INC.
3. ACCOUNTING PRONOUNCEMENTS - (continued)
In June 2016, the FASB issued ASU 2016-13, Financial Instruments—Credit Losses (Topic 326): Measurement of Credit Losses on Financial Instruments. This ASU requires measurement and recognition of expected credit losses for financial assets held, including trade receivables. ASU 2016-13 is effective for our fiscal year ending October 31, 2021, including interim periods within that fiscal year. We are evaluating the impact that the adoption of this ASU will have on our consolidated financial position, result of operations and cash flows.
In August 2016, the FASB issued ASU No. 2016-15, Statement of Cash Flows (Topic 230): Classification of Certain Cash Receipts and Cash Payments, which provides guidance on eight cash flow classification issues with the objective of reducing differences in practice. We will be required to adopt the amendments in this ASU in annual and interim periods for our fiscal year ending November 3, 2019, with early adoption permitted. Adoption is required to be on a retrospective basis, unless impracticable for any of the amendments, in which case a prospective application is permitted. We are in the process of evaluating the impact that ASU 2016-15 will have on our consolidated financial statements.
In October 2016, the FASB issued ASU 2016-16, Income Taxes (Topic 740): Intra-Entity Transfers of Assets Other than Inventory, which eliminates the exception that prohibits the recognition of current and deferred income tax effects for intra-entity transfers of assets other than inventory until the asset has been sold to an outside party. We will be required to adopt the amendments in this ASU in the annual and interim periods for our fiscal year ending November 3, 2019, with early adoption permitted. The application of the amendments will require the use of a modified retrospective basis through a cumulative-effect adjustment to retained earnings as of the beginning of the period of adoption. We are evaluating the standard and the impact it will have on our consolidated financial statements.
4. ACQUISITIONS
Fiscal 2016 acquisition
On November 3, 2015, we acquired manufacturing operations in Hamilton, Ontario, Canada for cash consideration of $2.2 million, net of post-closing working capital adjustments. This business allows us to service customers more competitively within the Canadian and Northeastern United States insulated metal panel (“IMP”) markets. Because the business was acquired from a seller in connection with a divestment required by a regulatory authority, the fair value of the net assets acquired exceeded the purchase consideration by $1.9 million, which was recorded as a non-taxable gain from bargain purchase in the consolidated statements of operations during the first quarter of fiscal 2016.
The fair values of the assets acquired and liabilities assumed as part of this acquisition as of November 3, 2015, as determined in accordance with ASC Topic 805, were as follows (in thousands):
November 3, 2015 | ||||
Current assets | $ | 307 | ||
Property, plant and equipment | 4,810 | |||
Assets acquired | 5,117 | |||
Current liabilities assumed | 380 | |||
Fair value of net assets acquired | 4,737 | |||
Total cash consideration transferred | 2,201 | |||
Deferred tax liabilities | 672 | |||
Gain from bargain purchase | $ | (1,864 | ) | |
The results of operations for this business are included in our metal components segment. Pro forma financial information and other disclosures for this acquisition have not been presented as such is not material to the Company’s financial position or operating results.
Fiscal 2015 acquisition
On January 16, 2015, NCI Group, Inc., a wholly-owned subsidiary of the Company, and Steelbuilding.com, LLC, a wholly owned subsidiary of NCI Group, Inc., completed the acquisition of CENTRIA (the “CENTRIA Acquisition”), a Pennsylvania general partnership (“CENTRIA”), pursuant to the terms of the Interest Purchase Agreement, dated November 7, 2014 (“Interest Purchase Agreement”) with SMST Management Corp., a Pennsylvania corporation, Riverfront Capital
76
NOTES TO CONSOLIDATED FINANCIAL STATEMENTS
NCI BUILDING SYSTEMS, INC.
4. ACQUISITIONS - (continued)
Fund, a Pennsylvania limited partnership, and CENTRIA. NCI acquired all of the general partnership interests of CENTRIA in exchange for $255.8 million in cash, including cash acquired of $8.7 million. The purchase price was subject to a post-closing adjustment to net working capital as provided in the Interest Purchase Agreement, which we settled during the first quarter of fiscal 2016 for additional cash consideration of approximately $2.1 million payable to the seller, which approximated the amount we previously accrued. The purchase price was funded through the issuance of $250.0 million of new indebtedness. See Note 11 — Long-Term Debt and Note Payable.
Accordingly, the results of CENTRIA’s operations from January 16, 2015 are included in our consolidated financial statements. For the fiscal year ended October 30, 2016 and for the period from January 16, 2015 to November 1, 2015, CENTRIA contributed revenue of $230.6 million and $179.4 million and operating income (loss) of $12.8 million and $(4.3) million, respectively. CENTRIA is a leader in the design, engineering and manufacturing of architectural IMP wall and roof systems and a provider of integrated coil coating services for the nonresidential construction industry. CENTRIA operates four production facilities in the United States and a manufacturing facility in China.
We report on a fiscal year that ends on the Sunday closest to October 31. CENTRIA previously reported on a calendar year that ended December 31. In accordance with ASC Topic 805, Business Combinations, the unaudited pro forma financial information for fiscal 2015 assumes the acquisition was completed on November 4, 2013, the first day of fiscal 2014.
The unaudited pro forma financial information does not necessarily represent what would have occurred if the transaction had taken place on the date presented and should not be taken as representative of our future consolidated results of operations. The unaudited pro forma financial information includes adjustments for interest expense to match the new capital structure, amortization expense for identified intangibles and depreciation expense based on the fair value and estimated lives of acquired property, plant and equipment. In addition, acquisition related costs and $16.1 million of transaction costs incurred by the seller are excluded from the unaudited pro forma financial information. The pro forma information does not reflect any expected synergies or expense reductions that may result from the acquisition.
Pro Forma (Unaudited) | |||||||
Fiscal year ended | |||||||
(In thousands, except per share amounts) | November 1, 2015 | November 2, 2014 | |||||
Sales | $ | 1,608,179 | $ | 1,605,707 | |||
Net income (loss) applicable to common shares | 16,133 | (106 | ) | ||||
Income (loss) per common share: | |||||||
Basic | $ | 0.22 | $ | — | |||
Diluted | $ | 0.22 | $ | — | |||
The following table summarizes the fair values of the assets acquired and liabilities assumed as part of the CENTRIA Acquisition as of January 16, 2015 as determined in accordance with ASC Topic 805. The fair value of all assets acquired and liabilities assumed were finalized during the first quarter of fiscal 2016, including certain contingent assets and liabilities and the post-closing working capital adjustment, which did not result in any material adjustments.
77
NOTES TO CONSOLIDATED FINANCIAL STATEMENTS
NCI BUILDING SYSTEMS, INC.
4. ACQUISITIONS - (continued)
(In thousands) | January 16, 2015 | |||
Cash | $ | 8,718 | ||
Current assets, excluding cash | 74,725 | |||
Property, plant and equipment | 34,127 | |||
Intangible assets | 128,280 | |||
Assets acquired | 245,850 | |||
Current liabilities | 61,869 | |||
Other long-term liabilities | 8,893 | |||
Liabilities assumed | 70,762 | |||
Fair value of net assets acquired | 175,088 | |||
Total cash consideration transferred | 257,927 | |||
Goodwill | $ | 82,839 | ||
The amount allocated to intangible assets was attributed to the following categories (in thousands):
Useful Lives | |||||
Backlog | $ | 8,400 | 9 months | ||
Trade names | 13,980 | 15 years | |||
Customer lists and relationships | 105,900 | 20 years | |||
$ | 128,280 | ||||
These intangible assets are amortized on a straight-line basis, which is presented in intangible asset amortization in our consolidated statements of operations. The backlog intangible asset was fully amortized during fiscal 2015. We also recorded a step-up in inventory fair value of approximately $2.4 million in fiscal 2015, which was recognized as an expense in fair value adjustment of acquired inventory in our consolidated statements of operations upon the sale of the related inventory.
The excess of the purchase price over the fair values of assets acquired and liabilities assumed was allocated to goodwill. The intention of this transaction was to strengthen our position as a fully integrated supplier to the nonresidential building products industry, by enhancing our existing portfolio of cold storage and commercial and industrial solutions, expanding our capabilities into high-end insulated metal panels and contributing specialty continuous metal coil coating capabilities. We believe the transaction will result in revenue synergies to our existing businesses, as well as improvements in supply chain efficiency, including alignment of purchase terms and pricing optimization. We include the results of CENTRIA in the metal components segment. Goodwill of $73.6 million and $9.1 million was recorded in our metal components segment and engineered building systems segment, respectively, based on expected synergies pertaining to these segments from the CENTRIA Acquisition. Additionally, because CENTRIA was treated as a partnership for tax purposes, the tax basis of the acquired assets and liabilities has been adjusted to their fair value and goodwill will be deductible for tax purposes.
5. RESTRUCTURING AND ASSET IMPAIRMENTS
As part of the plans developed in the fourth quarter of fiscal 2015 to improve cost efficiency and optimize our combined manufacturing footprint, given the Company’s recent acquisitions and restructuring efforts, we incurred severance related costs of $3.6 million, including $1.0 million and $1.7 million in the engineered building systems segment and metal components segment, respectively, and the remaining amount of $0.9 million at corporate for the fiscal year ended October 30, 2016. These charges include severance related costs associated with the consolidation and closing of two manufacturing facilities in our metal components segment during fiscal 2016. We also incurred approximately $0.6 million of other costs associated with the restructuring actions during fiscal 2016.
For the fiscal year ended November 1, 2015, we incurred severance and facility closure costs of $1.6 million in connection with the closing of a facility and other severance related costs of $1.2 million in our engineered building systems segment. We recorded asset impairment charges of $5.8 million for asset groups for which the fair values were below their carrying amounts in our metal components segment. These charges are presented in restructuring and impairment charges in our consolidated statements of operations. We measured the fair value of the asset groups using Level 3 inputs, including
78
NOTES TO CONSOLIDATED FINANCIAL STATEMENTS
NCI BUILDING SYSTEMS, INC.
5. RESTRUCTURING AND ASSET IMPAIRMENTS - (continued)
values of like-kind assets or other market indications of a potential selling value which approximates fair value. We also incurred severance related costs of $2.0 million and $0.3 million within the metal components segment and metal coil coating segment, respectively, primarily in an effort to streamline our management and manufacturing structure to better serve our customers. The remaining amount of costs in fiscal 2015 were incurred at corporate.
The following table summarizes our restructuring plan costs and charges related to the restructuring plans during the fiscal year ended October 30, 2016 and since inception, which are recorded in restructuring and impairment charges in the Company’s consolidated statements of operations (in thousands):
Fiscal Year Ended | Costs Incurred To Date (since inception) | ||||||
October 30, 2016 | |||||||
General severance | $ | 3,457 | $ | 7,344 | |||
Plant closing severance | 165 | 1,740 | |||||
Asset impairments | — | 5,844 | |||||
Other restructuring costs | 630 | 630 | |||||
Total restructuring costs | $ | 4,252 | $ | 15,558 | |||
The following table summarizes our severance liability and cash payments made pursuant to the restructuring plans from inception through October 30, 2016 (in thousands):
General Severance | Plant Closing Severance | Total | |||||||||
Balance, November 2, 2014 | $ | — | $ | — | $ | — | |||||
Costs incurred | 3,887 | 1,575 | 5,462 | ||||||||
Cash payments | (2,941 | ) | (1,575 | ) | (4,516 | ) | |||||
Accrued severance(1) | 739 | — | 739 | ||||||||
Balance, November 1, 2015 | $ | 1,685 | $ | — | $ | 1,685 | |||||
Costs incurred(1) | 2,725 | 165 | 2,890 | ||||||||
Cash payments | (3,928 | ) | (165 | ) | (4,093 | ) | |||||
Balance, October 30, 2016 | $ | 482 | $ | — | $ | 482 | |||||
(1) | During the second and fourth quarters of fiscal 2015, we entered into transition and separation agreements with certain executive officers. Each terminated executive officer was entitled to severance benefit payments issuable in two installments. The termination benefits were measured initially at the separation dates based on the fair value of the liability as of the termination date and were recognized ratably over the future service period. Costs incurred during fiscal 2016 exclude $0.7 million of amortization expense associated with these termination benefits. |
We expect to fully execute our plans in phases over the next 24 months and estimate that we will incur future additional restructuring charges associated with these plans. We are unable at this time to make a good faith determination of cost estimates, or ranges of cost estimates, associated with future phases of the plans or the total costs we may incur in connection with these plans.
6. GOODWILL AND OTHER INTANGIBLE ASSETS
Our goodwill balance and changes in the carrying amount of goodwill by operating segment are as follows (in thousands):
79
NOTES TO CONSOLIDATED FINANCIAL STATEMENTS
NCI BUILDING SYSTEMS, INC.
6. GOODWILL AND OTHER INTANGIBLE ASSETS – (continued)
Engineered Building Systems | Metal Components | Metal Coil Coating | Total | ||||||||||||
Balance, November 2, 2014 | $ | 5,200 | $ | 70,026 | $ | — | $ | 75,226 | |||||||
Additions | 9,110 | 73,571 | — | 82,681 | |||||||||||
Other, net | — | 119 | — | 119 | |||||||||||
Balance, November 1, 2015 | $ | 14,310 | $ | 143,716 | — | $ | 158,026 | ||||||||
Purchase accounting adjustments(1) | — | (3,755 | ) | — | (3,755 | ) | |||||||||
Balance, October 30, 2016 | $ | 14,310 | $ | 139,961 | $ | — | $ | 154,271 | |||||||
(1) | Includes immaterial error corrections related to the balance sheet and statement of operations as of and for the year ended November 1, 2015. These corrections related to the fair value of liabilities assumed in the acquisition of CENTRIA and resulted in a decrease in goodwill and current liabilities of $3.8 million and $3.0 million, respectively. The impact of these error corrections on net income for the fiscal year ended October 30, 2016 was a decrease of $0.5 million ($0.8 million, before tax). Management has assessed both quantitative and qualitative factors discussed in ASC Topic 250, Accounting Changes and Error Corrections, and Staff Accounting Bulletin 1.M, Materiality (SAB Topic 1.M) to determine that the correction of these misstatements qualifies as an immaterial error correction. |
On January 16, 2015, we completed the CENTRIA Acquisition. The fair value of all assets acquired and liabilities assumed were finalized during the first quarter of fiscal 2016, including certain contingent assets and liabilities and the post-closing working capital adjustment, which did not result in any material adjustments. This transaction resulted in goodwill of $79.0 million as the acquisition enhances our existing portfolio of cold storage and commercial and industrial solutions and expands our product offering into high-end IMP capabilities. Goodwill was allocated to the metal components segment and engineered building systems segment based on expected synergies that the Company believes the segments may derive from the acquisition.
In accordance with ASC Topic 350, Intangibles — Goodwill and Other, goodwill is tested for impairment at least annually at the reporting unit level, which is defined as an operating segment or a component of an operating segment that constitutes a business for which financial information is available and is regularly reviewed by management. Management has determined that we have six reporting units for the purpose of allocating goodwill and the subsequent testing of goodwill for impairment. Our metal components segment has five reporting units and our engineered building systems segment has one reporting unit with goodwill.
At the beginning of the fourth quarter of each fiscal year, we perform an annual impairment assessment of goodwill and indefinite-lived intangible assets. Additionally, we assess goodwill and indefinite-lived intangible assets for impairment whenever events or changes in circumstances indicate that the fair value may be below the carrying value. We completed our annual impairment assessment of goodwill and indefinite-lived intangible assets in the fourth quarter of fiscal 2016 and we elected to apply the qualitative assessment for the goodwill in certain of our reporting units within the metal components segment and the engineered building systems segment as of August 1, 2016. We also applied the qualitative assessment for the indefinite-lived intangible assets within the engineered building systems segment as of August 1, 2016. Under the qualitative assessment, various events and circumstances (or factors) that would affect the estimated fair value of a reporting unit are identified (similar to impairment indicators above). These factors are then classified by the type of impact they would have on the estimated fair value using positive, neutral, and negative categories based on current business conditions. Additionally, an assessment of the level of impact that a particular factor would have on the estimated fair value is determined using relative weightings. Additionally, the Company considers the results of the most recent two-step quantitative impairment test completed for a reporting unit and compares the weighted average cost of capital (WACC), publicly traded company multiples and observable and recent transaction multiples between the current and prior years for a reporting unit. Based on our assessment of these tests, we do not believe it is more likely than not that the fair value of the reporting units or the indefinite-lived intangible assets are less than their respective carrying amounts.
We performed a “Step 1” test for one reporting unit within the metal components segment during the fourth quarter of fiscal 2016. We estimated the fair value of the reporting unit using projected discounted cash flows and publicly traded company multiples. To develop the projected cash flows associated with the reporting unit, we considered key factors that include assumptions regarding sales volume and prices, operating margins, capital expenditures, working capital needs and discount rates. We discounted the projected cash flows using a long-term, risk-adjusted weighted average cost of capital, which was based on our estimate of the investment returns that market participants would require for the reporting unit. We
80
NOTES TO CONSOLIDATED FINANCIAL STATEMENTS
NCI BUILDING SYSTEMS, INC.
6. GOODWILL AND OTHER INTANGIBLE ASSETS – (continued)
considered publicly traded company multiples for companies with operations similar to the reporting unit. Based on our completion of this test, we determined that the fair value of the reporting unit exceeded the carrying amount. Goodwill was not considered to be impaired.
The following table represents all our intangible assets activity for the fiscal years ended October 30, 2016 and November 1, 2015 (in thousands):
Range of Life (Years) | October 30, 2016 | November 1, 2015 | |||||||||
Amortized intangible assets: | |||||||||||
Cost: | |||||||||||
Trade names | 15 | $ | 29,167 | $ | 29,167 | ||||||
Customer lists and relationships | 12 | – | 20 | 136,210 | 136,210 | ||||||
Non-competition agreements | 5 | – | 10 | 8,132 | 8,132 | ||||||
Supplier relationships | 3 | 150 | 150 | ||||||||
Backlog | 0.75 | — | 8,400 | ||||||||
$ | 173,659 | $ | 182,059 | ||||||||
Accumulated amortization: | |||||||||||
Trade names | $ | (8,768 | ) | $ | (6,824 | ) | |||||
Customer lists and relationships | (23,295 | ) | (15,613 | ) | |||||||
Non-competition agreements | (8,132 | ) | (8,132 | ) | |||||||
Supplier relationships | (150 | ) | (150 | ) | |||||||
Backlog | — | (8,400 | ) | ||||||||
$ | (40,345 | ) | $ | (39,119 | ) | ||||||
Net book value | $ | 133,314 | $ | 142,940 | |||||||
Indefinite-lived intangible assets: | |||||||||||
Trade names | 13,455 | 13,455 | |||||||||
Total intangible assets at net book value | $ | 146,769 | $ | 156,395 | |||||||
The Star and Ceco trade name assets have an indefinite life and are not amortized, but are reviewed annually and tested for impairment. These trade names were determined to have indefinite lives due to the length of time the trade names have been in place, with some having been in place for decades. Our intention is to maintain these trade names indefinitely.
All other intangible assets are amortized on a straight-line basis or a basis consistent with the expected future cash flows over their expected useful lives. As of October 30, 2016 and November 1, 2015, the weighted average amortization period for all our intangible assets was 15.9 years. Amortization expense of intangibles was $9.6 million, $16.9 million and $4.1 million for 2016, 2015 and 2014, respectively. We expect to recognize amortization expense over the next five fiscal years as follows (in thousands):
2017 | $ | 9,620 | |
2018 | 9,620 | ||
2019 | 9,620 | ||
2020 | 9,327 | ||
2021 | 9,064 | ||
In accordance with ASC Topic 350, Intangibles — Goodwill and Other, we evaluate the remaining useful life of intangible assets on an annual basis. We also review finite-lived intangible assets for impairment when events or changes in circumstances indicate the carrying values may not be recoverable in accordance with ASC Topic 360, Property, Plant and Equipment.
81
7. SHARE-BASED COMPENSATION
Our 2003 Long-Term Stock Incentive Plan (“Incentive Plan”) is an equity-based compensation plan that allows for the grant of a variety of awards, including stock options, restricted stock, restricted stock units, stock appreciation rights, performance share units (“PSUs”), phantom stock awards, long-term incentive awards with performance conditions (“Performance Share Awards”) and cash awards. Awards are generally granted once per year, with the amounts and types of awards determined by the Compensation Committee of our Board of Directors (the “Committee”). As a general rule, option awards terminate on the earlier of (i) 10 years from the date of grant, (ii) 30 days after termination of employment or service for a reason other than death, disability or retirement, (iii) one year after death or (iv) one year for incentive stock options or five years for other awards after disability or retirement. Awards are non-transferable except by disposition on death or to certain family members, trusts and other family entities as the Compensation Committee of our Board of Directors (the “Committee”) may approve. Awards may be paid in cash, shares of our Common Stock or a combination, in lump sum or installments and currently or by deferred payment, all as determined by the Committee.
As of October 30, 2016, and for all periods presented, our share-based awards under this plan have consisted of restricted stock grants, PSUs and stock option grants, none of which can be settled through cash payments, and Performance Share Awards. Both our stock options and restricted stock awards are subject only to vesting requirements based on continued employment at the end of a specified time period and typically vest over three to four years or earlier upon death, disability or a change in control. However, our annual restricted stock awards issued prior to December 15, 2013 also vest upon attainment of age 65 and, only in the case of certain special one-time restricted stock awards, a portion vest on termination without cause or for good reason, as defined by the agreements governing such awards. Restricted stock awards issued after December 15, 2013 do not vest upon attainment of age 65, as provided by the agreements governing such awards. The vesting of our Performance Share Awards is described below.
A total of approximately 3,000,000 and 4,254,000 shares were available at October 30, 2016 and November 1, 2015, respectively, under the Incentive Plan for the further grants of awards.
Our option awards and time-based restricted stock awards are typically subject to graded vesting over a service period, which is typically three or four years. Our performance-based and market-based restricted stock awards are typically subject to cliff vesting at the end of the service period, which is typically three years. We recognize compensation cost for these awards on a straight-line basis over the requisite service period for each annual award grant. In addition, certain of our awards provide for accelerated vesting upon qualified retirement, after a change of control or upon termination without cause or for good reason. We recognize compensation cost for such awards over the period from grant date to the date the employee first becomes eligible for retirement.
Stock Option Awards
The fair value of each option award is estimated as of the date of grant using a Black-Scholes-Merton option pricing formula. Expected volatility is based on normalized historical volatility of our stock over a preceding period commensurate with the expected term of the option and adjusted to exclude the increased volatility associated with the refinancing the Company experienced in fiscal 2009 because this volatility is not relevant to the expected future volatility of the stock. The risk-free rate for the expected term of the option is based on the U.S. Treasury yield curve in effect at the time of grant. Expected dividend yield was not considered in the option pricing formula since we do not currently pay dividends on our Common Stock and have no current plans to do so in the future.
There were 1,418,219 and 40,000 options exercised during fiscal 2016 and 2015, respectively. Cash received from the option exercises was $12.6 million and $0.4 million during fiscal 2016 and 2015, respectively. The total intrinsic value of options exercised in fiscal 2016 was $9.9 million and was insignificant for fiscal 2015. There were no options exercised during fiscal 2014.
The weighted average assumptions for the option awards granted on December 15, 2015, December 15, 2014 and December 16, 2013 are as follows:
82
NOTES TO CONSOLIDATED FINANCIAL STATEMENTS
NCI BUILDING SYSTEMS, INC.
7. SHARE-BASED COMPENSATION – (continued)
December 15, 2015 | December 15, 2014 | December 16, 2013 | ||||||
Expected volatility | 43.71 | % | 49.45 | % | 54.29 | % | ||
Expected term (in years) | 5.50 | 5.50 | 5.75 | |||||
Risk-free interest rate | 1.77 | % | 1.63 | % | 1.75 | % | ||
During fiscal 2016, 2015 and 2014, we granted 28,535, 10,543 and 5,058 stock options, respectively, and the weighted average grant-date fair value of options granted during fiscal 2016, 2015 and 2014 was $5.38, $7.91 and $9.09, respectively.
The following is a summary of stock option transactions during fiscal 2016, 2015 and 2014 (in thousands, except weighted average exercise prices and weighted average remaining life):
Number of Shares | Weighted Average Exercise Price | Weighted Average Remaining Life | Aggregate Intrinsic Value | |||||||||
Balance, November 3, 2013 | 2,008 | $ | 15.55 | |||||||||
Granted | 5 | 17.79 | ||||||||||
Cancelled | (65 | ) | (148.82 | ) | ||||||||
Balance, November 2, 2014 | 1,948 | 11.05 | ||||||||||
Granted | 10 | 17.07 | ||||||||||
Exercised | (40 | ) | (8.85 | ) | ||||||||
Cancelled | (14 | ) | (175.08 | ) | ||||||||
Balance, November 1, 2015 | 1,904 | 9.85 | ||||||||||
Granted | 29 | 12.76 | ||||||||||
Exercised | (1,418 | ) | (8.89 | ) | ||||||||
Cancelled | (7 | ) | (227.21 | ) | ||||||||
Balance, October 30, 2016 | 508 | $ | 10.24 | 4.1 | $ | 2,161 | ||||||
Exercisable at October 30, 2016 | 469 | $ | 9.92 | 3.7 | $ | 2,114 | ||||||
The following summarizes additional information concerning outstanding options at October 30, 2016 (in thousands, except weighted average remaining life and weighted average exercise prices):
Options Outstanding | |||||||
Number of Options | Weighted Average Remaining Life | Weighted Average Exercise Price | |||||
493 | 4.0 years | $ | 10.01 | ||||
15 | 7.8 years | 17.30 | |||||
508 | 4.1 years | $ | 10.24 | ||||
The following summarizes additional information concerning options exercisable at October 30, 2016 (in thousands, except weighted average exercise prices):
Options Exercisable | |||||
Number of Options | Weighted Average Exercise Price | ||||
463 | $ | 9.84 | |||
6 | 17.42 | ||||
469 | $ | 9.92 | |||
Restricted stock and performance awards
Long-term incentive awards granted to our senior executives generally have a three-year performance period. Long-term incentive awards include restricted stock units and PSUs representing 40% and 60% of the total value, respectively. The restricted stock units vest upon continued employment. Vesting of the PSUs is contingent upon continued employment and the achievement of targets with respect to the following metrics, as defined by management: (1) cumulative free cash flow
83
NOTES TO CONSOLIDATED FINANCIAL STATEMENTS
NCI BUILDING SYSTEMS, INC.
7. SHARE-BASED COMPENSATION – (continued)
(weighted 40%); (2) cumulative earnings per share (weighted 40%); and (3) total shareholder return (weighted 20%), in each case during the performance period. At the end of the performance period, the number of actual shares to be awarded varies between 0% and 200% of target amounts. The PSUs vest pro rata if an executive’s employment terminates prior to the end of the performance period due to death, disability, or termination by the Company without cause or by the executive for good reason. If an executive’s employment terminates for any other reason prior to the end of the performance period, all outstanding unvested PSUs, whether earned or unearned, will be forfeited and cancelled. If a change in control occurs prior to the end of the performance period, the PSU payout will be calculated and paid assuming that the maximum benefit had been achieved. If an executive’s employment terminates due to death or disability while any of the restricted stock is unvested, then all of the unvested restricted stock will become vested. If an executive’s employment is terminated by the Company without cause or after reaching normal retirement age, the unvested restricted stock will be forfeited. If a change in control occurs prior to the end of the performance period, the restricted stock will fully vest. The fair value of the awards is based on the Company’s stock price as of the date of grant. During the fiscal years ended October 30, 2016 and November 1, 2015, we granted PSUs with fair values of approximately $4.7 million and $3.6 million, respectively, to the Company’s senior executives.
The restricted stock units granted in December 2014 to our senior executives vest two-thirds on December 15, 2016 and one-third on December 15, 2017. For the restricted stock units granted in December 2015 to our senior executives, one-third vests annually. The PSUs granted in December 2014 to our senior executives vest one-half on December 15, 2016 and one-half on December 15, 2017. The PSUs granted in December 2015 to our senior executives cliff vest at the end of the three-year performance period.
Performance Share Awards granted to our key employees are paid 50% in cash and 50% in stock. Vesting of Performance Share Awards is contingent upon continued employment and the achievement of free cash flow and earnings per share targets, as defined by management, over a three-year period. At the end of the performance period, the number of actual shares to be awarded varies between 0% and 150% of target amounts. However, a minimum of 50% of the awards will vest upon continued employment over the three-year period if the minimum targets are not met. The Performance Share Awards vest earlier upon death, disability or a change of control. A portion of the awards also vests upon termination without cause or after reaching normal retirement age prior to the vesting date, as defined by the agreements governing such awards. The fair value of Performance Share Awards is based on the Company’s stock price as of the date of grant. The fair value and cash value of Performance Share Awards granted in fiscal 2016, 2015 and 2014 are as follows (in millions):
Fiscal year ended | |||||||||||
October 30, 2016 | November 1, 2015 | November 2, 2014 | |||||||||
Equity fair value | $ | 2.4 | $ | 1.5 | $ | 2.2 | |||||
Cash value | $ | 2.1 | $ | 1.7 | $ | 1.8 | |||||
During fiscal 2016, 2015 and 2014, we granted time-based restricted stock awards with a fair value of $4.2 million, $6.8 million and $3.5 million, respectively.
Restricted stock and performance award transactions during fiscal 2016, 2015 and 2014 were as follows (in thousands, except weighted average grant prices):
84
NOTES TO CONSOLIDATED FINANCIAL STATEMENTS
NCI BUILDING SYSTEMS, INC.
7. SHARE-BASED COMPENSATION – (continued)
Restricted Stock and Performance Awards | ||||||||||||||||||||
Time-Based | Performance-Based | Market-Based | ||||||||||||||||||
Number of Shares | Weighted Average Grant Price | Number of Shares(1) | Weighted Average Grant Price | Number of Shares(1) | Weighted Average Grant Price | |||||||||||||||
Balance, November 3, 2013 | 1,509 | $ | 13.62 | — | $ | — | 1,028 | $ | 11.71 | |||||||||||
Granted | 192 | 18.28 | 125 | 17.47 | — | — | ||||||||||||||
Vested | (765 | ) | 13.01 | — | — | — | — | |||||||||||||
Forfeited | (81 | ) | 13.49 | (8 | ) | 17.47 | — | — | ||||||||||||
Balance, November 2, 2014 | 855 | $ | 15.22 | 117 | $ | 17.47 | 1,028 | $ | 11.71 | |||||||||||
Granted | 410 | 16.60 | 270 | 17.04 | 45 | 12.76 | ||||||||||||||
Vested | (352 | ) | 13.11 | — | — | (541 | ) | 11.71 | ||||||||||||
Forfeited | (85 | ) | 23.71 | (44 | ) | 16.22 | (492 | ) | 11.72 | |||||||||||
Balance, November 1, 2015 | 828 | $ | 15.87 | 343 | $ | 17.19 | 40 | $ | 11.78 | |||||||||||
Granted | 329 | 12.64 | 516 | 12.76 | 71 | 14.60 | ||||||||||||||
Vested | (335 | ) | 15.09 | — | — | — | — | |||||||||||||
Forfeited | (60 | ) | 14.33 | (60 | ) | 15.22 | (4 | ) | 13.81 | |||||||||||
Balance, October 30, 2016 | 762 | $ | 14.91 | 799 | $ | 14.82 | 107 | $ | 14.02 | |||||||||||
(1) | The number of restricted stock shown reflects the shares that would be granted if the target level of performance is achieved. The number of shares actually issued may vary. |
Share-Based Compensation Expense
Share-based compensation expense is recorded over the requisite service or performance period. For awards with performance conditions, the amount of share-based compensation expense recognized is based upon the probable outcome of the performance conditions, as defined and determined by management. We estimated a forfeiture rate of 7.5% for our non-officers and 0% for our officers in our calculation of share-based compensation expense for the fiscal years ended October 30, 2016, November 1, 2015 and November 2, 2014. These estimates are based on historical forfeiture behavior exhibited by our employees.
Share-based compensation expense as well as the unrecognized share-based compensation expense and weighted average period over which expense attributable to unvested awards will be recognized are as follows (in millions, except weighted average remaining years):
Fiscal year ended | |||||||||||
October 30, 2016 | November 1, 2015 | November 2, 2014 | |||||||||
Cost of goods sold | $ | 1.1 | $ | 1.1 | $ | 1.3 | |||||
Engineering, selling, general and administrative | 9.8 | 8.3 | 8.9 | ||||||||
Total recognized share-based compensation expense | $ | 10.9 | $ | 9.4 | $ | 10.2 | |||||
Fiscal Year Ended October 30, 2016 | |||||
Unrecognized Share-Based Compensation Expense | Weighted Average Remaining Years | ||||
Stock options | $ | 0.1 | 1.5 | ||
Time-based restricted stock | 5.9 | 1.7 | |||
Performance- and market-based restricted stock | 9.4 | 1.8 | |||
Total unrecognized share-based compensation expense | $ | 15.4 | |||
85
NOTES TO CONSOLIDATED FINANCIAL STATEMENTS
NCI BUILDING SYSTEMS, INC.
7. SHARE-BASED COMPENSATION – (continued)
As of October 30, 2016, we do not have any amounts capitalized for share-based compensation cost in inventory or similar assets. The total income tax benefit recognized in results of operations for share-based compensation arrangements was $4.2 million, $3.7 million and $3.9 million for the fiscal years ended October 30, 2016, November 1, 2015 and November 2, 2014, respectively.
8. EARNINGS PER COMMON SHARE
Basic earnings per common share is computed by dividing net income allocated to common shares by the weighted average number of common shares outstanding. Diluted income per common share, if applicable, considers the dilutive effect of common stock equivalents. The reconciliation of the numerator and denominator used for the computation of basic and diluted income per common share is as follows (in thousands, except per share data):
Fiscal Year Ended | |||||||||||
October 30, 2016 | November 1, 2015 | November 2, 2014 | |||||||||
Numerator for Basic and Diluted Earnings Per Common Share: | |||||||||||
Net income applicable to common shares | $ | 50,638 | $ | 17,646 | $ | 11,085 | |||||
Denominator for Basic and Diluted Earnings Per Common Share: | |||||||||||
Weighted average basic number of common shares outstanding | 72,411 | 73,271 | 73,079 | ||||||||
Common stock equivalents: | |||||||||||
Employee stock options | 446 | 652 | 729 | ||||||||
PSUs and Performance Share Awards | — | — | 901 | ||||||||
Weighted average diluted number of common shares outstanding | 72,857 | 73,923 | 74,709 | ||||||||
Basic earnings per common share | $ | 0.70 | $ | 0.24 | $ | 0.15 | |||||
Diluted earnings per common share | $ | 0.70 | $ | 0.24 | $ | 0.15 | |||||
Incentive Plan securities excluded from dilution(1) | 195 | 289 | 78 | ||||||||
(1) | Represents securities not included in the computation of diluted earnings per common share because their effect would have been anti-dilutive. Awards subject to the achievement of performance and market conditions are not included in any of the fiscal years presented as such conditions had not been met at the end of any of those periods. |
We calculate earnings per share using the “two-class” method, whereby unvested share-based payment awards that contain nonforfeitable rights to dividends or dividend equivalents are “participating securities” and, therefore, these participating securities are treated as a separate class in computing earnings per share. The calculation of earnings per share presented here excludes the income attributable to unvested restricted stock units related to our Incentive Plan from the numerator and excludes the dilutive impact of those shares from the denominator.
9. OTHER ACCRUED EXPENSES
Other accrued expenses are comprised of the following (in thousands):
October 30, 2016 | November 1, 2015 | ||||||
Accrued warranty obligation and deferred warranty revenue | $ | 27,200 | $ | 25,162 | |||
Deferred revenue | 28,472 | 27,271 | |||||
Other accrued expenses | 47,712 | 44,876 | |||||
Total other accrued expenses | $ | 103,384 | $ | 97,309 | |||
86
10. WARRANTY
The following table represents the rollforward of our accrued warranty obligation and deferred warranty revenue activity for the fiscal years ended October 30, 2016 and November 1, 2015 (in thousands):
October 30, 2016 | November 1, 2015 | ||||||
Beginning balance | $ | 25,162 | $ | 23,685 | |||
Warranties sold | 3,853 | 2,525 | |||||
Revenue recognized | (3,269 | ) | (2,657 | ) | |||
Cost incurred and other(1) | 1,454 | 1,609 | |||||
Ending balance | $ | 27,200 | $ | 25,162 | |||
(1) | The $1.6 million in fiscal 2015 represents the fair value of accrued warranty obligations assumed in the CENTRIA Acquisition. |
11. LONG-TERM DEBT AND NOTE PAYABLE
Debt is comprised of the following (in thousands):
October 30, 2016 | November 1, 2015 | ||||||
Credit Agreement, due June 2019 (variable interest, at 4.25% on October 30, 2016 and November 1, 2015) | $ | 154,147 | $ | 194,147 | |||
8.25% senior notes, due January 2023 | 250,000 | 250,000 | |||||
Amended Asset-Based lending facility, due June 2019 (variable interest, at our option as described below) | — | — | |||||
Total long-term debt | $ | 404,147 | $ | 444,147 | |||
The scheduled maturity of our debt is as follows (in thousands):
2017 | $ | — | |
2018 | — | ||
2019 | 154,147 | ||
2020 | — | ||
2021 and thereafter | 250,000 | ||
$ | 404,147 | ||
Summary
On January 16, 2015, the Company issued $250.0 million in aggregate principal amount of 8.25% senior notes due in 2023 (the “Notes”) to fund the CENTRIA Acquisition. Interest on the Notes accrues at the rate of 8.25% per annum and is payable semi-annually in arrears on January 15 and July 15. The Notes are guaranteed on a senior unsecured basis by all of the Company’s existing and future domestic subsidiaries that guarantee the Company’s obligations (including by reason of being a borrower under the senior secured asset-based revolving credit facility on a joint and several basis with the Company or a guarantor subsidiary) under the senior secured credit facilities. We incurred approximately $9.2 million in transaction costs associated with the issuance.
On June 24, 2013, the Company entered into Amendment No. 1 (the “Amendment”) to its existing Credit Agreement (the “Credit Agreement”), dated as of June 22, 2012, between the Company, as borrower, and Credit Suisse AG, Cayman Islands Branch, as administrative agent and collateral agent and the other financial institutions party thereto from time to time (the “Term Loan Facility”), primarily to extend the maturity date and reduce the interest rate applicable to all of the outstanding term loans under the Term Loan Facility. As a result of the Amendment, in fiscal 2013, the Company recognized a debt extinguishment charge of approximately $21.5 million, related to the write-off of non-cash existing deferred debt issuance costs, non-cash initial debt discount write-off, prepayment penalty and fees to lenders.
87
NOTES TO CONSOLIDATED FINANCIAL STATEMENTS
NCI BUILDING SYSTEMS, INC.
11. LONG-TERM DEBT AND NOTE PAYABLE – (continued)
Pursuant to the Amendment, the maturity date of the $238 million of outstanding term loans (the “Initial Term Loans”) was extended and such loans were converted into a new tranche of term loans (the “Tranche B Term Loans”) that will mature on June 24, 2019 and, prior to such date, will amortize in nominal quarterly installments equal to one percent of the aggregate initial principal amount thereof per annum. At both October 30, 2016 and November 1, 2015, the interest rate on the term loan under the Credit Agreement was 4.25%.
In addition to the Credit Agreement, the Company entered into the Amended ABL Facility in May 2012 which allows aggregate maximum borrowings of up to $150.0 million. Borrowing availability on the Amended ABL Facility is determined by a monthly borrowing base collateral calculation that is based on specified percentages of the value of qualified cash, eligible inventory and eligible accounts receivable, less certain reserves and subject to certain other adjustments. The Amended ABL Facility and includes borrowing capacity of up to $30 million for letters of credit and up to $10 million for swingline borrowings. On November 7, 2014, the Company entered into Amendment No. 3 to the Loan and Security Agreement (the “ABL Loan and Security Agreement”) to amend the ABL Loan and Security Agreement to permit the CENTRIA Acquisition and associated financing, extend the maturity date of the Amended ABL Facility to June 24, 2019, decrease the applicable margin with respect to borrowings thereunder and make certain other amendments and modifications to provide greater operational and financial flexibility.
8.25% Senior Notes Due January 2023
On January 16, 2015, the Company issued $250.0 million in aggregate principal amount of 8.25% senior notes due 2023 to fund the CENTRIA Acquisition. Interest on the Notes accrues at the rate of 8.25% per annum and is payable semi-annually in arrears on January 15 and July 15. The Company incurred $9.2 million in transaction costs related to this issuance, which are being amortized over 8 years.
The Notes are guaranteed on a senior unsecured basis by all of the Company’s existing and future domestic subsidiaries that guarantee the Company’s obligations (including by reason of being a borrower under the senior secured asset-based revolving credit facility on a joint and several basis with the Company or a guarantor subsidiary) under the senior secured credit facilities. The Notes are unsecured senior indebtedness and rank equally in right of payment with all of the Company’s existing and future senior indebtedness and senior in right of payment to all of its future subordinated obligations. In addition, the Notes and guarantees are structurally subordinated to all existing and future indebtedness and other liabilities of the Company’s non-guarantor subsidiaries.
The Company may redeem the Notes at any time prior to January 15, 2018, at a price equal to 100% of the principal amount thereof, plus accrued and unpaid interest, if any, to the redemption date, plus the applicable make-whole premium. On or after January 15, 2018, the Company may redeem all or a part of the Notes at redemption prices (expressed as percentages of principal amount thereof) set forth below, plus accrued and unpaid interest, if any, to the applicable redemption date of the Notes, if redeemed during the 12-month period beginning on January 15 of the year as follows:
Year | Percentage | |
2018 | 106.188% | |
2019 | 104.125% | |
2020 | 102.063% | |
2021 and thereafter | 100.000% | |
In addition, prior to January 15, 2018, the Company may redeem the Notes in an aggregate principal amount of up to 40.0% of the original aggregate principal amount of the Notes with funds in an equal aggregate amount not exceeding the aggregate proceeds of one or more equity offerings, at a redemption price of 108.250%, plus accrued and unpaid interest, if any, to the applicable redemption date of the Notes.
Credit Agreement
On June 22, 2012, in connection with the Metl-Span LLC Acquisition, the Company entered into a Credit Agreement among the Company, as Borrower, Credit Suisse AG, Cayman Islands Branch, as Administrative Agent and Collateral Agent (the “Term Agent”), and the lenders party thereto. The Credit Agreement provided for a term loan credit facility in an aggregate principal amount of $250.0 million. Proceeds from borrowings under the Credit Agreement were used, together with cash on hand, (i) to finance the Metl-Span Acquisition, (ii) to extinguish the existing amended and restated credit
88
NOTES TO CONSOLIDATED FINANCIAL STATEMENTS
NCI BUILDING SYSTEMS, INC.
11. LONG-TERM DEBT AND NOTE PAYABLE – (continued)
agreement, due April 2014 (the “Refinancing”), and (iii) to pay fees and expenses incurred in connection with the Metl-Span Acquisition and the Refinancing. The Credit Agreement was issued at 95% of face value, which resulted in a note discount of $12.5 million. Prior to the Amendment, the note discount was amortized over the life of the loan through May 2, 2018 using the effective interest method.
The Credit Agreement contains a number of covenants that, among other things, will limit or restrict the ability of the Company and its subsidiaries to dispose of assets, incur additional indebtedness, make dividends and other restricted payments, create liens securing indebtedness, engage in mergers and other fundamental transactions, enter into restrictive agreements, amend certain documents in respect of other indebtedness, change the nature of their business and engage in certain transactions with affiliates.
On June 24, 2013, the Company entered into the Amendment to the Credit Agreement, dated as of June 22, 2012, between the Company, as borrower, and Credit Suisse AG, Cayman Islands Branch, as administrative agent and collateral agent and the other financial institutions party thereto from time to time, primarily to extend the maturity date and reduce the interest rate applicable to all of the outstanding term loans under the Term Loan Facility.
As a result of the Amendment, in fiscal 2013, the Company recognized a debt extinguishment charge of approximately $21.5 million, related to the write-off of non-cash existing deferred debt issuance costs, non-cash initial debt discount write-off, prepayment penalty and fees to the lenders.
Pursuant to the Amendment, the maturity date of $238 million of Initial Term Loans was extended and such loans were converted into the Tranche B Term Loans that will mature on June 24, 2019 and, prior to such date, will amortize in nominal quarterly installments equal to one percent of the aggregate initial principal amount thereof per annum. Pursuant to the Amendment, the Tranche B Term Loans will bear interest at a floating rate measured by reference to, at the Company’s option, either (i) an adjusted LIBOR not less than 1.00% plus a borrowing margin of 3.25% per annum or (ii) an alternate base rate plus a borrowing margin of 2.25% per annum. At both October 30, 2016 and November 1, 2015, the interest rate on the term loan under the Credit Agreement was 4.25%. Overdue amounts will bear interest at a rate that is 2% higher than the rate otherwise applicable.
The Tranche B Term Loans are secured by the same collateral and guaranteed by the same guarantors as the Initial Term Loans under the Term Loan Facility. Voluntary prepayments of the Tranche B Term Loans are permitted at any time, in minimum principal amounts, without premium or penalty, subject to a 1.00% premium payable in connection with certain repricing transactions within the first six months.
Pursuant to the Amendment, the Company will no longer be subject to a financial covenant requiring it to maintain a specified consolidated secured debt to EBITDA leverage ratio for specified periods. The Amendment also includes certain other changes to the Term Loan Facility.
Subject to certain exceptions, the term loan under the Amendment will be subject to mandatory prepayment in an amount equal to:
• | the net cash proceeds of (1) certain asset sales, (2) certain debt offerings, and (3) certain insurance recovery and condemnation events; and |
• | 50% of annual excess cash flow (as defined in the Amendment), subject to reduction to 0% if specified leverage ratio targets are met. |
Amended ABL Facility
On May 2, 2012, the Company entered into an Amended Asset-Based Lending Facility (“Amended ABL Facility”) to (i) permit the Metl-Span Acquisition, the entry by the Company into the Credit Agreement and the incurrence of debt thereunder and the repayment of existing indebtedness under NCI’s existing term loan, (ii) increase the amount available for borrowing thereunder to $150 million (subject to a borrowing base), (iii) increase the amount available for letters of credit thereunder to $30 million, and (iv) extend the final maturity thereunder.
On November 7, 2014, the Company, Steelbuilding.com, LLC (together with the Company, the “Guarantors”) and the Company’s subsidiaries NCI Group, Inc. and Robertson-Ceco II Corporation (each a “Borrower” and collectively, the “Borrowers”) entered into Amendment No. 3 to the Loan and Security Agreement (the “ABL Loan and Security Agreement”) among the Borrowers, the Guarantors, Wells Fargo Capital Finance, LLC as administrative agent and co-collateral agent, Bank of America, N.A. as co-collateral agent and syndication agent and certain other lenders under the ABL Loan and
89
NOTES TO CONSOLIDATED FINANCIAL STATEMENTS
NCI BUILDING SYSTEMS, INC.
11. LONG-TERM DEBT AND NOTE PAYABLE – (continued)
Security Agreement, in order to amend the ABL Loan and Security Agreement to (i) permit the CENTRIA Acquisition, (ii) permit the entry by the Company into documentation with respect to certain debt financing to be incurred in connection with the CENTRIA Acquisition and the incurrence of debt with respect thereto, (iii) extend the maturity date to June 24, 2019, (iv) decrease the applicable margin with respect to borrowings thereunder and (v) make certain other amendments and modifications to provide greater operational and financial flexibility.
Borrowing availability under the Amended ABL Facility is determined by a monthly borrowing base collateral calculation that is based on specified percentages of the value of qualified cash, eligible inventory and eligible accounts receivable, less certain reserves and subject to certain other adjustments. At October 30, 2016 and November 1, 2015, the Company’s excess availability under the Amended ABL Facility was $140.9 million and $131.0 million, respectively. At October 30, 2016 and November 1, 2015, the Company had no revolving loans outstanding under the Amended ABL Facility. In addition, at October 30, 2016 and November 1, 2015, standby letters of credit related to certain insurance policies totaling approximately $9.1 million and $8.7 million, respectively, were outstanding but undrawn under the Amended ABL Facility.
The Amended ABL Facility contains a number of covenants that, among other things, limit or restrict the Company’s ability to dispose of assets, incur additional indebtedness, incur guarantee obligations, engage in sale and leaseback transactions, prepay other indebtedness, modify organizational documents and certain other agreements, create restrictions affecting subsidiaries, make dividends and other restricted payments, create liens, make investments, make acquisitions, engage in mergers, change the nature of their business and engage in certain transactions with affiliates.
The Amended ABL Facility includes a minimum fixed charge coverage ratio of one to one, which will apply if the Company fails to maintain a specified minimum borrowing capacity. The minimum level of borrowing capacity as of October 30, 2016 and November 1, 2015 was $21.1 million and $19.7 million, respectively. Although the Amended ABL Facility did not require any financial covenant compliance, at October 30, 2016 and November 1, 2015, the Company’s fixed charge coverage ratio as of those dates, which is calculated on a trailing twelve month basis, was 2.86:1.00 and 3.54:1.00, respectively. These ratios include the pro forma impact of the CENTRIA Acquisition.
Loans under the Amended ABL Facility bear interest, at our option, as follows:
(1) | Base Rate loans at the Base Rate plus a margin. The margin ranges from 0.75% to 1.25% depending on the quarterly average excess availability under such facility, and |
(2) | LIBOR loans at LIBOR plus a margin. The margin ranges from 1.75% to 2.25% depending on the quarterly average excess availability under such facility. |
During an event of default, loans under the Amended ABL Facility will bear interest at a rate that is 2% higher than the rate otherwise applicable. “Base rate” is defined as the higher of the Wells Fargo Bank, N.A. prime rate or the overnight Federal Funds rate plus 0.5% and “LIBOR” is defined as the applicable London interbank offered rate adjusted for reserves.
Deferred Financing Costs
At October 30, 2016 and November 1, 2015, the unamortized balance in deferred financing costs related to the Credit Agreement, the Amended ABL Facility and the Notes was $9.1 million and $11.1 million, respectively, and was included in other assets, net on the consolidated balance sheets.
Insurance Note Payable
As of October 30, 2016 and November 1, 2015, the Company had an outstanding note payable in the amount of $0.5 million and $0.5 million, respectively, related to financed insurance premiums. Insurance premium financings are generally secured by the unearned premiums under such policies.
12. CD&R FUNDS
On August 14, 2009, the Company entered into an Investment Agreement (as amended, the “Investment Agreement”), by and between the Company and Clayton, Dubilier & Rice Fund VIII L.P. (“CD&R Fund VIII”). In connection with the Investment Agreement and the Stockholders Agreement dated October 20, 2009 (the “Stockholders Agreement”), the CD&R Fund VIII and the Clayton, Dubilier & Rice Friends & Family Fund VIII, L.P. (collectively, the “CD&R Funds”) purchased convertible preferred stock, which was later converted to shares of our Common Stock on May 14, 2013.
On January 15, 2014, the CD&R Funds completed a registered underwritten offering, in which the CD&R Funds offered 8.5 million shares of Common Stock at a price to the public of $18.00 per share (the “2014 Secondary Offering”). The
90
NOTES TO CONSOLIDATED FINANCIAL STATEMENTS
NCI BUILDING SYSTEMS, INC.
12. CD&R FUNDS – (continued)
underwriters also exercised their option to purchase 1.275 million additional shares of Common Stock. The aggregate offering price for the 9.775 million shares sold in the 2014 Secondary Offering was approximately $167.6 million, net of underwriting discounts and commissions. The CD&R Funds received all of the proceeds from the 2014 Secondary Offering and no shares in the 2014 Secondary Offering were sold by NCI or any of its officers or directors (although certain of our directors are affiliated with the CD&R Funds). In connection with the 2014 Secondary Offering and the 2014 Stock Repurchase (as defined below), we incurred approximately $0.8 million in expenses, which were included in engineering, selling, general and administrative expenses in the consolidated statement of operations for the fiscal year ended November 2, 2014.
On January 6, 2014, the Company entered into an agreement with the CD&R Funds to repurchase 1.15 million shares of its Common Stock at a price per share equal to the price per share paid by the underwriters to the CD&R Funds in the underwritten offering (the “2014 Stock Repurchase”). The 2014 Stock Repurchase, which was completed at the same time as the 2014 Secondary Offering, represented a private, non-underwritten transaction between NCI and the CD&R Funds that was approved and recommended by the Affiliate Transactions Committee of our board of directors. Following completion of the 2014 Stock Repurchase, NCI canceled the shares repurchased from the CD&R Funds, resulting in a $19.7 million decrease in both additional paid-in capital and treasury stock during the fiscal year ended November 2, 2014.
On July 25, 2016, the CD&R Funds completed a registered underwritten offering, in which the CD&R Funds offered 9.0 million shares of our Common Stock at a price to the public of $16.15 per share (the “2016 Secondary Offering”). The underwriters also exercised their option to purchase 1.35 million additional shares of our Common Stock from the CD&R Funds. The aggregate offering price for the 10.35 million shares sold in the 2016 Secondary Offering was approximately $160.1 million, net of underwriting discounts and commissions. The CD&R Funds received all of the proceeds from the 2016 Secondary Offering and no shares in the 2016 Secondary Offering were sold by the Company or any of its officers or directors (although certain of our directors are affiliated with the CD&R Funds). In connection with the 2016 Secondary Offering and the 2016 Stock Repurchase (as defined below), we incurred approximately $0.7 million in expenses, which were included in engineering, selling, general and administrative expenses in the consolidated statements of operations for the fiscal year ended October 30, 2016.
On July 18, 2016, the Company entered into an agreement with the CD&R Funds to repurchase approximately 2.9 million shares of our Common Stock at the price per share equal to the price per share paid by the underwriters to the CD&R Funds in the underwritten offering (the “2016 Stock Repurchase”). The 2016 Stock Repurchase, which was completed concurrently with the 2016 Secondary Offering, represented a private, non-underwritten transaction between the Company and the CD&R Funds that was approved and recommended by the Affiliate Transactions Committee of our board of directors. See Note 18 — Stock Repurchase Program.
At October 30, 2016 and November 1, 2015, the CD&R Funds owned approximately 42.3% and 58.4%, respectively, of the outstanding shares of our Common Stock.
13. RELATED PARTIES
Pursuant to the Investment Agreement and the Stockholders Agreement, the CD&R Funds have the right to designate a number of directors to NCI’s board of directors that is equivalent to the CD&R Funds’ percentage interest in the Company. Among other directors appointed by the CD&R Funds, our board of directors appointed to the board of directors James G. Berges, Nathan K. Sleeper and Jonathan L. Zrebiec. Messrs. Berges and Sleeper are partners and Mr. Zrebiec is a principal of Clayton, Dubilier & Rice, LLC, (“CD&R, LLC”), an affiliate of the CD&R Funds.
As a result of their respective positions with CD&R, LLC and its affiliates, one or more of Messrs. Berges, Sleeper and Zrebiec may be deemed to have an indirect material interest in certain agreements executed in connection with the Equity Investment. Messrs. Berges, Sleeper and Zrebiec may be deemed to have an indirect material interest in the following agreements:
• | the Investment Agreement, pursuant to which the CD&R Funds acquired a 68.4% interest in the Company, CD&R Fund VIII’s transaction expenses were reimbursed and a deal fee of $8.25 million was paid to CD&R, Inc., the predecessor to the investment management business of CD&R, LLC, on October 20, 2009; |
• | the Stockholders Agreement, which sets forth certain terms and conditions regarding the Equity Investment and the CD&R Funds’ ownership of the Preferred Shares, including certain restrictions on the transfer of the Preferred Shares and the shares of our Common Stock issuable upon conversion thereof and on certain actions of the CD&R |
91
NOTES TO CONSOLIDATED FINANCIAL STATEMENTS
NCI BUILDING SYSTEMS, INC.
13. RELATED PARTIES – (continued)
Funds and their controlled affiliates with respect to the Company, and to provide for, among other things, subscription rights, corporate governance rights and consent rights as well as other obligations and rights;
• | a Registration Rights Agreement, dated as of October 20, 2009 (the “Registration Rights Agreement”), between the Company and the CD&R Funds, pursuant to which the Company granted to the CD&R Funds, together with any other stockholder of the Company that may become a party to the Registration Rights Agreement in accordance with its terms, certain customary registration rights with respect to the shares of our Common Stock issuable upon conversion of the Preferred Shares; and |
• | an Indemnification Agreement, dated as of October 20, 2009 between the Company, NCI Group, Inc., a wholly owned subsidiary of the Company, Robertson-Ceco II Corporation, a wholly owned subsidiary of the Company, the CD&R Funds and CD&R, Inc., pursuant to which the Company, NCI Group, Inc. and Robertson-Ceco II Corporation agreed to indemnify CD&R, Inc., the CD&R Funds and their general partners, the special limited partner of CD&R Fund VIII and any other investment vehicle that is a stockholder of the Company and is managed by CD&R, Inc. or any of its affiliates, their respective affiliates and successors and assigns and the respective directors, officers, partners, members, employees, agents, representatives and controlling persons of each of them, or of their respective partners, members and controlling persons, against certain liabilities arising out of the Equity Investment and transactions in connection with the Equity Investment, including, but not limited to, the Credit Agreement, the Amended ABL Facility, the Exchange Offer, and certain other liabilities and claims. |
14. FAIR VALUE OF FINANCIAL INSTRUMENTS AND FAIR VALUE MEASUREMENTS
Fair Value of Financial Instruments
The carrying amounts of cash and cash equivalents, restricted cash, trade accounts receivable and accounts payable approximate fair value as of October 30, 2016 and November 1, 2015 because of the relatively short maturity of these instruments. The fair values of the remaining financial instruments not currently recognized at fair value on our consolidated balance sheets at the respective fiscal year ends were (in thousands):
October 30, 2016 | November 1, 2015 | ||||||||||||||
Carrying Amount | Fair Value | Carrying Amount | Fair Value | ||||||||||||
Credit agreement, due June 2019 | $ | 154,147 | $ | 154,147 | $ | 194,147 | $ | 193,662 | |||||||
8.25% senior notes, due January 2023 | $ | 250,000 | $ | 272,500 | $ | 250,000 | $ | 263,750 | |||||||
The fair values of the Credit Agreement and the Notes were based on recent trading activities of comparable market instruments, which are level 2 inputs.
Fair Value Measurements
ASC Subtopic 820-10, Fair Value Measurements and Disclosures, requires us to use valuation techniques to measure fair value that maximize the use of observable inputs and minimize the use of unobservable inputs. These inputs are prioritized as follows:
Level 1: Observable inputs such as quoted prices for identical assets or liabilities in active markets.
Level 2: Other inputs that are observable directly or indirectly, such as quoted prices for similar assets or liabilities or market-corroborated inputs.
Level 3: Unobservable inputs for which there is little or no market data and which require us to develop our own assumptions about how market participants would price the assets or liabilities.
The following is a description of the valuation methodologies used for assets and liabilities measured at fair value. There have been no changes in the methodologies used at October 30, 2016 and November 1, 2015.
Money market: Money market funds have original maturities of three months or less. The original cost of these assets approximates fair value due to their short-term maturity.
Mutual funds: Mutual funds are valued at the closing price reported in the active market in which the mutual fund is traded.
92
NOTES TO CONSOLIDATED FINANCIAL STATEMENTS
NCI BUILDING SYSTEMS, INC.
14. FAIR VALUE OF FINANCIAL INSTRUMENTS AND FAIR VALUE MEASUREMENTS – (continued)
Assets held for sale: Assets held for sale are valued based on current market conditions, prices of similar assets in similar condition and expected proceeds from the sale of the assets.
As of November 1, 2015, certain assets held for sale had a fair value of $2.3 million as measured on a nonrecurring basis. Assets held for sale are reported at fair value, if, on an individual basis, the fair value of the asset is less than the carrying amount. The fair value of assets held for sale is estimated using Level 3 inputs, such as broker quotes for like-kind assets or other market indications of a potential selling value which approximates fair value. The assets that were previously reported at fair value as of November 1, 2015 were sold in January 2016. As of October 30, 2016, no assets held for sale had a fair value less cost to sell below the carrying amount.
Deferred compensation plan liability: Deferred compensation plan liability is comprised of phantom investments in the deferred compensation plan and is valued at the closing price reported in the active markets in which the money market and mutual funds are traded.
The following tables summarize information regarding our financial assets and liabilities that are measured at fair value on a recurring basis as of October 30, 2016 and November 1, 2015, segregated by level of the valuation inputs within the fair value hierarchy utilized to measure fair value (in thousands):
Recurring fair value measurements | |||||||||||||||
October 30, 2016 | |||||||||||||||
Level 1 | Level 2 | Level 3 | Total | ||||||||||||
Assets: | |||||||||||||||
Short-term investments in deferred compensation plan(1): | |||||||||||||||
Money market | $ | 422 | $ | — | $ | — | $ | 422 | |||||||
Mutual funds – Growth | 773 | — | — | 773 | |||||||||||
Mutual funds – Blend | 3,118 | — | — | 3,118 | |||||||||||
Mutual funds – Foreign blend | 730 | — | — | 730 | |||||||||||
Mutual funds – Fixed income | — | 705 | — | 705 | |||||||||||
Total short-term investments in deferred compensation plan | 5,043 | 705 | — | 5,748 | |||||||||||
Total assets | $ | 5,043 | $ | 705 | $ | — | $ | 5,748 | |||||||
Liabilities: | |||||||||||||||
Deferred compensation plan liability | $ | — | $ | 3,847 | $ | — | $ | 3,847 | |||||||
Total liabilities | $ | — | $ | 3,847 | $ | — | $ | 3,847 | |||||||
93
NOTES TO CONSOLIDATED FINANCIAL STATEMENTS
NCI BUILDING SYSTEMS, INC.
14. FAIR VALUE OF FINANCIAL INSTRUMENTS AND FAIR VALUE MEASUREMENTS – (continued)
Recurring fair value measurements | |||||||||||||||
November 1, 2015 | |||||||||||||||
Level 1 | Level 2 | Level 3 | Total | ||||||||||||
Assets: | |||||||||||||||
Short-term investments in deferred compensation plan(1): | |||||||||||||||
Money market | $ | 744 | $ | — | $ | — | $ | 744 | |||||||
Mutual funds – Growth | 764 | — | — | 764 | |||||||||||
Mutual funds – Blend | 2,984 | — | — | 2,984 | |||||||||||
Mutual funds – Foreign blend | 724 | — | — | 724 | |||||||||||
Mutual funds – Fixed income | — | 673 | — | 673 | |||||||||||
Total short-term investments in deferred compensation plan | 5,216 | 673 | — | 5,889 | |||||||||||
Total assets | $ | 5,216 | $ | 673 | $ | — | $ | 5,889 | |||||||
Liabilities: | |||||||||||||||
Deferred compensation plan liability | $ | — | $ | 5,164 | $ | — | $ | 5,164 | |||||||
Total liabilities | $ | — | $ | 5,164 | $ | — | $ | 5,164 | |||||||
(1) | Unrealized holding gains/losses were insignificant for the fiscal years ended October 30, 2016 and November 1, 2015. These unrealized holding gains/losses were primarily offset by changes in the deferred compensation plan liability. |
15. INCOME TAXES
Income tax expense is based on pretax financial accounting income. Deferred income taxes are recognized for the temporary differences between the recorded amounts of assets and liabilities for financial reporting purposes and such amounts for income tax purposes.
The income tax provision for the fiscal years ended 2016, 2015 and 2014, consisted of the following (in thousands):
Fiscal Year Ended | |||||||||||
October 30, 2016 | November 1, 2015 | November 2, 2014 | |||||||||
Current: | |||||||||||
Federal | $ | 22,602 | $ | 12,366 | $ | 3,919 | |||||
State | 3,179 | 336 | 1,016 | ||||||||
Foreign | 838 | 1,638 | 516 | ||||||||
Total current | 26,619 | 14,340 | 5,451 | ||||||||
Deferred: | |||||||||||
Federal | 105 | (5,193 | ) | (198 | ) | ||||||
State | 1,380 | 91 | (319 | ) | |||||||
Foreign | (167 | ) | (266 | ) | (3,444 | ) | |||||
Total deferred | 1,318 | (5,368 | ) | (3,961 | ) | ||||||
Total provision | $ | 27,937 | $ | 8,972 | $ | 1,490 | |||||
The reconciliation of income tax computed at the United States federal statutory tax rate to the effective income tax rate is as follows:
94
NOTES TO CONSOLIDATED FINANCIAL STATEMENTS
NCI BUILDING SYSTEMS, INC.
15. INCOME TAXES – (continued)
Fiscal Year Ended | ||||||||
October 30, 2016 | November 1, 2015 | November 2, 2014 | ||||||
Statutory federal income tax rate | 35.0 | % | 35.0 | % | 35.0 | % | ||
State income taxes | 3.8 | % | 1.6 | % | 4.6 | % | ||
Production activities deduction | (3.4 | )% | (6.4 | )% | (3.7 | )% | ||
Canadian valuation allowance | — | % | — | % | (23.3 | )% | ||
Non-deductible expenses | 1.3 | % | 4.1 | % | 7.0 | % | ||
Uncertain tax position adjustment | — | % | — | % | (2.4 | )% | ||
Foreign tax benefit | — | % | — | % | (4.5 | )% | ||
Other | (1.3 | )% | (0.8 | )% | (0.9 | )% | ||
Effective tax rate | 35.4 | % | 33.5 | % | 11.8 | % | ||
Deferred income taxes reflect the net impact of temporary differences between the amounts of assets and liabilities recognized for financial reporting purposes and such amounts recognized for income tax purposes. The tax effects of the temporary differences for fiscal 2016 and 2015 are as follows (in thousands):
October 30, 2016 | November 1, 2015 | ||||||
Deferred tax assets: | |||||||
Inventory obsolescence | $ | 2,195 | $ | 2,302 | |||
Bad debt reserve | 1,094 | 1,044 | |||||
Accrued and deferred compensation | 22,339 | 22,203 | |||||
Accrued insurance reserves | 2,054 | 1,464 | |||||
Deferred revenue | 10,440 | 9,811 | |||||
Net operating loss and tax credit carryover | 4,301 | 4,512 | |||||
Depreciation and amortization | 473 | 60 | |||||
Pension | 6,568 | 5,770 | |||||
Other reserves | 502 | 1,098 | |||||
Total deferred tax assets | 49,966 | 48,264 | |||||
Less valuation allowance | (210 | ) | (115 | ) | |||
Net deferred tax assets | 49,756 | 48,149 | |||||
Deferred tax liabilities: | |||||||
Depreciation and amortization | (44,292 | ) | (39,708 | ) | |||
U.S. tax on unremitted foreign earnings | (1,107 | ) | (1,106 | ) | |||
Other | (58 | ) | (797 | ) | |||
Total deferred tax liabilities | (45,457 | ) | (41,611 | ) | |||
Total deferred tax asset, net | $ | 4,299 | $ | 6,538 | |||
We carry out our business operations through legal entities in the U.S., Canada, Mexico and China. These operations require that we file corporate income tax returns that are subject to U.S., state and foreign tax laws. We are subject to income tax audits in these multiple jurisdictions.
As of October 30, 2016, the $4.3 million net operating loss and tax credit carryforward included $0.5 million for U.S. state loss carryforwards. The state net operating loss carryforwards will expire in 1 to 19 years, if unused. As of October 30, 2016, our foreign operations have a net operating loss carryforward of approximately $12.9 million, representing $3.4 million of the $4.3 million deferred tax asset related to net operating loss and tax credit carryovers, that will start to expire in fiscal 2026, if unused. During fiscal 2014, after evaluating historical and future financial trends in our Canadian operations, we determined that it is more likely than not that we will utilize all of our current tax loss carryforwards. As a result, we reversed the entire valuation allowance on our net Canadian deferred tax asset. We have a full valuation allowance on the loss generated by our operations in China related to our CENTRIA operations.
95
NOTES TO CONSOLIDATED FINANCIAL STATEMENTS
NCI BUILDING SYSTEMS, INC.
15. INCOME TAXES – (continued)
The following table represents the rollforward of the valuation allowance on deferred taxes activity for the fiscal years ended October 30, 2016, November 1, 2015 and November 2, 2014 (in thousands):
October 30, 2016 | November 1, 2015 | November 2, 2014 | |||||||||
Beginning balance | $ | 115 | $ | — | $ | 4,046 | |||||
(Reductions) additions | 95 | 115 | (4,046 | ) | |||||||
Ending balance | $ | 210 | $ | 115 | $ | — | |||||
Uncertain tax positions
There were no unrecognized tax benefits at October 30, 2016. The total amount of unrecognized tax benefits at November 1, 2015 was $0.1 million, all of which would impact our effective tax rate, if recognized. We do not anticipate any material change in the total amount of unrecognized tax benefits to occur within the next twelve months.
The following table summarizes the activity related to the Company’s unrecognized tax benefits during fiscal 2016 and 2015 (in thousands):
October 30, 2016 | November 1, 2015 | ||||||
Unrecognized tax benefits at beginning of year | $ | 143 | $ | 143 | |||
Additions for tax positions related to prior years | — | — | |||||
Reductions resulting from expiration of statute of limitations | (143 | ) | — | ||||
Unrecognized tax benefits at end of year | $ | — | $ | 143 | |||
We recognize interest and penalties related to uncertain tax positions in income tax expense. To the extent accrued interest and penalties do not ultimately become payable, amounts accrued will be reduced and reflected as a reduction of the overall income tax provision in the period that such determination is made. We did not have a material amount of accrued interest and penalties related to uncertain tax positions as of October 30, 2016.
We file income tax returns in the U.S. federal jurisdiction and multiple state and foreign jurisdictions. Our tax years are closed with the IRS through the year ended October 28, 2012, as the statute of limitations related to these tax years has closed. In addition, open tax years related to state and foreign jurisdictions remain subject to examination but are not considered material.
16. ACCUMULATED OTHER COMPREHENSIVE LOSS
Accumulated other comprehensive loss consists of the following (in thousands):
October 30, 2016 | November 1, 2015 | ||||||
Foreign exchange translation adjustments | $ | (195 | ) | $ | 131 | ||
Defined benefit pension plan actuarial losses, net of tax | (10,358 | ) | (8,411 | ) | |||
Accumulated other comprehensive loss | $ | (10,553 | ) | $ | (8,280 | ) | |
17. OPERATING LEASE COMMITMENTS
We have operating lease commitments expiring at various dates, principally for real estate, office space, office equipment and transportation equipment. Certain of these operating leases have purchase options that entitle us to purchase the respective equipment at fair value at the end of the lease. In addition, many of our leases contain renewal options at rates similar to the current arrangements. As of October 30, 2016, future minimum rental payments related to noncancellable
96
NOTES TO CONSOLIDATED FINANCIAL STATEMENTS
NCI BUILDING SYSTEMS, INC.
17. OPERATING LEASE COMMITMENTS – (continued)
operating leases are as follows (in thousands):
2017 | $ | 11,967 | |
2018 | 9,174 | ||
2019 | 5,617 | ||
2020 | 3,504 | ||
2021 | 2,457 | ||
Thereafter | 10,872 | ||
Rental expense incurred from operating leases, including leases with terms of less than one year, for 2016, 2015 and 2014 was $17.8 million, $15.2 million and $11.6 million, respectively.
18. STOCK REPURCHASE PROGRAM
Our board of directors authorized two stock repurchase programs during the fiscal year ended October 30, 2016, which were publicly announced on January 20, 2016 and September 8, 2016. Together, these stock repurchase programs authorized for up to an aggregate of $106.3 million of the Company’s Common Stock.
On July 18, 2016, the Company entered into an agreement with the CD&R Funds to repurchase approximately 2.9 million shares of our Common Stock for $45.0 million based on the price per share paid by the underwriters to the CD&R Funds in the 2016 Secondary Offering. The 2016 Stock Repurchase represented a private, non-underwritten transaction between the Company and the CD&R Funds that was approved and recommended by the Affiliate Transactions Committee of our board of directors. The closing of the 2016 Stock Repurchase occurred on July 25, 2016 concurrently with the closing of the 2016 Secondary Offering. The 2016 Stock Repurchase was funded by the Company’s cash on hand.
In addition to the 2016 Stock Repurchase, the Company repurchased 1.6 million shares of our Common Stock for $17.9 million through open-market purchases during fiscal 2016 under the authorized stock repurchase programs. The Company repurchased the maximum amount authorized under the stock repurchase program initiated in January 2016. As of October 30, 2016, approximately $43.4 million remains available for stock repurchases under the program authorized in September 2016. The authorized program has no time limit on its duration, but our Credit Agreement, Amended ABL Facility, and Notes apply certain limitations on our repurchase of shares of our Common Stock. The timing and method of any repurchases, which will depend on a variety of factors, including market conditions, are subject to results of operations, financial conditions, cash requirements and other factors, and may be suspended or discontinued at any time.
In addition to the Common Stock repurchased during fiscal 2016, the Company also withheld shares of restricted stock to satisfy minimum tax withholding obligations arising in connection with the vesting of restricted stock units, which are included in treasury stock purchases in the consolidated statements of stockholders’ equity.
The Company canceled 4.0 million of the total shares repurchased during fiscal 2016 as well as 0.4 million shares repurchased in prior fiscal years that had been held in treasury stock, resulting in a $62.3 million decrease in both additional paid in capital and treasury stock during the fiscal year ended October 30, 2016. Changes in treasury stock, at cost, were as
97
NOTES TO CONSOLIDATED FINANCIAL STATEMENTS
NCI BUILDING SYSTEMS, INC.
18. STOCK REPURCHASE PROGRAM – (continued)
follows (in thousands):
Number of Shares | Amount | |||||
Balance, November 3, 2013 | 8 | $ | 116 | |||
Purchases | 1,381 | 23,804 | ||||
Retirements | (1,150 | ) | (19,717 | ) | ||
Balance, November 2, 2014 | 239 | $ | 4,203 | |||
Purchases | 208 | 3,320 | ||||
Retirements | — | — | ||||
Balance, November 1, 2015 | 447 | $ | 7,523 | |||
Purchases | 4,590 | 64,015 | ||||
Issuance of restricted stock | 162 | — | ||||
Retirements | (4,424 | ) | (62,279 | ) | ||
Balance, October 30, 2016 | 775 | $ | 9,259 | |||
19. EMPLOYEE BENEFIT PLANS
Defined Contribution Plan — We have a 401(k) profit sharing plan (the “Savings Plan”) that allows participation for all eligible employees. The Savings Plan allows us to match employee contributions up to 6% of a participant’s pre-tax deferral of eligible compensation into the plan. On February 27, 2009, the Savings Plan was amended, effective January 1, 2009, to make the matching contributions fully discretionary, and matching contributions were temporarily suspended. Effective July 1, 2011, the matching contributions to the Savings Plan were resumed and allowed us the discretion to match between 50% and 100% of the participant’s contributions up to 6% of a participant’s pre-tax deferrals, based on a calculation of the Company’s annual return-on-assets. Contributions expense for the fiscal years ended October 30, 2016, November 1, 2015 and November 2, 2014 was $5.7 million, $5.1 million and $4.0 million, respectively, for matching contributions to the Savings Plan.
Deferred Compensation Plan — We have an Amended and Restated Deferred Compensation Plan (as amended and restated, the “Deferred Compensation Plan”) that allows our officers and key employees to defer up to 80% of their annual salary and up to 90% of their bonus on a pre-tax basis until a specified date in the future, including at or after retirement. Additionally, the Deferred Compensation Plan allows our directors to defer up to 100% of their annual fees and meeting attendance fees until a specified date in the future, including at or after retirement. The Deferred Compensation Plan also permits us to make contributions on behalf of our key employees who are impacted by the federal tax compensation limits under the NCI 401(k) plan, and to receive a restoration matching amount which, under the current NCI 401(k) terms, mirrors our 401(k) profit sharing plan matching levels based on our Company’s performance. The Deferred Compensation Plan provides for us to make discretionary contributions to employees who have elected to defer compensation under the plan. Deferred Compensation Plan participants will vest in our discretionary contributions ratably over three years from the date of each of our discretionary contributions.
On February 26, 2016, the Company amended its Deferred Compensation Plan, with an effective date of January 31, 2016, to require that amounts deferred into the Company Stock Fund remain invested in the Company Stock Fund until distribution. In accordance with the terms of the Deferred Compensation Plan, the deferred compensation obligation related to the Company’s stock may only be settled by the delivery of a fixed number of the Company’s common shares held on the participant’s behalf. As a result, we have a deferred compensation obligation of $1.4 million related to the Company Stock Fund that is recorded within equity in additional paid-in capital on the consolidated balance sheet as of October 30, 2016. Subsequent changes in the fair value of the deferred compensation obligation classified within equity are not recognized. Additionally, the Company currently holds 144,857 shares in treasury shares, relating to deferred, vested 2012 PSU awards, until participants are eligible to receive benefits under the terms of the Deferred Compensation Plan.
As of October 30, 2016 and November 1, 2015, the liability balance of the Deferred Compensation Plan was $3.8 million and $5.2 million, respectively, and was included in accrued compensation and benefits on the consolidated balance sheets. We have not made any discretionary contributions to the Deferred Compensation Plan.
98
NOTES TO CONSOLIDATED FINANCIAL STATEMENTS
NCI BUILDING SYSTEMS, INC.
19. EMPLOYEE BENEFIT PLANS – (continued)
A rabbi trust is used to fund the Deferred Compensation Plan and an administrative committee manages the Deferred Compensation Plan and its assets. The investments in the rabbi trust were $5.7 million and $5.9 million at October 30, 2016 and November 1, 2015, respectively. The rabbi trust investments include debt and equity securities as well as cash equivalents and are accounted for as trading securities.
Defined Benefit Plans — With the acquisition of RCC on April 7, 2006, we assumed a defined benefit plan (the “RCC Pension Plan”). Benefits under the RCC Pension Plan are primarily based on years of service and the employee’s compensation. The RCC Pension Plan is frozen and, therefore, employees do not accrue additional service benefits. Plan assets of the RCC Pension Plan are invested in broadly diversified portfolios of government obligations, mutual funds, stocks, bonds, fixed income securities, master limited partnerships and hedge funds. In accordance with ASC Topic 805, we quantified the projected benefit obligation and fair value of the plan assets of the RCC Pension Plan and recorded the difference between these two amounts as an assumed liability.
As a result of the CENTRIA Acquisition on January 16, 2015, we assumed noncontributory defined benefit plans covering certain hourly employees (the “CENTRIA Benefit Plans”). Benefits under the CENTRIA Benefit Plans are calculated based on fixed amounts for each year of service rendered. CENTRIA also sponsors postretirement medical and life insurance plans that cover certain of its employees and their spouses (the “OPEB Plans”). The contributions to the OPEB Plans by retirees vary from none to 25% of the total premiums paid. Plan assets of the CENTRIA Benefit Plans are invested in broadly diversified portfolios of equity mutual funds, international equity mutual funds, bonds, mortgages and other funds. Currently, our policy is to fund the CENTRIA Benefit Plans as required by minimum funding standards of the Internal Revenue Code. In accordance with ASC Topic 805, we remeasured the projected benefit obligation and fair value of the plan assets of the CENTRIA Benefits Plans and OPEB Plans. The difference between the two amounts was recorded as an assumed liability.
In addition to the CENTRIA Benefit Plans, CENTRIA contributes to a multi-employer plan, the Steelworkers Pension Trust. The minimum required annual contribution to this plan is $0.3 million. The current contract expires on June 1, 2019. If we were to withdraw our participation from this multi-employer plan, CENTRIA may be required to pay a withdrawal liability representing an amount based on the underfunded status of the plan. The plan is not significant to the Company’s consolidated financial statements.
We refer to the RCC Pension Plan and the CENTRIA Benefit Plans collectively as the “Defined Benefit Plans” in this Note.
Assumptions—Weighted average actuarial assumptions used to determine benefit obligations were as follows:
October 30, 2016 | November 1, 2015 | ||||||||||
Defined Benefit Plans | OPEB Plans | Defined Benefit Plans | OPEB Plans | ||||||||
Discount rate | 3.64 | % | 3.25 | % | 4.17 | % | 3.75 | % | |||
Weighted average actuarial assumptions used to determine net periodic benefit cost (income) were as follows:
October 30, 2016 | November 1, 2015 | ||||||||||
Defined Benefit Plans | OPEB Plans | Defined Benefit Plans | OPEB Plans | ||||||||
Discount rate | 4.18 | % | 3.75 | % | 4.08 | % | 3.50 | % | |||
Expected return on plan assets | 6.16 | % | n/a | 6.75 | % | n/a | |||||
Health care cost trend rate-initial | n/a | 9.00 | % | n/a | 9.00 | % | |||||
Health care cost trend rate-ultimate | n/a | 5.00 | % | n/a | 5.00 | % | |||||
The basis used to determine the overall expected long-term asset return assumption for the Defined Benefit Plans for fiscal 2016 was a 10-year forecast of expected return based on the target asset allocation for the plans. The weighted average expected return for the portfolio over the forecast period is 6.16%, net of investment related expenses, and taking into consideration historical experience, anticipated asset allocations, investment strategies and the views of various investment professionals.
99
NOTES TO CONSOLIDATED FINANCIAL STATEMENTS
NCI BUILDING SYSTEMS, INC.
19. EMPLOYEE BENEFIT PLANS – (continued)
The health care cost trend rate for the OPEB Plans was assumed at 6.5% beginning in fiscal 2017, 6.0% for years 2018 to 2024, 5.5% for years 2025 to 2035, 5.0% for years 2036 to 2051 and approximately 4.0% per year thereafter.
Funded status—The changes in the projected benefit obligation, plan assets and funded status, and the amounts recognized on our consolidated balance sheets were as follows (in thousands):
October 30, 2016 | November 1, 2015 | ||||||||||||||||||||||
Change in projected benefit obligation | Defined Benefit Plans | OPEB Plans | Total | Defined Benefit Plans | OPEB Plans | Total | |||||||||||||||||
Accumulated benefit obligation | $ | 58,551 | $ | 8,347 | $ | 66,898 | $ | 58,403 | $ | 7,590 | $ | 65,993 | |||||||||||
Projected benefit obligation – beginning of fiscal year | $ | 58,403 | $ | 7,590 | $ | 65,993 | $ | 63,138 | $ | 8,153 | $ | 71,291 | |||||||||||
Interest cost | 2,354 | 261 | 2,615 | 2,382 | 218 | 2,600 | |||||||||||||||||
Service cost | 137 | 34 | 171 | 115 | 22 | 137 | |||||||||||||||||
Benefit payments | (3,708 | ) | (450 | ) | (4,158 | ) | (4,020 | ) | (663 | ) | (4,683 | ) | |||||||||||
Actuarial (gains) losses | 1,365 | 912 | 2,277 | (3,212 | ) | (140 | ) | (3,352 | ) | ||||||||||||||
Projected benefit obligation – end of fiscal year | $ | 58,551 | $ | 8,347 | $ | 66,898 | $ | 58,403 | $ | 7,590 | $ | 65,993 | |||||||||||
October 30, 2016 | November 1, 2015 | ||||||||||||||||||||||
Change in plan assets | Defined Benefit Plans | OPEB Plans | Total | Defined Benefit Plans | OPEB Plans | Total | |||||||||||||||||
Fair value of assets – beginning of fiscal year | $ | 47,295 | $ | — | $ | 47,295 | $ | 50,815 | $ | — | $ | 50,815 | |||||||||||
Actual return on plan assets | 883 | — | 883 | (999 | ) | — | (999 | ) | |||||||||||||||
Company contributions | 1,690 | 450 | 2,140 | 1,501 | 663 | 2,164 | |||||||||||||||||
Benefit payments | (3,708 | ) | (450 | ) | (4,158 | ) | (4,022 | ) | (663 | ) | (4,685 | ) | |||||||||||
Fair value of assets – end of fiscal year | $ | 46,160 | $ | — | $ | 46,160 | $ | 47,295 | $ | — | $ | 47,295 | |||||||||||
October 30, 2016 | November 1, 2015 | ||||||||||||||||||||||
Funded status | Defined Benefit Plans | OPEB Plans | Total | Defined Benefit Plans | OPEB Plans | Total | |||||||||||||||||
Fair value of assets | $ | 46,160 | $ | — | $ | 46,160 | $ | 47,295 | $ | — | $ | 47,295 | |||||||||||
Benefit obligation | 58,551 | 8,347 | 66,898 | 58,403 | 7,590 | 65,993 | |||||||||||||||||
Funded status | $ | (12,391 | ) | $ | (8,347 | ) | $ | (20,738 | ) | $ | (11,108 | ) | $ | (7,590 | ) | $ | (18,698 | ) | |||||
Benefit obligations in excess of fair value of assets of $20.7 million and $18.7 million as of October 30, 2016 and November 1, 2015, respectively, are included in other long-term liabilities on the consolidated balance sheets.
Plan assets—The investment policy is to maximize the expected return for an acceptable level of risk. Our expected long-term rate of return on plan assets is based on a target allocation of assets, which is based on our goal of earning the highest rate of return while maintaining risk at acceptable levels.
As of October 30, 2016 and November 1, 2015, the weighted average asset allocations by asset category for the Defined Benefit Plans were as follows (in thousands):
100
NOTES TO CONSOLIDATED FINANCIAL STATEMENTS
NCI BUILDING SYSTEMS, INC.
19. EMPLOYEE BENEFIT PLANS – (continued)
Investment type | October 30, 2016 | November 1, 2015 | |||
Equity securities | 45 | % | 48 | % | |
Debt securities | 37 | % | 34 | % | |
Master limited partnerships | 4 | % | 4 | % | |
Cash and cash equivalents | 5 | % | 5 | % | |
Real estate | 5 | % | 5 | % | |
Other | 4 | % | 4 | % | |
Total | 100 | % | 100 | % | |
The principal investment objectives are to ensure the availability of funds to pay pension and postretirement benefits as they become due under a broad range of future economic scenarios, to maximize long-term investment return with an acceptable level of risk based on our pension and postretirement obligations, and to be sufficiently diversified across and within the capital markets to mitigate the risk of adverse or unexpected results from one security class will not have an unduly detrimental . Each asset class has broadly diversified characteristics. Decisions regarding investment policy are made with an understanding of the effect of asset allocation on funded status, future contributions and projected expenses.
The plans strive to have assets sufficiently diversified so that adverse or unexpected results from one security class will not have an unduly detrimental impact on the entire portfolio. We regularly review our actual asset allocation and the investments are periodically rebalanced to our target allocation when considered appropriate. We have set the target asset allocation for the RCC Pension Plan as follows: 45% US bonds, 13% large cap US equities, 9% foreign equity, 8% master limited partnerships, 8% commodity futures, 7% real estate investment trusts, 6% emerging markets and 4% small cap US equities. The CENTRIA Benefit Plans have a target asset allocation of approximately 50%-75% equities and 25%-50% fixed income.
The fair values of the assets of the Defined Benefit Plans at October 30, 2016 and November 1, 2015, by asset category and by levels of fair value, as further defined in Note 14 — Fair Value of Financial Instruments and Fair Value Measurements were as follows (in thousands):
October 30, 2016 | November 1, 2015 | ||||||||||||||||||||||
Asset category | Level 1 | Level 2 | Total | Level 1 | Level 2 | Total | |||||||||||||||||
Cash | $ | 2,186 | $ | — | $ | 2,186 | $ | 2,146 | $ | — | $ | 2,146 | |||||||||||
Mutual funds: | |||||||||||||||||||||||
Growth funds | 5,705 | — | 5,705 | 6,039 | — | 6,039 | |||||||||||||||||
Real estate funds | 2,245 | — | 2,245 | 2,590 | — | 2,590 | |||||||||||||||||
Commodity linked funds | 1,780 | — | 1,780 | 1,791 | — | 1,791 | |||||||||||||||||
Equity income funds | 3,700 | — | 3,700 | 3,704 | — | 3,704 | |||||||||||||||||
Index funds | 2,156 | 54 | 2,210 | 1,914 | 43 | 1,957 | |||||||||||||||||
International equity funds | 225 | 1,271 | 1,496 | 258 | 1,662 | 1,920 | |||||||||||||||||
Fixed income funds | 1,577 | 2,095 | 3,672 | 1,381 | 1,129 | 2,510 | |||||||||||||||||
Master limited partnerships | 2,033 | — | 2,033 | 2,023 | — | 2,023 | |||||||||||||||||
Government securities | — | 5,955 | 5,955 | — | 7,392 | 7,392 | |||||||||||||||||
Corporate bonds | — | 7,315 | 7,315 | — | 6,082 | 6,082 | |||||||||||||||||
Common/collective trusts | — | 7,863 | 7,863 | — | 9,141 | 9,141 | |||||||||||||||||
Total | $ | 21,607 | $ | 24,553 | $ | 46,160 | $ | 21,846 | $ | 25,449 | $ | 47,295 | |||||||||||
101
NOTES TO CONSOLIDATED FINANCIAL STATEMENTS
NCI BUILDING SYSTEMS, INC.
19. EMPLOYEE BENEFIT PLANS – (continued)
Net periodic benefit cost (income)—The components of the net periodic benefit cost (income) were as follows (in thousands):
October 30, 2016 | November 1, 2015 | November 2, 2014 | |||||||||||||||||||||||||
Defined Benefit Plans | OPEB Plans | Total | Defined Benefit Plans | OPEB Plans | Total | RCC Pension Plan | |||||||||||||||||||||
Interest cost | $ | 2,354 | $ | 261 | $ | 2,615 | $ | 2,382 | $ | 218 | $ | 2,600 | $ | 1,912 | |||||||||||||
Service cost | 137 | 34 | 171 | 115 | 22 | 137 | — | ||||||||||||||||||||
Expected return on assets | (2,979 | ) | — | (2,979 | ) | (3,045 | ) | — | (3,045 | ) | (2,369 | ) | |||||||||||||||
Amortization of prior service credit | (9 | ) | — | (9 | ) | (9 | ) | — | (9 | ) | (9 | ) | |||||||||||||||
Amortization of net actuarial loss | 1,170 | — | 1,170 | 1,443 | — | 1,443 | 507 | ||||||||||||||||||||
Net periodic benefit cost (income) | $ | 673 | $ | 295 | $ | 968 | $ | 886 | $ | 240 | $ | 1,126 | $ | 41 | |||||||||||||
The amounts in accumulated other comprehensive income that have not yet been recognized as components of net periodic benefit income are as follows (in thousands):
October 30, 2016 | November 1, 2015 | ||||||||||||||||||||||
Defined Benefit Plans | OPEB Plans | Total | Defined Benefit Plans | OPEB Plans | Total | ||||||||||||||||||
Unrecognized net actuarial loss (gain) | $ | 15,985 | $ | 771 | $ | 16,756 | $ | 13,712 | $ | (140 | ) | $ | 13,572 | ||||||||||
Unrecognized prior service credit | (33 | ) | — | (33 | ) | (42 | ) | — | (42 | ) | |||||||||||||
Total | $ | 15,952 | $ | 771 | $ | 16,723 | $ | 13,670 | $ | (140 | ) | $ | 13,530 | ||||||||||
Unrecognized actuarial losses (gains), net of income tax, of $1.9 million and $(0.4) million during fiscal 2016 and 2015, respectively, are included in other comprehensive income (loss) in the consolidated statements of comprehensive income (loss).
The changes in plan assets and benefit obligation recognized in other comprehensive income are as follows (in thousands):
October 30, 2016 | November 1, 2015 | November 2, 2014 | |||||||||||||||||||||||||
Defined Benefit Plans | OPEB Plans | Total | Defined Benefit Plans | OPEB Plans | Total | RCC Pension Plan | |||||||||||||||||||||
Net actuarial gain (loss) | $ | (3,443 | ) | $ | (911 | ) | $ | (4,354 | ) | $ | (834 | ) | $ | 140 | $ | (694 | ) | $ | (6,886 | ) | |||||||
Amortization of net actuarial loss | 1,170 | — | 1,170 | 1,443 | — | 1,443 | 507 | ||||||||||||||||||||
Amortization of prior service credit | (9 | ) | — | (9 | ) | (9 | ) | — | (9 | ) | (9 | ) | |||||||||||||||
Total recognized in other comprehensive income (loss) | $ | (2,282 | ) | $ | (911 | ) | $ | (3,193 | ) | $ | 600 | $ | 140 | $ | 740 | $ | (6,388 | ) | |||||||||
102
NOTES TO CONSOLIDATED FINANCIAL STATEMENTS
NCI BUILDING SYSTEMS, INC.
19. EMPLOYEE BENEFIT PLANS – (continued)
The estimated amortization for the next fiscal year for amounts reclassified from accumulated other comprehensive income into the consolidated income statement is as follows (in thousands):
October 30, 2016 | |||||||||||
Defined Benefit Plans | OPEB Plans | Total | |||||||||
Amortization of prior service credit | $ | (9 | ) | $ | — | $ | (9 | ) | |||
Amortization of net actuarial loss | 1,374 | — | 1,374 | ||||||||
Total estimated amortization | $ | 1,365 | $ | — | $ | 1,365 | |||||
Actuarial gains and losses are amortized using the corridor method based on 10% of the greater of the projected benefit obligation or the market related value of assets over the average remaining service period of active employees.
We expect to contribute $2.0 million to the Defined Benefit Plans in fiscal 2017. We expect the following benefit payments to be made (in thousands):
Fiscal years ending | Defined Benefit Plans | OPEB Plans | Total | ||||||||
2017 | $ | 4,092 | $ | 779 | $ | 4,871 | |||||
2018 | 4,256 | 771 | 5,027 | ||||||||
2019 | 4,293 | 791 | 5,084 | ||||||||
2020 | 4,144 | 730 | 4,874 | ||||||||
2021 | 3,878 | 648 | 4,526 | ||||||||
2022 - 2026 | 18,587 | 2,210 | 20,797 | ||||||||
20. OPERATING SEGMENTS
Operating segments are defined as components of an enterprise that engage in business activities and by which discrete financial information is available that is evaluated on a regular basis by the chief operating decision maker to make decisions about how to allocate resources to the segment and assess the performance of the segment. We have three operating segments: engineered building systems; metal components; and metal coil coating. All operating segments operate primarily in the nonresidential construction market. Sales and earnings are influenced by general economic conditions, the level of nonresidential construction activity, metal roof repair and retrofit demand and the availability and terms of financing available for construction. Products of our operating segments use similar basic raw materials. The metal coil coating segment consists of cleaning, treating, painting and slitting continuous steel coils before the steel is fabricated for use by construction and industrial users. The metal components segment products include metal roof and wall panels, doors, metal partitions, metal trim, insulated panels and other related accessories. CENTRIA is included in the metal components segment. The engineered building systems segment includes the manufacturing of main frames, Long Bay® Systems and value-added engineering and drafting, which are typically not part of metal components or metal coil coating products or services. The operating segments follow the same accounting policies used for our consolidated financial statements.
We evaluate a segment’s performance based primarily upon operating income before corporate expenses. Intersegment sales are recorded based on standard material costs plus a standard markup to cover labor and overhead and consist of (i) hot-rolled, light gauge painted and slit material and other services provided by the metal coil coating segment to both the metal components and engineered building systems segments; (ii) building components provided by the metal components segment to the engineered building systems segment; and (iii) structural framing provided by the engineered building systems segment to the metal components segment.
Corporate assets consist primarily of cash but also include deferred financing costs, deferred taxes and property, plant and equipment associated with our headquarters in Houston, Texas. These items (and income and expenses related to these items) are not allocated to the operating segments. Corporate unallocated expenses include share-based compensation expenses, and executive, legal, finance, tax, treasury, human resources, information technology, purchasing, marketing and corporate travel expenses. Additional unallocated amounts include interest income, interest expense, debt extinguishment costs and other (expense) income.
103
NOTES TO CONSOLIDATED FINANCIAL STATEMENTS
NCI BUILDING SYSTEMS, INC.
20. OPERATING SEGMENTS – (continued)
The following table represents summary financial data attributable to these operating segments for the periods indicated (in thousands):
Fiscal Year Ended | |||||||||||
October 30, 2016 | November 1, 2015 | November 2, 2014 | |||||||||
Total sales: | |||||||||||
Engineered building systems | $ | 672,235 | $ | 667,166 | $ | 669,843 | |||||
Metal components | 1,044,040 | 920,845 | 694,858 | ||||||||
Metal coil coating | 247,736 | 231,732 | 246,582 | ||||||||
Intersegment sales | (279,083 | ) | (256,050 | ) | (240,743 | ) | |||||
Total net sales | $ | 1,684,928 | $ | 1,563,693 | $ | 1,370,540 | |||||
External sales: | |||||||||||
Engineered building systems | $ | 652,471 | $ | 647,881 | $ | 649,344 | |||||
Metal components | 925,863 | 815,310 | 607,594 | ||||||||
Metal coil coating | 106,594 | 100,502 | 113,602 | ||||||||
Total net sales | $ | 1,684,928 | $ | 1,563,693 | $ | 1,370,540 | |||||
Operating income: | |||||||||||
Engineered building systems | $ | 62,046 | $ | 51,410 | $ | 32,525 | |||||
Metal components | 102,495 | 50,541 | 33,306 | ||||||||
Metal coil coating | 25,289 | 19,080 | 23,982 | ||||||||
Corporate | (81,051 | ) | (64,200 | ) | (64,717 | ) | |||||
Total operating income | $ | 108,779 | $ | 56,831 | $ | 25,096 | |||||
Unallocated other expense | (29,815 | ) | (30,041 | ) | (12,421 | ) | |||||
Income before income taxes | $ | 78,964 | $ | 26,790 | $ | 12,675 | |||||
Depreciation and amortization: | |||||||||||
Engineered building systems | $ | 9,767 | $ | 10,224 | $ | 10,896 | |||||
Metal components | 26,416 | 35,713 | 19,643 | ||||||||
Metal coil coating | 4,674 | 4,401 | 4,031 | ||||||||
Corporate | 1,067 | 1,054 | 2,382 | ||||||||
Total depreciation and amortization expense | $ | 41,924 | $ | 51,392 | $ | 36,952 | |||||
104
NOTES TO CONSOLIDATED FINANCIAL STATEMENTS
NCI BUILDING SYSTEMS, INC.
20. OPERATING SEGMENTS – (continued)
Fiscal Year Ended | |||||||||||
October 30, 2016 | November 1, 2015 | November 2, 2014 | |||||||||
Capital expenditures: | |||||||||||
Engineered building systems | $ | 7,571 | $ | 6,053 | $ | 2,569 | |||||
Metal components | 9,133 | 9,145 | 8,646 | ||||||||
Metal coil coating | 1,805 | 3,279 | 3,935 | ||||||||
Corporate | 2,515 | 2,206 | 2,870 | ||||||||
Total capital expenditures | $ | 21,024 | $ | 20,683 | $ | 18,020 | |||||
Property, plant and equipment, net: | |||||||||||
Engineered building systems | $ | 50,862 | $ | 51,196 | $ | 43,876 | |||||
Metal components | 141,282 | 152,346 | 132,086 | ||||||||
Metal coil coating | 39,678 | 42,558 | 43,690 | ||||||||
Corporate | 10,390 | 11,792 | 25,062 | ||||||||
Total property, plant and equipment, net | $ | 242,212 | $ | 257,892 | $ | 244,714 | |||||
Total assets: | |||||||||||
Engineered building systems | $ | 229,422 | $ | 218,646 | $ | 209,281 | |||||
Metal components | 654,534 | 654,762 | 365,874 | ||||||||
Metal coil coating | 87,194 | 81,456 | 84,519 | ||||||||
Corporate | 87,146 | 124,865 | 99,009 | ||||||||
$ | 1,058,296 | $ | 1,079,729 | $ | 758,683 | ||||||
The following table represents summary financial data attributable to various geographic regions for the periods indicated (in thousands):
Fiscal Year Ended | |||||||||||
October 30, 2016 | November 1, 2015 | November 2, 2014 | |||||||||
Total sales: | |||||||||||
United States of America | $ | 1,589,479 | $ | 1,469,495 | $ | 1,258,055 | |||||
Canada | 61,781 | 72,567 | 92,238 | ||||||||
China | 6,733 | 2,734 | — | ||||||||
Mexico | 4,060 | 5,686 | 4,417 | ||||||||
All other | 22,875 | 13,211 | 15,830 | ||||||||
Total net sales | $ | 1,684,928 | $ | 1,563,693 | $ | 1,370,540 | |||||
Long-lived assets: | |||||||||||
United States of America | $ | 523,134 | $ | 562,443 | $ | 358,634 | |||||
Canada | 9,247 | 90 | 134 | ||||||||
China | 170 | 309 | — | ||||||||
Mexico | 10,701 | 9,471 | 6,095 | ||||||||
Total long-lived assets | $ | 543,252 | $ | 572,313 | $ | 364,863 | |||||
Sales are determined based on customers’ requested shipment location.
21. CONTINGENCIES
As a manufacturer of products primarily for use in nonresidential building construction, the Company is inherently exposed to various types of contingent claims, both asserted and unasserted, in the ordinary course of business. As a result, from time to time, the Company and/or its subsidiaries become involved in various legal proceedings or other contingent matters arising from claims, or potential claims. The Company insures against these risks to the extent deemed prudent by its management and to the extent insurance is available. Many of these insurance policies contain deductibles or self-insured
105
NOTES TO CONSOLIDATED FINANCIAL STATEMENTS
NCI BUILDING SYSTEMS, INC.
21. CONTINGENCIES – (continued)
retentions in amounts the Company deems prudent and for which the Company is responsible for payment. In determining the amount of self-insurance, it is the Company’s policy to self-insure those losses that are predictable, measurable and recurring in nature, such as claims for automobile liability and general liability. The Company regularly reviews the status of on-going proceedings and other contingent matters along with legal counsel. Liabilities for such items are recorded when it is probable that the liability has been incurred and when the amount of the liability can be reasonably estimated. Liabilities are adjusted when additional information becomes available. Management believes that the ultimate disposition of these matters will not have a material adverse effect on the Company’s results of operations, financial position or cash flows. However, such matters are subject to many uncertainties and outcomes are not predictable with assurance.
22. QUARTERLY RESULTS (Unaudited)
Shown below are selected unaudited quarterly data (in thousands, except per share data):
First Quarter | Second Quarter | Third Quarter | Fourth Quarter | |||||||||||||
FISCAL YEAR 2016 | ||||||||||||||||
Sales | $ | 370,014 | $ | 372,247 | $ | 462,353 | $ | 480,314 | ||||||||
Gross profit | $ | 89,716 | $ | 89,375 | $ | 127,951 | $ | 120,849 | ||||||||
Net income | $ | 5,892 | $ | 2,420 | $ | 23,715 | $ | 19,001 | ||||||||
Net income allocated to participating securities | $ | (57 | ) | $ | (23 | ) | $ | (165 | ) | $ | (105 | ) | ||||
Net income applicable to common shares | $ | 5,835 | $ | 2,397 | $ | 23,550 | $ | 18,896 | (3) | |||||||
Income per common share:(1)(2) | ||||||||||||||||
Basic | $ | 0.08 | $ | 0.03 | $ | 0.32 | $ | 0.27 | ||||||||
Diluted | $ | 0.08 | $ | 0.03 | $ | 0.32 | $ | 0.27 | ||||||||
FISCAL YEAR 2015 | ||||||||||||||||
Sales | $ | 322,926 | $ | 360,147 | $ | 420,789 | $ | 459,831 | ||||||||
Gross profit | $ | 72,139 | $ | 75,889 | $ | 100,687 | $ | 123,601 | ||||||||
Net income (loss) | $ | (320 | ) | $ | (7,488 | ) | $ | 7,220 | $ | 18,407 | ||||||
Net income allocated to participating securities | $ | — | $ | — | $ | (60 | ) | $ | (113 | ) | ||||||
Net income (loss) applicable to common shares | $ | (320 | ) | $ | (7,488 | ) | $ | 7,160 | $ | 18,294 | ||||||
Income (loss) per common share:(1)(2) | ||||||||||||||||
Basic | $ | — | $ | (0.10 | ) | $ | 0.10 | $ | 0.25 | |||||||
Diluted | $ | — | $ | (0.10 | ) | $ | 0.10 | $ | 0.25 | |||||||
(1) | The sum of the quarterly income per share amounts may not equal the annual amount reported, as per share amounts are computed independently for each quarter and for the full year based on the respective weighted average common shares outstanding. |
(2) | Excludes net income allocated to participating securities during each of the quarters of fiscal 2016 and the third and fourth quarters of fiscal 2015. These participating securities are treated as a separate class in computing earnings per share (see Note 8 — Earnings per Common Share). |
(3) | The fourth quarter of fiscal 2016 includes the correction of a prior period accounting error of $0.5 million ($0.8 million, before tax). See Note 6 — Goodwill and Other Intangible Assets. |
106
NOTES TO CONSOLIDATED FINANCIAL STATEMENTS
NCI BUILDING SYSTEMS, INC.
22. QUARTERLY RESULTS (Unaudited) – (continued)
The quarterly income (loss) before income taxes were impacted by the following special income (expense) items:
First Quarter | Second Quarter | Third Quarter | Fourth Quarter | ||||||||||||
FISCAL YEAR 2016 | |||||||||||||||
Restructuring and impairment charges | $ | (1,510 | ) | $ | (1,149 | ) | $ | (778 | ) | $ | (815 | ) | |||
Strategic development and acquisition related costs | (681 | ) | (579 | ) | (819 | ) | (590 | ) | |||||||
Gain (loss) on sale of assets and asset recovery | 725 | 927 | 52 | (62 | ) | ||||||||||
Gain from bargain purchase | 1,864 | — | — | — | |||||||||||
Total special charges in income before income taxes | $ | 398 | $ | (801 | ) | $ | (1,545 | ) | $ | (1,467 | ) | ||||
FISCAL YEAR 2015 | |||||||||||||||
Restructuring and impairment charges | $ | (1,480 | ) | $ | (1,465 | ) | $ | (750 | ) | $ | (7,611 | ) | |||
Strategic development and acquisition related costs | (1,729 | ) | (629 | ) | (700 | ) | (1,143 | ) | |||||||
Gain on legal settlements | — | — | — | 3,765 | |||||||||||
Fair value adjustment of acquired inventory | (972 | ) | (386 | ) | (1,000 | ) | — | ||||||||
Amortization of short-lived acquired intangibles | — | (2,720 | ) | (3,334 | ) | (2,346 | ) | ||||||||
Total special charges in income before income taxes | $ | (4,181 | ) | $ | (5,200 | ) | $ | (5,784 | ) | $ | (7,335 | ) | |||
107
Item 9. Changes in and Disagreements with Accountants on Accounting and Financial Disclosure.
None.
Item 9A. Controls and Procedures.
Evaluation of Disclosure Controls and Procedures
Our management, with the participation of our chief executive officer and chief financial officer, evaluated the effectiveness of our disclosure controls and procedures as of October 30, 2016. The term “disclosure controls and procedures,” as defined in Rules 13a-15(e) and 15d-15(e) under the Exchange Act, means controls and other procedures of a company that are designed to ensure that information required to be disclosed by a company in the reports that it files or submits under the Exchange Act is recorded, processed, summarized and reported, within the time periods specified in the SEC’s rules and forms. Disclosure controls and procedures include, without limitation, controls and procedures designed to ensure that information required to be disclosed by a company in the reports that it files or submits under the Exchange Act is accumulated and communicated to the company’s management, including its principal executive and principal financial officers, as appropriate to allow timely decisions regarding the required disclosure. Management recognizes that any controls and procedures, no matter how well designed and operated, can provide only reasonable assurance of achieving their objectives and management necessarily applies its judgment in evaluating the cost-benefit relationship of possible controls and procedures. Management believes that our disclosure controls and procedures are designed to provide reasonable assurance of achieving their objectives. Based on the evaluation of our disclosure controls and procedures as of October 30, 2016, our disclosure controls and procedures were ineffective because of the material weaknesses described below relating to the control environment of the CENTRIA subsidiary (“CENTRIA”) and the design of controls over the allocation of total contract consideration in multiple element revenue arrangements within the Company’s engineered building systems segment.
Management’s report on internal control over financial reporting is included in Item 8 and is incorporated herein by reference.
Identification of Material Weaknesses
Management has concluded that the presence of the control deficiencies within CENTRIA’s processes and the gaps in the design of controls over the allocation of total contract consideration in multiple element revenue arrangements within the engineered building systems segment, as described below, rose to the level of material weaknesses in the Company’s internal control over financial reporting as of October 30, 2016 based on the criteria set forth by COSO in Internal Control - Integrated Framework (2013 framework).
CENTRIA control environment. CENTRIA was acquired on January 16, 2015 and was excluded from our assessment of internal control over financial reporting during fiscal 2015. In fiscal 2016, management was required to include the controls of CENTRIA in its assessment of internal control over financial reporting. In the fourth quarter of fiscal 2016, management discovered deficiencies in the control environment related to CENTRIA. These control deficiencies did not result in a material adjustment to the Company’s financial results reported herein; however, the Company recorded an immaterial cumulative adjustment related to the fair value of liabilities assumed in the acquisition of CENTRIA, as described in Note 6 — Goodwill and Other Intangible Assets. Prior to the acquisition, CENTRIA was a privately held company and had not been required to develop an effective system of internal control commensurate with public company reporting requirements. Despite the recent implementation of certain additional control procedures following the acquisition of CENTRIA, our control environment continues to lack adequate procedures designed to perform, document and retain evidence of the performance of key controls and has certain accounting system limitations that require manual processes at CENTRIA.
The material weakness specifically related to i) the lack of effective control procedures to support the preparation, analysis and review of certain significant account reconciliations required to assess the appropriateness of account balances at period end and ii) limitations in the ability of the accounting system to produce complete and accurate reports to support the timely performance of key controls and the analysis of changes, or lack thereof, in certain account balances. In light of the identified material weakness, the Company performed additional review and other procedures at CENTRIA prior to filing this Annual Report on Form 10-K.
Design of internal controls over the allocation of total contract consideration for multiple element revenue arrangements within the Company’s engineered building systems segment. A portion of revenue within our engineered building systems segment includes multiple element revenue arrangements in which the total contract consideration is allocated to various phases of the contract and is recognized as the various phases are completed and shipped. Each deliverable is generally determined based on customer-specific manufacturing and delivery requirements. Because the separate deliverables have standalone value to the customer, they represent separate units of accounting.
108
This material weakness resulted from gaps in the design of controls, including general IT and other IT-related controls, over the monitoring and review of the estimated selling price that was allocated to each separate unit of accounting for revenue arrangements within the Company’s engineered building systems segment. Although corporate finance management review controls were in place to address the risk of an improper allocation of total contract consideration to the multiple revenue elements, they were not designed and documented at a sufficient level of precision to mitigate the risk of a material error. Management performed additional review and other procedures over multiple element revenue arrangements within the Company’s engineered building systems segment prior to the filing this Annual Report on Form 10-K, which did not result in any adjustments to the consolidated financial statements.
Remediation Efforts to Address Material Weaknesses
We are committed to the remediation of the material weaknesses in a timely manner. We have begun the process of developing a remediation plan that will address the material weaknesses in internal control over financial reporting. Specifically, we intend to implement changes to the design of the controls over the affected processes and to ensure such controls function at an appropriate level as follows:
• | Complete supplemental training regarding the performance of key controls, including the retention of adequate supporting documentation for such controls |
• | Implement system enhancements to provide timely and complete information in support of periodic control requirements and to reduce the reliance on manual processes |
• | Enhance the corporate finance management review controls that are relied upon to review multiple element revenue arrangements |
• | Provide continued and enhanced oversight until the material weaknesses are remediated |
As we continue to monitor the effectiveness of our internal control over financial reporting in the areas affected by the material weaknesses, we will perform additional procedures, including the use of manual mitigating control procedures where necessary, and will employ any additional resources deemed necessary to provide assurance that our financial statements continue to be fairly stated in all material respects. As we continue to evaluate and improve our disclosure controls and procedures and internal control over financial reporting, we may determine that additional measures are necessary to address these control deficiencies or that a modification of certain of the remediation measures described above is appropriate.
Changes in Internal Control over Financial Reporting
Except as noted above, there has been no change in our internal control over financial reporting (as defined in Rules 13a-15(f) and 15d-15(f) under the Exchange Act) during the fiscal quarter ended October 30, 2016 that has materially affected, or is reasonably likely to materially affect, our internal control over financial reporting.
Item 9B. Other Information.
None.
109
PART III
Item 10. Directors, Executive Officers and Corporate Governance.
We have adopted a Code of Business Conduct and Ethics, a copy of which is available on our internet website at www.ncibuildingsystems.com under the heading “About NCI — Committees and Charters.” Any amendments to or waivers from the Code of Business Conduct and Ethics that apply to our executive officers and directors will be posted to our website in the same section as the Code of Business Conduct and Ethics as noted above. However, the information on our website is not incorporated by reference into this Form 10-K.
The information under the captions “Election of Directors,” “Management,” “Section 16(a) Beneficial Ownership Reporting Compliance,” “Board of Directors” and “Corporate Governance” in our definitive proxy statement for our annual meeting of shareholders to be held on February 23, 2017 is incorporated by reference herein.
Item 11. Executive Compensation.
The information under the captions “Compensation Discussion & Analysis,” “Compensation Committee Report” and “Executive Compensation” in our definitive proxy statement for our annual meeting of shareholders to be held on February 23, 2017 is incorporated by reference herein.
Item 12. Security Ownership of Certain Beneficial Owners and Management and Related Stockholder Matters.
The information under the caption “Outstanding Capital Stock” in our definitive proxy statement for our annual meeting of shareholders to be held on February 23, 2017 is incorporated by reference herein.
Item 13. Certain Relationships and Related Transactions, and Director Independence.
The information under the captions “Board of Directors” and “Transactions with Related Persons” in our definitive proxy statement for our annual meeting of shareholders to be held on February 23, 2017 is incorporated by reference herein.
Item 14. Principal Accounting Fees and Services.
The information under the caption “Audit Committee and Auditors — Our Independent Registered Public Accounting Firm and Audit Fees” in our definitive proxy statement for our annual meeting of shareholders to be held on February 23, 2017 is incorporated by reference herein.
110
PART IV
Item 15. Exhibits, Financial Statement Schedules.
(a) | The following documents are filed as a part of this report: |
1. | consolidated financial statements (see Item 8). |
2. | consolidated financial statement schedules. |
All schedules have been omitted because they are inapplicable, not required, or the information is included elsewhere in the consolidated financial statements or notes thereto.
3. | Exhibits |
Those exhibits required to be filed by Item 601 of Regulation S-K are listed in the Index to Exhibits immediately preceding the exhibits filed herewith and such listing is incorporated herein by reference.
Item 16. Form 10-K Summary.
None.
111
SIGNATURES
Pursuant to the requirements of Section 13 or 15(d) of the Securities Exchange Act of 1934, the registrant has duly caused this report to be signed on its behalf by the undersigned, thereunto duly authorized.
NCI BUILDING SYSTEMS, INC. | ||
By: | /s/ Norman C. Chambers | |
Norman C. Chambers, Chairman of the Board and Chief Executive Officer | ||
Date: January 9, 2017
Pursuant to the requirements of the Securities Exchange Act of 1934, this report has been signed below by the following persons on behalf of the registrant and in the capacities and on the dates indicated per Form 10-K.
Name | Title | Date | ||
/s/ Norman C. Chambers | Chairman of the Board and Chief Executive Officer (Principal Executive Officer) | January 9, 2017 | ||
Norman C. Chambers | ||||
/s/ Mark E. Johnson | Executive Vice President, Chief Financial Officer and Treasurer (Principal Financial Officer) | January 9, 2017 | ||
Mark E. Johnson | ||||
/s/ Bradley S. Little | Vice President — Finance and Chief Accounting Officer (Principal Accounting Officer) | January 9, 2017 | ||
Bradley S. Little | ||||
* | Director | January 9, 2017 | ||
Kathleen J. Affeldt | ||||
* | Director | January 9, 2017 | ||
George L. Ball | ||||
* | Director | January 9, 2017 | ||
James G. Berges | ||||
* | Director | January 9, 2017 | ||
Matthew J. Espe | ||||
* | Director | January 9, 2017 | ||
Gary L. Forbes | ||||
* | Director | January 9, 2017 | ||
John J. Holland | ||||
* | Director | January 9, 2017 | ||
Lawrence J. Kremer | ||||
* | Director | January 9, 2017 | ||
George Martinez | ||||
* | Director | January 9, 2017 | ||
Nathan K. Sleeper | ||||
* | Director | January 9, 2017 | ||
Jonathan L. Zrebiec | ||||
*By: | /s/ Norman C. Chambers |
Norman C. Chambers, Attorney-in-Fact | |
112
Index to Exhibits
2.1 | Stockholders Agreement, dated as of October 20, 2009, by and between the Company, Clayton, Dubilier & Rice Fund VIII, L.P. and CD&R Friends & Family Fund VIII, L.P. (filed as Exhibit 2.1 to NCI’s Current Report on Form 8-K dated October 26, 2009 and incorporated by reference herein) | |
2.2 | Registration Rights Agreement, dated as of October 20, 2009, by and between the Company, Clayton, Dubilier & Rice Fund VIII, L.P. and CD&R Friends & Family Fund VIII, L.P. (filed as Exhibit 2.2 to NCI’s Current Report on Form 8-K dated October 26, 2009 and incorporated by reference herein) | |
2.3 | Indemnification Agreement, dated as of October 20, 2009, by and between the Company, NCI Group, Inc., Robertson-Ceco II Corporation, Clayton, Dubilier & Rice Fund VIII, L.P., CD&R Friends & Family Fund VIII, L.P. and Clayton, Dubilier & Rice, Inc. (filed as Exhibit 2.3 to NCI’s Current Report on Form 8-K dated October 26, 2009 and incorporated by reference herein) | |
2.5 | Investment Agreement, dated as of August 14, 2009, by and between NCI Building Systems, Inc. and Clayton, Dubilier & Rice Fund VIII, L.P. (filed as Exhibit 2.1 to NCI’s Current Report on Form 8-K dated August 19, 2009 and incorporated by reference herein) | |
2.6 | Amendment, dated as of August 28, 2009, to the Investment Agreement, dated as of August 14, 2009, by and between NCI Building Systems, Inc. and Clayton, Dubilier & Rice Fund VIII, L.P. (filed as Exhibit 2.1 to NCI’s Current Report on Form 8-K dated August 28, 2009 and incorporated by reference herein) | |
2.7 | Amendment No. 2, dated as of August 31, 2009, to the Investment Agreement (as amended), dated as of August 14, 2009, by and between NCI Building Systems, Inc. and Clayton, Dubilier & Rice, Fund VIII, L.P., including exhibits thereto (filed as Exhibit 2.1 to NCI’s Current Report on Form 8-K filed September 1, 2009 and incorporated by reference herein) | |
2.8 | Amendment No. 3, dated as of October 8, 2009, to the Investment Agreement (as amended), dated as of August 14, 2009, by and between NCI Building Systems, Inc. and Clayton, Dubilier & Rice, Fund VIII, L.P., including exhibits thereto (filed as Exhibit 2.1 to NCI’s Current Report on Form 8-K filed October 8, 2009 and incorporated by reference herein) | |
2.9 | Amendment No. 4, dated as of October 16, 2009, to the Investment Agreement (as amended), dated as of August 14, 2009, by and between NCI Building Systems, Inc. and Clayton, Dubilier & Rice, Fund VIII, L.P., including exhibits thereto (filed as Exhibit 2.1 to NCI’s Current Report on Form 8-K filed October 19, 2009 and incorporated by reference herein) | |
2.10 | Lock-Up and Voting Agreement, dated as of August 31, 2009, by and among NCI Building Systems, Inc. and the signatories thereto (incorporated by reference to exhibit 2.2 to Form 8-K filed with the SEC on September 1, 2009) | |
2.11 | Amendment No. 1 to Lock-Up and Voting Agreement, dated as of October 8, 2009, by and among NCI Building Systems, Inc. and the signatories thereto (incorporated by reference to exhibit 2.3 to Form 8-K filed with the SEC on October 8, 2009) | |
2.12 | Lock-Up and Voting Agreement, dated as of October 8, 2009, by and among NCI Building Systems, Inc. and the signatories thereto (incorporated by reference to exhibit 2.2 to Form 8-K filed with the SEC on October 8, 2009) | |
2.13 | Equity Purchase Agreement, dated as of May 2, 2012, by and among VSMA, Inc., Metl-Span LLC, NCI Group, Inc. and BlueScope Steel North America Corporation (filed as Exhibit 2.1 to NCI’s Current Report on Form 8-K dated May 8, 2012 and incorporated by reference herein) | |
2.14 | Interest Purchase Agreement, dated as of November 7, 2014, by and among NCI Group, Inc., Steelbuilding.com, Inc., SMST Management Corp., Riverfront Capital Fund and CENTRIA (filed as Exhibit 2.1 to NCI’s Current Report on Form 8-K dated November 12, 2014 and incorporated by reference herein) | |
3.1 | Restated Certificate of Incorporation, as amended through September 30, 1998 (filed as Exhibit 3.1 to NCI’s Annual Report on Form 10-K for the fiscal year ended November 2, 2002 and incorporated by reference herein) | |
3.2 | Certificate of Amendment to Restated Certificate of Incorporation, effective as of March 12, 2007 (filed as Exhibit 3.2 to NCI’s Quarterly Report on Form 10-Q for the quarter ended April 29, 2007 and incorporated by reference herein) | |
3.3 | Certificate of Amendment to Restated Certificate of Incorporation, effective as of March 4, 2010 (filed as Exhibit 4.3 to NCI’s registration statement on Form S-8 filed with the SEC on April 23, 2010 and incorporated by reference herein) | |
3.4 | Fourth Amended and Restated By-laws of NCI Building Systems, Inc., effective as of February 25, 2014 (filed as Exhibit 3.1 to NCI’s Current Report on Form 8-K dated February 26, 2014 and incorporated by reference herein) | |
3.5 | Amendment Agreement, dated as of May 8, 2012 (filed as Exhibit 4.1 to NCI’s Current Report on Form 8-K dated May 14, 2012 and incorporated by reference herein) | |
113
3.6 | Amended and Restated Certificate of Designations, Preferences and Rights of Series B Cumulative Convertible Participating Preferred Stock of the Company (filed as Annex B to Schedule 14C dated June 15, 2012 and incorporated by reference herein) | |
3.7 | Certificate of Elimination of the Series A Junior Participating Preferred Stock of the Company (filed as Exhibit 3.2 to NCI’s Current Report on Form 8-K dated October 26, 2009 and incorporated by reference herein) | |
3.8 | Certificate of Increase of Number of Shares of Series B Cumulative Convertible Participating Preferred Stock of the Company (filed as Exhibit 3.3 to NCI’s Current Report on Form 8-K dated October 26, 2009 and incorporated by reference herein) | |
4.1 | Form of certificate representing shares of NCI’s common stock (filed as Exhibit 1 to NCI’s registration statement on Form 8-A filed with the SEC on July 20, 1998 and incorporated by reference herein) | |
4.2 | Amendment No. 1 to the Credit Agreement, dated as of June 24, 2013, among NCI Building Systems, Inc., as borrower, and Credit Suisse AG, Cayman Islands Branch, as administrative agent and collateral agent and the other financial institutions party thereto from time to time (filed as Exhibit 10.1 to NCI’s Current Report on Form 8-K dated June 24, 2013 and incorporated by reference herein) | |
4.3 | Credit Agreement, dated as of June 22, 2012, among the Company, as Borrower, Credit Suisse AG, Cayman Islands Branch, as Administrative Agent and Collateral Agent, and the lenders party thereto (filed as Exhibit 10.1 to NCI’s Current Report on Form 8-K dated June 22, 2012 and incorporated by reference herein) | |
4.4 | Amendment No. 3 to Loan and Security Agreement, dated as of November 7, 2014 (filed as Exhibit 10.2 to NCI’s Current Report on Form 8-K dated November 12, 2014 and incorporated by reference herein) | |
4.5 | Amendment No. 2 to Loan and Security Agreement, dated as of May 2, 2012 (filed as Exhibit 10.2 to NCI’s Current Report on Form 8-K dated May 2, 2012 and incorporated by reference herein) | |
4.6 | Amendment No. 1 to Loan and Security Agreement, dated December 3, 2010, by and among the Company, as borrower or guarantor, certain domestic subsidiaries of the Company, as borrowers or guarantors, Wells Fargo Capital Finance, LLC, as administrative agent and co-collateral agent (filed as Exhibit 2.1 to NCI’s Current Report on Form 8-K dated December 9, 2010 and incorporated by reference herein) | |
4.7 | Loan and Security Agreement, dated as of October 20, 2009, by and among NCI Group, Inc. and Robertson-Ceco II Corporation, as borrowers, the Company and Steelbuilding.Com, Inc., as guarantors, Wells Fargo Foothill, LLC, as administrative and co-collateral agent, Bank of America, N.A. and General Electric Capital Corporation, as co-collateral agents and the lenders and issuing bank party thereto (filed as Exhibit 10.2 to NCI’s Current Report on Form 8-K dated October 26, 2009 and incorporated by reference herein) | |
4.8 | Amendment No. 1 to Intercreditor Agreement, dated as of June 22, 2012, among the Company, certain of its subsidiaries, Credit Suisse AG, Cayman Islands Branch, as Term Loan Administrative Agent and Term Loan Agent, Wells Fargo Capital Finance, LLC, as Working Capital Administrative Agent and Working Capital Agent and Credit Suisse AG, Cayman Islands Branch, as Control Agent (filed as Exhibit 10.3 to NCI’s Current Report on Form 8-K dated June 22, 2012 and incorporated by reference herein) | |
4.9 | Intercreditor Agreement, dated as of October 20, 2009, by and among the Company, as borrower or guarantor, certain domestic subsidiaries of the Company, as borrowers or guarantors, Wachovia Bank, National Association, as term loan agent and term loan administrative agent, Wells Fargo Foothill, LLC, as working capital agent and working capital administrative agent and Wells Fargo Bank, National Association, as control agent (filed as Exhibit 10.3 to NCI’s Current Report on Form 8-K dated October 26, 2009 and incorporated by reference herein) | |
4.10 | Guarantee and Collateral Agreement, dated as of June 22, 2012, made by the Company and certain of its subsidiaries, Credit Suisse AG, Cayman Islands Branch, as Collateral Agent (filed as Exhibit 10.2 to NCI’s Current Report on Form 8-K dated June 22, 2012 and incorporated by reference herein) | |
4.11 | Amendment No. 1 to Guaranty Agreement, dated as of June 22, 2012, among Wells Fargo Capital Finance, LLC, formerly known as Wells Fargo Foothill, LLC, in its capacity as administrative agent and co-collateral agent pursuant to the Loan Agreement (as therein defined) acting for and on behalf of the parties thereto as lenders, NCI Group, Inc., Robertson-Ceco II Corporation, the Company and Steelbuilding.com, Inc. (filed as Exhibit 10.4 to NCI’s Current Report on Form 8-K dated June 22, 2012 and incorporated by reference herein) | |
4.12 | Guaranty Agreement, dated as of October 20, 2009 by NCI Group, Inc., Robertson-Ceco II Corporation, the Company and Steelbuilding.com, Inc., in favor of Wells Fargo Foothill, LLC as administrative agent and collateral agent (filed as Exhibit 10.5 to NCI’s Current Report on Form 8-K dated October 26, 2009 and incorporated by reference herein) | |
4.13 | Pledge and Security Agreement, dated as of October 20, 2009, by and among the Company, NCI Group, Inc. and Robertson-Ceco II Corporation, to and in favor of Wells Fargo Foothill, LLC in its capacity as administrative agent and collateral agent (filed as Exhibit 10.6 to NCI’s Current Report on Form 8-K dated October 26, 2009 and incorporated by reference herein) | |
114
4.14 | Commitment Letter, dated as of November 7, 2014, from Credit Suisse AG, Credit Suisse Securities (USA) LLC, Citigroup Global Markets Inc., UBS AG, Stamford Branch, UBS Securities LLC, Royal Bank of Canada and RBC Capital Markets (filed as Exhibit 10.1 to NCI’s Current Report on Form 8-K dated November 12, 2014 and incorporated by reference herein) | |
4.15 | Indenture, dated as of January 16, 2015, among NCI Building Systems, Inc., NCI Group, Inc., Robertson-Ceco II Corporation, Steelbuilding.com, Inc. and Wilmington Trust, National Association (filed as Exhibit 4.1 to NCI’s Current Report on Form 8-K dated January 16, 2015 and incorporated by reference herein) | |
4.16 | First Supplemental Indenture, dated as of January 16, 2015, among NCI Building Systems, Inc., the guarantors listed on the signature pages thereto and Wilmington Trust, National Association (filed as Exhibit 4.2 to NCI’s Current Report on Form 8-K dated January 16, 2015 and incorporated by reference herein) | |
4.17 | Second Supplemental Indenture, dated as of January 16, 2015, among NCI Building Systems, Inc., the guarantors listed on the signature pages thereto and Wilmington Trust, National Association (filed as Exhibit 4.3 to NCI’s Current Report on Form 8-K dated January 16, 2015 and incorporated by reference herein) | |
10.1 | Reserved. | |
10.2 | Reserved. | |
10.3 | Reserved. | |
†10.4 | Stock Option Plan, as amended and restated on December 14, 2000 (filed as Exhibit 10.4 to NCI’s Annual Report on Form 10-K for the fiscal year ended October 31, 2000 and incorporated by reference herein) | |
†10.5 | Form of Nonqualified Stock Option Agreement (filed as Exhibit 10.5 to NCI’s Annual Report on Form 10-K for the fiscal year ended October 31, 2000 and incorporated by reference herein) | |
†10.6 | 2003 Long-Term Stock Incentive Plan, as amended and restated October 16, 2012 (filed as Annex A to NCI’s Proxy Statement for the Annual Meeting held February 26, 2013 and incorporated by reference herein) | |
†10.7 | Form of Nonqualified Stock Option Agreement (filed as Exhibit 4.2 to NCI’s registration statement no. 333-111139 and incorporated by reference herein) | |
†10.8 | Form of Incentive Stock Option Agreement (filed as Exhibit 4.3 to NCI’s registration statement no. 333-111139 and incorporated by reference herein) | |
†10.9 | Form of Restricted Stock Award Agreement for Senior Executive Officers (Electronic) (filed as Exhibit 10.2 to NCI’s Current Report on Form 8-K dated December 7, 2006 and incorporated by reference herein) | |
†10.10 | Form of Restricted Stock Award Agreement for Key Employees (filed as Exhibit 10.3 to NCI’s Current Report on Form 8-K dated December 7, 2006 and incorporated by reference herein) | |
†10.11 | Form of Restricted Stock Unit Agreement (filed as Exhibit 10.1 to NCI’s Current Report on Form 8-K dated December 7, 2006 and incorporated by reference herein) | |
†10.12 | Form of Restricted Stock Award Agreement for Non-Employee Directors (filed as Exhibit 10.4 to NCI’s Current Report on Form 8-K dated October 23, 2006 and incorporated by reference herein) | |
†10.13 | Restricted Stock Agreement, dated April 26, 2004, between NCI and Norman C. Chambers (filed as exhibit 10.2 to NCI’s Quarterly Report on Form 10-Q for the quarter ended May 1, 2004 and incorporated by reference herein) | |
†10.14 | First Amendment, dated October 24, 2005, to Restricted Stock Agreement, dated April 26, 2004, between NCI and Norman C. Chambers (filed as Exhibit 10.21 to NCI’s Annual Report on Form 10-K for the fiscal year ended October 29, 2005 and incorporated by reference herein) | |
†10.15 | Restricted Stock Agreement, effective August 26, 2004, between NCI and Mark Dobbins (filed as Exhibit 10.15 to NCI’s Annual Report on Form 10-K for the fiscal ended November 1, 2009 and incorporated by reference herein) | |
†10.16 | Restricted Stock Agreement, effective August 26, 2004 between NCI and Charles Dickinson (filed as Exhibit 10.16 to NCI’s Annual Report on Form 10-K for the fiscal ended November 1, 2009 and incorporated by reference herein) | |
†10.17 | NCI Building Systems, Inc. Deferred Compensation Plan (as amended and restated effective December 1, 2009) (filed as Exhibit 4.5 to Form S-8 dated April 23, 2010 and incorporated by reference herein) | |
†10.18 | Form of Employment Agreement between NCI and executive officers (filed as Exhibit 10.25 to NCI’s Annual Report on Form 10-K for the fiscal year ended October 28, 2007 and incorporated by reference herein) | |
†10.19 | Form of Amendment Agreement, dated August 14, 2009, among the Company, NCI Group, L.P. and executive officers (filed as Exhibit 10.20 to NCI’s Annual Report on Form 10-K for the fiscal ended November 1, 2009 and incorporated by reference herein) | |
†10.20 | Form of Indemnification Agreement for Officers and Directors (filed as Exhibit 10.1 to NCI’s Current Report on Form 8-K dated October 22, 2008 and incorporated by reference herein) | |
†10.21 | Form of Director Indemnification Agreement (filed as Exhibit 10.7 to NCI’s Current Report on Form 8-K dated October 26, 2009 and incorporated by reference herein) | |
115
10.22 | Mutual Waiver and Consent (filed as Exhibit 10.1 to NCI’s Quarterly Report on Form 10-Q for the quarter ended July 31, 2011 and incorporated by reference herein) | |
10.23 | Mutual Waiver and Consent (filed as Exhibit 10.1 to NCI’s Current Report on Form 8-K dated December 12, 2011 and incorporated by reference herein) | |
†10.24 | Consulting Agreement, effective March 23, 2012, by and between NCI Building Systems, Inc. and Charles W. Dickinson (filed as Exhibit 99.1 to NCI’s Current Report on Form 8-K dated March 26, 2012 and incorporated by reference herein) | |
†10.25 | Form of First Amendment to the Restricted Stock Agreement by and between NCI Building Systems, Inc. and Charles W. Dickinson (filed as Exhibit 99.2 to NCI’s Current Report on Form 8-K dated March 26, 2012 and incorporated by reference herein) | |
†10.26 | First Amendment to the Nonqualified Stock Option Agreement, effective March 23, 2012, by and between NCI Building Systems, Inc. and Charles W. Dickinson (filed as Exhibit 99.3 to NCI’s Current Report on Form 8-K dated March 26, 2012 and incorporated by reference herein) | |
†10.27 | Form of 2010 Nonqualified Stock Option Agreement to Top Eight (8) Executive Officers (filed as Exhibit 99.4 to NCI’s Current Report on Form 8-K dated March 26, 2012 and incorporated by reference herein) | |
†10.28 | NCI Senior Executive Bonus Plan (filed as Exhibit 10.1 to NCI’s Current Report on Form 8-K dated February 26, 2014 and incorporated by reference herein) | |
†10.29 | Form of Performance Cash and Share Award Agreement (filed as Exhibit 10.2 to NCI’s Quarterly Report on Form 10-Q for the quarter ended February 2, 2014 and incorporated by reference herein) | |
†10.30 | Form of Restricted Stock and Performance Share Award Agreement (filed as Exhibit 99.1 to NCI’s Current Report on Form 8-K dated December 17, 2014 and incorporated by reference herein) | |
†10.31 | Employment Agreement, effective September 1, 2015, by and between NCI Building Systems, Inc. and Norman C. Chambers (filed as Exhibit 10.1 to NCI’s Quarterly Report on Form 10-Q for the quarter ended August 2, 2015 and incorporated by reference herein) | |
†10.32 | Transition and Separation Agreement, effective March 9, 2015, by and among NCI Group, Inc., NCI Building Systems, Inc. and Mark W. Dobbins (filed as Exhibit 10.1 to NCI’s Quarterly Report on Form 10-Q for the quarter ended May 3, 2015 and incorporated by reference herein) | |
†10.33 | Transition and Separation Agreement, effective March 9, 2015, by and among NCI Group, Inc., NCI Building Systems, Inc. and Bradley D. Robeson (filed as Exhibit 10.2 to NCI’s Quarterly Report on Form 10-Q for the quarter ended May 3, 2015 and incorporated by reference herein) | |
†10.34 | Conditional Offer of Employment, dated as of August 27, 2014, by NCI Group, Inc. to Katy Theroux (filed as Exhibit 10.35 to NCI’s Annual Report on Form 10-K for the fiscal ended November 1, 2015 and incorporated by reference herein) | |
†10.35 | Conditional Offer of Employment, dated as of November 14, 2014, by NCI Group, Inc. to Don Riley (filed as Exhibit 10.36 to NCI’s Annual Report on Form 10-K for the fiscal ended November 1, 2015 and incorporated by reference herein) | |
†10.36 | Form of Award Agreement for Restricted Stock Units and Performance Share Awards for Senior Executive Officers (December 2015 awards) (filed as Exhibit 10.1 to NCI’s Quarterly Report on Form 10-Q for the quarter ended January 31, 2016 and incorporated by reference herein) | |
†10.37 | Form of Award Agreement for Restricted Stock Units and Performance Share Awards for Key Employees (December 2015 awards) (filed as Exhibit 10.2 to NCI’s Quarterly Report on Form 10-Q for the quarter ended January 31, 2016 and incorporated by reference herein) | |
†10.38 | Form of Award Agreement for One-Time Grant of Performance Share Units to Donald R. Riley and John L. Kuzdal (December 2015) (filed as Exhibit 10.3 to NCI’s Quarterly Report on Form 10-Q for the quarter ended January 31, 2016 and incorporated by reference herein) | |
†10.39 | General Form of Award Agreement for Equity Awards (December 2015) (filed as Exhibit 10.4 to NCI’s Quarterly Report on Form 10-Q for the quarter ended January 31, 2016 and incorporated by reference herein) | |
†10.40 | Form of Award Agreement for Director Restricted Stock Units (December 2015) (filed as Exhibit 10.5 to NCI’s Quarterly Report on Form 10-Q for the quarter ended January 31, 2016 and incorporated by reference herein) | |
†10.41 | Form of Award Agreement for Director Stock Options (December 2015) (filed as Exhibit 10.6 to NCI’s Quarterly Report on Form 10-Q for the quarter ended January 31, 2016 and incorporated by reference herein) | |
†10.42 | NCI Building Systems, Inc. Deferred Compensation Plan (as amended and restated effective January 31, 2016) (filed as Exhibit 10.7 to NCI’s Quarterly Report on Form 10-Q for the quarter ended January 31, 2016 and incorporated by reference herein) | |
†10.43 | First Amendment to the NCI Building Systems, Inc. 2003 Long-Term Stock Incentive Plan, as amended and restated October 16, 2012, dated May 31, 2016 (filed as Exhibit 10.1 to NCI’s Quarterly Report on Form 10-Q for the quarter ended July 31, 2016 and incorporated by reference herein) | |
116
†10.44 | Amendment to Employment Agreement by and between NCI Building Systems, Inc. and Norman C. Chambers, dated June 15, 2016 (filed as Exhibit 10.2 to NCI’s Quarterly Report on Form 10-Q for the quarter ended July 31, 2016 and incorporated by reference herein) | |
†10.45 | Form of Employment Agreement between NCI Building Systems, Inc. and named executive officers (filed as Exhibit 10.3 to NCI’s Quarterly Report on Form 10-Q for the quarter ended July 31, 2016 and incorporated by reference herein) | |
†10.46 | Form of Employment Agreement between NCI Building Systems, Inc. and executive officers (filed as Exhibit 10.4 to NCI’s Quarterly Report on Form 10-Q for the quarter ended July 31, 2016 and incorporated by reference herein) | |
10.47 | Stock Repurchase Agreement among NCI Building Systems, Inc., Clayton, Dubilier & Rice Fund VIII, L.P. and CD&R Friends & Family Fund VIII, L.P., dated July 18, 2016 (filed as Exhibit 10.1 to NCI’s Current Report on Form 8-K, dated July 20, 2016 and incorporated by reference herein) | |
*†10.48 | Form of Award Agreement for Equity Awards, applicable to Restricted Stock Units, Performance Share Units, Stock Options and Performance Cash and Share Awards (December 2016) | |
*21.1 | List of Subsidiaries | |
*23.1 | Consent of Independent Registered Public Accounting Firm | |
*24.1 | Powers of Attorney | |
*31.1 | Rule 13a-14(a)/15d-14(a) Certifications (Section 302 of the Sarbanes-Oxley Act of 2002) | |
*31.2 | Rule 13a-14(a)/15d-14(a) Certifications (Section 302 of the Sarbanes-Oxley Act of 2002) | |
**32.1 | Certifications pursuant to Section 1350 of Chapter 63 of Title 18 of the United States Code (Section 906 of the Sarbanes-Oxley Act of 2002) | |
**32.2 | Certifications pursuant to Section 1350 of Chapter 63 of Title 18 of the United States Code (Section 906 of the Sarbanes-Oxley Act of 2002) | |
**101.INS | XBRL Instance Document | |
**101.SCH | XBRL Taxonomy Extension Schema Document | |
**101.CAL | XBRL Taxonomy Extension Calculation Linkbase Document | |
**101.DEF | XBRL Taxonomy Extension Definition Linkbase Document | |
**101.LAB | XBRL Taxonomy Extension Labels Linkbase Document | |
**101.PRE | XBRL Taxonomy Extension Presentation Linkbase Document | |
* | Filed herewith |
** | Furnished herewith |
† | Management contracts or compensatory plans or arrangements |
117