Attached files
| file | filename |
|---|---|
| EX-99.1 - EX-99.1 - ALLSCRIPTS HEALTHCARE SOLUTIONS, INC. | mdrx-ex991_322.htm |
| 8-K - FORM 8-K - ALLSCRIPTS HEALTHCARE SOLUTIONS, INC. | mdrx-8k_20170109.htm |

Allscripts Investor Presentation J.P. Morgan 2017 Healthcare Conference January 10, 2017 Exhibit 99.2
Disclaimer This presentation contains forward-looking statements within the meaning of the Private Securities Litigation Reform Act of 1995. These forward-looking statements are based on the current beliefs and expectations of Allscripts management, only speak as of the date that they are made, and are subject to significant risks and uncertainties. Such statements can be identified by the use of words such as “future,” “anticipates,” “believes,” “estimates,” “expects,” “intends,” “plans,” “predicts,” “will,” “would,” “could,” “can,” “may,” and similar terms. Actual results could differ from those set forth in the forward-looking statements, and reported results should not be considered an indication of future performance. Certain factors that could cause Allscripts actual results to differ materially from those described in the forward-looking statements include, but are not limited to: the response of customers and competitors to the Netsmart joint business entity; the expected financial contribution and results of the Netsmart joint business entity, including consolidation for financial reporting purposes; Allscripts failure to compete successfully; consolidation in Allscripts industry; current and future laws, regulations and industry initiatives; increased government involvement in Allscripts industry; the failure of markets in which Allscripts operates to develop as quickly as expected; Allscripts or its customers’ failure to see the benefits of government programs; changes in interoperability or other regulatory standards; the effects of the realignment of Allscripts sales, services and support organizations; market acceptance of Allscripts products and services; the unpredictability of the sales and implementation cycles for Allscripts products and services; Allscripts ability to manage future growth; Allscripts ability to introduce new products and services; Allscripts ability to establish and maintain strategic relationships; risks related to the acquisition of new companies or technologies; the performance of Allscripts products; Allscripts ability to protect its intellectual property rights; the outcome of legal proceedings involving Allscripts; Allscripts ability to hire, retain and motivate key personnel; performance by Allscripts content and service providers; liability for use of content; security breaches; price reductions; Allscripts ability to license and integrate third party technologies; Allscripts ability to maintain or expand its business with existing customers; risks related to international operations; changes in tax rates or laws; business disruptions; Allscripts ability to maintain proper and effective internal controls; and asset impairment charges. Additional information about these and other risks, uncertainties and factors affecting Allscripts business is contained in Allscripts filings with the Securities and Exchange Commission, including under the caption “Risk Factors” in the most recent Allscripts Annual Report on Form 10-K and subsequent Form 10-Qs. Allscripts does not undertake to update forward-looking statements to reflect changed assumptions, the impact of circumstances or events that may arise after the date of the forward-looking statements, or other changes in its business, financial condition or operating results over time.
Non-GAAP Financial Measures This presentation includes references to non-GAAP gross margin, selling, general and administrative expenses (SG&A), non-GAAP earning per share, Adjusted EBITDA and Adjusted EBITDA, net of non-controlling interest which are also considered non-GAAP financial measures under Section 101 of Regulation G under the Securities Exchange Act of 1934, as amended. Each of these measures adjusts for certain items and are not considered financial measures under generally accepted accounting principles in the United States (“GAAP”). Non-GAAP revenue consists of GAAP revenue and adds back deferred revenue from the Netsmart transaction that is eliminated for GAAP purposes due to purchase accounting adjustments. Non-GAAP gross margin consists of non-GAAP gross profit as a percentage of GAAP revenue in the applicable period, as defined above. Non-GAAP selling, general and administrative expenses, as reported, and excludes non-recurring expenses and transaction-related costs and stock-based compensation expense recorded to SG&A. Adjusted EBITDA is a non-GAAP measure and consists of GAAP net income (loss) as reported and adjusts for: acquisition-related deferred revenue adjustments; depreciation and amortization; stock-based compensation expense; non-recurring expenses and transaction-related costs; non-cash asset impairment charges; interest expense and other, net; equity in net earnings of unconsolidated investments; and tax provision (benefit). Adjusted EBITDA, net of non-controlling interest, is a non-GAAP measure and consists of Adjusted EBITDA as described above, with an adjustment to reduce Adjusted EBITDA for the percentage of non-controlling interest in consolidated subsidiaries. For this presentation, Netsmart preferred stock is treated as if it was converted to common stock. Non-GAAP net income attributable to Allscripts Healthcare Solutions, Inc. is a non-GAAP measure and consists of Non-GAAP net income as described above, with an adjustment to reduce Non-GAAP net income for the percentage of non-controlling interest outside Allscripts ownership position. For this presentation, Netsmart preferred stock is treated as if it was converted to common stock. Non-GAAP earnings per share consists of non-GAAP net income, as defined above, divided by weighted shares outstanding – diluted in the applicable period. Management also believes that non-GAAP measures provide useful supplemental information to management and investors regarding the underlying performance of Allscripts business operations. Acquisition accounting adjustments made in accordance with GAAP can make it difficult to make meaningful comparisons of the underlying operations of the business without considering the non-GAAP adjustments provided and discussed herein. Management also uses this information internally for forecasting and budgeting, as it believes that these measures are indicative of core operating results. In addition, management may use non-GAAP measures to measure achievement under Allscripts stock and cash incentive compensation plans. Note, however, that non-GAAP measures are performance measures only, and they do not provide any measure of cash flow or liquidity. Non-GAAP financial measures are not in accordance with, or an alternative for, measures of financial performance prepared in accordance with GAAP and may be different from non-GAAP measures used by other companies. Non-GAAP measures have limitations in that they do not reflect all of the amounts associated with Allscripts results of operations as determined in accordance with GAAP. Investors and potential investors are encouraged to review the reconciliation of non-GAAP financial measures with GAAP financial measures contained within the company's press releases dated November 3, 2016 and February 18, 2016. For the purpose of providing financial guidance, the company does not reconcile non-GAAP revenue, non-GAAP earnings, Adjusted net EBITDA or non-GAAP earnings per share guidance to the corresponding GAAP financial measures. Allscripts does not provide guidance for the various reconciling items since certain items that impact GAAP revenue and net income are either outside of its control and/or cannot be reasonably predicted. These are available on Allscripts investor relations website (http://www.investor.Allscripts.com).

WHO WE ARE A Global Leader in Healthcare Technology
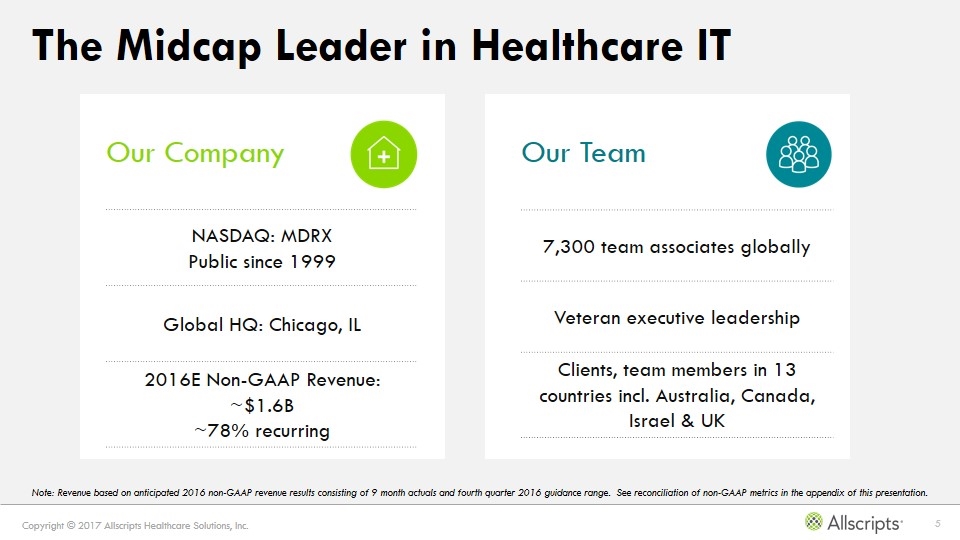
The Midcap Leader in Healthcare IT NASDAQ: MDRX Public since 1999 Global HQ: Chicago, IL 2016E Non-GAAP Revenue: ~$1.6B ~78% recurring Our Team 7,300 team associates globally Veteran executive leadership Clients, team members in 13 countries incl. Australia, Canada, Israel & UK Note: Revenue based on anticipated 2016 non-GAAP revenue results consisting of 9 month actuals and fourth quarter 2016 guidance range. See reconciliation of non-GAAP metrics in the appendix of this presentation. Our Company
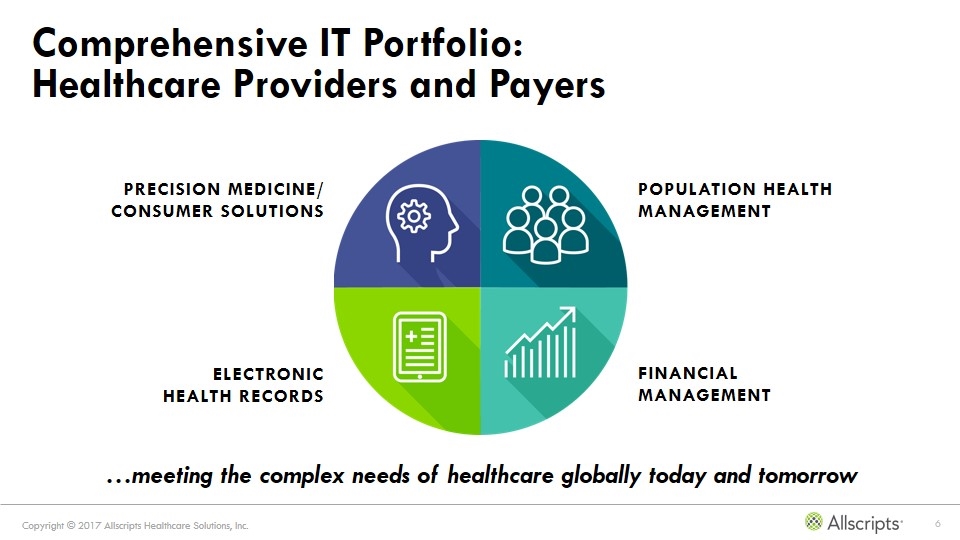
Comprehensive IT Portfolio: Healthcare Providers and Payers POPULATION HEALTH MANAGEMENT ELECTRONIC HEALTH RECORDS FINANCIAL MANAGEMENT PRECISION MEDICINE/ CONSUMER SOLUTIONS …meeting the complex needs of healthcare globally today and tomorrow
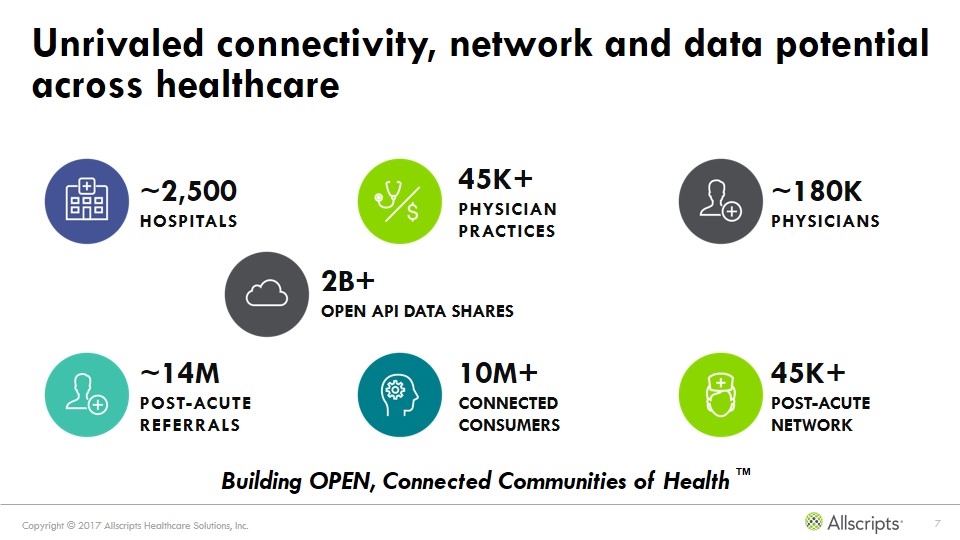
Unrivaled connectivity, network and data potential across healthcare 10M+ CONNECTED CONSUMERS ~14M POST-ACUTE REFERRALS 45K+ PHYSICIAN PRACTICES ~2,500 HOSPITALS ~180K PHYSICIANS Building OPEN, Connected Communities of Health ™ 45K+ POST-ACUTE NETWORK 2B+ OPEN API DATA SHARES
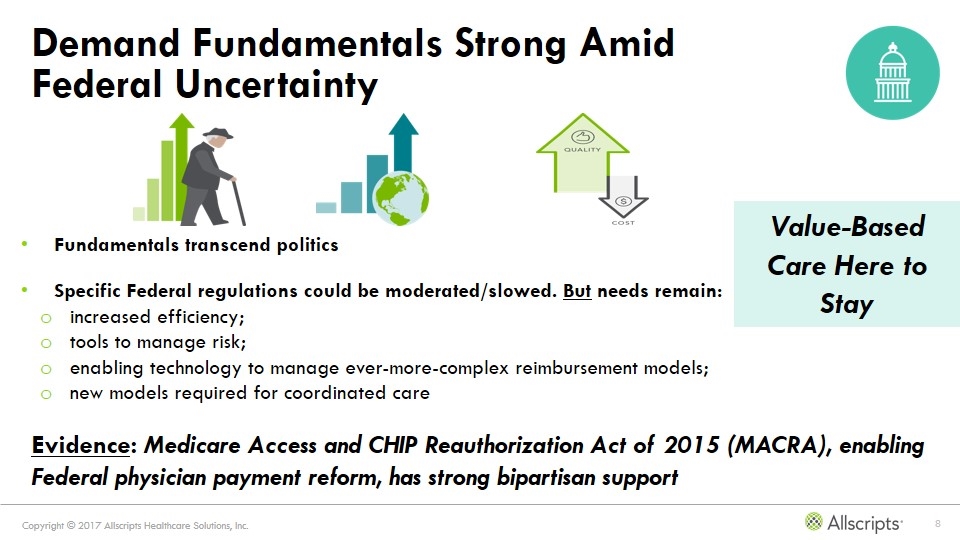
Demand Fundamentals Strong Amid Federal Uncertainty Fundamentals transcend politics Specific Federal regulations could be moderated/slowed. But needs remain: increased efficiency; tools to manage risk; enabling technology to manage ever-more-complex reimbursement models; new models required for coordinated care Value-Based Care Here to Stay Evidence: Medicare Access and CHIP Reauthorization Act of 2015 (MACRA), enabling Federal physician payment reform, has strong bipartisan support
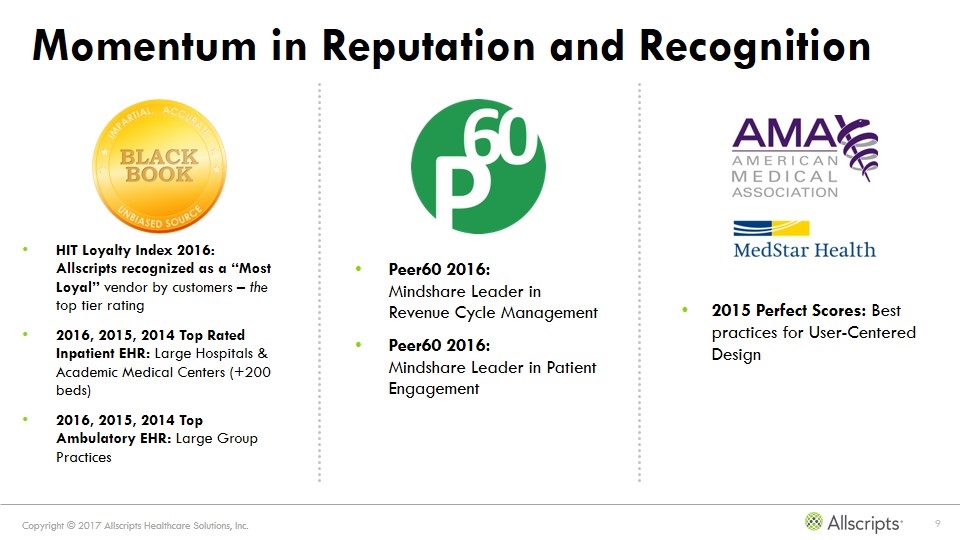
Momentum in Reputation and Recognition HIT Loyalty Index 2016: Allscripts recognized as a “Most Loyal” vendor by customers – the top tier rating 2016, 2015, 2014 Top Rated Inpatient EHR: Large Hospitals & Academic Medical Centers (+200 beds) 2016, 2015, 2014 Top Ambulatory EHR: Large Group Practices 2015 Perfect Scores: Best practices for User-Centered Design Peer60 2016: Mindshare Leader in Revenue Cycle Management Peer60 2016: Mindshare Leader in Patient Engagement
Strong finish to 2016 Expected Q4 consolidated bookings >$400M Record fourth quarter bookings Affirm fourth quarter guidance range for all measures Implies 2016 double digit growth – Bookings; Non-GAAP revenue; Adjusted Net EBITDA; Non-GAAP EPS See reconciliation of non-GAAP metrics in the appendix of this presentation. Guidance range as provided in Allscripts press release dated November 3, 2016 Period-over-period comparability is affected by the inclusion of Netsmart in consolidated results beginning April 19, 2016.

POSITION AND STRATEGY Growth Opportunity
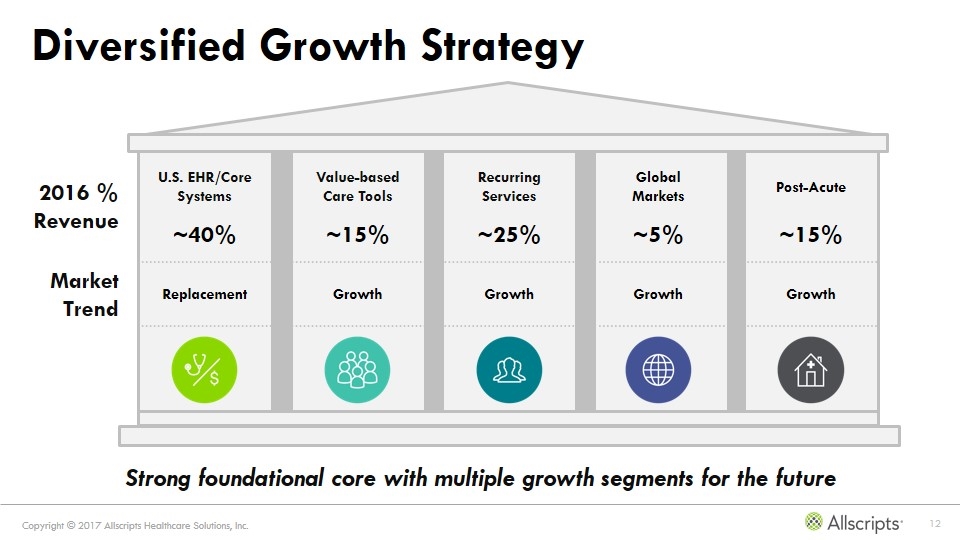
Diversified Growth Strategy Strong foundational core with multiple growth segments for the future U.S. EHR/Core Systems Value-based Care Tools Recurring Services Global Markets Post-Acute ~15% ~15% ~25% ~40% ~5% Replacement Growth Growth Growth Growth Market Trend 2016 % Revenue
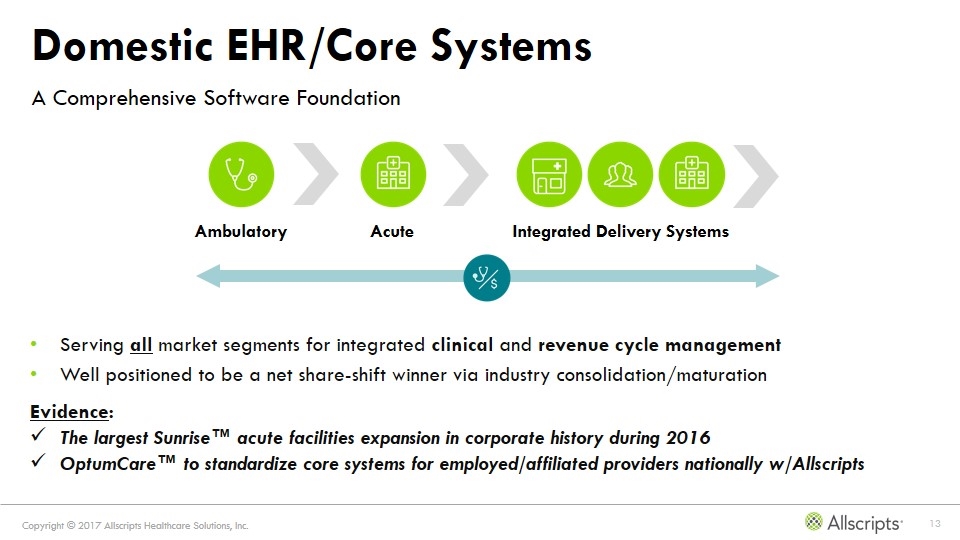
Domestic EHR/Core Systems A Comprehensive Software Foundation Serving all market segments for integrated clinical and revenue cycle management Well positioned to be a net share-shift winner via industry consolidation/maturation Evidence: The largest Sunrise™ acute facilities expansion in corporate history during 2016 OptumCare™ to standardize core systems for employed/affiliated providers nationally w/Allscripts Acute Ambulatory Integrated Delivery Systems
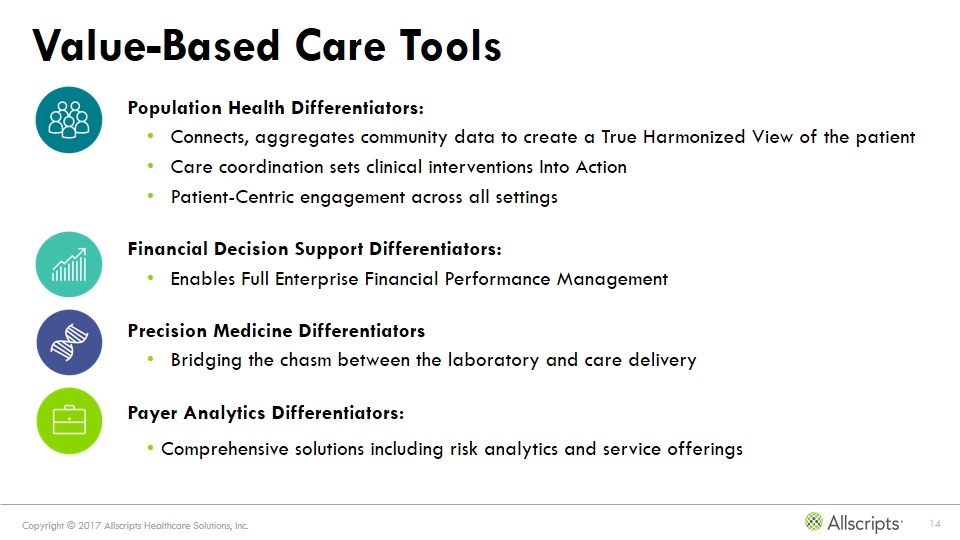
Value-Based Care Tools Population Health Differentiators: Connects, aggregates community data to create a True Harmonized View of the patient Care coordination sets clinical interventions Into Action Patient-Centric engagement across all settings Financial Decision Support Differentiators: Enables Full Enterprise Financial Performance Management Precision Medicine Differentiators Bridging the chasm between the laboratory and care delivery Payer Analytics Differentiators: Comprehensive solutions including risk analytics and service offerings
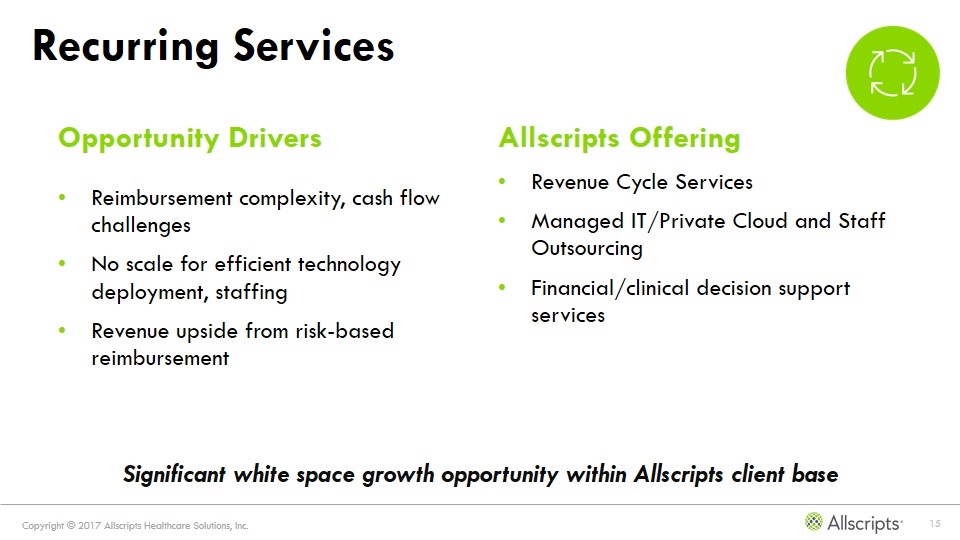
Recurring Services Opportunity Drivers Reimbursement complexity, cash flow challenges No scale for efficient technology deployment, staffing Revenue upside from risk-based reimbursement Allscripts Offering Revenue Cycle Services Managed IT/Private Cloud and Staff Outsourcing Financial/clinical decision support services Significant white space growth opportunity within Allscripts client base
Global Markets Key Advantages Outstanding reputation and presence in English speaking countries Leverage single Sunrise™ platform to international growth markets Complete solution: clinical/financial + value-based care U.K., Australia, others lag the U.S. in healthcare digital automation Allscripts 2016 Success Sales Several new government contracts/U.K. Trusts Dudley Group NHS Trust, U.K. Government of Bahamas Implementations Highly successful go-live at King's College Hospital NHS Foundation Trust, London Government of South Australia Market Expansion Largest EHR provider in Singapore Geographic expansion acquisition in Australia
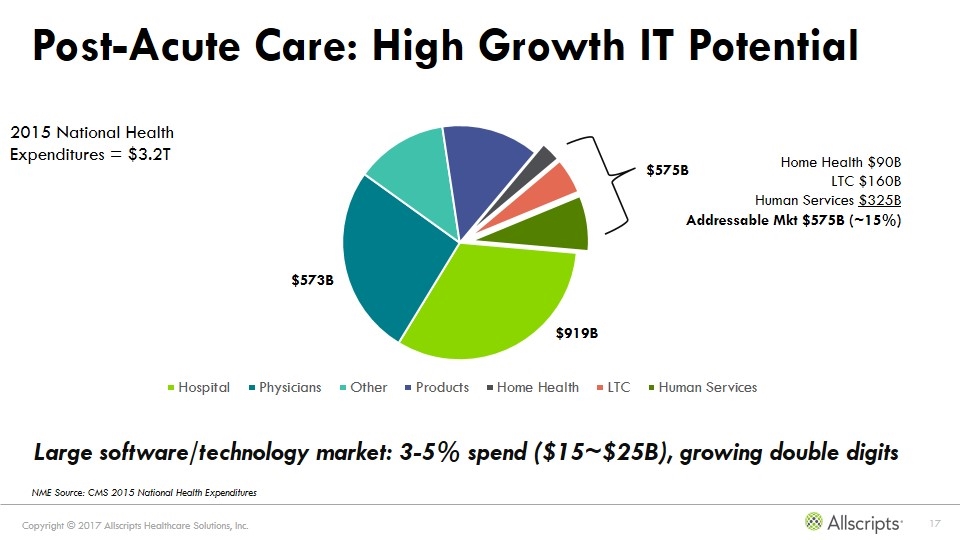
Post-Acute Care: High Growth IT Potential Large software/technology market: 3-5% spend ($15~$25B), growing double digits NME Source: CMS 2015 National Health Expenditures
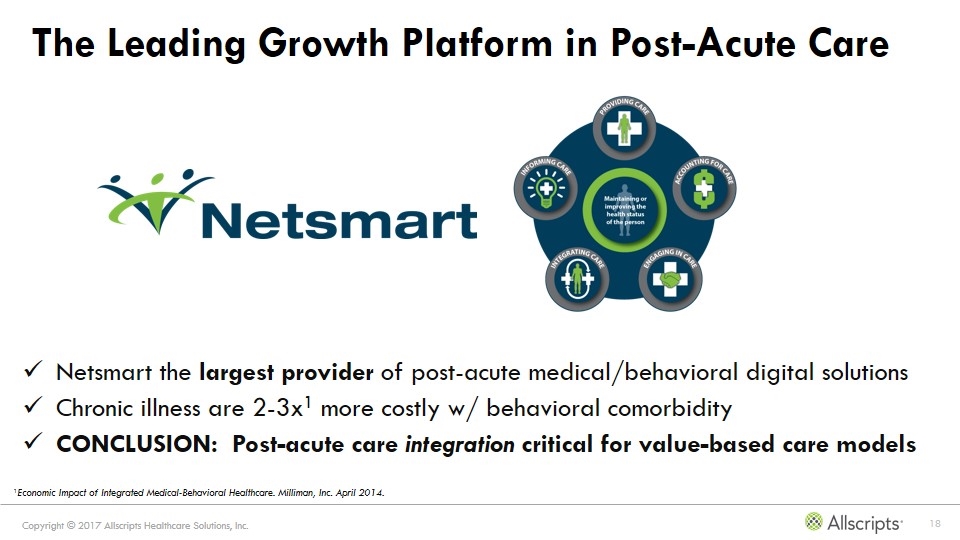
The Leading Growth Platform in Post-Acute Care Netsmart the largest provider of post-acute medical/behavioral digital solutions Chronic illness are 2-3x1 more costly w/ behavioral comorbidity CONCLUSION: Post-acute care integration critical for value-based care models 1Economic Impact of Integrated Medical-Behavioral Healthcare. Milliman, Inc. April 2014.

Financial Model
Consistent Execution Since 2013 Operating Playbook Results Maximize client relation Recurring revenue = 78% Generate consistent results Bookings 17+% 2016E Increase operational efficiency Margin expansion; expense leverage while increasing R&D to 17% of revenue New growth sources Multiple growth pillars Note: Bookings based on anticipated actual provided January 9, 2017 Actuals subject to change,. See reconciliation of non-GAAP metrics in the appendix of this presentation See reconciliation of non-GAAP metrics in the appendix of this presentation or Allscripts Investor Relations Website.
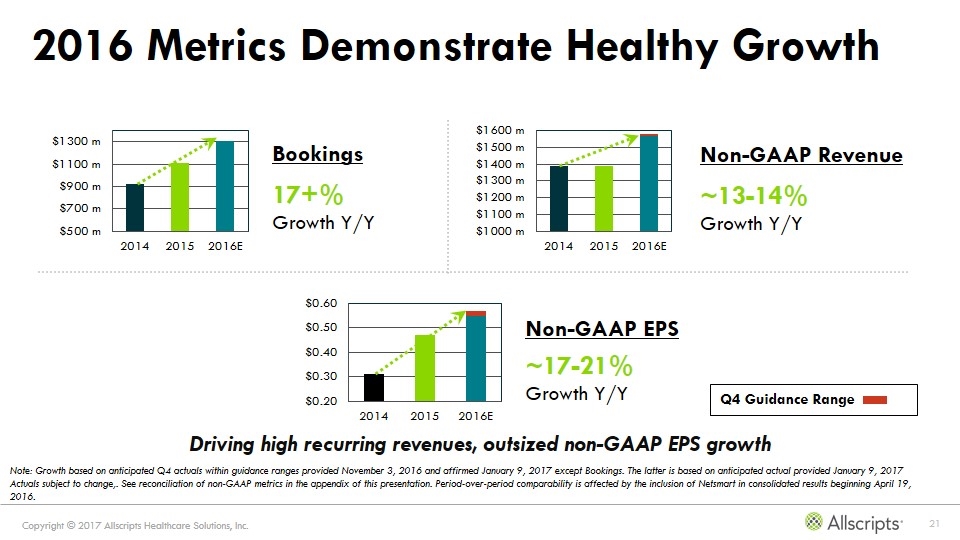
2016 Metrics Demonstrate Healthy Growth Bookings 17+% Growth Y/Y Non-GAAP Revenue ~13-14% Growth Y/Y Non-GAAP EPS ~17-21% Growth Y/Y Driving high recurring revenues, outsized non-GAAP EPS growth Note: Growth based on anticipated Q4 actuals within guidance ranges provided November 3, 2016 and affirmed January 9, 2017 except Bookings. The latter is based on anticipated actual provided January 9, 2017 Actuals subject to change,. See reconciliation of non-GAAP metrics in the appendix of this presentation. Period-over-period comparability is affected by the inclusion of Netsmart in consolidated results beginning April 19, 2016. Q4 Guidance Range
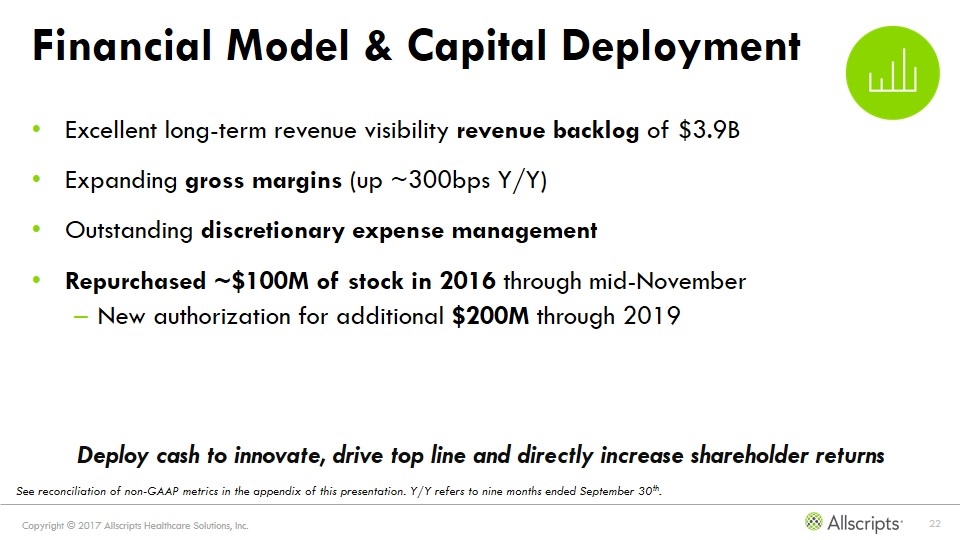
Financial Model & Capital Deployment Excellent long-term revenue visibility revenue backlog of $3.9B Expanding gross margins (up ~300bps Y/Y) Outstanding discretionary expense management Repurchased ~$100M of stock in 2016 through mid-November New authorization for additional $200M through 2019 Deploy cash to innovate, drive top line and directly increase shareholder returns See reconciliation of non-GAAP metrics in the appendix of this presentation. Y/Y refers to nine months ended September 30th.
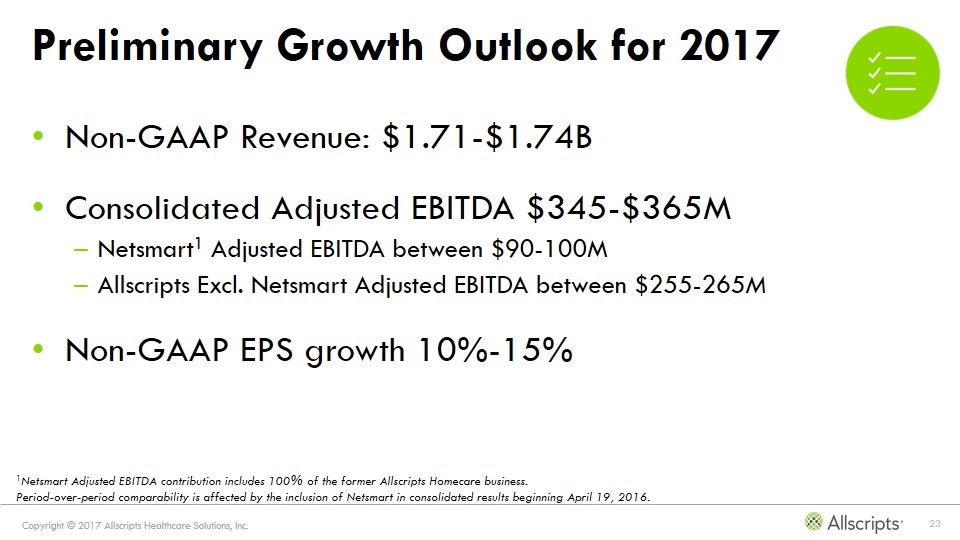
Preliminary Growth Outlook for 2017 Non-GAAP Revenue: $1.71-$1.74B Consolidated Adjusted EBITDA $345-$365M Netsmart1 Adjusted EBITDA between $90-100M Allscripts Excl. Netsmart Adjusted EBITDA between $255-265M Non-GAAP EPS growth 10%-15% 1Netsmart Adjusted EBITDA contribution includes 100% of the former Allscripts Homecare business. Period-over-period comparability is affected by the inclusion of Netsmart in consolidated results beginning April 19, 2016.
Attractive Long-Term Growth Investment Large, diverse client base and mix drives sustainable, recurring revenue and cash flow Beyond the EHR – high-value cross sale into expansive base Well positioned for multiple growth opportunities including value-based care and post-acute Strong momentum in global markets Seasoned executive team focused on cash and consistent performance
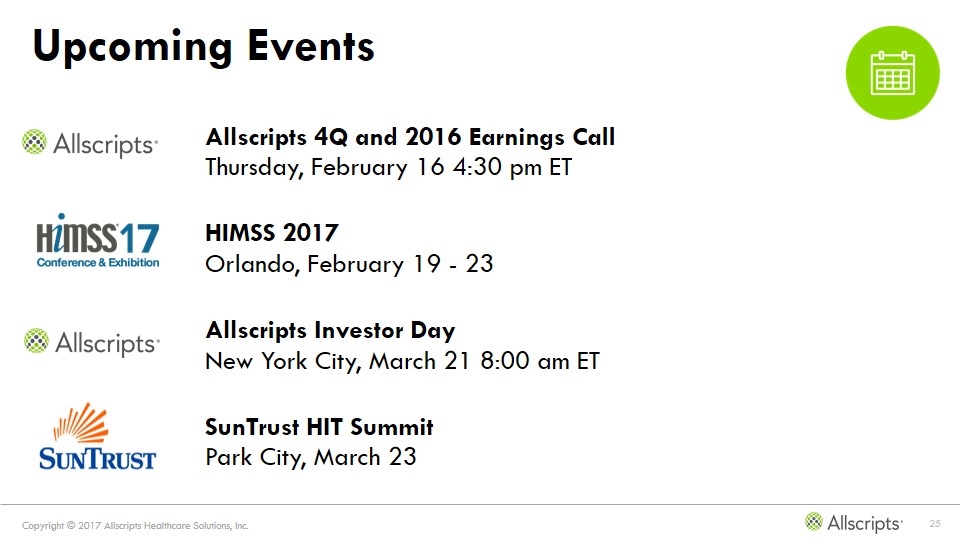
Upcoming Events Allscripts 4Q and 2016 Earnings Call Thursday, February 16 4:30 pm ET HIMSS 2017 Orlando, February 19 - 23 Allscripts Investor Day New York City, March 21 8:00 am ET SunTrust HIT Summit Park City, March 23

Allscripts Investor Presentation J.P. Morgan 2017 Healthcare Conference January 10 2017

APPENDIX – Non-GAAP Reconciliations
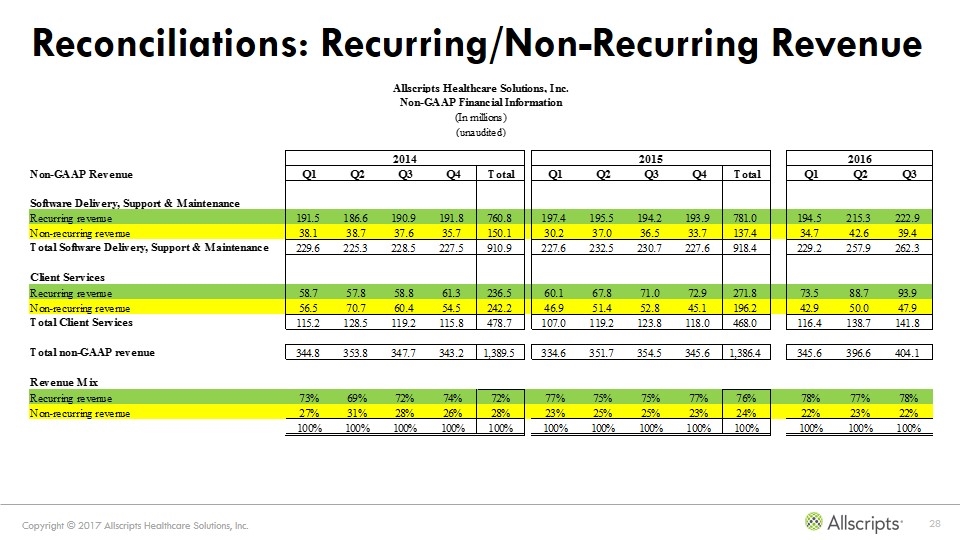
Reconciliations: Recurring/Non-Recurring Revenue
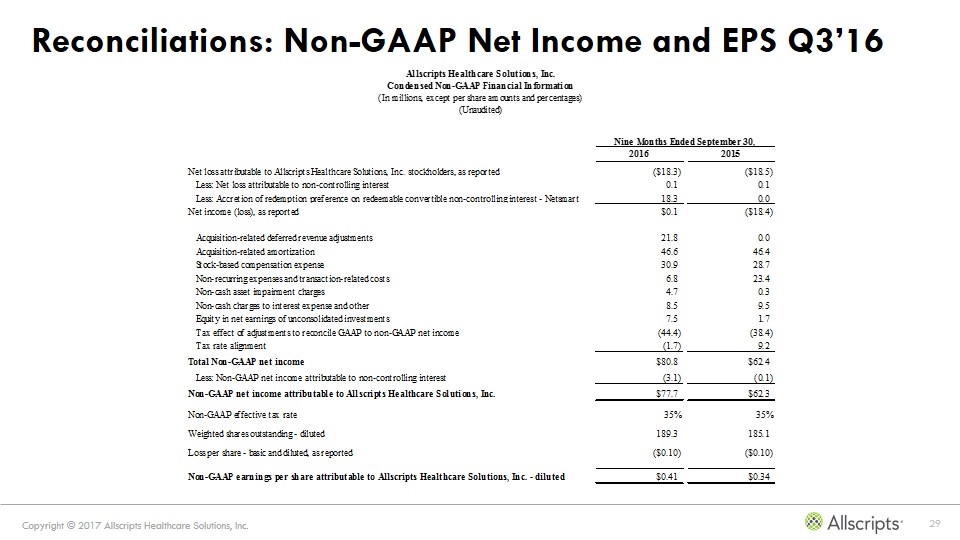
Reconciliations: Non-GAAP Net Income and EPS Q3’16
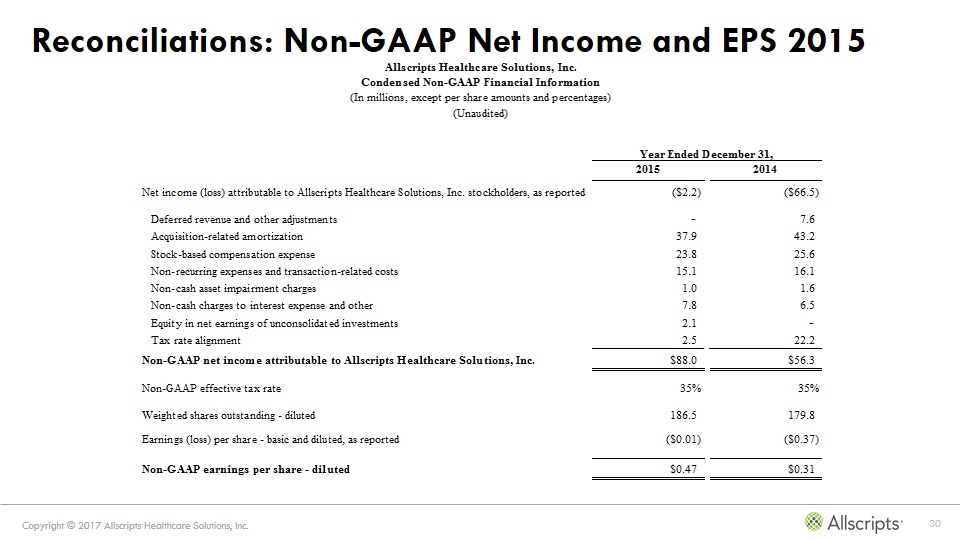
Reconciliations: Non-GAAP Net Income and EPS 2015

Allscripts Investor Presentation J.P. Morgan 2017 Healthcare Conference January 10 2017
