Attached files
| file | filename |
|---|---|
| EX-99.1 - EX-99.1 - Teladoc Health, Inc. | a17-1612_1ex99d1.htm |
| 8-K - 8-K - Teladoc Health, Inc. | a17-1612_18k.htm |
Exhibit 99.2
Jason Gorevic, CEO Mark Hirschhorn, COO and CFO 35th Annual J.P. Morgan Healthcare Conference January 9, 2017

Safe Harbor Statement This presentation contains, and our officers may make, “forward-looking” statements that are based on our management’s beliefs and assumptions and on information currently available to management. These forward-looking statements include, without limitation, information concerning possible or assumed future results of operations, including descriptions of our business plan and strategies. These statements often include words such as ‘‘anticipate,’’ ‘‘expect,’’ ‘‘suggest,’’ ‘‘plan,’’ ‘‘believe,’’ ‘‘intend,’’ ‘‘estimate,’’ ‘‘target,’’ ‘‘project,’’ ‘‘should,’’ ‘‘could,’’ ‘‘would,’’ ‘‘may,’’ ‘‘will,’’ ‘‘forecast,’’ and other similar expressions. Forward-looking statements involve known and unknown risks, uncertainties and other factors that may cause our actual results, performance or achievements to be materially different from any future results, performance or achievements expressed or implied by the forward-looking statements. These statements are based on certain assumptions that we have made in light of our experience in the industry and our perception of historical trends, current conditions, expected future developments and other factors we believe are appropriate under the circumstances as of the date hereof. These and other important factors may cause our actual results, performance or achievements to differ materially from those expressed or implied by these forward-looking statements. Such risks and other factors that may impact management’s beliefs and assumptions are more particularly described in our filings with the U.S. Securities and Exchange Commission (the “SEC”), including under “Item 1A.—Risk Factors” in our Annual Report on Form 10-K for the year ended December 31, 2015 and under similar headings in our subsequently filed Quarterly Reports on Form 10-Q, and could cause our results to differ materially from those expressed in forward-looking statements. As a result, we cannot guarantee future results, outcomes, levels of activity, performance, developments or achievements, and there can be no assurance that our expectations, intentions, anticipations, beliefs or projections will result or be achieved or accomplished. The forward-looking statements in this presentation are made only as of the date hereof. Except as required by law, we assume no obligation to update these forward-looking statements, or to update the reasons actual results could differ materially from those anticipated in the forward-looking statements, even if new information becomes available in the future. This presentation also contains estimates and other statistical data made by independent parties and by us relating to market size and growth and other data about our industry. This data involves a number of assumptions and limitations, and you are cautioned not to give undue weight to such estimates. As the Company has not completed its quarter and year-end annual close procedures and the audit of its 2016 financial statements is not complete, the revenue expectations presented in this press release are preliminary, and, therefore, subject to final year-end closing adjustments and may change. The preliminary financial results presented in this presentation are based solely upon information available as of the date of this presentation, are not a comprehensive statement of our financial results or positions as of or for the 2016 fiscal year, and have not been audited, reviewed, or compiled by our independent registered accounting firm. This presentation may include certain non-GAAP financial measures as defined by SEC rules. We believe that the presentation of such non-GAAP financial measures enhances an investor’s understanding of our financial performance. We use certain non-GAAP financial measures for business planning purposes and in measuring our performance relative to that of our competitors. For additional information regarding these non-GAAP measures, including reconciliations to the most directly comparable financial measure calculated according to GAAP, refer to the Appendix to this presentation and to our Annual Report on Form 10-K for the year ended December 31, 2015 and any subsequently filed Quarterly Reports on Form 10-Q. 2
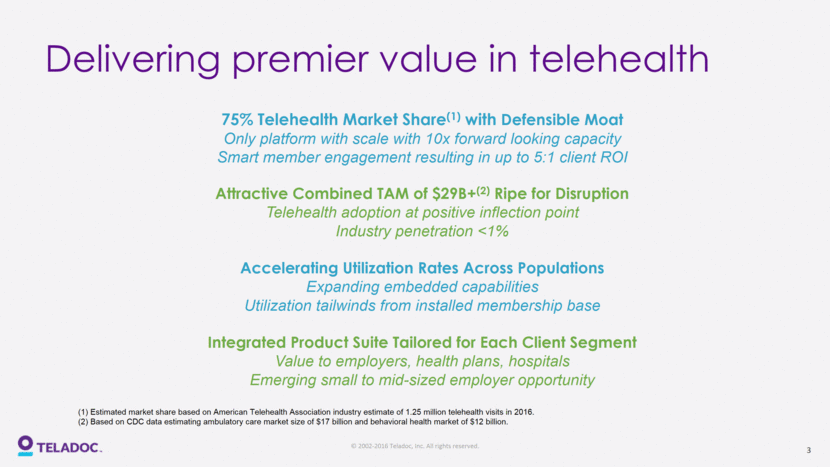
(1) Estimated market share based on American Telehealth Association industry estimate of 1.25 million telehealth visits in 2016. (2) Based on CDC data estimating ambulatory care market size of $17 billion and behavioral health market of $12 billion. 75% Telehealth Market Share(1) with Defensible Moat Only platform with scale with 10x forward looking capacity Smart member engagement resulting in up to 5:1 client ROI Attractive Combined TAM of $29B+(2) Ripe for Disruption Telehealth adoption at positive inflection point Industry penetration <1% Accelerating Utilization Rates Across Populations Expanding embedded capabilities Utilization tailwinds from installed membership base Integrated Product Suite Tailored for Each Client Segment Value to employers, health plans, hospitals Emerging small to mid-sized employer opportunity Delivering premier value in telehealth 3
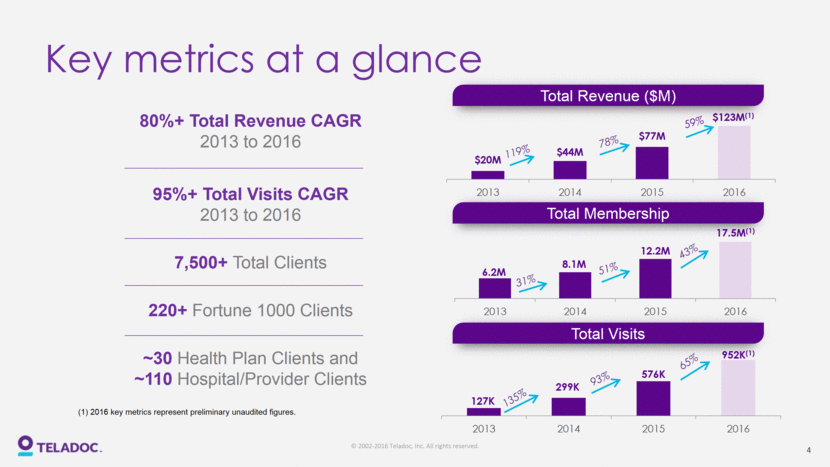
Total Visits 80%+ Total Revenue CAGR 2013 to 2016 95%+ Total Visits CAGR 2013 to 2016 7,500+ Total Clients 220+ Fortune 1000 Clients ~30 Health Plan Clients and ~110 Hospital/Provider Clients Total Revenue ($M) Total Membership Key metrics at a glance 119% 78% 59% 31% 51% 43% 135% 93% 65% 4 (1) 2016 key metrics represent preliminary unaudited figures. $20M $44M $77M $123M (1) 2013 2014 2015 2016 6.2M 8.1M 12.2M 17.5M (1) 2013 2014 2015 2016 127K 299K 576K 952K (1) 2013 2014 2015 2016
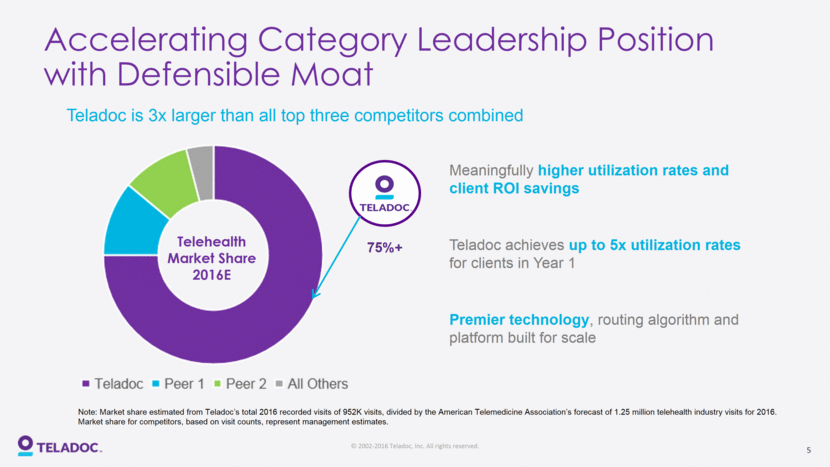
Accelerating Category Leadership Position with Defensible Moat Telehealth Market Share 2016E 75%+ Meaningfully higher utilization rates and client ROI savings Teladoc achieves up to 5x utilization rates for clients in Year 1 Premier technology, routing algorithm and platform built for scale Teladoc is 3x larger than all top three competitors combined 5 Note: Market share estimated from Teladoc’s total 2016 recorded visits of 952K visits, divided by the American Telemedicine Association’s forecast of 1.25 million telehealth industry visits for 2016. Market share for competitors, based on visit counts, represent management estimates.
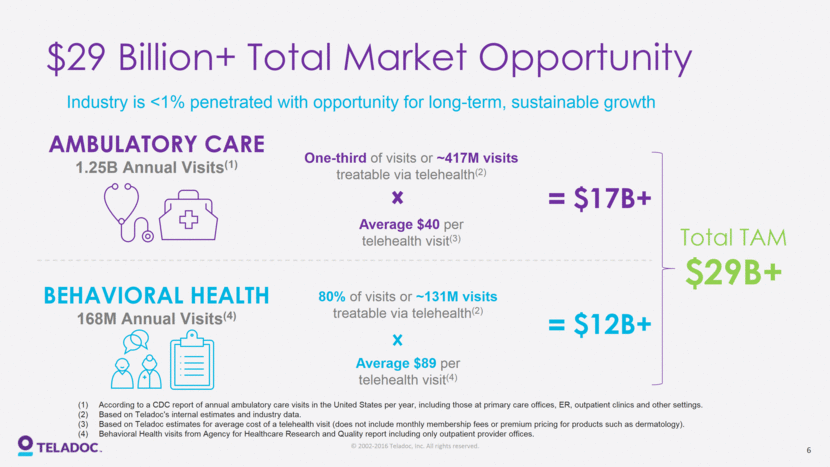
Industry is <1% penetrated with opportunity for long-term, sustainable growth AMBULATORY CARE 1.25B Annual Visits(1) $17B+ $12B+ Total TAM $29B+ One-third of visits or ~417M visits treatable via telehealth(2) Average $40 per telehealth visit(3) BEHAVIORAL HEALTH 168M Annual Visits(4) 80% of visits or ~131M visits treatable via telehealth(2) Average $89 per telehealth visit(4) $29 Billion+ Total Market Opportunity 6 According to a CDC report of annual ambulatory care visits in the United States per year, including those at primary care offices, ER, outpatient clinics and other settings. Based on Teladoc's internal estimates and industry data. Based on Teladoc estimates for average cost of a telehealth visit (does not include monthly membership fees or premium pricing for products such as dermatology). Behavioral Health visits from Agency for Healthcare Research and Quality report including only outpatient provider offices.
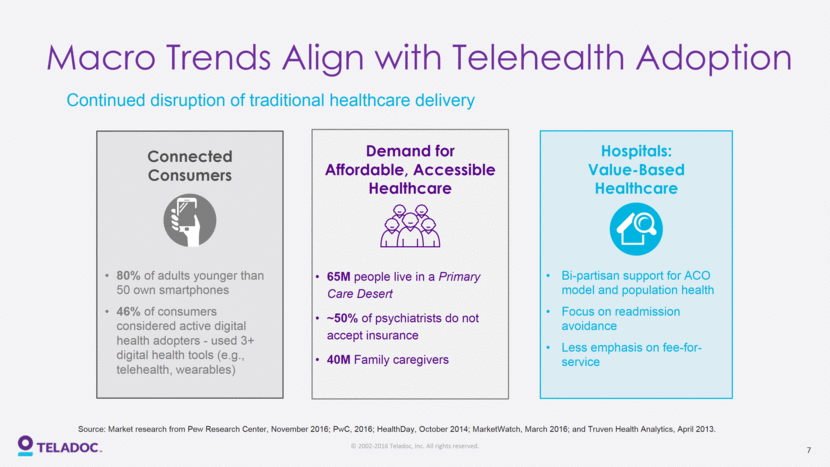
Macro Trends Align with Telehealth Adoption 80% of adults younger than 50 own smartphones 46% of consumers considered active digital health adopters - used 3+ digital health tools (e.g., telehealth, wearables) Bi-partisan support for ACO model and population health Focus on readmission avoidance Less emphasis on fee-for-service Connected Consumers Hospitals: Value-Based Healthcare 65M people live in a Primary Care Desert ~50% of psychiatrists do not accept insurance 40M Family caregivers Demand for Affordable, Accessible Healthcare Continued disruption of traditional healthcare delivery 7 Source: Market research from Pew Research Center, November 2016; PwC, 2016; HealthDay, October 2014; MarketWatch, March 2016; and Truven Health Analytics, April 2013.
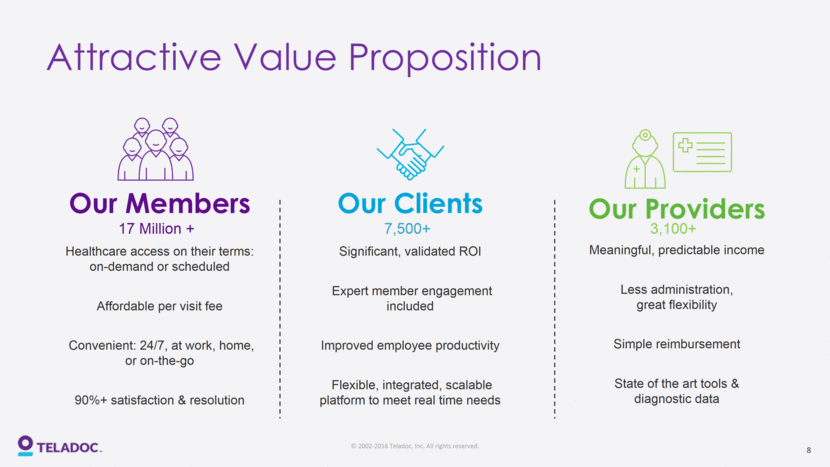
Our Members Healthcare access on their terms: on-demand or scheduled Affordable per visit fee Convenient: 24/7, at work, home, or on-the-go 90%+ satisfaction & resolution Our Clients Significant, validated ROI Expert member engagement included Improved employee productivity Flexible, integrated, scalable platform to meet real time needs Our Providers Meaningful, predictable income Less administration, great flexibility Simple reimbursement State of the art tools & diagnostic data 17 Million + 7,500+ 3,100+ Attractive Value Proposition 8
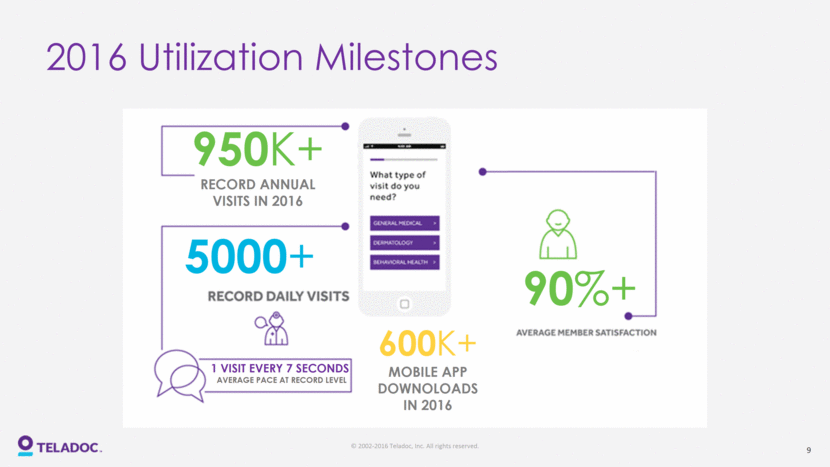
2016 Utilization Milestones 950K+ RECORD ANNUAL VISITS IN 2016 600K+ MOBILE APP DOWNOLOADS IN 2016 9 5000+ 1 VISIT EVERY 7 SECONDS AVERAGE PACE AT RECORD LEVEL 90%+
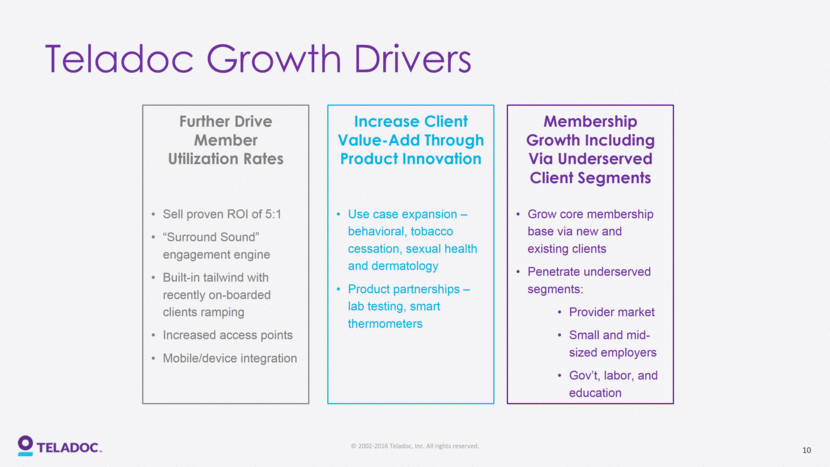
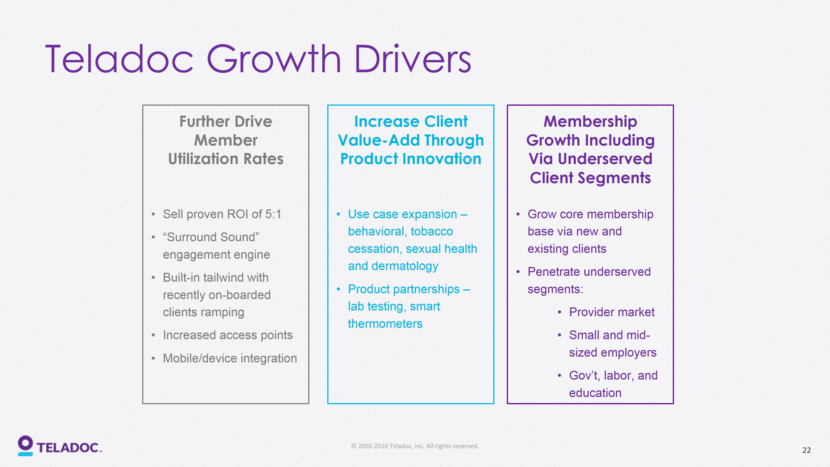
Teladoc Growth Drivers Increase Client Value-Add Through Product Innovation Grow core membership base via new and existing clients Penetrate underserved segments: Provider market Small and mid-sized employers Gov’t, labor, and education Membership Growth Including Via Underserved Client Segments Further Drive Member Utilization Rates Sell proven ROI of 5:1 “Surround Sound” engagement engine Built-in tailwind with recently on-boarded clients ramping Increased access points Mobile/device integration Use case expansion – behavioral, tobacco cessation, sexual health and dermatology Product partnerships – lab testing, smart thermometers 10
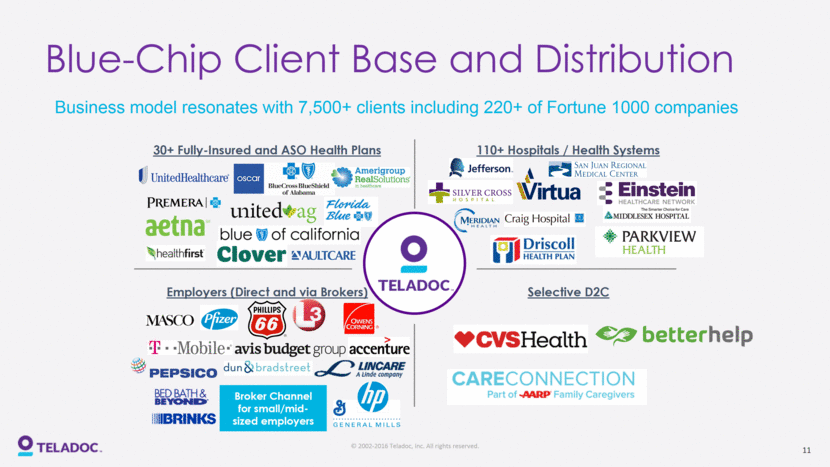
Blue-Chip Client Base and Distribution 30+ Fully-Insured and ASO Health Plans Employers (Direct and via Brokers) 110+ Hospitals / Health Systems Selective D2C Business model resonates with 7,500+ clients including 220+ of Fortune 1000 companies Broker Channel for small/mid-sized employers 11
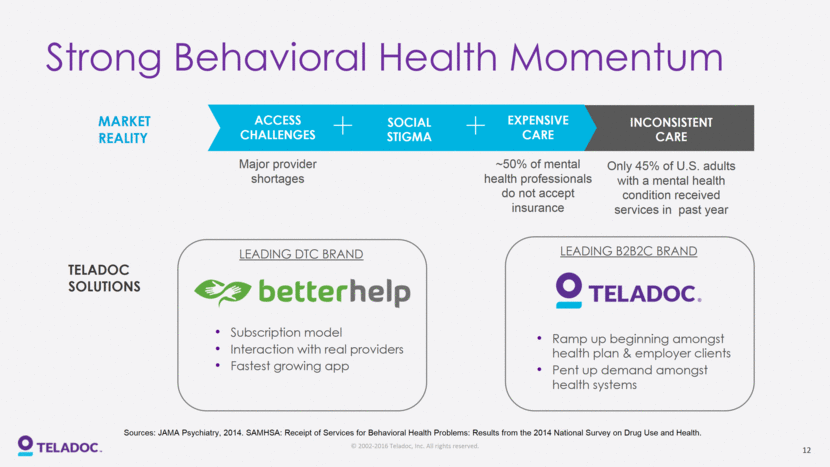
Strong Behavioral Health Momentum SOCIAL STIGMA INCONSISTENT CARE Only 45% of U.S. adults with a mental health condition received services in past year MARKET REALITY TELADOC SOLUTIONS LEADING DTC BRAND LEADING B2B2C BRAND Subscription model Interaction with real providers Fastest growing app Ramp up beginning amongst health plan & employer clients Pent up demand amongst health systems ACCESS CHALLENGES Major provider shortages EXPENSIVE CARE ~50% of mental health professionals do not accept insurance 12 Sources: JAMA Psychiatry, 2014. SAMHSA: Receipt of Services for Behavioral Health Problems: Results from the 2014 National Survey on Drug Use and Health.
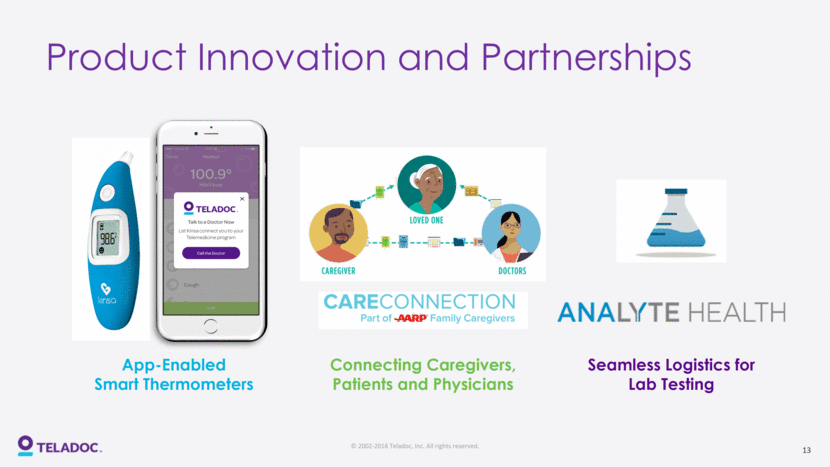
Product Innovation and Partnerships App-Enabled Smart Thermometers Connecting Caregivers, Patients and Physicians Seamless Logistics for Lab Testing 13
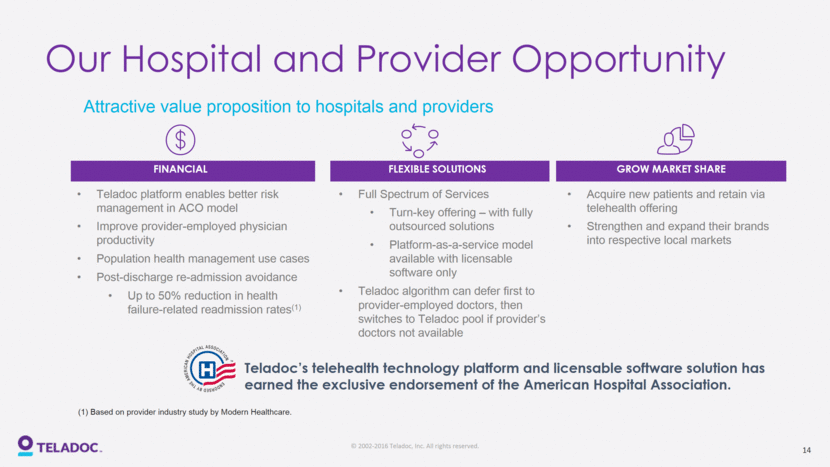
FINANCIAL FLEXIBLE SOLUTIONS GROW MARKET SHARE Teladoc platform enables better risk management in ACO model Improve provider-employed physician productivity Population health management use cases Post-discharge re-admission avoidance Up to 50% reduction in health failure-related readmission rates(1) Acquire new patients and retain via telehealth offering Strengthen and expand their brands into respective local markets Full Spectrum of Services Turn-key offering – with fully outsourced solutions Platform-as-a-service model available with licensable software only Teladoc algorithm can defer first to provider-employed doctors, then switches to Teladoc pool if provider’s doctors not available Teladoc’s telehealth technology platform and licensable software solution has earned the exclusive endorsement of the American Hospital Association. Our Hospital and Provider Opportunity Attractive value proposition to hospitals and providers 14 (1) Based on provider industry study by Modern Healthcare.
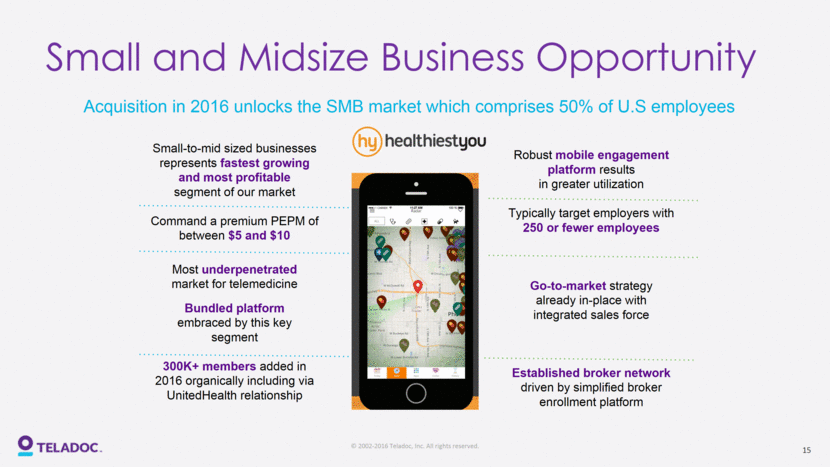
Small and Midsize Business Opportunity Small-to-mid sized businesses represents fastest growing and most profitable segment of our market Command a premium PEPM of between $5 and $10 Most underpenetrated market for telemedicine Bundled platform embraced by this key segment 300K+ members added in 2016 organically including via UnitedHealth relationship Robust mobile engagement platform results in greater utilization Typically target employers with 250 or fewer employees Go-to-market strategy already in-place with integrated sales force Established broker network driven by simplified broker enrollment platform Acquisition in 2016 unlocks the SMB market which comprises 50% of U.S employees 15
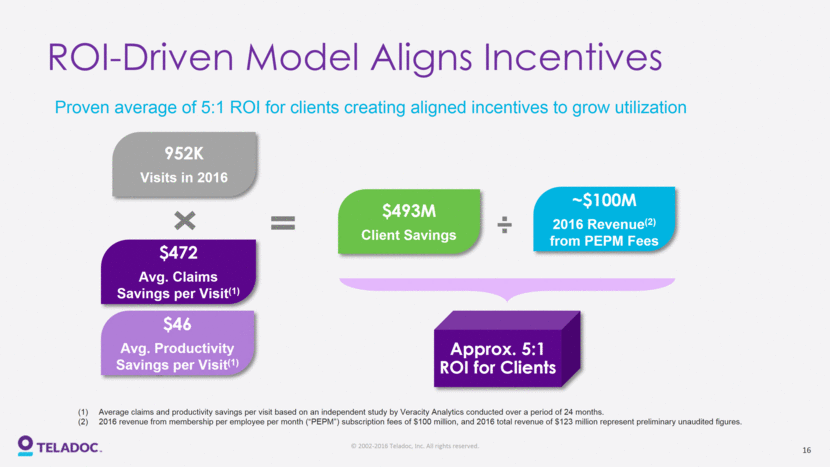
952K Visits in 2016 $472 Avg. Claims Savings per Visit(1) $493M Client Savings Approx. 5:1 ROI for Clients ~$100M 2016 Revenue(2) from PEPM Fees $46 Avg. Productivity Savings per Visit(1) ÷ ROI-Driven Model Aligns Incentives Proven average of 5:1 ROI for clients creating aligned incentives to grow utilization 16 Average claims and productivity savings per visit based on an independent study by Veracity Analytics conducted over a period of 24 months. 2016 revenue from membership per employee per month (“PEPM”) subscription fees of $100 million, and 2016 total revenue of $123 million represent preliminary unaudited figures.
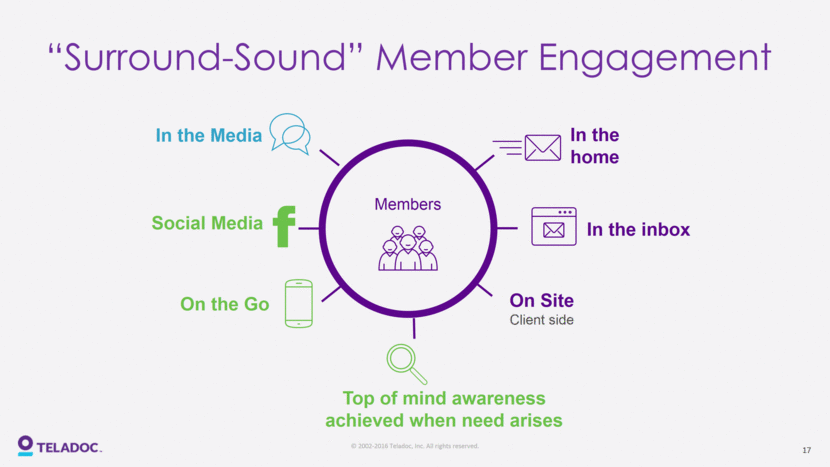
“Surround-Sound” Member Engagement Social Media Members In the Media On the Go In the home Top of mind awareness achieved when need arises In the inbox On Site Client side 17
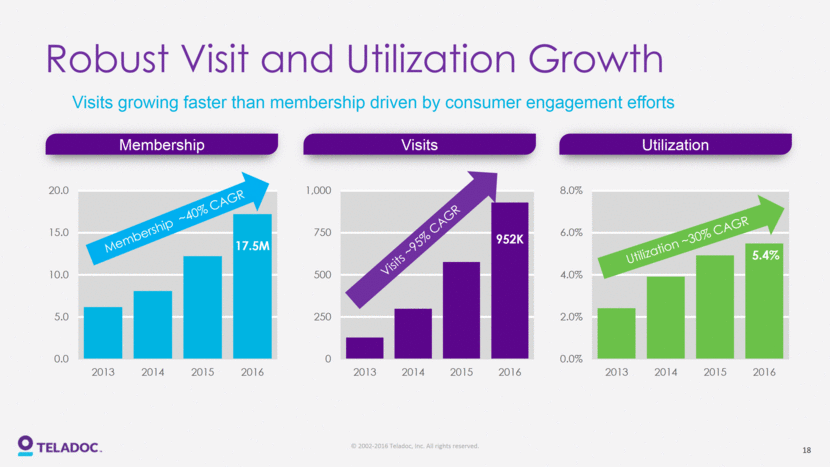
Robust Visit and Utilization Growth Membership ~40% CAGR Utilization ~30% CAGR Visits ~95% CAGR 5.4% 17.5M 952K Membership Utilization Visits Visits growing faster than membership driven by consumer engagement efforts 18 0 250 500 750 1,000 2013 2014 2015 2016 0.0 5.0 10.0 15.0 20.0 2013 2014 2015 2016 0.0% 2.0% 4.0% 6.0% 8.0% 2013 2014 2015 2016
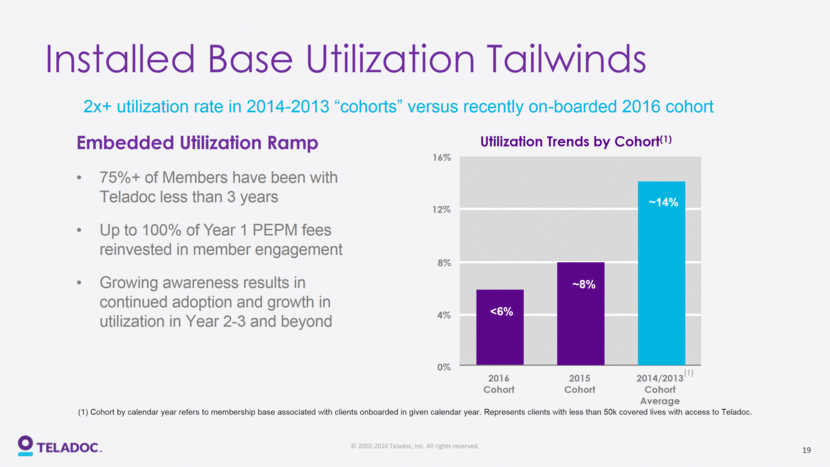
Embedded Utilization Ramp 75%+ of Members have been with Teladoc less than 3 years Up to 100% of Year 1 PEPM fees reinvested in member engagement Growing awareness results in continued adoption and growth in utilization in Year 2-3 and beyond Installed Base Utilization Tailwinds 2x+ utilization rate in 2014-2013 “cohorts” versus recently on-boarded 2016 cohort Utilization Trends by Cohort(1) 0% 4% 8% 12% 16% (1) 2016 Cohort 2015 Cohort 2014/2013 Cohort Average <6% ~8% ~14% 19 (1) Cohort by calendar year refers to membership base associated with clients onboarded in given calendar year. Represents clients with less than 50k covered lives with access to Teladoc.
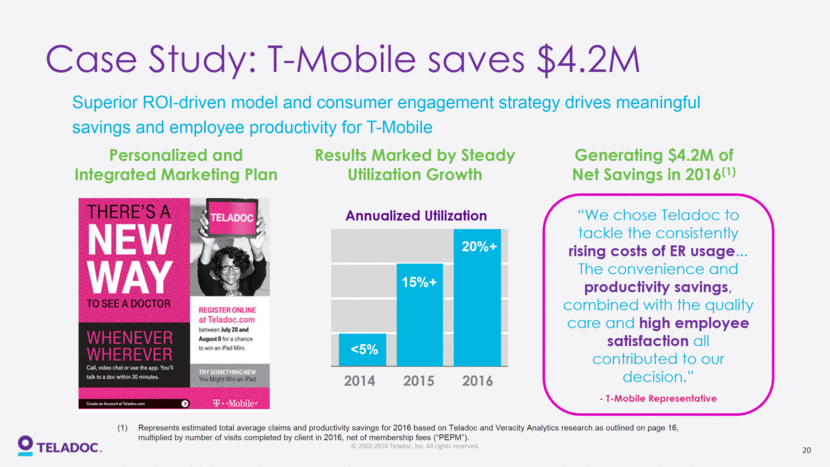
Case Study: T-Mobile saves $4.2M “We chose Teladoc to tackle the consistently rising costs of ER usage... The convenience and productivity savings, combined with the quality care and high employee satisfaction all contributed to our decision.” - T-Mobile Representative Superior ROI-driven model and consumer engagement strategy drives meaningful savings and employee productivity for T-Mobile Annualized Utilization 2014 2015 2016 <5% 15%+ 20%+ Personalized and Integrated Marketing Plan Results Marked by Steady Utilization Growth Generating $4.2M of Net Savings in 2016(1) 20 Represents estimated total average claims and productivity savings for 2016 based on Teladoc and Veracity Analytics research as outlined on page 16, multiplied by number of visits completed by client in 2016, net of membership fees (“PEPM”).
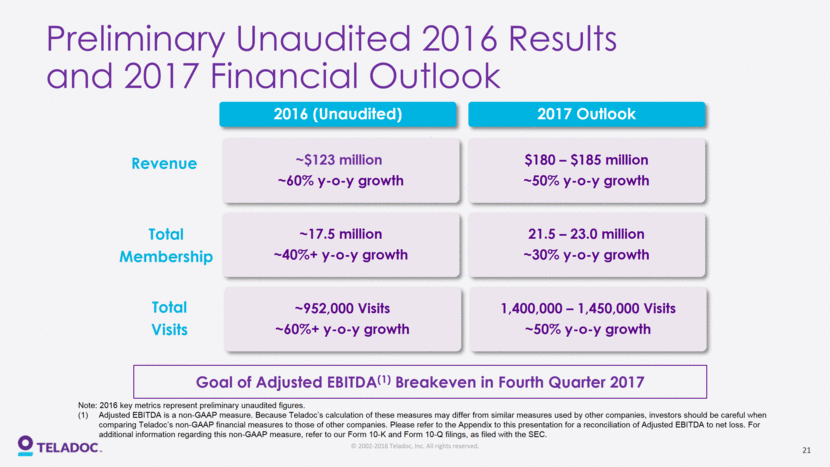
Preliminary Unaudited 2016 Results and 2017 Financial Outlook 2016 (Unaudited) 2017 Outlook ~$123 million ~60% y-o-y growth $180 – $185 million ~50% y-o-y growth ~17.5 million ~40%+ y-o-y growth 21.5 – 23.0 million ~30% y-o-y growth ~952,000 Visits ~60%+ y-o-y growth 1,400,000 – 1,450,000 Visits ~50% y-o-y growth Revenue Total Membership Total Visits Goal of Adjusted EBITDA(1) Breakeven in Fourth Quarter 2017 21 Note: 2016 key metrics represent preliminary unaudited figures. Adjusted EBITDA is a non-GAAP measure. Because Teladoc’s calculation of these measures may differ from similar measures used by other companies, investors should be careful when comparing Teladoc’s non-GAAP financial measures to those of other companies. Please refer to the Appendix to this presentation for a reconciliation of Adjusted EBITDA to net loss. For additional information regarding this non-GAAP measure, refer to our Form 10-K and Form 10-Q filings, as filed with the SEC.
22 Teladoc Growth Drivers Increase Client Value-Add Through Product Innovation Grow core membership base via new and existing clients Penetrate underserved segments: Provider market Small and mid-sized employers Gov’t, labor, and education Membership Growth Including Via Underserved Client Segments Further Drive Member Utilization Rates Sell proven ROI of 5:1 “Surround Sound” engagement engine Built-in tailwind with recently on-boarded clients ramping Increased access points Mobile/device integration Use case expansion – behavioral, tobacco cessation, sexual health and dermatology Product partnerships – lab testing, smart thermometers
Appendix www.teladoc.com
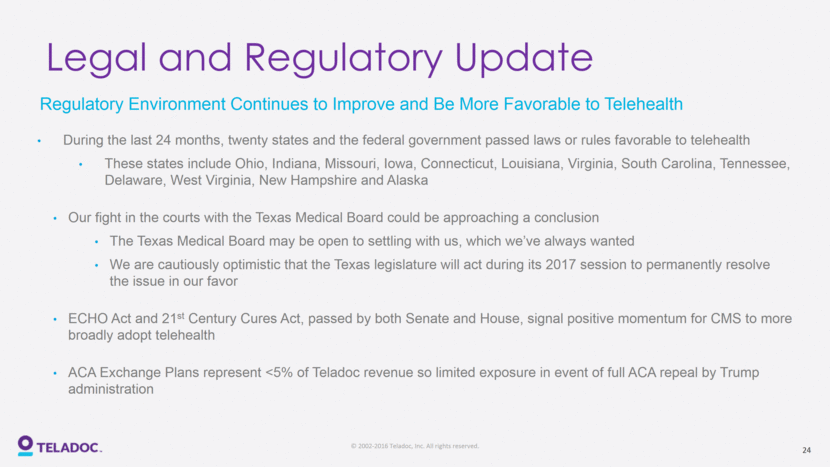
Legal and Regulatory Update During the last 24 months, twenty states and the federal government passed laws or rules favorable to telehealth These states include Ohio, Indiana, Missouri, Iowa, Connecticut, Louisiana, Virginia, South Carolina, Tennessee, Delaware, West Virginia, New Hampshire and Alaska Our fight in the courts with the Texas Medical Board could be approaching a conclusion The Texas Medical Board may be open to settling with us, which we’ve always wanted We are cautiously optimistic that the Texas legislature will act during its 2017 session to permanently resolve the issue in our favor ECHO Act and 21st Century Cures Act, passed by both Senate and House, signal positive momentum for CMS to more broadly adopt telehealth ACA Exchange Plans represent <5% of Teladoc revenue so limited exposure in event of full ACA repeal by Trump administration Regulatory Environment Continues to Improve and Be More Favorable to Telehealth 24
