Attached files
| file | filename |
|---|---|
| 8-K - 8-K - TIER REIT INC | form8-k01092017.htm |
1
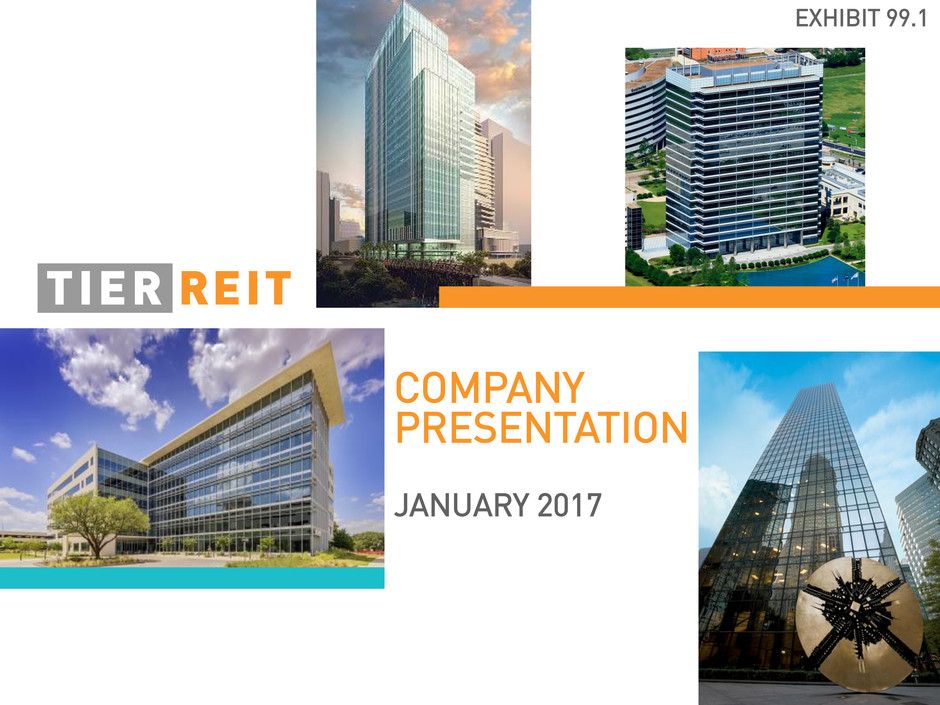
COMPANY
PRESENTATION
JANUARY 2017
EXHIBIT 99.1

2
Value Creation
• Proven track record in publicly-
traded real estate companies
• Successful history of investing &
creating value in target markets
• Ability to complete complex
transactions
• Clear path to long-term value
creation across portfolio
Seven Target Growth Markets
• High-quality, Class A office
properties
• High-growth, demand-driven
markets
• Amenity-rich, high-density
submarkets – TIER1 submarkets
• Emphasis on LIVE.WORK.PLAY
environments
Targeted Approach
TIER ONE Property Services
• Unparalleled customer service &
operational excellence
• Operating & developing to
highest sustainability standards
• A leader in BOMA 360
designations
• Significant LEED & Energy Star
certifications
Focus + Strategy
5950 Sherry Lane
Experience + Innovation
Domain 8 (Rendering)
Service + Sustainability
Burnett Plaza

3
WHY
TIER?
Focused investment strategy
High-quality portfolio
Significant value creation opportunities
Experienced management team
Proven execution capabilities
Austin I Dallas I Houston I Charlotte I Nashville I Atlanta I Denver 3

4
Domain 7, Austin, TX
PART ONE
FOCUSED STRATEGY
Delivered 2015

5
Transformation
2010 Today
Reduced portfolio from 36 to 13 markets
Reduced net debt / EBITDA from 10.7x to 7.3x1
Increased unencumbered NOI from 0% to 76%2
Experienced public company
management team executing on
long-term focused strategy
1 Leverage calculated as net debt divided by annualized normalized EBITDA from properties owned at period end for 1Q’10, and for 3Q’16, pro-forma for the completed disposition of 801 Thompson (Rockville, MD)
on 10.27.16 and the pending disposition of Fifth Third Center (Columbus) and the completed payoff of the Eldridge Place (Houston) loan on 10.11.16
2 Represents NOI from unencumbered assets divided by total NOI for the periods ended 1Q’10, and for 3Q’16, pro-forma for the completed disposition of 801 Thompson (Rockville, MD) on 10.27.16 and the pending
disposition of Fifth Third Center (Columbus) and the completed payoff of the Eldridge Place (Houston) loan on 10.11.16

6
Seven Target Growth Markets1
TIER REIT targets demand-driven, amenity-rich TIER1 submarkets that
will benefit most from population and office-using employment growth
Dallas
• 100+ companies relocated
employees to DFW from 2010-2014,
occupying 12.5mm SF
• 5-year population growth of 678K
• 5-year office-using jobs CAGR 3.8%
5.3%
4.7%
2.6% 2.9%
5.7%
3.6%
6.1%
Historical 5-Year Rent CAGR2
Austin
• #1 fastest growing city in the U.S.
• 5-year population growth of 280K
• 5-year office-using jobs CAGR
5.8%
Charlotte
• Population grew at 3x U.S.
average over past 10 years
• 5-year population growth
of 215K
• 5-year office-using jobs
CAGR 3.8%
Denver
• 5th largest in-migration as % of
population for 2009-2015
• 5-year population growth of 262K
• 5-year office-using jobs CAGR 3.5%
Nashville
• Over 37% more office workers than
at the height of the last cycle
• 5-year population growth of 158K
• 5-year office-using jobs CAGR 6.1%
Houston
• 89 companies relocated employees to
Houston from 2010-2014, occupying
12.6mm SF
• 5-year population growth of 732K
• 5-year office-using jobs CAGR 2.5%
Atlanta
• Forecasted 2nd among all MSAs in
population growth in next 5 years
• 5-year population growth of 445K
• 5-year office-using jobs CAGR 3.4%
1 Market statistics per CBRE Research, Moody’s Analytics, and CoStar Portfolio Strategy
2 CoStar Portfolio Strategy; historical Class A growth rates of gross asking rent by market and weighted by TIER1 submarkets
7
Strategic Plan
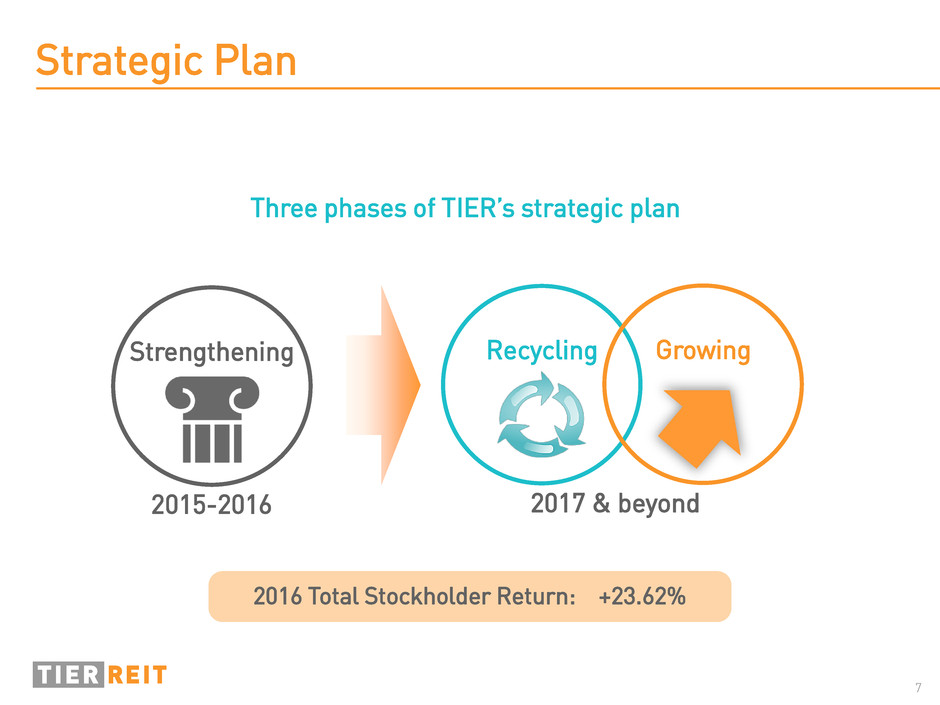
Three phases of TIER’s strategic plan
2015-2016
Strengthening Recycling Growing
2017 & beyond
2016 Total Stockholder Return: +23.62%

8
Results of Strengthening Phase
Over $1 billion of dispositions since December 2014
2015-2016
Strengthening
• TIER owns 60%, substantially all of which is
under agreement for sale at gross sales
price of $114mm
• Closing expected January 2017, subject
only to loan assumption approval and
customary closing conditions
1 TIER provides no assurance the transaction will close; gross sales price shown at TIER’s ownership share
Colorado Building Lawson Commons United Plaza 250 West Pratt
FOUR40 1650 Arch Street One Chestnut Place Fifth Third (Cleveland)
Hurstbourne Place
Hurstbourne Park
Wanamaker Building
Currently under contract: The Wanamaker Building1

9
Results of Strengthening Phase
Dispose of
nonstrategic
assets
Reduce
leverage
Strengthen
corporate
governance
Key Goals
Enhance
balance sheet
flexibility
Commentary
• Exited five markets since Dec.’14 at an average 6.1% GAAP cap rate1
• Under contract with $114mm of nonstrategic assets2
• Increased fixed charge coverage from 1.5x to 2.8x3
• Reduced net debt / EBITDA from 9.6x to 7.3x4
• Reduced mortgage debt from more than $1.5B to ~$256mm5
• Converted credit facility to unsecured
• Five independent board members, including non-executive Chairman
• Four new board members since 2014, all with public REIT experience
1 Operating properties sold during the time period, excluding land sales; capitalization rate based on annualized GAAP NOI for the last full quarter of ownership
2 TIER provides no assurance these transactions will close; gross sales price shown at TIER’s ownership share
3 Fixed charge coverage calculated as normalized fixed charges, divided by normalized EBITDA from properties owned at period end for 3Q’14, and 3Q’16, pro-forma for the completed disposition of 801 Thompson
(Rockville, MD) on 10.27.16 and the pending disposition of Fifth Third Center (Columbus) and the completed payoff of the Eldridge Place (Houston) loan on 10.11.16
4 Leverage calculated as net debt divided by annualized normalized EBITDA from properties owned at period end for 3Q’14, and for 3Q’16, pro-forma for the completed disposition of 801 Thompson (Rockville, MD) on
10.27.16 and the pending disposition of Fifth Third Center (Columbus) and the completed payoff of the Eldridge Place (Houston) loan on 10.11.16
5 Mortgage debt outstanding at period end for 3Q’14, and for 3Q’16, pro-forma for the completed disposition of 801 Thompson (Rockville, MD) on 10.27.16 and the pending disposition of Fifth Third Center (Columbus)
and the completed payoff of the Eldridge Place (Houston) loan on 10.11.16
2015-2016
Strengthening
10
Capital Recycling Opportunities
Target Growth
Markets
LIVE.WORK.PLAY
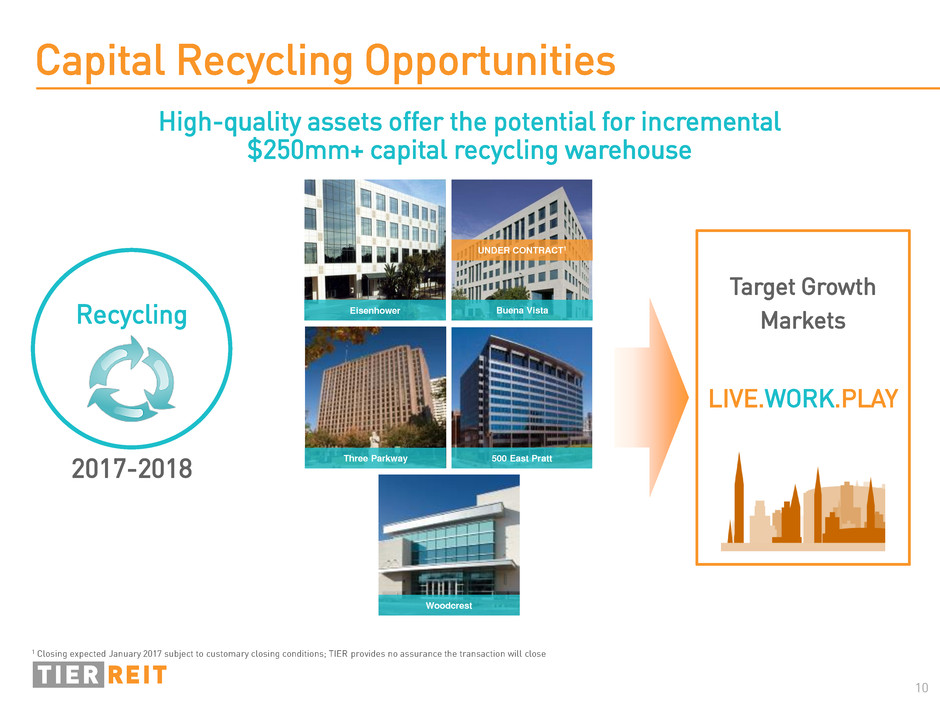
High-quality assets offer the potential for incremental
$250mm+ capital recycling warehouse
2017-2018
Recycling
500 East Pratt
Woodcrest
Three Parkway
Buena Vista Eisenhower
UNDER CONTRACT1
1 Closing expected January 2017 subject to customary closing conditions; TIER provides no assurance the transaction will close

11
BriarLake Plaza, Houston, TX
PART TWO
CREATING VALUE
Phase II delivered 2014

12
Experienced Management Team
Significant real estate & public company experience
spanning 30+ years
Bill Reister
Chief Investment
Officer
Dallas Lucas
Chief Financial
Officer
Anubhav Raj
Senior Vice President
Capital Markets
Heath Johnson
Managing Director
Asset Management
Scott Fordham
Chief Executive
Officer

13
Value Creation Results
Terrace Office Park - Austin, TX
• Rebuilt occupancy from 65% to
90%+ within 24 months after
tenant relocation
Loop Central - Houston, TX
• Restored occupancy from 74% to
90%+ within 12 months after
tenant M&A
Burnett Plaza - Ft. Worth, TX
• Re-leased 116K SF prior to
tenant’s known vacancy
Two BriarLake Plaza -Houston, TX
• Class A office tower delivered in
4Q’14
• Located in prestigious Westchase
• Commands highest rents in
submarket
Domain 8 – Austin, TX
• 94%+ pre-leased
• Expected delivery 1Q’17
• Estimated 9%+ development yield
Seasoned team with experience,
market knowledge, and relationships
Proven ability to develop premier
office space in TIER1 submarkets
Successful track record
of acquisitions
5950 Sherry Lane – Dallas, TX
• Acquired in unique, off-market
swap transaction in 4Q’14
The Domain – Austin, TX
• Complex acquisition in 3Q’15
aided by existing relationships
• Included below-market rent &
development opportunities
• Premier LIVE.WORK.PLAY
community
Asset Management Acquisitions Development
Terrace Office Park Domain 8 Domain 2

14
Mark-to-Market Rents
Future Value Creation: Leasing
Stabilize Occupancy at 93%
Terrace Office Park
5950 Sherry Lane
In-place rents 10-25% below market for
tenants expiring through 2019 (~720K SF)
Opportunity to lease up to 175K SF of
vacant space
Potential
incremental
value creation:
$110 to $135
million1,2
1 Mark-to-market potential incremental value calculated using incremental estimated NOI from re-leasing SF expiring through 2019 at Bank of America Plaza, Terrace Office Park, and Domain 4 at current market
rates (less estimated $2/SF for Bank of America rate attributed to redevelopment) and a 6-7% NOI capitalization rate less $40/SF estimated leasing capital
2 Stabilized occupancy potential incremental value calculated using estimated NOI generated from increasing occupancy of Two BriarLake Plaza, 5950 Sherry Lane, and Burnett Plaza at 90% NOI margins of current
market rates and a 6-7% NOI capitalization rate less $40/SF estimated leasing capital
Bank of America Plaza BriarLake Plaza
15
Future Value Creation: Redevelopment
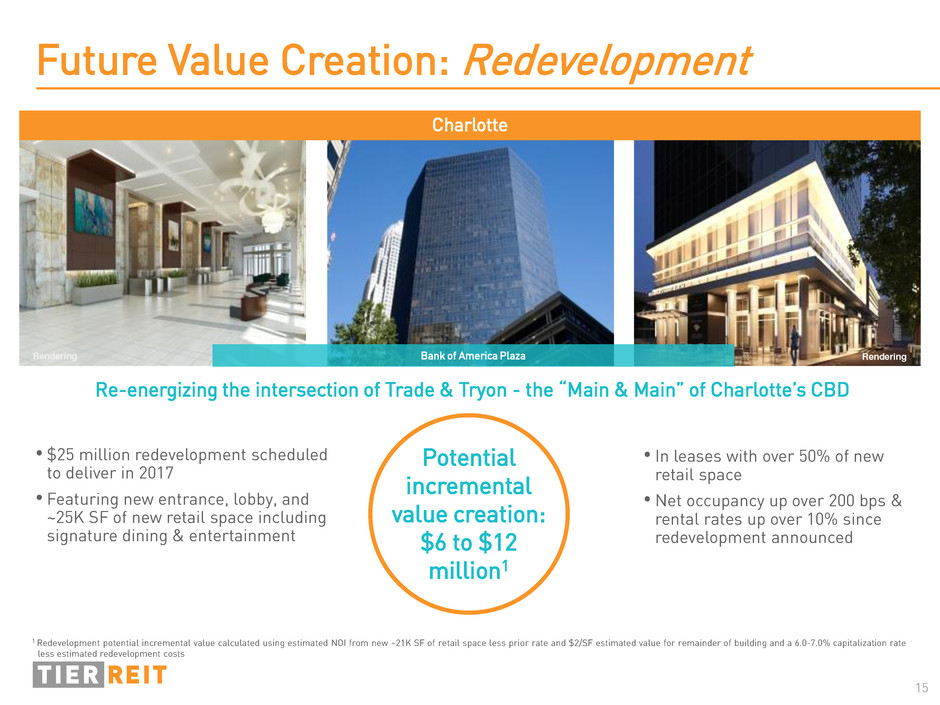
Re-energizing the intersection of Trade & Tryon - the “Main & Main” of Charlotte’s CBD
Potential
incremental
value creation:
$6 to $12
million1
1 Redevelopment potential incremental value calculated using estimated NOI from new ~21K SF of retail space less prior rate and $2/SF estimated value for remainder of building and a 6.0-7.0% capitalization rate
less estimated redevelopment costs
• $25 million redevelopment scheduled
to deliver in 2017
• Featuring new entrance, lobby, and
~25K SF of new retail space including
signature dining & entertainment
• In leases with over 50% of new
retail space
• Net occupancy up over 200 bps &
rental rates up over 10% since
redevelopment announced
Charlotte
Bank of America Plaza Rendering Rendering

16
Future Value Creation: Development
Domain 11 & 12 (pre-development)
• ~640K net rentable SF
• ~$335/SF development cost
• ~8.5%+ est. development yield
Domain 9,10 & Block G (future)
• ~660K net rentable SF of additional
future office space
Austin CBD (pre-development)
• ~325K net rentable SF
• ~$440/SF development cost
• ~8.25%+ est. development yield
Legacy East (pre-development)
• ~570K net rentable SF in two phases
• ~$340/SF development cost
• ~8.5%+ est. development yield
Potential
incremental
value creation:
$230 to $315
million1
1 Development potential incremental value calculated using stabilized NOI from above developments and a 6.0-6.5% capitalization rate less estimated development costs
Austin
Third + Shoal (Rendering)
Dallas
Legacy East (Rendering)
Austin
Domain 11 & 12 (Rendering)
17
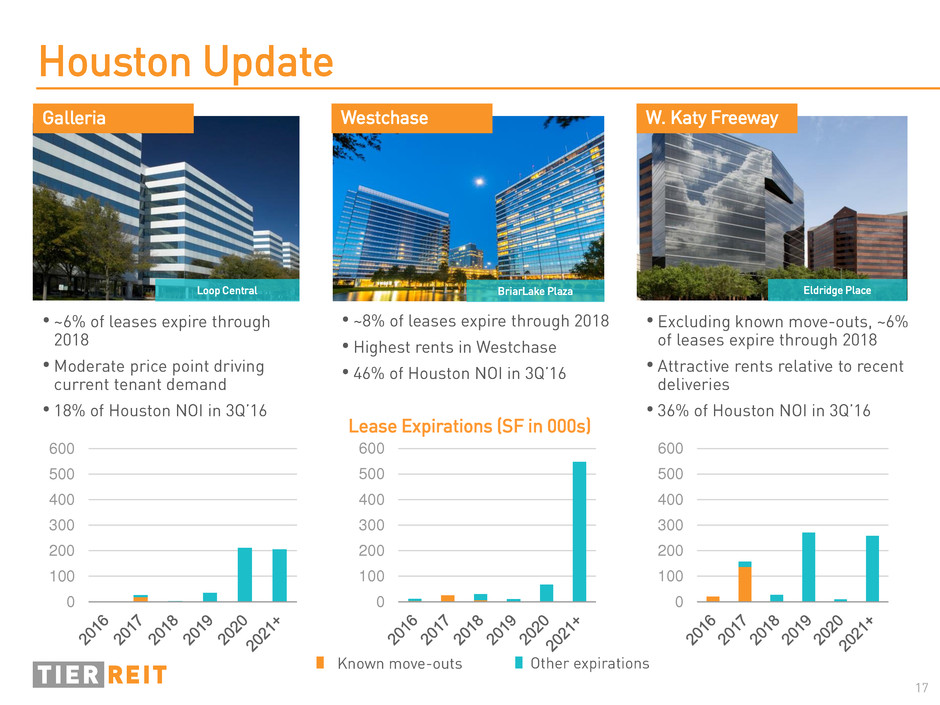
Houston Update
Galleria
Loop Central BriarLake Plaza
Westchase
Eldridge Place
W. Katy Freeway
• Excluding known move-outs, ~6%
of leases expire through 2018
• Attractive rents relative to recent
deliveries
• 36% of Houston NOI in 3Q’16
• ~8% of leases expire through 2018
• Highest rents in Westchase
• 46% of Houston NOI in 3Q’16
• ~6% of leases expire through
2018
•Moderate price point driving
current tenant demand
• 18% of Houston NOI in 3Q’16
Known move-outs
Lease Expirations (SF in 000s)
0
100
200
300
400
500
600
0
100
200
300
400
500
600
0
100
200
300
400
500
600
Other expirations

18
Commitment to Stockholders
• Upon completion of recycling phase, substantially all net operating
income will be derived from TIER’s seven high-growth target markets
Preserving optionality to enhance equity value through public or private execution
• Near-term goals for achieving share price parity with peer companies:
− Complete disposition of few remaining properties located outside target markets
− Allocate disposition proceeds prudently into strategic investments
− Execute on significant value creation opportunities
− Achieve full and sustainable dividend coverage
− Capitalize on future Houston office market recovery to drive occupancy gains
and monetize select holdings
• TIER REIT management team and board of directors are
100% committed to optimizing value of TIER’s common
stock through public market execution or pursuing other
strategic alternatives including private execution

19
1 As previously reported on page 12 of the 9.30.16 supplemental reporting package, pro-forma for the completed disposition of 801 Thompson (Rockville, MD) on 10.27.16 (adjusted Cash NOI of ($.1mm) with no
debt), and the pending disposition of Fifth Third Center (Columbus) (adjusted Cash NOI of $2.8mm and note payable of $48.3mm) and the completed payoff of the Eldridge Place (Houston) loan on 10.11.16 (note
payable of $70.0mm)
2 Comprised of adjusted cash NOI from the following markets: Austin – 18%, Dallas – 4%, Houston – 31%, Charlotte – 13%, Los Angeles – 3%, Louisville – 6%, Nashville – 2%, Tampa – 2%, Washington, D.C. – 1%,
Baltimore – 4%, Cherry Hill – 4%, Philadelphia – 12%
3 Includes Domain 8, The Domain land, Third + Shoal land (Austin), and Legacy East land (Dallas)
4 Calculated based on total market capitalization as of 12.30.16, less cost basis of land and development properties and estimated value for all properties other than stabilized Houston operating portfolio
5 Represents total potential incremental value creation opportunities from slides 14-16
Net Asset Value Components
Commentary
• Based on ending stock price of
$17.39 on 12.30.16
• 21% discount to consensus NAV
of $21.97
• 8.0% implied cap rate on
stabilized assets
• 14% cap rate, or $127 per SF on
stabilized Houston assets4
• $186 per SF valuation on all
operating properties, an
approximate 44% discount to
replacement cost
Components
3Q’16
Annualized1
($mm)
Total adjusted cash NOI at ownership share for stabilized properties2 112.2
Other real estate properties:
• Estimated value of non-stabilized properties at ownership share
• Cost basis of land and development properties3
258.6
92.5
Total other real estate properties 351.1
Other tangible assets 17.9
Liabilities:
• Other liabilities
• Debt
105.9
839.1
Total Liabilities 945.0
Diluted shares outstanding 47.9
Excludes aggregate potential incremental value creation opportunities of ~$345-460mm5

20
Bank of America Plaza, Charlotte, NC
PART THREE
BALANCE SHEET
Redevelopment to deliver 2017
21
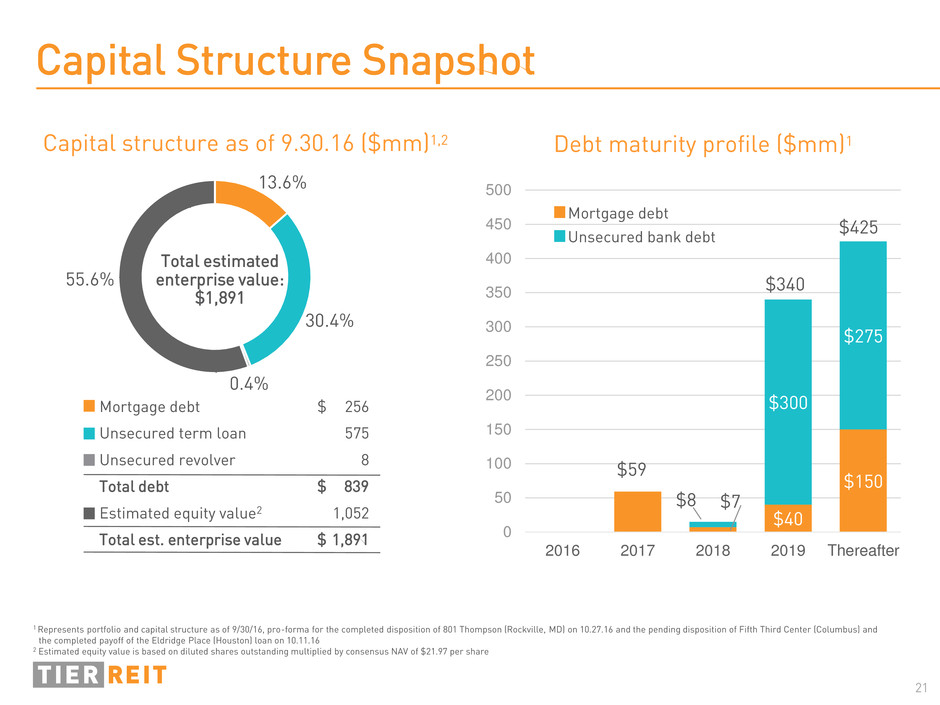
13.6%
30.4%
0.4%
55.6%
Total estimated
enterprise value:
$1,891
Capital structure as of 9.30.16 ($mm)1,2
Mortgage debt $ 256
Unsecured term loan 575
Unsecured revolver 8
Total debt $ 839
Estimated equity value2 1,052
Total est. enterprise value $ 1,891
1 Represents portfolio and capital structure as of 9/30/16, pro-forma for the completed disposition of 801 Thompson (Rockville, MD) on 10.27.16 and the pending disposition of Fifth Third Center (Columbus) and
the completed payoff of the Eldridge Place (Houston) loan on 10.11.16
2 Estimated equity value is based on diluted shares outstanding multiplied by consensus NAV of $21.97 per share
Capital Structure Snapshot
$40
$150
$300
$275
0
50
100
150
200
250
300
350
400
450
500
2016 2017 2018 2019 Thereafter
$8 $7
Debt maturity profile ($mm)1
$340
$425
$59
Mortgage debt
Unsecured bank debt

22
1 EBITDA and NOI reflect annualized 3Q’14 and 3Q’16 normalized EBITDA and NOI for properties owned at period end; 3Q’16 EBITDA and NOI are pro-forma for the completed disposition of 801 Thompson (Rockville,
MD) on 10.27.16 and the pending disposition of Fifth Third Center (Columbus) and the completed payoff of the Eldridge Place (Houston) loan on 10.11.16
2 Represents portfolio and capital structure as of 3Q’14, and for 3Q’16, pro-forma for the completed disposition of 801 Thompson (Rockville, MD) on 10.27.16 and the pending disposition of Fifth Third Center
(Columbus) and the completed payoff of the Eldridge Place (Houston) loan on 10.11.16. 3Q’14 estimated enterprise value calculated using third party appraisal; 3Q’16 estimated enterprise value calculated based on
outstanding shares multiplied by consensus NAV of $21.97 per share
Balance Sheet Targets
Credit statistics
9.30.14 9.30.16 Targets 2017
Net debt / annualized adj. EBITDA1 9.6x 7.3x <7.0x
Net debt / total est. enterprise value2 55% 44% <45%
Mortgage debt / total est. enterprise value2 55% 14% <20%
Fixed charge coverage2 1.5x 2.8x >3.0x
Unencumbered NOI / total NOI1,2 5% 76% >65%
Working toward investment grade debt rating

23
Burnett Plaza, Fort Worth, TX
PART FOUR
INVESTMENT RATIONALE
International TOBY 2014

24
INVESTMENT
RATIONALE
Focused investment strategy
High-quality portfolio
Significant value creation opportunities
Experienced management team
Proven execution capabilities
Austin I Dallas I Houston I Charlotte I Nashville I Atlanta I Denver 24

25
APPENDIX
MARKET FUNDAMENTALS
5950 Sherry Lane, Dallas, TX
Acquired 2014

26
Sources: Moody's Analytics; BLS; CoStar Portfolio Strategy As of 16Q3
(10%)
(8%)
(6%)
(4%)
(2%)
0%
2%
4%
6%
8%
10%
12%
00 01 02 03 04 05 06 07 08 09 10 11 12 13 14 15 16 17 18 19 20
Austin Office-Using Employment
National Office-Using Employment Growth
Austin Working Age Population Growth
National Working Age Population Growth
Employment & Population Growth (Y/Y)
Top-tier market with a highly educated workforce
combined with pro-business government policy
• 9.7% Class A vacancy, down from 10.4% in prior year
• YoY: 7.7% Class A rent growth / 1.6mm SF net absorption
• 3Q’16: 4.6% Class A rent growth / 0.2mm SF net absorption
• 1.7mm SF under construction, ~75% preleased
• 3.0%+ avg. annual rent growth projected through 2020
Office-Using Employment & Population Growth1
Market Commentary1 Portfolio Snapshot
Austin
1 Based on Moody’s Analytics, Bureau of Labor Statistics and CoStar Portfolio Strategy as of 3Q’16
The Domain
Terrace
Office Park
Third + Shoal
Terrace Office Park Third + Shoal (Rendering) Domain 7

27
Sources: Moody's Analytics; BLS; CoStar Portfolio Strategy As of 16Q3
(8%)
(6%)
(4%)
(2%)
0%
2%
4%
6%
8%
00 01 02 03 04 05 06 07 08 09 10 11 12 13 14 15 16 17 18 19 20
Dallas - Fort Worth Office-Using Employment
National Office-Using Employment Growth
Dallas - Fort Worth Working Age Population Growth
National Working Age Population Growth
Employment & Population Growth (Y/Y)
Dallas’ diversified economy, affordability, location and
quality of labor have resulted in one of the largest
gains in job growth in the country
• 16.5% Class A vacancy
• YoY: 5.4% Class A rent growth / 2.8mm SF net absorption
• 3Q’16: 0.9% Class A rent growth / 1.8mm SF net absorption
• 10.4mm SF under construction, ~63% preleased
• 2.5%+ avg. annual rent growth projected through 2020
Dallas-Fort Worth
Office-Using Employment & Population Growth1
Market Commentary1 Portfolio Snapshot
Burnett Plaza 5950 Sherry Lane Legacy East (Rendering)
5950 Sherry
Lane
Burnett
Plaza
Legacy
East
1 Based on Moody’s Analytics, Bureau of Labor Statistics and CoStar Portfolio Strategy as of 3Q’16

28
Sources: Moody's Analytics; BLS; CoStar Portfolio Strategy As of 16Q3
(8%)
(6%)
(4%)
(2%)
0%
2%
4%
6%
8%
00 01 02 03 04 05 06 07 08 09 10 11 12 13 14 15 16 17 18 19 20
Houston Office-Using Employment
National Office-Using Employment Growth
Houston Working Age Population Growth
National Working Age Population Growth
Employment & Population Growth (Y/Y)
Houston
Office-Using Employment & Population Growth1
Market Commentary1 Portfolio Snapshot
Energy-related headwinds have slowed office demand
while new supply is being delivered, likely resulting
in further vacancy increases
• 17.0% Class A vacancy, up from 13.2% in prior year
• YoY: (2.0%) Class A rent compression / 2.3mm SF net
absorption
• 3Q’16: (0.6%) Class A rent compression / 0.2mm SF net
absorption
• Sublease inventory of ~12.0mm SF as of 3Q’16
• 2.7mm SF under construction, ~47% preleased
BriarLake
Plaza
Loop
Central
Eldridge
Place
BriarLake Plaza Loop Central Eldridge Place
1 Based on Moody’s Analytics, Bureau of Labor Statistics and CoStar Portfolio Strategy as of 3Q’16

29
Sources: Moody's Analytics; BLS; CoStar Portfolio Strategy As of 16Q3
(10%)
(8%)
(6%)
(4%)
(2%)
0%
2%
4%
6%
8%
10%
00 01 02 03 04 05 06 07 08 09 10 11 12 13 14 15 16 17 18 19 20
Charlotte Office-Using Employment
National Office-Using Employment Growth
Charlotte Working Age Population Growth
National Working Age Population Growth
Employment & Population Growth (Y/Y)
Charlotte’s local and state economic development efforts,
affordable living costs and a young, educated workforce
supports above-average job growth
• 10.2% Class A vacancy, up from 9.2% in prior year
• YoY: 2.3% Class A rent growth / 0.1mm SF net absorption
• 3Q’16: Flat Class A rent growth / (0.2mm) SF net absorption
• 3.5mm SF under construction, ~53% preleased
• 2.5%+ avg. annual rent growth projected through 2020
Charlotte
Office-Using Employment & Population Growth1
Market Commentary1 Portfolio Snapshot
Bank of
America Plaza
Bank of America Plaza
1 Based on Moody’s Analytics, Bureau of Labor Statistics and CoStar Portfolio Strategy as of 3Q’16

30
Sources: Moody's Analytics; BLS; CoStar Portfolio Strategy As of 16Q3
(8%)
(6%)
(4%)
(2%)
0%
2%
4%
6%
8%
00 01 02 03 04 05 06 07 08 09 10 11 12 13 14 15 16 17 18 19 20
Nashville Office-Using Employment
National Office-Using Employment Growth
Nashville Working Age Population Growth
National Working Age Population Growth
Employment & Population Growth (Y/Y)
Nashville
Office-Using Employment & Population Growth1
Market Commentary1 Portfolio Snapshot
Nashville's economic diversity, mix of private and public
businesses and industries, combined with business costs
~20% below the national average, fuels office demand
• 4.0% Class A vacancy, down from 4.7% in prior year
• YoY: 11.0% Class A rent growth / 0.7mm SF net absorption
• 3Q’16: (0.2%) Class A rent compression / 0.3mm SF net
absorption
• 3.1mm SF under construction, ~64% preleased
• 3.0%+ avg. annual rent growth projected through 2020
Plaza at
MetroCenter
Plaza at MetroCenter
1 Based on Moody’s Analytics, Bureau of Labor Statistics and CoStar Portfolio Strategy as of 3Q’16

31
Forward-Looking Statements
This presentation contains forward-looking statements, including discussion and analysis of the financial condition of us and our subsidiaries and
other matters. These forward-looking statements are not historical facts but are the intent, belief or current expectations of our management
based on their knowledge and understanding of our business and industry. Words such as “may,” “will”, “anticipates,” “expects,” “intends,”
“plans,” “believes,” “seeks,” “estimates,” “would,” “could,” “should,” “objectives,” “strategies,” “goals,” and variations of these words and similar
expressions are intended to identify forward-looking statements. We intend that such forward-looking statements be subject to the safe harbor
provisions created by Section 27A of the Securities Act of 1933 and Section 21E of the Securities Exchange Act of 1934. These statements are not
guarantees of future performance and are subject to risks, uncertainties and other factors, some of which are beyond our control, are difficult to
predict and could cause actual results to differ materially from those expressed or forecasted in the forward-looking statements. Forward-
looking statements that were true at the time made may ultimately prove to be incorrect or false. We caution you not to place undue reliance on
forward-looking statements, which reflect our management's view only as of the date of this presentation. We undertake no obligation to update
or revise forward-looking statements to reflect changed assumptions, the occurrence of unanticipated events or changes to future operating
results.
Factors that could cause actual results to differ materially from any forward-looking statements made in the presentation include but are not
limited to: (i) market disruptions and economic conditions experienced by the economy or real estate industry as a whole and the local economic
conditions in the markets in which our properties are located; (ii) our ability to renew expiring leases and lease vacant spaces at favorable rates
or at all; (iii) the inability of tenants to continue paying their rent obligations due to bankruptcy, insolvency or a general downturn in their
business; (iv) the availability of cash flow from operating activities to fund distributions and capital expenditures; (v) our ability to raise capital in
the future by issuing additional equity or debt securities, selling our assets or otherwise to fund our future capital needs; (vi) our ability to
strategically acquire or dispose of assets on favorable terms or at all; (vii) our level of debt and the terms and limitations imposed on us by our
debt agreements; (viii) our ability to retain our executive officers and other key personnel; (ix) unfavorable changes in laws or regulations
impacting our business or our assets; and (x) factors that could affect our ability to qualify as a real estate investment trust. The forward-looking
statements should be read in light of these and other risk factors identified in the “Risk Factors” section of our Annual Report on Form 10-K for
the year ended December 31, 2015, as filed with the Securities and Exchange Commission.
The modeling, projections, analyses, and other forward-looking information prepared by CoStar Portfolio Strategy, LLC (“CoStar”) and presented
herein are based on financial and other information from public and proprietary sources, as well as various assumptions concerning future
events and circumstances that are speculative, uncertain and subject to change without notice. Actual results and events may differ materially
from the projections presented.
All CoStar materials set forth herein (“CoStar Materials”) speak only as of the date referenced and may have materially changed since such date.
CoStar does not purport that the CoStar Materials herein are comprehensive, and, while they are believed to be accurate, the CoStar Materials
are not guaranteed to be free from error, omission or misstatement. CoStar has no obligation to update any of the CoStar Materials included in
this document. All CoStar Materials are provided “as is,” without any guarantees, representations or warranties of any kind, including implied
warranties of merchantability, non-infringement, title and fitness for a particular purpose. To the maximum extent permitted by law, CoStar
disclaims any and all liability in the event any CoStar Materials prove to be inaccurate, incomplete or unreliable. CoStar does not sponsor,
endorse, offer or promote an investment in the securities of TIER REIT, Inc. You should not construe any of the CoStar Materials as investment,
tax, accounting or legal advice.
32
5950 Sherry Lane, Suite 700
Dallas, Texas 75225
www.tierreit.com
972.483.2400
ir@tierreit.com
