Attached files
| file | filename |
|---|---|
| 8-K - INGN 8-K - CURES ACT IMPACT - Inogen Inc | ingn-8k_20170109.htm |
| EX-99.1 - EX-99.1 - Inogen Inc | ingn-ex991_136.htm |
Company Overview January 2017 Exhibit 99.2
Notice regarding forward-looking statements These slides and the accompanying oral presentation (the “Presentation”) include forward-looking statements within the meaning of the Private Securities Litigation Reform Act of 1995, which are based on current expectations, estimates and projections based on information currently available to management. These forward-looking statements include, among others, statements relating to our current GAAP and non-GAAP guidance, including our estimates of 2016 and 2017 revenue, adjusted EBITDA, adjusted net income, and related margin expectations; our expectations regarding the impact of competitive bidding and decreasing reimbursement rates on both our rental revenue and the oxygen therapy market generally; the size and estimates of growth in the oxygen therapy market; our estimates of reimbursement associated with the 21st Century Cures Act; and our expectations for positive cash flow and our needs for additional capital. All statements other than statements of historical facts contained in this Presentation, including statements regarding our future results of operations and financial position, business strategy, prospective products, plans and objectives of management for future operations, and future results of current and anticipated products are forward-looking statements. Forward-looking statements are typically identified by words like “believe,” “anticipate,” “could,” “should,” “estimate,” “expect,” “intend,” “plan,” “project,” “will,” “forecast,” “budget,” “pro forma,” and similar terms. Forward-looking statements are subject to numerous risks and uncertainties that could cause actual results to differ materially from currently anticipated results, including but not limited to, risks arising from the possibility that we will not realize anticipated revenue; the impact of reduced reimbursement rates; the possible loss of key employees, customers, or suppliers; and intellectual property risks if we are unable to secure and maintain patent or other intellectual property protection for the intellectual property used in our products. In addition, our business is subject to numerous additional risks and uncertainties, including, among others, risks relating to market acceptance of our products; our ability to successfully launch new products and applications; competition; our sales, marketing and distribution capabilities; our planned sales, marketing, and research and development activities; interruptions or delays in the supply of components or materials for, or manufacturing of, our products; seasonal variations; unanticipated increases in costs or expenses; and risks associated with international operations. The known risks and uncertainties are described in detail under the caption “Risk Factors” and elsewhere in our Quarterly Report on Form 10-Q for the period ended September 30, 2016. Additional information will also be set forth in our Annual Report on Form 10-K for the period ended December 31, 2016 to be filed with the SEC and our subsequent reports on Form 10-Q and Form 8-K. Accordingly, our actual results may materially differ from our current expectations, estimates and projections. Unless otherwise specified herein, forward-looking statements represent our management’s beliefs and assumptions only as of our November 3, 2016 earnings release, and we undertake no obligation to update any forward-looking statements, whether as a result of new information, future events or otherwise, except as required by applicable law. You should read our Annual Report on Form 10-K, quarterly reports of Form 10-Q, and other documents that we have filed and may file from time to time with the SEC for more complete information about Inogen, Inc. You may get these documents for free by visiting EDGAR on the Securities and Exchange Commission Web site at www.sec.gov. Use of Non-GAAP Financial Measures This Presentation includes certain non-GAAP financial measures as defined by SEC rules. The non-GAAP financial measures are not intended to be considered in isolation or as a substitute for results prepared in accordance with GAAP. Management believes that non-GAAP financial measures, taken in conjunction with U.S. GAAP financial measures, provide useful information for both management and investors by excluding certain non-cash and other expenses that are not indicative of Inogen's core operating results. Management uses non-GAAP measures to compare Inogen's performance relative to forecasts and strategic plans, to benchmark Inogen's performance externally against competitors, and for certain compensation decisions. As required by Regulation G, we have provided a reconciliation of these non-GAAP measures to the most directly comparable GAAP measures, which is available in the Appendix following this Presentation. For future periods, we are unable to provide a quantitative reconciliation of non-GAAP financial measures without unreasonable effort as a result of the uncertainty regarding, and the potential variability of, the amounts of interest income, interest expense, depreciation and amortization, stock-based compensation, provisions for income taxes, and certain other infrequently occurring items, such as acquisition related costs, that may be incurred in the future.
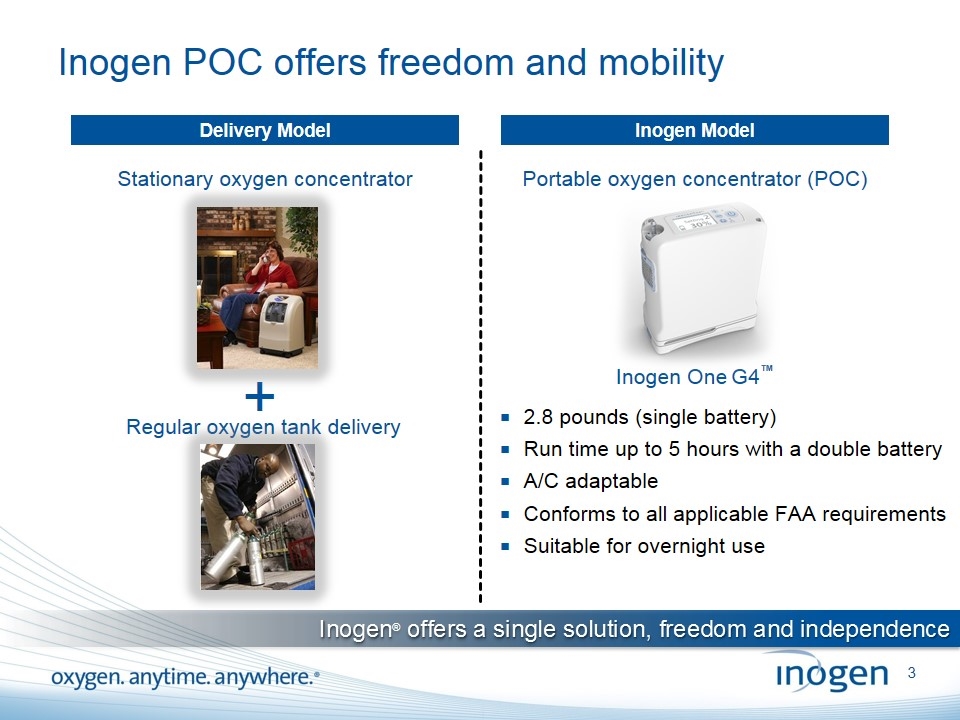
Inogen POC offers freedom and mobility Stationary oxygen concentrator + Regular oxygen tank delivery Delivery Model Inogen Model 2.8 pounds (single battery) Run time up to 5 hours with a double battery A/C adaptable Conforms to all applicable FAA requirements Suitable for overnight use Portable oxygen concentrator (POC) Inogen® offers a single solution, freedom and independence Inogen One G4™
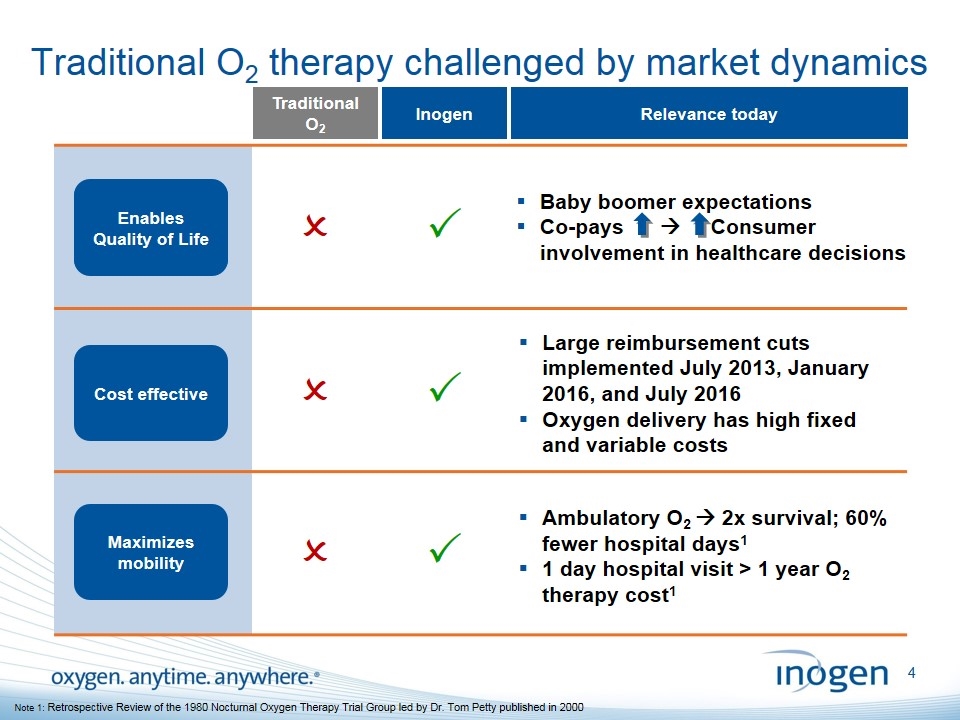
Traditional O2 therapy challenged by market dynamics Traditional O2 P Inogen Cost effective Maximizes mobility P P O O O Relevance today Large reimbursement cuts implemented July 2013, January 2016, and July 2016 Oxygen delivery has high fixed and variable costs Ambulatory O2 à 2x survival; 60% fewer hospital days1 1 day hospital visit > 1 year O2 therapy cost1 Baby boomer expectations Co-pays à Consumer involvement in healthcare decisions Cost effective Enables Quality of Life Note 1: Retrospective Review of the 1980 Nocturnal Oxygen Therapy Trial Group led by Dr. Tom Petty published in 2000
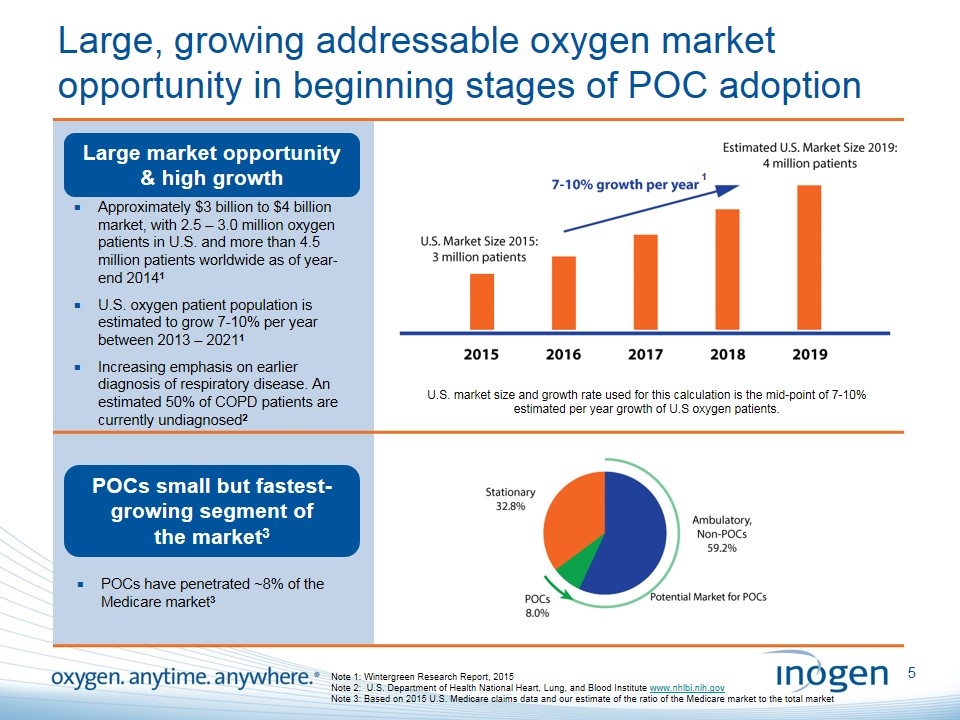
Large, growing addressable oxygen market opportunity in beginning stages of POC adoption Large market opportunity & high growth POCs small but fastest-growing segment of the market3 Note 1: Wintergreen Research Report, 2015 Note 2: U.S. Department of Health National Heart, Lung, and Blood Institute www.nhlbi.nih.gov Note 3: Based on 2015 U.S. Medicare claims data and our estimate of the ratio of the Medicare market to the total market Approximately $3 billion to $4 billion market, with 2.5 – 3.0 million oxygen patients in U.S. and more than 4.5 million patients worldwide as of year-end 20141 U.S. oxygen patient population is estimated to grow 7-10% per year between 2013 – 20211 Increasing emphasis on earlier diagnosis of respiratory disease. An estimated 50% of COPD patients are currently undiagnosed2 POCs have penetrated ~8% of the Medicare market3 U.S. market size and growth rate used for this calculation is the mid-point of 7-10% estimated per year growth of U.S oxygen patients. 1
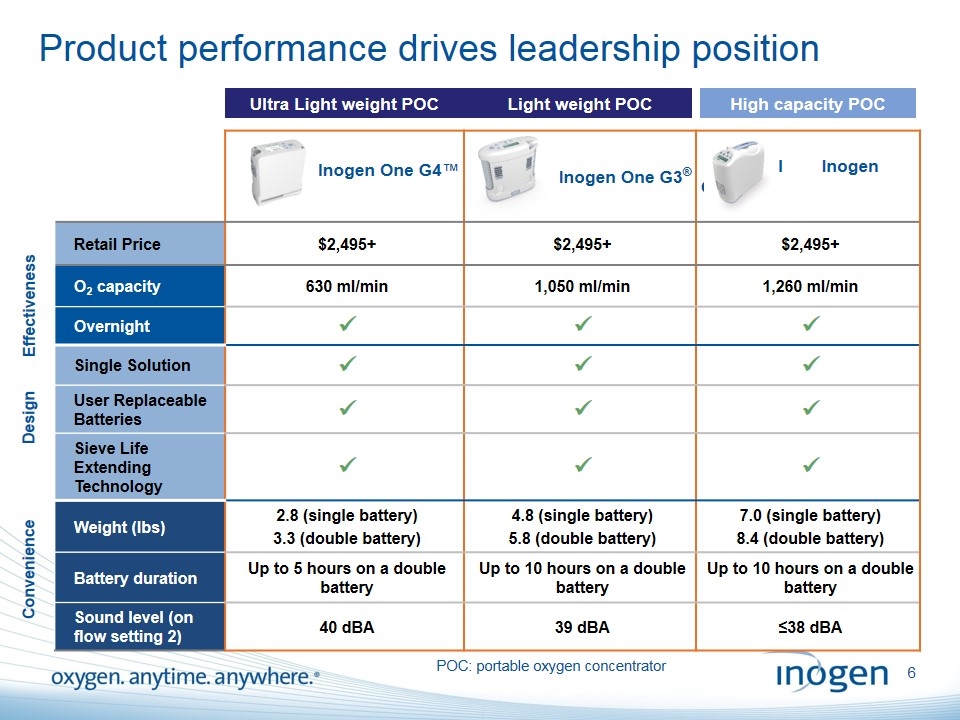
Product performance drives leadership position Ultra Light weight POC Light weight POC High capacity POC Inogen One G4™ Inogen One G3® I Inogen One G2® Retail Price $2,495+ $2,495+ $2,495+ O2 capacity 630 ml/min 1,050 ml/min 1,260 ml/min Overnight ü ü ü Single Solution ü ü ü User Replaceable Batteries ü ü ü Sieve Life Extending Technology ü ü ü Weight (lbs) 2.8 (single battery) 3.3 (double battery) 4.8 (single battery) 5.8 (double battery) 7.0 (single battery) 8.4 (double battery) Battery duration Up to 5 hours on a double battery Up to 10 hours on a double battery Up to 10 hours on a double battery Sound level (on flow setting 2) 40 dBA 39 dBA ≤38 dBA Effectiveness Design Convenience POC: portable oxygen concentrator
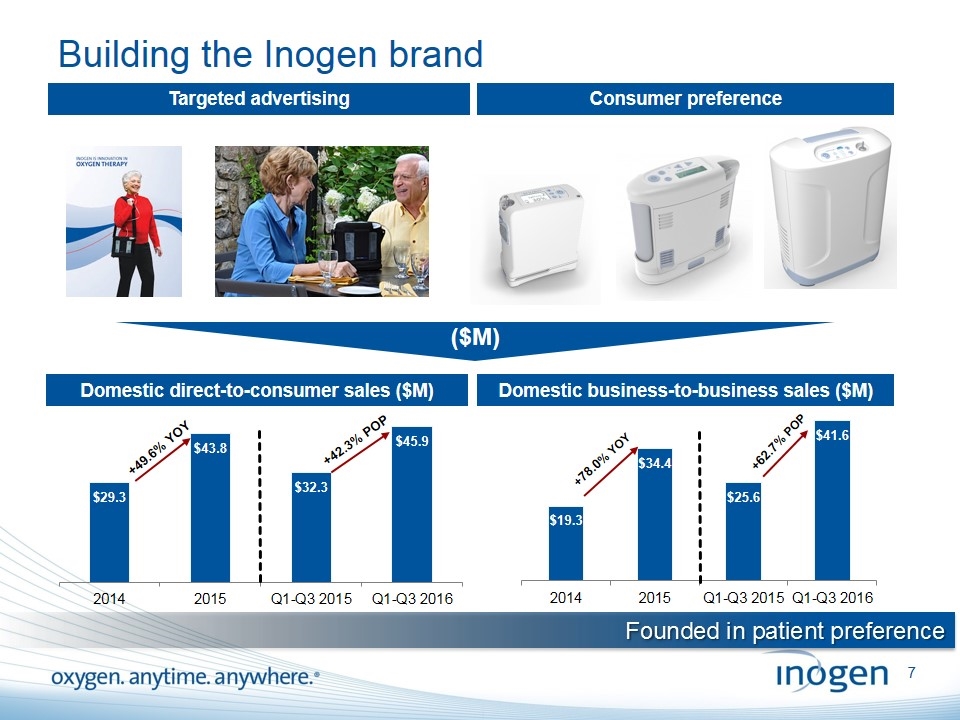
Building the Inogen brand Targeted advertising Consumer preference Domestic direct-to-consumer sales ($M) Domestic business-to-business sales ($M) +49.6% YOY +42.3% POP +78.0% YOY +62.7% POP ($M) Founded in patient preference
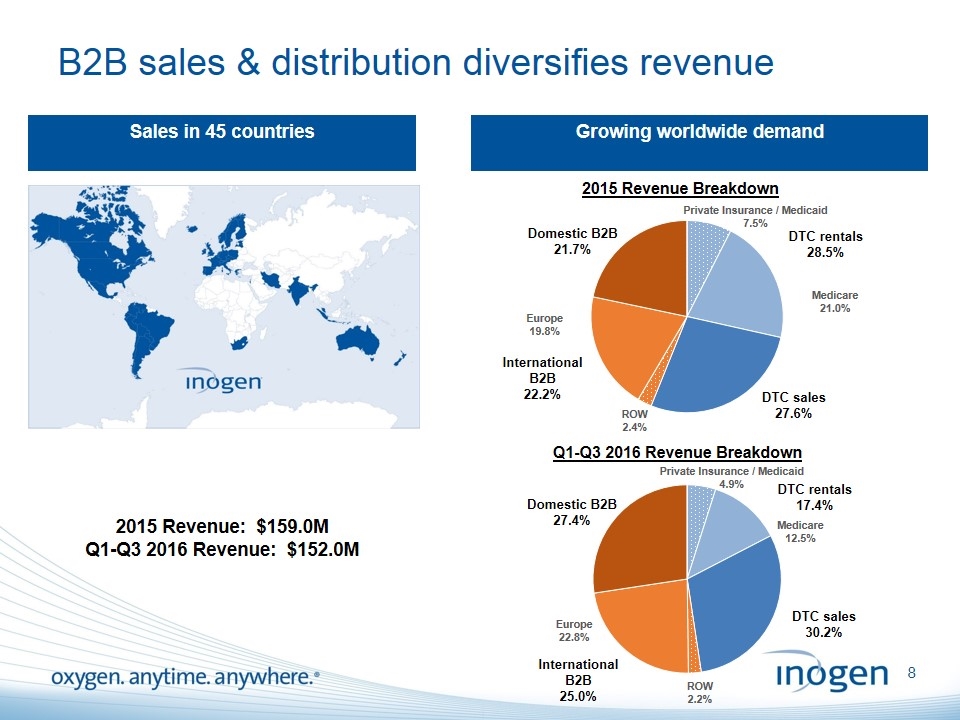
B2B sales & distribution diversifies revenue Sales in 45 countries Growing worldwide demand 2015 Revenue: $159.0M Q1-Q3 2016 Revenue: $152.0M Medicare 21.0% Europe 19.8% Medicare 12.5% Europe 22.8%
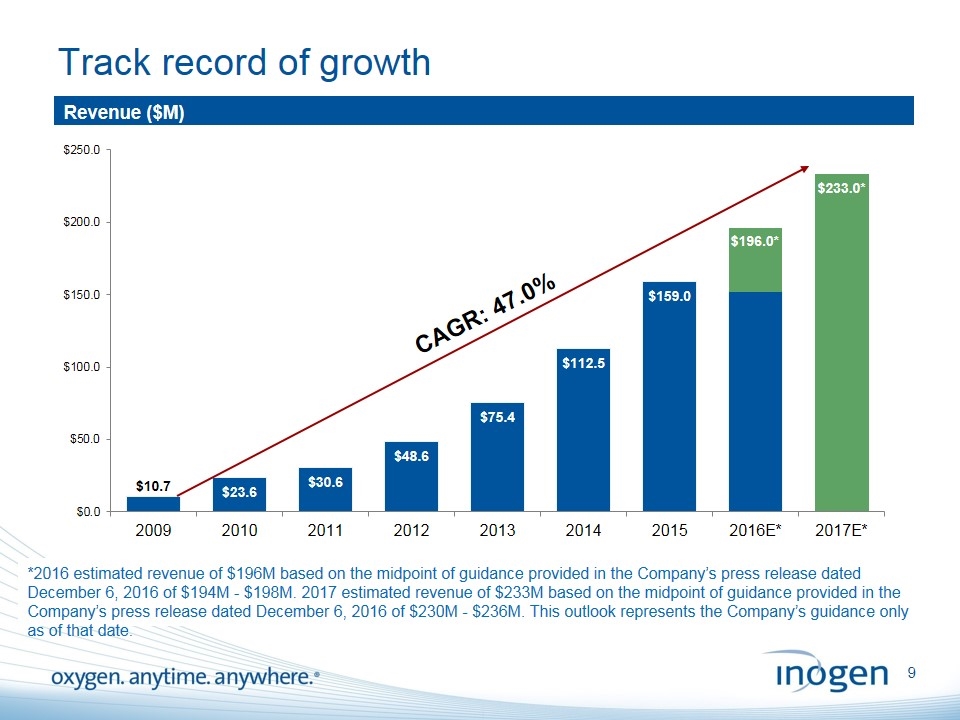
Track record of growth Revenue ($M) CAGR: 47.0% *2016 estimated revenue of $196M based on the midpoint of guidance provided in the Company’s press release dated December 6, 2016 of $194M - $198M. 2017 estimated revenue of $233M based on the midpoint of guidance provided in the Company’s press release dated December 6, 2016 of $230M - $236M. This outlook represents the Company’s guidance only as of that date.
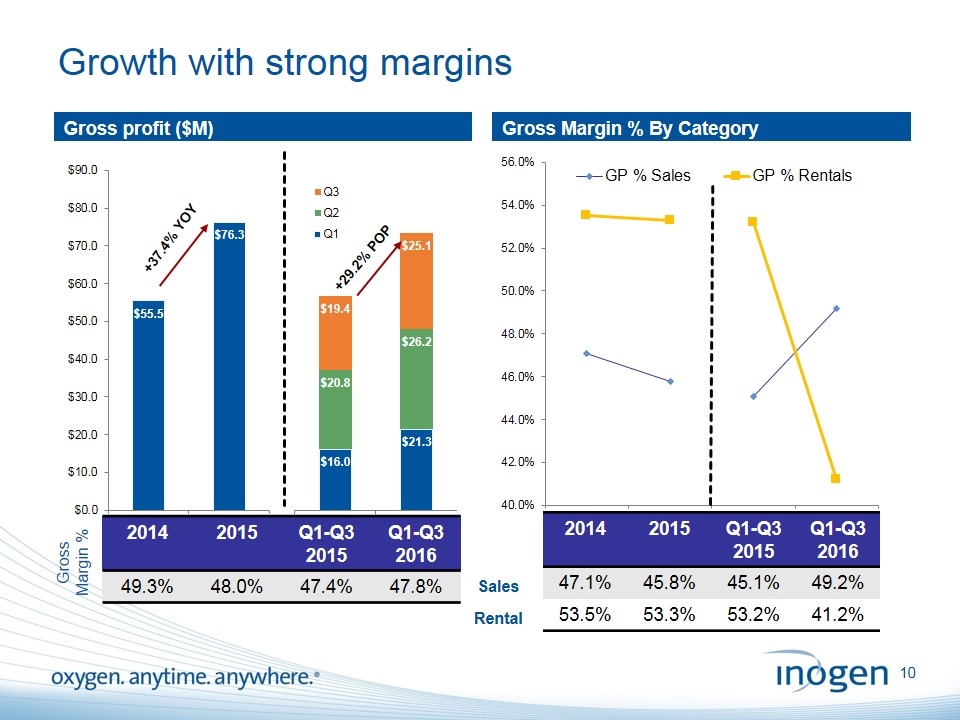
Growth with strong margins Gross profit ($M) Gross Margin % By Category 2014 2015 Q1-Q3 2015 Q1-Q3 2016 49.3% 48.0% 47.4% 47.8% Gross Margin % 2014 2015 Q1-Q3 2015 Q1-Q3 2016 47.1% 45.8% 45.1% 49.2% 53.5% 53.3% 53.2% 41.2% Sales Rental +37.4% YOY
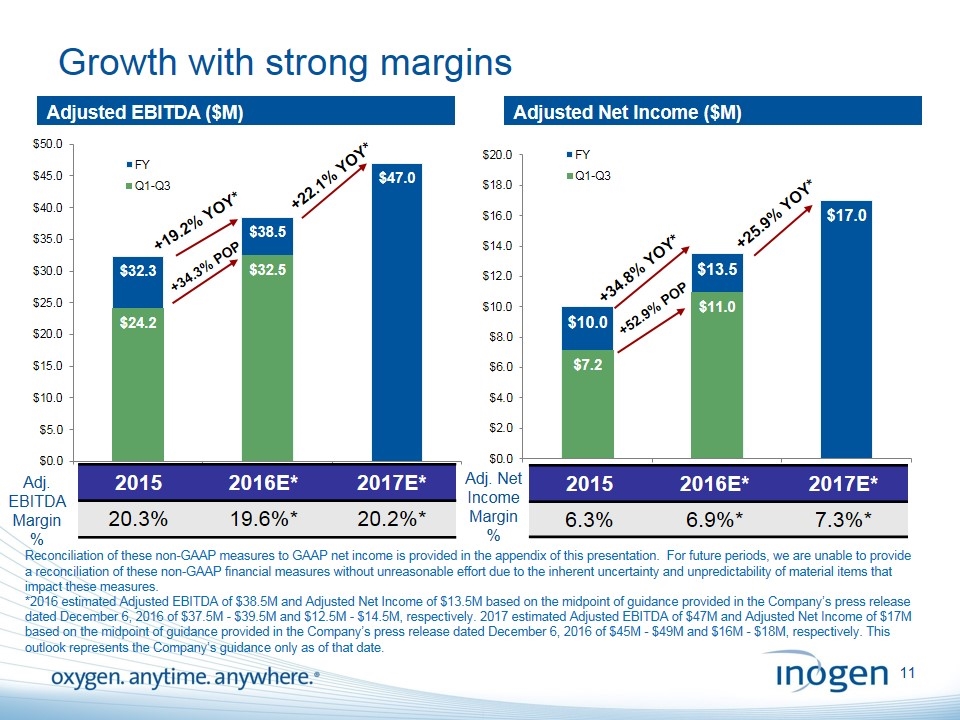
Growth with strong margins Reconciliation of these non-GAAP measures to GAAP net income is provided in the appendix of this presentation. For future periods, we are unable to provide a reconciliation of these non-GAAP financial measures without unreasonable effort due to the inherent uncertainty and unpredictability of material items that impact these measures. *2016 estimated Adjusted EBITDA of $38.5M and Adjusted Net Income of $13.5M based on the midpoint of guidance provided in the Company’s press release dated December 6, 2016 of $37.5M - $39.5M and $12.5M - $14.5M, respectively. 2017 estimated Adjusted EBITDA of $47M and Adjusted Net Income of $17M based on the midpoint of guidance provided in the Company’s press release dated December 6, 2016 of $45M - $49M and $16M - $18M, respectively. This outlook represents the Company’s guidance only as of that date. Adjusted EBITDA ($M) Adjusted Net Income ($M) Adj. EBITDA Margin % 2015 2016E* 2017E* 6.3% 6.9%* 7.3%* +22.1% YOY* Adj. Net Income Margin % 2015 2016E* 2017E* 20.3% 19.6%* 20.2%* +19.2% YOY* +25.9% YOY*
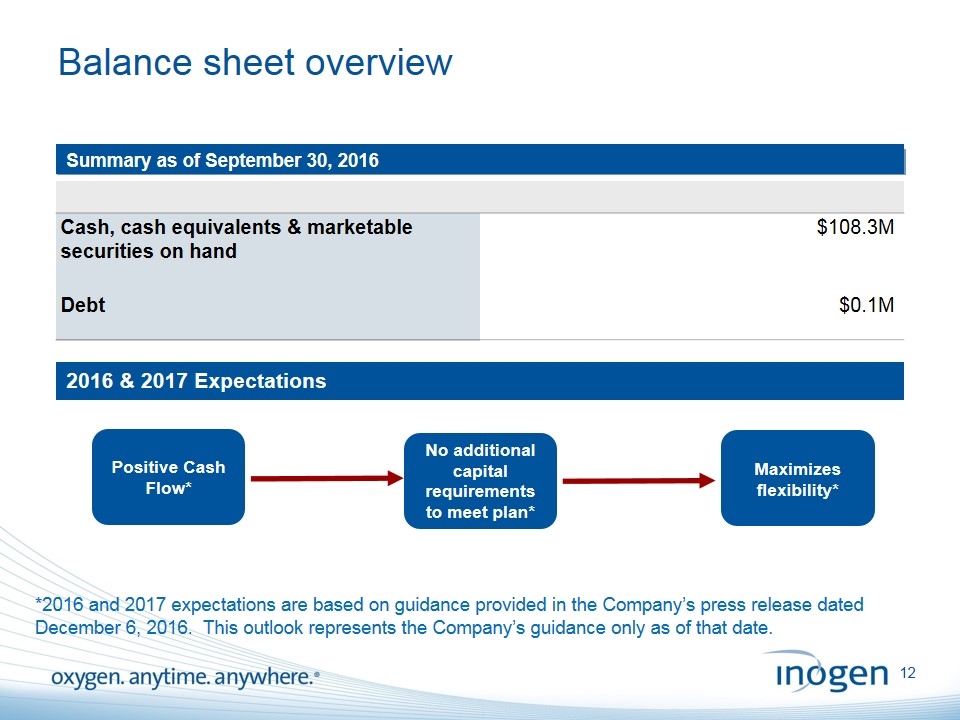
Balance sheet overview [Insert object title] Summary as of September 30, 2016 Cash, cash equivalents & marketable securities on hand $108.3M Debt $0.1M No additional capital requirements to meet plan* Positive Cash Flow* Maximizes flexibility* 2016 & 2017 Expectations *2016 and 2017 expectations are based on guidance provided in the Company’s press release dated December 6, 2016. This outlook represents the Company’s guidance only as of that date.
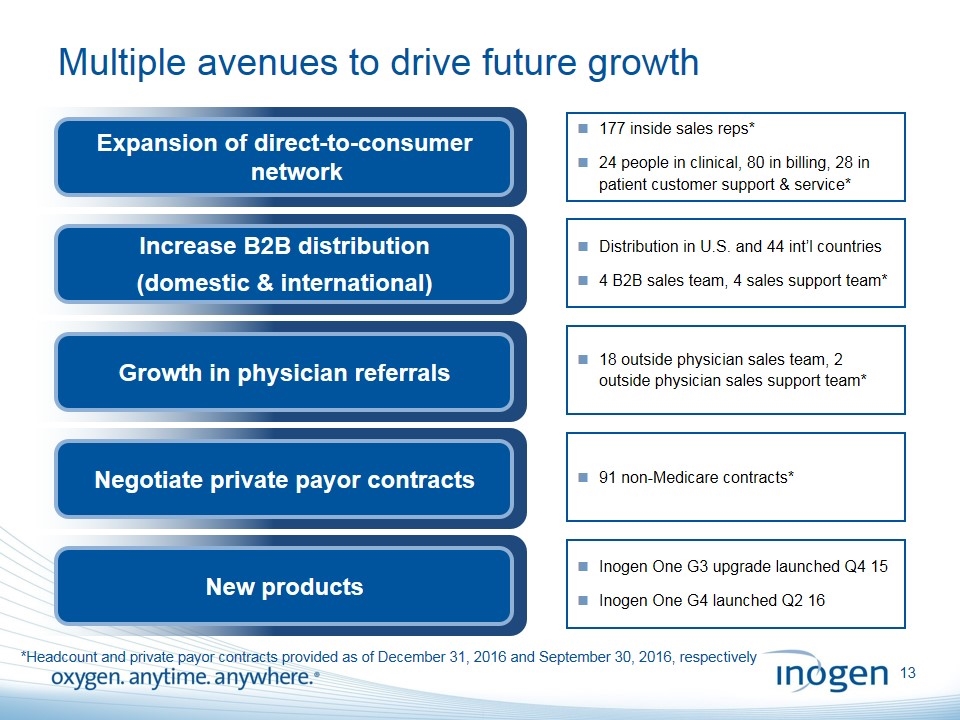
Multiple avenues to drive future growth Expansion of direct-to-consumer network Increase B2B distribution (domestic & international) Growth in physician referrals Negotiate private payor contracts 177 inside sales reps* 24 people in clinical, 80 in billing, 28 in patient customer support & service* Distribution in U.S. and 44 int’l countries 4 B2B sales team, 4 sales support team* 18 outside physician sales team, 2 outside physician sales support team* 91 non-Medicare contracts* New products Inogen One G3 upgrade launched Q4 15 Inogen One G4 launched Q2 16 *Headcount and private payor contracts provided as of December 31, 2016 and September 30, 2016, respectively
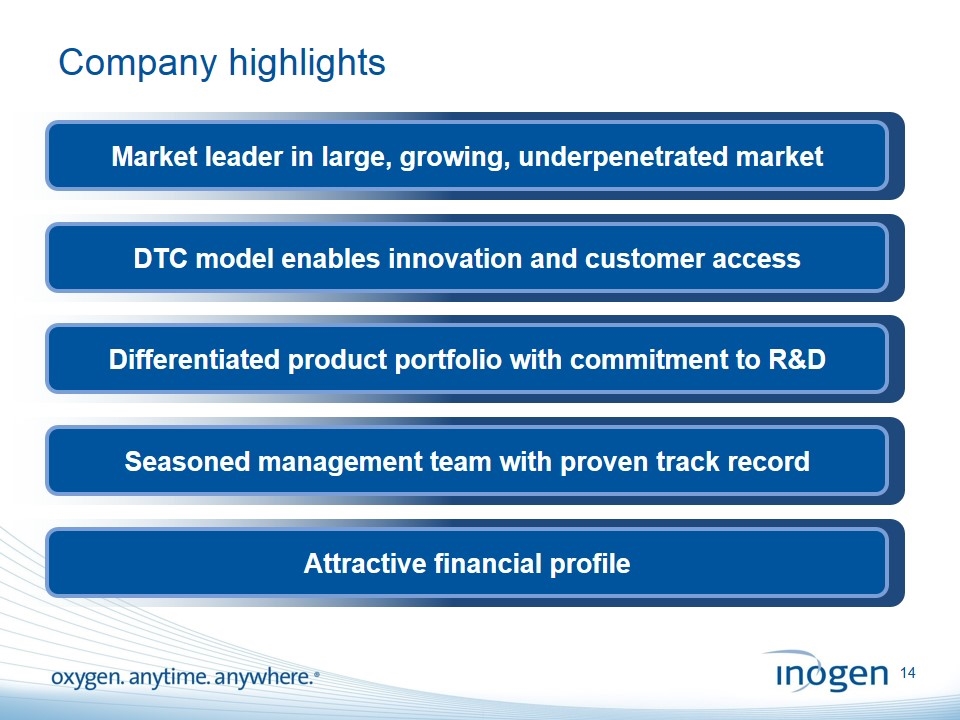
Company highlights Market leader in large, growing, underpenetrated market DTC model enables innovation and customer access Differentiated product portfolio with commitment to R&D Seasoned management team with proven track record Attractive financial profile
Proprietary and Confidential
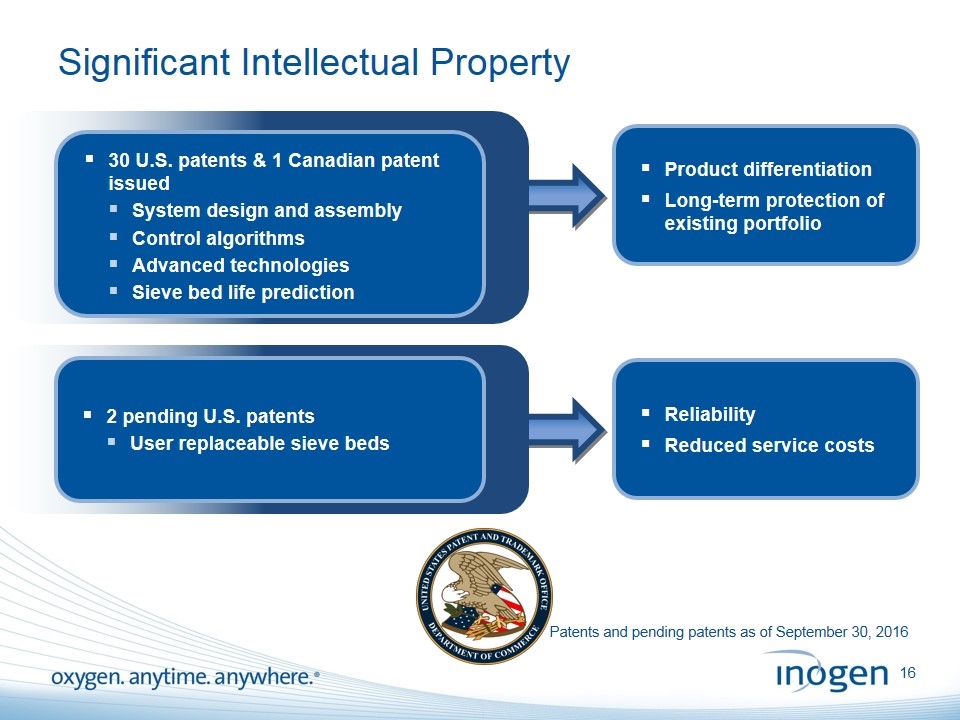
Significant Intellectual Property 30 U.S. patents & 1 Canadian patent issued System design and assembly Control algorithms Advanced technologies Sieve bed life prediction 2 pending U.S. patents User replaceable sieve beds Product differentiation Long-term protection of existing portfolio Reliability Reduced service costs Patents and pending patents as of September 30, 2016
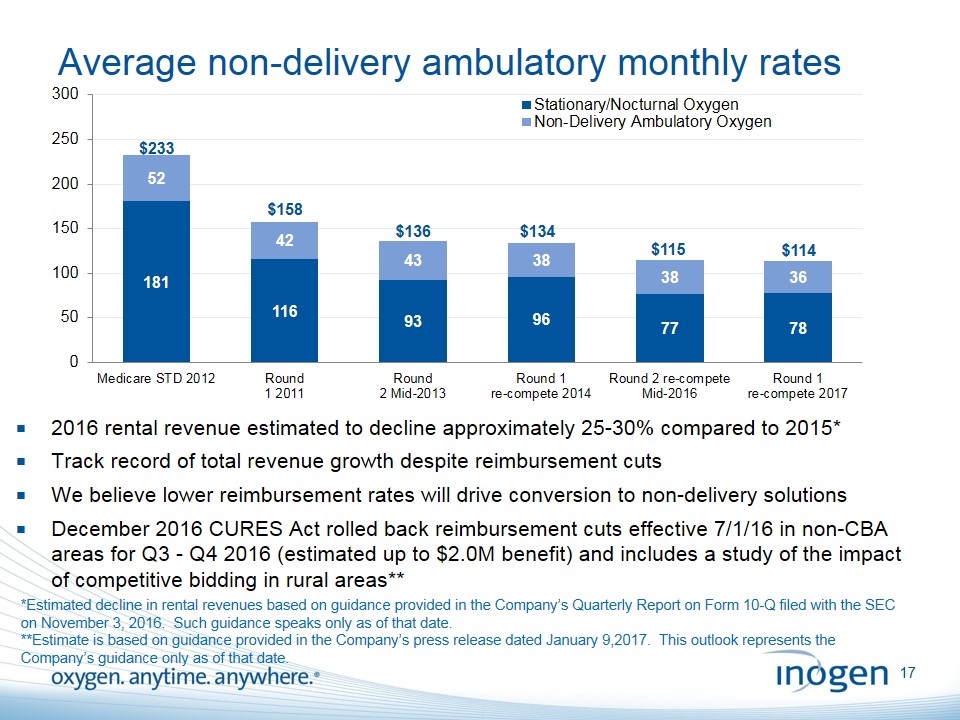
Average non-delivery ambulatory monthly rates $233 $136 $134 2016 rental revenue estimated to decline approximately 25-30% compared to 2015* Track record of total revenue growth despite reimbursement cuts We believe lower reimbursement rates will drive conversion to non-delivery solutions December 2016 CURES Act rolled back reimbursement cuts effective 7/1/16 in non-CBA areas for Q3 - Q4 2016 (estimated up to $2.0M benefit) and includes a study of the impact of competitive bidding in rural areas** $158 $115 $114 *Estimated decline in rental revenues based on guidance provided in the Company’s Quarterly Report on Form 10-Q filed with the SEC on November 3, 2016. Such guidance speaks only as of that date. **Estimate is based on guidance provided in the Company’s press release dated January 9,2017. This outlook represents the Company’s guidance only as of that date.
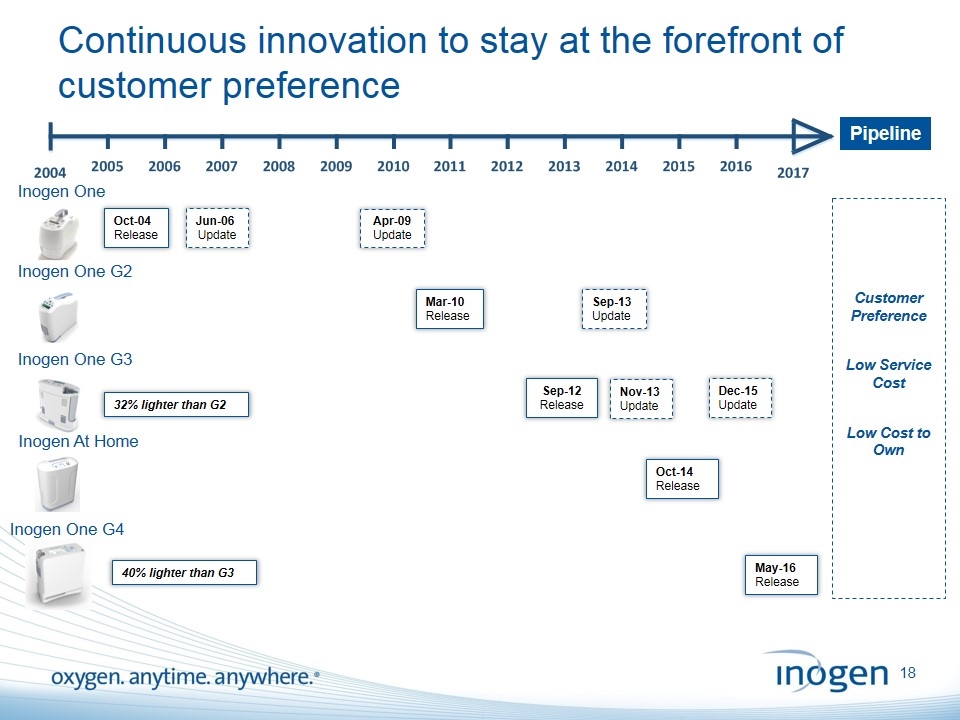
Inogen At Home Continuous innovation to stay at the forefront of customer preference Oct-04 Release Inogen One Inogen One G2 Inogen One G3 Sep-12 Release 32% lighter than G2 Nov-13 Update Oct-14 Release Dec-15 Update Pipeline Customer Preference Low Service Cost Low Cost to Own Jun-06 Update Apr-09 Update Mar-10 Release Sep-13 Update Inogen One G4 May-16 Release 40% lighter than G3
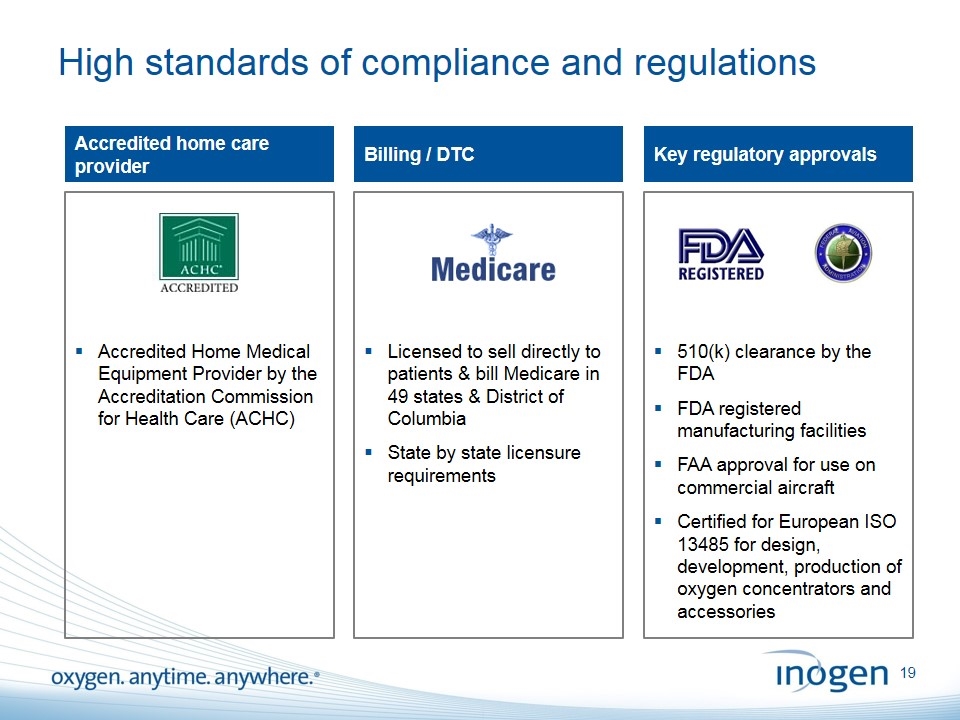
510(k) clearance by the FDA FDA registered manufacturing facilities FAA approval for use on commercial aircraft Certified for European ISO 13485 for design, development, production of oxygen concentrators and accessories Licensed to sell directly to patients & bill Medicare in 49 states & District of Columbia State by state licensure requirements Accredited Home Medical Equipment Provider by the Accreditation Commission for Health Care (ACHC) High standards of compliance and regulations Accredited home care provider Billing / DTC Key regulatory approvals
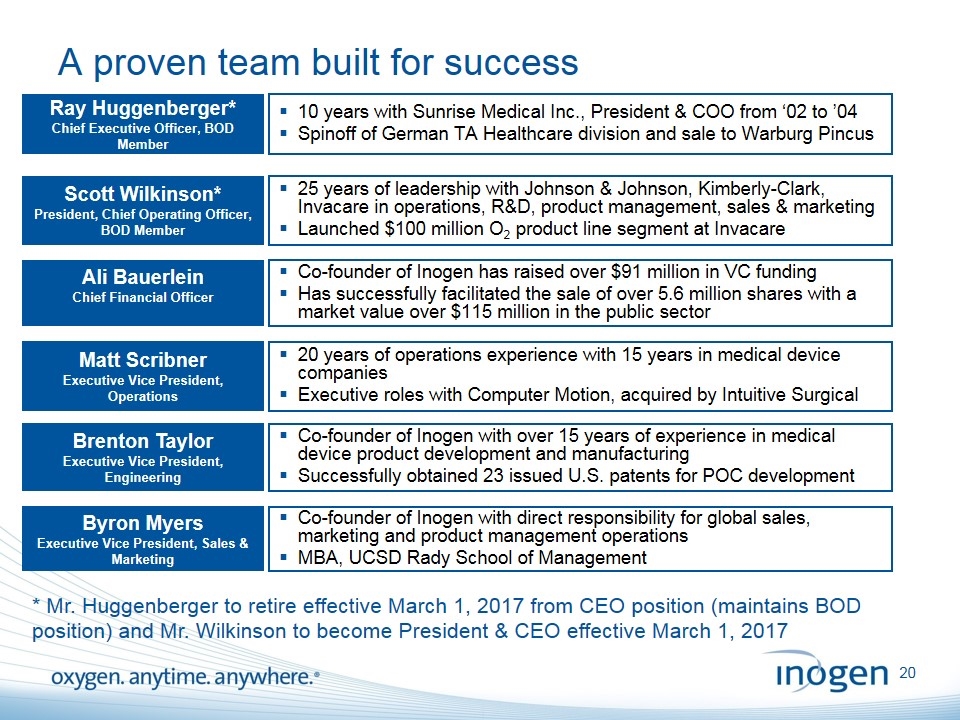
A proven team built for success Ray Huggenberger* Chief Executive Officer, BOD Member Ali Bauerlein Chief Financial Officer Scott Wilkinson* President, Chief Operating Officer, BOD Member 10 years with Sunrise Medical Inc., President & COO from ‘02 to ’04 Spinoff of German TA Healthcare division and sale to Warburg Pincus Co-founder of Inogen has raised over $91 million in VC funding Has successfully facilitated the sale of over 5.6 million shares with a market value over $115 million in the public sector 25 years of leadership with Johnson & Johnson, Kimberly-Clark, Invacare in operations, R&D, product management, sales & marketing Launched $100 million O2 product line segment at Invacare Matt Scribner Executive Vice President, Operations 20 years of operations experience with 15 years in medical device companies Executive roles with Computer Motion, acquired by Intuitive Surgical Brenton Taylor Executive Vice President, Engineering Co-founder of Inogen with over 15 years of experience in medical device product development and manufacturing Successfully obtained 23 issued U.S. patents for POC development Byron Myers Executive Vice President, Sales & Marketing Co-founder of Inogen with direct responsibility for global sales, marketing and product management operations MBA, UCSD Rady School of Management * Mr. Huggenberger to retire effective March 1, 2017 from CEO position (maintains BOD position) and Mr. Wilkinson to become President & CEO effective March 1, 2017
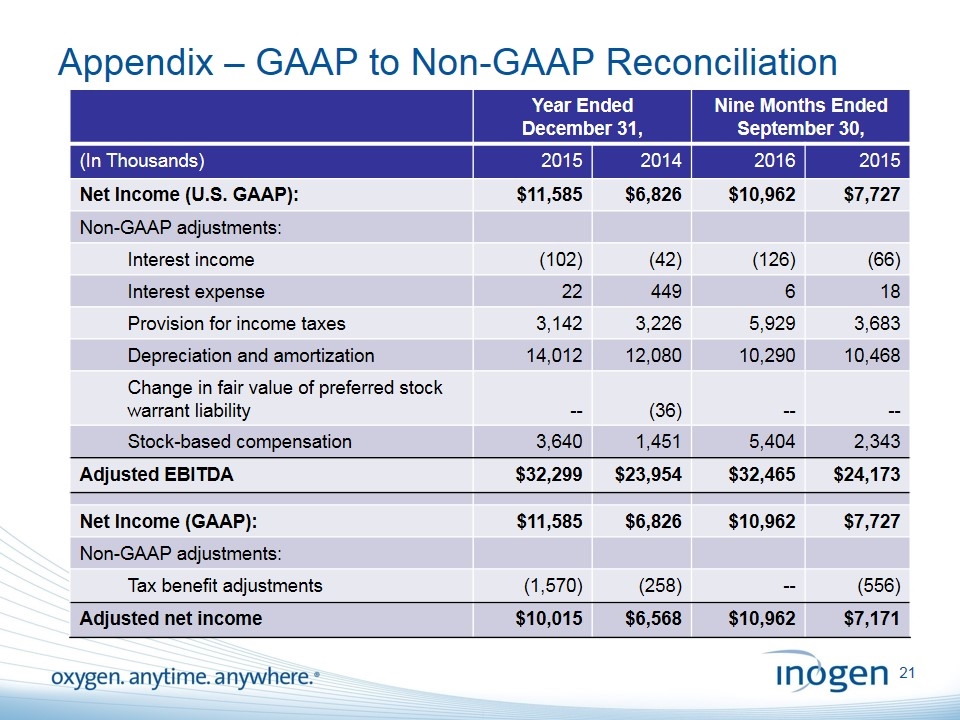
Appendix – GAAP to Non-GAAP Reconciliation Year Ended December 31, Nine Months Ended September 30, (In Thousands) 2015 2014 2016 2015 Net Income (U.S. GAAP): $11,585 $6,826 $10,962 $7,727 Non-GAAP adjustments: Interest income (102) (42) (126) (66) Interest expense 22 449 6 18 Provision for income taxes 3,142 3,226 5,929 3,683 Depreciation and amortization 14,012 12,080 10,290 10,468 Change in fair value of preferred stock warrant liability -- (36) -- -- Stock-based compensation 3,640 1,451 5,404 2,343 Adjusted EBITDA $32,299 $23,954 $32,465 $24,173 Net Income (GAAP): $11,585 $6,826 $10,962 $7,727 Non-GAAP adjustments: Tax benefit adjustments (1,570) (258) -- (556) Adjusted net income $10,015 $6,568 $10,962 $7,171
