Attached files
| file | filename |
|---|---|
| 8-K - 8-K - BRUKER CORP | a17-1651_18k.htm |
Exhibit 99.1
© Bruker Corporation Bruker drives profitable growth and margin expansion by enabling scientific discoveries and by delivering high-performance analytical, life science and diagnostic solutions Innovation with Integrity
Bruker Corporation Safe Harbor Statement Any statements contained in this presentation that do not describe historical facts may constitute forward-looking statements within the meaning of the Private Securities Litigation Reform Act of 1995. Forward-looking statements are based on current expectations, forecasts and assumptions of our management and are subject to risks and uncertainties that could cause actual results to differ materially from those indicated, including, but not limited to, risks and uncertainties relating to: adverse changes in conditions in the global economy and volatility in the capital markets; the integration of businesses we have acquired or may acquire in the future; fluctuations in foreign currency exchange rates; implementation of strategies for improving our operating margins, profitability and cash flow; changing technologies; product development and market acceptance of our products; the cost and pricing of our products; competition; dependence on collaborative partners, key suppliers and contract manufacturers; capital spending and government funding policies; changes in governmental regulations; the use and protection of intellectual property rights and other risk factors discussed from time to time in our filings with the Securities and Exchange Commission, or SEC. These and other factors are identified and described in more detail in our most recent reports filed with the SEC, including, without limitation, our annual report on Form 10-K for the year ended December 31, 2015, our most recent quarterly reports on Form 10-Q and our current reports on Form 8-K. We expressly disclaim any intent or obligation to update these forward-looking statements other than as required by law. © Bruker Corporation 2
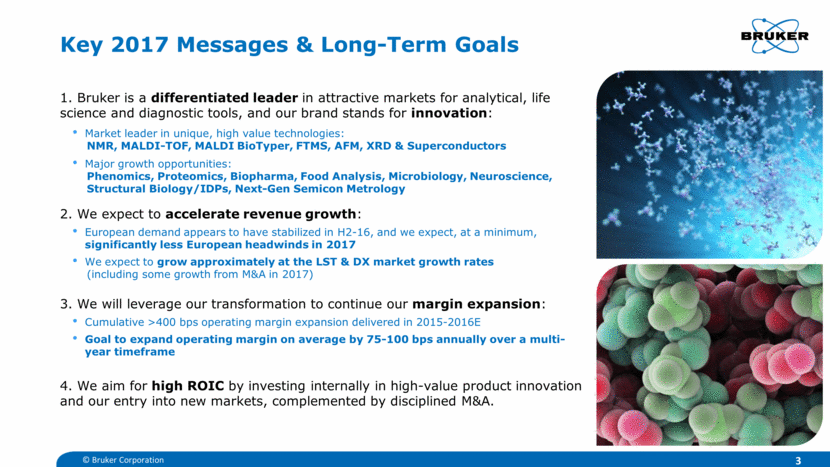
Key 2017 Messages & Long-Term Goals 1. Bruker is a differentiated leader in attractive markets for analytical, life science and diagnostic tools, and our brand stands for innovation: Market leader in unique, high value technologies: NMR, MALDI-TOF, MALDI BioTyper, FTMS, AFM, XRD & Superconductors Major growth opportunities: Phenomics, Proteomics, Biopharma, Food Analysis, Microbiology, Neuroscience, Structural Biology/IDPs, Next-Gen Semicon Metrology 2. We expect to accelerate revenue growth: European demand appears to have stabilized in H2-16, and we expect, at a minimum, significantly less European headwinds in 2017 We expect to grow approximately at the LST & DX market growth rates (including some growth from M&A in 2017) 3. We will leverage our transformation to continue our margin expansion: Cumulative >400 bps operating margin expansion delivered in 2015-2016E Goal to expand operating margin on average by 75-100 bps annually over a multi-year timeframe 4. We aim for high ROIC by investing internally in high-value product innovation and our entry into new markets, complemented by disciplined M&A. 3 © Bruker Corporation
4 I. Bruker Business and Financial Overview Company Overview Technologies, Products & Markets From Transformation to Operational Excellence Financial Performance & Capital Allocation © Bruker Corporation
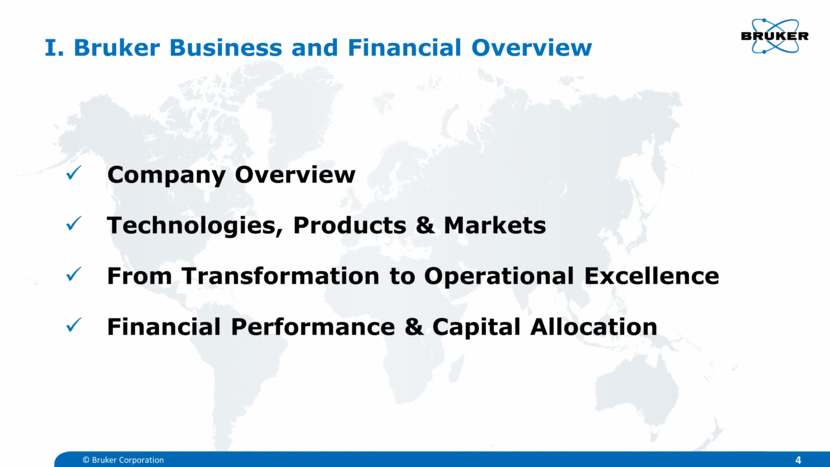
Bruker Overview Founded in 1960 FY2016E revenue: ~$1.6 billion R&D investment: ~9% of revenue ~75% of revenue from scientific and diagnostic instruments ~6,000 employees worldwide After major restructuring and Transformation now on to Operational Excellence phase Long-term oriented ownership: ~35% owned by insiders Quarterly dividend: ~$0.04/share Pro forma FY2016E ROIC: >20%* *Pro forma assuming a ‘normalized’ effective tax rate of 26.5%. Three Primary Life-Science Tools Groups with Global Footprint Revenue breakdown (% as of Q3-16 YTD): CALID NANO Academic & Government Pharma/Biopharma Diagnostic Labs & Hospitals Applied Markets Industrial & Next-Gen Semicon Metrology Large, diverse end markets: © Bruker Corporation BEST Service & After-market Americas Europe Rest of World APAC & India 5 34% 29% 29% 8% BioSpin 35% 29% 5% 31% 75% 25% Systems
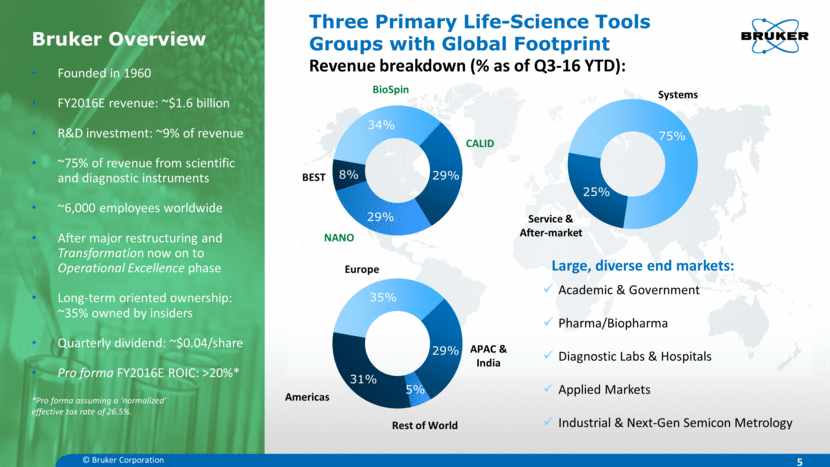
Bruker Technology Portfolio & Key Markets Differentiated, high-performance scientific instruments, analytical tools and diagnostic solutions Microscopic & Nano-Scales Cellular & Sub-Cellular Levels Small Molecule & Protein Levels 6 Enabling research and analysis of life and materials at: Nuclear Magnetic Resonance (NMR) Mass Spectrometry X-Ray Analysis Atomic Force Microscopy (AFM) FT-IR/NIR/Raman Spectroscopy Microbiology Preclinical Imaging plus other Life-Science Tools (LST) © Bruker Corporation
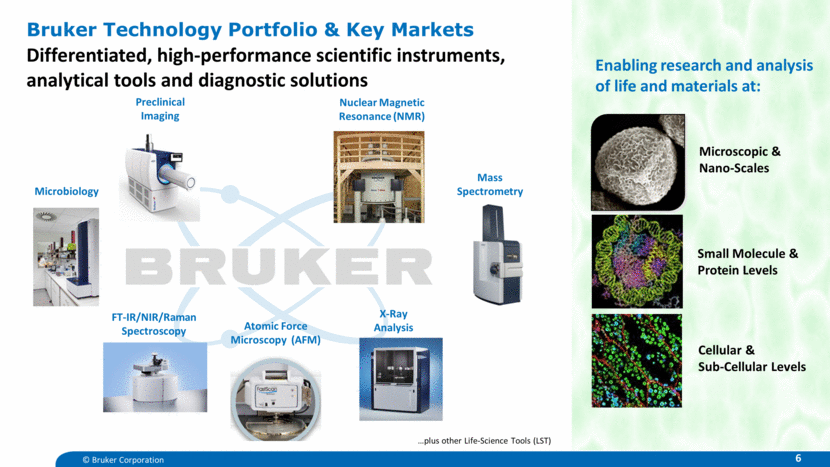
BioSpin Group ~34% of Q3-16 YTD revenue NMR/EPR for Life-Science Research & Pharma Applied, Industrial & Clinical MR Preclinical Imaging Services & Life-Cycle Support NANO Group ~29% of Q3-16 YTD revenue Atomic Force Microscopy Fluorescence Microscopy for Cell Biology & Neurosciences X-Ray for Materials Research, QC Next-Gen Semicon Metrology Service & After-Market business CALID Group ~29% of Q3-16 YTD revenue Mass Spectrometry for Proteomics & Metabolomics Applied & Pharma Microbiology & Pathology FT-IR/NIR/Raman for Applied Markets CBRNE Detection for Security Service, Consumables & Software 7 BRUKER HAS #1 OR #2 MARKET POSITION FOR MORE THAN 60% OF OUR PRODUCT PORTFOLIO © Bruker Corporation Bruker Scientific Instruments (BSI) Organization Three Life Science Tools & Diagnostics (LST & DX) Groups: NMR/EPR & NMR Phenomics Preclinical Imaging & MALDI Imaging MALDI BioTyper FT-IR/NIR, X-Ray Diffraction (XRD), Next-Gen Semicon Metrology Atomic Force Microscopy
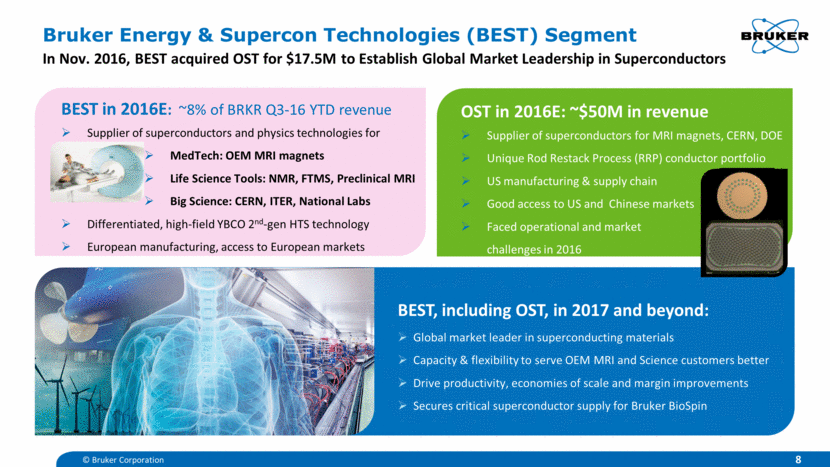
BEST in 2016E: ~8% of BRKR Q3-16 YTD revenue Supplier of superconductors and physics technologies for MedTech: OEM MRI magnets Life Science Tools: NMR, FTMS, Preclinical MRI Big Science: CERN, ITER, National Labs Differentiated, high-field YBCO 2nd-gen HTS technology European manufacturing, access to European markets 8 © Bruker Corporation Bruker Energy & Supercon Technologies (BEST) Segment In Nov. 2016, BEST acquired OST for $17.5M to Establish Global Market Leadership in Superconductors BEST, including OST, in 2017 and beyond: Global market leader in superconducting materials Capacity & flexibility to serve OEM MRI and Science customers better Drive productivity, economies of scale and margin improvements Secures critical superconductor supply for Bruker BioSpin OST in 2016E: ~$50M in revenue Supplier of superconductors for MRI magnets, CERN, DOE Unique Rod Restack Process (RRP) conductor portfolio US manufacturing & supply chain Good access to US and Chinese markets Faced operational and market challenges in 2016
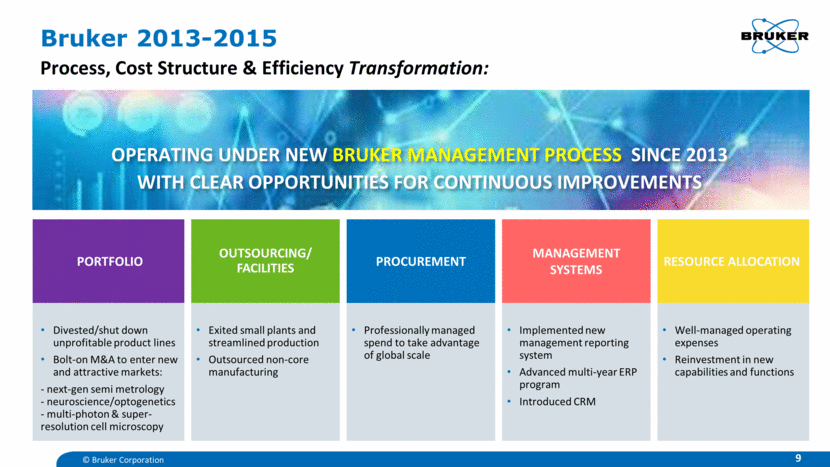
Bruker 2013-2015 Process, Cost Structure & Efficiency Transformation: PORTFOLIO OUTSOURCING/ FACILITIES PROCUREMENT MANAGEMENT SYSTEMS RESOURCE ALLOCATION Divested/shut down unprofitable product lines Bolt-on M&A to enter new and attractive markets: - next-gen semi metrology - neuroscience/optogenetics - multi-photon & super-resolution cell microscopy Exited small plants and streamlined production Outsourced non-core manufacturing Professionally managed spend to take advantage of global scale Implemented new management reporting system Advanced multi-year ERP program Introduced CRM Well-managed operating expenses Reinvestment in new capabilities and functions 9 OPERATING UNDER NEW BRUKER MANAGEMENT PROCESS SINCE 2013 WITH CLEAR OPPORTUNITIES FOR CONTINUOUS IMPROVEMENTS © Bruker Corporation
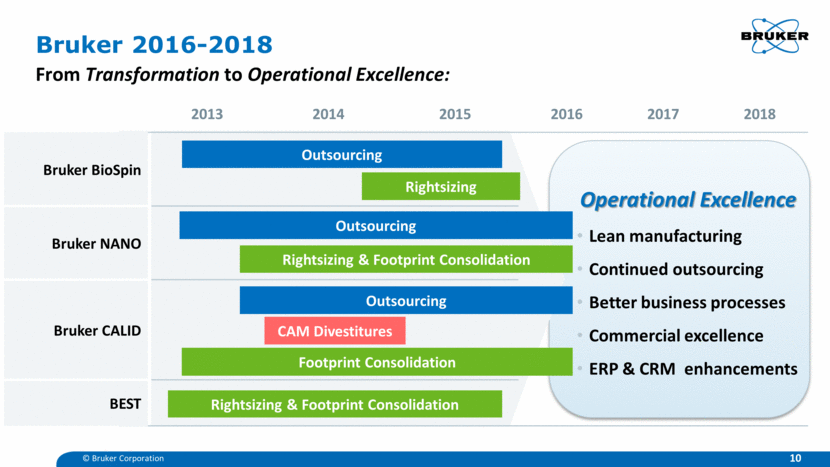
Bruker 2016-2018 From Transformation to Operational Excellence: 2013 2014 2015 2016 2017 2018 Bruker BioSpin Operational Excellence Lean manufacturing Continued outsourcing Better business processes Commercial excellence ERP & CRM enhancements Bruker NANO Bruker CALID BEST Outsourcing Rightsizing Rightsizing & Footprint Consolidation Outsourcing CAM Divestitures Rightsizing & Footprint Consolidation Outsourcing Footprint Consolidation 10 © Bruker Corporation
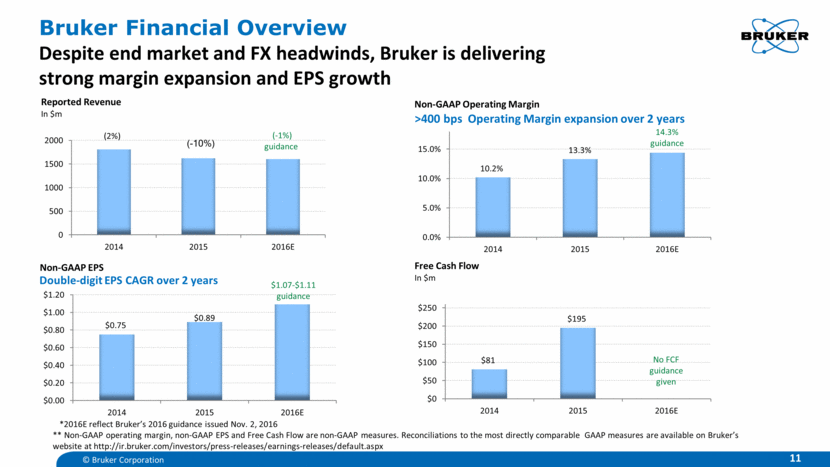
Bruker Financial Overview Despite end market and FX headwinds, Bruker is delivering strong margin expansion and EPS growth 11 *2016E reflect Bruker’s 2016 guidance issued Nov. 2, 2016 No FCF guidance given >400 bps Operating Margin expansion over 2 years © Bruker Corporation Double-digit EPS CAGR over 2 years ** Non-GAAP operating margin, non-GAAP EPS and Free Cash Flow are non-GAAP measures. Reconciliations to the most directly comparable GAAP measures are available on Bruker’s website at http://ir.bruker.com/investors/press-releases/earnings-releases/default.aspx 10.2% 13.3% 14.3% guidance 0 0.2 0.4 0.6 0.8 1 1.2 0.0% 5.0% 10.0% 15.0% 2014 2015 2016E Non - GAAP Operating Margin $81 $195 0 0.2 0.4 0.6 0.8 1 1.2 $0 $50 $100 $150 $200 $250 2014 2015 2016E Free Cash Flow In $m $0.75 $0.89 $ 1.07 - $1.11 guidance 0 0.2 0.4 0.6 0.8 1 1.2 $0.00 $0.20 $0.40 $0.60 $0.80 $1.00 $1.20 2014 2015 2016E Non - GAAP EPS
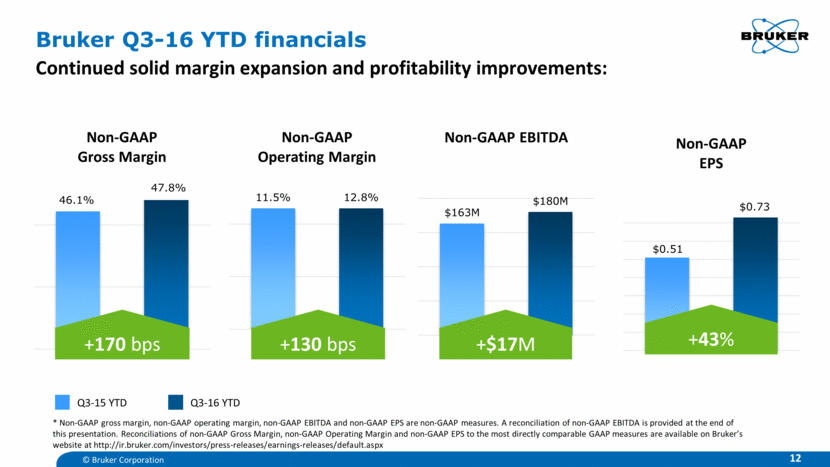
Bruker Q3-16 YTD financials Continued solid margin expansion and profitability improvements: +170 bps +130 bps +43% +$17M Q3-15 YTD Q3-16 YTD 12 © Bruker Corporation * Non-GAAP gross margin, non-GAAP operating margin, non-GAAP EBITDA and non-GAAP EPS are non-GAAP measures. A reconciliation of non-GAAP EBITDA is provided at the end of this presentation. Reconciliations of non-GAAP Gross Margin, non-GAAP Operating Margin and non-GAAP EPS to the most directly comparable GAAP measures are available on Bruker’s website at http://ir.bruker.com/investors/press-releases/earnings-releases/default.aspx 46.1% 47.8% Non - GAAP Gross Margin 11.5% 12.8% Non - GAAP Operating Margin $0.51 $ 0.73 Non - GAAP EPS $163M $180M Non - GAAP EBITDA
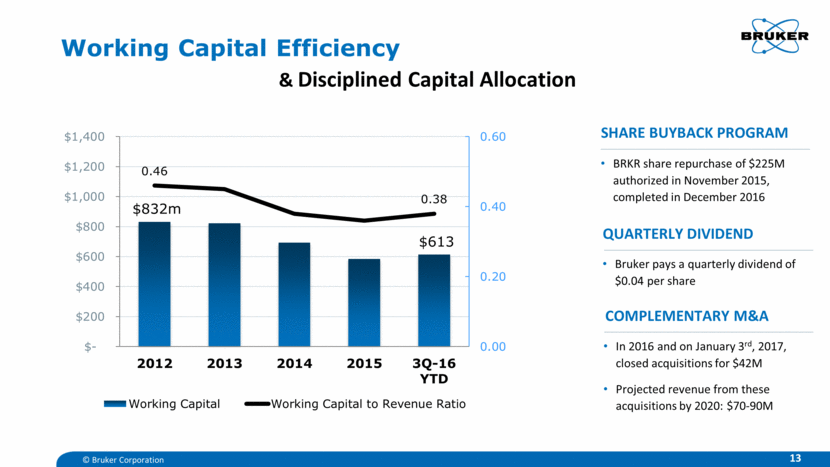
Working Capital Efficiency & Disciplined Capital Allocation 13 SHARE BUYBACK PROGRAM BRKR share repurchase of $225M authorized in November 2015, completed in December 2016 QUARTERLY DIVIDEND Bruker pays a quarterly dividend of $0.04 per share COMPLEMENTARY M&A In 2016 and on January 3rd, 2017, closed acquisitions for $42M Projected revenue from these acquisitions by 2020: $70-90M © Bruker Corporation
14 II. Bruker Strategy for Profitable Growth High-impact innovation and new high-margin products Entry into new or adjacent markets Service, Consumables & After-Market business Operational & Commercial Excellence Complementary, financially disciplined M&A © Bruker Corporation
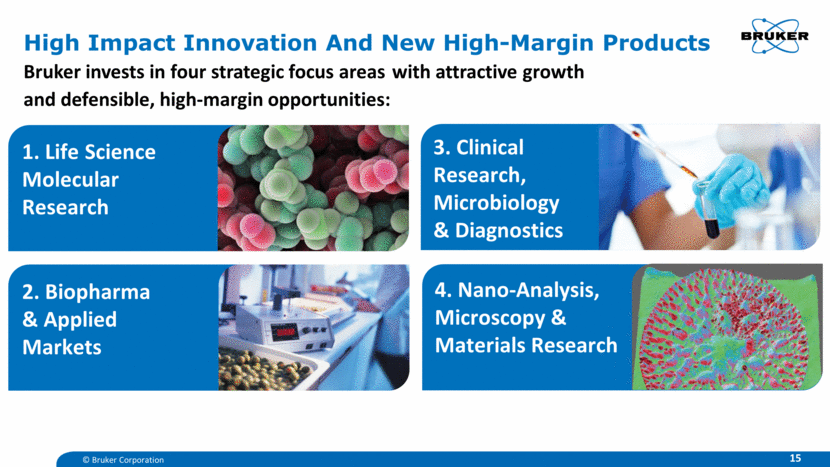
High Impact Innovation And New High-Margin Products Bruker invests in four strategic focus areas with attractive growth and defensible, high-margin opportunities: 1. Life Science Molecular Research 2. Biopharma & Applied Markets 4. Nano-Analysis, Microscopy & Materials Research 3. Clinical Research, Microbiology & Diagnostics 15 © Bruker Corporation
16 © Bruker Corporation Key technology to study IDP biological function UHF-NMR expanding to up to 200 kDa globular proteins in structural biology With >100 kHz MAS probes enabling breakthrough in membrane protein research First actively-shielded 1 GHz UHF-NMR at U. Bayreuth Very high TIMS mobility resolution (>200), coupled with Bruker’s ultra-high performance ESI-QTOFs TIMS is game-changing technology for MS-based phenomics and higher-throughput clinical proteomics Ultra-high field NMR for structural biology and Intrinsically Disordered Proteins (IDPs) timsTOFTM next-gen Trapped Ion Mobility QTOF High Impact Innovation Life Science Molecular Research
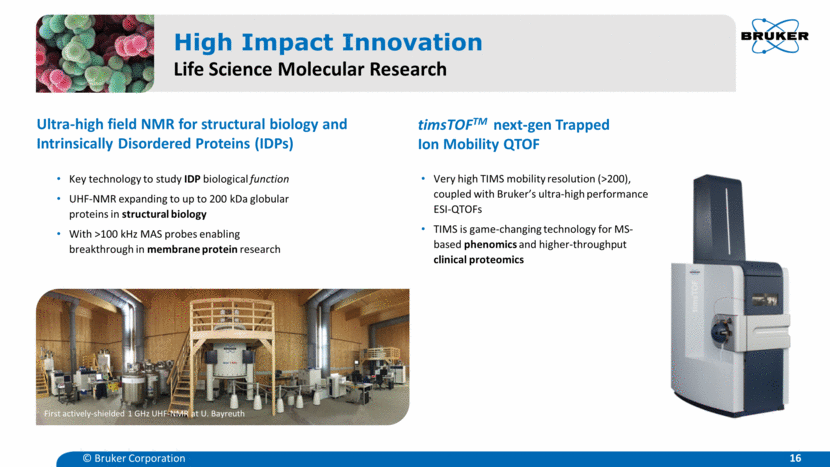
17 © Bruker Corporation Label-free ultra-high throughput MS- screening for primary screens on millions of compounds in pharma drug discovery First MS to offer speed, specificity and robustness for pharma primary screens Accelerates drug discovery rapifleX MALDI PharmaPulse™ rapifleX MALDI with unique 10 kHz laser is enabling technology for MS Imaging in pathology translational research MALDI TissueTyper NMR FoodScreeners Bruker NMR, MS and FT-IR/NIR instruments are critical to quality, authenticity and safety testing in food analysis NMR HoneyScreener™ and NMR WineScreener™: detect and quantify many ingredients in short, automated, high-value and low-cost analyses Recent microEPR acquisition: compact QC systems for beer flavor stability and food dosimetry High Impact Innovation Biopharma & Applied Markets
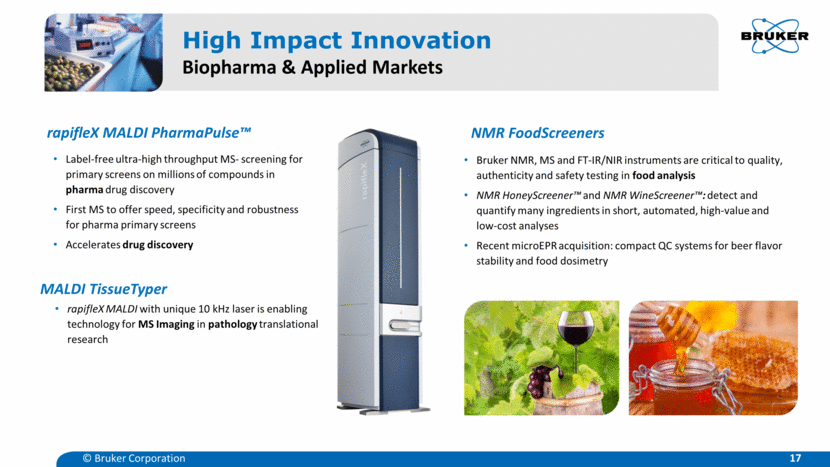
18 © Bruker Corporation Clinical Microbiology Phenomics by NMR NMR for translational phenomics research International Phenome Center Network (IPCN) launched in 2016 with Bruker as key NMR partner Phenomics is expected to grow rapidly in the next decade in clinical research and in diagnostic use High Impact Innovation Clinical Research, Microbiology & Diagnostics Bruker pioneered MALDI Biotyper to identify bacteria, yeasts and fungi more accurately and with short time-to-result Global installed base ~2,300 systems Roadmap for MALDI Biotyper: ID ‘gold standard’, ID from BC+ in sepsis, antibiotic resistance/susceptibility, syndromic panels Recent PCR assay, biology consumables and software acquisitions key for next wave of microbiology growth
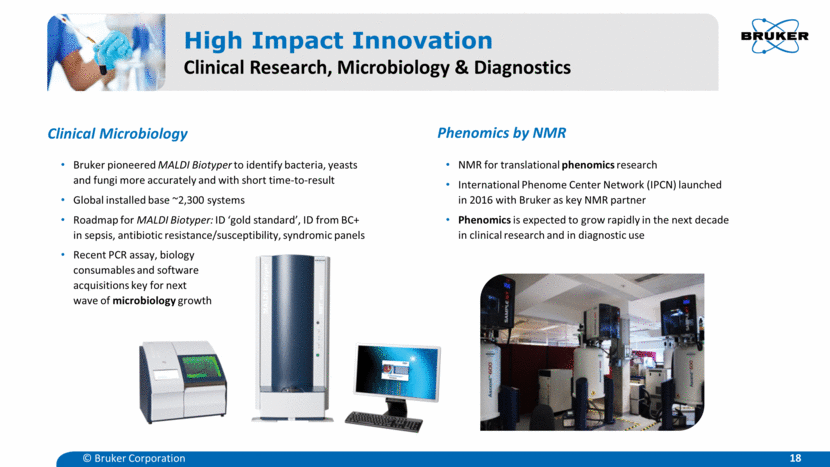
19 © Bruker Corporation Next-gen Optogenetics & Super-Resolution Cell Microscopy Next-gen X-Ray Semiconductor Metrology Simultaneous, all-optical stimulation and imaging platforms for neuroscience research Multi-cell brain research: decode neural connectivity and networks Fastest and deep 3D super-resolution microscopy for live-cell research Chip & memory makers require next-gen nano-metrology tools to ensure yield and quality Bruker next-gen AFM and X-ray metrology tools are key for advanced nodes and new 3D chip structures Mouse spermatocyte courtesy of Jackson Labs High Impact Innovation Nano-Analysis, Microscopy & Materials Research
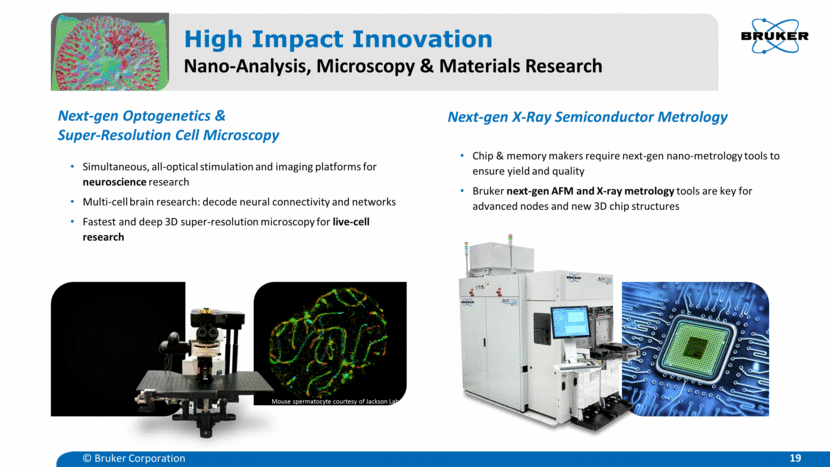
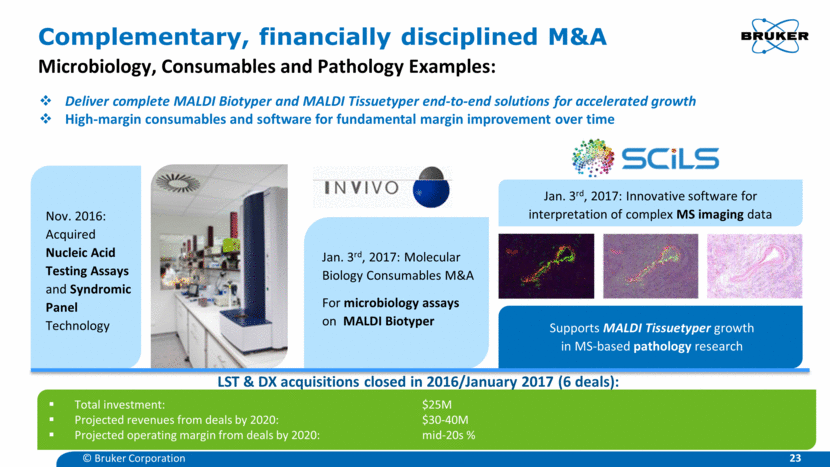
20 Expanding into Adjacent Markets I. FOCUS ON PHARMA: NMR, MASS SPEC & FT-IR II. CLINICAL MICROBIOLOGY ROADMAP IV. ENTRY INTO NEXT-GEN SEMICON METROLOGY III. BRUKER EXPLOSIVES TRACE DETECTION (ETD) ID ‘gold standard’ Resistance & AST Syndromic Panels 10 nm semiconductor manufacturing 7 nm (5 nm) node X-ray metrology validation Unique AFM & X-Ray metrology solutions Next-generation benchtops for airport security, e.g. at FRA airport High performance handheld ETD system for borders, ports, etc. Future ETD technologies under development for US DHS NMR & HRAM MS combined FUSION solution MALDI PharmaPulse UHTS Fragment-based drug discovery by NMR NMR Reaction Monitoring Antibody QC by QTOF PAT by FT-IR/NIR HOS for Biologics © Bruker Corporation ID from positive BC in Sepsis
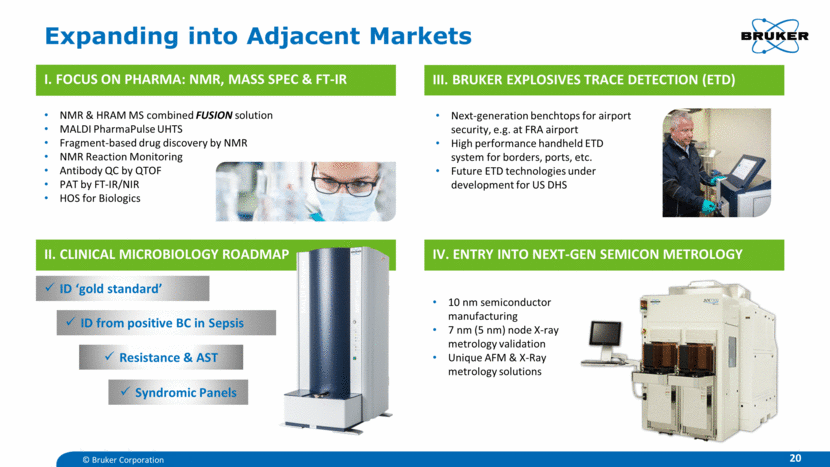
21 Grow After-Market Business Services, Consumables and Software Focus on After-Market revenue CALID BIOSPIN CALID NANO © Bruker Corporation Focus on Service 200 250 300 350 400 450 2013 2014 2015 2016E $ millions
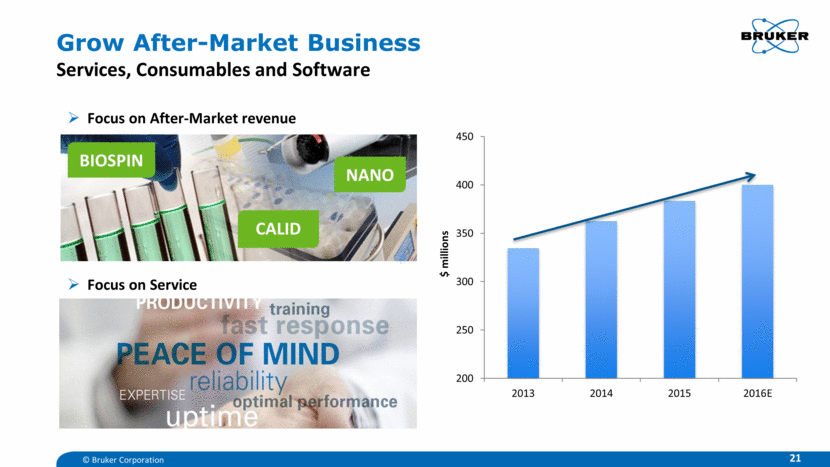
New marketing systems and analytics Key account management Improved pricing and discounting practices CRM roll out on-going New sales force capabilities Lean factories and further outsourcing Global procurement and logistics 22 © Bruker Corporation Operational & Commercial Excellence Strengthen ERP/CRM, Commercial/Operational Processes and Order Execution
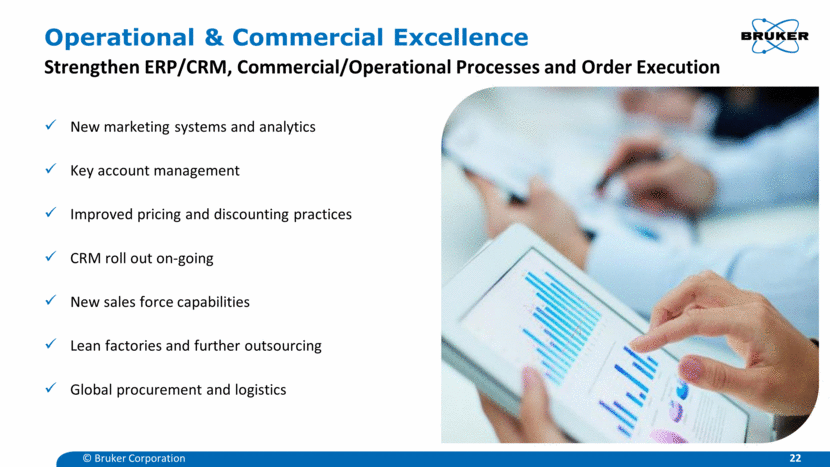
23 © Bruker Corporation Complementary, financially disciplined M&A Microbiology, Consumables and Pathology Examples: Nov. 2016: Acquired Nucleic Acid Testing Assays and Syndromic Panel Technology Total investment: $25M Projected revenues from deals by 2020: $30-40M Projected operating margin from deals by 2020: mid-20s % Deliver complete MALDI Biotyper and MALDI Tissuetyper end-to-end solutions for accelerated growth High-margin consumables and software for fundamental margin improvement over time Jan. 3rd, 2017: Molecular Biology Consumables M&A For microbiology assays on MALDI Biotyper Jan. 3rd, 2017: Innovative software for interpretation of complex MS imaging data Supports MALDI Tissuetyper growth in MS-based pathology research LST & DX acquisitions closed in 2016/January 2017 (6 deals):
Key 2017 Messages & Long-Term Goals 1. Bruker is a differentiated leader in attractive markets for analytical, life science and diagnostic tools, and our brand stands for innovation: Market leader in unique, high value technologies: NMR, MALDI-TOF, MALDI BioTyper, FTMS, AFM, XRD & Superconductors Major growth opportunities: Phenomics, Proteomics, Biopharma, Food Analysis, Microbiology, Neuroscience, Structural Biology/IDPs, Next-Gen Semicon Metrology 2. We expect to accelerate revenue growth: European demand appears to have stabilized in H2-16, and we expect, at a minimum, significantly less European headwinds in 2017 We expect to grow approximately at the LST & DX market growth rates (including some growth from M&A in 2017) 3. We will leverage our transformation to continue our margin expansion: Cumulative >400 bps operating margin expansion delivered in 2015-2016E Goal to expand operating margin on average by 75-100 bps annually over a multi-year timeframe 4. We aim for high ROIC by investing internally in high-value product innovation and our entry into new markets, complemented by disciplined M&A. 24 © Bruker Corporation
© Bruker Corporation www.bruker.com 25
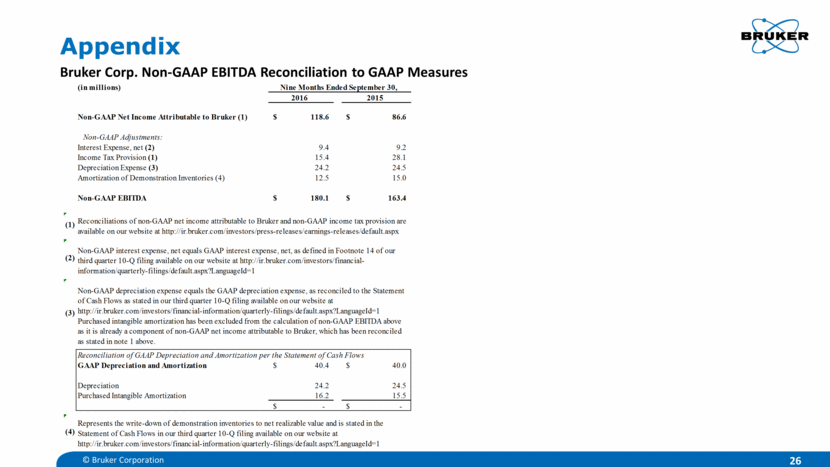
Appendix Bruker Corp. Non-GAAP EBITDA Reconciliation to GAAP Measures 26 © Bruker Corporation (in millions) 2016 2015 Non-GAAP Net Income Attributable to Bruker (1) 118.6 $ 86.6 $ Non-GAAP Adjustments: Interest Expense, net (2) 9.4 9.2 Income Tax Provision (1) 15.4 28.1 Depreciation Expense (3) 24.2 24.5 Amortization of Demonstration Inventories (4) 12.5 15.0 Non-GAAP EBITDA 180.1 $ 163.4 $ (1) (2) (3) Reconciliation of GAAP Depreciation and Amortization per the Statement of Cash Flows GAAP Depreciation and Amortization 40.4 $ 40.0 $ Depreciation 24.2 24.5 Purchased Intangible Amortization 16.2 15.5 - $ - $ (4) Nine Months Ended September 30, Reconciliations of non-GAAP net income attributable to Bruker and non-GAAP income tax provision are available on our website at http://ir.bruker.com/investors/press-releases/earnings-releases/default.aspx Non-GAAP depreciation expense equals the GAAP depreciation expense, as reconciled to the Statement of Cash Flows as stated in our third quarter 10-Q filing available on our website at http://ir.bruker.com/investors/financial-information/quarterly-filings/default.aspx?LanguageId=1 Purchased intangible amortization has been excluded from the calculation of non-GAAP EBITDA above as it is already a component of non-GAAP net income attributable to Bruker, which has been reconciled as stated in note 1 above. Non-GAAP interest expense, net equals GAAP interest expense, net, as defined in Footnote 14 of our third quarter 10-Q filing available on our website at http://ir.bruker.com/investors/financial- information/quarterly-filings/default.aspx?LanguageId=1 Represents the write-down of demonstration inventories to net realizable value and is stated in the Statement of Cash Flows in our third quarter 10-Q filing available on our website at http://ir.bruker.com/investors/financial-information/quarterly-filings/default.aspx?LanguageId=1
