Attached files
| file | filename |
|---|---|
| EX-99.1 - EX-99.1 - U.S. CONCRETE, INC. | d302503dex991.htm |
| 8-K - 8-K - U.S. CONCRETE, INC. | d302503d8k.htm |
Exhibit 99.2
Unless the context otherwise requires or indicates, all references to “U.S. Concrete,” “USCR,” the “Company,” “we,” “our” and “us” refer to U.S. Concrete, Inc., a Delaware corporation, and its subsidiaries.
Our company
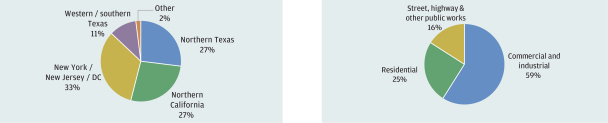
We are a leading producer of ready-mixed concrete in select geographic markets in the United States. We operate our business through two primary reportable segments: ready-mixed concrete and aggregate products. Ready-mixed concrete is an important building material that is used in the vast majority of commercial, residential and public works construction projects. Aggregates are a raw material used in the production of ready-mixed concrete. We serve substantially all end markets of the construction industry in our select geographic markets. Our customers include contractors for commercial and industrial, residential, street and highway and other public works construction. Our ready-mixed concrete segment’s revenue by end market for the twelve months ended September 30, 2016 was approximately 59% commercial and industrial, 25% residential and 16% street, highway and other public works.
We operate principally in northern Texas, western / southern Texas, northern California and the New York / New Jersey / Washington, D.C. area, with those markets representing approximately 27%, 11%, 27% and 33%, respectively, of our consolidated revenue for the twelve months ended September 30, 2016. We believe we are well-positioned for strong growth in these attractive regions. According to estimates from the Portland Cement Association (“PCA”), the states in which we operate represent a total of approximately 27% of the 2015 consumption of ready-mixed concrete in the United States, which favorably positions us to capture additional market share in this fragmented industry. Our consolidated revenue from continuing operations for the twelve months ended September 30, 2016 was $1,113.0 million, of which we derived approximately 90.6% from our ready-mixed concrete segment, 3.6% from our aggregate products segment (excluding $33.5 million sold internally) and 5.8% from our other operations. For the twelve months ended September 30, 2016, our net income was $18.2 million, our income from continuing operations was $18.6 million, and our Adjusted EBITDA (as defined herein) was $146.4 million, of which we derived approximately 78% from our ready-mixed concrete operations, net of corporate allocations, 21% from our aggregate products operations and other operations related to aggregate products (including hauling operations, aggregates distribution, recycled aggregates, and lime slurries), net of intercompany eliminations and corporate allocations, and 1% from other operations, net of corporate allocations. See “Summary financial and other data” for a reconciliation of Adjusted EBITDA to income (loss) from continuing operations.
1
| Revenue by region (LTM 9/30/16)
|
Ready-mixed revenue by end market (LTM 9/30/16)
| |
| ||
As of September 30, 2016, we operated 154 standard ready-mixed concrete plants, 16 volumetric ready-mixed concrete facilities, 15 producing aggregates facilities, three aggregates distribution terminals, two lime slurry facilities and one recycled aggregates facility. During the twelve months ended September 30, 2016, these plants and facilities produced approximately 7.8 million cubic yards of ready-mixed concrete and 5.3 million tons of aggregates. We lease two other aggregates facilities to third parties and retain a royalty on production from those facilities. As of September 30, 2016, we operated 1,590 drum mixer trucks and 125 volumetric mixer trucks.
Our business
Our ready-mixed concrete segment engages principally in the formulation, production and delivery of ready-mixed concrete to our customers’ job sites. We provide our ready-mixed concrete from our operations in Texas, northern California, New York, New Jersey, the Washington, D.C. area, Oklahoma and the U.S. Virgin Islands (“USVI”). Ready-mixed concrete is a highly versatile construction material that results from combining coarse and fine aggregates, such as gravel, crushed stone and sand, with water, various chemical admixtures and cement. We also provide services intended to reduce our customers’ overall construction costs by lowering the installed, or “in-place,” cost of concrete. These services include the formulation of mixtures for specific design uses, on-site and lab-based product quality control and customized delivery programs to meet our customers’ needs. We generally do not provide paving or other finishing services, which construction contractors or subcontractors typically perform.
Our standard ready-mixed concrete products consist of proportioned mixes we produce and deliver in an unhardened plastic state for placement and shaping into designed forms at the job site. Selecting the optimum mix for a job entails determining not only the ingredients that will produce the desired permeability, strength, appearance and other properties of the concrete after it has hardened and cured, but also the ingredients necessary to achieve a workable consistency considering the weather and other conditions at the job site.
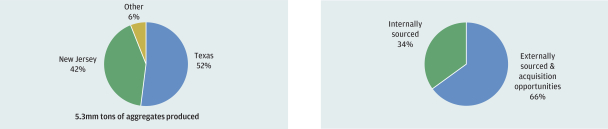
Our aggregate products segment produces crushed stone, sand and gravel from 15 aggregates facilities located in New Jersey, Texas, Oklahoma and the USVI. We sell these aggregates for use in commercial, industrial and public works projects, as well as consume them internally in the production of ready-mixed concrete. We produced approximately 5.3 million tons of aggregates during the twelve months ended September 30, 2016, with Texas representing 52% and New Jersey representing 42% of the total production. We consumed 51% of our aggregates production internally and sold 49% to third-party customers during the same period. We believe our aggregates reserves provide us with additional raw materials sourcing flexibility and supply availability. In addition, we own sand pit operations in Michigan and one quarry in western Texas, both of which we lease to third parties and for which we receive royalties based on the volumes produced and sold during the terms of the leases.
2
Other products not associated with a reportable segment include our building materials stores, hauling operations, aggregates distribution terminals, lime slurry, ARIDUS® Rapid Drying Concrete technology, brokered product sales, recycled aggregates operation and concrete blocks.
We operate in select geographic markets and pursue attractive construction material categories where we have leading market positions. We maintain these positions by focusing on commercial projects with higher margins and by vertically integrating our operations, where practical. We also differentiate ourselves through our leadership in innovating new sustainable concrete building materials. We believe our focus on select geographic markets with favorable industry dynamics, disciplined pricing, accretive acquisitions and prudent balance sheet leverage distinguishes us from our competition and results in superior margin performance and industry-leading returns on capital.
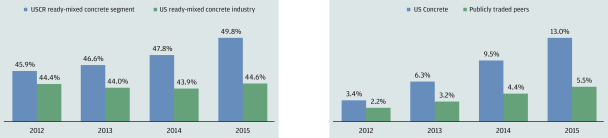
| Superior margin performance (material spread margin)
|
Industry-leading returns on capital
| |
| ||
Source: National Ready Mixed Concrete Association (“NRMCA”), CapIQ and management estimates
Note: Material spread margin defined as (revenue—raw material costs) / revenue; return on capital defined as net operating profit after taxes / average of beginning and ending debt and book equity; publicly traded peers consist of Martin Marietta Materials, Summit Materials and Vulcan Materials.
Competitive strengths
| Top 3 positions in favorable geographic markets with attractive fundamentals. We operate in favorable construction markets where we believe we have an advantage compared to our competitors given our ability to handle complex projects across a broad array of industry sectors. We have a large, high-quality asset base focused in the Texas/Oklahoma, northern California, New York/New Jersey, Washington, D.C. and USVI markets. Our management team believes we have a leading market position in all of our geographic markets, and estimates our overall market share based on cubic yards of volume of concrete produced in our key regions during the twelve months ended September 30, 2016 is approximately 30%. |
Market | Position | ||||
| New York Metro Area | #1 | |||||
| Western Texas | #1 | |||||
| U.S. Virgin Islands | #1 | |||||
| San Francisco Bay Area | #1(Tie) | |||||
| Dallas | Top 2 | |||||
| Washington, D.C. Area | Top 3 | |||||
|
Note: Based on management estimates of cubic yards volume for the twelve months ended September 30, 2016 after giving pro-forma effect to acquisitions through September 30, 2016. |
| |||||
As of September 30, 2016, our high-quality asset base was comprised of 82 ready-mixed concrete plants, 16 volumetric ready-mixed concrete plants and nine aggregates facilities in Texas / Oklahoma, 22 ready-mixed concrete plants in northern California, 46 ready-mixed concrete plants, four aggregates facilities, three aggregates distribution terminals and one recycled aggregates facility in New York / New Jersey / Washington, D.C., four ready-mixed concrete plants and two aggregates facilities in the USVI; as well as 1,590 operated drum mixer trucks and 125 operated volumetric mixer trucks. We believe the scale and quality of our asset base, in addition to our product differentiation, on-time deliveries, competitive all-in delivered cost, servicing and
3
reliability differentiate us. These advantages also allow us to meet the needs of both large and small jobs for a wide range of clients in multiple end markets and to continue building market share in each of our regions through superior performance and customer service.
In addition to operating in geographic markets in which we believe we are well-positioned compared to our competitors, we focus on higher margin commercial and industrial construction, which represented 59% of our ready-mixed concrete segment’s revenue for the twelve months ended September 30, 2016. Residential construction represented 25% of ready-mixed concrete segment’s revenue for the twelve months ended September 30, 2016, while street, highway and other public works construction represented 16% of our ready-mixed concrete segment’s revenue for the same period. According to FMI Corp., as of September 30, 2016, spending in all of our end markets is projected to grow over the next four years: from 2016 through 2020, non-residential building construction is expected to grow at a compound annual growth rate (“CAGR”) of approximately 3.8%, commercial office and retail building construction is expected to grow at a CAGR of approximately 2.7%, residential construction is expected to grow at a CAGR of approximately 3.1% and highway and street construction is expected to grow at a CAGR of approximately 2.2%. Additionally, continued growth in annual new non-residential construction is projected in all of our regional markets. According to Dodge Data and Analytics, annual new non-residential construction is expected to grow at a CAGR from 2015 through 2019 of approximately 3.8% in the San Francisco Metropolitan Statistical Area (“MSA”), approximately 2.6% in the Dallas-Fort Worth MSA, approximately 4.1% in the New York City MSA and approximately 3.0% in the Washington, D.C. MSA. Growth in our northern Texas market is largely driven by construction demand in the transportation, financial and other professional services and manufacturing sectors; growth in our northern California market is driven largely by the technology sector; and growth in our New York / New Jersey and Washington, D.C. markets is driven by the financial services and government sectors, respectively. We believe that our better-than-average growth is driven by key industry sectors within our markets, which generally benefit from year-round construction. Furthermore, we believe that our specific geographic markets currently exhibit healthy residential trends supported by a number of factors, including population growth, decreasing unemployment, low mortgage and other interest rates, rising home prices and increasing construction activity. According to the U.S. Census Bureau Building Permits Survey from 2014 to 2015, in the aggregate, the number of building permits in our markets grew 42.4% compared to 11.3% for the national average. As of December 2016, the National Association of Home Builders projects national housing starts to grow at a CAGR of approximately 5.9% from 2015 through 2017. According to Global Insight, as of November 2016, private, single-family housing starts are expected to grow at a CAGR from 2015 to 2019 of approximately 14.7% in California, 5.1% in Texas, 2.3% in New York/New Jersey and 9.2% in the Washington, D.C. area (including Virginia and Maryland).
Long-term diversified customer base across sectors and regions. We serve a diversified base of customers. Our management and sales personnel develop and maintain successful long-term relationships with our key customers. Key elements of our customer-focused approach include:
| • | corporate-level marketing and sales expertise; |
| • | technical service expertise to develop innovative new branded products; and |
| • | training programs that emphasize successful marketing and sales techniques that focus on the sale of high-margin concrete mix designs. |
We estimate that the average length of our top 15 customer relationships is approximately 20 years. We further estimate that approximately 80% of our top 35 customers have relationships that extend past five years, with approximately 29% surpassing 20 years of loyalty. Our customer engagement model results in contractors
4
returning year-after-year to us as a supplier they can trust. Despite our robust and loyal customer base, in the twelve months ended September 30, 2016, no single customer or project accounted for more than 5% of our consolidated revenue and the 15 largest customers accounted for approximately 19% of our consolidated revenue. Our broad, yet targeted customer base enables us to develop an efficient and stable business model. We believe that by providing high-quality, reliable services and customized products and solutions, we are able to maintain important long-term relationships.
Top supplier to commercial projects with high margins. We provide alternative solutions for designers and contractors by offering value-added concrete products, such as color-conditioned, fiber-reinforced, steel-reinforced and high-performance concrete. We believe this innovation enhances our ability to compete for and win supply contracts for some of the largest and most prestigious commercial projects.
Some of the larger commercial projects we are working on include:
Selected precedent commercial projects
| Project | Location | Cubic Yards | Status | |||||||
| LaGuardia Airport |
Queens, New York | 350,000 | In Progress | |||||||
| Toyota North American Headquarters |
Plano, Texas | 140,000 | In Progress | |||||||
| The Union Tower |
Dallas, Texas | 110,000 | In Progress | |||||||
| Facebook NA-4 Data Center |
Fort Worth, Texas | 100,000 | In Progress | |||||||
| San Antonio Village |
Mountain View, California | 100,000 | In Progress | |||||||
| 5 Pointz |
Long Island City, Queens, NY | 90,000 | In Progress | |||||||
| Dallas Love Field Parking Garage |
Dallas, Texas | 80,000 | In Progress | |||||||
| Legacy West |
Plano, Texas | 80,000 | In Progress | |||||||
| The Wharf |
Washington, D.C. | 77,000 | In Progress | |||||||
| 655 NY Avenue |
Washington, D.C. | 71,000 | In Progress | |||||||
| Manhattan West Tower |
Manhattan, New York | 70,000 | In Progress | |||||||
| Workday Campus |
Pleasanton, CA | 70,000 | In Progress | |||||||
Note: LaGuardia Airport was a joint venture with two other suppliers
These types of projects have higher margins due to rigorous specifications, increased complexity, high customization requirements and significant volume capacity needs. We believe our focus on commercial projects and value-added construction materials has resulted in a favorable margin profile and premium price position that are among the highest in the industry today.
5
Favorable margin profile and premium price position lead the industry
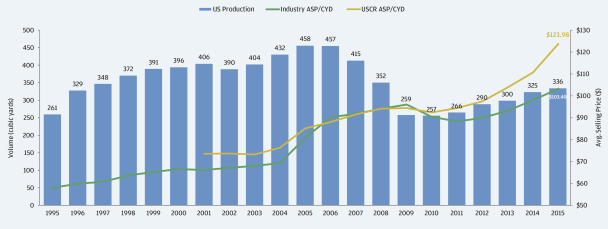
Source: U.S. production and industry average selling price (“ASP”) / cubic yard (“CYD”) data from NRMCA.
We also make a concerted effort to focus on environmental sustainability. We are a leader in the sustainable concrete market, and we expect domestic and global sustainable demand to continue to grow at attractive rates. According to the U.S. Green Building Council’s Green Building Economic Impact Study dated September 2015, commercial green construction spending is expected to grow at a CAGR of approximately 9.8% from 2015 to 2018. In 2008, we launched our environmentally friendly concrete (“EF Technology”) initiative which promotes green building and construction. Our EF Technology ready-mixed concrete products replace a portion of the traditional cement components with reclaimed fly ash, slag and other materials, resulting in lower carbon dioxide emissions. We believe this technological approach leads to an environmentally superior and sustainable alternative to traditional ready-mixed concrete for our customers’ consumption. We believe EF Technology reduces greenhouse gases and landfill space consumption and produces a highly durable product. Customers can also receive Leadership in Energy and Environmental Design (“LEED”) credits for the use of this technology.
We believe our use of technology creates a competitive advantage over smaller concrete producers and larger vertically integrated aggregates and cement companies that do not focus on technology as a first solution. We are positioned to take advantage of the growing demand for these products, which could result in an increase in our revenue and profits and expansion of our operating margins, as these higher-priced, value-added products are a lower-cost alternative to cement. We are a charter member of the Carbon Leadership Forum and the first ready-mixed concrete company in North America to adopt and receive verified Environmental Product Declarations for our concrete mixes. We are also a supporter of the NRMCA Green-Star program, a plant-specific certification program that utilizes an environmental management system based on a model of continual improvement.
Vertical integration into aggregates enhances the value chain. Our aggregates business’ primary focus is supplying our ready-mixed operations. This vertical integration helps generate higher overall corporate margins, which is a key reason we have focused on the acquisition of aggregates operations. We currently own 15 aggregates production facilities, one recycling operation and three aggregates distribution terminals. We currently have over 130 million tons of owned and leased reserves. We believe vertical integration enhances our competitiveness and confers a strategic advantage by providing us with a stable supply of aggregates products, improving our overall purchasing power and increasing our precision in bidding for new projects. Our focus on vertical integration has allowed us to source approximately 34% of the aggregates used in our ready-mix
6
concrete during the twelve months ended September 30, 2016 from internal production in the markets where we have aggregates reserves (i.e., New York, New Jersey and Texas). This internal sourcing has helped enhance our value chain and associated margins.
| Aggregates production by geography (twelve months ended September 30, 2016)
|
Aggregates used in ready-mixed operations (twelve months ended September 30, 2016)
| |
| ||
Note: Aggregates used in ready-mixed operations are from regions where USCR has aggregates production.
Successful track record of accretive acquisitions with significant consolidation pipeline. We have completed 23 ready-mixed concrete and aggregates acquisitions since January 1, 2014, and believe that sourcing, executing and integrating acquisitions is one of our core competencies. Our acquisitions have accelerated our Adjusted EBITDA growth evidenced by our having earned approximately 29% of our Adjusted EBITDA for the twelve months ended September 30, 2016 from businesses acquired since 2014.
Recent acquisitions
| Company | Location | Date | Description | |||
| Kings Ready Mix | Brooklyn, NY | Aug. 2016 | • Four ready-mixed concrete plants and 62 mixer trucks
• Strengthened position in New York metropolitan area | |||
| Jenna Concrete Corp. |
Bronx, NY | Aug. 2016 | • Two ready-mixed concrete plants and 52 mixer trucks
• Further expanded geographic coverage in Manhattan market and established footprint in the Bronx borough | |||
| NYCON Supply Corp. |
Queens, NY | June 2016 | • Two ready-mixed concrete plants and 38 mixer trucks
• Expanded position in western Queens and midtown Manhattan area | |||
| Greco Brothers Concrete |
Brooklyn, NY | Feb. 2016 | • Two ready-mixed concrete plants and 37 mixer trucks
• Strengthened position in New York metropolitan area | |||
|
| ||||||
7
| Company | Location | Date | Description | |||
| Heavy Materials |
St. Thomas / St. Croix, USVI |
Oct. 2015 | • Three ready-mixed concrete plants, one concrete block plant and 32 mixer trucks
• Vertically integrated with two aggregates quarries; approximately 40 million tons of reserves and export capability | |||
| Spartan Concrete Products |
St. Croix, USVI | Oct. 2015 | • One ready-mixed concrete plant and 16 mixer trucks
• Vertically integrated St. Croix with Heavy Materials aggregates supply | |||
| Wantage Stone |
Wantage, NJ | Sep. 2015 | • Single site quarry
• Furthered vertical integration in our New York and New Jersey operations | |||
| E & A Materials |
Wichita Falls, TX | Aug. 2015 | • Two sand and gravel facilities
• Vertically integrated operations around Wichita Falls and southern Oklahoma | |||
| DuBrook Concrete |
Chantilly, VA | May 2015 | • Three ready-mixed concrete plants and 42 mixer trucks
• Expanded Washington, D.C. metro footprint into northern Virginia | |||
| Ferrara Bros. |
New York, NY | Apr. 2015 | • Six ready-mixed concrete plants and 89 mixer trucks in NYC
• Expanded service coverage in Manhattan | |||
|
| ||||||
Depending on the size of a potential acquisition opportunity, our acquisition strategy may vary. For local opportunities, we focus on expanding within our existing markets through concrete bolt-on acquisitions and vertical integration into aggregates. For regional opportunities, we focus on expanding concentrically around our existing geographic regions. For national opportunities, we focus on selected larger-scale opportunities in new geographies that have strong, stable markets with promising growth profiles, appealing market structures and defensible positions of scale. This acquisition strategy has resulted in a successful acquisition track record and a significant consolidation pipeline. We have demonstrated our ability to increase market share, vertically integrate operations, enhance margins and generate attractive returns through a focused and disciplined acquisition strategy.
Financial performance and conservative balance sheet. We have successfully improved our financial performance by refocusing our financial objectives over the last five years. Our management team has extensive experience in the industry, as does our board of directors. Our management team has focused on reducing our cost structure, while expanding our existing and acquired businesses in our core geographic regions to drive strong performance. As a result, we have grown revenue, improved profit margins and increased liquidity during the last five years. In addition to cash on hand, we benefit from significant liquidity
8
through our Revolving Facility and cash flow from operations. We believe our conservative balance sheet and liquidity will allow us to take advantage of strategic opportunities as well as provide ample cushion against general downturns in economic activity.
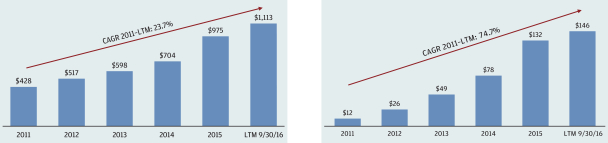
| Revenue (in millions)
|
Adjusted EBITDA from continuing operations (in millions)
| |
| ||
Experienced management team driving sustainable business improvement. Our senior management team consists of twelve executives with an average of 25 years of industry experience and is comprised of individuals with a proven track record in the construction materials industry. Our Chief Executive Officer, William J. Sandbrook, has approximately 24 years of experience in the construction materials industry. Our management team’s deep market knowledge enables us to effectively assess new opportunities to grow our business.
Since 2011, our management team has repositioned the Company with a focus on higher margin products, attractive markets and added scale through acquisitions. Following the economic downturn that occurred between 2007 and 2009, the Company actively exited low-quality geographic markets and products which included concrete block, precast and ready-mixed in Delaware, Detroit and Tennessee. The management team successfully navigated the Company following the housing crisis and transformed the profitability of the business, increasing our Adjusted EBITDA from $11.9 million for the year ended December 31, 2011 to $146.4 million for the twelve months ended September 30, 2016. This growth was achieved by contributions from ready-mixed and aggregates acquisitions, organic volume growth in our ready-mixed concrete and aggregate products segments and price and margin improvement in our ready-mixed operations.
Our margin improvement since 2011 is the result of both an increase in our ready-mixed concrete pricing and an increase in our material spread margin. Our average price per cubic yard of ready-mixed concrete was approximately $20 more than the industry average in 2015. This favorable price differential represents an improvement in our pricing since 2009 when our average price was in-line with the industry average. In addition, our material spread margin increased to approximately $63/cubic yard in the twelve months ended September 30, 2016, an increase of approximately $20/cubic yard from the 2009 level of approximately $43/cubic yard. Given our superior margin profile, we believe we are better positioned to withstand declines in the economic cycle than in the past.
We believe we are well-positioned to capitalize on additional growth in our geographic locations and selected end markets. Our management is focused further on improving the business and recruiting and retaining motivated and knowledgeable professional managers to continue to develop our business and maintain our leading market position.
9
Company strategy
Focus on core operations. We believe the best opportunities for future growth lie within our core ready-mixed concrete and aggregate products segments. During 2015, we divested the last of our precast businesses so as to continue our focus on ready-mixed concrete and aggregates. We will continue to invest in our business, both in physical plants and new technologies, as well as continue to evaluate both organic and strategic acquisition opportunities. We believe our focus on optimizing the performance of our ready-mixed concrete segment will continue to differentiate us from our larger, vertically integrated competitors that focus principally on their aggregates or cement segments and treat ready-mixed concrete operations as a downstream outlet for their aggregates or cement products.
Pursue growth. In addition to our general organic growth initiative, we continuously evaluate both acquisition and partnership opportunities. We are focused on both strengthening our positions in existing geographic markets as well as identifying attractive new markets. All of our acquisitions must meet our strict criteria, including fit with our strategic plan, investment return hurdles, capital requirements and attractive market attributes. During 2015 and 2016, we completed fourteen acquisitions that expanded our operations in our existing geographic markets and into the USVI market. Most notably, we acquired Ferrara Bros. Building Materials Corp. (“Ferrara Bros.” or “Ferrara”), which significantly expanded our footprint in the New York metropolitan market and allowed us to more effectively serve construction projects in Manhattan. In addition, we expanded into the USVI market with our acquisitions of Heavy Materials, LLC (“Heavy”) and Spartan Concrete Products, LLC (“Spartan”). We believe our significant experience, positive reputation and strong management team will allow us to continue our successful track record of identifying opportunities, closing and integrating acquisitions, realizing synergies and enhancing asset value and cash flow.
Manage costs. We consistently seek opportunities to reduce costs and improve margins through our focus on existing operations and new technologies. Additionally, our regional acquisitions allow for synergies, such as selling, general and administrative reductions, economies of scale, labor cost savings and increases in purchasing power. We believe that by aggressively managing our cost structure, we can maintain and improve our favorable margin profile.
Our competitors
The ready-mixed concrete industry is highly competitive. Our leadership position in a geographic market depends largely on the location and operating costs of our plants and prevailing prices in that market. Price is the primary competitive factor among suppliers for small or less complex jobs, such as residential construction. However, the ability to meet demanding specifications for strength or sustainability, timeliness of delivery and consistency of quality and service, in addition to price, are the principal competitive factors among suppliers for large or complex jobs. Our competitors range from small, owner-operated private companies to the operating subsidiaries of large, vertically integrated manufacturers of cement and aggregates. We continue to focus on developing new competitive advantages that will differentiate us from our competitors, such as our high-performing, low-CO2 concrete, ARIDUS® Rapid Drying Concrete technology and EF Technology ready-mixed concrete products.
10
Summary financial and other data
The following table presents our summary financial and other data as of and for the years ended December 31, 2015, 2014 and 2013, as of and for the nine months ended September 30, 2016 and 2015, and for the twelve months ended September 30, 2016. The summary financial and other data as of December 31, 2015 and 2014 and for the years ended December 31, 2015, 2014 and 2013 has been derived from our audited consolidated financial statements and related notes. The summary financial and other data as of December 31, 2013 and for the years ended December 31, 2012 and December 31, 2011 has been derived from our audited consolidated financial statements and related notes. The summary financial and other data as of and for the nine months ended September 30, 2016 and 2015 has been derived from our unaudited consolidated financial statements. The unaudited consolidated financial data for the twelve months ended September 30, 2016 has been derived by adding the financial data from our audited consolidated financial statements for the year ended December 31, 2015 to the financial data from our unaudited consolidated financial statements for the nine months ended September 30, 2016 and subtracting the financial data from our unaudited consolidated financial statements for the nine months ended September 30, 2015. The unaudited consolidated financial statements have been prepared on the same basis as our audited consolidated financial statements and, in the opinion management, reflect all adjustments, consisting of only normal recurring adjustments, necessary for a fair presentation of this data. The results for any interim period are not necessarily indicative of the results that may be expected for a full year. On April 27, 2016, we filed an Amendment No. 1 on Form 10-K/A (the “Amendment”) with the SEC, to restate our 2015 consolidated financial statements to (i) eliminate from our consolidated balance sheet as of December 31, 2015, a $24.8 million deferred tax asset related to our outstanding common stock purchase warrants that were issued on August 31, 2010 (the “Warrants”) and increase income tax expense by $24.8 million in our consolidated statement of operations for the year ended December 31, 2015, and (ii) eliminate a $6.1 million tax deduction included in income tax benefit in our consolidated statement of operations for the year ended December 31, 2015 and increase accrued liabilities by $5.9 million and decrease prepaid expenses by $0.2 million in our consolidated balance sheet as of December 31, 2015 related to the exercise of Warrants during 2015.
The summary financial and other data presented on the following page should be read in conjunction with “Management’s discussion and analysis of financial condition and results of operations” and our consolidated financial statements and the related notes in our most recent Annual Report on Form 10-K/A and Quarterly Report on Form 10-Q.
11
| Year ended December 31, | Nine months ended September 30, |
Twelve months ended September 30, |
||||||||||||||||||||||
| (In millions, except selling prices and percentage amounts) | 2015 (restated) |
2014 | 2013 | 2016 | 2015 | 2016 | ||||||||||||||||||
| Statement of Operations Data |
||||||||||||||||||||||||
| Revenue: |
||||||||||||||||||||||||
| Ready-mixed concrete |
||||||||||||||||||||||||
| Sales to external customers |
$ | 876.6 | $ | 632.8 | $ | 545.3 | $ | 770.5 | $ | 638.5 | $ | 1,008.6 | ||||||||||||
| Aggregate products |
||||||||||||||||||||||||
| Sales to external customers |
34.3 | 31.6 | 21.7 | 30.8 | 25.1 | 39.9 | ||||||||||||||||||
| Intersegment sales |
26.2 | 21.0 | 16.5 | 25.6 | 18.4 | 33.5 | ||||||||||||||||||
|
|
|
|||||||||||||||||||||||
| Total reportable segment revenue |
937.1 | 685.4 | 583.5 | 826.9 | 682.0 | 1,082.0 | ||||||||||||||||||
| Other products and eliminations |
37.6 | 18.3 | 14.7 | 22.5 | 29.2 | 31.0 | ||||||||||||||||||
|
|
|
|||||||||||||||||||||||
| Total revenue |
$ | 974.7 | $ | 703.7 | $ | 598.2 | $ | 849.4 | $ | 711.1 | $ | 1,113.0 | ||||||||||||
| (Loss) income from continuing operations |
$ | (5.1 | ) | $ | 21.6 | $ | (18.3 | ) | $ | 25.0 | $ | 1.2 | $ | 18.6 | ||||||||||
| (Loss) income from discontinued operations, net of taxes |
(0.3 | ) | (1.0 | ) | (1.8 | ) | (0.5 | ) | (0.4 | ) | (0.4 | ) | ||||||||||||
|
|
|
|||||||||||||||||||||||
| Net (loss) income |
$ | (5.4 | ) | $ | 20.6 | $ | (20.1 | ) | $ | 24.5 | $ | 0.8 | $ | 18.2 | ||||||||||
| Balance Sheet Data |
||||||||||||||||||||||||
| Total assets(1) |
$ | 681.7 | $ | 460.5 | $ | 414.0 | $ | 942.2 | $ | 670.2 | $ | 942.2 | ||||||||||||
| Cash and cash equivalents |
$ | 3.9 | $ | 30.2 | $ | 112.7 | $ | 66.0 | $ | 8.6 | $ | 66.0 | ||||||||||||
| Total debt(1) |
$ | 275.6 | $ | 220.4 | $ | 214.1 | $ | 452.5 | $ | 292.1 | $ | 452.5 | ||||||||||||
| Total equity |
$ | 134.0 | $ | 101.5 | $ | 83.7 | $ | 202.5 | $ | 122.8 | $ | 202.5 | ||||||||||||
| Cash Flow Data |
||||||||||||||||||||||||
| Net cash provided by operating activities |
$ | 104.3 | $ | 50.9 | $ | 24.2 | $ | 88.5 | $ | 56.7 | $ | 136.1 | ||||||||||||
| Net cash used in investing activities |
$ | (157.8 | ) | $ | (118.5 | ) | $ | (26.1 | ) | $ | (153.2 | ) | $ | (120.4 | ) | $ | (190.6 | ) | ||||||
| Net cash provided by (used in) financing activities |
$ | 27.3 | $ | (14.9 | ) | $ | 109.8 | $ | 126.8 | $ | 42.1 | $ | 112.0 | |||||||||||
|
|
|
|||||||||||||||||||||||
| Other Information and Financial Data |
||||||||||||||||||||||||
| Ready-mixed concrete statistics |
||||||||||||||||||||||||
| Average selling price per cubic yard |
$ | 123.98 | $ | 110.85 | $ | 104.03 | $ | 129.64 | $ | 123.46 | $ | 128.36 | ||||||||||||
| Sales volume in cubic yards |
7,038 | 5,696 | 5,225 | 5,929 | 5,145 | 7,821 | ||||||||||||||||||
| Adjusted EBITDA(2) |
$ | 131.9 | $ | 77.8 | $ | 49.1 | $ | 113.7 | $ | 99.2 | $ | 146.4 | ||||||||||||
| Adjusted EBITDA Margin(2) |
13.5 | % | 11.1 | % | 8.2 | % | 13.4 | % | 14.0 | % | 13.2 | % | ||||||||||||
| (Loss) income from continuing operations margin(2) |
(0.5 | )% | 3.1 | % | (3.1 | )% | 2.9 | % | 0.2 | % | 1.7 | % | ||||||||||||
| Adjusted Free Cash Flow(3) |
$ | 81.8 | $ | 22.0 | $ | 2.5 | $ | 59.8 | $ | 45.7 | $ | 95.9 | ||||||||||||
| Net Debt(4) |
$ | 271.7 | $ | 190.2 | $ | 101.4 | $ | 386.5 | $ | 283.5 | $ | 386.5 | ||||||||||||
|
|
||||||||||||||||||||||||
| (1) | For the year ended December 31, 2015, total assets and total debt reflect the reclassification of $6.1 million of unamortized debt issuance costs from an asset to a direct reduction of the carrying value of debt. No such adjustments were made for the years ended December 31, 2014 and 2013 or the nine months ended September 30, 2015. |
12
| (2) | We define Adjusted EBITDA as our (loss) income from continuing operations, plus income tax (benefit) expense, net interest expense, depreciation, depletion and amortization, non-cash stock compensation expense, derivative (gain) loss, (gain) loss on early extinguishment of debt, non-cash loss (gain) on revaluation of contingent consideration, officer severance, acquisition-related professional fees, expense related to the departure of our former Chief Executive Officer and expense related to our corporate headquarters relocation. Acquisition-related professional fees consists of fees and expenses for accountants, lawyers and other professionals incurred during the negotiation and closing of strategic acquisitions and does not include fees or expenses associated with post-closing integration of strategic acquisitions. We define Adjusted EBITDA Margin as the amount determined by dividing Adjusted EBITDA by total revenue. The most directly comparable GAAP financial measure to Adjusted EBITDA Margin is (loss) income from continuing operations margin, which we define as the amount determined by dividing (loss) income from continuing operations by total revenue. We have included Adjusted EBITDA and Adjusted EBITDA Margin herein because they are widely used by investors for valuation and comparing our financial performance with the performance of other building material companies. We also use Adjusted EBITDA and Adjusted EBITDA Margin to monitor and compare the financial performance of our operations. Adjusted EBITDA does not give effect to the cash we must use to service our debt or pay our income taxes and thus does not reflect the funds actually available for capital expenditures. In addition, our presentation of Adjusted EBITDA may not be comparable to similarly titled measures other companies report. Adjusted EBITDA and Adjusted EBITDA Margin are not intended to be used as an alternative to any measure of our performance in accordance with GAAP. The following table reconciles Adjusted EBITDA to the most directly comparable GAAP financial measure, which is income (loss) from continuing operations. |
| Year ended December 31, | Nine months ended September 30, |
Twelve months ended September 30, |
||||||||||||||||||||||||||||||
| (In millions) | 2015 (restated) |
2014 | 2013 | 2012 | 2011 | 2016 | 2015 | 2016 | ||||||||||||||||||||||||
| Adjusted EBITDA Reconciliation |
||||||||||||||||||||||||||||||||
| (Loss) income from continuing operations |
$ | (5.1 | ) | $ | 21.6 | $ | (18.3 | ) | $ | (24.3 | ) | $ | (7.9 | ) | $ | 25.0 | $ | 1.2 | $ | 18.6 | ||||||||||||
| Income tax expense (benefit) |
0.8 | 2.2 | 1.2 | (3.7 | ) | (0.4 | ) | 14.3 | (2.8 | ) | 17.9 | |||||||||||||||||||||
| Interest expense, net |
21.7 | 20.4 | 11.3 | 11.3 | 11.0 | 19.9 | 16.0 | 25.7 | ||||||||||||||||||||||||
| Corporate (gain) loss on early extinguishment of debt |
— | — | (0.9 | ) | 2.6 | — | 12.0 | — | 12.0 | |||||||||||||||||||||||
| Derivative loss (gain) |
60.0 | 3.6 | 30.0 | 19.7 | (13.4 | ) | (6.4 | ) | 46.4 | 7.2 | ||||||||||||||||||||||
| Depreciation, depletion and amortization |
43.6 | 23.8 | 18.9 | 15.5 | 18.4 | 38.8 | 31.4 | 51.0 | ||||||||||||||||||||||||
| Non-cash loss (gain) on revaluation of contingent consideration |
0.9 | — | — | — | — | 2.3 | (1.4 | ) | 4.7 | |||||||||||||||||||||||
| Non-cash stock compensation expense |
5.8 | 3.7 | 5.4 | 2.5 | 2.1 | 5.7 | 5.0 | 6.5 | ||||||||||||||||||||||||
| Acquisition-related professional fees |
3.8 | 2.5 | 0.8 | — | — | 2.1 | 3.1 | 2.8 | ||||||||||||||||||||||||
| Officer severance |
0.4 | — | 0.2 | — | — | — | 0.4 | — | ||||||||||||||||||||||||
| Departure of former CEO |
— | — | — | — | 2.1 | — | — | — | ||||||||||||||||||||||||
| Corporate headquarters relocation expense |
— | — | 0.5 | 2.5 | — | — | — | — | ||||||||||||||||||||||||
|
|
|
|||||||||||||||||||||||||||||||
| Adjusted EBITDA |
$ | 131.9 | $ | 77.8 | $ | 49.1 | $ | 26.1 | $ | 11.9 | $ | 113.7 | $ | 99.2 | $ | 146.4 | ||||||||||||||||
|
|
||||||||||||||||||||||||||||||||
| (3) | We define Adjusted Free Cash Flow as net cash provided by operating activities less capital expenditures, plus proceeds from the sale of property, plant and equipment, plus proceeds from disposals of business units. We consider Adjusted Free Cash Flow to be an important indicator of our ability to service our debt and generate cash for acquisitions and other strategic investments. However, Adjusted Free Cash Flow is not intended to be used as an alternative to any measure of our liquidity in accordance with GAAP. The following table reconciles Adjusted Free Cash Flow to the most directly comparable GAAP financial measure, which is net cash provided by operating activities. |
| Year ended December 31, | Nine months ended September 30, |
Twelve months ended September 30, |
||||||||||||||||||||||
| (In millions) | 2015 (restated) |
2014 | 2013 | 2016 | 2015 | 2016 | ||||||||||||||||||
| Adjusted Free Cash Flow Reconciliation |
||||||||||||||||||||||||
| Net cash provided by operating activities |
$ | 104.3 | $ | 50.9 | $ | 24.2 | $ | 88.5 | $ | 56.7 | $ | 136.1 | ||||||||||||
| Less: capital expenditures |
(25.0 | ) | (32.6 | ) | (20.0 | ) | (31.0 | ) | (12.8 | ) | (43.2 | ) | ||||||||||||
| Plus: proceeds from the sale of property, plant and equipment |
1.3 | 3.7 | 0.6 | 1.9 | 0.7 | 2.5 | ||||||||||||||||||
| Plus: proceeds (payments) from disposals of business units |
1.2 | — | (2.3 | ) | 0.4 | 1.1 | 0.5 | |||||||||||||||||
|
|
|
|||||||||||||||||||||||
| Adjusted Free Cash Flow |
$ | 81.8 | $ | 22.0 | $ | 2.5 | $ | 59.8 | $ | 45.7 | $ | 95.9 | ||||||||||||
|
|
||||||||||||||||||||||||
| (4) | We define Net Debt as total debt, including current maturities and capital lease obligations, less cash and cash equivalents. We believe that Net Debt is useful to investors as a measure of our financial position. However, Net Debt is not intended to be used as an alternative to any measure |
13
| of our financial position in accordance with GAAP. The following table reconciles Net Debt to the most directly comparable GAAP financial measure, which is total debt, including current maturities and capital lease obligations. |
| Year ended December 31, | Nine months ended September 30, |
Twelve months ended September 30, |
||||||||||||||||||||||
| (In millions) | 2015 | 2014 | 2013 | 2016 | 2015 | 2016 | ||||||||||||||||||
| Net Debt Reconciliation |
||||||||||||||||||||||||
| Total debt, including current maturities and capital lease obligations(1) |
$ | 275.6 | $ | 220.4 | $ | 214.1 | $ | 452.5 | $ | 292.1 | $ | 452.5 | ||||||||||||
| Less: cash and cash equivalents |
(3.9 | ) | (30.2 | ) | (112.7 | ) | 66.0 | 8.6 | 66.0 | |||||||||||||||
|
|
|
|||||||||||||||||||||||
| Net Debt |
$ | 271.7 | $ | 190.2 | $ | 101.4 | $ | 386.5 | $ | 283.5 | $ | 386.5 | ||||||||||||
|
|
||||||||||||||||||||||||
| (1) | For the year ended December 31, 2015, total assets and total debt reflect the reclassification of $6.1 million of unamortized debt issuance costs from an asset to a direct reduction of the carrying value of debt. No such adjustments were made for the years ended December 31, 2014 and 2013 or the nine months ended September 30, 2015. |
14