Attached files
| file | filename |
|---|---|
| 8-K - 8-K - STONEMOR PARTNERS LP | d305199d8k.htm |
| Exhibit 99.1
|
Exhibit 99.1
StoneMor Partners L.P.
2016 Investor Day – The London NYC Hotel
December 14, 2016
|
|
Forward Looking Statements
2
This presentation contains forward-looking statements that involve a number of assumptions, risks and
uncertainties that could cause actual results to differ materially from those contained in the forward-looking
statements. The Partnership cautions readers that any forward-looking information is not a guarantee of future
performance. Such forward-looking statements include, but are not limited to, statements about future financial
and operating results, the Partnership’s plans, objectives, expectations and intentions and other statements that
are not historical facts. Risks, assumptions and uncertainties that could cause actual results to materially differ from
the forward-looking statements include, but are not limited to, those associated with the cash flow from our preneed
and at-need sales, our trusts, and financings, which may impact our ability to meet our financial projections,
our ability to service our debt and pay distributions, and our ability to increase our distributions; future revenue
and revenue growth; the integration or anticipated benefits of our recent acquisitions or any future acquisitions;
our ability to complete and fund additional acquisitions; the effect of economic downturns; the impact of our
leverage on our operating plans; the decline in the fair value of certain equity and debt securities held in our trusts;
our ability to attract, train and retain an adequate number of sales people; the volume and timing of pre-need sales
of cemetery services and products; increased use of cremation; changes in the death rate; changes in the political
or regulatory environments, including potential changes in tax accounting and trusting policies; litigation or legal
proceedings that could expose us to significant liabilities and damage our reputation; the effects of cyber security
attacks due to our significant reliance on information technology; the financial condition of third-party insurance
companies that fund our pre-need funeral contracts; and other risks, assumptions and uncertainties detailed from
time to time in the Partnership’s reports filed with the U.S. Securities and Exchange Commission, including
quarterly reports on Form 10-Q, reports on Form 8-K and annual reports on Form 10-K. Forward-looking statements
speak only as of the date hereof, and the Partnership assumes no obligation to update such statements, except as
may be required by applicable law.
|
|
Today’s Agenda
3
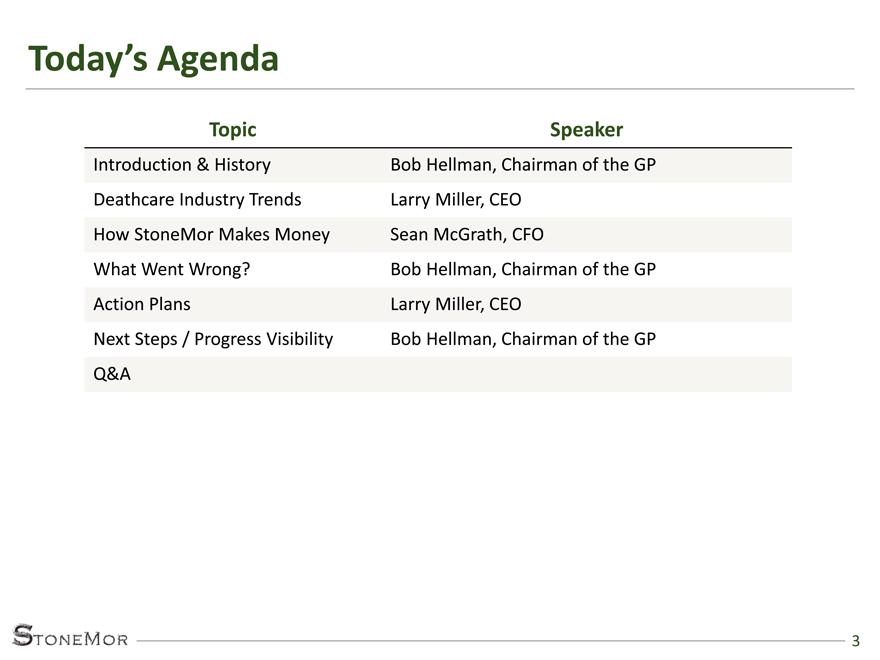
Topic Speaker
Introduction & History Bob Hellman, Chairman of the GP
Deathcare Industry Trends Larry Miller, CEO
How StoneMor Makes Money Sean McGrath, CFO
What Went Wrong Bob Hellman, Chairman of the GP
Action Plans Larry Miller, CEO
Next Steps / Progress Visibility Bob Hellman, Chairman of the GP
Q&A
|
|
Answers First…
4
StoneMor has been operating for over a dozen years as a master limited
partnership, pursuing one consistent strategy and operational model
Distribution cut driven by self-induced operating challenges which manifested
over the past few quarters
Not an industry problem – industry has terrific tailwinds
Not a business model problem
Operating challenges are known, solutions identified and progress underway
As progress manifests itself in increase cash flow, we expect that distributions
will be increased over the next 12-24 months
|
|
Discussion Topics
Topics This Presentation Will Address
5
StoneMor history
Deathcare industry trends
How StoneMor makes money
What went wrong?
Sustainability of current distribution
Action plans
Next steps / progress visibility
|
|
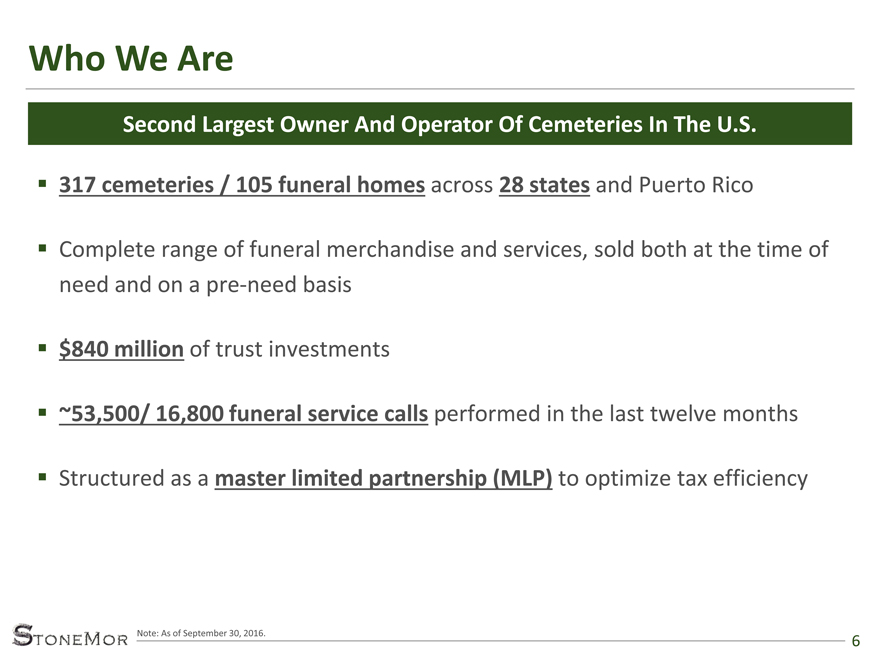
Who We Are
6
317 cemeteries / 105 funeral homes across 28 states and Puerto Rico
Complete range of funeral merchandise and services, sold both at the time of
need and on a pre-need basis
$840 million of trust investments
~53,500/ 16,800 funeral service calls performed in the last twelve months
Structured as a master limited partnership (MLP) to optimize tax efficiency
Note: As of September 30, 2016.
Second Largest Owner And Operator Of Cemeteries In The U.S.
|
|
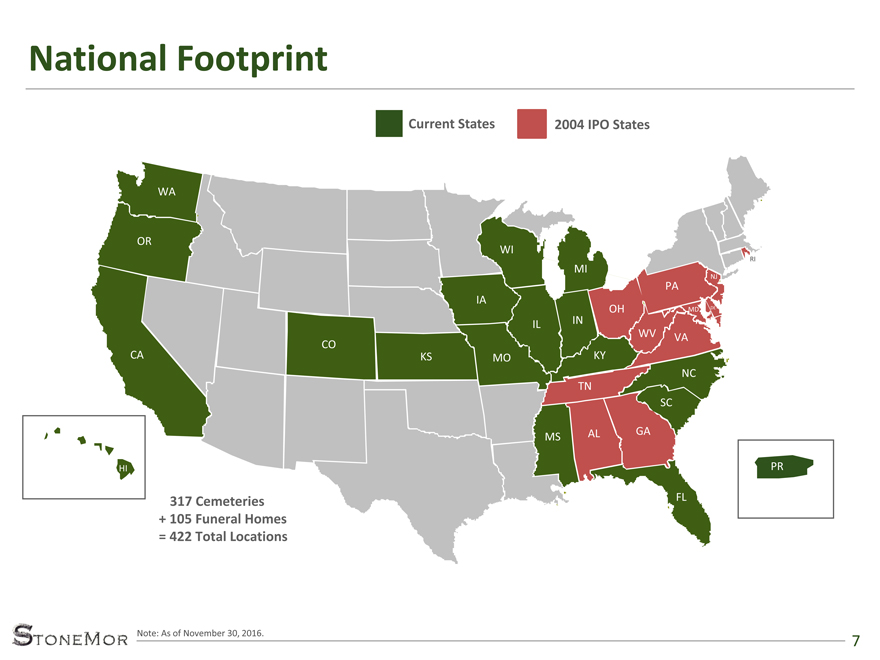
National Footprint
7
317 Cemeteries
+ 105 Funeral Homes
= 422 Total Locations
WA
OR
CA
CO
KS
IA
IL
MO
IN
MI
OH
PA
WV
KY
TN
VA
NC
SC
MS AL GA
FL
WI
Current States 2004 IPO States
Note: As of November 30, 2016.
NJ
MD DE
RI
HI PR
|
|
22
45
91 100 103
122
139 144 145
171 175 185
6
19
43
45 45
51
64
77 83
91 98
98
0
50
100
150
200
250
300
2005 2006 2007 2008 2009 2010 2011 2012 2013 2014 2015 2016
Cemeteries Funeral Homes
8
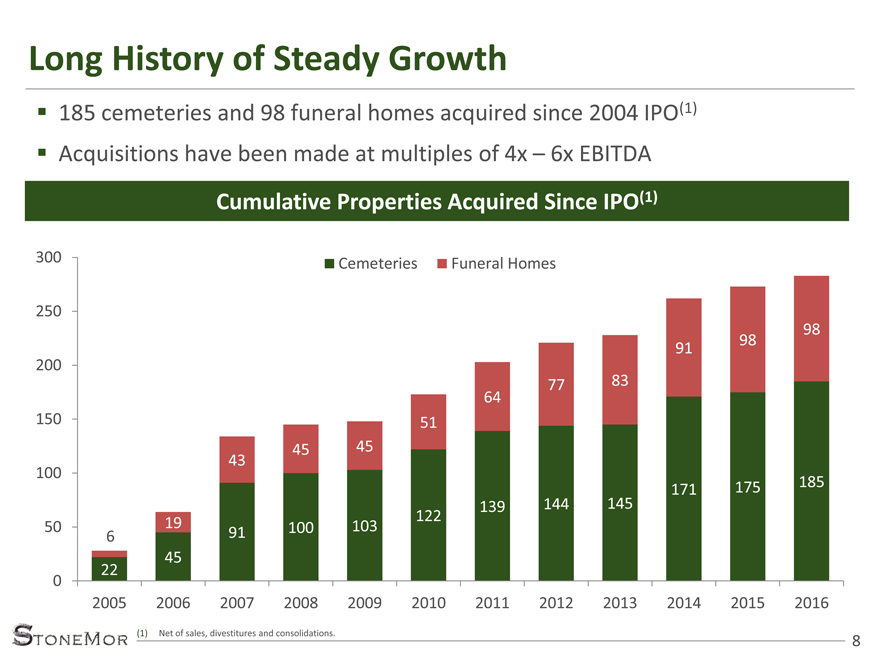
Long History of Steady Growth
185 cemeteries and 98 funeral homes acquired since 2004 IPO(1)
Acquisitions have been made at multiples of 4x – 6x EBITDA
Cumulative Properties Acquired Since IPO(1)
(1) Net of sales, divestitures and consolidations.
|
|
9
Deathcare Industry Trends
|
|
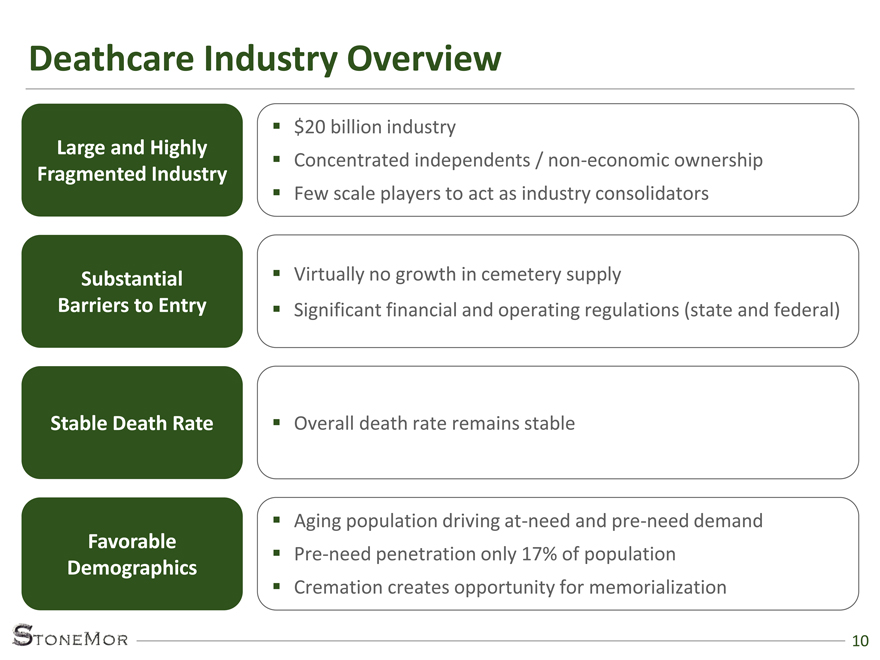
Deathcare Industry Overview
10
$20 billion industry
Concentrated independents / non-economic ownership
Few scale players to act as industry consolidators
Substantial
Barriers to Entry
Stable Death Rate
Favorable
Demographics
Virtually no growth in cemetery supply
Significant financial and operating regulations (state and federal)
Overall death rate remains stable
Aging population driving at-need and pre-need demand
Pre-need penetration only 17% of population
Cremation creates opportunity for memorialization
Large and Highly
Fragmented Industry
|
|
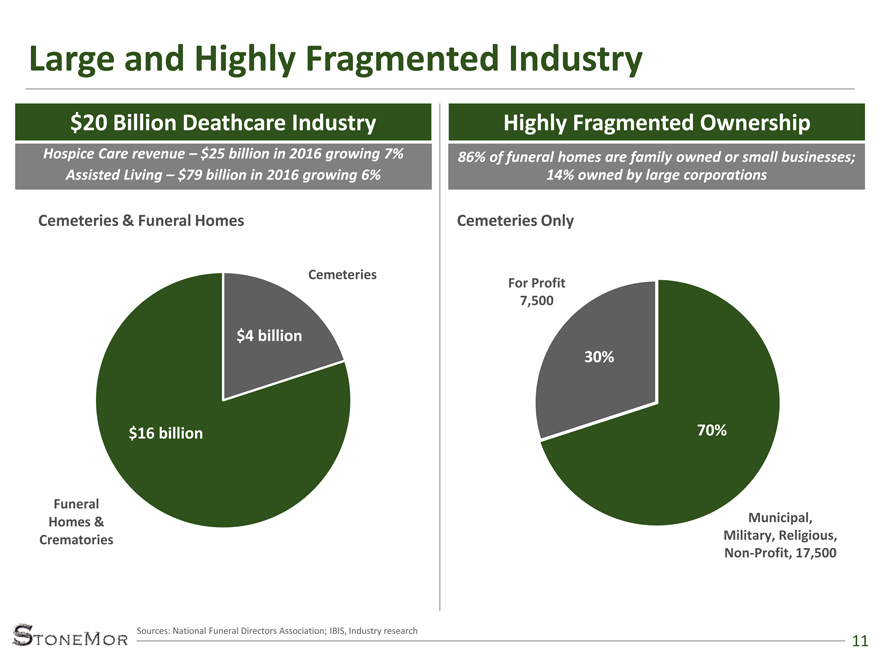
Cemeteries
Funeral
Homes &
Crematories
$16 billion
$4 billion
Cemeteries & Funeral Homes
Large and Highly Fragmented Industry
11
$20 Billion Deathcare Industry Highly Fragmented Ownership
86% of funeral homes are family owned or small businesses;
14% owned by large corporations
Sources: National Funeral Directors Association; IBIS, Industry research
70%
30%
For Profit
7,500
Municipal,
Military, Religious,
Non-Profit, 17,500
Hospice Care revenue – $25 billion in 2016 growing 7%
Assisted Living – $79 billion in 2016 growing 6%
Cemeteries Only
|
|
12
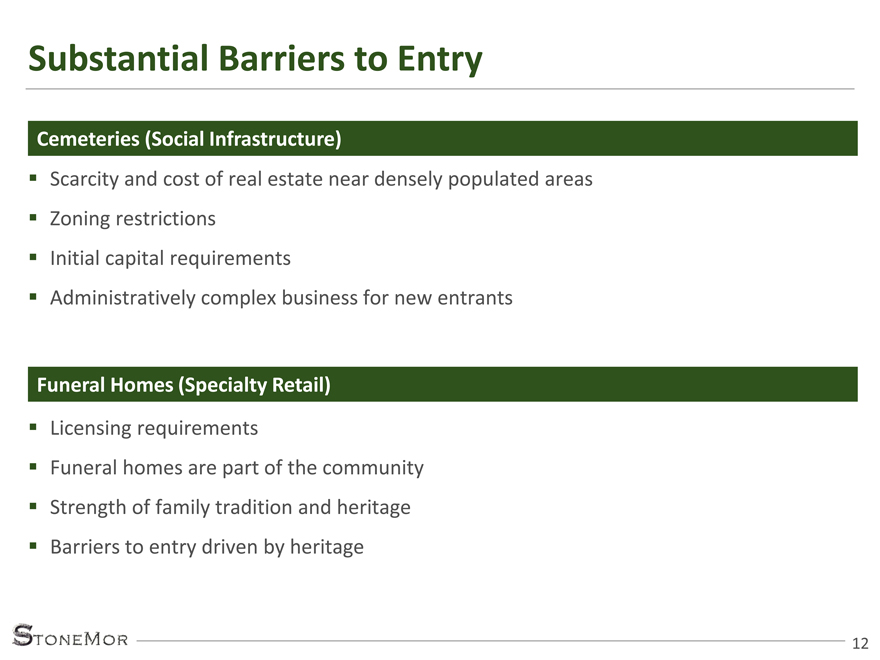
Substantial Barriers to Entry
Scarcity and cost of real estate near densely populated areas
Zoning restrictions
Initial capital requirements
Administratively complex business for new entrants
Cemeteries (Social Infrastructure)
Funeral Homes (Specialty Retail)
Licensing requirements
Funeral homes are part of the community
Strength of family tradition and heritage
Barriers to entry driven by heritage
|
|
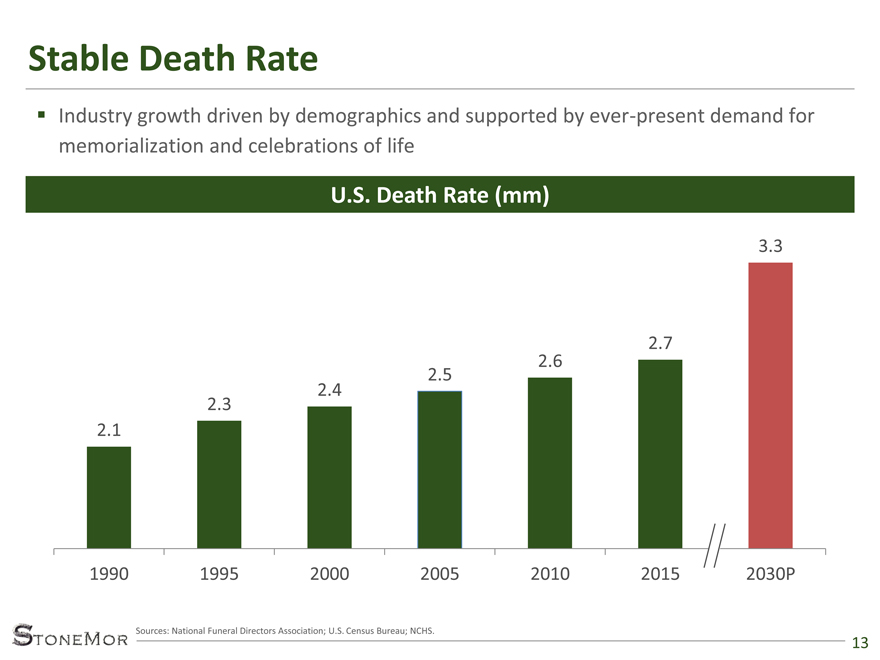
Stable Death Rate
13
Industry growth driven by demographics and supported by ever-present demand for
memorialization and celebrations of life
2.1
2.3
2.4
2.5
2.6
2.7
3.3
1990 1995 2000 2005 2010 2015 2030P
U.S. Death Rate (mm)
Sources: National Funeral Directors Association; U.S. Census Bureau; NCHS.
|
|
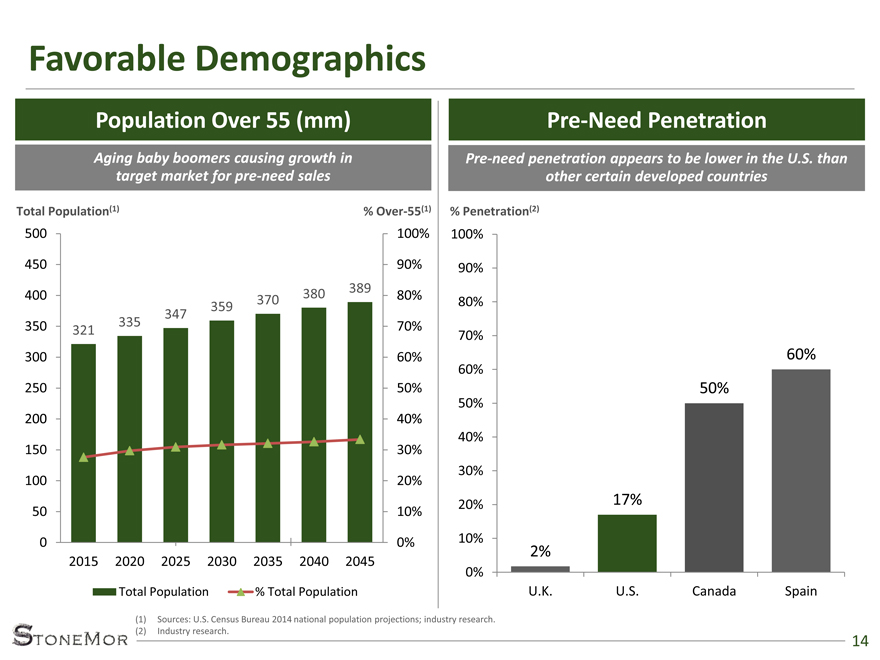
Favorable Demographics
14
Population Over 55 (mm) Pre-Need Penetration
Aging baby boomers causing growth in
target market for pre-need sales
Total Population(1) % Over-55(1)
(1) Sources: U.S. Census Bureau 2014 national population projections; industry research.
(2) Industry research.
321
335
347
359 370 380 389
0%
10%
20%
30%
40%
50%
60%
70%
80%
90%
100%
0
50
100
150
200
250
300
350
400
450
500
2015 2020 2025 2030 2035 2040 2045
Total Population % Total Population
Pre-need penetration appears to be lower in the U.S. than
other certain developed countries
% Penetration(2)
2%
17%
50%
60%
0%
10%
20%
30%
40%
50%
60%
70%
80%
90%
100%
U.K. U.S. Canada Spain
|
|
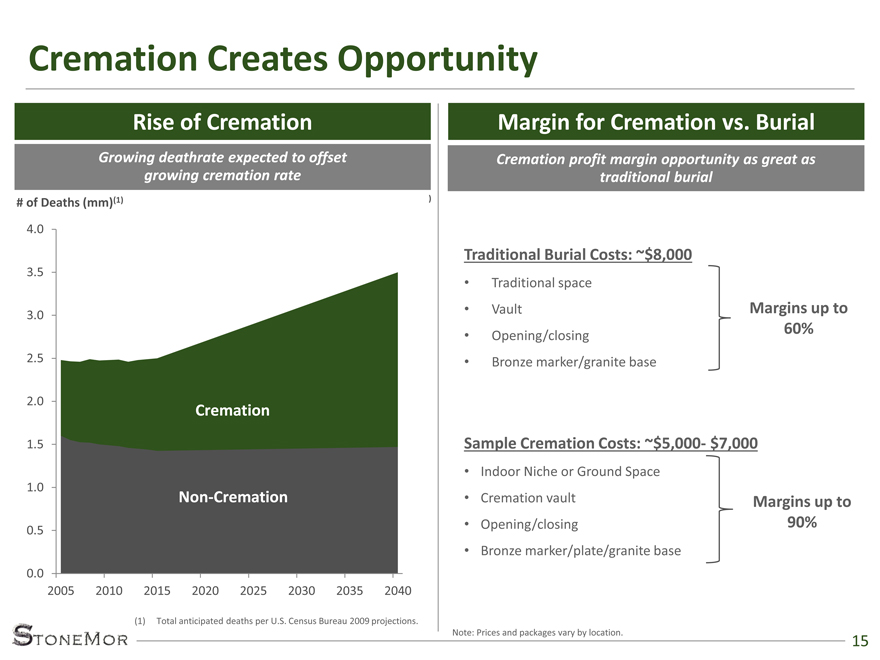
Cremation Creates Opportunity
15
Cremation
Non-Cremation
# of Deaths (mm)(1) )
(1) Total anticipated deaths per U.S. Census Bureau 2009 projections.
Traditional Burial Costs: ~$8,000
• Traditional space
• Vault
• Opening/closing
• Bronze marker/granite base
Sample Cremation Costs: ~$5,000- $7,000
• Indoor Niche or Ground Space
• Cremation vault
• Opening/closing
• Bronze marker/plate/granite base
Margins up to
90%
Margins up to
60%
Note: Prices and packages vary by location.
0.0
0.5
1.0
1.5
2.0
2.5
3.0
3.5
4.0
2005 2010 2015 2020 2025 2030 2035 2040
Non-Cremation
Rise of Cremation Margin for Cremation vs. Burial
Cremation profit margin opportunity as great as
traditional burial
Growing deathrate expected to offset
|
|
Deathcare Industry Context
16
Death care industry continues to grow, driven by demographic tailwinds
Fragmented ownership and lack of industry consolidators results in substantial
consolidation opportunity
Cremation as much of an opportunity as a threat
Barriers to entry serve as the basis for company stability
|
|

17
How StoneMor Makes Money
|
|
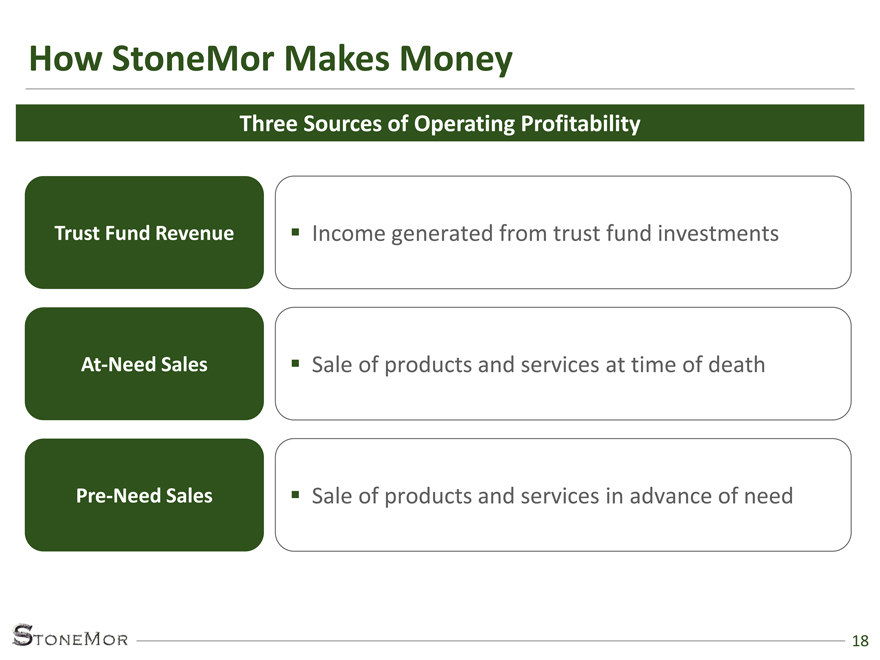
How StoneMor Makes Money
18
Income generated from trust fund investments
At-Need Sales
Pre-Need Sales
Sale of products and services at time of death
Sale of products and services in advance of need
Trust Fund Revenue
Three Sources of Operating Profitability
|
|
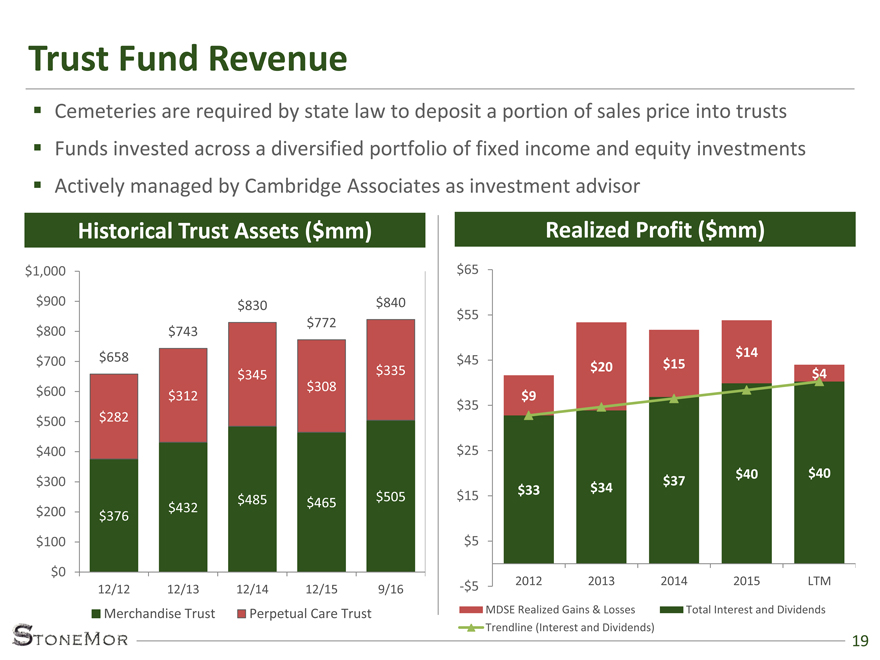
Trust Fund Revenue
19
Cemeteries are required by state law to deposit a portion of sales price into trusts
Funds invested across a diversified portfolio of fixed income and equity investments
Actively managed by Cambridge Associates as investment advisor
$376
$432
$485 $465 $505
$282
$312
$345
$308
$335
$658
$743
$830
$772
$840
$0
$100
$200
$300
$400
$500
$600
$700
$800
$900
$1,000
12/12 12/13 12/14 12/15 9/16
Merchandise Trust Perpetual Care Trust
Historical Trust Assets ($mm) Realized Profit ($mm)
$33 $34 $37 $40 $40
$9
$20 $15
$14
$4
-$5
$5
$15
$25
$35
$45
$55
$65
2012 2013 2014 2015 LTM
MDSE Realized Gains & Losses Total Interest and Dividends
Trendline (Interest and Dividends)
|
|
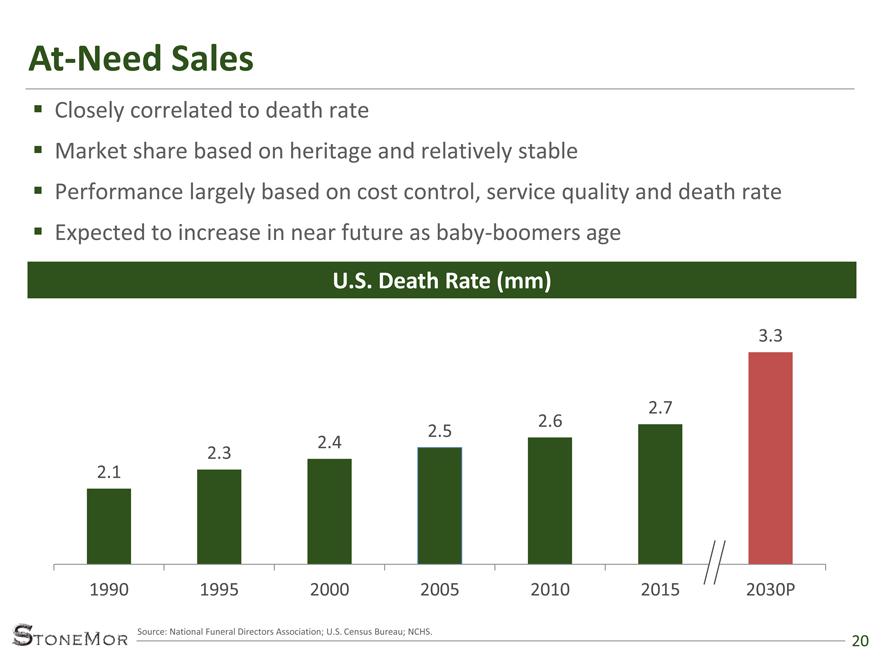
At-Need Sales
20
Closely correlated to death rate
Market share based on heritage and relatively stable
Performance largely based on cost control, service quality and death rate
Expected to increase in near future as baby-boomers age
U.S. Death Rate (mm)
Source: National Funeral Directors Association; U.S. Census Bureau; NCHS.
2.1
2.3
2.4
2.5
2.6
2.7
3.3
1990 1995 2000 2005 2010 2015 2030P
|
|
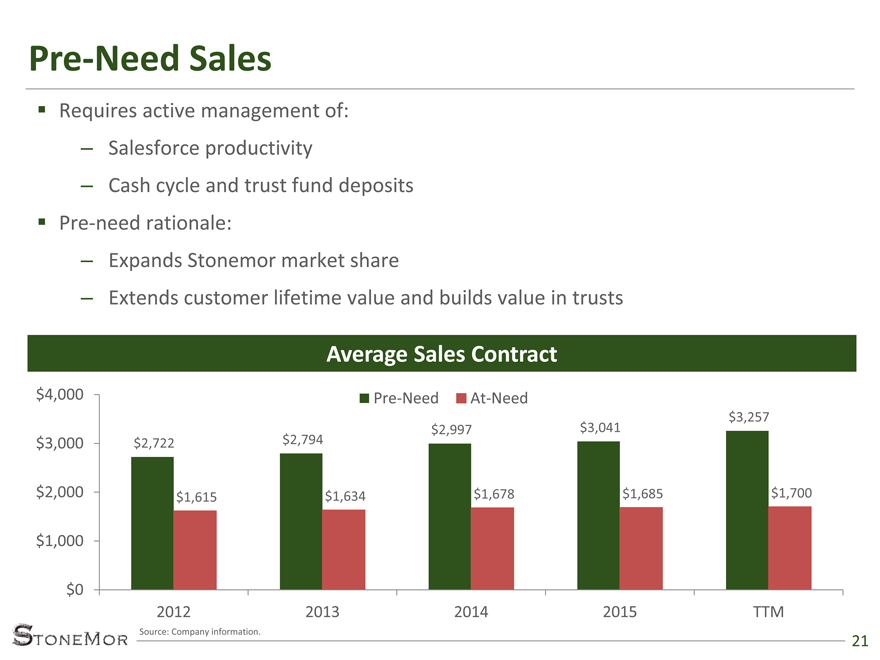
Pre-Need Sales
21
Requires active management of:
– Salesforce productivity
– Cash cycle and trust fund deposits
Pre-need rationale:
– Expands Stonemor market share
– Extends customer lifetime value and builds value in trusts
$2,722 $2,794
$2,997 $3,041
$3,257
$1,615 $1,634 $1,678 $1,685 $1,700
$0
$1,000
$2,000
$3,000
$4,000
2012 2013 2014 2015 TTM
Pre-Need At-Need
Average Sales Contract
Source: Company information.
|
|
22
What Went Wrong?
|
|
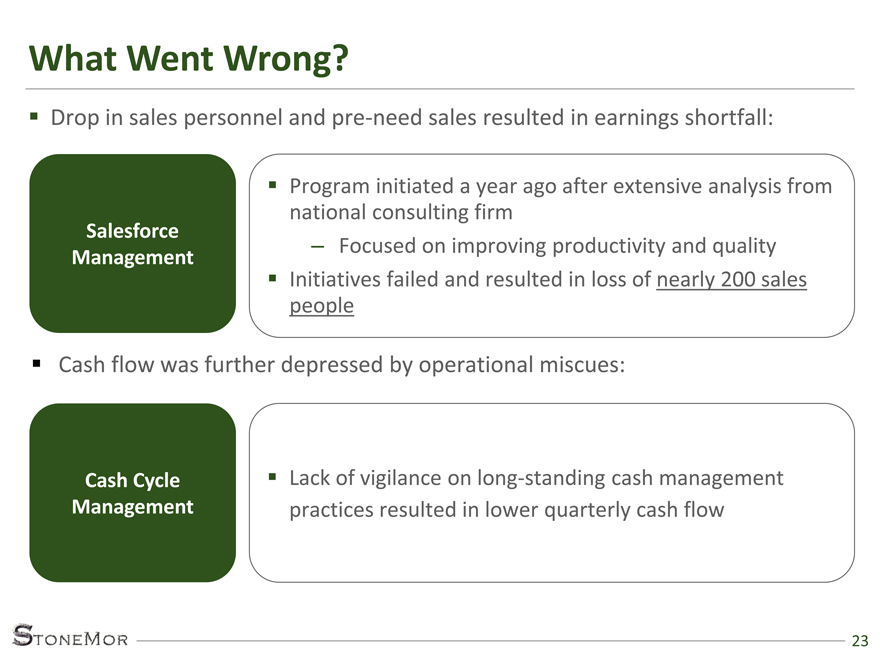
What Went Wrong
Drop in sales personnel and pre-need sales resulted in earnings shortfall:
23
Program initiated a year ago after extensive analysis from
national consulting firm
– Focused on improving productivity and quality
Initiatives failed and resulted in loss of nearly 200 sales
people
Cash Cycle
Management
Lack of vigilance on long-standing cash management
practices resulted in lower quarterly cash flow
Salesforce
Management
Cash flow was further depressed by operational miscues:
|
|
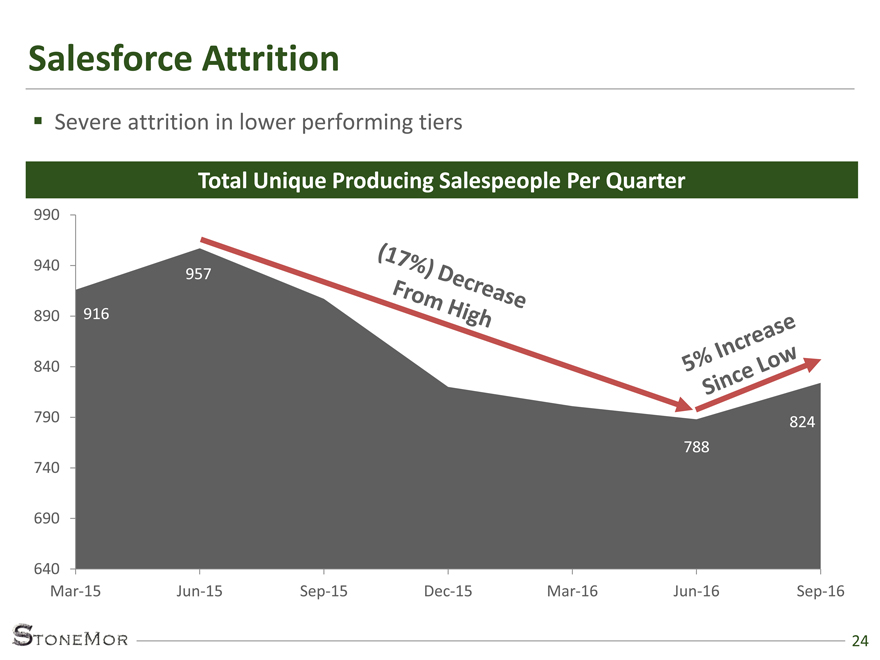
Salesforce Attrition
24
Severe attrition in lower performing tiers
Total Unique Producing Salespeople Per Quarter
916
957
788
824
640
690
740
790
840
890
940
990
Mar-15 Jun-15 Sep-15 Dec-15 Mar-16 Jun-16 Sep-16
|
|
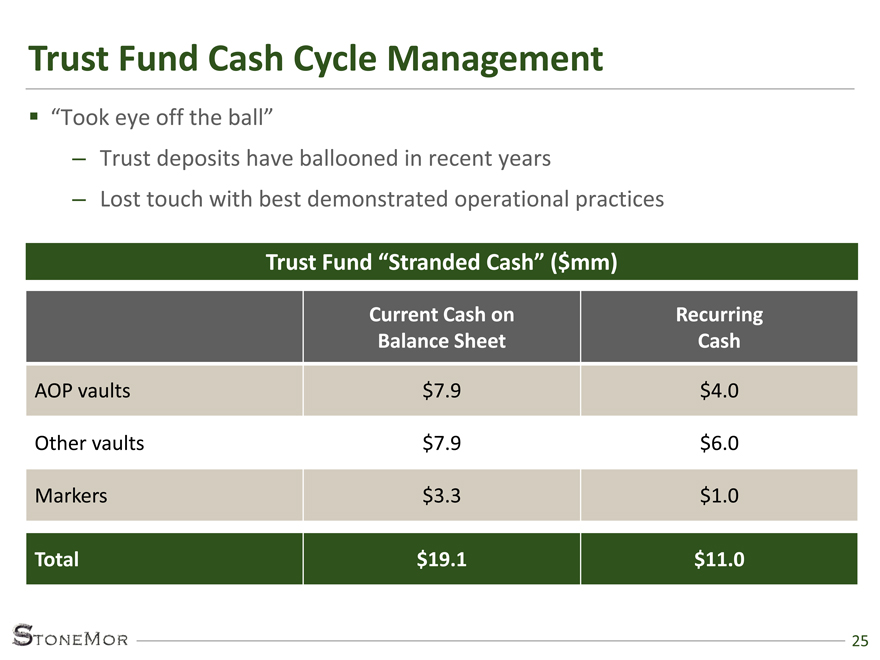
Trust Fund Cash Cycle Management
“Took eye off the ball”
– Trust deposits have ballooned in recent years
– Lost touch with best demonstrated operational practices
25
Current Cash on
Balance Sheet
Recurring
Cash
AOP vaults $7.9 $4.0
Other vaults $7.9 $6.0
Markers $3.3 $1.0
Total $19.1 $11.0
Trust Fund “Stranded Cash” ($mm)
|
|
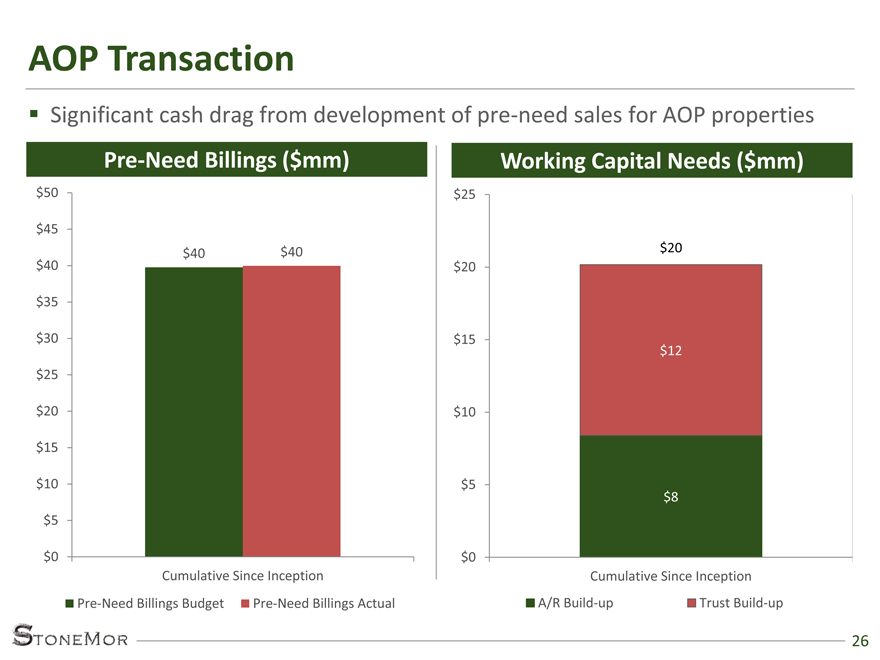
AOP Transaction
Significant cash drag from development of pre-need sales for AOP properties
26
Pre-Need Billings ($mm) Working Capital Needs ($mm)
$8
$12
$20
$0
$5
$10
$15
$20
$25
Cumulative Since Inception
A/R Build-up Trust Build-up
$40 $40
$0
$5
$10
$15
$20
$25
$30
$35
$40
$45
$50
Cumulative Since Inception
Pre-Need Billings Budget Pre-Need Billings Actual
|
|

27
Action Plans
|
|
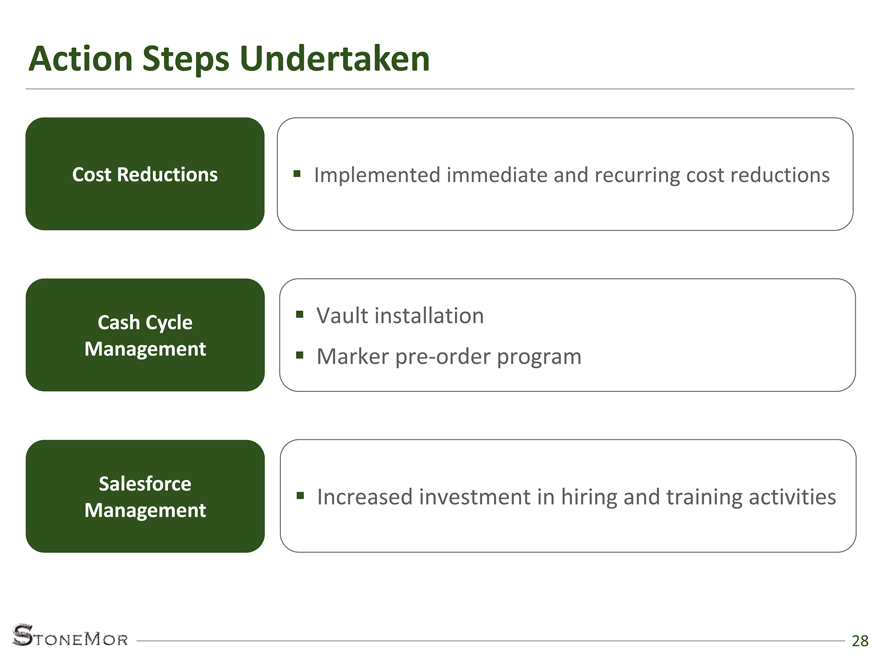
Action Steps Undertaken
28
Increased investment in hiring and training activities
Cash Cycle
Management
Cost Reductions
Vault installation
Marker pre-order program
Implemented immediate and recurring cost reductions
Salesforce
Management
|
|
Cost Reductions
29
Able to achieve real cash savings of over $6mm
Currently implementing $5mm of additional savings (completed by year end)
By year end, StoneMor will have implemented over $11mm of cost savings
that will directly affect 2017 cash flow
In addition, StoneMor is evaluating option of using life insurance contracts to
replace future pre-need trust deposits for Merchandise Trust fund
|
|
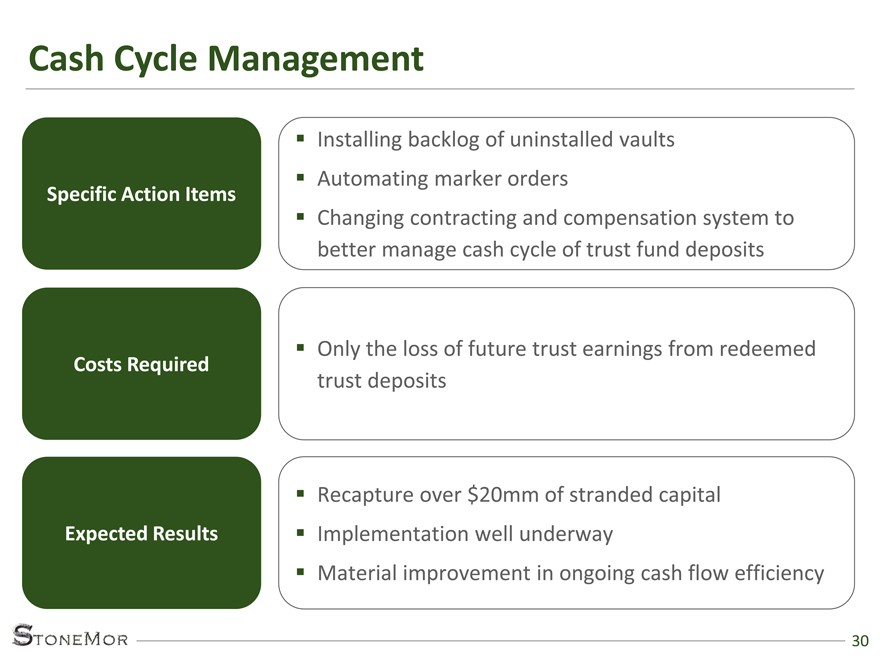
Cash Cycle Management
30
Costs Required
Expected Results
Specific Action Items
Only the loss of future trust earnings from redeemed
trust deposits
Installing backlog of uninstalled vaults
Automating marker orders
Changing contracting and compensation system to
better manage cash cycle of trust fund deposits
Recapture over $20mm of stranded capital
Implementation well underway
Material improvement in ongoing cash flow efficiency
|
|
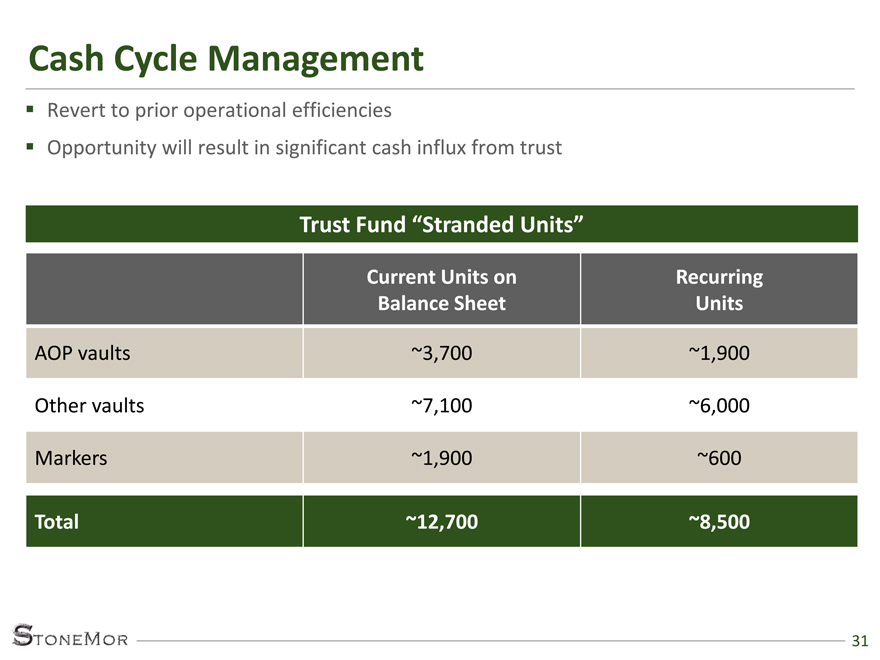
Cash Cycle Management
31
Current Units on
Balance Sheet
Recurring
Units
AOP vaults ~3,700 ~1,900
Other vaults ~7,100 ~6,000
Markers ~1,900 ~600
Total ~12,700 ~8,500
Trust Fund “Stranded Units”
Revert to prior operational efficiencies
Opportunity will result in significant cash influx from trust
|
|
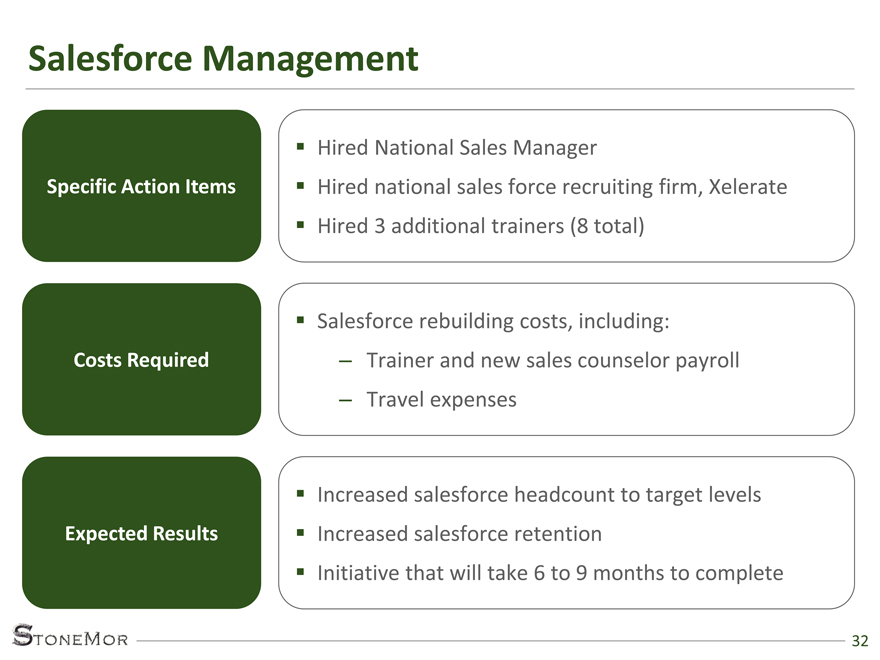
Salesforce Management
32
Costs Required
Expected Results
Specific Action Items
Hired National Sales Manager
Hired national sales force recruiting firm, Xelerate
Hired 3 additional trainers (8 total)
Salesforce rebuilding costs, including:
– Trainer and new sales counselor payroll
– Travel expenses
Increased salesforce headcount to target levels
Increased salesforce retention
Initiative that will take 6 to 9 months to complete
|
|
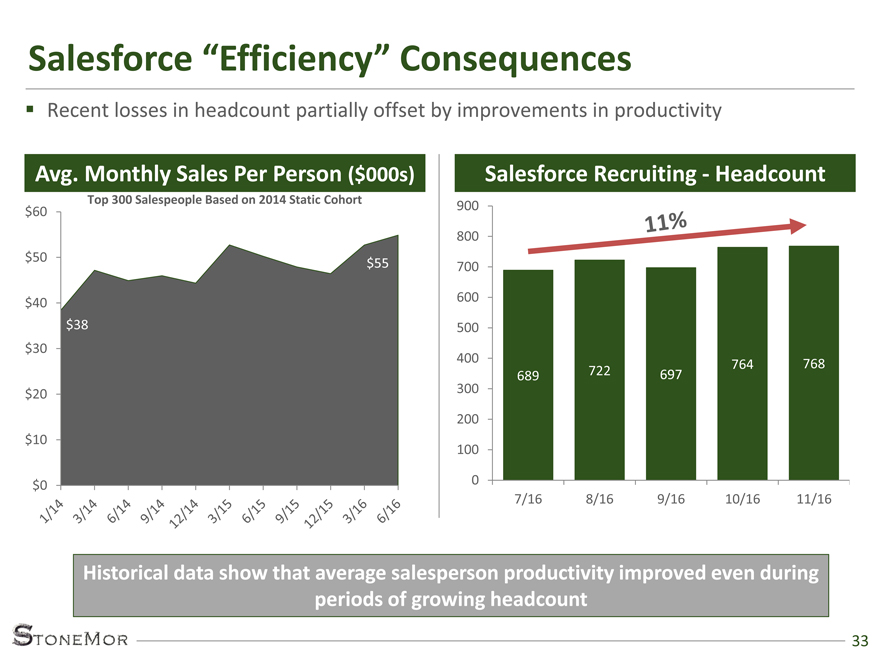
Salesforce “Efficiency” Consequences
33
Recent losses in headcount partially offset by improvements in productivity
Historical data show that average salesperson productivity improved even during
periods of growing headcount
$38
$55
$0
$10
$20
$30
$40
$50
$60
Avg. Monthly Sales Per Person ($000s) Salesforce Recruiting—Headcount
689 722 697
764 768
0
100
200
300
400
500
600
700
800
900
7/16 8/16 9/16 10/16 11/16
Top 300 Salespeople Based on 2014 Static Cohort
|
|
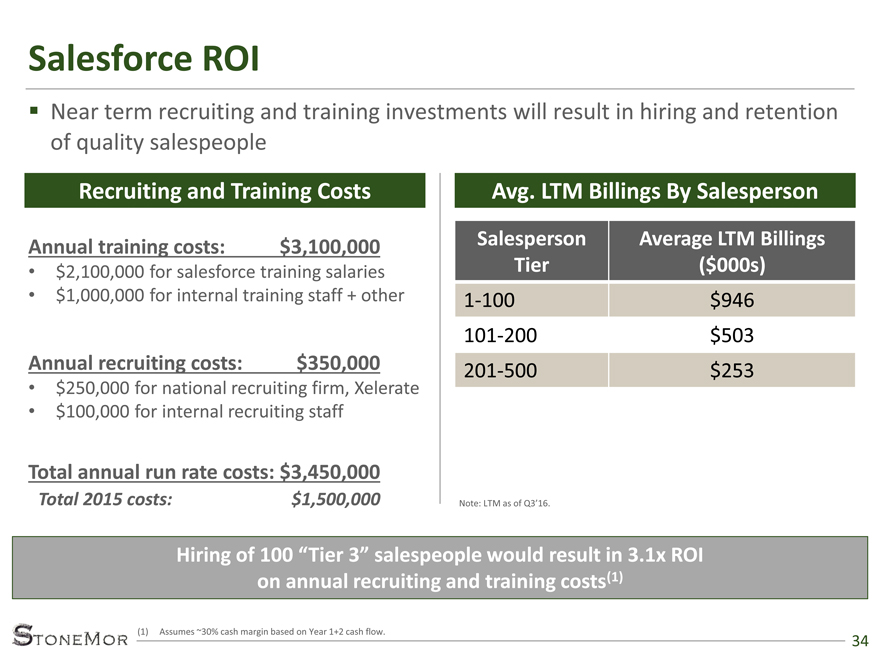
Salesforce ROI
34
Recruiting and Training Costs Avg. LTM Billings By Salesperson
Near term recruiting and training investments will result in hiring and retention
of quality salespeople
Salesperson
Tier
Average LTM Billings
($000s)
1-100 $946
101-200 $503
201-500 $253
Note: LTM as of Q3’16.
Annual recruiting costs: $350,000
• $250,000 for national recruiting firm, Xelerate
• $100,000 for internal recruiting staff
Annual training costs: $3,100,000
• $2,100,000 for salesforce training salaries
• $1,000,000 for internal training staff + other
Total annual run rate costs: $3,450,000
Total 2015 costs: $1,500,000
Hiring of 100 “Tier 3” salespeople would result in 3.1x ROI
on annual recruiting and training costs(1)
(1) Assumes ~30% cash margin based on Year 1+2 cash flow.
|
|
35
Next Steps / Visibility
|
|
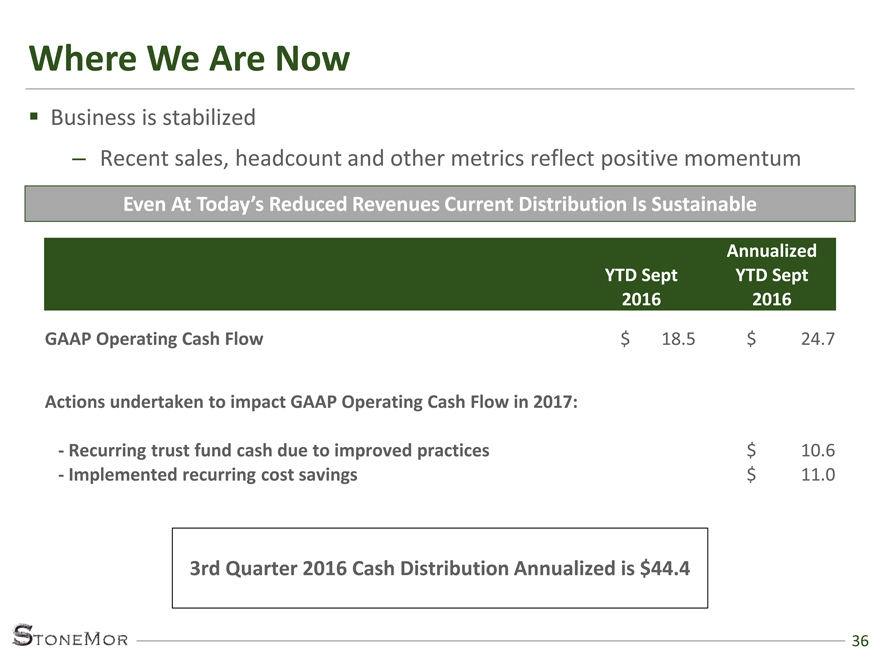
Where We Are Now
Business is stabilized
– Recent sales, headcount and other metrics reflect positive momentum
36
Annualized
YTD Sept YTD Sept
2016 2016
GAAP Operating Cash Flow $ 18.5 $ 24.7
Actions undertaken to impact GAAP Operating Cash Flow in 2017:
- Recurring trust fund cash due to improved practices $ 10.6
- Implemented recurring cost savings $ 11.0
Even At Today’s Reduced Revenues Current Distribution Is Sustainable
3rd Quarter 2016 Cash Distribution Annualized is $44.4
|
|
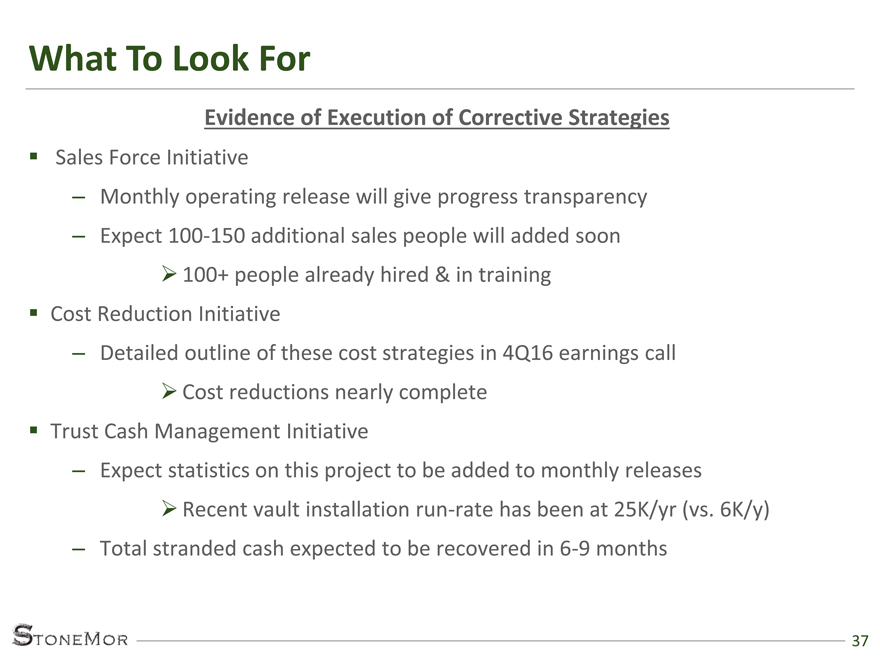
What To Look For
Evidence of Execution of Corrective Strategies
Sales Force Initiative
– Monthly operating release will give progress transparency
– Expect 100-150 additional sales people will added soon
100+ people already hired & in training
Cost Reduction Initiative
– Detailed outline of these cost strategies in 4Q16 earnings call
Cost reductions nearly complete
Trust Cash Management Initiative
– Expect statistics on this project to be added to monthly releases
Recent vault installation run-rate has been at 25K/yr (vs. 6K/y)
– Total stranded cash expected to be recovered in 6-9 months
37
|
|
Path To Distribution Growth
The trust fund cash management and costs initiatives are well underway
We are now singularly focused on the sales recovery effort
There is a direct correlation between sales headcount and operating results
However, success of this initiative initially shows up in non-GAAP operating
results
Visibility of the cash flow impact of this is complicated by SEC focus on non-
GAAP reporting
Therefore, as the sales force recovers, we expect to begin modestly increasing
distributions
However, the bulk of the increase in our DCF will initially be utilized to increase
our coverage ratio
We expect the operating recovery to be complete by YE 2017, with GAAP
operating cash flow demonstrating this in 2018.
38
|
|
39
Q&A
|
|
StoneMor Partners L.P.
3600 Horizon Blvd., Suite 100
Trevose, PA 19053
40
Contact:
John McNamara, Director – Investor Relations
Phone: (215) 826-2945
E-mail: jmcna@stonemor.com