Attached files
| file | filename |
|---|---|
| 8-K - FORM 8-K - International Seaways, Inc. | v454456_8k.htm |
Exhibit 99.1
International Seaways, Inc. 1 International Seaways, Inc. Investor Day December 6 th , 2016

International Seaways, Inc. Disclaimer Fo r w ar d - Loo ki n g Sta t e m e nt s • Dur ing the course of th i s presentation, the Co m pany ( International Seaways, Inc . (INSW)) m ay m a k e f or w ard - loo k ing state m ents or prov ide f or w ard - loo k ing in f or m at i on. All state m ents other than state m ents of h i storical f a c ts shou l d be c on s idered f or w ar d - loo k ing state m ent s . So m e of the s e state m ents i n c lude wor ds su c h as ‘‘out l oo k ,’’ ‘‘be l ie v e, ’ ’ ‘‘e x pe c t, ’ ’ ‘‘potent i a l ,’’ ‘‘cont i nue,’’ ‘‘ m ay ,’’ ‘‘will,’’ ‘‘shou l d, ’ ’ ‘‘cou l d, ’ ’ ‘‘see k ,’’ ‘‘predict, ’ ’ ‘‘int e nd,’’ ‘‘p l an, ’ ’ ‘‘e s ti m ate, ’ ’ ‘‘ant i cipat e ,’’ ‘‘target,’’ ‘‘pro j e c t, ’ ’ ‘‘ f oreca s t, ’ ’ ‘‘sha l l,’’ ‘‘conte m p l ate ’ ’ or the negati v e v ersion of tho s e wor ds or other co m parable word s . Although they re f le c t INSW ’s c u r r ent e x pe c tat i ons , the s e state m ents are not guarantees of f uture per f or m an c e, but i nvo l v e a nu m ber of r isks, un c ertaint i e s , and a s su m pt i ons which are d i ff ic u lt to predi c t. So m e of the f a c tors that m ay cau s e a c tual out c o m es and re s u l ts to d i ff er m ateria l ly f rom tho s e e x pressed in, or i m p l ied by , the f or w ar d - loo k ing state m ents in c lude, but a r e not ne c e s sari l y li m ited to, gener al e c ono m ic cond i tion s , co m pet i ti v e pressures, the natu re of the C o m pany ’s ser v ices and the i r pri c e m ove m ent s , and the ab i lity to r eta i n key e m p l oyee s . T he Co m pany does not under ta k e to update any f or w ard - loo k ing state m ents as a resu l t of f uture deve l op m ent s , new i n f or m at i on or other w is e . N on - G AA P F ina n cial M easures • In c luded in th i s presentation are certain no n - G AAP f inan c ial m ea s ures, in c lud i ng T i m e Charter Equ i v a l ent (“ T CE” ) rev enue, EBIT D A, and Ad j u s ted EBIT D A, de s igned to co m p l e m ent the f inan c ial in f or m at i on presented in a c cordance with genera l ly a c cepted a c counting princip l es in the United Sta t es of A m eri c a be c au s e m anage m ent be l ie v es su c h m ea s ures are u s e f ul to i nve s tors. T CE rev enue, which r epresents sh i pp i ng rev enues le s s v oyage e x pen s e s , i s a m ea s ure that co m pares revenue generated f rom a voyage charter to re v enue gener ated f rom a t i m e c harte r . EBIT D A r epresents net ( lo s s ) /in c o m e be f ore interest e x pen s e, in c o m e ta x es and depreciat i on and a m orti z at i on e x pen s e. Ad j u s ted EBIT D A c on s ists of EBIT D A adju s ted f or the i m pa c t of certain ite m s that we do not con s ider in d ic ati v e of our ongo i ng operating per f or m an c e. W e present no n - G AAP m ea s ures when we be l ie ve that the add i tional in f or m at i on is u s e f ul and m ean i ng f ul to i nve s tors. No n - G AAP f in an c ial m ea s ures do not have any s tandardi z ed m ean i ng and are there f ore un l ike l y to be co m parable to s i m ilar m ea s ures presented by other co m pan i e s. T he presentation of no n - G AAP f inan c ial m ea s ures is not i ntended to be a s ub s titute f or, and shou l d not be c on s idered in iso l at i on f ro m , the f inan c ial m ea s ur e s r eported in a c cordance with G AAP. See Append i x f or a re c on c iliat i on of certain no n - G AAP m ea s ures to the co m parable G AAP m ea s ures. • T h i s presentation a l so contains e s ti m ates and other in f or m at i on con c erning our indu s t r y that are ba s ed on indu s t r y pub l icat i o n s , sur v ey s and f oreca s t s . T h i s in f or m at i on in v ol v es a nu m ber of assu m ptions and li m itations, and w e ha v e not indepen d ently v e r i f ied the accu r acy or co m pleteness of the in f o r m ation. Available In fo rma t ion • Y ou m ay obtain additional information about the issuer, including a copy of INSW’s Form 10 registration statement, f or f ree by v isiting ED G AR on the S EC W eb site at www.se c .go v , or from the issuer’s website at www.intlseas.com . 2

International Seaways, Inc. Today’s Presenters Lois K. Zabrocky President & CEO International Seaways, Inc. Jeffrey D. Pribor Chief Financial Officer International Seaways, Inc. ▪ Most recently served as President for OSG’S International Flag strategic business unit, International Seaways’ predecessor company ▪ Joined OSG in 1992, previously held positions as Head of International Product Carrier & Gas Strategic Business Unit and head of the Aframax International Pool ▪ Joined International Seaways in 2016, as Chief Financial Officer ▪ Prior to joining International Seaways, Jeff was the Global Head of Maritime Investment Banking at Jefferies LLC, and prior to Jefferies LLC, he was the CFO of General Maritime Corporation 3

Company Overview

International Seaways, Inc. Two Industry - Leading Public Companies Enhanced Strategic Focus, Simplified Operating Structures, Strong Financial Profiles OVERSEAS SHIPHOLDING GROUP 5

International Seaways, Inc. • x Favorable time to invest in tanker industry x Strong balance sheet - low leverage provides protection and opportunities x Strong and transparent corporate governance x Large pure play international tanker company – 55 vessels; 6.5M DWT 1 x Balanced commercial strategy - substantial fixed cost coverage while low breakevens provide upside from spot rate exposure x Capital allocation strategy - opportunity to return excess cash to shareholders 6 International Seaways, Inc. (INSW) Overview Bright Future Rich History 1 Total Fleet DWT excludes LNG vessels

International Seaways, Inc. 7 INSW Overview Deleveraged Balance Sheet Operating Leverage Low Breakeven Fixed Cost Coverage Capital Allocation Policy ▪ 39 Vessels in pools provide upside in a rising market ▪ Every $5,000 TCE above $14,300 breakeven provides $68.7M in EBITDA ▪ Rigorous policies around twin goals of fleet renewal/growth and returning cash to shareholders ▪ JVs and 10 time chartered and bareboat vessels provide stable cash flow which covers fixed costs (G&A and debt service) ▪ $14,300 Fleetwide Cash Breakeven - Reduced G&A - Competitive OPEX - Low - amortizing debt (1% per year) ▪ 26% Debt to Capitalization ▪ < 40% Net Debt to Vessel Value ▪ Debt - EBITDA – 1.8x at 3Q 2016 LTM ▪ $160M Liquidity - $110M Cash at 3Q 2016 - $50M undrawn revolver Segment # Total DWT VLCC/ULCC 9 2,875,775 Aframax /LR2 8 897,858 Panamax/LR1 12 853,214 MR 20 955,968 Conventional Fleet Total 49 5,582,815 LNG 1 4 864,000 m 3 FSO 2 873,916 Total Fleet 2 55 6,456,731 Fleet 1 LNG vessels are typically described in cubic meters (m3) rather than DWT 2 Total Fleet DWT excludes LNG vessels

International Seaways, Inc. International Seaways Spin - Off 8 ▪ On Distribution date – November 30, 2016 - Holders of OSG common stock as of record date received 0.3333 shares of INSW stock for each OSG share - Holders of OSG warrants received 0.063327 share of INSW stock per warrant ▪ Record date for the spin - off – November 18, 2016 ▪ INSW Stock Price (1) : $12.95 ▪ Number of Shares Outstanding: 29,157,387 ▪ Market Capitalization: $378M ▪ Enterprise Value: $708M ▪ Create a pure play company which will: - Provide simplicity for investors, lenders and partners - Eliminate US income taxes - Improve strategic focus and management accountability - Provide the potential to broaden investor base - Enhance the ability to pursue industry consolidation opportunities including potential sales & acquisitions - Pursue capital allocation strategies which create shareholder value by renewing fleet and/or returning capital to shareholders on a more tax efficient basis 1 December 1, 2016 Mechanics Rationale for Spin

International Seaways, Inc. Experienced INSW Management Team Lois K. Zabrocky President & CEO ▪ Most recently served as President for OSG’S International Flag strategic business unit, International Seaways’ predecessor company ▪ Joined OSG in 1992, previously held positions as Head of International Product Carrier & Gas Strategic Business Unit and head of the Aframax International Pool Jeffrey D. Pribor Chief Financial Officer ▪ Joined International Seaways in 2016, as Chief Financial Officer ▪ Prior to joining International Seaways, was Global Head of Maritime Investment Banking at Jefferies LLC and earlier CFO of General Maritime Corporation James D. Small Chief Administrative Officer & General Counsel ▪ Joined OSG in 2015, prior to which he worked at Cleary Gottlieb Steen & Hamilton since 1996 ▪ At Cleary, he worked in New York, London and Hong Kong focusing on corporate and financial transactions, US securities law, capital markets and corporate governance William Nugent Head of International Fleet Operations ▪ Joined OSG in 2000 and rejoined OSG in 2006, most recently as Head of International Fleet Operations ▪ After rejoining in 2006 , he was Vice President of New Construction and Head of the Technical Services Group Derek Solon Chief Commercial Officer ▪ Joined OSG in 2012 most recently as Vice President, Commercial ▪ Prior to joining OSG, worked as a tanker broker at Poten & Partners and served as an intelligence officer in the US Navy 9

International Seaways, Inc. Strong, Transparent Corporate Governance Douglas D. Wheat Chairman of the Board ▪ Managing Partner of Wheat Investments Timothy J. Bernlohr Director ▪ Founder and Managing Member of TJB Management Consulting, LLC Ian T. Blackley Director ▪ President, CEO and Director of OSG Randee Day Director ▪ President and CEO of Day & Partners, LLC, Former CEO of DHT Joseph I. Kro nsbe rg Director ▪ Principal at Cyrus Capital Partners, L.P. Ronald Steger Director ▪ Retired Partner of KPMG Chad L. Valerio Director ▪ Former Portfolio Manager at BlueMountain Capital Management, LLC Ty E. Wallach Director ▪ Partner at Paulson & Co. Inc. Gregory A. Wright Director ▪ Co - Founder and CFO of One Cypress Energy, LLC 10 Majority Independent Board Rigorous Board Policies Committees Led by Independent Directors Board of Directors Industry Leading Governance Track Record (1) Highly professional management team and board of directors guided by rigorous capital allocation principles (1) OSG was ranked in 1 st quartile in Wells Fargo Securities Research’s Corporate Governance Rankings Strong Investor Participation

International Seaways, Inc. ▪ In 2014, adopted an outsourced technical and commercial operational model reducing costs and enhancing flexibility while retaining best in class quality Recent Accomplishments 11 INSW Spin - Off Significant Cash Generation G&A Reductions Adopted Outsourcing Model ▪ Rigorous and on - going drive to lower cash G&A has resulted in reduction from $39M in 2015 to a run rate G&A of $24M per year as of time of spin - off, equal to $1,340/vessel/day, one of the lowest among public tanker peers ▪ Significant cash generator – since 2014, INSW has generated over $560M of excess cash from operations used to return cash to shareholders and deleverage: - Deleverage INSW - $160M - Dividended $402M to parent for equity and bond repurchases and dividend payouts ▪ Successfully launched the International Seaways, Inc. spin - off, creating a stand alone pure play international tanker company

Investment Highlights

International Seaways, Inc. Investment Highlights - A Differentiated International Tanker Opportunity 13 Positioned to Optimize Revenue ● 55 vessel fleet with balanced mix of contracted cash flows and spot market upside ● Contracted revenue from 10 (1) time charters and JV cash flow cover fixed costs while 39 vessels with spot exposure provide significant upside opportunity ● LNG and FSO joint ventures have provided long term and stable revenue stream; approx. $35M in cash flows for LTM 3Q 2016 ● Operating leverage – every $5,000 of TCE equals $68.7M incremental EBITDA Lean & Scalable Model ● Best - in - class outsourced technical and commercial management ● Model allows for both low cost and scalability ● G&A significantly reduced – post - split target run rate G&A is $1,340/vessel/day, lowest third of tanker peers ● Competitive OPEX ● Overall company cash flow break - even of $14,300/vessel/day provides security and flexibility Capital Allocation Strategy ● Management guided by rigorous capital allocation strategy, including evaluation of returning cash to shareholders, purchasing vessels, and selling existing vessels ● Strong free cash flow will allow for dividends/returns to shareholders and fleet renewal ● Well maintained fleet provides excellent ROI; will be opportunistic about fleet renewal ● Pursue opportunities for market consolidation and value - enhancing strategic transactions ● Favorable market timing provides multiple opportunities to create value for shareholders Strong Financial Position ● Strong balance sheet with low leverage: less than 40% net debt to vessel valuations ● Ample liquidity – approximately $160M available from cash and undrawn revolver as of 3Q 2016 ● Advantageous debt facility with minimal amortization contributes to low cash break - even ● Minimal capital expenditure commitments – no newbuildings (1) Excludes Raphael, which comes off of time charter during the first half of December 2016

International Seaways, Inc. Capital Allocation Strategy 14 Policy/Goals Balance Sheet Liquidity Consolidation Timing CAPEX ▪ Currently $160M ▪ Over three years of fixed cost coverage ▪ 1% annual amortizing debt until bullet maturity 3Q 2019 ▪ No newbuilding commitments ▪ No external funding requirements ▪ Favorable point in tanker cycle provide multiple opportunities for company and is an opportune entry point for investors ▪ Acquisitions/sales/mergers will be evaluated in comparison to all other capital allocation alternatives ▪ Fleet renewal and returning cash to shareholders - Fleet renewal – focus is on the water vessels - Returning cash – dividends, share repurchases ▪ Maintain strong balance sheet throughout cycle ▪ Target <= 50% LTV ▪ Currently < 40%

International Seaways, Inc. Strong Financial Position ▪ 3Q 2016 Debt of $440M and $110M Cash. Net Debt $330M - 26% Debt to Total Book Capital - Less than 40% Net Debt to Market Value of Vessels - Debt to EBITDA of 1.8x for LTM 3Q 2016 ▪ Value of JVs not included in the above leverage figures ▪ $110M Cash as of 3Q 2016 & $50M undrawn revolving credit facility Low Leverage Liquidity Favorable Debt Characteristics ▪ Term Loan B matures August 2019 ▪ Minimal mandatory amortization of 1% per year lowers cash breakeven Minimal Capital Expenditures ▪ No newbuild commitments ▪ Dry dock and maintenance capital expenditure only 15

International Seaways, Inc. $38.7 $33.2 $25.0 $24.0 $0.0 $5.0 $10.0 $15.0 $20.0 $25.0 $30.0 $35.0 $40.0 $45.0 2015 2016 (annualized) 2017 Target (with Transition Costs) 2017 Target Run Rate $M Lean and Scalable Model – Significantly Reduced G&A 16 ▪ Outsourced model allows for a lean organizational structure ▪ Business can scale up without material overhead changes ▪ Low target run rate cash G&A – $1,340/vessel/day is among best in tanker industry ▪ Maintaining a culture of continuous cost improvement $2,140/vessel/day $1,850/vessel/day INSW G&A – 2015 to Target 2017 $1,400/vessel/day $1,340/vessel/day The $8M reduction in G&A from 2016 to 2017 is primarily driven by a reduction in headcount. A number of positions were made redundant as a result of the simplified INSW business model

International Seaways, Inc. Lean and Scalable Model – OPEX 17 15 ▪ Highly competitive OPEX numbers ▪ Assets maintained to top quality/vetting standards by INSW specific criteria ▪ INSW 3Q 2016 YTD Average Daily OPEX for owned and bareboat - in vessels is approx. $8,000 INSW Daily OPEX excludes DDK deviation bunkers, insurance claims and one - off expenses Only includes Owned and Bareboat Chartered In vessels Daily Dollars basis Operating Days $8,737 $7,940 $8,177 $7,371 $6,500 $7,000 $7,500 $8,000 $8,500 $9,000 ULCC & VLCC Aframax Panamax MR Crewing 53% Stores 8% Spares 8% Fees & Services 7% Insurance Premiums 6% Management Fees 5% Repairs 4% Lubes 3% Transportation 3% SQE, Vetting, Environmental 3% 3Q 2016 YTD Daily OPEX Owned and Bareboat - In Vessels 3Q 2016 YTD OPEX Categories Average Daily OPEX / Vessel

International Seaways, Inc. Confidential Lean and Scalable Model – Operations KPI Benchmark 0.0 0.2 0.4 0.6 0.8 1.0 1.2 1.4 1.6 Chapter 2 Chapter 3 Chapter 4 Chapter 5 Chapter 6 Chapter 7 Chapter 8 Chapter 9 Chapter 10 Chapter 11 Chapter 12 Intertanko Industry Average INSW 2. Certification and Documentation 3. Crew Management 4. Navigation 5. Safety Management 6. Pollution Prevention 7. Structural Condition 8. Petroleum 9. Mooring 10. Communications 11. Engine/Steering Compartments 12. General Appearance Sire Observations per Chapter Sire Observations 2 3 4 5 6 7 8 9 10 11 12 Chapters ▪ Ship Inspection Reporting Program (Sire) inspections are of top importance to oil majors ▪ Fewer observations = superior performance ▪ From 2015 to 2016 INSW has had a 13% reduction in the number of observations per inspection 18

International Seaways, Inc. Lean and Scalable Model – Experience Drives Performance 19 Pro v ides global di v ersific at i on w ith expande d customer base Experienced crews trained in best practices drive operational success ▪ Our customers through Oil Companies International Marine Forum (OCIMF) independently inspect and measure all tankers ▪ In 2016, our ships had fewer observations per inspection on average than the rest of the world fleet (3.29 vs 3.32) ▪ Our Ships outperform the world fleet in ▪ Safety Management ▪ Navigation ▪ Pollution Prevention ▪ Seaways dedicated pool of 1,487 active crew members ▪ 94.4% Retention Rate ▪ Multiple Nationalities ▪ Filipino, Russian, Italian, Chinese, Croatian ▪ In December, we recognize our crews with service awards: ▪ 25 years: 7 crewmembers ▪ 20 years: 35 crewmembers ▪ 15 year: 123 crewmembers ▪ 10 years: 93 crewmembers ▪ 5 years: 66 crewmembers ▪ We invest in training because it stays in the fleet Experienced Trained Crews Technical Excellence

International Seaways, Inc. $0 $2,000 $4,000 $6,000 $8,000 $10,000 $12,000 $14,000 $16,000 $18,000 VLCC Aframax Panamax MR INSW Vessel Expenses DDK & CAPEX G&A Debt Service Lean and Scalable Model – Low Breakevens 20 $17,000 $13,400 $14,000 $12,900 $14,300 INSW Daily OPEX excludes DDK deviation bunkers, insurance claims and one - off expenses Only includes owned vessels. Three bareboat - in vessels have charter hire and OPEX expenses of approx. $13,900 per day Breakevens basis Revenue Days Low TCE breakeven allows INSW to navigate low points in the tanker cycle while providing significant operating leverage in rising markets Breakeven Rates by Sector Basis 3Q 2016 YTD Actuals

International Seaways, Inc. Positioned to Optimize Revenue – Diversified Fleet S our c e : c o mm er cial poo l w eb sit e s 1 Represents the number of vessels in each class as a percentage of the International Flag fleet, as of September 30, 2016. Do e s not include JV vessels. 2 Does not include three vessels operating on Commercial Management Agreements (CMAs) or the Raphael which comes off time chart e r during the first half of December 2016 V LC C / U L C C 19% P ana m a x / LR 1 24% B y V e s s e l C la s s (1) MR 41% Af ra m a x / LR 2 16% V ess e l T y pe Size (dwt) INSW Fl e et TC & BB Out (2) VLCC / ULCC 300,000 – 440,000+ 9 2 A f ra m ax / LR2 112,000 – 113,000 8 - Pana m a x / LR1 70,000 – 75,000 12 6 MR 36,000 – 51,000 20 2 T o t al Cru d e & Product Fleet 49 10 LNG 216,000 m 3 4 FSO 432,000 – 442,000+ 2 T o t al JV Fleet 6 21 INSW Tanker Fleet

International Seaways, Inc. Positioned to Optimize Revenue – Balanced Revenue Mix 22 ▪ Sufficient scale allows optimization strategies to maximize Time Charter Equivalent revenue ▪ Builds economies of scale to drive down cost ▪ Creates flexibility for INSW to scale up or down without adding overhead cost 39 Tankers in Pools (including CMAs) ▪ 20% of conventional fleet deployed on time and bareboat charters ▪ Time charters will be continually evaluated 10 Tankers on Time and Bareboat Charter ▪ 2 x FSO and 4 x LNG JVs provide diversification of income ▪ $35M in cash flows for LTM 3Q 2016 6 Joint Venture Units Current Vessel Deployment Strategy Contracted cash flows covered overhead and debt service $0 $20 $40 $60 $80 $100 $120 $140 Contracted Cash Flow - LTM 3Q 2016 Overhead & Debt Service - LTM 3Q 2016 Time Charter Revenues $86M JV Distributions $35M Debt Service $47M G&A $36M

International Seaways, Inc. Positioned to Optimize Revenue – Upside from Pool Employment 23 Pools VLCC Aframax Aframax /LR2 Panamax / LR1 MR MR Total # of INSW Vessels 5 7 1 6 2 14 35 2 # of Total Vessels 36 1 42 18 29 67 28 220 Other Participants Rationale for Participation Largest VLCC pool and provides best access to China and Caribbean Concentration in the best Western shipping routes Clean petroleum focused management Consistently highest spot rates via South America Partnership Strength in a local European market Expertise in the Americas High vessel utilization rates Commercial pools selected for specific expertise Offers customers greater flexibility and higher service levels Capitalize on attractive time charter opportunities Source: commercial pool websites. Note: Number of total vessels per pool as of Nov 1, 2016. 1 36 VLCCs operated by TI International joined with 15 VLCCs of Frontline in an alliance to create VLCC Chartering Ltd in Octob er 2014. Only the vessels operated solely by the TI pool are reflected above. 2 INSW vessels not operating in pools include 9 vessels on time charters, one MR on bareboat charter, and 4 vessels operating o n CMAs, including the Raphael INSW participates in six market - leading commercial pools, generating increased utilization and cash flow

International Seaways, Inc. $10,000 $15,000 $20,000 $25,000 $30,000 3Q 2016 YTD INSW Spot Rate TD9* Clarksons Average c. 2010-built $5,000 $10,000 $15,000 3Q 2016 YTD INSW Spot Rate TC2/TC14* Clarksons Avg MR Earnings $10,000 $15,000 $20,000 $25,000 3Q 2016 YTD INSW Spot Rate TD21** Clarksons Avg Panamax Earnings • Spot Aframaxes outperformed TD9 by $7,500 per day and beat the Clarksons’ Average • Earning days, including paid port time, are 75% of operating days • Efficient COAs assist in increasing utilization Positioned to Optimize Revenue – Vessels Have Outperformed Markets 24 $/Da y Source: Clarksons *TCE as reported by Clarksons’ Shipping Intelligence Network **No TCE available from Clarksons’ Shipping Intelligence Network; only recorded as worldscale rates VLCCs Aframax / LR2 Panamax / LR1 MRs $30,000 $35,000 $40,000 $45,000 $50,000 3Q 2016 YTD INSW Spot Rate TD3* Clarksons Average c. 2010-built • Spot VLCCs outperformed TD3 and Clarksons’ Average by over $5,000 per day for the period • Laden/ballast ratio of 58% of at sea days over the period • Strong relationships with Chinese oil companies • Spot Panamaxes out earned the Clarksons’ Average by over $5K per day for the period • Laden/ballast ratio in excess of 60% over the period when adjusting for Panamax Canal delays • Very close partnership with South American oil producers • Spot MRs out earned the TC2/TC14 index and the Clarksons’ Average during the period • Earning days, including paid port time, are 75% of operating days • Global chartering presence with strong ties to Latin American charterers +14% TD3 +13% Clarksons’ Index +47% TD9 +2% Clarksons’ Index +7% TC2/TC14 +6% Clarksons’ Index +32% Clarksons’ Index

International Seaways, Inc. Positioned to Optimize Revenue – Contracted Cash from FSO JV 25 Pro v ides global di v ersific at i on w ith expande d customer base 50% owner of a Joint Venture with Euronav that owns two Floating Storage and Offloading (FSO) units with multi year contracts to process oil for export for Qatar Petroleum ▪ FSO paid $30M in cash contributions to INSW over last 12 months ▪ $85.5M in total cash contributions to INSW since 2014 ▪ Existing debt of the JV will be paid off at the end of the current contract in Q3 2017 ▪ Qatar Petroleum expects field life to last for decades to come ▪ Vessels lives extend through 2032 ▪ Contract extension negotiations ongoing with new field operator Total and majority partner Qatar Petroleum Specialized Assets Enhance Value of Exported Crude Source of Significant Cash Contributions ▪ Assets specifically designed to process 100% of crude oil exports from Al Shaheen field in Qatar: ▪ Field produces 270,000 – 300,000 bpd of crude with high water content ▪ JV initially approached by field operator as the partners owned the only double hull ULCCs ▪ Large 3 million barrel units provide the field operator with spare capacity allowing production to continue uninterrupted ▪ FSOs have sophisticated oil/water separation plant that process oil and increases the quality of the crude ▪ Several other bespoke features at request of field operator ● Top tier technical management and safety performance through JV partner

International Seaways, Inc. 26 Pro v ides global di v ersific at i on w ith expande d customer base 49.9% owner of a Joint Venture with Nakilat that owns four LNG carriers on long term charter for export of LNG from Qatar ● JV has paid $5M in cash distributions to INSW on average from 2011 to 2015 after fully servicing debt which is non - recourse to the company ● All ships are on charter for 25 years to Qatar Liquefied Gas Company through 2032/2033 ● Charterer holds two five - year options to extend ● Hire rate has an OPEX escalation component ● JV Partner is the Qatari LNG Shipping company with a strong relationship with customer Qatar Gas ● Ships have five cargo tanks with membrane - type containment system allowing transportation of cargo at - 163 ƒ C ● Dual main engines, twin propellers and five generator sets provide redundancy that enhances safe operation ● All vessels fitted with re - liquefication plants allowing the cargo quantity loaded to match the quantity discharged ● Top tier technical management and safety performance through JV partner Positioned to Optimize Revenue – Contracted Cash from LNG JV Strong Partner in Diversified Assets Cash Contributions Through Long Term Charters

International Seaways, Inc. 27 ▪ Asset - light service business based in Houston ▪ Provides STS coverage in US Gulf, US Pacific, US Atlantic, Grand Bahama and Panama - INSW market share of the US lightering market is approximately 30 - 35% ▪ Lightering unit generated EBITDA of over $2.3M over the last 12 months. The investment from INSW is about $1.8M, ROA is 128% ▪ Over 30% increase in operations when compared to 2015 ▪ Key Customers include Valero, Trafigura , Vitol, Lukoil and Baere Maritime – same customer base Provides Ship - to - Ship (STS) transfer equipment and expertise to provide for waterborne movement of crude oil and refined petroleum products 0 100 200 300 Number of Operations Increasing STS Operations 2015 2016 Positioned to Optimize Revenue – Cash from Lightering

Market Fundamentals

International Seaways, Inc. Market Fundamentals – Demand Drives the Business 29 $/Day $/D a y Source: Lloyds Maritime Intelligence, EIA November Short Term Energy Outlook Demand Strong Chinese Seaborne Petroleum Imports Encouraging signs continue on demand side 5.0 5.5 6.0 6.5 7.0 7.5 8.0 +8.7% CAGR Chinese Seaborne Petroleum Imports ( Mbpd ) • Chinese demand remains strong with a growing trend • Record setting monthly crude imports in 2016 78 80 82 84 86 88 90 92 94 96 98 2009 2010 2011 2012 2013 2014 2015 2016 2017 +2.2% CAGR since financial crisis • Overall, positive trend in demand for oil continues • EIA calling for increase in demand of 1.6% (1.5 million barrels per day) between 2016 - 2017 Global Liquid Fuel Consumption

International Seaways, Inc. Chinese Gasoline Imports ( kMT ) 0 1000 2000 3000 4000 2010 2011 2012 2013 2014 2015 2016 E Total Chinese Product Exports ( kMT ) 5000 15000 25000 35000 2010 2011 2012 2013 2014 2015 2016 E Market Fundamentals – Favorable Demand Dynamics in Product Sector 30 $/Day $/D a y Source: Castor; CR Weber 5.00 7.00 9.00 11.00 13.00 January-09 January-10 January-11 January-12 January-13 January-14 January-15 January-16 MR Sea Mile Demand (Million) Export - oriented Teapot Refineries: Permits granted in the start of 2015 both increased crude oil imports and increased product available for export But location of refineries does little to satiate growing demand for gasoline in China so imports continue to rise • MR Sea Miles maintain their upward, long - term trend • Period since financial crisis saw US become largest refined product exporter +10% CAGR

International Seaways, Inc. Market Fundamentals - Supply 31 $/Day $/D a y 0 10 20 30 40 50 60 70 80 90 100 Fewest orders in 20 years 0 20 40 60 80 100 HHI Ulsan HHI Samho HHI Gunsan HMD Samsung DSME Sungdong STX SPP Daehan Last 5 yrs capacity Current capacity Projected Capacity Source: Clarksons , MJLF Low Ordering Activity and Shrinking Yard Capacity Set the Stage for Strong and Sustained Recovery Deliveries Projected Shrinking Shipyard Capacity (S. Korea) Tanker Contracting (million DWT) South Korean Shipyard Capacity 0 5 10 15 20 25 30 35 40 45 2008 2009 2010 2011 2012 2013 2014 2015 2016 2017 2018 2019 2020 DWT, millions VLCC Aframax Panamax MR Low Ordering Activity

International Seaways, Inc. • IMO requirements enter into force Sept 7, 2017 • At the first IOPP certificate renewal after this date, ships must be fitted with a ballast water treatment system. IOPP renewals generally coincide with five year Special Surveys • Ballast treatment systems remove or kill or render non - functioning potentially invasive non - native microbiological organisms • There are other national and local ballast discharge standards which also must be complied with, some of which may require treatment systems • Ballast water treatment system equipment costs for tankers range between $1 to $2 million dollars depending on the technology and size of vessel. • Installation costs vary by system complexity and size but may range as high as $1 million dollars • Retrofits to existing ships are challenging given space requirements for the equipment and piping and especially challenging for tankers because of the need to safely fit this equipment in hazardous area zones. Market Fundamentals - Regulatory Environment 32 Ballast Water Treatment System • On Oct 27, 2016, IMO announced the ratification of regulations requiring a reduction of sulfur content in fuels • Content to drop from 3.5% to 0.5% effective Jan 1, 2020 • Ship owners can either burn new, cleaner fuels or burn existing fuel but install equipment to scrub the sulfur from the exhaust • Scrubber technology is expensive ($4 to $10 million), novel, and highly complex • Operations of scrubbers will likely increase vessels’ daily operating expense • It is possible that there will be an insufficient supply of new fuels in 2020 • IMO will review implementation in 2018 based on availability of low sulfur fuel • Price of these fuels will be significantly higher than today’s fuel prices New Sulfur Emission Requirement
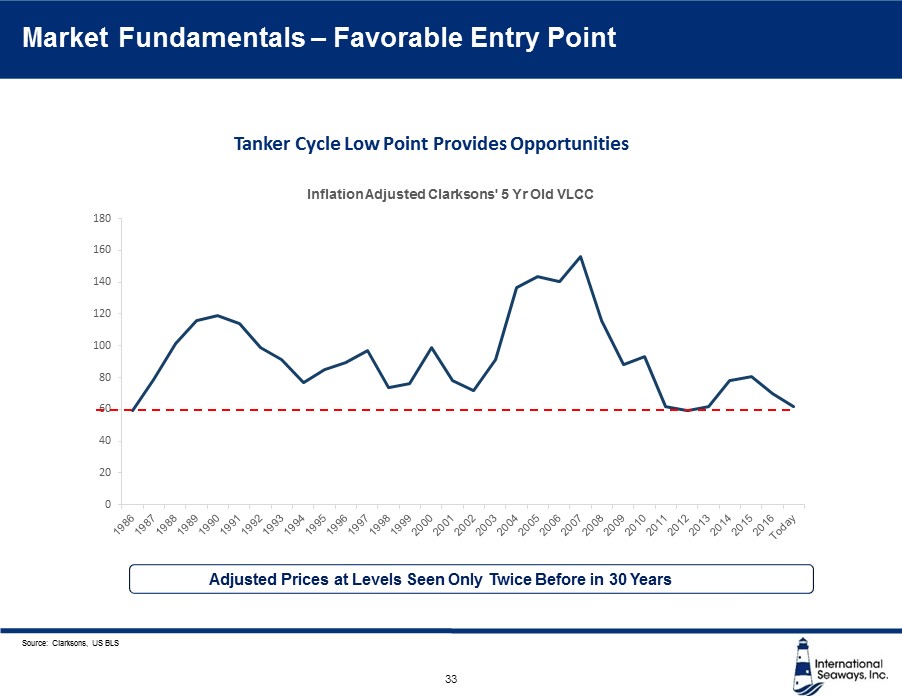
International Seaways, Inc. 0 20 40 60 80 100 120 140 160 180 Inflation Adjusted Clarksons' 5 Yr Old VLCC Source: Clarksons, US BLS Adjusted Prices at Levels Seen Only Twice Before in 30 Years 33 Tanker Cycle Low Point Provides Opportunities Market Fundamentals – Favorable Entry Point

Financial Overview

International Seaways, Inc. Strong Financial Position – Balance Sheet 35 September 30, 2016 ( $ M) Assets Liabilities Cash and Equivalents $110 Current Liabilities $44 Other Current Assets $61 Long Term Debt Other Long Term Liabilities $433 $7 Total Current Assets $171 Total Liabilities $484 Vessels $1,173 Equity Other Long Term Assets $365 Total Equity $1,225 Total Assets $1,709 Total Liabilities and Equity $1,709 Strong balance sheet and low breakevens protect INSW during low portions of tanker cycle and provide opportunity for growth and returning cash ▪ Term Loan B ▪ Original Amount: $628M ▪ Current Amount: $440M ▪ Maturity: August 2019 ▪ Amortization: 1% / year ▪ Rate: LIBOR +475 bps ▪ Covenant: FMV >= $500M LTM EBITDA 1 : $252M Debt to LTM EBITDA: 1.8x Net debt to LTM EBITDA: 1.3x Debt to Total Capitalization: 26% Net Debt to Fleet Value 2 : <40% INSW Debt Enterprise Value: $708M Enterprise Value vs LTM EBITDA : 2.8x Tanker Peer Universe 3 : 7.0x 1 Includes Equity Income from JVs 2 Excludes Value of JV 3 Source: Jefferies and Bloomberg

International Seaways, Inc. Strong Financial Position – Robust Revenue Generator 36 Avg. Fleet 2 60 50 49 Source: Company filings 1 See Appendix for reconciliation s . 2 Represents average fleet size over each period. 3 9 % 39 % 48 % $16,548 $27,551 $24,461 2014 2015 3Q16 LTM TCE Revenue Per Day Rev. Days 20,969 17,270 17,280 Average – Per Day Per Vessel (US$) TCE Revenue ($M) 1 Historical Adjusted EBITDA ($M) 1 $137 $299 $252 2014 2015 3Q16 LTM Adjusted EBITDA 228 304 288 119 172 135 $347 $476 $423 2014 2015 3Q16 LTM Crude Product

International Seaways, Inc. 1 Applies illustrative rate increases shown above to actual spot days for the last 12 months, ending 3Q2016, to calculate the i ll ustrative incremental EBITDA increase. Source: Clarksons ’ Shipping Intelligence Network Incremental EBITDA from Higher Rates 1 Cash Flow from Operating Leverage Spot exposure from participation in a diverse group of commercial pools positions INSW to benefit from strength in the international tanker market 253 253 253 42 127 212 3Q16 LTM EBITDA +$5k / Day (Crude) +$1k / Day (MR) +$15k / Day (Crude) +$3k / Day (MR) +$25k / Day (Crude) +$5k / Day (MR) Illustrative Effect of Increasing International Spot Rates ($ M) $ 252 $ 294 $ 379 $ 464 ▪ INSW can generate substantial incremental EBITDA from relatively small increases in spot rates ▪ Illustrates INSW’s ability to benefit significantly in an increasing rate environment VLCC Aframax MR 12 Year Average TCE 50,500 28,100 18,000 Peak Year TCE 98,300 50,000 29,900 Historical TCEs 37

International Seaways, Inc. Free Cash Flow INSW’s already sufficient free cash flow improves as the spot markets strengthen Incremental Improvement of Free Cash Flow ($M) $176.9 $245.6 $314.3 $383.0 $451.6 $0.0 $100.0 $200.0 $300.0 $400.0 $500.0 $600.0 $700.0 $800.0 3Q16 LTM +$5k / Day +$10k / Day +$15k / Day +$20k / Day G&A Debt Service Charter Hire DDK&CAPEX OPEX Free Cash Flow LTM 3Q 2016: Debt Service, Overhead & Vessel Operating Costs 38

Closing Remarks

International Seaways, Inc. Investment Highlights - A Differentiated International Tanker Opportunity 40 Positioned to Optimize Revenue ● 55 vessel fleet with balanced mix of contracted cash flows and spot market upside ● Contracted revenue from 10 (1) time charters and JV cash flow cover fixed costs while 39 vessels with spot exposure provide significant upside opportunity ● LNG and FSO joint ventures have provided long term and stable revenue stream; approx. $35M in cash flows for LTM 3Q 2016 ● Operating leverage – every $5,000 of TCE equals $68.7M incremental EBITDA Lean & Scalable Model ● Best - in - class outsourced technical and commercial management ● Model allows for both low cost and scalability ● G&A significantly reduced – post - split target run rate G&A is $1,340/vessel/day, lowest third of tanker peers ● Competitive OPEX ● Overall company cash flow break - even of $14,300/vessel/day provides security and flexibility Capital Allocation Strategy ● Management guided by rigorous capital allocation strategy, including evaluation of returning cash to shareholders, purchasing vessels, and selling existing vessels ● Strong free cash flow will allow for dividends/returns to shareholders and fleet renewal ● Well maintained fleet provides excellent ROI; will be opportunistic about fleet renewal ● Pursue opportunities for market consolidation and value - enhancing strategic transactions ● Favorable market timing provides multiple opportunities to create value for shareholders Strong Financial Position ● Strong balance sheet with low leverage: less than 40% net debt to vessel valuations ● Ample liquidity – approximately $160M available from cash and undrawn revolver as of 3Q 2016 ● Advantageous debt facility with minimal amortization contributes to low cash break - even ● Minimal capital expenditures commitments – no newbuildings (1) Excludes Raphael, which comes off of time charter during the first half of December 2016

Q&A
Appendix

International Seaways, Inc. INSW TCE Revenue in thousands of dollars LTM ended September 30, 2016 Year ended December 31, 2015 Year ended December 31, 2014 Time charter equivalent revenues 422,686 475,790 346,987 Add: Voyage expenses 14,793 21,844 170,031 Shipping revenues 437,479 497,634 517,018 43

International Seaways, Inc. INSW Continuing Operations – Adjusted EBITDA in thousands of dollars LTM ended September 30, 2016 Year ended December 31, 2015 Year ended December 31, 2014 Net (loss)/income $77,140 $173,170 ($119,099) Income tax provision $411 $140 $744 Interest expense $40,885 $42,970 $56,258 Depreciation and amortization $81,678 $81,653 $84,931 EBITDA $200,114 $297,933 $22,834 Technical management transition costs - $39 $3,417 Severance costs - - $16,666 Loss/(gain) on disposal of vessels, including impairments $49,414 ($4,459) ($9,955) Loss on repurchase of debt $1,342 - - Other costs associated with repurchase of debt $225 - - Reorganization items, net $1,049 $5,659 $104,528 Adjusted EBITDA $252,144 $299,172 $137,490 44

International Seaways, Inc. Glossary of Commonly Used Shipping Terms 45 Source: Tankers International, various industry websites Handysize Product Carrier:29,000 - 39,999 MR: 40,000 – 54,999 Panamax / LR1: 55,000 - 79,999 Aframax / LR2: 80,000 - 119,999 Suezmax: 120,000 – 199,999 VLCC: 200,000 – 319,999 ULCC: 320,000 + Tanker Sizes (DWT) Bareboat: Where a vessel is chartered for a period of time and where the hire payment excludes crew and maintenance costs Broker: Develop business between ship owners and charterers, we well as provide information about the market Bunkers: Fuel used by ships Charter Party: Contract between a ship owner and a charterer Charterer: Ship owner’s customer given full use of the ship for a specified time (time charter or bareboat charter) or for a specific voyage (voyage or spot charter) Commercial Management Agreement (CMA): An agreement with a pool operator where they handle all the chartering and commercial operations of the vessel, and earnings are kept segregated from the rest of the pooling system. Contract of Affreightment (COA): An agreement by a ship owner to provide cargo space on a ship or ships at a specified time at a specified price DDK: Drydock Deadweight: The weight a vessel can carry, including cargo, bunkers, fresh water and stores Demurrage: Liquidated damages paid by charterers to compensate an owner for exceeding the time allowed under a charter party for load and discharge Drydock: Waterless dock allowing access to hull/propulsion mechanisms for repair or servicing DWT: Deadweight Tons FSO: Floating Storage and Offloading Freight: The money a ship owner is paid in return for carrying cargo Idle Days: Time during which a ship is unemployed IMO: International Maritime Organization Intertanko : An industry association for independent tanker owners and operators IOPP: International Oil Pollution Prevention (certificate) KPI: Key Performance Indicator Laden: When a vessel has cargo onboard Laden/Ballast: The ratio between when a vessel is carrying cargo (laden condition), and when it is not (ballast condition) Laycan: The dates between which a vessel must present itself at the first load port LNG: Liquefied Natural Gas OCIMF: Oil Companies International Marine Forum Off Hire: Time during which repairs are carried out on a vessel. The time is charged to the owner’s account OPEX: Operating Expense SIRE: Ship Inspection Report program Spot Charter / Spot Fixture: When a ship is chartered for a single voyage TCE: Time Charter Equivalent Time Charter: When a vessel is hired for a specified period of time. Hire payments include compensation for the crew and maintenance, which are provided by owners Time Charter Equivalent: The amount of money in US Dollars per day on a particular voyage, net of commercial operation costs Worldscale : An international freight index for tankers that provides a method of calculating the freight applicable to transporting oil by reference to a Standard Vessel on a round trip voyage from one or several load ports to one or several discharge ports.