Attached files
| file | filename |
|---|---|
| EX-32.2 - EXHIBIT 32.2 - J&J SNACK FOODS CORP | ex32-2.htm |
| EX-32.1 - EXHIBIT 32.1 - J&J SNACK FOODS CORP | ex32-1.htm |
| EX-31.2 - EXHIBIT 31.2 - J&J SNACK FOODS CORP | ex31-2.htm |
| EX-31.1 - EXHIBIT 31.1 - J&J SNACK FOODS CORP | ex31-1.htm |
| EX-23.1 - EXHIBIT 23.1 - J&J SNACK FOODS CORP | ex23-1.htm |
| EX-21.1 - EXHIBIT 21.1 - J&J SNACK FOODS CORP | ex21-1.htm |
| EX-4.5 - EXHIBIT 4.5 - J&J SNACK FOODS CORP | ex4-5.htm |


UNITED STATES
SECURITIES AND EXCHANGE COMMISSION
Washington, D.C. 20549
FORM 10-K
(X) ANNUAL REPORT PURSUANT TO SECTION 13 OR 15(d) OF THE SECURITIES EXCHANGE ACT OF 1934 FOR THE FISCAL YEAR ENDED SEPTEMBER 24, 2016
( ) TRANSITION REPORT PURSUANT TO SECTION 13 OR 15 (d) OF THE SECURITIES EXCHANGE ACT OF 1934 FOR THE TRANSITION PERIOD FROM TO
Commission File No. 0-14616
J & J SNACK FOODS CORP.
(Exact name of registrant as specified in its charter)
|
New Jersey |
22-1935537 |
|
(State or other jurisdiction of incorporation or organization) |
(I.R.S. Employer Identification No.) |
|
|
|
|
6000 Central Highway |
08109 |
|
Pennsauken, New Jersey |
(Zip Code) |
| (Address of principal executive offices) |
Registrant's telephone number, including area code: (856) 665-9533
Securities Registered Pursuant to Section 12(b) of the Act:
|
Title of Each Class |
Name of Each Exchange on Which Registered |
|
Common Stock, no par value |
The NASDAQ Global Select Exchange |
Securities Registered Pursuant to Section 12(g) of the Act: None
Indicate by check mark if the registrant is a well-known seasoned issuer, as defined in Rule 405 of the Securities Act. Yes X No
Indicate by check mark if the registrant is not required to file reports pursuant to Section 13 or 15(d) of the Act. Yes ___ No X
Indicate by check mark whether the registrant (1) has filed all reports required to be filed by Section 13 or 15(d) of the Securities Exchange Act of 1934 during the preceding 12 months (or such shorter period that the registrant was required to file such reports), and (2) has been subject to such filing requirements for the past 90 days. Yes X No ___
Indicate by check mark whether the registrant has submitted electronically and posted on its corporate Web site, if any, every Interactive Data File required to be submitted and posted pursuant to Rule 405 of Regulation S-T (§232.405 of this chapter) during the preceding 12 months (or for such shorter period that the registrant was required to submit and post such files). Yes X No ___
Indicate by check mark if disclosure of delinquent filers pursuant to Item 405 of Regulation S-K (229.405 of this chapter) is not contained herein, and will not be contained, to the best of Registrant's knowledge, in definitive proxy or information statements incorporated by reference in Part III of this Form 10-K or any amendment to this Form 10-K.
Indicate by check mark whether the registrant is a large accelerated filer, an accelerated filer, a non-accelerated filer, or a smaller reporting company. See the definitions of “large accelerated filer,” “accelerated filer,” “non-accelerated filer” and “smaller reporting company” in Rule 12b-2 of the Exchange Act. (Check one):
Large accelerated filer (X) Accelerated filer ( )
Non-accelerated filer ( ) Smaller reporting company ( )
(Do not check if a smaller reporting company)
Indicate by check mark whether the registrant is a shell company (as defined in Rule 12b-2 of the Exchange Act). Yes___ No X_
As of November 8, 2016, the latest practicable date, 18,682,723 shares of the Registrant’s common stock were issued and outstanding. The aggregate market value of shares held by non-affiliates of the Registrant on such date was $1,568,251,219 based on the last sale price on March 24, 2016 of $105.48 per share. March 24, 2016 was the last business day of the registrant’s most recently completed second fiscal quarter.
DOCUMENTS INCORPORATED BY REFERENCE
Portions of the registrant’s definitive proxy statement for its Annual Meeting of Shareholders scheduled for February 15, 2017 are incorporated by reference into Part III of this report.
J & J SNACK FOODS CORP.
2016 FORM 10-K ANNUAL REPORT
TABLE OF CONTENTS
| Page | ||
|
PART I | ||
| Item 1 | Business | 1 |
|
Item 1A |
Risk Factors |
6 |
|
Item 1B |
Unresolved Staff Comments |
9 |
|
Item 2 |
Properties |
9 |
|
Item 3 |
Legal Proceedings |
10 |
|
Item 4 |
Mine Safety Disclosures |
10 |
|
PART II | ||
|
Item 5 |
Market For Registrant’s Common Equity, Related Stockholder Matters And Issuer Purchases Of Equity Securities |
11 |
|
Item 6 |
Selected Financial Data |
12 |
|
Item 7 |
Management’s Discussion And Analysis Of Financial Condition And Results Of Operations |
13 |
|
Item 7A |
Quantitative And Qualitative Disclosures About Market Risk |
24 |
|
Item 8 |
Financial Statements And Supplementary Data |
24 |
|
Item 9 |
Changes In And Disagreements With Accountants On Accounting And Financial Disclosure |
24 |
|
Item 9A |
Controls and Procedures |
25 |
|
Item 9B |
Other Information |
25 |
|
PART III | ||
|
Item 10 |
Directors, Executive Officers and Corporate Governance |
26 |
|
Item 11 |
Executive Compensation |
26 |
|
Item 12 |
Security Ownership Of Certain Beneficial Owners And Management And Related Stockholder Matters |
27 |
|
Item 13 |
Certain Relationships And Related Transactions, and Director Independence |
27 |
|
Item 14 |
Principal Accountant Fees and Service |
27 |
|
PART IV | ||
|
Item 15 |
Exhibits, Financial Statement Schedules |
28 |
In addition to historical information, this document and analysis contains forward-looking statements. The forward-looking statements contained herein are subject to certain risks and uncertainties that could cause actual results to differ materially from those projected in the forward-looking statements. Important factors that might cause such a difference include, but are not limited to, those discussed in the “Management’s Discussion and Analysis of Financial Condition and Results of Operations.” Readers are cautioned not to place undue reliance on these forward-looking statements, which reflect management’s analysis only as of the date hereof. We undertake no obligation to publicly revise or update these forward-looking statements to reflect events or circumstances that arise after the date hereof.
Part I
Item 1. Business
General
J & J Snack Foods Corp. (the “Company” or “J & J”) manufactures nutritional snack foods and distributes frozen beverages which it markets nationally to the food service and retail supermarket industries. The Company’s principal snack food products are soft pretzels marketed primarily under the brand names SUPERPRETZEL and BAVARIAN BAKERY, frozen juice treats and desserts marketed primarily under the LUIGI’S, WHOLE FRUIT, ICEE, PHILLY SWIRL and MINUTE MAID* brand names, churros marketed primarily under the TIO PEPE’S, CALIFORNIA CHURROS and OREO** brand names and bakery products sold primarily under the READI-BAKE, COUNTRY HOME, MARY B’S AND DADDY RAY’S brand names as well as for private label and contract packing. J & J believes it is the largest manufacturer of soft pretzels in the United States, Mexico and Canada. Other snack food products include funnel cake sold under THE FUNNEL CAKE FACTORY brand and dough enrobed handheld products sold under the PATIO brand and other smaller brands as well. The Company’s principal frozen beverage products are the ICEE brand frozen carbonated beverage and the SLUSH PUPPIE brand frozen non- carbonated beverage.
The Company’s Food Service and Frozen Beverages sales are made primarily to food service customers including snack bar and food stand locations in leading chain, department, discount, warehouse club and convenience stores; malls and shopping centers; fast food outlets; stadiums and sports arenas; leisure and theme parks; movie theatres; independent retailers; and schools, colleges and other institutions. The Company’s retail supermarket customers are primarily supermarket chains.
The Company was incorporated in 1971 under the laws of the State of New Jersey.
The Company has made acquisitions as described in “Management’s Discussion and Analysis of Financial Condition and Results of Operations” and our consolidated financial statements and related notes thereto.
The Company operates in three business segments: Food Service, Retail Supermarkets and Frozen Beverages. These segments are described below.
The Chief Operating Decision Maker for Food Service and Retail Supermarkets and the Chief Operating Decision Maker for Frozen Beverages monthly review detailed operating income statements and sales reports in order to assess performance and allocate resources to each individual segment. Sales is considered to be the one and only key variable monitored by the Chief Operating Decision Makers and management when determining each segment’s and the company’s financial condition and operating performance. In addition, the Chief Operating Decision Makers review and evaluate depreciation, capital spending and assets of each segment on a quarterly basis to monitor cash flow and asset needs of each segment (see Item 7 – Management’s Discussion and Analysis of Financial Condition and Results of Operations and Item 8 – Financial Statements and Supplementary Data for financial information about segments).
*Minute Maid is a registered trademark of the Coca-Cola Company
**OREO is a registered trademark of Mondelez International, Inc.
Food Service
The primary products sold by the food service segment are soft pretzels, frozen juice treats and desserts, churros, dough enrobed handheld products and baked goods. Our customers in the food service segment include snack bars and food stands in chain, department and discount stores; malls and shopping centers; casual dining restaurants; fast food outlets; stadiums and sports arenas; leisure and theme parks; convenience stores; movie theatres; warehouse club stores; schools, colleges and other institutions. Within the food service industry, our products are purchased by the consumer primarily for consumption at the point-of-sale.
Retail Supermarkets
The primary products sold to the retail supermarket channel are soft pretzel products – including SUPERPRETZEL, frozen juice treats and desserts including LUIGI’S Real Italian Ice, MINUTE MAID Juice Bars and Soft Frozen Lemonade, WHOLE FRUIT frozen fruit bars and sorbet, PHILLY SWIRL cups and sticks, ICEE Squeeze-Up Tubes and dough enrobed handheld products including PATIO burritos. Within the retail supermarket channel, our frozen and prepackaged products are purchased by the consumer for consumption at home.
Frozen Beverages
We sell frozen beverages to the food service industry primarily under the names ICEE, SLUSH PUPPIE and PARROT ICE in the United States, Mexico and Canada. We also provide repair and maintenance service to customers for customers’ owned equipment.
Products
Soft Pretzels
The Company’s soft pretzels are sold under many brand names; some of which are: SUPERPRETZEL, PRETZEL FILLERS, PRETZELFILS, GOURMET TWISTS, MR. TWISTER, SOFT PRETZEL BITES, SOFTSTIX, SOFT PRETZEL BUNS, TEXAS TWIST,BAVARIAN BAKERY,SUPERPRETZEL BAVARIAN, NEW YORK PRETZEL, KIM & SCOTT’S GOURMET PRETZELS and SERIOUSLY TWISTED!; and, to a lesser extent, under private labels.
Soft pretzels are sold in the Food Service and Retail Supermarket segments. Soft pretzel sales amounted to 20% of the Company’s revenue in fiscal year 2016, 21% in 2015 and 22% in 2014.
Certain of the Company’s soft pretzels qualify under USDA regulations as the nutritional equivalent of bread for purposes of the USDA school lunch program, thereby enabling a participating school to obtain partial reimbursement of the cost of the Company’s soft pretzels from the USDA.
The Company’s soft pretzels are manufactured according to a proprietary formula. Soft pretzels, ranging in size from one to ten ounces in weight, are shaped and formed by the Company’s twister machines. These soft pretzel tying machines are automated, high-speed machines for twisting dough into the traditional pretzel shape. Additionally, we make soft pretzels which are extruded or shaped by hand. Soft pretzels, after processing, are primarily quick-frozen in either raw or baked form and packaged for delivery.
The Company’s principal marketing program in the Food Service segment includes supplying ovens, mobile merchandisers, display cases, warmers and similar merchandising equipment to the retailer to prepare and promote the sale of soft pretzels. Some of this equipment is proprietary, including combination warmer and display cases that reconstitute frozen soft pretzels while displaying them, thus eliminating the need for an oven. The Company retains ownership of the equipment placed in customer locations, and as a result, customers are not required to make an investment in equipment.
Frozen Juice Treats and Desserts
The Company’s frozen juice treats and desserts are marketed primarily under the LUIGI’S, WHOLE FRUIT, PHILLY SWIRL, ICEE and MINUTE MAID brand names. Frozen juice treats and desserts are sold in the Food Service and Retail Supermarkets segments. Frozen juice treats and dessert sales were 12% of the Company’s revenue in fiscal year 2016, 13% in 2015 and 12% in 2014.
The Company’s school food service MINUTE MAID and WHOLE FRUIT frozen juice bars and cups contain three to four ounces of 100% apple or pineapple juice with no added sugar and 100% of the daily US FDA value of vitamin C. The juice bars are produced in various flavors and are packaged in a sealed push-up paper container referred to as the Milliken M-pak, which the Company believes has certain sanitary and safety advantages.
The balance of the Company’s frozen juice treats and desserts products are manufactured from water, sweeteners and fruit juice concentrates in various flavors and packaging including cups, tubes, sticks, M-paks and pints. Several of the products contain ice cream and WHOLE FRUIT contains pieces of fruit.
Churros
The Company’s churros are sold primarily under the TIO PEPE’S, CALIFORNIA CHURROS and OREO brand names. Churros are sold to the Food Service and Retail Supermarkets segments. Churro sales were 6% of the Company’s sales in fiscal year 2016, 6% in 2015 and 6% in 2014. Churros are Hispanic pastries in stick form which the Company produces in several sizes according to a proprietary formula. The churros are deep fried, frozen and packaged. At food service point-of-sale they are reheated and topped with a cinnamon sugar mixture. The Company also sells fruit and crème-filled churros. The Company supplies churro merchandising equipment similar to that used for its soft pretzels.
Handheld Products
The Company's dough enrobed handheld products are marketed under the PATIO, SUPREME STUFFERS and SWEET STUFFERS brand names and under private labels. Handheld products are sold to the Food Service and Retail Supermarket segments. Handheld product sales amounted to 4% of the Company’s sales in fiscal year 2016, 4% in 2015 and 5% in 2014.
Bakery Products
The Company’s bakery products are marketed under the MRS. GOODCOOKIE, READI-BAKE, COUNTRY HOME, MARY B’S and DADDY RAY’S brand names, and under private labels. Bakery products include primarily biscuits, fig and fruit bars, cookies, breads, rolls, crumb, muffins and donuts. Bakery products are sold to the Food Service segment. Bakery products sales amounted to 30% of the Company’s sales in fiscal year 2016, 31% in 2015 and 31% in 2014.
Frozen Beverages
The Company markets frozen beverages primarily under the names ICEE, SLUSH PUPPIE and PARROT ICE in the United States, Mexico and Canada. Frozen beverages are sold in the Frozen Beverages segment.
Frozen beverage sales amounted to 15% of revenue in fiscal year 2016, 15% in 2015 and 14% in 2014.
Under the Company’s principal marketing program for frozen carbonated beverages, it installs frozen beverage dispensers for its ICEE brand at customer locations and thereafter services the machines, arranges to supply customers with ingredients required for production of the frozen beverages, and supports customer retail sales efforts with in-store promotions and point-of-sale materials. In most cases, the Company retains ownership of its dispensers, and as a result, customers are not required to make an investment in equipment or arrange for the ingredients and supplies necessary to produce and market the frozen beverages. The Company sells frozen non-carbonated beverages under the SLUSH PUPPIE and PARROT ICE brands through a distributor network and through its own distribution network. The Company also provides repair and maintenance service to customers for customers’ owned equipment and sells equipment in its Frozen Beverages segment, revenue from both totaled to 10% of sales in 2016, 9% in 2015 and 9% in 2014.
Each new frozen carbonated customer location requires a frozen beverage dispenser supplied by the Company or by the customer. Company-supplied frozen carbonated dispensers are purchased from outside vendors, built new or rebuilt by the Company.
The Company provides managed service and/or products to approximately 119,000 Company-owned and customer-owned dispensers.
The Company has the rights to market and distribute frozen beverages under the name ICEE to the entire continental United States (except for portions of nine states) as well as internationally.
Other Products
Other products sold by the Company include funnel cakes sold under the FUNNEL CAKE FACTORY brand name and smaller amounts of various other food products. These products are sold in the Food Service and Frozen Beverages segments.
Customers
The Company sells its products to two principal channels: food service and retail supermarkets. The primary products sold to the food service channel are soft pretzels, frozen beverages, frozen juice treats and desserts, churros, dough enrobed handheld products and baked goods. The primary products sold to the retail supermarket channel are soft pretzels, frozen juice treats and desserts and dough enrobed handheld products.
We have several large customers that account for a significant portion of our sales. Our top ten customers accounted for 42%, 43% and 43% of our sales during fiscal years 2016, 2015 and 2014, respectively, with our largest customer accounting for 8% of our sales in 2016, 8% of our sales in 2015 and 8% of our sales in 2014. Three of the ten customers are food distributors who sell our product to many end users. The loss of one or more of our large customers could adversely affect our results of operations. These customers typically do not enter into long-term contracts and make purchase decisions based on a combination of price, product quality, consumer demand and customer service performance. If our sales to one or more of these customers are reduced, this reduction may adversely affect our business. If receivables from one or more of these customers become uncollectible, our operating income would be adversely impacted.
The Food Service and the Frozen Beverages segments sell primarily to food service channels. The Retail Supermarkets segment sells primarily to the retail supermarket channel.
The Company’s customers in the food service segment include snack bars and food stands in chain, department and mass merchandising stores, malls and shopping centers, fast food outlets, casual dining restaurants, stadiums and sports arenas, leisure and theme parks, convenience stores, movie theatres, warehouse club stores, schools, colleges and other institutions, and independent retailers. Machines and machine parts are sold to other food and beverage companies. Within the food service industry, the Company’s products are purchased by the consumer primarily for consumption at the point-of-sale.
The Company sells its products to an estimated 85-90% of supermarkets in the United States. Products sold to retail supermarket customers are primarily soft pretzel products, including SUPERPRETZEL, frozen juice treats and desserts including LUIGI’S Real Italian Ice, MINUTE MAID Juice Bars and Soft Frozen Lemonade, WHOLE FRUIT frozen fruit bars, WHOLE FRUIT Sorbet, PHILLY SWIRL cups and sticks, MARY B’S biscuits and dumplings, DADDY RAY’S fig and fruit bars, ICEE Squeeze-Up Tubes, PATIO burritos and OREO Churros. Within the retail supermarket industry, the Company’s frozen and prepackaged products are purchased by the consumer for consumption at home.
Marketing and Distribution
The Company has developed a national marketing program for its products. For Food Service and Frozen Beverages segments’ customers, this marketing program includes providing ovens, mobile merchandisers, display cases, warmers, frozen beverage dispensers and other merchandising equipment for the individual customer’s requirements and point-of-sale materials as well as participating in trade shows and in-store demonstrations. The Company’s ongoing advertising and promotional campaigns for its Retail Supermarket segment’s products include trade shows, newspaper advertisements with coupons, in-store demonstrations and consumer advertising campaigns.
The Company develops and introduces new products on a routine basis. The Company evaluates the success of new product introductions on the basis of sales levels, which are reviewed no less frequently than monthly by the Company’s Chief Operating Decision Makers.
The Company’s products are sold through a network of about 100 food brokers, independent sales distributors and the Company’s own direct sales force. For its snack food products, the Company maintains warehouse and distribution facilities in Pennsauken, Bellmawr and Bridgeport, New Jersey; Vernon (Los Angeles) and Colton, California; Brooklyn, New York; Scranton, Pittsburgh, Hatfield and Lancaster, Pennsylvania; Carrollton (Dallas), Texas; Atlanta, Georgia; Moscow Mills (St. Louis), Missouri; Pensacola and Tampa, Florida; Solon, Ohio; Weston, Oregon; and Holly Ridge, North Carolina. Frozen beverages and machine parts are distributed from 161 Company managed warehouse and distribution facilities located in 44 states, Mexico and Canada, which allow the Company to directly service its customers in the surrounding areas. The Company’s products are shipped in refrigerated and other vehicles from the Company’s manufacturing and warehouse facilities on a fleet of Company operated tractor-trailers, trucks and vans, as well as by independent carriers.
Seasonality
The Company’s sales are seasonal because frozen beverage sales and frozen juice treats and desserts sales are generally higher during the warmer months.
Trademarks and Patents
The Company has numerous trademarks, the most important of which are SUPERPRETZEL, TEXAS TWIST, NEW YORK PRETZEL, BAVARIAN BAKERY, MR. TWISTER, SOFT PRETZEL BITES, SOFTSTIX, PRETZEL FILLERS and PRETZELFILS for its pretzel products; SHAPE-UPS, WHOLE FRUIT, PHILLY SWIRL and LUIGI’S for its frozen juice treats and desserts; TIO PEPE’S and CALIFORNIA CHURROS for its churros; ARCTIC BLAST, SLUSH PUPPIE and PARROT ICE for its frozen beverages; FUNNEL CAKE FACTORY for its funnel cake products, PATIO for its handheld burritos and MRS. GOODCOOKIE, READI-BAKE, COUNTRY HOME, CAMDEN CREEK, MARY B’S and DADDY RAY’S for its bakery products.
The Company markets frozen beverages under the trademark ICEE in all of the continental United States, except for portions of nine states, and in Mexico and Canada. Additionally, the Company has the international rights to the trademark ICEE.
The trademarks, when renewed and continuously used, have an indefinite term and are considered important to the Company as a means of identifying its products. The Company considers its trademarks important to the success of its business.
The Company has numerous patents related to the manufacturing and marketing of its product.
Supplies
The Company’s manufactured products are produced from raw materials which are readily available from numerous sources. With the exception of the Company’s soft pretzel twisting equipment, churros and funnel cake production equipment, which are made for J & J by independent third parties, and certain specialized packaging equipment, the Company’s manufacturing equipment is readily available from various sources. Syrup for frozen beverages is purchased primarily from The Coca-Cola Company, Dr Pepper/Seven Up, Inc., the Pepsi Cola Company, and Jogue, Inc. Cups, straws and lids are readily available from various suppliers. Parts for frozen beverage dispensing machines are purchased from several sources. Frozen beverage dispensers are purchased primarily from IMI Cornelius, Inc. and FBD Partnership.
Competition
Snack food and bakery products markets are highly competitive. The Company’s principal products compete against similar and different food products manufactured and sold by numerous other companies, some of which are substantially larger and have greater resources than the Company. As the soft pretzel, frozen juice treat and dessert, bakery products and related markets evolve, additional competitors and new competing products may enter the markets. Competitive factors in these markets include product quality, customer service, taste, price, identity and brand name awareness, method of distribution and sales promotions.
The Company believes it is the only national distributor of soft pretzels. However, there are numerous regional and local manufacturers of food service and retail supermarket soft pretzels as well as several chains of retail pretzel stores.
In Frozen Beverages the Company competes directly with other frozen beverage companies. These include several companies which have the right to use the ICEE name in portions of nine states. There are many other regional frozen beverage competitors throughout the country and one large retail chain which uses its own frozen beverage brand.
The Company competes with large soft drink manufacturers for counter and floor space for its frozen beverage dispensing machines at retail locations and with products which are more widely known than the ICEE, SLUSH PUPPIE and PARROT ICE frozen beverages.
The Company competes with a number of other companies in the frozen juice treat and dessert and bakery products markets.
Risks Associated with Foreign Operations
Foreign operations generally involve greater risk than doing business in the United States. Foreign economies differ favorably or unfavorably from the United States’ economy in such respects as the level of inflation and debt, which may result in fluctuations in the value of the country’s currency and real property. Sales of our foreign operations were $27,075,000, $25,313,000 and $23,633,000 in fiscal years 2016, 2015 and 2014, respectively. At September 24, 2016, the total assets of our foreign operations were approximately $29 million or 3.7% of total assets. At September 26, 2015, the total assets of our foreign operations were approximately $28 million or 3.8% of total assets.
Employees
The Company has about 3,600 full and part time employees and approximately 1,500 workers employed by staffing agencies as of September 24, 2016. About 1,000 production and distribution employees throughout the Company are covered by collective bargaining agreements.
The Company considers its employee relations to be good.
Available Information
The Company’s internet address is www.jjsnack.com. On the investor relations section of its website, the Company provides free access to its annual report on Form 10-K, quarterly reports on Form 10-Q, current reports on Form 8-K and any amendments to these reports, as soon as reasonably practicable after such material is electronically filed with, or furnished to, the Securities and Exchange Commission (“SEC”). The information on the website listed above is not and should not be considered part of this annual report on Form 10-K and is not incorporated by reference in this document.
Item 1A. Risk Factors
You should carefully consider the risks described below, together with all of the other information included in this report, in considering our business and prospects. The risks and uncertainties described below are not the only ones facing us. Additional risks and uncertainties not presently known to us or that we currently deem insignificant may also impair our business operations. Following is a discussion of known potentially significant risks which could result in harm to our business, financial condition or results of operations.
Risks of Shortages or Increased Cost of Raw Materials
We are exposed to the market risks arising from adverse changes in commodity prices, affecting the cost of our raw materials and energy. The raw materials and energy which we use for the production and distribution of our products are largely commodities that are subject to price volatility and fluctuations in availability caused by changes in global supply and demand, weather conditions, agricultural uncertainty or governmental controls. We purchase these materials and energy mainly in the open market. Our procurement practices are intended to reduce the risk of future price increases, but also may potentially limit the ability to benefit from possible price decreases. If commodity price changes result in increases in raw materials and energy costs, we may not be able to increase our prices to offset these increased costs without suffering reduced volume, revenue and operating income.
General Risks of the Food Industry
Food processors are subject to the risks of adverse changes in general economic conditions; evolving consumer preferences and nutritional and health-related concerns; changes in food distribution channels; federal, state and local food processing controls or other mandates; consumer product liability claims; and risks of product tampering. The increased buying power of large supermarket chains, other retail outlets and wholesale food vendors could result in greater resistance to price increases and could alter the pattern of customer inventory levels and access to shelf space.
Environmental Risks
The disposal of solid and liquid waste material resulting from the preparation and processing of foods is subject to various federal, state and local laws and regulations relating to the protection of the environment. Such laws and regulations have an important effect on the food processing industry as a whole, requiring substantially all firms in the industry to incur material expenditures for modification of existing processing facilities and for construction of upgraded or new waste treatment facilities.
We cannot predict what environmental legislation or regulations will be enacted in the future, how existing or future laws or regulations will be administered or interpreted or what environmental conditions may be found to exist. Enactment of more stringent laws or regulations or more strict interpretation of existing laws and regulations may require additional expenditures by us, some of which could be material.
Risks Resulting from Several Large Customers
We have several large customers that account for a significant portion of our sales. Our top ten customers accounted for 42%, 43% and 43% of our sales during fiscal years 2016, 2015 and 2014, respectively, with our largest customer accounting for 8% of our sales in 2016, 8% of our sales in 2015 and 8% of our sales in 2014. Three of the ten customers are food distributors who sell our product to many end users. The loss of one or more of our large customers could adversely affect our results of operations. These customers typically do not enter into long-term contracts and make purchase decisions based on a combination of price, product quality, consumer demand and customer service performance. If our sales to one or more of these customers are reduced, this reduction may adversely affect our business. If receivables from one or more of these customers become uncollectible, our operating income would be adversely impacted.
Competition
Our businesses operate in highly competitive markets. We compete against national and regional manufacturers and distributors on the basis of price, quality, product variety and effective distribution. Many of our major competitors in the market are larger and have greater financial and marketing resources than we do. Increased competition and anticipated actions by our competitors could lead to downward pressure on prices and/or a decline in our market share, either of which could adversely affect our results. See “Competition” in Item 1 for more information about our competitors.
Risks Relating to Manufacturing
Our ability to purchase, manufacture and distribute products is critical to our success. Damage or disruption to our manufacturing or distribution capabilities due to weather, natural disaster, fire or explosion, terrorism, pandemic, political upheaval, strikes or other reasons could impair our ability to manufacture or distribute our products.
Our Certificate of Incorporation may inhibit a change in control that you may favor
Our Certificate of Incorporation contains provisions that may delay, deter or inhibit a future acquisition of J & J Snack Foods Corp. not approved by our Board of Directors. This could occur even if our shareholders are offered an attractive value for their shares or if a substantial number or even a majority of our shareholders believe the takeover is in their best interest. These provisions are intended to encourage any person interested in acquiring us to negotiate with and obtain the approval of our Board of Directors in connection with the transaction. Provisions that could delay, deter or inhibit a future acquisition include the following:
|
-- |
a classified Board of Directors; |
|
-- |
the requirement that our shareholders may only remove Directors for cause; |
|
-- |
limitations on share holdings and voting of certain persons; |
|
-- |
special Director voting rights; and |
|
-- |
the ability of the Board of Directors to consider the interests of various constituencies, including our employees, customers, suppliers, creditors and the local communities in which we operate. |
Risks Relating to the Control by Gerald B. Shreiber
Gerald B. Shreiber is the founder of the Company and the current beneficial owner of 20% of its outstanding stock. Our Certificate of Incorporation provides that he has three votes on the Board of Directors (subject to certain adjustments). Therefore, he and one other director have voting control of the Board. The performance of this Company is greatly impacted by his leadership and decisions. His voting control reduces the restrictions on his actions. His retirement, disability or death may have a significant impact on our future operations.
Risk Related to Increases in our Health Insurance Costs and Costs of Compliance with the Patient Protection and Affordable Care Act and the Health Care and Education Reconciliation Act of 2010
The costs of employee health care insurance have been increasing in recent years due to rising health care costs, legislative changes, and general economic conditions. Additionally, we may incur additional costs because of the Patient Protection and Affordable Care Act and the Health Care and Education Reconciliation Act of 2010 (collectively, the “Health Care Reform Laws”). Provisions of these laws have become and will become effective over the past several years and at various dates over the next several years. Because of the breadth and complexity of these laws and the phased-in nature of the new regulations, as well as other health care reform legislation considered by Congress and state legislatures, we cannot predict with certainty the future effect of these laws on us. A continued increase in health care costs or additional costs incurred as a result of the Health Care Reform Laws or the enforcement of the Health Care Reform Laws or other future health care reform laws imposed by Congress or state legislations could have a negative impact on our financial position and results of operations.
Risk Related to Product Changes
There are risks in the marketplace related to trade and consumer acceptance of product improvements, packing initiatives and new product introductions.
Risks Related to Change in the Business
Our ability to successfully manage changes to our business processes, including selling, distribution, product capacity, information management systems and the integration of acquisitions, will directly affect our results of operations.
Risks Associated with Foreign Operations
Foreign operations generally involve greater risk than doing business in the United States. Foreign economies differ favorably or unfavorably from the United States’ economy in such respects as the level of inflation and debt, which may result in fluctuations in the value of the country’s currency and real property. Further, there may be less government regulation in various countries, and difficulty in enforcing legal rights outside the United States. Additionally, in some foreign countries, there is the possibility of expropriation or confiscatory taxation limitations on the removal of property or other assets, political or social instability or diplomatic developments which could affect the operations and assets of U.S. companies doing business in that country. Sales of our foreign operations were $27,075,000, $25,313,000 and $23,633,000 in fiscal years 2016, 2015 and 2014, respectively. At September 24, 2016, the total assets of our foreign operations were approximately $29 million or 3.7% of total assets. At September 26, 2015, the total assets of our foreign operations were approximately $28 million or 3.8% of total assets.
Risks associated with our information technology systems
The efficient operation of our business depends on our information technology systems. We rely on our information technology systems to effectively manage our business data, communications, supply chain, manufacturing, order entry and fulfillment, and other business processes. The failure of our information technology systems (including those provided to us by third parties) to perform as we anticipate could disrupt our business and could result in billing, collecting, and ordering errors, processing inefficiencies, and the loss of sales and customers, causing our business and results of operations to suffer.
In addition, our information technology systems may be vulnerable to damage or interruption from circumstances beyond our control, including fire, natural disasters, systems failures, security breaches or intrusions (including theft of customer, consumer or other confidential data), and viruses. If we are unable to prevent physical and electronic break-ins, cyber-attacks and other information security breaches, we may suffer financial and reputational damage, be subject to litigation or incur remediation costs or penalties because of the unauthorized disclosure of confidential information belonging to us or to our partners, customers, suppliers or employees.
Seasonality and Quarterly Fluctuations
Our sales are affected by the seasonal demand for our products. Demand is greater during the summer months primarily as a result of the warm weather demand for our ICEE and frozen juice treats and desserts products. Because of seasonal fluctuations, there can be no assurance that the results of any particular quarter will be indicative of results for the full year or for future years.
Item 1B. Unresolved Staff Comments
We have no unresolved SEC staff comments to report.
Item 2. Properties
The Company’s primary east coast manufacturing facility is located in Pennsauken, New Jersey in a 70,000 square foot building on a two-acre lot. Soft pretzels are manufactured at this Company-owned facility which also serves as the Company’s corporate headquarters. This facility operates at approximately 55% of capacity. The Company owns a 128,000 square foot building adjacent to this manufacturing facility which contains a large freezer for warehousing and distribution purposes. The warehouse has a utilization rate of 80-90% depending on product demand. The Company leases, through January 2022, 16,000 square feet of office and warehouse space located next to the Pennsauken, New Jersey plant and owns a 43,000 square foot office and warehouse building in the same complex.
The Company owns a 150,000 square foot building on eight acres in Bellmawr, New Jersey. The facility is used by the Company to manufacture some of its products including funnel cake, pretzels and churros. The facility operates at about 70% of capacity.
The Company’s primary west coast manufacturing facility is located in Vernon (Los Angeles), California. It consists of a 137,000 square foot facility in which soft pretzels, churros and various lines of baked goods are produced and warehoused. Included in the 137,000 square foot facility is a 30,000 square foot freezer used for warehousing and distribution purposes. The facility is leased through November 2030. The Company leases an additional 80,000 square feet of office and warehouse space, adjacent to its manufacturing facility, through November 2030. The manufacturing facility operates at approximately 50% of capacity.
The Company leases a 22,000 square foot soft pretzel manufacturing facility located in Brooklyn, New York. The lease runs through August 2023. The facility operates at about 60% of capacity.
The Company leases through June 2030 a 45,000 square foot churros manufacturing facility located in Colton, California which operates at approximately 55% of capacity.
The Company leases an 85,000 square foot bakery manufacturing facility located in Atlanta, Georgia. The lease runs through December 2020. The facility operates at about 60% of capacity.
The Company owns a 46,000 square foot frozen juice treat and dessert manufacturing facility and a 42,000 square foot dry storage warehouse located on six acres in Scranton, Pennsylvania. The manufacturing facility operates at approximately 60% of capacity.
The Company leases a 29,600 square foot soft pretzel manufacturing facility located in Hatfield, Pennsylvania. The lease runs through June 2017. The facility operates at approximately 50% of capacity.
The Company leases a 48,000 square foot soft pretzel manufacturing facility located in Carrollton, Texas. The lease runs through April 2019. The facility operates at approximately full capacity. The Company leases an additional property containing a 6,500 square foot storage freezer across the street from the manufacturing facility, which lease expires May 2021.
The Company leases an 18,000 square foot soft pretzel manufacturing facility located in Chambersburg, Pennsylvania. The lease runs through September 2019. The facility operates at approximately 35% of capacity.
The Company’s fresh bakery products manufacturing facility and offices are located in Bridgeport, New Jersey in three buildings totaling 133,000 square feet. The buildings are leased through December 2025. The manufacturing facility operates at approximately 65% of capacity.
The Company owns a 165,000 square foot fig and fruit bar manufacturing facility located on 9-1/2 acres in Moscow Mills (St. Louis), Missouri. The facility operates at about 50% of capacity.
The Company leases a building in Pensacola, Florida for the manufacturing, packing and warehousing of dumplings. The building is approximately 14,000 square feet and the lease runs through December 2017. The manufacturing facility operates at approximately 70% of capacity.
The Company owns an 84,000 square foot handheld products manufacturing facility in Holly Ridge, North Carolina which operates at about 45% of capacity.
The Company leases a 70,000 square foot handheld products manufacturing facility in Weston, Oregon which operates at about 30% of capacity. The facility is leased through May 13, 2021.
The Company leases a 39,000 square foot frozen juice treat and dessert manufacturing facility in Tampa, Florida which operates at about 70% of capacity. The facility is leased through September 2023.
The Company also leases approximately 160 warehouse and distribution facilities in 44 states, Mexico and Canada.
Item 3. Legal Proceedings
The Company has no material pending legal proceedings, other than ordinary routine litigation incidental to the business, to which the Company or any of its subsidiaries is a party or of which any of their property is subject.
Item 4. Mine Safety Disclosures
Not Applicable
PART II
Item 5. Market For Registrant’s Common Equity, Related Stockholder Matters And Issuer Purchases Of Equity Securities
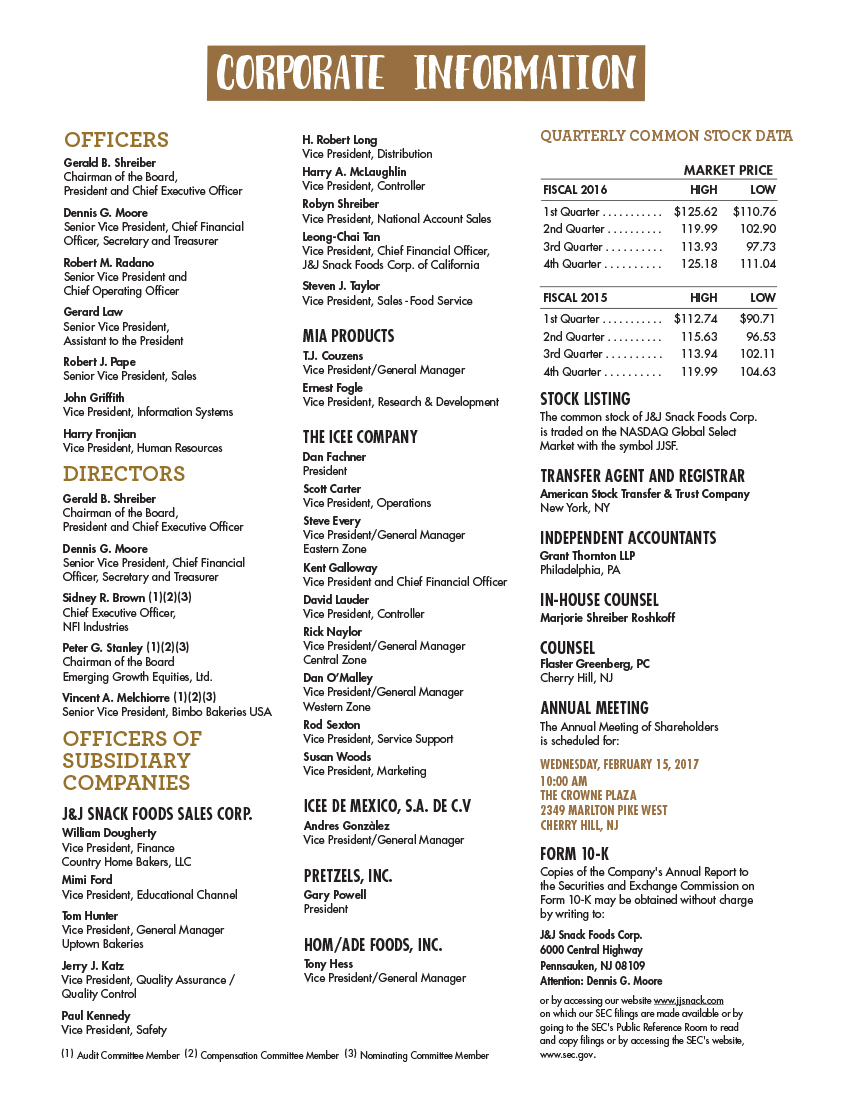
The Company’s common stock is traded on the NASDAQ Global Select Market under the symbol “JJSF.” The following table sets forth the high and low sale price quotations as reported by NASDAQ and dividend information for the common stock for each quarter of the years ended September 26, 2015 and September 24, 2016.
| Common Stock Market Price | ||||||||||||
|
Dividend |
||||||||||||
|
High |
Low |
Declared |
||||||||||
|
Fiscal 2015 |
||||||||||||
|
First quarter |
$ | 112.74 | $ | 90.71 | $ | 0.3600 | ||||||
|
Second quarter |
115.63 | 96.53 | 0.3600 | |||||||||
|
Third quarter |
113.94 | 102.11 | 0.3600 | |||||||||
|
Fourth quarter |
119.99 | 104.63 | 0.3600 | |||||||||
|
Fiscal 2016 |
||||||||||||
|
First quarter |
$ | 125.62 | $ | 110.76 | $ | 0.3900 | ||||||
|
Second quarter |
119.99 | 102.90 | 0.3900 | |||||||||
|
Third quarter |
113.93 | 97.73 | 0.3900 | |||||||||
|
Fourth quarter |
125.18 | 111.04 | 0.3900 | |||||||||
As of September 24, 2016, we had approximately 15,400 beneficial shareholders.
In our fiscal year ended September 24, 2016, we purchased and retired 141,700 shares of our common stock at a cost of $15,265,019. In our first quarter, we purchased and retired 27,083 shares at a cost of $3,115,439. In our second quarter, we purchased and retired 80,565 shares at a cost of $8,642,887. In our third quarter, we purchased and retired 34,052 shares at a cost of $3,506,693. We did not purchase and retire any shares in our fourth quarter.
In our fiscal year ended September 26, 2015, we purchased and retired 72,698 shares of our common stock at a cost of $8,011,118.
In our fiscal year ended September 27, 2014, we purchased and retired 81,685 shares of our common stock at a cost of $7,504,729.
On November 8, 2012 the Company’s Board of directors authorized the purchase and retirement of an additional 500,000 shares of the Company’s common stock; 47,775 shares remain to be purchased under that authorization.
For information on the Company’s Equity Compensation Plans, please see Item 12 herein.
Stock Performance Graph
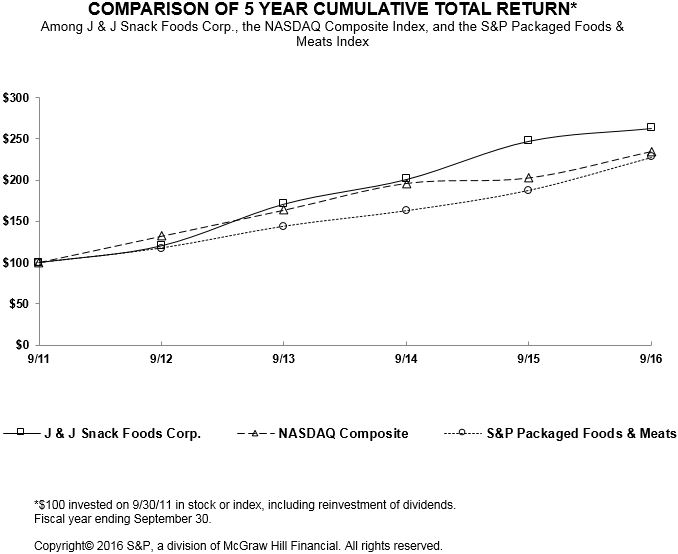 |
Item 6. Selected Financial Data
The selected financial data for the last five years was derived from our audited consolidated financial statements. The following selected financial data should be read in conjunction with “Management’s Discussion and Analysis of Financial Condition and Results of Operations” and our consolidated financial statements and related notes thereto, especially as the information pertains to fiscal 2014, 2015 and 2016.
| Fiscal year ended in September | ||||||||||||||||||||
| (In thousands except per share data) | ||||||||||||||||||||
|
2016 |
2015 |
2014 |
2013 |
2012 |
||||||||||||||||
|
Net Sales |
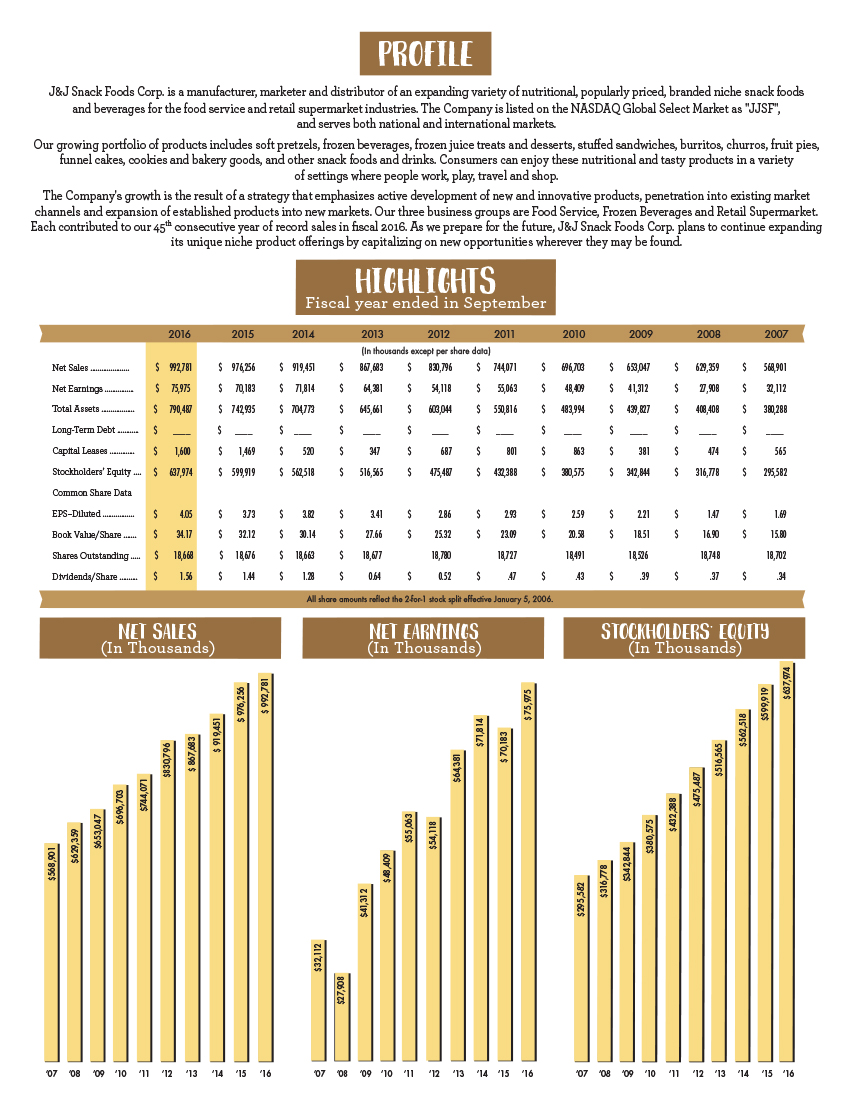
$ | 992,781 | $ | 976,256 | $ | 919,451 | $ | 867,683 | $ | 830,796 | ||||||||||
|
Net Earnings |
$ | 75,975 | $ | 70,183 | $ | 71,814 | $ | 64,381 | $ | 54,118 | ||||||||||
|
Total Assets |
$ | 790,487 | $ | 739,669 | $ | 704,773 | $ | 645,661 | $ | 603,044 | ||||||||||
|
Long-Term Debt |
$ | - | $ | - | $ | - | $ | - | $ | - | ||||||||||
|
Capital Lease Obligations |
$ | 1,600 | $ | 1,469 | $ | 520 | $ | 347 | $ | 687 | ||||||||||
|
Stockholders' Equity |
$ | 637,974 | $ | 599,919 | $ | 562,518 | $ | 516,565 | $ | 475,487 | ||||||||||
|
Common Share Data |
||||||||||||||||||||
|
Earnings Per Diluted Share |
$ | 4.05 | $ | 3.73 | $ | 3.82 | $ | 3.41 | $ | 2.86 | ||||||||||
|
Earnings Per Basic Share |
$ | 4.07 | $ | 3.76 | $ | 3.85 | $ | 3.43 | $ | 2.87 | ||||||||||
|
Common Shares Outstanding At Year End |
18,668 | 18,676 | 18,663 | 18,677 | 18,780 | |||||||||||||||
|
Cash Dividends Declared Per Common Share |
$ | 1.56 | $ | 1.44 | $ | 1.28 | $ | 0.64 | $ | 0.52 | ||||||||||
Item 7. Management’s Discussion And Analysis Of Financial Condition And Results Of Operations
In addition to historical information, this document and analysis contains forward-looking statements. The forward-looking statements contained herein are subject to certain risks and uncertainties that could cause actual results to differ materially from those projected in the forward-looking statements. Important factors that might cause such a difference include, but are not limited to, those discussed in the “Management’s Discussion and Analysis of Financial Condition and Results of Operations.” Readers are cautioned not to place undue reliance on these forward-looking statements, which reflect management’s analysis only as of the date hereof. We undertake no obligation to publicly revise or update these forward-looking statements to reflect events or circumstances that arise after the date hereof.
Critical Accounting Policies, Judgments and Estimates
We prepare our financial statements in conformity with accounting principles generally accepted in the United States of America. The preparation of such financial statements requires management to make estimates and assumptions that affect the reported amounts of assets and liabilities and disclosures of contingent assets and liabilities at the date of those financial statements and the reported amounts of revenues and expenses during the reporting period. Actual results could differ from those estimates.
The Company discloses its significant accounting policies in the accompanying notes to its audited consolidated financial statements.
Judgments and estimates of uncertainties are required in applying the Company’s accounting policies in certain areas. Following are some of the areas requiring significant judgments and estimates: revenue recognition, accounts receivable, cash flow and valuation assumptions in performing asset impairment tests of long-lived and intangible assets, estimates of the value and useful lives of intangible assets, insurance reserves, inventories and income taxes.
There are numerous critical assumptions that may influence accounting estimates in these and other areas. We base our critical assumptions on historical experience, third-party data and various other estimates we believe to be reasonable. A description of the aforementioned policies follows:
Revenue Recognition - We recognize revenue from our products when the products are shipped to our customers. Repair and maintenance equipment service revenue is recorded when it is performed provided the customer terms are that the customer is to be charged on a time and material basis or on a straight-line basis over the term of the contract when the customer has signed a service contract. Revenue is recognized only where persuasive evidence of an arrangement exists, our price is fixed or estimable and collectability is reasonably assured. We record offsets to revenue for allowances, end-user pricing adjustments, trade spending, coupon redemption costs and returned product. Customers generally do not have the right to return product unless it is damaged or defective. Off-invoice allowances are deducted directly from the amount invoiced to our customer when our products are shipped to the customer. Offsets to revenue for allowances, end-user pricing adjustments and trade spending are recorded primarily as a reduction of accounts receivable based on our estimates of liability which are based on customer programs and historical experience. These offsets to revenue are estimated primarily on the quantity of product purchased over specific time periods. For our Retail Supermarket and Frozen Beverages segments, we accrue for the liability based on products sold multiplied by per product offsets. Offsets to revenue for our Food Service segment are calculated in a similar manner for offsets owed to our direct customers; however, because shipments to end-users are unknown to us until reported by our direct customers or by the end-users, there is a greater degree of uncertainty as to the accuracy of the amounts accrued for end-user offsets. Additional uncertainty may occur as customers take deductions when they make payments to us. This creates complexities because our customers do not always provide reasons for the deductions taken. Additionally, customers may take deductions to which they are not entitled and the length of time customers take deductions to which they are entitled can vary from two weeks to well over a year. Because of the aforementioned uncertainties, the process to determine these estimates requires judgment. We feel that due to constant monitoring of the process, including but not limited to comparing actual results to estimates made on a monthly basis, these estimates are reasonable in all material respects. Our recorded liability for allowances, end-user pricing adjustments and trade spending was approximately $14.3 million at September 24, 2016 and $11.7 million at September 26, 2015.
Accounts Receivable - We record accounts receivable at the time revenue is recognized. Bad debt expense is recorded in marketing and administrative expenses. The amount of the allowance for doubtful accounts is based on our estimate of the accounts receivable amount that is uncollectable. It is comprised of a general reserve based on historical experience and amounts for specific customers’ accounts receivable balances that we believe are at risk due to our knowledge of facts regarding the customer(s). We continually monitor our estimate of the allowance for doubtful accounts and adjust it monthly. We usually have approximately 15 customers with accounts receivable balances of between $1 million to $10 million. Failure of these customers, and others with lesser balances, to pay us the amounts owed, could have a material impact on our consolidated financial statements.
Accounts receivable due from any of our customers is subject to risk. Our total bad debt expense was $525,000, $310,000 and $161,000 for the fiscal years 2016, 2015 and 2014, respectively. At September 24, 2016 and September 26, 2015, our accounts receivables were $98,325,000 and $102,649,000 net of an allowance for doubtful accounts of $571,000 and $304,000.
Asset Impairment – We have three reporting units with goodwill totaling $86,442,000 as of September 24, 2016. Goodwill is evaluated annually by the Company for impairment. We perform impairment tests at year end for our reporting units, which is also the operating segment level, with recorded goodwill utilizing primarily the discounted cash flow method. This methodology used to estimate the fair value of the total Company and its reporting units requires inputs and assumptions (i.e. revenue growth, operating profit margins, capital spending requirements and discount rates) that reflect current market conditions. The estimated fair value of each reporting unit is compared to the carrying value of the reporting unit. If the carrying value of the reporting unit exceeds its fair value, the goodwill of the reporting unit is potentially impaired, and the Company then determines the implied fair value of goodwill, which is compared to the carrying value of goodwill to determine if impairment exists. Our tests at September 24, 2016 show that the fair value of each of our reporting units with goodwill exceeded its carrying value. Therefore no further analysis was required. The inputs and assumptions used involve considerable management judgment and are based upon assumptions about expected future operating performance. Assumptions used in these forecasts are consistent with internal planning. The actual performance of the reporting units could differ from management’s estimates due to changes in business conditions, operating performance, economic conditions, competition and consumer preferences.
Licenses and rights, customer relationships and non- compete agreements are being amortized by the straight-line method over periods ranging from 3 to 20 years and amortization expense is reflected throughout operating expenses. Long-lived assets, including fixed assets and amortizing intangibles, are reviewed for impairment as events or changes in circumstances occur indicating that the carrying amount of the asset may not be recoverable. Indefinite lived intangibles are reviewed annually for impairment. Cash flow and sales analyses are used to assess impairment. The estimates of future cash flows and sales involve considerable management judgment and are based upon assumptions about expected future operating performance. Assumptions used in these forecasts are consistent with internal planning. The actual cash flows and sales could differ from management’s estimates due to changes in business conditions, operating performance, economic conditions, competition and consumer preferences.
Useful Lives of Intangible Assets - Most of our trade names which have carrying value have been assigned an indefinite life and are not amortized because we plan to receive the benefit from them indefinitely. If we decide to curtail or eliminate the use of any of the trade names or if sales that are generated from any particular trade name do not support the carrying value of the trade name, then we would record impairment or assign an estimated useful life and amortize over the remaining useful life. Rights such as prepaid licenses and non-compete agreements are amortized over contractual periods. The useful lives of customer relationships are based on the discounted cash flows expected to be received from sales to the customers adjusted for an attrition rate. The loss of a major customer or declining sales in general could create an impairment charge.
Insurance Reserves - We have a self-insured medical plan which covers approximately 1,500 of our employees. We record a liability for incurred but not yet reported or paid claims based on our historical experience of claims payments and a calculated lag time period. We maintain a spreadsheet that includes claims payments made each month according to the date the claim was incurred. This enables us to have an historical record of claims incurred but not yet paid at any point in the past. We then compare our accrued liability to the more recent claims incurred but not yet paid amounts and adjust our recorded liability up or down accordingly. Our recorded liability at September 24, 2016 and September 26, 2015 was $1,719,000 and $1,659,000, respectively. Considering that we have stop loss coverage of $200,000 for each individual plan subscriber, the general consistency of claims payments and the short time lag, we believe that there is not a material exposure for this liability. Because of the foregoing, we do not engage a third party actuary to assist in this analysis.
We self-insure, up to loss limits, worker’s compensation and automobile liability claims. Accruals for claims under our self-insurance program are recorded on a claims-incurred basis. Under this program, the estimated liability for claims incurred but unpaid in fiscal years 2016 and 2015 was $1,900,000 and $2,800,000 respectively. Our total recorded liability for all years’ claims incurred but not yet paid was $8,200,000 and $8,200,000 at September 24, 2016 and September 26, 2015, respectively. We estimate the liability based on total incurred claims and paid claims adjusting for loss development factors which account for the development of open claims over time. We estimate the amounts we expect to pay for some insurance years by multiplying incurred losses by a loss development factor which is based on insurance industry averages and the age of the incurred claims; our estimated liability is then the difference between the amounts we expect to pay and the amounts we have already paid for those years. Loss development factors that we use range from 1.0 to 2.0. However, for some years, the estimated liability is the difference between the amounts we have already paid for that year and the maximum we could pay under the program in effect for that particular year because the calculated amount we expect to pay is higher than the maximum. For other years, where there are few claims open, the estimated liability we record is the amount the insurance company has reserved for those claims. We evaluate our estimated liability on a continuing basis and adjust it accordingly. Due to the multi-year length of these insurance programs, there is exposure to claims coming in lower or higher than anticipated; however, due to constant monitoring and stop loss coverage of $350,000 on individual claims, we believe our exposure is not material. Because of the foregoing, we do not engage a third party actuary to assist in this analysis. In connection with these self-insurance agreements, we customarily enter into letters of credit arrangements with our insurers. At September 24, 2016 and September 26, 2015, we had outstanding letters of credit totaling $8,675,000 and $9,075,000, respectively.
Inventories - Inventories are valued at the lower of cost (determined by the first-in, first-out method) or market. We recognize abnormal amounts of idle facilities, freight, handling costs, and spoilage as charges of the current period. Additionally, we allocate fixed production overhead to inventories based on the normal capacity of our production facilities. We calculate normal capacity as the production expected to be achieved over a number of periods or seasons under normal circumstances, taking into account the loss of capacity resulting from planned maintenance. This requires us to use judgment to determine when production is outside the range of expected variation in production (either abnormally low or abnormally high). In periods of abnormally low production (for example, periods in which there is significantly lower demand, labor and material shortages exist, or there is unplanned equipment downtime) the amount of fixed overhead allocated to each unit of production is not increased. However, in periods of abnormally high production the amount of fixed overhead allocated to each unit of production is decreased to assure inventories are not measured above cost.
Income Taxes - We account for our income taxes under the liability method. Under the liability method, deferred tax assets and liabilities are determined based on the difference between the financial statement and tax bases of assets and liabilities as measured by the enacted tax rates that will be in effect when these differences reverse. Deferred tax expense is the result of changes in deferred tax assets and liabilities.
Refer to Note A to the accompanying consolidated financial statements for additional information on our accounting policies.
RESULTS OF OPERATIONS:
Fiscal 2016 (52 weeks) Compared to Fiscal Year 2015 (52 weeks)
Net sales increased $16,525,000, or 2%, to $992,781,000 in fiscal 2016 from $976,256,000 in fiscal 2015.
We have three reportable segments, as disclosed in the accompanying notes to the consolidated financial statements: Food Service, Retail Supermarkets and Frozen Beverages.
The Chief Operating Decision Maker for Food Service and Retail Supermarkets and the Chief Operating Decision Maker for Frozen Beverages monthly review detailed operating income statements and sales reports in order to assess performance and allocate resources to each individual segment. Sales is considered to be the one and only key variable monitored by the Chief Operating Decision Makers and management when determining each segment’s and the company’s financial condition and operating performance. In addition, the Chief Operating Decision Makers review and evaluate depreciation, capital spending and assets of each segment on a quarterly basis to monitor cash flow and asset needs of each segment.
FOOD SERVICE
Sales to food service customers increased $4,894,000 or less than 1%, to $621,529,000 in fiscal 2016. Soft pretzel sales to the food service market increased 1% to $170,155,000 for the year with sales increases and decreases throughout our customer base. Soft pretzel sales to restaurant chains were about the same this year and last year. Frozen juice bar and ices sales decreased $2,656,000, or 5%, to $51,798,000 for the year due primarily to lower sales to two customers. Churro sales to food service customers were up 1% to $57,318,000 for the year with sales increases and decreases throughout our customer base. Sales of bakery products decreased $6,617,000, or 2%, for the year with sales to one customer down $7.0 million as the customer added a secondary supplier. Handheld sales to food service customers were up 26% to $27,427,000 in 2016 with sales increases to one customer accounting for about 80% of the increase. Sales of funnel cake increased $7,000,000, or 57% to $19,179,000 due primarily to increased sales to school food service and $4.0 million of sales to a new restaurant chain customer. Sales of new products in the first twelve months since their introduction were approximately $32 million for the year. Price increases accounted for approximately $5 million of sales for the year and net volume, including new product sales as defined above, was essentially unchanged from last year. Operating income in our Food Service segment increased from $75,286,000 in 2015 to $76,539,000 in 2016. Operating income for the year benefitted from lower marketing expenses, lower ingredient costs, significantly increased volume of our handhelds and funnel cake products, pricing and more favorable product mix and was hurt by higher group health insurance costs and lower volume of our frozen juices and ices and bakery products. However, operating income in the fourth quarter decreased from $23,665,000 in 2015 to $17,498,000 in 2016 primarily because of a 2% decline in sales and higher manufacturing expenses. We anticipate that these issues will continue to affect us into the first quarter of fiscal year 2017. Additionally, approximately 1/4 of the decrease of $6,167,000 in operating income resulted from costs related to certain bakery products that were withdrawn from the market due to quality issues.
RETAIL SUPERMARKETS
Sales of products to retail supermarkets decreased $5,788,000 or 5% to $117,589,000 in fiscal year 2016. Soft pretzel sales to retail supermarkets were $33,279,000 compared to $35,727,000 in 2015, a decrease of 7%. About 1/2 of the pretzel sales decline was due to the discontinuance of SUPERPRETZEL BAVARIAN Soft Pretzel bread which was introduced in 2015. Sales of frozen juices and ices decreased $3,250,000 or 5% to $68,924,000. Increased trade spending to introduce WHOLE FRUIT Organic juice tubes and new PHILLY SWIRL products and general declines in sales of our existing PHILLY SWIRL products accounted for all of the sales decline in frozen juices and ices. PHILLY SWIRL sales were down primarily because of lower sales to a customer in Canada due to the stronger US dollar, lower sales to one warehouse club store which carried fewer SKUS this year and decreased sales to one retail supermarket customer of a product that is being discontinued. Although sales were down for the year, PHILLY SWIRL sales were marginally higher in the fourth quarter. Coupon redemption costs, a reduction of sales, which were higher in the first six months a year ago supporting the introduction of the SUPERPRETZEL BAVARIAN Soft Pretzel Bread, decreased 6% to $4,430,000 for the year. Handheld sales to retail supermarket customers decreased 19% to $15,347,000 for the year. Roughly 37% of the handhelds sales decline in the year resulted from increased trade spending to introduce PILLSBURY mini dessert pies. The balance of the sales decline was spread over our customer base. Sales of OREO churros, introduced this year, were approximately $4.0 million for the year, with about ½ of the sales coming in the fourth quarter.
Sales of new products in the first twelve months since their introduction were approximately $8 million in fiscal year 2016. Price increases accounted for approximately $2 million of sales for the year but higher trade spending of $6 million and volume decreases of $2 million resulted in an overall sales decline of $5.7 million. Operating income in our Retail Supermarkets segment decreased from $11,020,000 to $9,618,000 for the year primarily because of approximately $2 million of increased trade spending related to the introduction of WHOLE FRUIT Organic juice tubes, OREO churros, PILLSBURY mini dessert pies and other new products and lower soft pretzels and frozen juices and ices sales volume. However, operating income in the fourth quarter increased from $1,413,000 in 2015 to $1,793,000 in 2016 primarily because of a 4% increase in overall sales.
FROZEN BEVERAGES
Frozen beverage and related product sales increased 7% to $253,663,000 in fiscal 2016. Beverage sales alone increased 5% to $150,118,000 for the year with increases and decreases throughout our customer base. Gallon sales were up 6% in our base ICEE business, with sales to movie theaters accounting for about 3/4 of the increase. Service revenue increased 8% to $71,123,000 for the year with sales increases and decreases spread throughout our customer base. Sales of beverage machines, which tend to fluctuate from year to year while following no specific trend, increased from $26,413,000 in 2015 to $31,155,000 in 2016. The estimated number of Company owned frozen beverage dispensers was 52,000 and 49,000 at September 24, 2016 and September 26, 2015, respectively. Operating income in our Frozen Beverage segment increased from $24,582,000 in 2015 to $26,653,000 in 2016 due primarily to higher sales in all areas of the business.
CONSOLIDATED
Other than as commented upon above by segment, there are no material specific reasons for the reported sales increases or decreases. Sales levels can be impacted by the appeal of our products to our customers and consumers and their changing tastes, competitive and pricing pressures, sales execution, marketing programs, seasonal weather, customer stability and general economic conditions.
Gross profit as a percentage of sales decreased to 30.67% in 2016 from 30.82% in 2015. Gross profit percentage benefitted from lower ingredient costs, pricing and increased food service handhelds and funnel cake business which was more than offset by higher costs in our frozen beverages business and increased trade spending related to the introduction of WHOLE FRUIT Organic juice tubes, OREO churros, PILLSBURY mini dessert pies and new PHILLY SWIRL products in our retail supermarket business, as well as by lower volume in most of our food service segment and in our retail supermarket business and the product withdrawal in our food service segment mentioned previously.
Total operating expenses increased $1,655,000 to $191,657,000 in fiscal 2016 and as a percentage of sales decreased to 19.31% of sales from 19.46% in 2015. Marketing expenses were 8.66% and 8.72% of sales in 2016 and 2015, respectively. Distribution expenses as a percent of sales decreased to 7.36% from 7.60% in 2015 due in part to lower fuel costs and shipping efficiencies. Administrative expenses were 3.25% and 3.16% of sales in 2016 and 2015, respectively. Other general expense of $281,000 this year compared to other general income of $207,000 in 2015.
Operating income increased $1,922,000 or 2% to $112,810,000 in fiscal year 2016 as a result of the aforementioned items.
Our investments generated before tax income of $4.1 million this year, up from $1.2 million last year as sales of our mutual fund investments, net of capital gain distributions, generated a realized loss of $598,000 this year compared to a realized loss of $3.9 million last year. Although we recognized losses as we decreased our investments in mutual funds, our overall return on the mutual funds has been positive since we first made the investments in October 2012. We have reduced our investments in mutual funds over the past year to $13 million at September 2016 from $19 million at September 2015 and $128 million at September 2014. The remaining unrealized losses of $520,000 are spread over 4 funds with total fair market value of $12.5 million. The remaining mutual funds presently generate income of 4.9 % per year. We have invested $17 million in Fixed-to-Floating Perpetual Preferred Stock which generates fixed income to call dates in 2018, 2019 and 2025 and then income is based on a spread above LIBOR if the securities are not called. The annual yield from these investments is presently 5.5%, of which 70% is not subject to income tax. The mutual funds and the Fixed-to-Floating Perpetual Preferred Stock investment securities do not have contractual maturities; however, we classify them as long term assets as it is our intent to hold them for a period of over one year, although we may sell some or all of them depending on presently unanticipated needs for liquidity or market conditions. We have invested $103 million in corporate bonds which generate fixed income to maturity dates in 2017 through 2021, with $67 million maturing prior to the end of our fiscal year 2018. The bonds presently generate income of about 2.2% per year. Our expectation is that we will hold the corporate bonds to their maturity dates and redeem them at our amortized cost.
The effective income tax rate decreased to 35.0% from 37.3% last year because the realized losses on sales of our mutual fund investments in 2015 and 2016 are not deductible as we do not have capital gains to offset the losses and our income tax expense for 2016 benefitted by $885,000 related to share base compensation (see Note A13). We expect the effective income tax rate for 2017 to be between 35% and 35-1/2%.
Net investment after tax income for the year of $2.7 million, or $.14 per share, compared to last year’s net investment after tax loss of $516,000, or $.03 per share.
Net earnings increased $5,792,000 or 8%, in fiscal 2016 to $75,975,000, or $.32 per diluted share as a result of the aforementioned items.
There are many factors which can impact our net earnings from year to year and in the long run, among which are the supply and cost of raw materials and labor, insurance costs, factors impacting sales as noted above, the continuing consolidation of our customers, our ability to manage our manufacturing, marketing and distribution activities, our ability to make and integrate acquisitions and changes in tax laws and interest rates.
Fiscal 2015 (52 weeks) Compared to Fiscal Year 2014 (52 weeks)
Net sales increased $56,805,000, or 6%, to $976,256,000 in fiscal 2015 from $919,451,000 in fiscal 2014.
Excluding sales of PHILLY SWIRL, which was acquired in the third quarter of fiscal 2014, through April of this year, sales increased approximately 5% for the year.
We have three reportable segments, as disclosed in the accompanying notes to the consolidated financial statements: Food Service, Retail Supermarkets and Frozen Beverages.
The Chief Operating Decision Maker for Food Service and Retail Supermarkets and the Chief Operating Decision Maker for Frozen Beverages monthly review detailed operating income statements and sales reports in order to assess performance and allocate resources to each individual segment. Sales is considered to be the one and only key variable monitored by the Chief Operating Decision Makers and management when determining each segment’s and the company’s financial condition and operating performance. In addition, the Chief Operating Decision Makers review and evaluate depreciation, capital spending and assets of each segment on a quarterly basis to monitor cash flow and asset needs of each segment.
FOOD SERVICE
Sales to food service customers increased $24,737,000 or 4%, to $616,635,000 in fiscal 2015. Soft pretzel sales to the food service market increased 3% to $168,970,000 for the year aided primarily by increased sales to school food service and convenience stores. Increased sales to one customer accounted for approximately 3/4 of the pretzel sales increase. Soft pretzel sales to restaurant chains were down about 4% this year to about $40 million. Frozen juice bar and ices sales increased $566,000, or 1%, to $54,454,000 for the year due entirely to increased sales of WHOLEFRUIT Frozen Organic Juice Tubes to one customer; excluding these sales, frozen juices and ices sales were down 3%. Churro sales to food service customers were up 1% to $56,602,000 for the year which include a decline in sales of $6,469,000 to one restaurant chain that discontinued carrying churros in August 2014. Churro sales to other customers were up 15% for the year with sales to four customers accounting for about 1/2 of the increase. Sales of bakery products increased $19,579,000, or 7%, for the year as sales increases were concentrated in eight customers and to school food service. Handheld sales to food service customers were down 10% to $21,817,000 in 2015 as sales declines were spread throughout our customer base. Sales of new products in the first twelve months since their introduction were approximately $18 million for the year. Price increases accounted for approximately $9 million of sales for the year and net volume increases, including new product sales as defined above, accounted for approximately $16 million of sales for the year. Operating income in our Food Service segment increased from $73,731,000 in 2014 to $75,286,000 in 2015. Operating income benefited from lower distribution costs and improved performance at some of our smaller manufacturing facilities and was negatively impacted by continuing declines in sales of our handhelds business, higher manufacturing costs and higher costs of egg raw material. Additionally, operating income was impacted in 2014 by $973,000 of shutdown costs of our Norwalk, California, manufacturing facility.
RETAIL SUPERMARKETS
Sales of products to retail supermarkets increased $10,733,000 or 10% to $123,377,000 in fiscal year 2015. Excluding sales of PHILLY SWIRL through April of this year, sales increased approximately 1% for the year, although sales in our fourth quarter were down 9% due to lower sales of handhelds and higher trade spending. Soft pretzel sales to retail supermarkets were $35,727,000 compared to $34,830,000 in 2014, an increase of 3%. Sales of frozen juices and ices increased $12,770,000 or 21% to $72,174,000. Without PHILLY SWIRL sales, sales of frozen juices and ices were up $3,669,000, or 6%, with sales increases and decreases spread across our customer base. Coupon redemption costs, a reduction of sales, increased 24% or about $918,000 for the year. Handheld sales to retail supermarket customers decreased 11% to $18,957,000 in 2015 as three customers accounted for about 3/4 of the decrease in sales. Sales of products in the first twelve months since their introduction were approximately $1.5 million in fiscal year 2015. Price increases accounted for approximately $2.7 million of sales for the year and net volume increases, including new product sales as defined above and PHILLY SWIRL’s sales and net of increased coupon costs, accounted for approximately $8 million in sales for the year. Operating income in our Retail Supermarkets segment decreased from $11,201,000 in 2014 to $11,020,000 in 2015 due primarily to higher coupon expense and advertising expenses to support our SUPERPRETZEL soft pretzel products. Additionally, in 2015, we were impacted by operating losses of PHILLY SWIRL during its off season while in 2014 we acquired PHILLY SWIRL after its off season.
FROZEN BEVERAGES
Frozen beverage and related product sales increased 10% to $236,244,000 in fiscal 2015. Beverage sales alone increased 7% to $142,705,000 for the year with increases and decreases throughout our customer base. Gallon sales were up 7% in our base ICEE business, with sales to movie theaters accounting for about half of the increase. Service revenue increased 10% to $65,765,000 for the year with sales increases and decreases spread throughout our customer base. Sales of beverage machines, which tend to fluctuate from year to year while following no specific trend, increased from $20,224,000 in 2014 to $26,413,000 in 2015. The estimated number of Company owned frozen beverage dispensers was 53,000 and 49,000 at September 26, 2015 and September 27, 2014, respectively. Operating income in our Frozen Beverage segment increased from $21,916,000 in 2014 to $24,582,000 in 2015 due primarily to higher sales in all areas of the business and lower fuel costs.
CONSOLIDATED
Other than as commented upon above by segment, there are no material specific reasons for the reported sales increases or decreases. Sales levels can be impacted by the appeal of our products to our customers and consumers and their changing tastes, competitive and pricing pressures, sales execution, marketing programs, seasonal weather, customer stability and general economic conditions.
Gross profit as a percentage of sales decreased to 30.82% in 2015 from 31.28% in 2014. Gross profit margins benefited from the improved performance of our frozen beverages business and from higher gross profit margins in our retail supermarket business. Gross profit margins in our food service segment were impacted by increased lower margin school food service sales, continuing decline in sales of our handhelds business, higher manufacturing costs, modest volume increases and higher egg raw material costs. We will continue to be impacted by higher egg raw material costs in our 2016 fiscal year resulting from the Avian Flu epidemic; however, we have increased our selling prices intending to recover a significant portion of the increased costs.
Total operating expenses increased $9,273,000 to $190,002,000 in fiscal 2015 and as a percentage of sales decreased to 19.46% of sales from 19.66% in 2014. Marketing expenses were 8.72% and 8.55% of sales in 2015 and 2014, respectively. Marketing expenses this year included additional spending to support our retail SUPERPRETZEL soft pretzel products. Distribution expenses as a percent of sales decreased to 7.60% from 7.74% in 2014 due in part to lower fuel costs. Administrative expenses were 3.16% and 3.24% of sales in 2015 and 2014, respectively. Other general income of $207,000 this year compared to other general expense of $1,154,000 in 2014. Included in other general expense in 2014 is $973,000 of shutdown costs of our Norwalk, CA manufacturing facility.
Operating income increased $4,040,000 or 4% to $110,888,000 in fiscal year 2015 as a result of the aforementioned items.
Our investments generated before tax income of $1.2 million this year, down from $4.5 million last year as sales of our mutual fund investments, net of capital gain distributions, generated a realized loss of $3.9 million this year. Although we recognized losses as we decreased our investments in mutual funds, our overall return on the mutual funds has been positive since we first made the investments in October 2012. We have reduced our investments in mutual funds over the past year to $19 million at September 2015 from $128 million at September 2014. The remaining unrealized losses of $827,000 are spread over 4 funds with total fair market value of $19.2 million. The remaining mutual funds presently generate income of 4.8 % per year. We invested $20 million this year in Fixed-to-Floating Perpetual Preferred Stock which generates fixed income to call dates in 2018, 2019 and 2025 and then income is based on a spread above LIBOR if the securities are not called. The annual yield from these investments is presently 5.5%, of which 70% is not subject to income tax. The mutual funds and the Fixed-to-Floating Perpetual Preferred Stock investment securities do not have contractual maturities; however, we classify them as long term assets as it is our intent to hold them for a period of over one year, although we may sell some or all of them depending on presently unanticipated needs for liquidity or market conditions. In the fourth quarter we invested $67 million in corporate bonds which generate fixed income to maturity dates in 2017 through 2021, with $40 million maturing prior to the end of our fiscal year 2018. The bonds presently generate income of about 2.5% per year. Our expectation is that we will hold the corporate bonds to their maturity dates and redeem them at our amortized cost.
The effective income tax rate increased to 37.3% from 35.4% last year primarily because the realized losses on sales of our mutual fund investments in 2015 are not deductible as we do not have capital gains to offset the losses. We expect the effective income tax rate for 2016 to be between 36% and 36.5%.
Net investment after tax loss for the year of $516,000, or $.03 per share, compared to last year’s net investment after tax income of $2.8 million, or $.15 per share.
Net earnings decreased $1,631,000 or 2%, in fiscal 2015 to $70,183,000, or $.09 per diluted share as a result of the aforementioned items.
There are many factors which can impact our net earnings from year to year and in the long run, among which are the supply and cost of raw materials and labor, insurance costs, factors impacting sales as noted above, the continuing consolidation of our customers, our ability to manage our manufacturing, marketing and distribution activities, our ability to make and integrate acquisitions and changes in tax laws and interest rates.
RESULTS OF OPERATIONS
ACQUISITIONS
In June 2012, we acquired the assets of Kim & Scott’s Gourmet Pretzels, Inc., a manufacturer and seller of a premium brand soft pretzel. This business had sales of approximately $8 million over the prior twelve months to food service and retail supermarket customers, and had sales of approximately $1.8 million in our 2012 fiscal year from the acquisition date.
In October 2013, we acquired the assets of New York Pretzel, a manufacturer and distributor of soft pretzels selling primarily in the northeast to foodservice and retail locations. Of the purchase price of $11.8 million, $849,000 was allocated to intangible assets, $7,716,000 was allocated to goodwill and $3,049,000 was allocated to property, plant and equipment. This business had sales of about $4.3 million in our 2014 fiscal year included in the food service segment.
In May 2014, we acquired the stock of Philly’s Famous Water Ice, Inc. (PHILLY SWIRL). PHILLY SWIRL, located in Tampa, FL, produces frozen novelty products sold primarily to retail supermarket locations throughout the United States and to Canada with annual sales approximating $25 million. The allocation of the purchase price of $17.4 million is $4.0 million to working capital, $1.2 million to property, plant and equipment, $11.1 million to intangible assets, $1.8 million to goodwill, $4.0 million to deferred tax assets and $95,000 to other assets and $4.8 million to deferred tax liabilities. Sales of PHILLY SWIRL from the acquisition date to September 26, 2015 were $12.6 million and are included in the retail supermarket segment.
These acquisitions were accounted for under the purchase method of accounting, and their operations are included in the accompanying consolidated financial statements from their respective acquisition dates.
LIQUIDITY AND CAPITAL RESOURCES
Although there are many factors that could impact our operating cash flow, most notably net earnings, we believe that our future operating cash flow, along with our borrowing capacity, our current cash and cash equivalent balances and our investment securities is sufficient to fund future growth and expansion. See Note C to our financial statements for a discussion of our investment securities.
Fluctuations in the value of the Mexican and Canadian currencies and the resulting translation of the net assets of our Mexican and Canadian subsidiaries caused an increase of $3,065,000 in accumulated other comprehensive loss in 2016, an increase of $5,389,000 in accumulated other comprehensive loss in 2015 and an increase of $929,000 in accumulated other comprehensive loss in 2014. In 2016, sales of the two subsidiaries were $27,075,000 as compared to $25,313,000 in 2015 and $23,633,000 in 2014.
In our fiscal year ended September 24, 2016, we purchased and retired 141,700 shares of our common stock at a cost of $15,265,019. In our first quarter, we purchased and retired 27,083 shares at a cost of $3,115,439. In our second quarter, we purchased and retired 80,565 shares at a cost of $8,642,887. In our third quarter, we purchased and retired 34,052 shares at a cost of $3,506,693. We did not purchase and retire any shares in our fourth quarter.
In our fiscal year ended September 26, 2015, we purchased and retired 72,698 shares of our common stock at a cost of $8,011,118.
In our fiscal year ended September 27, 2014, we purchased and retired 81,685 shares of our common stock at a cost of $7,504,729.
In November 2016, we entered into an amendment and modification to an amended and restated loan agreement with our existing banks which provides for up to a $50,000,000 revolving credit facility repayable in November 2021. The agreement contains restrictive covenants and requires commitment fees in accordance with standard banking practice. There were no outstanding balances under the facility at September 24, 2016 or at September 26, 2015. The significant financial covenants are:
|
|
● |
Tangible net worth must initially be more than $465 million. |
|
|
● |
Total funded indebtedness divided by earnings before interest expense, income taxes, depreciation and amortization shall not be greater than 2.25 to 1. |
We were in compliance with the financial covenants described above at September 24, 2016.
We self-insure, up to loss limits, certain insurable risks such as worker's compensation and automobile liability claims. Accruals for claims under our self-insurance program are recorded on a claims-incurred basis. Under this program, the estimated liability for claims incurred but unpaid in fiscal years 2016 and 2015 was $1,900,000 and $2,800,000, respectively. In connection with certain self-insurance agreements, we customarily enter into letters of credit arrangements with our insurers. At September 24, 2016 and September 26, 2015, we had outstanding letters of credit totaling $8,575,000 and $9,075,000, respectively.
The following table presents our contractual cash flow commitments on long-term debt, operating leases and purchase commitments for raw materials and packaging. See Notes to the consolidated financial statements for additional information on our long-term debt and operating leases.
|
Total |
Less Than 1 Year |
1-3 Years |
4-5 Years |
After 5 Years |
||||||||||||||||
|
Long-term debt,including current maturities |
$ | - | $ | - | $ | - | $ | - | $ | - | ||||||||||
|
Capital lease obligations |
1,600 | 365 | 638 | 528 | 69 | |||||||||||||||
|
Purchase commitments |
75,000 | 73,500 | 1,500 | - | - | |||||||||||||||
|
Operating leases |
65,475 | 13,351 | 21,134 | 11,744 | 19,246 | |||||||||||||||
|
Total |
$ | 142,075 | $ | 87,216 | $ | 23,272 | $ | 12,272 | $ | 19,315 | ||||||||||
The purchase commitments do not exceed our projected requirements over the related terms and are in the normal course of business.
Fiscal 2016 Compared to Fiscal 2015
Cash and cash equivalents and marketable securities held to maturity and available for sale increased $34,401,000, or 14%, to $274,388,000 from a year ago for reasons described below.
Accounts receivables, net decreased $4,324,000, or 4%, to $98,325,000 in 2016 because of lower sales in this year’s September month and timing of collections. Inventories increased $6,027,000 or 7% to $88,684,000 in 2016 due to sluggish September sales this year and changes in product mix.
Prepaid expenses and other increased to $13,904,000 from $6,557,000 last year due primarily to an increase in prepaid income taxes as a result of adopting bonus depreciation.
Net property, plant and equipment increased $12,159,000 to $184,213,000 because purchases of property, plant and equipment for the improvement and expansion of our manufacturing capabilities and frozen carbonated beverage business exceeded depreciation on existing assets. Purchases of property, plant and equipment were $48,709,000 in 2016 and $48,641,000 in 2015.
Goodwill remained at $86,442,000 because there was no goodwill acquired in acquisitions and no impairment charges.
Other intangible assets, less accumulated amortization decreased $4,000,000 to $41,819,000 due to amortization of $5,078,000 during the year, offset by $1,078,000 paid for the acquisition of the HEARTBAR brand in the food service segment.
Marketable securities available for sale and held to maturity increased by $27,438,000 to $133,736,000 as we reinvested proceeds from the 2015 sales of our mutual funds investments.
Accounts Payables increased 5% to $62,026,000 from $59,206,000.
Accrued insurance liability was essentially unchanged at $10,119,000 as our estimates for incurred but not yet paid claims under our group insurance and insurance liability programs remained about the same as at September 2015.
Accrued compensation expense increased 7% to $16,340,000 due to an increase in our employee base and a general increase in the level of pay rates.
Dividends payable increased to $7,280,000 as our quarterly dividend payment increased to $.39/share from $.36/share.
Deferred income tax liabilities increased $7,663,000 to $48,186,000 from $40,523,000 because of increased liabilities related to depreciation of property and equipment.
Other long-term liabilities include $354,000 of gross unrecognized tax benefits at September 24, 2016 and $334,000 at September 26, 2015.
Common stock decreased $6,321,000 to $25,332,000 in 2016 because repurchases of our common stock of $15,265,000 exceeded increases totaling $8,945,000 from the exercise of incentive and nonqualified stock options, stock issued under our stock purchase plan for employees, stock issued under our deferred stock plan and share-based compensation expense.
Net cash provided by operating activities increased $17,304,000 to $121,225,000 in 2016 primarily because of an increase in net earnings of $5,792,000, a reduction of accounts receivable of $3,571,000 in 2016 compared to an increase of $3,123,000 in 2015, an increase of accounts payable and accrued liabilities of $3,888,000 compared to $287,000 in 2015 and an increase in deferred income taxes of $7,700,000, as well as by higher depreciation of fixed assets of $2,180,000 in 2016.
Net cash used in investing activities increased $46,111,000 to $74,602,000 in 2016 from $28,491,000 in 2015 primarily because purchases of marketable securities, net of proceeds, was $28,562,000 in 2016 compared to proceeds from marketable securities, net of purchases, of $19,877,000, in 2015. We reduced our holdings of mutual funds in 2015 by $109 million.
Net cash used in financing activities of $29,745,000 in 2015 increased to $37,573,000 in 2016 primarily because of increased dividend payments of $2,369,000 and increased repurchases of common stock of $7,254,000.
In 2016, the major variables in determining our net increase in cash and cash equivalents and marketable securities were our net earnings, depreciation and amortization of fixed assets, changes in accounts receivable and accounts payable, purchases of property, plant and equipment, payments of cash dividend and the repurchase of common stock. Other variables which in the past have had a significant impact on our change in cash and cash equivalents and marketable securities are purchases of companies and proceeds from borrowings and payments of long-term debt. As discussed in results of operations, our net earnings may be influenced by many factors. Depreciation and amortization of fixed assets is primarily determined by past purchases of property, plant and equipment although it could be impacted by a significant acquisition. Purchases of property, plant and equipment are primarily determined by our ongoing normal manufacturing and marketing requirements but could be increased significantly for manufacturing expansion requirements or large frozen beverage customer needs. From time to time, we have repurchased common stock and we anticipate that we will do so again in the future. We are actively seeking acquisitions that could be a significant use of cash. Although we have no long-term debt at September 24, 2016, we may borrow in the future depending on our needs.
Fiscal 2015 Compared to Fiscal 2014
Cash and cash equivalents and marketable securities held to maturity and available for sale increased $18,110,000, or 8%, to $239,987,000 from a year ago for reasons described below.
Accounts receivables, net increased $2,677,000, or 3%, to $102,649,000 in 2015, generally in line with sales increases in our fourth quarter. Inventories increased $4,539,000 or 6% to $80,622,000 in 2015 due primarily to an increase in parts inventory to support our growing repair and maintenance service in our frozen beverages segment.
Prepaid expenses and other increased to $6,557,000 from $3,695,000 last year primarily because of an increase in prepaid income taxes of $2,314,000 this year compared to last year.
Net property, plant and equipment increased $16,560,000 to $174,089,000 because purchases of property, plant and equipment for the improvement and expansion of our manufacturing capabilities and frozen carbonated beverage business exceeded depreciation on existing assets. Purchasing of property, plant and equipment were $11,265,000 higher in 2015 than in 2014 because of significant manufacturing improvements in pretzel production and growth of our frozen beverage customer base.
Goodwill remained at $86,442,000 because there was no goodwill acquired in acquisitions.
Other intangible assets, less accumulated amortization decreased $5,170,000 to $45,819,000 due almost entirely to amortization of $5,370,000 during the year.
Marketable securities available for sale and held to maturity decreased by $23,819,000 to $106,298,000 as we reduced our holdings of mutual funds from $128.1 million to $19.2 million during the year and invested $86.4 million in corporate bonds and preferred stocks.
Accounts Payables decreased less than 1% to $59,206,000 from $59,968,000.
Accrued insurance liability decreased $347,000, or 3% to $10,231,000 due to decreases in estimates for incurred but not yet paid claims under our group insurance and insurance liability programs.
Accrued compensation expense increased 7% to $15,318,000 due to an increase in our employee base and a general increase in the level of pay rates.
Dividends payable increased to $6,723,000 as our quarterly dividend payment increased to $.36/share from $.32/share.
Deferred income tax liabilities decreased $1,031,000 to $43,789,000 from $44,820,000.
Other long-term liabilities include $334,000 of gross unrecognized tax benefits at September 26, 2015 and $315,000 at September 27, 2014.
Common stock decreased $968,000 to $31,653,000 in 2015 because repurchases of our common stock of $8,011,000 exceeded increases totaling $6,625,000 from the exercise of incentive and nonqualified stock options, stock issued under our stock purchase plan for employees, stock issued under our deferred stock plan and share-based compensation expense.
Net cash provided by operating activities decreased $1,269,000 to $105,273,000 in 2015 primarily because of a decrease in net earnings of $1,631,000, an increase of prepaid expenses of $2,871,000 in 2015 compared to $182,000 in 2014 and an increase of accounts payable and accrued liabilities of $287,000 compared to $6,831,000 in 2014 which were mainly offset by increased loss on sale of marketable securities of $3,958,000 and a decrease in accounts receivable of $3,123,000 in 2015 compared to $8,913,000 in 2014.
Net cash used in investing activities decreased $56,269,000 to $29,843,000 in 2015 from $86,112,000 in 2014 primarily because net proceeds from marketable securities of $19,980,000 in 2015 compared to net purchases of marketable securities of $19,687,000 in 2014 and a decline in payments for purchases of companies of $27,745,000 which were offset by increased purchases of property, plant and equipment of $11,265,000.
Net cash used in financing activities of $25,435,000 in 2014 increased to $29,745,000 in 2015 primarily because of increased dividend payments $5,230,000.
In 2015, the major variables in determining our net increase in cash and cash equivalents and marketable securities were our net earnings, depreciation and amortization of fixed assets, increase in accounts receivable and accounts payable, purchases of property, plant and equipment, payments of cash dividend and the repurchase of common stock. Other variables which in the past have had a significant impact on our change in cash and cash equivalents and marketable securities are purchases of companies and proceeds from borrowings and payments of long-term debt. As discussed in results of operations, our net earnings may be influenced by many factors. Depreciation and amortization of fixed assets is primarily determined by past purchases of property, plant and equipment although it could be impacted by a significant acquisition. Purchases of property, plant and equipment are primarily determined by our ongoing normal manufacturing and marketing requirements but could be increased significantly for manufacturing expansion requirements or large frozen beverage customer needs. From time to time, we have repurchased common stock and we anticipate that we will do so again in the future. We are actively seeking acquisitions that could be a significant use of cash. Although we have no long-term debt at September 26, 2015, we may borrow in the future depending on our needs.
Item 7A. Quantitative And Qualitative Disclosures About Market Risk
The following is the Company’s quantitative and qualitative analysis of its financial market risk:
Interest Rate Sensitivity
The Company has in the past entered into interest rate swaps to limit its exposure to interest rate risk and may do so in the future if the Board of Directors feels that such non-trading purpose is in the best interest of the Company and its shareholders. As of September 24, 2016, the Company had no interest rate swap contracts.
Interest Rate Risk
At September 24, 2016, the Company had no long-term debt obligations.
Purchasing Risk
The Company’s most significant raw material requirements include flour, shortening, corn syrup, sugar, juice, cheese, chocolate, and a variety of nuts. The Company attempts to minimize the effect of future price fluctuations related to the purchase of raw materials primarily through forward purchasing to cover future manufacturing requirements, generally for periods from 1 to 12 months. Future contracts are not used in combination with forward purchasing of these raw materials. The Company’s procurement practices are intended to reduce the risk of future price increases, but also may potentially limit the ability to benefit from possible price decreases.
Foreign Exchange Rate Risk
The Company has not entered into any forward exchange contracts to hedge its foreign currency rate risk as of September 24, 2016, because it does not believe its foreign exchange exposure is significant.
Item 8. Financial Statements And Supplementary Data
The financial statements of the Company are filed under this Item 8, beginning on page F-1 of this report.
Item 9. Changes In And Disagreements With Accountants On Accounting And Financial Disclosure
None.
Item 9A. Controls And Procedures
Disclosure Controls and Procedures
We carried out an evaluation under the supervision and with the participation of our management, including our chief executive officer and chief financial officer, of the effectiveness of the design and operation of our disclosure controls and procedures, as such term is defined under Rule 13a-15(e) promulgated under the Securities Exchange Act of 1934 (the "Exchange Act"), as amended for financial reporting, as of September 24, 2016. Based on that evaluation, our chief executive officer and chief financial officer concluded that these controls and procedures are effective at a reasonable assurance level.
Our disclosure controls and procedures are designed to provide reasonable assurance that information required to be disclosed by us in the reports that we file or submit under the Exchange Act is recorded, processed, summarized, and reported, within the time periods specified in the rules and forms of the Securities and Exchange Commission. These disclosure controls and procedures include, among other things, controls and procedures designed to provide reasonable assurance that information required to be disclosed by us in the reports that we file under the Exchange Act is accumulated and communicated to our management, including our chief executive officer and chief financial officer, as appropriate to allow timely decisions regarding required disclosure.
Management’s Report on Internal Control over Financial Reporting
Our management is responsible for establishing and maintaining adequate internal control over financial reporting. Internal control over financial reporting is defined in Rule 13a-15(f) and 15d-15(f) under the Exchange Act as a process designed by, or under the supervision of, the chief executive officer and chief financial officer and effected by the board of directors and management to provide reasonable assurance regarding the reliability of financial reporting and the preparation of financial statements for external purposes in accordance with generally accepted accounting principles and includes those policies and procedures that:
|
● |
Pertain to the maintenance of records that in reasonable detail accurately and fairly reflect the transactions and dispositions of our assets; |
|
|
● |
Provide reasonable assurance that transactions are recorded as necessary to permit preparation of financial statements in accordance with generally accepted accounting principles, and that receipts and expenditures of the company are being made only in accordance with authorizations of our management and board of directors; |
|
● |
Provide reasonable assurance regarding prevention or timely detection of unauthorized acquisition, use or disposition of our assets that could have a material effect on the financial statements. |
Because of its inherent limitations, internal control over financial reporting may not prevent or detect misstatements. Projections of any evaluation of effectiveness to future periods are subject to the risks that controls may become inadequate because of changes in conditions, or that the degree of compliance with the policies or procedures may deteriorate.
Our management assessed the effectiveness of our internal control over financial reporting as of September 24, 2016. In making this assessment, our management used the criteria set forth by the Committee of Sponsoring Organizations of the Treadway Commission (COSO) in the 2013 Internal Control-Integrated Framework.
Based on our assessment, our management believes that, as of September 24, 2016, our internal control over financial reporting is effective. There have been no changes that occurred during our fourth quarter that have materially affected, or are reasonably likely to materially affect, our internal control over financial reporting.
Our independent registered public accounting firm, Grant Thornton LLP, audited our internal control over financial reporting as of September 24, 2016. Their report, dated November 21, 2016, expressed an unqualified opinion on our internal control over financial reporting. That report appears in Item 15 of Part IV of this Annual Report on Form 10-K and is incorporated by reference to this Item 9A.
Item 9B. Other Information
There was no information required on Form 8-K during the quarter that was not reported.
PART III
Item 10. Directors, Executive Officers and Corporate Governance
Portions of the information concerning directors and executive officers, appearing under the captions “Information Concerning Nominees For Election To Board” and “Information Concerning Continuing Directors And Executive Officers” and information concerning Section 16(a) Compliance appearing under the caption “Compliance with Section 16(a) of the Securities Exchange Act of 1934” in the Company’s Proxy Statement filed with the Securities and Exchange Commission in connection with the Annual Meeting of Shareholders to be held on February 15, 2017 (“2016 Proxy Statement”) is incorporated herein by reference.
Portions of the information concerning the Audit Committee, the requirement for an Audit Committee Financial Expert and the Nominating Committee in the Company’s 2016 Proxy Statement filed with the Securities and Exchange Commission in connection with the Annual Meeting of Shareholders to be held on February 15, 2017 is incorporated herein by reference.
The Company has adopted a Code of Ethics pursuant to Section 406 of the Sarbanes-Oxley Act of 2002, which applies to the Company’s principal executive officer and senior financial officers. The Company has also adopted a Code of Business Conduct and Ethics which applies to all employees. The Company will furnish any person, without charge, a copy of the Code of Ethics upon written request to J & J Snack Foods Corp., 6000 Central Highway, Pennsauken, New Jersey 08109, Attn: Dennis Moore. A copy of the Code of Ethics can also be found on our website at www.jjsnack.com. Any waiver of any provision of the Code of Ethics granted to the principal executive officer or senior financial officer may only be granted by a majority of the Company’s disinterested directors. If a waiver is granted, information concerning the waiver will be posted on our website www.jjsnack.com for a period of 12 months.
Item 11. Executive Compensation
Information concerning executive compensation appearing in the Company’s 2016 Proxy Statement under the caption “Management Remuneration” is incorporated herein by reference.
The following is a list of the executive officers of the Company and their principal past occupations or employment. All such persons serve at the pleasure of the Board of Directors and have been elected to serve until the Annual Meeting of Shareholders on February 15, 2017 or until their successors are duly elected.
|
Name |
Age |
Position |
|
|
|
|
|
Gerald B. Shreiber |
74 |
Chairman of the Board, President, Chief Executive Officer and Director |
| Dennis G. Moore | 60 | Senior Vice President, Chief Financial Officer, Secretary, Treasurer and Director |
| Robert M. Radano | 67 | Senior Vice President, Sales and Chief Operating Officer |
| Dan Fachner | 57 | President of The ICEE Company Subsidiary |
| Gerard G. Law | 42 | Senior Vice President and Assistant to the President |
| Robert J. Pape | 59 | Senior Vice President Sales |
Gerald B. Shreiber is the founder of the Company and has served as its Chairman of the Board, President, and Chief Executive Officer since its inception in 1971. His term as a director expires in 2020.
Dennis G. Moore joined the Company in 1984. He served in various controllership functions prior to becoming the Chief Financial Officer in June 1992. His term as a director expires in 2017.
Robert M. Radano joined the Company in 1972 and in May 1996 was named Chief Operating Officer of the Company. Prior to becoming Chief Operating Officer, he was Senior Vice President, Sales responsible for national food service sales of J & J.
Dan Fachner has been an employee of ICEE-USA Corp., which was acquired by the Company in May 1987, since 1979. He was named Senior Vice President of The ICEE Company in April 1994 and became President in May 1997.
Gerard G. Law joined the Company in 1992. He served in various manufacturing and sales management capacities prior to becoming Senior Vice President, Western Operations in 2009. He was named to his present position in 2011 in which he has responsibility for marketing, research and development and overseeing a number of the manufacturing facilities of J & J.
Robert J. Pape joined the Company in 1998. He served in various sales and sales management capacities prior to becoming Senior Vice President Sales in 2010.
Item 12. Security Ownership Of Certain Beneficial Owners And Management And Related Stockholder Matters
Information concerning the security ownership of certain beneficial owners and management appearing in the Company’s 2016 Proxy Statement under the caption “Security Ownership of Certain Beneficial Owners and Management” is incorporated herein by reference.
The following table details information regarding the Company’s existing equity compensation plans as of September 24, 2016.
|
( a ) |
( b ) |
( c ) |
||||||||||
|
Number of |
||||||||||||
|
Securities |
||||||||||||
|
Remaining |
||||||||||||
|
available for |
||||||||||||
|
future |
||||||||||||
|
Number of |
Weighted- |
issuance under |
||||||||||
|
securities to |
average |
equity |
||||||||||
|
be issued upon |
exercise |
compensation |
||||||||||
|
exercise of |
price of |
plans |
||||||||||
|
outstanding |
outstandng |
(excluding |
||||||||||
|
options, |
options, |
securities |
||||||||||
|
warrants and |
warrants and |
reflected in |
||||||||||
|
Plan Category |
rights |
rights |
column (a) ) |
|||||||||
|
Equity compensation plans approved by security holders |
674,000 | $ | 84.90 | 674,000 | ||||||||
|
Equity compensation plans not approved by security holders |
- | - | - | |||||||||
|
Total |
674,000 | $ | 84.90 | 674,000 | ||||||||
Item 13. Certain Relationships And Related Transactions, and Director Independence
Information concerning the Certain Relationships and Related Transactions, and Director Independence in the Company’s 2016 Proxy Statement is incorporated herein by reference.
Item 14. Principal Accounting Fees And Services
Information concerning the Principal Accountant Fees and Services in the Company’s 2016 Proxy Statement is incorporated herein by reference.
PART IV
Item 15. Exhibits, Financial Statement Schedules
|
|
(a) |
The following documents are filed as part of this Report: |
|
|
(1) |
Financial Statements |
The financial statements filed as part of this report are listed on the Index to Consolidated Financial Statements and Financial Statements Schedule on page F-1.
|
|
(2) |
Financial Statement Schedule – Page S-1 |
Schedule II – Valuation and Qualifying Accounts
All other schedules are omitted either because they are not applicable or because the information required is contained in the financial statements or notes thereto.
|
|
(b) |
Exhibits |
|
|
3.1 |
Amended and Restated Certificate of Incorporation filed February 28, 1990 (Incorporated by reference from the Company’s Form 10-Q dated May 4, 1990). |
|
|
3.2 |
Revised Bylaws adopted November 19, 2013 (Incorporated by reference from the Company’s Form 10-K dated November 26, 2013). |
|
|
4.3 |
Amended and Restated Loan Agreement dated December 1, 2006 by and among J & J Snack Foods Corp. and Certain of its Subsidiaries and Citizens Bank of Pennsylvania, as Agent (Incorporated by reference from the Company’s Form 10-K dated December 6, 2006). |
|
|
4.4 |
First Amendment and Modification to Amendment and Restated Loan Agreement (Incorporated by reference from the Company’s Form 10-K dated December 7, 2011). |
|
|
4.5** |
Fourth Amendment and Modification to Amendment and Restated Loan Agreement. |
|
|
10.2* |
J & J Snack Foods Corp. Stock Option Plan (Incorporated by reference from the Company’s Definitive Proxy Statement dated December 21, 2011). |
|
|
10.8* |
J & J Snack Foods Corp. Employee Stock Purchase Plan (Incorporated by reference from the Company’s Form S-8 dated May 16, 1996). |
|
|
14.1 |
Code of Ethics Pursuant to Section 406 of the Sarbanes-Oxley Act of 2002 (Incorporated by reference from the Company’s 10-Q dated July 20, 2004). |
|
|
21.1** |
Subsidiaries of J & J Snack Foods Corp. |
|
|
23.1** |
Consent of Independent Registered Public Accounting Firm. |
|
|
31.1** |
Certification Pursuant to Section 302 of the Sarbanes-Oxley Act of 2002. |
|
|
31.2** |
Certification Pursuant to Section 302 of the Sarbanes-Oxley Act of 2002. |
|
|
32.1** |
Certification Pursuant to 18 U.S.C. Section 1350, As Adopted Pursuant To Section 906 Of The Sarbanes-Oxley Act of 2002. |
|
|
32.2** |
Certification Pursuant to 18 U.S.C. Section 1350, As Adopted Pursuant To Section 906 Of The Sarbanes-Oxley Act of 2002. |
|
|
101** |
The following financial information from J&J Snack Foods Corp.'s Form 10-K for the year ended September 24, 2016, formatted in XBRL (eXtensible Business Reporting Language): |
|
(i) |
|
Consolidated Balance Sheets, |
|
(ii) |
|
Consolidated Statements of Earnings, |
|
(iii) |
Consolidated Statements of Comprehensive Income, |
|
(iv) |
Consolidated Statements of Cash Flows, |
|
(v) |
Consolidated Statement of Changes in Stockholders' Equity and |
|
(vi) |
The Notes to the Consolidated Financial Statements |
_____________
*Compensatory Plan
**Filed Herewith
SIGNATURES
Pursuant to the requirements of Section 13(a) or 15(d) of the Securities Exchange Act of 1934, the Registrant has duly caused report to be signed on its behalf by the undersigned, thereunto duly authorized.
|
|
J & J SNACK FOODS CORP. |
| |
|
|
|
|
|
|
|
|
|
|
|
November 21, 2016 |
By: |
/s/ Gerald B. Shreiber | |
|
|
|
Gerald B. Shreiber, Chairman of the Board, President, Chief Executive Officer and Director (Principal Executive Officer) | |
Pursuant to the requirements of the Securities Exchange Act of 1934, this report has been signed below by the following persons on behalf of the Registrant and in the capacities and on the dates indicated.
|
November 21, 2016 |
/s/ Gerald B. Shreiber |
|
|
Gerald B. Shreiber, Chairman of the Board, President, Chief Executive Officer and Director (Principal Executive Officer) |
|
|
|
|
November 21, 2016 |
/s/ Dennis G. Moore |
|
|
Dennis G. Moore, Senior Vice President, Chief Financial Officer and Director (Principal Financial Officer) (Principal Accounting Officer) |
|
|
|
|
November 21, 2016 |
/s/ Sidney R. Brown |
|
|
Sidney R. Brown, Director |
|
|
|
|
November 21, 2016 |
/s/ Peter G. Stanley |
|
|
Peter G. Stanley, Director |
|
|
|
|
November 21, 2016 |
/s/ Vincent A. Melchiorre |
|
|
Vincent A. Melchiorre, Director |
J & J SNACK FOODS CORP.
INDEX TO CONSOLIDATED FINANCIAL STATEMENTS
AND FINANCIAL STATEMENT SCHEDULE
Financial Statements:
|
Report of Independent Registered Public Accounting Firm |
F-2 |
|
Consolidated Balance Sheets as of September 24, 2016 and September 26, 2015 |
F-3 |
|
Consolidated Statements of Earnings for the fiscal years ended September 24, 2016, September 26, 2015 and September 27, 2014 |
F-4 |
|
Consolidated Statements of Comprehensive Income for the fiscal years ended September 24, 2016, September 26, 2015 and September 27, 2014 |
F-5 |
|
|
|
|
Consolidated Statement of Changes in Stockholders’ Equity for the fiscal years ended September 24, 2016, September 26, 2015 and September 27, 2014 |
F-6 |
|
Consolidated Statements of Cash Flows for the fiscal years ended September 24, 2016, September 26, 2015 and September 27, 2014 |
F-7 |
|
Notes to Consolidated Financial Statements |
F-8 |
|
Financial Statement Schedule: |
|
|
Schedule II – Valuation and Qualifying Accounts |
S-1 |
Board of Directors and Shareholders
J&J Snack Foods Corp. and Subsidiaries
We have audited the accompanying consolidated balance sheets of J&J Snack Foods Corp. and subsidiaries (the “Company”) as of September 24, 2016 and September 26, 2015, and the related consolidated statements of earnings, comprehensive income, changes in shareholders’ equity, and cash flows for each of the three fiscal years in the period ended September 24, 2016 (52 weeks, 52 weeks and 52 weeks, respectively). Our audits of the basic consolidated financial statements included the financial statement schedule listed in the index appearing under Item 15(a)(2). These financial statements and financial statement schedule are the responsibility of the Company’s management. Our responsibility is to express an opinion on these financial statements and financial statement schedule based on our audits. We have also audited the internal control over financial reporting of the Company as of September 24, 2016, based on criteria established in the 2013 Internal Control—Integrated Framework issued by the Committee of Sponsoring Organizations of the Treadway Commission (COSO). The Company’s management is responsible for maintaining effective internal control over financial reporting and for its assessment of the effectiveness of internal control over financial reporting, included in the accompanying Management’s Report on Internal Control over Financial Reporting. Our responsibility is to express an opinion on the Company’s internal control over financial reporting based on our audit.
We conducted our audits in accordance with the standards of the Public Company Accounting Oversight Board (United States). Those standards require that we plan and perform the audit to obtain reasonable assurance about whether the financial statements are free of material misstatement and whether effective internal control over financial reporting was maintained in all material respects. An audit includes examining, on a test basis, evidence supporting the amounts and disclosures in the financial statements. An audit also includes assessing the accounting principles used and significant estimates made by management, as well as evaluating the overall financial statement presentation. An audit of internal control over financial reporting includes obtaining an understanding of internal control over financial reporting, assessing the risk that a material weakness exists, testing and evaluating the design and operating effectiveness of internal control based on the assessed risk, and performing such other procedures as we consider necessary in the circumstances. We believe that our audits provide a reasonable basis for our opinion.
A company’s internal control over financial reporting is a process designed to provide reasonable assurance regarding the reliability of financial reporting and the preparation of financial statements for external purposes in accordance with generally accepted accounting principles. A company’s internal control over financial reporting includes those policies and procedures that (1) pertain to the maintenance of records that, in reasonable detail, accurately and fairly reflect the transactions and dispositions of the assets of the company; (2) provide reasonable assurance that transactions are recorded as necessary to permit preparation of financial statements in accordance with generally accepted accounting principles, and that receipts and expenditures of the company are being made only in accordance with authorizations of management and directors of the company; and (3) provide reasonable assurance regarding prevention or timely detection of unauthorized acquisition, use, or disposition of the company’s assets that could have a material effect on the financial statements.
Because of its inherent limitations, internal control over financial reporting may not prevent or detect misstatements. Also, projections of any evaluation of effectiveness to future periods are subject to the risk that controls may become inadequate because of changes in conditions, or that the degree of compliance with the policies or procedures may deteriorate.
In our opinion, the consolidated financial statements referred to above present fairly, in all material respects, the financial position of the Company as of September 24, 2016 and September 26, 2015, and the results of its operations and its cash flows for each of the three fiscal years in the period ended September 24, 2016 (52 weeks, 52 weeks and 52 weeks, respectively) in conformity with accounting principles generally accepted in the United States of America. Also, in our opinion, the related financial statement schedule, when considered in relation to the basic consolidated financial statements taken as a whole, presents fairly, in all material respects, the information set forth therein. Also, in our opinion the Company maintained, in all material respects, effective internal control over financial reporting as of September 24, 2016, based on criteria established in the 2013 Internal Control—Integrated Framework issued by COSO.
/s/ GRANT THORNTON LLP
Philadelphia, Pennsylvania
November 21, 2016
J & J SNACK FOODS CORP. AND SUBSIDIARIES
CONSOLIDATED BALANCE SHEETS
(in thousands, except share amounts)
|
September 24, |
September 26, |
|||||||
|
2016 |
2015 |
|||||||
|
Assets |
||||||||
|
Current assets |
||||||||
|
Cash and cash equivalents |
$ | 140,652 | $ | 133,689 | ||||
|
Marketable securities held to maturity |
13,539 | - | ||||||
|
Accounts receivable, net |
98,325 | 102,649 | ||||||
|
Inventories |
88,684 | 82,657 | ||||||
|
Prepaid expenses and other |
13,904 | 6,557 | ||||||
|
Total current assets |
355,104 | 325,552 | ||||||
|
Property, plant and equipment, at cost |
605,045 | 571,675 | ||||||
|
Less accumulated depreciation and amortization |
420,832 | 399,621 | ||||||
|
Property, plant and equipment, net |
184,213 | 172,054 | ||||||
|
Other assets |
||||||||
|
Goodwill |
86,442 | 86,442 | ||||||
|
Other intangible assets, net |
41,819 | 45,819 | ||||||
|
Marketable securities held to maturity |
90,732 | 66,660 | ||||||
|
Marketable securities available for sale |
29,465 | 39,638 | ||||||
|
Other |
2,712 | 3,504 | ||||||
|
Total other assets |
251,170 | 242,063 | ||||||
|
Total Assets |
$ | 790,487 | $ | 739,669 | ||||
|
Liabilities and Stockholders' Equity |
||||||||
|
Current Liabilities |
||||||||
|
Current obligations under capital leases |
$ | 365 | $ | 273 | ||||
|
Accounts payable |
62,026 | 59,206 | ||||||
|
Accrued insurance liability |
10,119 | 10,231 | ||||||
|
Accrued liabilities |
6,161 | 5,365 | ||||||
|
Accrued compensation expense |
16,340 | 15,318 | ||||||
|
Dividends payable |
7,280 | 6,723 | ||||||
|
Total current liabilities |
102,291 | 97,116 | ||||||
|
Long-term obligations under capital leases |
1,235 | 1,196 | ||||||
|
Deferred income taxes |
48,186 | 40,523 | ||||||
|
Other long-term liabilities |
801 | 915 | ||||||
|
Stockholders' Equity |
||||||||
|
Preferred stock, $1 par value; authorized 10,000,000 shares; none issued |
- | - | ||||||
|
Common stock, no par value; authorized, 50,000,000 shares; issued and outstanding 18,668,000 and 18,676,000 respectively |
25,332 | 31,653 | ||||||
|
Accumulated other comprehensive loss |
(13,415 | ) | (10,897 | ) | ||||
|
Retained Earnings |
626,057 | 579,163 | ||||||
|
Total stockholders' equity |
637,974 | 599,919 | ||||||
|
Total Liabilities and Stockholders' Equity |
$ | 790,487 | $ | 739,669 | ||||
The accompanying notes are an integral part of these statements.
J & J SNACK FOODS CORP. AND SUBSIDIARIES
CONSOLIDATED STATEMENTS OF EARNINGS
(in thousands, except per share information)
|
Fiscal Year Ended |
||||||||||||
|
September 24, |
September 26, |
September 27, |
||||||||||
|
2016 |
2015 |
2014 |
||||||||||
|
(52 weeks) |
(52 weeks) |
(52 weeks) |
||||||||||
|
Net Sales |
$ | 992,781 | $ | 976,256 | $ | 919,451 | ||||||
|
Cost of goods sold (1) |
688,314 | 675,366 | 631,874 | |||||||||
|
Gross Profit |
304,467 | 300,890 | 287,577 | |||||||||
|
Operating expenses |
||||||||||||
|
Marketing (2) |
85,963 | 85,160 | 78,632 | |||||||||
|
Distribution (3) |
73,114 | 74,158 | 71,159 | |||||||||
|
Administrative (4) |
32,299 | 30,891 | 29,784 | |||||||||
|
Other general expense (income) |
281 | (207 | ) | 1,154 | ||||||||
|
Total operating expenses |
191,657 | 190,002 | 180,729 | |||||||||
|
Operating Income |
112,810 | 110,888 | 106,848 | |||||||||
|
Other income (expenses) |
||||||||||||
|
Investment income |
4,132 | 1,157 | 4,473 | |||||||||
|
Interest expense & other |
(123 | ) | (126 | ) | (115 | ) | ||||||
|
Earnings before income taxes |
116,819 | 111,919 | 111,206 | |||||||||
|
Income taxes |
40,844 | 41,736 | 39,392 | |||||||||
|
NET EARNINGS |
$ | 75,975 | $ | 70,183 | $ | 71,814 | ||||||
|
Earnings per diluted share |
$ | 4.05 | $ | 3.73 | $ | 3.82 | ||||||
|
Weighted average number of diluted shares |
18,769 | 18,819 | 18,807 | |||||||||
|
Earnings per basic share |
$ | 4.07 | $ | 3.76 | $ | 3.85 | ||||||
|
Weighted average number of basic shares |
18,649 | 18,685 | 18,677 | |||||||||
|
(1) |
Includes share-based compensation expense of $609 for the year ended September 24, 2016, $471 for the year ended September 26, 2015 and $466 for the year ended September 27, 2014. |
|
(2) |
Includes share-based compensation expense of $924 for the year ended September 24, 2016, $709 for the year ended September 26, 2015 and $673 for the year ended September 27, 2014. |
|
(3) |
Includes share-based compensation expense of $48 for the year ended September 24, 2016, $44 for the year ended September 26, 2015 and $42 for the year ended September 27, 2014. |
|
(4) |
Includes share-based compensation expense of $794 for the year ended September 24, 2016, $942 for the year ended September 26, 2015 and $895 for the year ended September 27, 2014. |
The accompanying notes are an integral part of these statements.
J&J SNACK FOODS CORP. AND SUBSIDIARIES
CONSOLIDATED STATEMENTS OF COMPREHENSIVE INCOME
(in thousands)
|
Fiscal Year Ended |
||||||||||||
|
September 24, |
September 26, |
September 27, |
||||||||||
|
2016 |
2015 |
2014 |
||||||||||
|
(52 weeks) |
(52 weeks) |
(52 weeks) |
||||||||||
|
Net Earnings |
$ | 75,975 | $ | 70,183 | $ | 71,814 | ||||||
|
Foreign currency translation adjustments |
(3,065 | ) | (5,389 | ) | (929 | ) | ||||||
|
Unrealized holding (loss) gain on marketable securities |
(8 | ) | (2,607 | ) | 505 | |||||||
|
Amount reclassified from accumulated other comprehensive income |
555 | 3,087 | 366 | |||||||||
|
Total Other Comprehensive Loss, net of tax |
(2,518 | ) | (4,909 | ) | (58 | ) | ||||||
|
Comprehensive Income |
$ | 73,457 | $ | 65,274 | $ | 71,756 | ||||||
The accompanying notes are an integral part of these statements.
J & J SNACK FOODS CORP. AND SUBSIDIARIES
CONSOLIDATED STATEMENT OF CHANGES IN STOCKHOLDERS' EQUITY
(in thousands)
|
Accumulated |
||||||||||||||||||||
|
Other |
||||||||||||||||||||
|
Common Stock |
Comprehensive |
Retained |
||||||||||||||||||
|
Shares |
Amount |
Loss |
Earnings |
Total |
||||||||||||||||
|
Balance at September 29, 2013 |
18,677 | $ | 34,516 | $ | (5,930 | ) | $ | 487,979 | $ | 516,565 | ||||||||||
|
Issuance of common stock upon exercise of stock options |
52 | 2,227 | - | - | 2,227 | |||||||||||||||
|
Issuance of common stock for employee stock purchase plan |
16 | 1,102 | - | - | 1,102 | |||||||||||||||
|
Foreign currency translation adjustment |
- | - | (929 | ) | - | (929 | ) | |||||||||||||
|
Unrealized holding gain on marketable securities |
- | - | 871 | - | 871 | |||||||||||||||
|
Issuance of common stock under deferred stock plan |
- | 34 | - | - | 34 | |||||||||||||||
|
Dividends declared |
- | - | - | (23,908 | ) | (23,908 | ) | |||||||||||||
|
Share-based compensation |
- | 2,247 | - | - | 2,247 | |||||||||||||||
|
Repurchase of common stock |
(82 | ) | (7,505 | ) | - | - | (7,505 | ) | ||||||||||||
|
Net earnings |
- | - | - | 71,814 | 71,814 | |||||||||||||||
|
Balance at September 27, 2014 |
18,663 | $ | 32,621 | $ | (5,988 | ) | $ | 535,885 | $ | 562,518 | ||||||||||
|
Issuance of common stock upon exercise of stock options |
72 | 3,489 | - | - | 3,489 | |||||||||||||||
|
Issuance of common stock for employee stock purchase plan |
14 | 1,174 | - | - | 1,174 | |||||||||||||||
|
Foreign currency translation adjustment |
- | - | (5,389 | ) | - | (5,389 | ) | |||||||||||||
|
Unrealized holding gain on marketable securities |
- | - | 480 | - | 480 | |||||||||||||||
|
Issuance of common stock under deferred stock plan |
- | 21 | - | - | 21 | |||||||||||||||
|
Dividends declared |
- | - | - | (26,905 | ) | (26,905 | ) | |||||||||||||
|
Share-based compensation |
- | 2,359 | - | - | 2,359 | |||||||||||||||
|
Repurchase of common stock |
(73 | ) | (8,011 | ) | - | - | (8,011 | ) | ||||||||||||
|
Net earnings |
- | - | - | 70,183 | 70,183 | |||||||||||||||
|
Balance at September 26, 2015 |
18,676 | $ | 31,653 | $ | (10,897 | ) | $ | 579,163 | $ | 599,919 | ||||||||||
|
Issuance of common stock upon exercise of stock options |
120 | 5,249 | - | - | 5,249 | |||||||||||||||
|
Issuance of common stock for employee stock purchase plan |
14 | 1,320 | - | - | 1,320 | |||||||||||||||
|
Foreign currency translation adjustment |
- | - | (3,065 | ) | - | (3,065 | ) | |||||||||||||
|
Unrealized holding gain on marketable securities |
- | - | 547 | - | 547 | |||||||||||||||
|
Issuance of common stock under deferred stock plan |
- | 7 | - | - | 7 | |||||||||||||||
|
Dividends declared |
- | - | - | (29,081 | ) | (29,081 | ) | |||||||||||||
|
Share-based compensation |
- | 2,368 | - | - | 2,368 | |||||||||||||||
|
Repurchase of common stock |
(142 | ) | (15,265 | ) | - | - | (15,265 | ) | ||||||||||||
|
Net earnings |
- | - | - | 75,975 | 75,975 | |||||||||||||||
|
Balance at September 24, 2016 |
18,668 | $ | 25,332 | $ | (13,415 | ) | $ | 626,057 | $ | 637,974 | ||||||||||
The accompanying notes are an integral part of these statements.
J & J SNACK FOODS CORP. AND SUBSIDIARIES
CONSOLIDATED STATEMENTS OF CASH FLOWS
(in thousands)
|
Fiscal Year Ended |
||||||||||||
|
September 24, |
September 26, |
September 27, |
||||||||||
|
2016 |
2015 |
2014 |
||||||||||
|
(52 weeks) |
(52 weeks) |
(52 weeks) |
||||||||||
|
Operating activities: |
||||||||||||
|
Net earnings |
$ | 75,975 | $ | 70,183 | $ | 71,814 | ||||||
|
Adjustments to reconcile net earnings to net cash provided by operating activities: |
||||||||||||
|
Depreciation of fixed assets |
34,536 | 32,356 | 31,660 | |||||||||
|
Amortization of intangibles and deferred costs |
5,587 | 5,915 | 5,433 | |||||||||
|
Gains from disposals of property & equipment |
(398 | ) | (334 | ) | (119 | ) | ||||||
|
Amortization of bond premiums |
1,011 | 103 | - | |||||||||
|
Share-based compensation |
2,375 | 2,166 | 2,076 | |||||||||
|
Deferred income taxes |
7,700 | (121 | ) | (8 | ) | |||||||
|
Loss on sale of marketable securities |
661 | 4,319 | 361 | |||||||||
|
Changes in assets and liabilities, net of effects from purchase of companies: |
||||||||||||
|
Decrease (increase) in accounts receivable, net |
3,571 | (3,123 | ) | (8,913 | ) | |||||||
|
Increase in inventories |
(6,295 | ) | (4,959 | ) | (1,857 | ) | ||||||
|
Increase in prepaid expenses and other |
(7,386 | ) | (2,871 | ) | (182 | ) | ||||||
|
Increase in accounts payable and accrued liabilities |
3,888 | 287 | 6,831 | |||||||||
|
Net cash provided by operating activities |
121,225 | 103,921 | 107,096 | |||||||||
|
Investing activities: |
||||||||||||
|
Payments for purchases of companies, net of cash acquired |
- | (615 | ) | (28,360 | ) | |||||||
|
Purchases of property, plant and equipment |
(48,709 | ) | (48,641 | ) | (39,385 | ) | ||||||
|
Purchases of marketable securities |
(41,786 | ) | (90,240 | ) | (26,932 | ) | ||||||
|
Proceeds from redemption and sales of marketable securities |
13,224 | 110,117 | 7,245 | |||||||||
|
Proceeds from disposal of property, plant and equipment |
2,294 | 1,786 | 1,572 | |||||||||
|
Other |
375 | (898 | ) | (806 | ) | |||||||
|
Net cash used in investing activities |
(74,602 | ) | (28,491 | ) | (86,666 | ) | ||||||
|
Financing activities: |
||||||||||||
|
Payments to repurchase common stock |
(15,265 | ) | (8,011 | ) | (7,505 | ) | ||||||
|
Proceeds from issuance of common stock |
6,570 | 4,663 | 3,320 | |||||||||
|
Payments on capitalized lease obligations |
(355 | ) | (243 | ) | (326 | ) | ||||||
|
Payment of cash dividend |
(28,523 | ) | (26,154 | ) | (20,924 | ) | ||||||
|
Net cash used in financing activities |
(37,573 | ) | (29,745 | ) | (25,435 | ) | ||||||
|
Effect of exchange rates on cash and cash equivalents |
(2,087 | ) | (3,756 | ) | (580 | ) | ||||||
|
Net increase (decrease) in cash and cash equivalents |
6,963 | 41,929 | (5,585 | ) | ||||||||
|
Cash and cash equivalents at beginning of year |
133,689 | 91,760 | 97,345 | |||||||||
|
Cash and cash equivalents at end of year |
$ | 140,652 | $ | 133,689 | $ | 91,760 | ||||||
The accompanying notes are an integral part of these statements.
J & J SNACK FOODS CORP. AND SUBSIDIARIES
NOTES TO CONSOLIDATED FINANCIAL STATEMENTS
NOTE A – SUMMARY OF SIGNIFICANT ACCOUNTING POLICIES
J & J Snack Foods Corp. and Subsidiaries (the Company) manufactures, markets and distributes a variety of nutritional snack foods and beverages to the food service and retail supermarket industries. A summary of the significant accounting policies consistently applied in the preparation of the accompanying consolidated financial statements follows.
1. Principles of Consolidation
The consolidated financial statements were prepared in accordance with U.S. GAAP. These financial statements include the accounts of J & J Snack Foods Corp. and its wholly-owned subsidiaries. Intercompany balances and transactions have been eliminated in the consolidated financial statements.
2. Revenue Recognition
We recognize revenue from our products when the products are shipped to our customers. Repair and maintenance equipment service revenue is recorded when it is performed provided the customer terms are that the customer is to be charged on a time and material basis or on a straight-line basis over the term of the contract when the customer has signed a service contract. Revenue is recognized only where persuasive evidence of an arrangement exists, our price is fixed or estimable and collectability is reasonably assured. We record offsets to revenue for allowances, end-user pricing adjustments, trade spending, coupon redemption costs and returned product. Customers generally do not have the right to return product unless it is damaged or defective. Our recorded liability for allowances, end-user pricing adjustments and trade spending was approximately $14.3 million at September 24, 2016 and $11.7 million at September 26, 2015.
All amounts billed to customers related to shipping and handling are classified as revenues. Our product costs include amounts for shipping and handling, therefore, we charge our customers shipping and handling fees at the time the products are shipped or when services are performed. The cost of shipping products to the customer is recognized at the time the products are shipped to the customer and our policy is to classify them as Distribution expenses. The cost of shipping products to the customer classified as Distribution expenses was $73,114,000, $74,158,000 and $71,159,000 for the fiscal years ended 2016, 2015 and 2014, respectively.
During the years ended September 24, 2016, September 26, 2015 and September 27, 2014, we sold $24,664,000, $25,536,000 and $22,826,000, respectively, of repair and maintenance service contracts in our frozen beverage business. At September 24, 2016 and September 26, 2015, deferred income on repair and maintenance service contracts was $1,671,000 and $1,579,000, respectively, of which $145,000 and $70,000 is included in other long-term liabilities as of September 24, 2016 and September 26, 2015, respectively and the balance is reflected as short-term and included in accrued liabilities on the consolidated balance sheet. Repair and maintenance service contract income of $24,571,000, $25,534,000 and $22,748,000 was recognized for the fiscal years ended 2016, 2015 and 2014, respectively.
3. Foreign Currency
Assets and liabilities in foreign currencies are translated into U.S. dollars at the rate of exchange prevailing at the balance sheet date. Revenues and expenses are translated at the average rate of exchange for the period. The cumulative translation adjustment is recorded as a separate component of stockholders’ equity and changes to such are included in comprehensive income.
4. Use of Estimates
In preparing financial statements in conformity with accounting principles generally accepted in the United States of America, management is required to make estimates and assumptions that affect the reported amounts of assets and liabilities, the disclosure of contingent assets and liabilities at the date of the financial statements, and the reported amounts of revenues and expenses during the reporting period. Actual results could differ from those estimates.
5. Cash Equivalents
Cash equivalents are short-term, highly liquid investments with original maturities of three months or less.
J & J SNACK FOODS CORP. AND SUBSIDIARIES
NOTES TO CONSOLIDATED FINANCIAL STATEMENTS (continued)
NOTE A – SUMMARY OF SIGNIFICANT ACCOUNTING POLICIES (continued)
6. Concentrations and related risks
We maintain cash balances at financial institutions located in various states. We have cash balances at two banks totalling approximately $100 million that is in excess of FDIC insurance of $250,000 per bank.
Financial instruments that could potentially subject us to concentrations of credit risk are trade accounts receivable; however, such risks are limited due to the large number of customers comprising our customer base and their dispersion across geographic regions. We usually have approximately 15 customers with accounts receivable balances of between $1 million and $10 million.
We have several large customers that account for a significant portion of our sales. Our top ten customers accounted for 42%, 43% and 43% of our sales during fiscal years 2016, 2015 and 2014, respectively, with our largest customer accounting for 8% of our sales in 2016, 8% of our sales in 2015 and 8% of our sales in 2014. Three of the ten customers are food distributors who sell our product to many end users.
About 30% of our employees are covered by collective bargaining agreements.
None of our vendors supplied more than 10% of our ingredients and packaging in 2016, 2015 or 2014.
The majority of our accounts receivable are due from trade customers. Credit is extended based on evaluation of our customers’ financial condition and collateral is not required. Accounts receivable payment terms vary and are stated in the financial statements at amounts due from customers net of an allowance for doubtful accounts. At September 24, 2016 and September 26, 2015, our accounts receivables were $98,325,000 and $102,649,000 net of an allowance for doubtful accounts of $571,000 and $304,000. Accounts receivable outstanding longer than the payment terms are considered past due. We determine our allowance by considering a number of factors, including the length of time trade accounts receivable are past due, our previous loss history, customers’ current ability to pay their obligations to us, and the condition of the general economy and the industry as a whole. We write off accounts receivable when they become uncollectible, and payments subsequently received on such receivables are credited to the allowance for doubtful accounts.
7. Inventories
Inventories are valued at the lower of cost (determined by the first-in, first-out method) or market. We recognize abnormal amounts of idle facilities, freight, handling costs, and spoilage as charges of the current period. Additionally, we allocate fixed production overhead to inventories based on the normal capacity of our production facilities. We calculate normal capacity as the production expected to be achieved over a number of periods or seasons under normal circumstances, taking into account the loss of capacity resulting from planned maintenance. This requires us to use judgment to determine when production is outside the range of expected variation in production (either abnormally low or abnormally high). In periods of abnormally low production (for example, periods in which there is significantly lower demand, labor and material shortages exist, or there is unplanned equipment downtime) the amount of fixed overhead allocated to each unit of production is not increased. However, in periods of abnormally high production the amount of fixed overhead allocated to each unit of production is decreased to assure inventories are not measured above cost.
8. Investment Securities
We classify our investment securities in one of three categories: held to maturity, trading, or available for sale. Our investment portfolio at September 24, 2016, consists of investments classified as held to maturity and available for sale. The securities that we have the positive intent and ability to hold to maturity are classified as held to maturity and are stated at amortized cost. Investments classified as available for sale are reported at fair market value with unrealized gains and losses related to the changes in fair value of the securities recognized in accumulated other comprehensive income (loss). The mutual funds and preferred stock in our available for sale portfolio do not have contractual maturities; however, we classify them as long term assets as it is our intent to hold them for a period of over one year, although we may sell some or all of them depending on presently unanticipated needs for liquidity or market conditions. See Note C for further information on our holdings of investment securities.
J & J SNACK FOODS CORP. AND SUBSIDIARIES
NOTES TO CONSOLIDATED FINANCIAL STATEMENTS (continued)
NOTE A – SUMMARY OF SIGNIFICANT ACCOUNTING POLICIES (continued)
9. Depreciation and Amortization
Depreciation of equipment and buildings is provided for by the straight-line method over the assets’ estimated useful lives. We review our equipment and buildings to ensure that they provide economic benefit and are not impaired.
Amortization of improvements is provided for by the straight-line method over the term of the lease or the assets’ estimated useful lives, whichever is shorter. Licenses and rights, customer relationships and non-compete agreements are being amortized by the straight-line method over periods ranging from 3 to 20 years and amortization expense is reflected throughout operating expenses.
Long-lived assets, including fixed assets and amortizing intangibles, are reviewed for impairment as events or changes in circumstances occur indicating that the carrying amount of the asset may not be recoverable. Indefinite lived intangibles are reviewed annually for impairment. Cash flow and sales analyses are used to assess impairment. The estimates of future cash flows and sales involve considerable management judgment and are based upon assumptions about expected future operating performance. Assumptions used in these forecasts are consistent with internal planning. The actual cash flows and sales could differ from management’s estimates due to changes in business conditions, operating performance, economic conditions, competition and consumer preferences.
10. Fair Value of Financial Instruments
The carrying value of our short-term financial instruments, such as accounts receivables and accounts payable, approximate their fair values, based on the short-term maturities of these instruments.
11. Income Taxes
We account for our income taxes under the liability method. Under the liability method, deferred tax assets and liabilities are determined based on the difference between the financial statement and tax bases of assets and liabilities as measured by the enacted tax rates that will be in effect when these differences reverse. Deferred tax expense is the result of changes in deferred tax assets and liabilities.
Additionally, we recognize a liability for income taxes and associated penalties and interest for tax positions taken or expected to be taken in a tax return which are more likely than not to be overturned by taxing authorities (“uncertain tax positions”). We have not recognized a tax benefit in our financial statements for these uncertain tax positions.
As of September 24, 2016 and September 26, 2015, the total amount of gross unrecognized tax benefits is $354,000 and $334,000; respectively, all of which would impact our effective tax rate over time, if recognized. We recognize interest and penalties related to income tax matters as a part of the provision for income taxes. We had $219,000 of accrued interest and penalties as of September 24, 2016 and $199,000 as of September 26, 2015. We did not recognize any penalties and interest resulting from tax settlements in the years ended September 24, 2016 and September 26, 2015. A reconciliation of the beginning and ending amount of unrecognized tax benefits is as follows:
|
(in thousands) |
||||
|
Balance at September 26, 2015 |
$ | 334 | ||
|
Additions based on tax positions related to the current year |
20 | |||
|
Reductions for tax positions of prior years |
- | |||
|
Settlements |
- | |||
|
Balance at September 24, 2016 |
$ | 354 | ||
In addition to our federal tax return and tax returns for Mexico and Canada, we file tax returns in all states that have a corporate income tax. Virtually all the returns noted above are open for examination for three to four years.
J & J SNACK FOODS CORP. AND SUBSIDIARIES
NOTES TO CONSOLIDATED FINANCIAL STATEMENTS (continued)
NOTE A – SUMMARY OF SIGNIFICANT ACCOUNTING POLICIES (continued)
12. Earnings Per Common Share
Basic earnings per common share (EPS) excludes dilution and is computed by dividing income available to common shareholders by the weighted average common shares outstanding during the period. Diluted EPS takes into consideration the potential dilution that could occur if securities (stock options) or other contracts to issue common stock were exercised and converted into common stock.
Our calculation of EPS is as follows:
| Fiscal Year Ended September 24, 2016 | ||||||||||||
|
Income |
Shares |
Per Share |
||||||||||
|
(Numerator) |
(Denominator) |
Amount |
||||||||||
|
(in thousands, except per share amounts) |
||||||||||||
|
Earnings Per Basic Share |
||||||||||||
|
Net Income available to common stockholders |
$ | 75,975 | 18,649 | $ | 4.07 | |||||||
|
Effect of Dilutive Securities |
||||||||||||
|
Options |
- | 120 | (0.02 | ) | ||||||||
|
Earnings Per Diluted Share |
||||||||||||
|
Net Income available to common stockholders plus assumed conversions |
$ | 75,975 | 18,769 | $ | 4.05 | |||||||
180,170 anti-dilutive shares have been excluded in the computation of 2016 diluted EPS.
| Fiscal Year Ended September 26, 2015 | ||||||||||||
|
Income |
Shares |
Per Share |
||||||||||
|
(Numerator) |
(Denominator) |
Amount |
||||||||||
|
(in thousands, except per share amounts) |
||||||||||||
|
Earnings Per Basic Share |
||||||||||||
|
Net Income available to common stockholders |
$ | 70,183 | 18,685 | $ | 3.76 | |||||||
|
Effect of Dilutive Securities |
||||||||||||
|
Options |
- | 134 | (0.03 | ) | ||||||||
|
Earnings Per Diluted Share |
||||||||||||
|
Net Income available to common stockholders plus assumed conversions |
$ | 70,183 | 18,819 | $ | 3.73 | |||||||
J & J SNACK FOODS CORP. AND SUBSIDIARIES
NOTES TO CONSOLIDATED FINANCIAL STATEMENTS (continued)
NOTE A – SUMMARY OF SIGNIFICANT ACCOUNTING POLICIES (continued)
1,500 anti-dilutive shares have been excluded in the computation of 2015 diluted EPS.
| Fiscal Year Ended September 27, 2014 | ||||||||||||
|
Income |
Shares |
Per Share |
||||||||||
|
(Numerator) |
(Denominator) |
Amount |
||||||||||
|
(in thousands, except per share amounts) |
||||||||||||
|
Earnings Per Basic Share |
||||||||||||
|
Net Income available to common stockholders |
$ | 71,814 | 18,677 | $ | 3.85 | |||||||
|
Effect of Dilutive Securities |
||||||||||||
|
Options |
- | 130 | (0.03 | ) | ||||||||
|
Earnings Per Diluted Share |
||||||||||||
|
Net Income available to common stockholders plus assumed conversions |
$ | 71,814 | 18,807 | $ | 3.82 | |||||||
No anti-dilutive shares have been excluded in the computation of 2014 diluted EPS.
13. Accounting for Stock-Based Compensation
At September 24, 2016, the Company has three stock-based employee compensation plans. Share-based compensation was recognized as follows:
|
Fiscal year ended |
||||||||||||
|
September 24, |
September 26, |
September 27, |
||||||||||
|
2016 |
2015 |
2014 |
||||||||||
| (in thousands, except per share amounts) | ||||||||||||
|
Stock options |
$ | 86 | $ | 1,098 | $ | 1,262 | ||||||
|
Stock purchase plan |
305 | 328 | 329 | |||||||||
|
Stock issued to employees |
4 | 6 | 17 | |||||||||
|
Total share-based compensation |
$ | 395 | $ | 1,432 | $ | 1,608 | ||||||
|
The above compensation is net of tax benefits |
$ | 1,980 | $ | 734 | $ | 468 | ||||||
Income tax benefit related to share-based compensation for the year ended September 26, 2016 includes $885,000 as a result of our early adoption as of our fiscal March 2016 quarter of Accounting Standards Update No 2016-09, Improvements to Employee Share-Based Payment Accounting. Under this new standard, income tax benefit is recognized rather than additional paid in capital upon the exercise of stock options.
At September 24, 2016, the Company has unrecognized compensation expense of approximately $3.1 million to be recognized over the next three fiscal years.
The fair value of each option grant is estimated on the date of grant using the Black-Scholes options-pricing model with the following weighted average assumptions used for grants in fiscal 2016, 2015 and 2014: expected volatility of 16.7% for fiscal year 2016, expected volatility of 18.4% for fiscal year 2015 and 21.2% for fiscal year 2014: weighted average risk-free interest rates of 1.3%, 1.7% and 1.6%; dividend rate of 1.4%, 1.4% and .9% and expected lives ranging between 5 and 10 years for all years. An expected forfeiture rate of 19% was used for 2016, 19% was used for 2015 and 20% was used for 2014.
J & J SNACK FOODS CORP. AND SUBSIDIARIES
NOTES TO CONSOLIDATED FINANCIAL STATEMENTS (continued)
NOTE A – SUMMARY OF SIGNIFICANT ACCOUNTING POLICIES (continued)
Expected volatility is based on the historical volatility of the price of our common shares over the past 49 to 55 months for 5 year options and 10 years for 10 year options. We use historical information to estimate expected life and forfeitures within the valuation model. The expected term of awards represents the period of time that options granted are expected to be outstanding. The risk-free rate for periods within the expected life of the option is based on the U.S. Treasury yield curve in effect at the time of grant. Compensation cost is recognized using a straight-line method over the vesting or service period and is net of estimated forfeitures.
14. Advertising Costs
Advertising costs are expensed as incurred. Total advertising expense was $4,870,000, $4,290,000 and $3,487,000 for the fiscal years 2016, 2015 and 2014, respectively.
15. Commodity Price Risk Management
Our most significant raw material requirements include flour, packaging, shortening, corn syrup, sugar, juice, cheese, chocolate, and a variety of nuts. We attempt to minimize the effect of future price fluctuations related to the purchase of raw materials primarily through forward purchasing to cover future manufacturing requirements, generally for periods from 1 to 12 months. As of September 24, 2016, we have approximately $75 million of such commitments. Futures contracts are not used in combination with forward purchasing of these raw materials. Our procurement practices are intended to reduce the risk of future price increases, but also may potentially limit the ability to benefit from possible price decreases. Our policy is to recognize estimated losses on purchase commitments when they occur. At each of the last three fiscal year ends, we did not have any material losses on our purchase commitments.
16. Research and Development Costs
Research and development costs are expensed as incurred. Total research and development expense was $525,000, $506,000 and $499,000 for the fiscal years 2016, 2015 and 2014, respectively.
17. Recent Accounting Pronouncements
In May 2014, the FASB issued guidance on revenue recognition which says that we should recognize revenue to depict the transfer of promised goods or services to customers in an amount that reflects the consideration which we expect to be entitled in exchange for those goods or services. This guidance is effective for our fiscal year ending September 2019. Early application is permitted. We anticipate that the impact of this guidance on our consolidated financial statements will not be material.
In July 2015, the FASB issued guidance which requires an entity to measure inventory at the lower of cost or net realizable value. Net realizable value is the estimated selling price in the ordinary course of business, less reasonably predictable costs of completion, disposal and transportation. This guidance will simplify the subsequent measurement of inventory, as current guidance requires an entity to measure inventory at the lower of cost or market. Under current guidance, market could be replacement cost, net realizable value, or net realizable value less an approximately normal profit margin. This guidance is effective for our fiscal year ended September 2018. Early adoption is permitted. The adoption of this guidance in the December quarter did not have a material impact on our consolidated financial statements.
In September 2015, the FASB issued guidance on accounting for business combinations which requires that an acquirer recognize adjustments to provisional amounts that are identified during the measurement period in the reporting period in which the adjustment amounts are determined. This guidance eliminates the requirement to retrospectively account for these adjustments. This guidance is effective for our fiscal year ended September 2018. Early adoption is permitted. This guidance did not impact amounts and disclosures related to previous business combinations; therefore, the adoption of this guidance in the December quarter did not impact our consolidated financial statements.
J & J SNACK FOODS CORP. AND SUBSIDIARIES
NOTES TO CONSOLIDATED FINANCIAL STATEMENTS (continued)
NOTE A – SUMMARY OF SIGNIFICANT ACCOUNTING POLICIES (continued)
In November 2015, the FASB issued guidance on the balance sheet classification of deferred taxes which eliminates the current requirement to present deferred tax assets and liabilities as current and noncurrent in a classified balance sheet and now requires entities to classify all deferred tax assets and liabilities as noncurrent. This guidance is effective for our fiscal year ended September 2018. Early adoption is permitted. The adoption of this guidance in this Form 10-K did not have a material impact on our financial statements.
In January 2016, the FASB issued guidance which requires an entity to measure equity investments at fair value with changes in fair value recognized in net income , to use the price that would be received by a seller when measuring the fair value of financial instruments for disclosure purposes, and which eliminates the requirement to disclose the method(s) and significant assumptions used to estimate the fair value that is required to be disclosed for financial instruments measured at amortized cost on the balance sheet. Under present guidance, changes in fair value of equity investments are recognized in Stockholders’ Equity. This guidance is effective for our fiscal year ended September 2019. Early adoption is not permitted. We anticipate that the adoption of this guidance on our consolidated financial statements will not be material.
In February 2016, the FASB issued guidance on lease accounting which requires that an entity recognize most leases on its balance sheet. The guidance retains a dual lease accounting model for purposes of income statement recognition, continuing the distinction between what are currently known as “capital” and “operating” leases for lessees. This guidance is effective for our fiscal year ended September 2020. We anticipate that the impact of this guidance on our financial statements will be material.
In March 2016, the FASB issued guidance on share based compensation which requires that an entity recognize all excess tax benefits and tax deficiencies as income tax expense or benefit in the income statement as discrete items in the reporting period in which they occur. Under current guidance, excess tax benefits are recognized in additional paid-in capital and tax deficiencies are recognized either as an offset to accumulated excess tax benefits, or in the income statement. This guidance is effective for our fiscal year ended September 2018. Early adoption is permitted. See Note A.13 to these financial statements for a discussion of the impact the adoption of this guidance in our March 2016 quarter had on our consolidated financial statements.
18. Reclassifications
Certain prior year financial statement amounts have been reclassified to be consistent with the presentation for the current year.
NOTE B – ACQUISITIONS
In October 2013, we acquired the assets of New York Pretzel, a manufacturer and distributor of soft pretzels selling primarily in the northeast to foodservice and retail locations. Of the purchase price of $11.8 million, $849,000 was allocated to intangible assets, $7,716,000 was allocated to goodwill and $3,049,000 was allocated to property, plant and equipment.
In May 2014, we acquired the stock of Philly’s Famous Water Ice, Inc. (PHILLY SWIRL). PHILLY SWIRL, located in Tampa, FL, produces frozen novelty products sold primarily to retail supermarket locations throughout the United States and to Canada with annual sales approximating $25 million. The allocation of the purchase price of $17.4 million is $4.0 million to working capital, $1.2 million to property, plant and equipment, $11.1 million to intangible assets, $1.8 million to goodwill, $4.0 million to deferred tax assets and $95,000 to other assets and $4.8 million to deferred tax liabilities.
Acquisition costs of $269,000 for the New York Pretzel and PHILLY SWIRL acquisitions are included in other general expense in the consolidated statements of earnings for the year ended September 26, 2015.
The goodwill and intangible assets acquired in the business combinations are recorded at fair value. To measure fair value for such assets, we use techniques including discounted expected future cash flows (Level 3 input).
J & J SNACK FOODS CORP. AND SUBSIDIARIES
NOTES TO CONSOLIDATED FINANCIAL STATEMENTS (continued)
NOTE C – INVESTMENT SECURITIES
We have classified our investment securities as marketable securities held to maturity and available for sale. The FASB defines fair value as the price that would be received from selling an asset or paid to transfer a liability in an orderly transaction between market participants. As such, fair value is a market-based measurement that should be determined based on assumptions that market participants would use in pricing an asset or liability. As a basis for considering such assumptions, the FASB has established three levels of inputs that may be used to measure fair value:
|
Level 1 |
Observable inputs such as quoted prices in active markets for identical assets or liabilities; |
|
Level 2 |
Observable inputs, other than Level 1 inputs in active markets, that are observable either directly or indirectly; and |
|
Level 3 |
Unobservable inputs for which there is little or no market data, which require the reporting entity to develop its own assumptions. |
Our marketable securities held to maturity and available for sale consist of investments in mutual funds, preferred stock and corporate bonds. The fair values of mutual funds are based on quoted market prices in active markets and are classified within Level 1 of the fair value hierarchy. The fair values of preferred stock and corporate bonds are based on quoted prices for identical or similar instruments in markets that are not active. As a result, preferred stock and corporate bonds are classified within Level 2 of the fair value hierarchy.
The amortized cost, unrealized gains and losses, and fair market values of our investment securities held to maturity at September 24, 2016 are summarized as follows:
|
Gross |
Gross |
Fair |
||||||||||||||
|
Amortized |
Unrealized |
Unrealized |
Market |
|||||||||||||
|
Cost |
Gains |
Losses |
Value |
|||||||||||||
| (in thousands) | ||||||||||||||||
|
Corporate Bonds |
$ | 103,311 | $ | 734 | $ | 138 | $ | 103,907 | ||||||||
|
Certificates of Deposit |
960 | 11 | - | 971 | ||||||||||||
|
Total investment securities held to maturity |
$ | 104,271 | $ | 745 | $ | 138 | $ | 104,878 | ||||||||
The amortized cost, unrealized gains and losses, and fair market values of our investment securities available for sale at September 24, 2016 are summarized as follows:
|
Gross |
Gross |
Fair |
||||||||||||||
|
Amortized |
Unrealized |
Unrealized |
Market |
|||||||||||||
|
Cost |
Gains |
Losses |
Value |
|||||||||||||
|
(in thousands) |
||||||||||||||||
|
Mutual Funds |
$ | 13,003 | $ | - | $ | 520 | $ | 12,483 | ||||||||
|
Preferred Stock |
16,791 | 273 | 82 | 16,982 | ||||||||||||
|
Total investment securities available for sale |
$ | 29,794 | $ | 273 | $ | 602 | $ | 29,465 | ||||||||
J & J SNACK FOODS CORP. AND SUBSIDIARIES
NOTES TO CONSOLIDATED FINANCIAL STATEMENTS (continued)
NOTE C – INVESTMENT SECURITIES (continued)
The mutual funds seek current income with an emphasis on maintaining low volatility and overall moderate duration. We have reduced our investments in mutual funds over the past year to $13 million at September 2016 from $19 million at September 2015 and $128 million at September 2014. The remaining unrealized losses of $520,000 are spread over 4 funds with total fair market value of $12.5 million. The remaining mutual funds presently generate income of 4.9 % per year. We have invested $17 million in Fixed-to-Floating Perpetual Preferred Stock which generates fixed income to call dates in 2018, 2019 and 2025 and then income is based on a spread above LIBOR if the securities are not called. The annual yield from these investments is presently 5.5%, of which 70% is not subject to income tax. The mutual funds and the Fixed-to-Floating Perpetual Preferred Stock investment securities do not have contractual maturities; however, we classify them as long term assets as it is our intent to hold them for a period of over one year, although we may sell some or all of them depending on presently unanticipated needs for liquidity or market conditions. We have invested $103 million in corporate bonds which generate fixed income to maturity dates in 2017 through 2021, with $67 million maturing prior to the end of our fiscal year 2018. The bonds presently generate income of about 2.2% per year. Our expectation is that we will hold the corporate bonds to their maturity dates and redeem them at our amortized cost.
The amortized cost, unrealized gains and losses, and fair market values of our investment securities held to maturity at September 26, 2015 are summarized as follows:
|
Gross |
Gross |
Fair |
||||||||||||||
|
Amortized |
Unrealized |
Unrealized |
Market |
|||||||||||||
|
Cost |
Gains |
Losses |
Value |
|||||||||||||
| (in thousands) | ||||||||||||||||
|
Corporate Bonds |
$ | 66,660 | $ | 15 | $ | 663 | $ | 66,012 | ||||||||
|
Total investment securities held to maturity |
$ | 66,660 | $ | 15 | $ | 663 | $ | 66,012 | ||||||||
The amortized cost, unrealized gains and losses, and fair market values of our investment securities available for sale at September 26, 2015 are summarized as follows:
|
Gross |
Gross |
Fair |
||||||||||||||
|
Amortized |
Unrealized |
Unrealized |
Market |
|||||||||||||
|
Cost |
Gains |
Losses |
Value |
|||||||||||||
|
(in thousands) |
||||||||||||||||
|
Mutual Funds |
$ | 20,041 | $ | - | $ | 827 | $ | 19,214 | ||||||||
|
Preferred Stock |
20,473 | 114 | 163 | 20,424 | ||||||||||||
|
Total investment securities available for sale |
$ | 40,514 | $ | 114 | $ | 990 | $ | 39,638 | ||||||||
The amortized cost and fair value of the Company’s held to maturity securities by contractual maturity at September 24, 2016 and September 26, 2015 are summarized as follows:
|
September 24, 2016 |
September 26, 2015 |
|||||||||||||||
|
Fair |
Fair |
|||||||||||||||
|
Amortized |
Market |
Amortized |
Market |
|||||||||||||
|
Cost |
Value |
Cost |
Value |
|||||||||||||
|
(in thousands) |
||||||||||||||||
|
Due in one year or less |
$ | 13,539 | $ | 13,552 | $ | - | $ | - | ||||||||
|
Due after one year through five years |
90,732 | 91,326 | 63,522 | 63,010 | ||||||||||||
|
Due after five years through ten years |
- | - | 3,138 | 3,002 | ||||||||||||
|
Total held to maturity securities |
$ | 104,271 | $ | 104,878 | $ | 66,660 | $ | 66,012 | ||||||||
|
Less current portion |
13,539 | 13,552 | - | - | ||||||||||||
|
Long term held to maturity securities |
$ | 90,732 | $ | 91,326 | $ | 66,660 | $ | 66,012 | ||||||||
J & J SNACK FOODS CORP. AND SUBSIDIARIES
NOTES TO CONSOLIDATED FINANCIAL STATEMENTS (continued)
NOTE C – INVESTMENT SECURITIES (continued)
Proceeds from the sale and redemption of marketable securities were $13,224,000, $110,117,000 and $7,245,000 in the years ended September 24, 2016, September 26, 2015 and September 27, 2014, respectively; with losses of $661,000, $4,319,000 and $361,000 recorded in 2016, 2015 and 2014, respectively. We use the specific identification method to determine the cost of securities sold.
NOTE D – INVENTORIES
Inventories consist of the following:
|
September 24, |
September 26, |
|||||||
|
2016 |
2015 |
|||||||
|
(in thousands) |
||||||||
|
Finished goods |
$ | 38,285 | $ | 34,258 | ||||
|
Raw materials |
18,223 | 17,000 | ||||||
|
Packaging materials |
6,799 | 5,949 | ||||||
|
Equipment parts and other |
25,377 | 25,450 | ||||||
|
Total Inventories |
$ | 88,684 | $ | 82,657 | ||||
NOTE E – PROPERTY, PLANT AND EQUIPMENT
Property, plant and equipment consist of the following:
|
September 24, |
September 26, |
Estimated |
||||||||||||
|
2016 |
2015 |
Useful Lives (in years) |
||||||||||||
| (in thousands) | ||||||||||||||
|
Land |
$ | 2,512 | $ | 2,496 | - | |||||||||
|
Buildings |
26,741 | 26,741 | 15 | - | 39.5 | |||||||||
|
Plant machinery and equipment |
227,614 | 210,728 | 5 | - | 20 | |||||||||
|
Marketing equipment |
278,299 | 266,047 | 5 | - | 7 | |||||||||
|
Transportation equipment |
7,637 | 6,866 | 5 | |||||||||||
|
Office equipment |
22,136 | 20,586 | 3 | - | 5 | |||||||||
|
Improvements |
34,750 | 28,725 | 5 | - | 20 | |||||||||
|
Construction in Progress |
5,356 | 9,486 | - | |||||||||||
|
Total property, plant and equipment |
$ | 605,045 | $ | 571,675 | ||||||||||
Depreciation expense was $34,536,000, $32,356,000 and $31,660,000 for fiscal years 2016, 2015 and 2014, respectively.
J & J SNACK FOODS CORP. AND SUBSIDIARIES
NOTES TO CONSOLIDATED FINANCIAL STATEMENTS (continued)
NOTE F – GOODWILL AND INTANGIBLE ASSETS
Our three reporting units, which are also reportable segments, are Food Service, Retail Supermarket and Frozen Beverages.
The carrying amount of acquired intangible assets for the reportable segments are as follows:
|
September 24, 2016 |
September 26, 2015 |
|||||||||||||||
|
Gross |
Gross |
|||||||||||||||
|
Carrying |
Accumulated |
Carrying |
Accumulated |
|||||||||||||
|
Amount |
Amortization |
Amount |
Amortization |
|||||||||||||
|
(in thousands) |
||||||||||||||||
|
FOOD SERVICE |
||||||||||||||||
|
Indefinite lived intangible assets |
||||||||||||||||
|
Trade Names |
$ | 14,150 | $ | - | $ | 13,072 | $ | - | ||||||||
|
Amortized intangible assets |
||||||||||||||||
|
Non compete agreements |
592 | 563 | 592 | 538 | ||||||||||||
|
Customer relationships |
40,797 | 37,201 | 40,797 | 33,584 | ||||||||||||
|
License and rights |
3,606 | 2,890 | 3,606 | 2,802 | ||||||||||||
|
TOTAL FOOD SERVICE |
$ | 59,145 | $ | 40,654 | $ | 58,067 | $ | 36,924 | ||||||||
|
RETAIL SUPERMARKETS |
||||||||||||||||
|
Indefinite lived intangible assets |
||||||||||||||||
|
Trade Names |
$ | 7,206 | $ | - | $ | 7,206 | $ | - | ||||||||
|
Amortized Intangible Assets |
||||||||||||||||
|
Non compete agreements |
160 | 160 | 160 | 114 | ||||||||||||
|
Customer relationships |
7,979 | 2,021 | 7,979 | 1,220 | ||||||||||||
|
TOTAL RETAIL SUPERMARKETS |
$ | 15,345 | $ | 2,181 | $ | 15,345 | $ | 1,334 | ||||||||
|
FROZEN BEVERAGES |
||||||||||||||||
|
Indefinite lived intangible assets |
||||||||||||||||
|
Trade Names |
$ | 9,315 | $ | - | $ | 9,315 | $ | - | ||||||||
|
Amortized intangible assets |
||||||||||||||||
|
Non compete agreements |
198 | 198 | 198 | 198 | ||||||||||||
|
Customer relationships |
6,678 | 6,506 | 6,678 | 6,075 | ||||||||||||
|
Licenses and rights |
1,601 | 924 | 1,601 | 854 | ||||||||||||
|
TOTAL FROZEN BEVERAGES |
$ | 17,792 | $ | 7,628 | $ | 17,792 | $ | 7,127 | ||||||||
|
CONSOLIDATED |
$ | 92,282 | $ | 50,463 | $ | 91,204 | $ | 45,385 | ||||||||
The gross carrying amount of intangible assets is determined by applying a discounted cash flow model to the future sales and earnings associated with each intangible asset or is set by contract cost. The amortization period used for definite lived intangible assets is set by contract period or by the period over which the bulk of the discounted cash flow is expected to be generated. We currently believe that we will receive the benefit from the use of the trade names classified as indefinite lived intangible assets indefinitely and they are therefore not amortized.
Licenses and rights, customer relationships and non compete agreements are being amortized by the straight-line method over periods ranging from 3 to 20 years and amortization expense is reflected throughout operating expenses.
J & J SNACK FOODS CORP. AND SUBSIDIARIES
NOTES TO CONSOLIDATED FINANCIAL STATEMENTS (continued)
NOTE F – GOODWILL AND INTANGIBLE ASSETS (continued)
Amortizing intangibles are reviewed for impairment as events or changes in circumstances occur indicating that the carrying amount of the asset may not be recoverable. Indefinite lived intangibles are reviewed annually at year end for impairment. Cash flow and sales analyses are used to assess impairment. The estimates of future cash flows and sales involve considerable management judgment and are based upon assumptions about expected future operating performance which include Level 3 inputs such as annual growth rates and discount rates. Assumptions used in these forecasts are consistent with internal planning. The actual cash flows and sales could differ from management’s estimates due to changes in business conditions, operating performance, economic conditions, competition and consumer preferences. There were no impairments of intangible assets in 2016, 2015 or 2014.
Intangible assets of $849,000 were acquired in the food service segment in the New York Pretzel acquisition in the three months ended December 28, 2013 and intangible assets of $11,060,000 were acquired in the retail supermarket segment in the PHILLY SWIRL acquisition in the three months ended June 28, 2014. Intangible assets of $200,000 were acquired in the frozen beverages segment in fiscal year 2015. Intangible assets of $1,078,000 were acquired in fiscal year 2016 in the food service segment due to the purchase of the HEARTBAR brand.
Aggregate amortization expense of intangible assets for the fiscal years 2016, 2015 and 2014 was $5,078,000, $5,370,000 and $4,932,000, respectively.
Estimated amortization expense for the next five fiscal years is approximately $2,600,000 in 2017, $1,800,000 in 2018, $1,700,000 in 2019, $1,400,000 in 2020 and $1,000,000 in 2021. The weighted average amortization period of the intangible assets is 10.6 years.
Goodwill
The carrying amounts of goodwill for the reportable segments are as follows:
|
Food |
Retail |
Frozen |
||||||||||||||
|
Service |
Supermarkets |
Beverages |
Total |
|||||||||||||
|
(in thousands) |
||||||||||||||||
|
Balance at September 24, 2016 |
$ | 46,832 | $ | 3,670 | $ | 35,940 | $ | 86,442 | ||||||||
|
Balance at September 26, 2015 |
$ | 46,832 | $ | 3,670 | $ | 35,940 | $ | 86,442 | ||||||||
The carrying value of goodwill is determined based on the excess of the purchase price of acquisitions over the estimated fair value of tangible and intangible net assets. Goodwill is not amortized but is evaluated annually at year end by management for impairment. Our impairment analysis for 2016, 2015 and 2014 was based on a combination of the income approach, which estimates the fair value of discounted cash flows, and the market approach, which estimates the fair value based on comparable market prices. Under the income approach the Company used a discounted cash flow which requires Level 3 inputs such as: annual growth rates, discount rates based upon the weighted average cost of capital and terminal values based upon current stock market multiples. There were no impairment charges in 2016, 2015 or 2014.
Goodwill of $7,716,000 was acquired in the New York Pretzel acquisition in the three months ended December 28, 2013, all of which was allocated to the food service segment. Goodwill of $1,826,000 was acquired in the PHILLY SWIRL acquisition in the three months ended June 28,2014, all of which was allocated to the retail supermarket segment.
No goodwill was acquired in fiscal years 2015 and 2016.
J & J SNACK FOODS CORP. AND SUBSIDIARIES
NOTES TO CONSOLIDATED FINANCIAL STATEMENTS (continued)
NOTE G – LONG-TERM DEBT
In November 2016, we entered into an amended and restated loan agreement with our existing banks which provides for up to a $50,000,000 revolving credit facility repayable in November 2021, with the availability of repayments without penalty. Interest is calculated based on LIBOR plus an applicable margin. The agreement contains financial covenants and requires commitment fees in accordance with standard banking practice. As of September 24, 2016 and September 26, 2015, there were no outstanding balances under the facility. We were in compliance with the financial covenants at September 24, 2016.
NOTE H – OBLIGATIONS UNDER CAPITAL LEASES
|
The following is a schedule by years of future minimum lease payments under capital leases: |
||||
|
(in thousands) |
||||
|
2017 |
$ | 365 | ||
|
2018 |
338 | |||
|
2019 |
300 | |||
|
2020 |
262 | |||
|
2021 |
266 | |||
|
2022 and thereafter |
69 | |||
|
Total minimum capital lease payments |
$ | 1,600 | ||
NOTE I – INCOME TAXES
Income tax expense (benefit) is as follows:
| Fiscal year ended | ||||||||||||
|
September 24, |
September 26, |
September 27, |
||||||||||
|
2016 |
2015 |
2014 |
||||||||||
|
|
(in thousands) | |||||||||||
|
Current |
||||||||||||
|
U.S. Federal |
$ | 25,126 | $ | 33,348 | $ | 31,506 | ||||||
|
Foreign |
2,433 | 2,260 | 2,008 | |||||||||
|
State |
5,622 | 6,294 | 6,693 | |||||||||
|
Total current expense |
33,181 | 41,902 | 40,207 | |||||||||
|
Deferred |
||||||||||||
|
U.S. Federal |
$ | 6,444 | $ | (109 | ) | $ | (217 | ) | ||||
|
Foreign |
(145 | ) | (34 | ) | (58 | ) | ||||||
|
State |
1,364 | (23 | ) | (540 | ) | |||||||
|
Total deferred expense (benefit) |
7,663 | (166 | ) | (815 | ) | |||||||
|
Total expense |
$ | 40,844 | $ | 41,736 | $ | 39,392 | ||||||
The change in deferred taxes for the year ended September 27, 2014 does not equal deferred tax expense in the amount of $823,000 as a result of purchase accounting related to the Philly Swirl acquisition.
J & J SNACK FOODS CORP. AND SUBSIDIARIES
NOTES TO CONSOLIDATED FINANCIAL STATEMENTS (continued)
NOTE I – INCOME TAXES (continued)
The provisions for income taxes differ from the amounts computed by applying the statutory federal income tax rate of approximately 35% to earnings before income taxes for the following reasons:
|
Fiscal year ended |
||||||||||||
|
September 24, |
September 26, |
September 27, |
||||||||||
|
2016 |
2015 |
2014 |
||||||||||
|
(in thousands) |
||||||||||||
|
Income taxes at federal statutory rates |
$ | 40,887 | $ | 39,172 | $ | 38,922 | ||||||
|
Increase (decrease) in taxes resulting from: |
||||||||||||
|
State income taxes, net of federal income tax benefit |
4,541 | 4,196 | 4,281 | |||||||||
|
Domestic production activities deduction |
(2,100 | ) | (2,100 | ) | (2,100 | ) | ||||||
|
Increase (reduction) in gross unrecognized tax benefits |
20 | 39 | (161 | ) | ||||||||
|
Increase in federal valuation allowance |
240 | 1,366 | - | |||||||||
|
Share based compensation |
(1,109 | ) | 308 | 437 | ||||||||
|
Other, net |
(1,635 | ) | (1,245 | ) | (1,987 | ) | ||||||
|
Income tax expense |
$ | 40,844 | $ | 41,736 | $ | 39,392 | ||||||
Deferred tax assets and liabilities consist of the following:
|
September 24, |
September 26, |
|||||||
|
2016 |
2015 |
|||||||
|
(in thousands) |
||||||||
|
Deferred tax assets |
||||||||
|
Vacation accrual |
$ | 1,646 | $ | 1,600 | ||||
|
Capital loss carry forwards |
1,674 | 1,434 | ||||||
|
Insurance accrual |
3,317 | 3,385 | ||||||
|
Deferred income |
112 | 63 | ||||||
|
Allowances |
1,514 | 927 | ||||||
|
Inventory capitalization |
954 | 738 | ||||||
|
Share-based compensation |
1,253 | 1,480 | ||||||
|
Net Operating Loss |
1,691 | 1,823 | ||||||
|
Total deferred tax assets |
12,161 | 11,450 | ||||||
|
Valuation allowance |
(1,674 | ) | (1,434 | ) | ||||
|
Total deferred tax assets, net |
10,487 | 10,016 | ||||||
|
Deferred tax liabilities |
||||||||
|
Amortization of goodwill and other intangible assets |
27,358 | 25,791 | ||||||
|
Depreciation of property and equipment |
31,315 | 24,748 | ||||||
|
Total deferred tax liabilities |
58,673 | 50,539 | ||||||
|
Total deferred tax liabilities, net |
$ | 48,186 | $ | 40,523 | ||||
As of September 24, 2016, we have federal and state capital loss carry forwards of approximately $4.6 million from the sale of marketable securities in fiscal years 2015 and 2016. These carry forwards will expire in 2020, 2021 and 2022. As we have no foreseeable capital gains that would allow us to use this asset, we have recorded a valuation allowance for the full amount of this deferred asset.
As of September 24, 2016, we have a federal net operating loss carry forward of approximately $5 million from the PHILLY SWIRL acquisition. These carry forwards are subject to an annual limitation under Code Section 382 of approximately $378,000 and will expire in 2033. We have determined there are no limitations to the total use of this asset and accordingly, have not recorded a valuation allowance for this deferred tax asset.
J & J SNACK FOODS CORP. AND SUBSIDIARIES
NOTES TO CONSOLIDATED FINANCIAL STATEMENTS (continued)
NOTE I – INCOME TAXES (continued)
We have undistributed earnings of our Mexican and Canadian subsidiaries that are considered to be indefinitely reinvested and accordingly no provision for US federal and state income taxes has been provided thereon.
NOTE J - COMMITMENTS
1. Lease Commitments
The following is a summary of approximate future minimum rental commitments for non-cancelable operating leases with terms of more than one year as of September 24, 2016:
|
Plants and |
||||||||||||
|
Offices |
Equipment |
Total |
||||||||||
| (in thousands) | ||||||||||||
|
2017 |
$ | 6,472 | $ | 6,879 | $ | 13,351 | ||||||
|
2018 |
5,911 | 5,626 | 11,537 | |||||||||
|
2019 |
5,305 | 4,292 | 9,597 | |||||||||
|
2020 |
4,537 | 2,365 | 6,902 | |||||||||
|
2021 |
3,830 | 1,012 | 4,842 | |||||||||
|
2022 and thereafter |
18,984 | 262 | 19,246 | |||||||||
|
Total minimal rental commitments |
$ | 45,039 | $ | 20,436 | $ | 65,475 | ||||||
Total rent expense was $17,481,000, $16,448,000 and $15,163,000 for fiscal years 2016, 2015 and 2014, respectively.
2. Other Commitments
We are a party to litigation which has arisen in the normal course of business which management currently believes will not have a material adverse effect on our financial condition or results of operations.
We self-insure, up to loss limits, certain insurable risks such as worker’s compensation and automobile liability claims. Accruals for claims under our self-insurance program are recorded on a claims incurred basis. Our total recorded liability for all years’ claims incurred but not yet paid was $8,200,000 and $8,200,000 at September 24, 2016 and September 26, 2015, respectively. In connection with certain self-insurance agreements, we customarily enter into letters of credit arrangements with our insurers. At September 24, 2016 and September 26, 2015, we had outstanding letters of credit totaling $8,675,000 and $9,075,000, respectively.
We have a self-insured medical plan which covers approximately 1,500 of our employees. We record a liability for incurred but not yet reported or paid claims based on our historical experience of claims payments and a calculated lag time period. Our recorded liability at September 24, 2016 and September 26, 2015 was $1,719,000 and $1,659,000, respectively.
NOTE K - CAPITAL STOCK
In our fiscal year ended September 24, 2016, we purchased and retired 141,700 shares of our common stock at a cost of $15,265,019. In our first quarter, we purchased and retired 27,083 shares at a cost of $3,115,439. In our second quarter, we purchased and retired 80,565 shares at a cost of $8,642,887. In our third quarter, we purchased and retired 34,052 shares at a cost of $3,506,693. We did not purchase and retire any shares in our fourth quarter.
In our fiscal year ended September 26, 2015, we purchased and retired 72,698 shares of our common stock at a cost of $8,011,118.
In our fiscal year ended September 27, 2014, we purchased and retired 81,685 shares of our common stock at a cost of $7,504,729.
J & J SNACK FOODS CORP. AND SUBSIDIARIES
NOTES TO CONSOLIDATED FINANCIAL STATEMENTS (continued)
NOTE L – STOCK OPTIONS
We have a Stock Option Plan (the “Plan”). Pursuant to the Plan, stock options may be granted to officers and our key employees which qualify as incentive stock options as well as stock options which are nonqualified. The exercise price of incentive stock options is at least the fair market value of the common stock on the date of grant. The exercise price for nonqualified options is determined by a committee of the Board of Directors. The options are generally exercisable after three years and expire no later than ten years from date of grant. There were 800,000 shares reserved under the Plan; options for 174,875 shares remain unissued as of September 24, 2016. There are options that were issued under an option plan that has since expired that are still outstanding.
We have an Employee Stock Purchase Plan (“ESPP”) whereby employees purchase stock by making contributions through payroll deductions for six month periods. The purchase price of the stock is 85% of the lower of the market price of the stock at the beginning of the six-month period or the end of the six-month period. In fiscal years 2016, 2015 and 2014 employees purchased 13,747, 13,648 and 15,650 shares at average purchase prices of $96.00, $86.01 and $70.40, respectively. ESPP expense of $305,000, $328,000 and $329,000 was recognized for fiscal years 2016, 2015 and 2014, respectively.
A summary of the status of our stock option plans as of fiscal years 2016, 2015 and 2014 and the changes during the years ended on those dates is represented below:
|
Incentive Stock Options |
Nonqualified Stock Options |
|||||||||||||||
|
Weighted- |
Weighted- |
|||||||||||||||
|
Stock |
Average |
Stock |
Average |
|||||||||||||
|
Options |
Exercise |
Options |
Exercise |
|||||||||||||
|
Outstanding |
Price |
Outstanding |
Price |
|||||||||||||
|
Balance, September 29, 2013 |
259,852 | $ | 51.17 | 231,247 | $ | 44.77 | ||||||||||
|
Granted |
83,440 | 82.07 | 38,132 | 88.26 | ||||||||||||
|
Exercised |
(39,097 | ) | 42.42 | (20,000 | ) | 20.43 | ||||||||||
|
Canceled |
(8,550 | ) | 58.68 | - | - | |||||||||||
|
Balance, September 27, 2014 |
295,645 | 60.83 | 249,379 | 53.38 | ||||||||||||
|
Granted |
114,488 | 100.94 | 55,152 | 106.96 | ||||||||||||
|
Exercised |
(70,792 | ) | 47.30 | (6,590 | ) | 51.14 | ||||||||||
|
Canceled |
(6,989 | ) | 84.13 | - | - | |||||||||||
|
Balance, September 26, 2015 |
332,352 | 77.04 | 297,941 | 63.34 | ||||||||||||
|
Granted |
120,450 | 108.69 | 58,720 | 112.35 | ||||||||||||
|
Exercised |
(86,223 | ) | 53.67 | (44,777 | ) | 42.53 | ||||||||||
|
Canceled |
(10,792 | ) | 97.07 | - | - | |||||||||||
|
Balance, September 24, 2016 |
355,787 | $ | 92.81 | 311,884 | $ | 75.56 | ||||||||||
|
Exercisable Options |
||||||||||||||||
|
September 24, 2016 |
54,640 | $ | 57.98 | 139,880 | $ | 43.52 | ||||||||||
The weighted-average fair value of incentive options granted during fiscal years ended September 24, 2016, September 26, 2015 and September 27, 2014 was $13.94, $15.27 and $15.24, respectively. The weighted-average fair value of non-qualified stock options granted during the fiscal years ended September 24, 2016, September 26, 2015 and September 27, 2014 was $19.95, $21.90 and $17.34, respectively. The total intrinsic value of stock options exercised was $8.4 million, $4.8 million and $3.4 million in fiscal years 2016, 2015 and 2014, respectively.
J & J SNACK FOODS CORP. AND SUBSIDIARIES
NOTES TO CONSOLIDATED FINANCIAL STATEMENTS (continued)
NOTE L – STOCK OPTIONS (continued)
The total cash received from these option exercises was $5.3 million, $3.1 million and $1.5 million in fiscal years 2016, 2015 and 2014, respectively; and the actual tax benefit realized from the tax deductions from these option exercises was $1.6 million, $874,000 and $1.0 million in fiscal years 2016, 2015 and 2014, respectively.
The following table summarizes information about incentive stock options outstanding as of September 24, 2016:
|
Options Outstanding |
Options Exercisable |
|||||||||||||||||||
|
Number |
Weighted- |
Number |
||||||||||||||||||
|
Outstanding |
Average |
Weighted- |
Exercisable |
Weighted- |
||||||||||||||||
|
at |
Remaining |
Average |
at |
Average |
||||||||||||||||
|
Range of |
September 24, |
Contractual |
Exercise |
September 24, |
Exercise |
|||||||||||||||
|
Exercise Prices |
2016 |
Life |
Price |
2016 |
Price |
|||||||||||||||
|
$57.15-$81.67 |
129,733 | 1.6 | $ | 71.68 | 54,640 | $ | 57.98 | |||||||||||||
|
$89.37-$117.65 |
226,054 | 3.9 | 104.94 | - | - | |||||||||||||||
|
Total options |
355,787 | 3.1 | 92.81 | 54,640 | 57.98 | |||||||||||||||
The following table summarizes information about nonqualified stock options outstanding as of September 24, 2016:
|
Options Outstanding |
Options Exercisable |
|||||||||||||||||||
|
Number |
Weighted- |
Number |
||||||||||||||||||
|
Outstanding |
Average |
Weighted- |
Exercisable |
Weighted- |
||||||||||||||||
|
at |
Remaining |
Average |
at |
Average |
||||||||||||||||
|
Range of |
September 24, |
Contractual |
Exercise |
September 24, |
Exercise |
|||||||||||||||
|
Exercise Prices |
2016 |
Life |
Price |
2016 |
Price |
|||||||||||||||
|
$31.10-$41.75 |
80,000 | 1.8 | $ | 35.46 | 80,000 | $ | 35.46 | |||||||||||||
|
$47.59-$57.99 |
59,880 | 4.0 | 54.30 | 59,880 | 54.30 | |||||||||||||||
|
$80.79-$119.44 |
172,004 | 5.9 | 101.61 | - | - | |||||||||||||||
|
Total options |
311,884 | 4.4 | 75.56 | 139,880 | 43.52 | |||||||||||||||
NOTE M – 401(k) PROFIT-SHARING PLAN
We maintain a 401(k) profit-sharing plan for our employees. Under this plan, we may make discretionary profit-sharing and matching 401(k) contributions. Contributions of $1,936,000, $1,836,000 and $1,686,000 were made in fiscal years 2016, 2015 and 2014, respectively.
NOTE N – CASH FLOW INFORMATION
The following is supplemental cash flow information:
|
Fiscal Year Ended |
||||||||||||
|
September 24, |
September 26, |
September 27, |
||||||||||
|
2016 |
2015 |
2014 |
||||||||||
| (in thousands) | ||||||||||||
|
Cash paid for: |
||||||||||||
|
Interest |
$ | 57 | $ | 53 | $ | 41 | ||||||
|
Income taxes |
41,064 | 43,867 | 41,318 | |||||||||
|
Non cash items: |
||||||||||||
|
Capital leases |
$ | 486 | $ | 1,191 | $ | 499 | ||||||
J & J SNACK FOODS CORP. AND SUBSIDIARIES
NOTES TO CONSOLIDATED FINANCIAL STATEMENTS (continued)
NOTE O – SEGMENT REPORTING
We principally sell our products to the food service and retail supermarket industries. Sales and results of our frozen beverages business are monitored separately from the balance of our food service business because of different distribution and capital requirements. We maintain separate and discrete financial information for the three operating segments mentioned above which is available to our Chief Operating Decision Makers. We have applied no aggregation criteria to any of these operating segments in order to determine reportable segments. Our three reportable segments are Food Service, Retail Supermarkets and Frozen Beverages. All inter-segment net sales and expenses have been eliminated in computing net sales and operating income. These segments are described below.
Food Service
The primary products sold by the food service segment are soft pretzels, frozen juice treats and desserts, churros, dough enrobed handheld products and baked goods. Our customers in the food service segment include snack bars and food stands in chain, department and discount stores; malls and shopping centers; casual dining restaurants; fast food outlets; stadiums and sports arenas; leisure and theme parks; convenience stores; movie theatres; warehouse club stores; schools, colleges and other institutions. Within the food service industry, our products are purchased by the consumer primarily for consumption at the point-of-sale.
Retail Supermarkets
The primary products sold to the retail supermarket channel are soft pretzel products – including SUPERPRETZEL, frozen juice treats and desserts including LUIGI’S Real Italian Ice, MINUTE MAID Juice Bars and Soft Frozen Lemonade, WHOLE FRUIT frozen fruit bars and sorbet, PHILLY SWIRL cups and sticks, ICEE Squeeze-Up Tubes and dough enrobed handheld products including PATIO burritos. Within the retail supermarket channel, our frozen and prepackaged products are purchased by the consumer for consumption at home.
Frozen Beverages
We sell frozen beverages to the food service industry primarily under the names ICEE, SLUSH PUPPIE and PARROT ICE in the United States, Mexico and Canada. We also provide repair and maintenance service to customers for customers’ owned equipment.
The Chief Operating Decision Maker for Food Service and Retail Supermarkets and the Chief Operating Decision Maker for Frozen Beverages monthly review detailed operating income statements and sales reports in order to assess performance and allocate resources to each individual segment. Sales is considered to be the one and only key variable monitored by the Chief Operating Decision Makers and management when determining each segment’s and the company’s financial condition and operating performance. In addition, the Chief Operating Decision Makers review and evaluate depreciation, capital spending and assets of each segment on a quarterly basis to monitor cash flow and asset needs of each segment. Information regarding the operations in these three reportable segments is as follows:
J & J SNACK FOODS CORP. AND SUBSIDIARIES
NOTES TO CONSOLIDATED FINANCIAL STATEMENTS (continued)
NOTE O - SEGMENT REPORTING (continued)
| Fiscal year ended | ||||||||||||
|
September 24, |
September 26, |
September 27, |
||||||||||
|
2016 |
2015 |
2014 |
||||||||||
|
(52 weeks) |
(52 weeks) |
(52 weeks) |
||||||||||
|
(in thousands) |
||||||||||||
|
Sales to External Customers: |
||||||||||||
|
Food Service |
||||||||||||
|
Soft pretzels |
$ | 170,155 | $ | 168,970 | $ | 164,680 | ||||||
|
Frozen juices and ices |
51,798 | 54,454 | 53,888 | |||||||||
|
Churros |
57,318 | 56,602 | 55,929 | |||||||||
|
Handhelds |
27,427 | 21,817 | 24,248 | |||||||||
|
Bakery |
294,518 | 301,135 | 281,556 | |||||||||
|
Other |
20,313 | 13,657 | 11,597 | |||||||||
|
Total Food Service |
$ | 621,529 | $ | 616,635 | $ | 591,898 | ||||||
|
Retail Supermarket |
||||||||||||
|
Soft pretzels |
$ | 33,279 | $ | 35,727 | $ | 34,830 | ||||||
|
Frozen juices and ices |
68,924 | 72,174 | 59,404 | |||||||||
|
Handhelds |
15,347 | 18,957 | 21,354 | |||||||||
|
Coupon redemption |
(4,430 | ) | (4,725 | ) | (3,807 | ) | ||||||
|
Other |
4,469 | 1,244 | 863 | |||||||||
|
Total Retail Supermarket |
$ | 117,589 | $ | 123,377 | $ | 112,644 | ||||||
|
Frozen Beverages |
||||||||||||
|
Beverages |
$ | 150,118 | $ | 142,705 | $ | 133,283 | ||||||
|
Repair and maintenance service |
71,123 | 65,765 | 59,805 | |||||||||
|
Machines sales |
31,155 | 26,413 | 20,224 | |||||||||
|
Other |
1,267 | 1,361 | 1,597 | |||||||||
|
Total Frozen Beverages |
$ | 253,663 | $ | 236,244 | $ | 214,909 | ||||||
|
Consolidated Sales |
$ | 992,781 | $ | 976,256 | $ | 919,451 | ||||||
|
Depreciation and Amortization: |
||||||||||||
|
Food Service |
$ | 22,912 | $ | 21,289 | $ | 20,882 | ||||||
|
Retail Supermarket |
1,031 | 1,132 | 492 | |||||||||
|
Frozen Beverages |
16,180 | 15,850 | 15,719 | |||||||||
|
Total Depreciation and Amortization |
$ | 40,123 | $ | 38,271 | $ | 37,093 | ||||||
|
Operating Income: |
||||||||||||
|
Food Service |
$ | 76,539 | $ | 75,286 | $ | 73,731 | ||||||
|
Retail Supermarket |
9,618 | 11,020 | 11,201 | |||||||||
|
Frozen Beverages |
26,653 | 24,582 | 21,916 | |||||||||
|
Total Operating Income |
$ | 112,810 | $ | 110,888 | $ | 106,848 | ||||||
|
Capital Expenditures: |
||||||||||||
|
Food Service |
$ | 24,759 | $ | 28,228 | $ | 21,594 | ||||||
|
Retail Supermarket |
369 | 112 | 26 | |||||||||
|
Frozen Beverages |
23,581 | 20,301 | 17,765 | |||||||||
|
Total Capital Expenditures |
$ | 48,709 | $ | 48,641 | $ | 39,385 | ||||||
|
Assets: |
||||||||||||
|
Food Service |
$ | 589,854 | $ | 543,851 | $ | 516,916 | ||||||
|
Retail Supermarket |
22,090 | 24,209 | 25,917 | |||||||||
|
Frozen Beverages |
178,543 | 171,609 | 161,940 | |||||||||
|
Total Assets |
$ | 790,487 | $ | 739,669 | $ | 704,773 | ||||||
J & J SNACK FOODS CORP. AND SUBSIDIARIES
NOTES TO CONSOLIDATED FINANCIAL STATEMENTS (continued)
NOTE P - ACCUMULATED OTHER COMPREHENSIVE LOSS:
Changes to the components of accumulated other comprehensive loss are as follows:
|
Fiscal Year Ended September 24, 2016 |
||||||||||||
| (in thousands) | ||||||||||||
|
Unrealized |
||||||||||||
|
Foreign Currency |
Holding Loss on |
|||||||||||
|
Translation |
Marketable |
|||||||||||
|
Adjustments |
Securities |
Total |
||||||||||
|
Beginning Balance |
$ | (10,021 | ) | $ | (876 | ) | $ | (10,897 | ) | |||
|
Other comprehensive loss before reclassifications |
(3,065 | ) | (8 | ) | (3,073 | ) | ||||||
|
Amounts reclassified from accumulated other comprehensive income |
- | 555 | 555 | |||||||||
|
Ending Balance |
$ | (13,086 | ) | $ | (329 | ) | $ | (13,415 | ) | |||
|
Fiscal Year Ended September 26, 2015 |
||||||||||||
| (in thousands) | ||||||||||||
|
Foreign Currency |
Unrealized Holding Loss on |
|||||||||||
|
Translation |
Marketable |
|||||||||||
|
Adjustments |
Securities |
Total |
||||||||||
|
Beginning Balance |
$ | (4,632 | ) | $ | (1,356 | ) | $ | (5,988 | ) | |||
|
Other comprehensive loss before reclassifications |
(5,389 | ) | (2,607 | ) | (7,996 | ) | ||||||
|
Amounts reclassified from accumulated other comprehensive income |
- | 3,087 | 3,087 | |||||||||
|
Ending Balance |
$ | (10,021 | ) | $ | (876 | ) | $ | (10,897 | ) | |||
J & J SNACK FOODS CORP. AND SUBSIDIARIES
NOTES TO CONSOLIDATED FINANCIAL STATEMENTS (continued)
NOTE Q - QUARTERLY FINANCIAL DATA (UNAUDITED)
|
Fiscal Year Ended September 24, 2016 |
||||||||||||||||
|
Net Earnings |
||||||||||||||||
|
Per |
||||||||||||||||
|
Gross |
Net |
Diluted |
||||||||||||||
|
Net Sales |
Profit |
Earnings |
Share(1) |
|||||||||||||
|
(in thousands, except per share information) |
||||||||||||||||
|
1st Quarter |
$ | 222,850 | $ | 63,835 | $ | 12,978 | $ | 0.69 | ||||||||
|
2nd Quarter |
229,710 | 68,749 | 15,588 | 0.83 | ||||||||||||
|
3rd Quarter |
277,981 | 92,086 | 26,791 | 1.43 | ||||||||||||
|
4th Quarter |
262,240 | 79,797 | 20,618 | 1.10 | ||||||||||||
|
Total |
$ | 992,781 | $ | 304,467 | $ | 75,975 | $ | 4.05 | ||||||||
|
Fiscal Year Ended September 26, 2015 |
||||||||||||||||
|
Net Earnings |
||||||||||||||||
|
Per |
||||||||||||||||
|
Gross |
Net |
Diluted |
||||||||||||||
|
Net Sales |
Profit |
Earnings |
Share(1) |
|||||||||||||
|
(in thousands, except per share information) |
||||||||||||||||
|
1st Quarter |
$ | 212,752 | $ | 61,101 | $ | 11,256 | $ | 0.60 | ||||||||
|
2nd Quarter |
225,008 | 66,950 | 14,637 | 0.78 | ||||||||||||
|
3rd Quarter |
278,724 | 90,396 | 24,462 | 1.30 | ||||||||||||
|
4th Quarter |
259,772 | 82,443 | 19,828 | 1.05 | ||||||||||||
|
Total |
$ | 976,256 | $ | 300,890 | $ | 70,183 | $ | 3.73 | ||||||||
|
(1) |
Total of quarterly amounts do not necessarily agree to the annual report amounts due to separate quarterly calculations of weighted average shares outstanding. |
SCHEDULE II - VALUATION AND QUALIFYING ACCOUNTS
|
Opening |
Charged to |
Closing |
||||||||||||||||
|
Year |
Description |
Balance |
Expense |
Deductions |
Balance |
|||||||||||||
|
2016 |
Allowance for doubtful accounts |
$ | 304,000 | $ | 525,000 | $ | 258,000 | (1) | $ | 571,000 | ||||||||
|
2015 |
Allowance for doubtful accounts |
$ | 450,000 | $ | 310,000 | $ | 456,000 | (1) | $ | 304,000 | ||||||||
|
2014 |
Allowance for doubtful accounts |
$ | 854,000 | $ | 161,000 | $ | 565,000 | (1) | $ | 450,000 | ||||||||
|
(1) |
Write-offs of uncollectible accounts receivable. |
S-1