Attached files
| file | filename |
|---|---|
| 8-K - FORM 8-K - BANK OF THE OZARKS INC | d290817d8k.htm |
 NASDAQ: OZRK | NOVEMBER 2016
Exhibit 99.1 |
 2 This presentation and other communications by the Company include certain “forward looking statements” regarding the Company’s plans, expectations, thoughts, beliefs, estimates, goals and outlook for the future that are intended to be covered by the Private Securities Litigation Reform Act of 1995. Forward-looking statements are based on management’s expectations as well as certain assumptions and estimates made by, and information available to, management at the time. Those statements are not guarantees of future results or performance and are subject to certain known and unknown risks, uncertainties and other factors that may cause actual results to differ materially from those expressed in, or implied by, such forward-looking statements. These risks, uncertainties, and other factors include, but are not limited to: potential delays or other problems implementing our growth, expansion and acquisition strategies including delays in identifying sites, hiring or retaining qualified personnel, obtaining regulatory or other approvals, obtaining permits and designing, constructing and opening new offices; the ability to enter into and/or close additional acquisitions; problems with, or additional expenses relating to, integrating acquisitions; the inability to realize expected cost savings and/or synergies from acquisitions; problems with managing acquisitions; the effect of the announcements of any future mergers or acquisitions on customer relationships and operating results; the ability to attract new or retain existing or acquired deposits, or to retain or grow loans and leases, including growth from unfunded closed loans; the ability to generate future revenue growth or to control future growth in non-interest expense; interest rate fluctuations, including changes in the yield curve between short-term and long-term interest rates; competitive factors and pricing pressures, including their effect on our net interest margin; general economic, unemployment, credit market and real estate market conditions, and the effect of such conditions on the creditworthiness of borrowers and lessees, collateral values, the value of investment securities and asset recovery values; changes in legal and regulatory requirements, including additional legal and regulatory requirements to which the Company is subject as a result of its total assets exceeding $10 billion; the availability and access to capital; possible downgrades in the Company’s credit ratings or outlook which could increase the costs of funding from capital markets; recently enacted and potential legislation and regulatory actions and the costs and expenses to comply with new legislation and regulatory actions; changes in U.S. government monetary and fiscal policy; possible further downgrade of U.S. Treasury securities; the ability to keep pace with technological changes, including changes regarding maintaining cybersecurity; an increase in the incidence or severity of fraud, illegal payments, security breaches or other illegal acts impacting us and our customers; adoption of new accounting standards or changes in existing standards; and adverse results (including costs, fines, reputational harm or other negative effects) from current or future litigation, regulatory examinations or other legal and/or regulatory actions as well as other factors described in reports we file with the SEC, including in our Annual Report on Form 10-K for the year ended December 31, 2015 under the headings “Forward-Looking Information” and “Item 1A. Risk Factors” and in our Quarterly Reports on Form 10-Q under “Part II, Item 1A Risk Factors.” Should one or more of the foregoing risks materialize, or should underlying assumptions prove incorrect, actual results or outcomes may vary materially from those projected in, or implied by, such forward- looking statements. The Company disclaims any obligation to update or revise any forward-looking statements, whether as a result of new information, future events or otherwise. Forward-Looking Information |
 3 A Tradition of High Performance Top Performing Bank ABA Banking Journal Assets over $3 Billion Top Performing Bank ABA Banking Journal Assets $1 Billion - $10 Billion Top Performing Regional Bank SNL Financial Top Performing Bank Bank Director Magazine Assets $1 Billion - $5 Billion Community Banker of the Year American Banker George Gleason Top Performing Bank Bank Director Magazine Assets $1 Billion - $5 Billion Top Performing Regional Bank SNL Financial Top Performing Bank Bank Director Magazine Assets $5 Billion - $50 Billion Top Performing Regional Bank, SNL Financial Top Performing Bank Bank Director Magazine Assets $5 Billion - $50 Billion |
 4 Consistent Profitability and Solid Earnings Growth • Record net income in 16 of 19 years as a public company. • 37 years under current leadership.
• 37 consecutive years (for company and its predecessor institution) of positive net income; no loss years. Net Income ($ in Millions) Red bars denote record annual results. 1997 1998 1999 2000 2001 2002 2003 2004 2005 2006 2007 2008 2009 2010 2011 2012 2013 2014 2015 9M 2015 9M 2016 4.5 5.6 6.6 6.0 9.0 14.4 20.2 25.9 31.5 31.7 31.7 34.5 36.8 64.0 101.3 77.0 91.2 118.6 182.3 130.8 182.2 39.3% Increase 53.7% Increase |
 5 Discipline An Ability to Capitalize on Opportunities Hard Work ROAE & ROATE (%) *Data for all FDIC insured institutions from the FDIC Quarterly Banking
Profile, last update second quarter 2016. Annualized when
appropriate. Calculations of return on average tangible
common stockholders’ equity and the reconciliations
to GAAP are included in the schedule at the end of this
presentation.
The Rewards of:
ROAA (%) 2008 2009 2010 2011 2012 2013 2014 2015 9M 2016 16.16 13.75 21.62 27.04 16.80 16.28 15.08 14.97 13.27 16.61 14.05 22.13 27.87 17.22 16.73 16.63 17.02 15.88 0.35 -0.73 5.85 7.79 8.90 9.54 9.01 9.30 9.05 Bank of the Ozarks, Inc. ROAE Bank of the Ozarks, Inc. ROATE FDIC* 2008 2009 2010 2011 2012 2013 2014 2015 9M 2016 1.14 1.23 2.13 2.70 2.04 2.14 2.01 2.11 1.88 0.03 -0.08 0.65 0.88 1.00 1.07 1.01 1.04 1.02 Bank of the Ozarks, Inc. ROAA FDIC* |
 6 Excellence in Three Disciplines Superb Net Interest Margin Favorable Asset Quality Excellent Efficiency |
 7 *Data from S&P Global Market Intelligence. **Data for all FDIC insured institutions from the FDIC Quarterly Banking Profile, last update second quarter 2016.
Favorable 1.74%
Variance vs
Industry at 3.08%**
Superb Net Interest Margin:
Top Decile of Industry for 6 Consecutive Years*
Bank of the Ozarks, Inc.
FDIC Insured Institutions
2010 2011 2012 2013 2014 2015 2016 Net Interest Margin (%) 4.99 5.10 5.31 5.35 5.61 5.80 5.90 6.05 5.98 5.84 5.97 5.84 5.83 5.56 5.55 5.63 5.46 5.62 5.49 5.53 5.42 5.37 5.07 4.98 4.92 4.82 4.90 3.83 3.76 3.75 3.71 3.66 3.61 3.56 3.57 3.52 3.46 3.43 3.32 3.27 3.26 3.26 3.28 3.17 3.15 3.14 3.12 3.02 3.06 3.08 3.13 3.10 3.08 Q1 Q2 Q3 Q4 Q1 Q2 Q3 Q4 Q1 Q2 Q3 Q4 Q1 Q2 Q3 Q4 Q1 Q2 Q3 Q4 Q1 Q2 Q3 Q4 Q1 Q2 Q3 |
   8 2012 2013 2014 2015 9M 2016 Financial Institutions Nationwide** Loan Yield-Legacy 5.87% 5.48% 5.10% 5.00% 5.06% 4.31% COIBD 0.38% 0.23% 0.23% 0.31% 0.49% 0.33% Spread 5.49% 5.25% 4.87% 4.69% 4.57% 3.98% OZRK* Financial Institutions Nationwide** Tax-exempt (TE) 5.47% Taxable 2.66% Total (TE) 4.15% 2.39% • Outstanding Yield on our Portfolio of Purchased Loans (6.58%)* • Favorable Loan Yields on Legacy Portfolio Favorable 1.76% Variance vs Industry • Favorable 0.75% Variance vs Industry Key Drivers of Net Interest Margin • Tradition of Maintaining High Quality, Good Yielding Investment Portfolio
* Data for the nine months ended September 30, 2016.
** Data for all financial institutions nationwide from the FDIC Uniform
Bank Performance Report for insured commercial banks with assets greater than $3 billion for the six months ended June 30, 2016. 2012 2013 2014 2015 1Q 2016 2Q 2016 3Q 2016 Loan Yield - Purchased 8.78% 9.03% 8.94% 7.24% 6.71% 6.72% 6.54% Legacy Loan Yields 2014 2015 2016 1Q 5.11% 5.01% 5.00% 2Q 5.08% 5.10% 5.06% 3Q 5.04% 4.96% 5.12% 4Q 5.18% 4.96% • Legacy Loan Yields have been in a 22 bps range in the past 11 quarters |
 9 * Bank of the Ozarks’ data excludes purchased loans and net charge-offs related to such loans.
** Data for all FDIC insured institutions from the FDIC Quarterly
Banking Profile, last update second quarter 2016.
Annualized when appropriate.
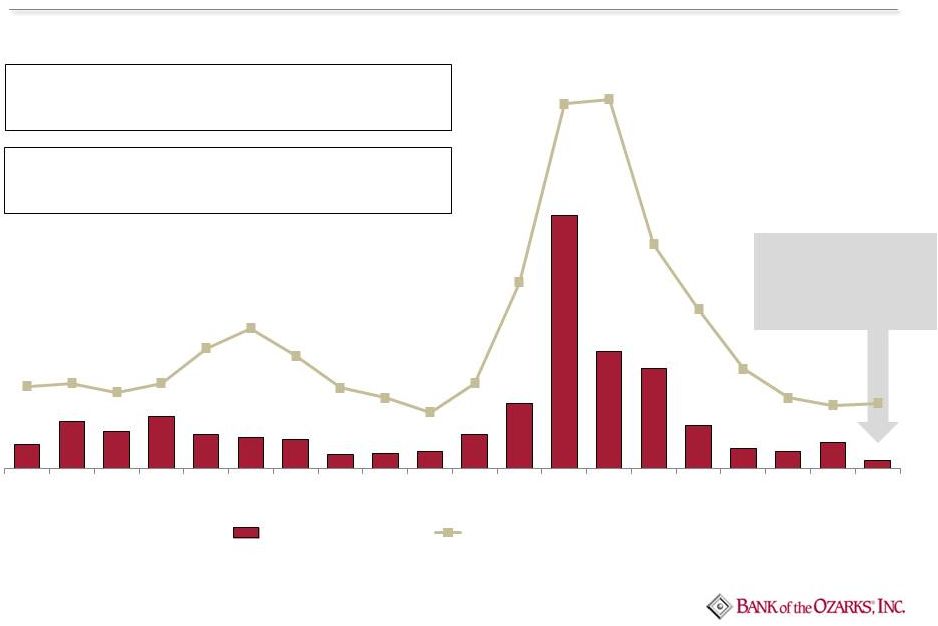
Asset Quality 65% Better Than Industry Average
Since going public in 1997, our annual net charge-
off ratio has been below the industry average every year.
9M 2016 Net Charge-Off
Ratios Annualized:
• Non-purchased loans 0.06% • Purchased loans 0.08% • Total loans 0.06% Net Charge-Off Ratio (%) Over those 19 years, our net charge off ratio has been only 35% of industry average. 0.17 0.33 0.26 0.36 0.24 0.22 0.20 0.10 0.11 0.12 0.24 0.45 1.75 0.81 0.69 0.30 0.14 0.12 0.18 0.06 0.57 0.59 0.53 0.59 0.83 0.97 0.78 0.56 0.49 0.39 0.59 1.29 2.52 2.55 1.55 1.10 0.69 0.49 0.44 0.45 1997 1998 1999 2000 2001 2002 2003 2004 2005 2006 2007 2008 2009 2010 2011 2012 2013 2014 2015 9M 2016 Bank of the Ozarks, Inc.* FDIC
Insured Institutions** |
 10 *Data from S&P Global Market Intelligence. **Data for all FDIC insured institutions from the FDIC Quarterly Banking Profile, last update second quarter 2016.
Excellent Efficiency:
Top Decile of Industry for 14 Consecutive Years*
2000 2001 2002 2003 2004 2005 2006 2007 2008 2009 2010 2011 2012 2013 2014 2015 9M 2016 59.1 52.5 47.9 47.5 46.2 43.4 47.1 46.3 42.3 37.8 42.9 41.6 46.6 45.3 45.3 38.4 36.6 58.5 57.7 56.0 56.6 58.0 57.2 56.8 59.5 59.0 55.5 57.2 61.4 61.6 60.5 61.9 59.9 58.8 Bank of the Ozarks, Inc. FDIC Insured Institutions** Efficiency Ratio (%) • Favorable trend in efficiency ratio in recent years • Long term goal for further improvement |
 11 Extremely Conservative, Risk Averse Culture A Constant Pursuit of Lower Credit Risk & Lower Interest Rate Risk |
 12 Dan Thomas, Vice Chairman, Chief Lending Officer, RESG President • Dan Thomas, CPA, JD, LLM (Taxation) • RESG established in 2003 by Dan Thomas Team Members: 95 as of 10/07/2016 Priorities: • Asset Quality-primary • Profitability-secondary • Growth-tertiary RESG Loans at September 30, 2016 • 70% of our funded non-purchased loans • 91% of our unfunded closed loans • 80% of our total funded and unfunded balances of non-purchased loans
RESG Asset Quality
• Two loans have incurred losses since inception of RESG in 2003 • $10.4 million total credit losses since inception • Annualized loss ratio of 0.08% since inception • Leverage Ratio on RESG Loans Real Estate Specialties Group (RESG) 13 Year History of Annual Losses Year-end Ending Portfolio Balance Net charge-offs ("NCO")* NCO Ratio 2003 $ 5,106,325 - 0.00% 2004 $ 52,657,865 - 0.00% 2005 $ 51,055,927 - 0.00% 2006 $ 61,322,550 - 0.00% 2007 $ 209,523,672 - 0.00% 2008 $ 470,485,099 - 0.00% 2009 $ 516,044,727 $ 7,531,303 1.50% 2010 $ 567,716,359 - 0.00% 2011 $ 649,806,170 $ 2,905,315 0.50% 2012 $ 848,441,013 - 0.00% 2013 $ 1,270,767,688 - 0.00% 2014 $ 2,308,573,422 - 0.00% 2015 $ 4,263,799,976 - 0.00% 9/30/2016 $ 6,111,394,170 - 0.00% Total $ 10,436,618 Average $ 745,473 0.08% 2005-2007 • Low 70% range Loan to Cost • High 60% range Loan to Value September 30, 2016 • 49% Loan to Cost • 42% Loan to Appraised Value vs * Net charge-offs presented in the table can be attributed to two loans
and includes ORE write-downs related to those two
loans. Our Primary Engine for Loan Growth
|
 13 RESG Business Model Reduces Credit Risk – It starts with the right focus I. Strong and capable sponsors, preferred equity providers and mezzanine debt providers, as evidenced by • Strong liquidity • Strong capital • Significant expertise and experience II. Marquee projects III. Low leverage with substantial equity and mezzanine debt, all of which is “equity” relative to the bank’s senior secured position IV. Defensive loan structures providing substantial protection to the bank Focus on some combination of four factors |
 14 RESG Business Model Emphasizes Industry-Leading Excellence throughout the Life of the Loan • Thorough underwriting including detailed modeling and stress testing for
economic stress, interest rate stress, exit refinancing stress and cap
rate stress.
• Economic analysis including supply and demand metrics for the relevant
market, submarket and micro market, as appropriate.
• Thorough and consistent documentation under the supervision of RESG’s
in-house legal team in coordination with outside counsel.
• An emphasis on precision at closing handled by RESG’s team of closers and
paralegals.
• Thorough life-of-loan asset management by teams of skilled asset managers. |
 15 • Weighted average LTV of RESG’s portfolio is a very conservative 42.0% Low Leverage and Significant RESG Portfolio Diversification by Product Type Reduce Risk RESG Portfolio Details *Data as of September 30, 2016. Excludes: $340 million in total commitments co-managed by Community Banking and RESG.
• No property type accounts for more than 21.3% of RESG’s portfolio • Weighted average LTC of RESG’s portfolio is a very conservative 48.8% Property Type Total Commitment (Funded and Unfunded) Percentage of RESG Portfolio Loan to Cost (LTC) Loan to Value (LTV) Condos $ 2,967,690,554 21.3% 43.7% 38.0% Multi-family 2,804,748,088 20.2% 59.7% 49.9% Office / MOB 2,236,579,691 16.1% 49.6% 38.7% Hospitality 1,976,238,044 14.2% 47.6% 40.4% Land Hold 1,270,544,630 9.1% 42.3% 39.0% Mixed Use 1,092,533,679 7.9% 48.9% 42.5% SF Lots 479,230,241 3.4% 47.0% 47.3% Retail 408,082,743 2.9% 61.5% 58.3% Land Development 235,479,399 1.7% 45.3% 41.2% Industrial 233,870,730 1.7% 54.4% 51.0% SF Homes 203,246,650 1.5% 43.7% 48.9% Totals $ 13,908,244,449 100.0% 48.8% 42.0% |
 16 The amount of the Company’s total real estate loans at September 30, 2016 based on the state in
which the principal collateral is located is reflected in the
table above. Data for individual states is
separately presented when aggregate total real estate loans in that state exceed $10 million. Significant Diversification by both Geography and Product Type Reduces Credit Risk
Total Real Estate Portfolio
The above tables include the amount and type of
non-farm/non-residential loans and
construction/land development loans as of September 30, 2016 and their
respective percentage of the total
non-farm/non-residential loan and total construction/land development loan portfolios. Outstanding Balances by Product Type Outstanding Balances by State of Collateral Non-Farm Non-Residential Total ($ in thousands) % Retail, including shopping and strip centers $ 675,585
13.9%
Churches and schools
255,584
5.3% Office, including medical offices 752,030 15.5% Warehouse and mini-storage 31,414 0.6% Gasoline stations and convenience stores 105,308 2.2% Hotels and Motels 1,074,417 22.1% Restaurants and bars 146,296 3.0% Manufacturing and industrial 506,209 10.4% Nursing Homes and Assisted living centers 380,208 7.8% Hospitals, surgery centers and other medical 69,175 1.4% Golf courses, entertainment and recreational facilities 25,639 0.5% Mixed Use Properties 369,977 7.6% Other non-farm/non-residential 459,394 9.5% Total $ 4,851,236 100.0% Construction/Land Development Loans Total ($ in thousands) % Unimproved land $ 329,629
6.8% Land Development and Lots: 0.0% 1-4 family and Multi-family 626,188 12.9% Non-residential 802,834 16.6% Construction: 0.0% 1-4 Family Residential 0.0% Owner occupied 35,158 0.7% Non-owner occupied: 0.0% Pre-sold 1,003,787 20.8% Speculative 217,624 4.5% Multifamily 652,128 13.5% Industrial, commercial and other 1,168,394 24.2% Total $ 4,835,742 100.0% Location Total ($ in thousands) New York $ 2,370,903 Florida 2,006,329 Georgia 1,549,025 Arkansas 1,231,510 Texas 1,217,030 North Carolina 723,325 California 672,604 Colorado 292,350 Tennessee 237,589 Arizona 195,642 Washington 168,217 South Carolina 147,984 Illinois 129,880 Nevada 125,191 Cayman Islands 113,852 Oregon 108,133 Maryland 80,924 Alabama 78,808 Pennsylvania 74,791 Hawaii 60,463 Minnesota 49,789 Missouri 48,785 Oklahoma 42,168 Ohio 39,084 Virginia 29,943 Rhode Island 25,866 Louisiana 15,808 Mississippi 13,223 Kansas 12,734 Connecticut 11,968 Other 53,024 Total $ 11,926,942 |
 17 Non-Purchased Construction Loans with Interest Reserves We Have Aggressively Lowered Loan Leverage in Recent Years to Reduce Credit Risk *Assumes loans are fully advanced.
2010 2009 Loan to Value* (%) Loan to Cost* (%) 2010 2011 2012 2013 2014 2009 2011 2012 2013 2015 2015 2014 2016 2016 66 66 65 65 65 63 62 63 62 61 59 55 53 56 59 60 59 55 54 56 53 54 54 52 54 51 50 50 50 50 Q2 Q3 Q4 Q1 Q2 Q3 Q4 Q1 Q2 Q3 Q4 Q1 Q2 Q3 Q4 Q1 Q2 Q3 Q4 Q1 Q2 Q3 Q4 Q1 Q2 Q3 Q4 Q1 Q2 Q3 59 57 57 57 58 54 55 56 55 56 56 55 54 52 53 52 51 50 48 47 45 45 46 45 45 43 44 44 43 43 Q2 Q3 Q4 Q1 Q2 Q3 Q4 Q1 Q2 Q3 Q4 Q1 Q2 Q3 Q4 Q1 Q2 Q3 Q4 Q1 Q2 Q3 Q4 Q1 Q2 Q3 Q4 Q1 Q2 Q3 |
 18 2009 2010 2011 2012 2013 2014 2015 9/30/2016 53.1 54.7 57.0 58.2 62.7 72.9 79.0 81.8 Shift in Interest Rates (in bps) % Increase in Projected Baseline Net Interest Income** +100 2.5% +200 5.4% +300 8.4% +400 11.4% +500 14.4% *S&P Global Market Intelligence reporting for year-to-date 2016.
**Earnings simulation model’s projected impact of a change in
interest rates on the projected baseline net interest income for the 12- month period commencing October 1, 2016. Assumes parallel shifts in the yield curve and does not take into account changes in the
slope of the yield curve or the impact of any possible
future acquisitions. With our Net Interest Margin in the
96 th
percentile* of the
industry, we are well positioned if rates don’t change.
Rising Interest Rates will Benefit our Net Interest Income
We have taken actions to
protect our loan and investment
securities portfolios from a
possible negative interest rate
macroeconomic scenario.
• 93% of our variable rate loans have floors • Essentially all new variable rate loans are being originated with floors • 98.4% of our investment securities have fixed rates Variable Rate Portion of Total Non-Purchased Loans and Leases
Variable Rate %
We are well positioned to benefit from rising rates
We are well positioned even if
U.S. sovereign debt yields and
key indexes such as LIBOR go
negative. |
 19 A Proven Track Record of Growth: Organic Growth through Existing Offices – Substantial Capacity Exists Organic Growth through De Novo Branching
Acquisitions are “icing on the cake”
|
 20 $28 Million In 1979 $2.8 Billion In 2009 Organic Growth through De Novo Branching
A Proven Track Record of Growth
Organic Growth
continues to
be our #1
Growth Priority.
We expect future
acquisitions will also
be a meaningful
contributor to growth.
Through organic growth
and closing of our two
recent acquisitions
our total assets are
$18.5 Billion.
Augmented by Multiple Acquisitions since 2010
1. March 2010
Unity National Bank
GA FDIC-assisted 2. July 2010 Woodlands Bank SC, NC, GA, AL FDIC-assisted 3. September 2010 Horizon Bank FL FDIC-assisted 4. December 2010 Chestatee State Bank GA FDIC-assisted 5. January 2011 Oglethorpe Bank GA FDIC-assisted 6. April 2011 First Choice Community Bank GA FDIC-assisted 7. April 2011 Park Avenue Bank GA, FL FDIC-assisted 8. December 2012 The Citizens Bank AL Traditional M&A 9. July 2013 First National Bank of Shelby NC Traditional M&A 10. March 2014 OMNIBANK TX Traditional M&A 11. May 2014 Summit Bank AR Traditional M&A 12. February 2015 Intervest National Bank NY, FL Traditional M&A 13. August 2015 Bank of the Carolinas NC Traditional M&A 14. July 20, 2016 Community & Southern Bank GA, FL Traditional M&A 15. July 21, 2016 C1 Bank FL Traditional M&A |
 21 1.75B 145% Growth in 2014 1.35B 51% Growth in 2014 2.55B 64% Growth in 2015 Unfunded Balances of Closed Non-Purchased Loans Financial data ($ in billions) Non-Purchased Loans & Leases Organic Loan and Lease Growth is Always Growth Priority #1 Financial data ($ in billions) 2.84B 96% Growth in 2015 2.23B 34% Growth in 9M 2016 (not annualized) 2.33B 40% Growth in 9M 2016 (not annualized) Our exceptional execution delivers to our customers a compelling value proposition which has allowed us to achieve our substantial growth in recent years, while adhering to very conservative credit and leverage standards and receiving favorable pricing. This significant growth reflects: (i) growth in our customer base
and the share of business we are getting from many customers,
(ii) the fact that decreases in the bank’s loan to
cost ratio on projects results in several months later
funding on most projects and (iii) the fact that the
bank’s growth is allowing it to work on larger,
higher quality projects which have longer construction
cycles than smaller projects.
*Does not include $530 million of unfunded balances of closed purchased
loans. 12/31/2010
12/31/2011
12/31/2012
12/31/2013
12/31/2014
12/31/2015
9/30/2016
0.17B 0.31B 0.77B 1.21B 2.96B 5.80B 8.13B* 12/31/2010 12/31/2011 12/31/2012 12/31/2013 12/31/2014 12/31/2015 9/30/2016 1.85B 1.88B 2.12B 2.63B 3.98B 6.53B 8.76B |
 22 By 2018 we want to achieve approximately 57% of our growth in earning assets in CRE and 43% from non-CRE. With the increased capabilities we have developed organically and through acquisitions, we expect the non-CRE components of our earning assets to grow even faster. We expect to continue to grow our CRE lending through RESG and Community Bank Lending, and we expect the amount of growth to generally increase over time. 2016 We Have Multiple Engines for Growth in Earning Assets with Significant
Diversification Geographically and by Collateral Type
Growth Non-purchased loans and leases and investment portfolio ($ in millions) We have designed and strive to execute our business plan for each growth engine to achieve much better than
average yields with much lower than average risk.
2014 2015 (increased capabilities in direct consumer and small business lending as a result of Community & Southern Bank acquisition;
increased emphasis on SBA Lending, building on the
leadership acquired in the OMNIBANK acquisition; and increased emphasis
in poultry lending, building on the portfolio acquired in the Summit Bank acquisition) (expanding on the skill set and track record of our proven team from our traditional small ticket leasing to also include
aircraft, medical devices, materials handling and franchise finance) (experienced team acquired with Community & Southern Bank acquisition)
Q1 Q2 Q3 Q4 Q1 Q2 Q3 Q4 Q1 Q2 Q3 Cyclical Engines • Community Bank Lending $21 $55 $130 ($15) $99 $146 $186 $134 $135 $114 $60 • Leasing 7 6 11 6 11 11 11 <1> <7> <7> <2> • Consumer Indirect Marine & RV - - - - - - - - - - 89 Cyclical/Counter-Cyclical Engine • Real Estate Specialties Group 111 309 303 314 222 295 488 950 943 500 404 Counter-Cyclical Engines • Corporate Loan Specialties Group 7 22 25 35 <1> 4 <4> <2> <8> 16 <5> • Investment Portfolio 18 14 <24> <16> <55> <2> 2 <182> 26 196 106 |
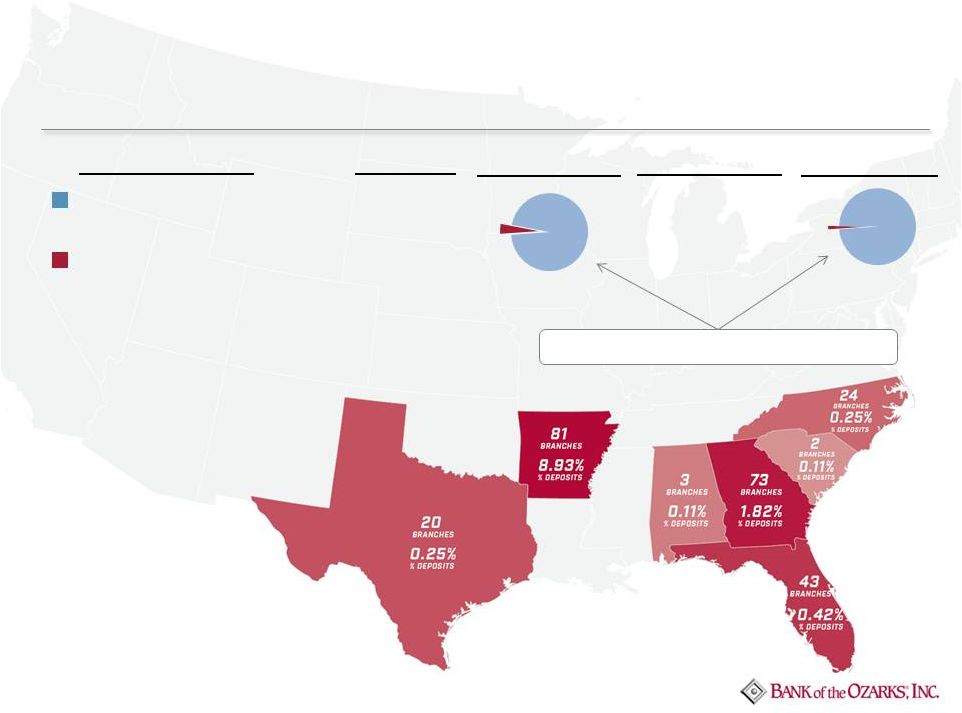 23 7 States*, 156 Cities # Branches All FDIC Financial Institutions as of June 30, 2016 5,956 Bank of the Ozarks as of June 30, 2016, proforma 246 % of Deposits** Untapped Deposit Growth Potential in Existing Markets (Branch count includes deposit-gathering branches only as of June 30, 2016;
adjusted to include deposit-gathering branches from recent
acquisitions.) *Deposits in our New York office and
deposits for all FDIC financial institutions in New York
are excluded from this analysis. **Data for all FDIC
Insured Institutions from the FDIC Annual Market Share
Report, last updated June 30, 2016. Data for Bank of the Ozarks as of
June 30, 2016, proforma to include July 20, 2016 and July
21, 2016 acquisitions. % of Branches**
Deposit Balance
$ 1,034B*
$ 14.4B*
Substantial capacity for future growth.
to include 7-20-2016 and 7-21-2016
acquisitions. 1.39
4.13 |
 24 A Potent Combination of Organic Growth and Acquisitions (Office count as of October 20, 2016; includes deposit-gathering branches and loan
production offices.)
We Now Have 255 Offices in Nine States |
 25 Maximizing Value of Our Extensive Branch Network Over the Next 12 – 18 Months Closing Duplicative Branches Growth in
Legacy Markets
Selected Expansion
with CRA focus
• Planned consolidation of 5 branches in cities in Northwest Georgia due to significant overlap with other locations • Average deposits of $18.5 million per branch to be closed • Other branch locations within less than 2 miles on average • Minimal staff reduction • Due to the profile of the branches, we expect minimal disruption to customer service • Strategically compelling opportunities to fill in existing branch footprints • 3 offices in Northwest Arkansas originally planned before the Great Recession expanding our Arkansas presence o 2 opened in 2Q16 o 1 opened in 4Q16 • 1 office in McKinney, TX, in an area that has experienced recent significant growth o Expected to open 2Q17 Additionally, we will continue to analyze the strategic opportunities associated with opening branches in markets
currently served by our national lending platform, which we have
referred to as de novo 2.0. We anticipate opening one or more of these branches in 2017 and/or 2018. • Significant commitment to enhancing service to low-to- moderate income census tracts and majority / minority census tracts and their customers • Current expansion plans for existing MSAs include: o 2 branches in Dallas County, TX o 2 branches in Tarrant County, TX o 2-4 branches in central Atlanta MSA • Expected to enhance CRA performance and profitability |
 26 2010 2011 2012 2013 2014 2015 9/30/2016 4,347 3,239 6,478 7,218 9,370 12,232 11,299 Organic Growth in Core Checking Accounts Net Growth in Number of Core Checking Accounts Excluding Accounts Acquired from Acquisitions 9M 2016 core checking account growth suggests another record year Deposit Growth Priority #1 |
 27 Well Capitalized with Ample Sources of Liquidity |
 28 Ratios at 9-30-16 OZRK Current Minimum Capital Required – Basel III Minimum Capital Required – Basel III Fully Phased-In (1-1-19) Common equity tier 1 to risk-weighted assets: 10.15% 5.125% 7.00% Tier 1 capital to risk-weighted assets: 10.15% 6.625% 8.50% Total capital to risk-weighted assets: 12.23% 8.625% 10.50% Tier 1 leverage to average assets: 12.53% 4.00% 4.00% Strong Capital Position |
 29 Abundant Sources of Secondary Liquidity FHLB Borrowing Availability $5,296,628,467 Unsecured Lines of Credit 230,000,000 Investments Available for Secured Lines of Credit 565,189,993 Fed Funds Available through Fed Discount Window 154,455,959 Total as of 9-30-2016 $ 6,246,274,419 * Approximate * Updated as of 11-15-16 to reflect increased borrowing capacity from FHLB.
(1) (1) (1) |
 30 |
 31 YTD 2016 Financial Highlights: (as of 9-30-16) • Net Income of $182.2 million • Net Interest Income of $406.7 million • Some of our Best Asset Quality Ratios as a Public Company including:
o Record 0.08% Ratio of Nonperforming Loans and Leases as a Percent of
Total Loans and Leases
o Record 0.17% Ratio of Loans and Leases Past Due 30 Days or more
including Past Due Non-Accrual Loans and Leases
to Total Loans and
Leases
• $2.23 Billion Growth in Non-Purchased Loans and Leases • $2.33 Billion Growth in the Unfunded Balance of Closed Loans • 4.88% Net Interest Margin • 36.6% Efficiency Ratio • 11,299 Net New Core Checking Accounts |
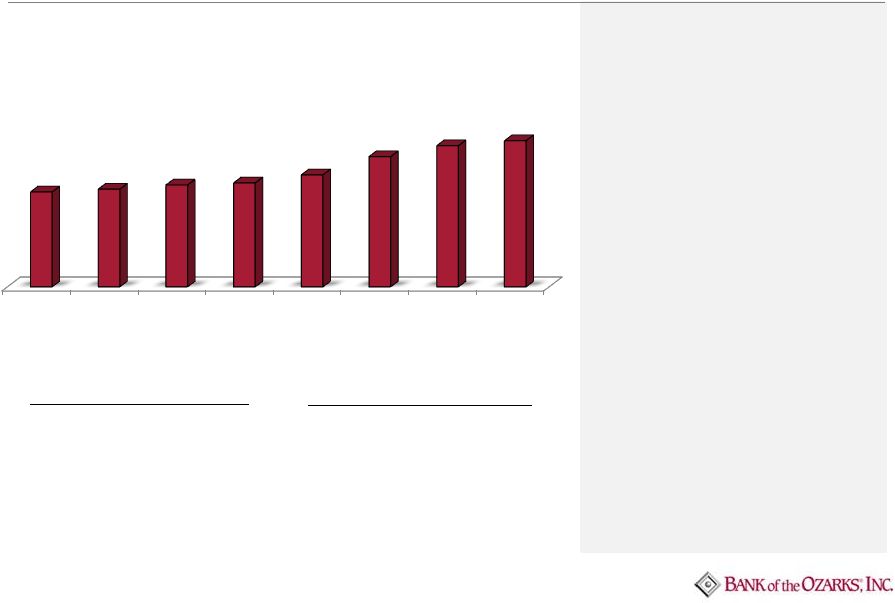
 32 Building Capital for Shareholders †Calculation of the Company’s tangible book value per common share, including the reconciliation to the most directly
comparable GAAP financial measures are included in the table at the end of this presentation. Management believes presentation of these non-GAAP financial measures provides useful supplemental information
that contributes to a proper understanding of the
financial results and capital levels of the
Company. a
Issued 847,232 shares in Genala
transaction which added $0.11 to tangible book value per common share.
b
Issued 2,514,770 shares in FNB Shelby transaction which added $0.50 to
tangible book value per common share. c
Issued 5,765,846 shares in Summit transaction which added $0.35 to
tangible book value per common share. d
Issued 8,084,863 shares in Intervest and Bank of the Carolinas
transactions, which added $1.90 to tangible book value per common share; and issued 2,098,436 shares in a follow-on offering, which added $0.90 to tangible book value per common share. e Issued 30,354,402 shares in Community & Southern and C1 transactions, which added $0.75 to tangible book value per common
share. 12/31/2006
12/31/2007
12/31/2008
12/31/2009
12/31/2010
12/31/2011
12/31/2012
12/31/2013
12/31/2014
12/31/2015
9/30/2016
Tangible Book Value
per Common
Share† $2.52
$2.75
$3.66 $3.90 $4.58 $5.98 $7.03 $8.27 $10.04 $14.48 $16.79 Annual Growth Rate 9.13% 33.09% 6.56% 17.44% 30.57% 17.56% 17.64% 21.40% 44.22% YTD Growth Rate Not Annualized 15.95% 566% increase in tangible book value per common share in 9 3/4 years, resulting in a compounded annual growth rate of 21.5% c d e b a |
 33 Solid Returns for Shareholders • Increased our cash dividend in each of the last 25 quarters • Cash dividends increased every year since going public • Four 2-for-1 stock splits since going public in July 1997
• June 17, 2002 • December 10, 2003 • August 16, 2011 • June 23, 2014 |
 34 Bank of the Ozarks S&P 400 Mid Cap Index NASDAQ Financial Index Beating the Indexes |
 35 *Represents ending balances, as determined in accordance with accounting principles generally accepted in the U.S., ending shares outstanding and tangible book value per share as of the date indicated. **Intangible assets consist of core deposit and bank charter intangible and goodwill.
<1> Includes $14,123,000 of common stockholders' equity and
$1,460,000 of bargain purchase gain. <2> Includes
$60,079,000 of common stockholders' equity and $5,163,000 of tax-exempt bargain purchase gain. Financial data in thousands, except per share amounts. Non-GAAP Reconciliation Calculation of Tangible Book Value Per Common Share
Common Stock
Without
Pro Forma
12/31/2015
Issuance
Common Stock Issuance
6/30/2016
CSB & C1
with CSB & C1
9/30/2016
Common Stockholders' Equity
1,464,631
$
(110,000)
$
1,354,631
$
1,556,921 $ 1,136,340 $ 2,693,261 $ 2,756,346 $ Less: Intangible Assets ** (152,340) (152,340) (149,904) (574,845) (724,749) (722,153)
Tangible Common Stockholders'
Equity 1,312,291
$
(110,000)
$
1,202,291
$
1,407,017 $ 561,495 $ 1,968,512 $ 2,034,193 $ Ending Shares 90,612 (2,098)
88,514
90,745 30,355
121,100
121,134
Tangible Book Value Per Share
* 14.48
$
13.58
$
15.51 $
16.26
$
16.79
$
Difference
0.90
$
Difference 0.75 $
Pro Forma
Pro Forma
Pro Forma
12/31/2013
3/31/2014
Summit
with Summit
12/31/2014
12/31/2014
Intervest
with Intervest
6/30/2015
Carolinas
with Carolinas
Common Stockholders' Equity
629,060
$
653,208
$
166,402
$
819,610
$
908,390
$
908,390
$
238,476
$
1,146,866
$
1,209,254
$
65,389
$
1,274,643
$
Less: Intangible Assets
** (19,158)
(20,993)
(88,766)
(109,759)
(105,576)
(105,576)
(46,595)
(152,171)
(151,150)
(7,617)
(158,767)
Tangible Common
Stockholders' Equity 609,902
$
632,215
$
77,636
$
709,851
$
802,814
$
802,814
$
191,881
$
994,695
$
1,058,104
$
57,772
$
1,115,876
$
Ending Shares
73,712
73,888
5,766
79,654
79,924
79,924
6,637
86,561
86,811
1,448
88,259
Tangible Book Value Per Share *
8.27
$
8.56
$
8.91
$
10.04
$
10.04
$
11.49
$
12.19
$
12.64
$
Difference
0.35
$
Difference
1.45
$
Difference
0.45
$
Without Pro Forma 12/31/2006 12/31/2007 12/31/2008 12/31/2009 12/31/2010 12/31/2011 12/31/2012 Genala Genala 6/30/2013 Shelby with Shelby Common Stockholders' Equity 174,633 $ 190,829 $ 252,302 $ 269,028 $ 320,355 $ 424,551 $ 507,664 $ (15,583) $ <1> 492,081 $ 531,125 $ 65,242 $
<2>
596,367
$
Less: Intangible Assets **
(6,140)
(5,877)
(5,664)
(5,554)
(7,925)
(12,207)
(11,827)
1,656
(10,171)
(10,690)
(10,136)
(20,826)
Tangible Common Stockholders'
Equity 168,493
$
184,952
$
246,638
$
263,474
$
312,430
$
412,344
$
495,837
$
(13,927)
$
481,910
$
520,435
$
55,106
$
575,541
$
Ending Shares
66,986
67,272
67,456
67,618
68,214
68,928
70,544
(848)
69,696
70,876
2,515
73,391
Tangible Book Value Per Share
* 2.52
$
2.75
$
3.66
$
3.90
$
4.58
$
5.98
$
7.03
$
6.92
$
7.34
$
7.84
$
Difference
0.11
$
Difference
0.50
$
|
 36 Non-GAAP Reconciliation Calculation of Annualized Return on Average Tangible Common Stockholders' Equity
Nine Months Ended
12/31/2008
12/31/2009
12/31/2010
12/31/2011
12/31/2012
12/31/2013
12/31/2014
12/31/2015
9/30/2016
Net Income Available To Common Stockholders
34,474
$
36,826
$
64,001
$
101,321
$
77,044
$
91,237
$
118,606
$
182,253
$
182,193
$
Average Common
Stockholders' Equity Before Noncontrolling
Interest 213,271
$
267,768
$
296,035
$
374,664
$
458,595
$
560,351
$
786,430
$
1,217,475
$
1,833,933
$
Less Average Intangible
Assets: Goodwill
(5,231)
(5,243)
(5,243)
(5,243)
(5,243)
(5,243)
(51,793)
(118,013)
(264,306)
Core Deposit, Bank Charter and Intellectual
Property Intangibles, Net Of Accumulated
Amortization (515)
(368)
(1,621)
(5,932)
(5,989)
(9,661)
(21,651)
(28,660)
(36,844)
Total Average Intangibles
(5,746)
(5,611)
(6,864)
(11,175)
(11,232)
(14,904)
(73,444)
(146,673)
(301,150)
Average Tangible Common Stockholders'
Equity 207,525
$
262,157
$
289,171
$
363,489
$
447,363
$
545,447
$
712,986
$
1,070,802
$
1,532,783
$
Return On Average Common
Stockholders' Equity 16.16%
13.75%
21.62%
27.04%
16.80%
16.28%
15.08%
14.97%
13.27%
Return On Average Tangible Common Stockholders'
Equity 16.61%
14.05%
22.13%
27.87%
17.22%
16.73%
16.63%
17.02%
15.88%
Financial data in thousands, except per share
amounts. Years Ended
|
 |