Attached files
| file | filename |
|---|---|
| 8-K - 8-K - Summit Materials, Inc. | a16-21568_18k.htm |
Exhibit 99.1
Local Performance Through the Cycle Summit Materials Investor Day November 15, 2016
Legal Disclaimer Forward-Looking Statements This presentation contains “forward-looking statements” within the meaning of the federal securities laws, which involve risks and uncertainties. Forward-looking statements include all statements that do not relate solely to historical or current facts, and you can identify forward-looking statements because they contain words such as “believes,” “expects,” “may,” “will,” “should,” “seeks,” “intends,” “trends,” “plans,” “estimates,” “projects” or “anticipates” or similar expressions that concern our strategy, plans, expectations or intentions. Any and all statements made relating to the macroeconomic outlook for our markets, potential acquisition activity, our estimated and projected earnings, margins, costs, price, expenditures, cash flows, sales volumes and financial results are forward-looking statements. These forward-looking statements are subject to risks and uncertainties that may change at any time, and, therefore, our actual results may differ materially from those expected. We derive many of our forward-looking statements from our operating budgets and forecasts, which are based upon many detailed assumptions. While we believe that our assumptions are reasonable, it is very difficult to predict the impact of known factors, and, of course, it is impossible to anticipate all factors that could affect our actual results. In light of the significant uncertainties inherent in the forward-looking statements included herein, the inclusion of such information should not be regarded as a representation by us or any other person that the results or conditions described in such statements or our objectives and plans will be achieved. Important factors could affect our results and could cause results to differ materially from those expressed in our forward-looking statements, including but not limited to the factors discussed in the section entitled “Risk Factors” in our Annual Report on Form 10-K filed with the SEC on February 22, 2016. Such factors may be updated from time to time in our periodic filings with the SEC, which are accessible on the SEC’s website at www.sec.gov. We undertake no obligation to publicly update or revise any forward-looking statement as a result of new information, future events or otherwise, except as otherwise required by law. Non-GAAP Financial Measures Included in this presentation are certain non-GAAP financial measures, such as Adjusted EBITDA, Further Adjusted EBITDA, Adjusted EPS, Gross Profit, Net Debt, and Free Cash Flow designed to complement the financial information presented in accordance with U.S. GAAP because management believes such measures are useful to investors. These non-GAAP financial measures should be considered only as supplemental to, and not superior to, financial measures provided in accordance with GAAP. Please refer to the appendix of this presentation for a reconciliation of the historical non-GAAP financial measures included in this presentation to the most directly comparable financial measures prepared in accordance with GAAP. Because GAAP financial measures on a forward-looking basis are not accessible, and reconciling information is not available without unreasonable effort, we have not provided reconciliations for forward-looking non-GAAP measures. For the same reasons we are unable to address the probable significance of the unavailable information, which could be material to future results 1
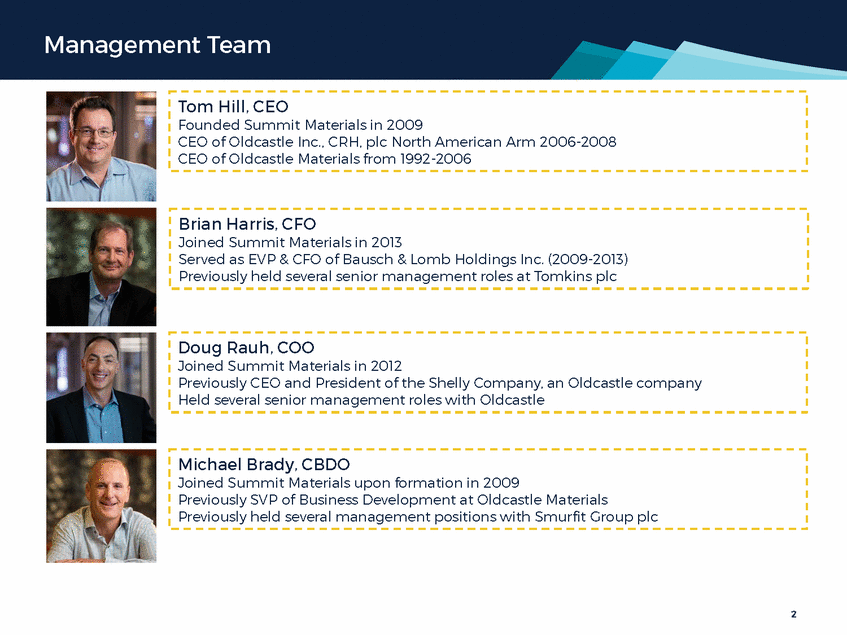
Management Team 2 Michael Brady, CBDO Joined Summit Materials upon formation in 2009 Previously SVP of Business Development at Oldcastle Materials Previously held several management positions with Smurfit Group plc Doug Rauh, COO Joined Summit Materials in 2012 Previously CEO and President of the Shelly Company, an Oldcastle company Held several senior management roles with Oldcastle Brian Harris, CFO Joined Summit Materials in 2013 Served as EVP & CFO of Bausch & Lomb Holdings Inc. (2009-2013) Previously held several senior management roles at Tomkins plc Tom Hill, CEO Founded Summit Materials in 2009 CEO of Oldcastle Inc., CRH, plc North American Arm 2006-2008 CEO of Oldcastle Materials from 1992-2006
Management Team Robert Hall President, Founder RK Hall Construction Gary Hamm President Hamm Companies Bryan Kalbfleisch President Alleyton Resource Alan Barnes President ConAgg of MO Jason Kilgore President, Founder Kilgore Companies Ab Boxley President Boxley Materials 3 OpCo Presidents Tom Beck Cement Shane Evans West Damian Murphy East Experienced Regional Management
Investment Thesis Summit Today Unique Operating Model The Road Ahead Texas 4
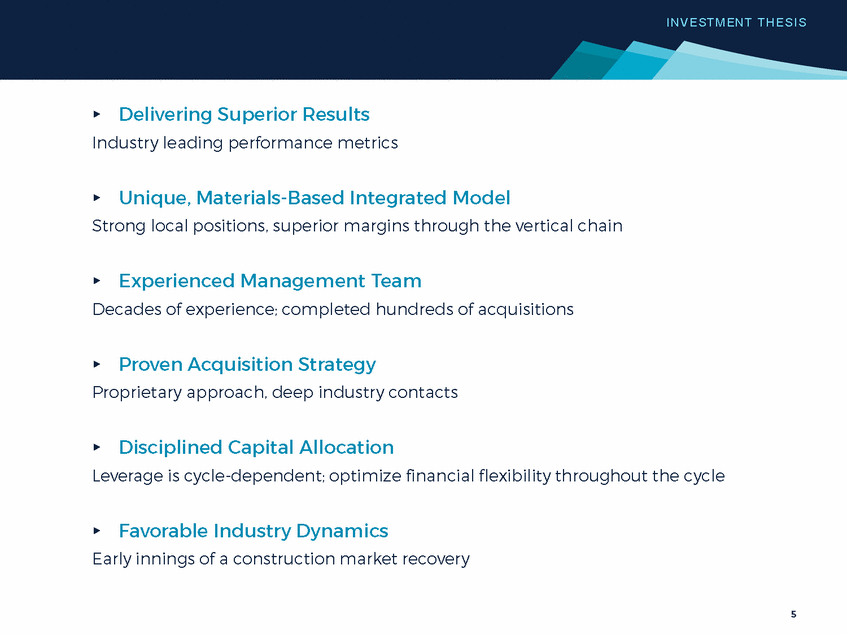
I N VEST M EN T T H ESI S ▸ Delivering Superior Results Industry leading performance metrics ▸ Unique, Materials-Based Integrated Model Strong local positions, superior margins through the vertical chain ▸ Experienced Management Team Decades of experience; completed hundreds of acquisitions ▸ Proven Acquisition Strategy Proprietary approach, deep industry contacts ▸ Disciplined Capital Allocation Leverage is cycle-dependent; optimize financial flexibility throughout the cycle ▸ Favorable Industry Dynamics Early innings of a construction market recovery 5
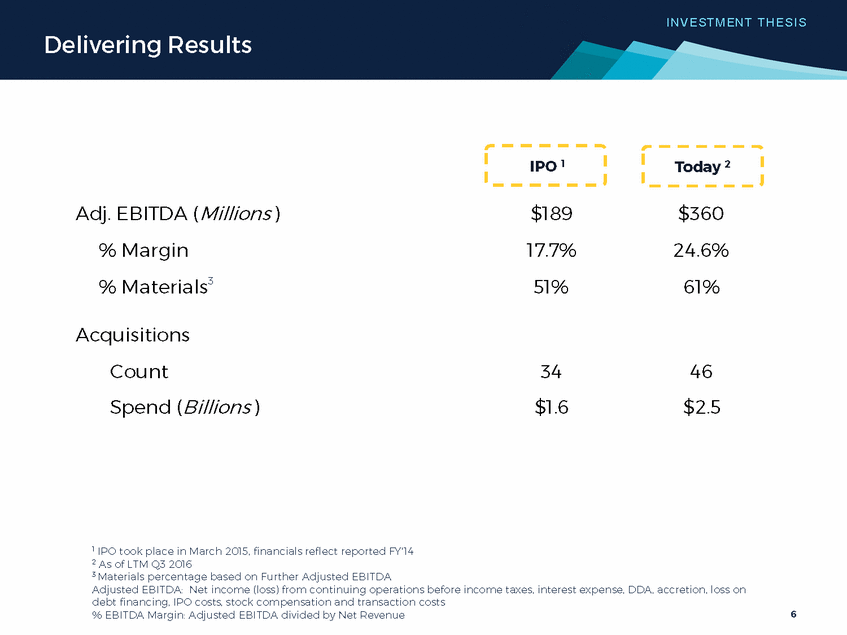
I N VEST M EN T T H ESI S Delivering Results IPO 1 Today 2 Adj. EBITDA (Millions ) % Margin % Materials3 $189 17.7% 51% $360 24.6% 61% Acquisitions Count Spend (Billions ) 34 $1.6 46 $2.5 1 IPO took place in March 2015, financials reflect reported FY'14 2 As of LTM Q3 2016 3 Materials percentage based on Further Adjusted EBITDA Adjusted EBITDA: Net income (loss) from continuing operations before income taxes, interest expense, DDA, accretion, loss on debt financing, IPO costs, stock compensation and transaction costs % EBITDA Margin: Adjusted EBITDA divided by Net Revenue 6
I N VEST M EN T T H ESI S Delivering Results Millions Aggregate Volume (tons) Net Revenue $1,460 36 2013 2014 2015 LTM Q3'16 2013 2014 2015 LTM Q3'16 Gross Profit 1 & Margin Adj. EBITDA & Margin 34% 25% 30% 22% 29% $536 $360 25% 18% 2013 2014 2015 LTM Q3'16 2013 2014 2015 LTM Q3'16 Margin Margin Per reported filings Margin defined as metric divided by Net Revenue 1 Gross Profit equals Net Revenue, less costs of goods sold and royalties 7 16%$288 $189 $130 $442 $317 $239 $1,290 $1,071 $824 32 25 17
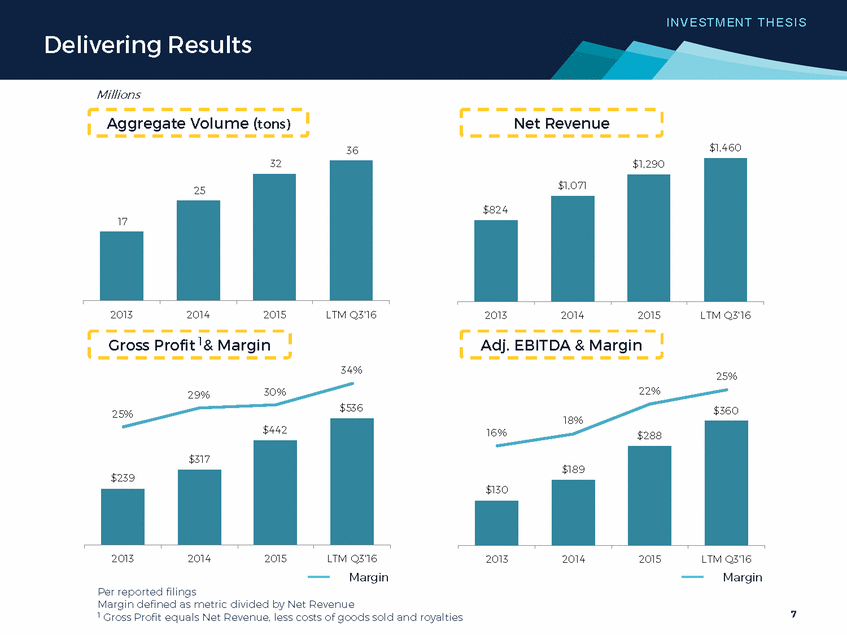
KILGORE ( 0 '-1 P A N ( S CONTINENTA). CEMENT trONHA LL L Troy Vines,Inc. Mainland Sand & Graven STAUCTION. A.L.L....E. .YTON BOXLEY PURCHASINCi Scale Benefits ACiCiRECiATES Productivity Cost Efficiencies PRICINCi Optimization Methodologies EQUIPMENT R&M Fleet Management Core & Customizable Systems Data-Driven Decisions IT FRAMEWORK 8 Maintain Benefits of Local with Economies of Scale
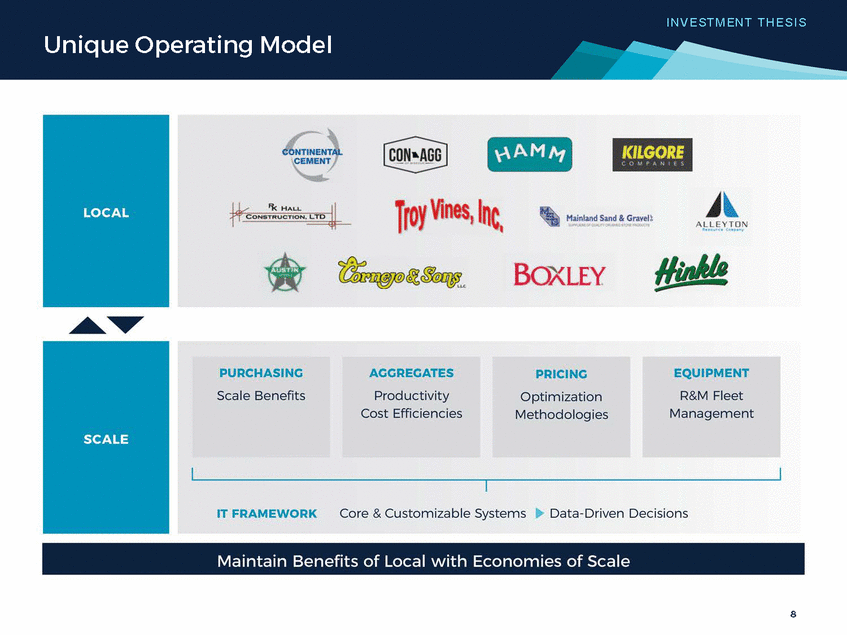
I N VEST M EN T T H ESI S Unique Operating Model Gross Profit Per Unit 1 Cement Aggregates 8% CAGR 11% CAGR $52.22 Materials $4.52 2013 LTM Q3'16 2013 LTM Q3'16 Asphalt 2 Ready Mix $15.14 $27.83 7% Products 2013 LTM Q3'16 2013 LTM Q3'16 Local Operating Model Drives Superior Margins 2013 data presented on a reported basis, LTM Q3’16 calculated per reported filings Gross profit equals net revenue, less costs of goods sold and royalties 1 Cement performance reflects Cement segment on a successor basis, which includes earnings associated with the processing of hazardous and non-hazardous waste, which is processed into fuel and used in the cement plants 2 Includes liquid asphalt terminal gross profit 9 $23.22CAGR 27% $7.82 CAGR $3.42 $42.63
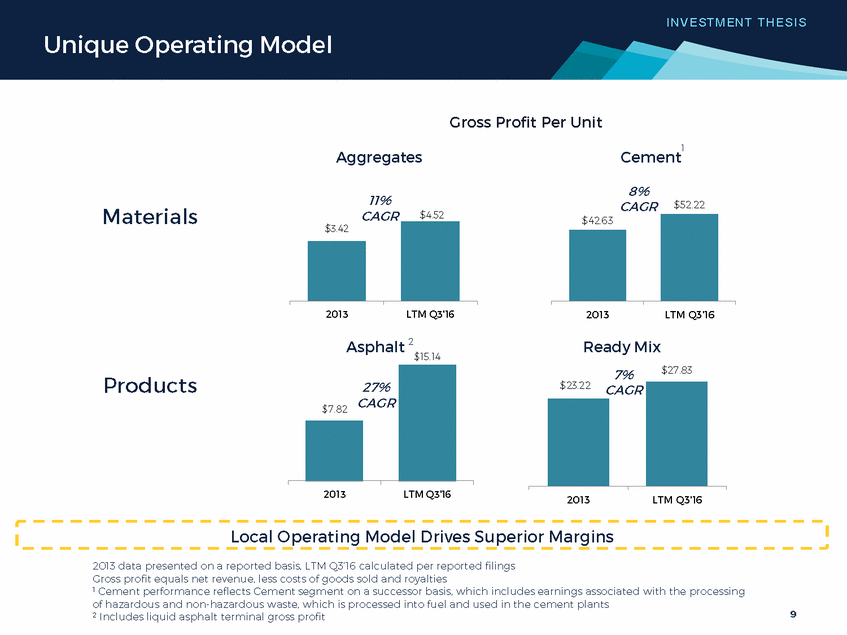
I N VEST M EN T T H ESI S Acquisitions 9 Bolt-Ons Davenport Cement Platform Value Added IPO 51% ay IPO '15-'16 DealsToday 1 Materials percentage based on Further Adjusted EBITDA 10 $2.5 $1.6 $0.9 Acquisition Spend (Billions) Materials EBITDA Contribution1 2015 & 2016 Deals
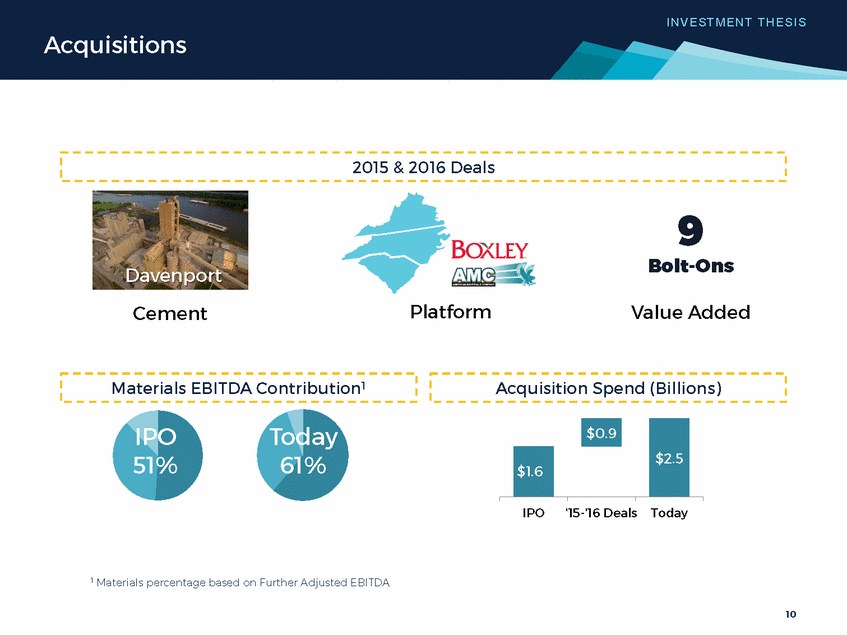
I N VEST M EN T T H ESI S Valuation Adjusted EBITDA Net Revenue Performance Metrics ’14-’16E CAGR 18% 39% TEV / EBITDA 19.4x FCF Yield % Valuation Metrics IPO 51% 6.2% 9.4x 8.4x ’16E ’17E ’18E ’16E ’17E ’18E ’16E ’17E ’18E ’16E ’17E ’16E ’17E ’16E ’17E Projected/estimated figures (denoted with “E”) reflect Factset consensus estimates as of 11/11/16 with exception of ’16 FCF for Summit which is sourced from Nasdaq, all other figures calculated from public filings 11 0.7% 2.5%2.7% 1.4% 1.5% 16.5x 15.2x 10.9x 13.8x 12.7x 12.0x 30% 30% 10%10%
Investment Thesis Summit Today Unique Operating Model The Road Ahead Texas 12
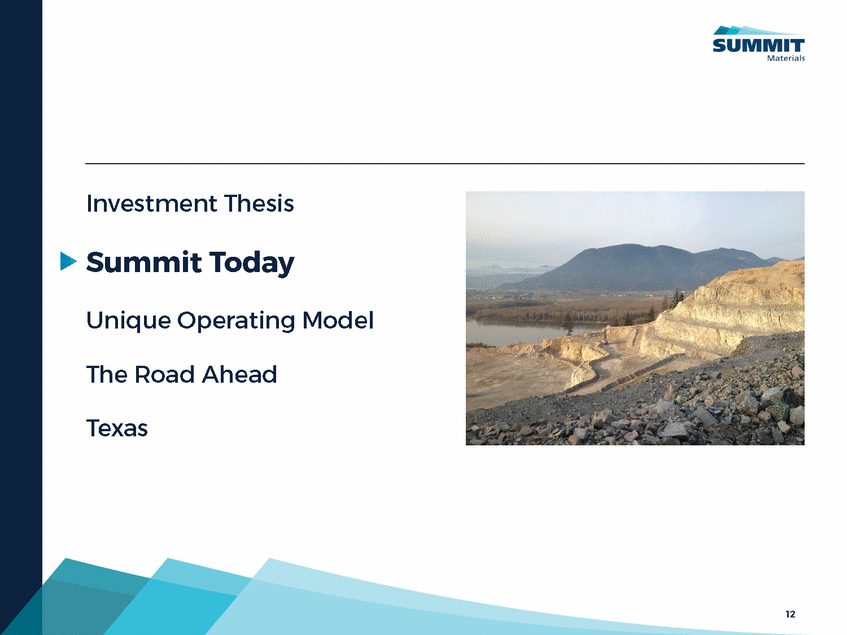
S U MMIT T O D AY Passion for Safety Lost-Time Incident Rate (LTIR) 1.58 1.48 1.47 1.46 1.45 1.36 2010 2011 2012 2013 2014 2015 YTD Q3'16 1 2 Summit Industry 1 Summit data presented on a successor basis 2 Source: MSHA, Aggregate Mine Lost-Time Injury Rate – reported injuries per 200,000 hours worked (excludes coal mines) 13 0.72 0.54 0.33 0.29 0.19 0.42 0.13
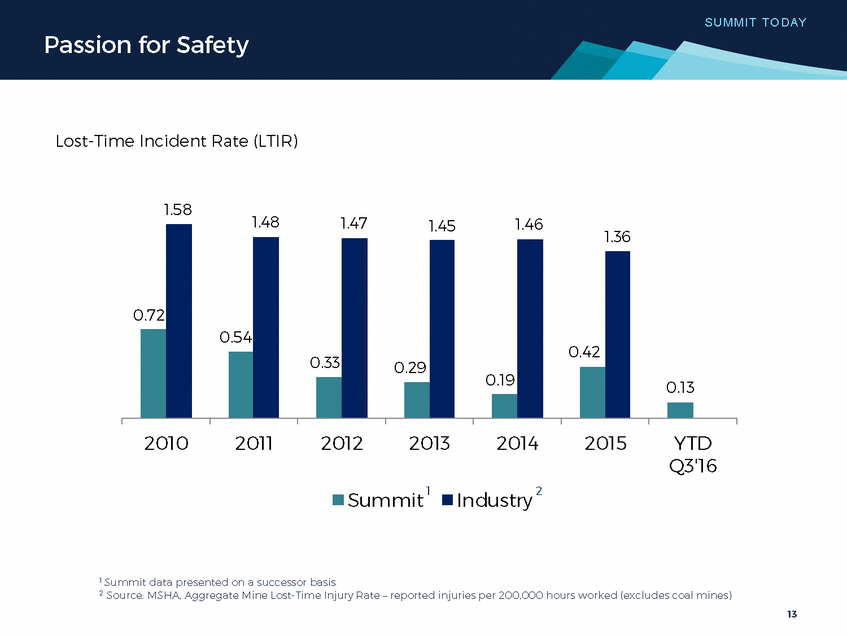
S U MMIT T O D AY Building Scale 1 Pro forma for full-year ownership of all acquisitions closed at YE 2009 14 Volume in millions 1 Aggregate Tons 2.1 Cement Tons - Asphalt Tons 0.2 Ready Mix Concrete CY-
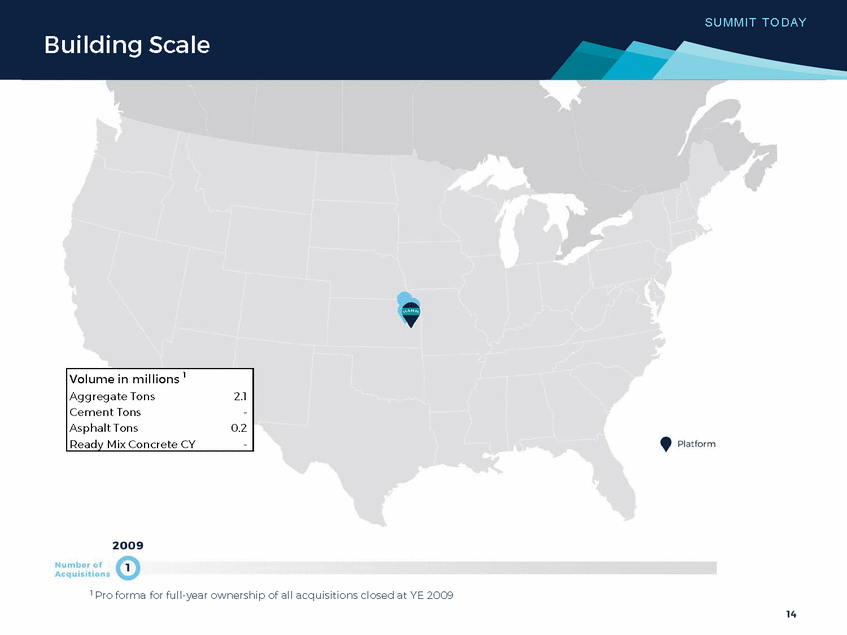
S U MMIT T O D AY Building Scale 1 1 LTM Q3 ’16 pro forma for full-year ownership of all acquisitions closed to date; , includes Midland Concrete 15 Volume in millions 1 Aggregate Tons 38.0 Cement Tons 2.4 Asphalt Tons 4.4 Ready Mix Concrete CY4.2
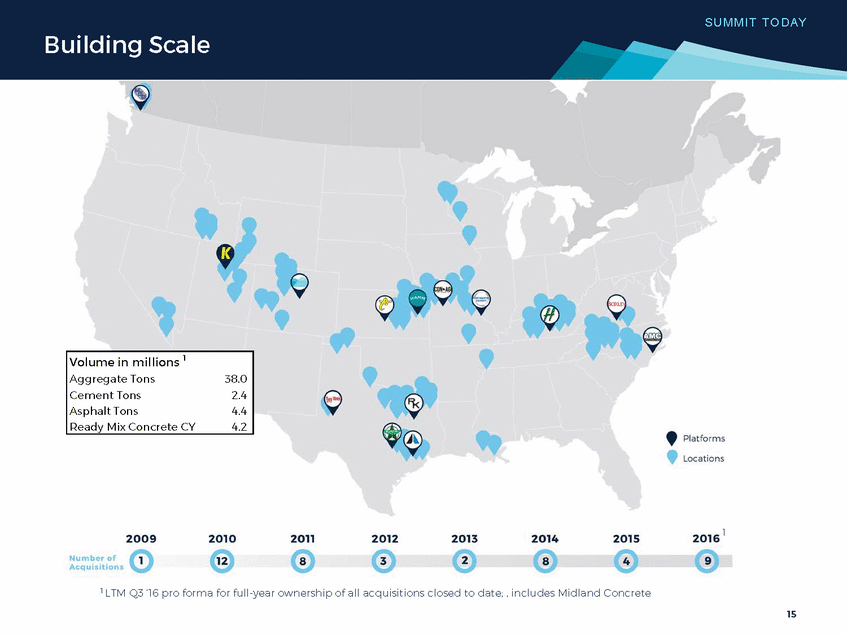
SUM ACQUIRES DAVENPORT CONTINENTAL FAMILY-OWNED LAFARCE & HOLCIM ..,. ..,. New plant Post-crisis difficulties ..,. Merger announced 0 0 0 0 0 SUM IPO ..,. Continental lOG% owned SUMMIT ACQUIRES 80% ..,.Relationship-based deal ..,.Market slow to recover 16
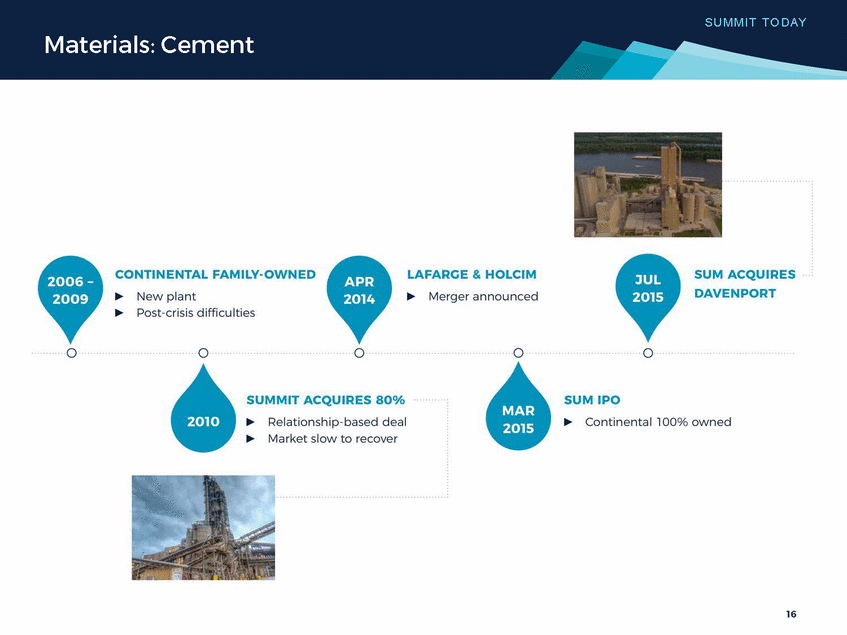
S U MMIT T O D AY Materials: Cement 2 cement plants ▸ Davenport, IA ▸ Hannibal, MO Extensive distribution network ▸ ▸ 9 terminal locations; 230K tons of storage Minneapolis to New Orleans ▸ Truck, barge, rail ~2.4M short tons of capacity ▸ ▸ 0.5B tons reserves >100 years average life Gulf Coast import capabilities 17
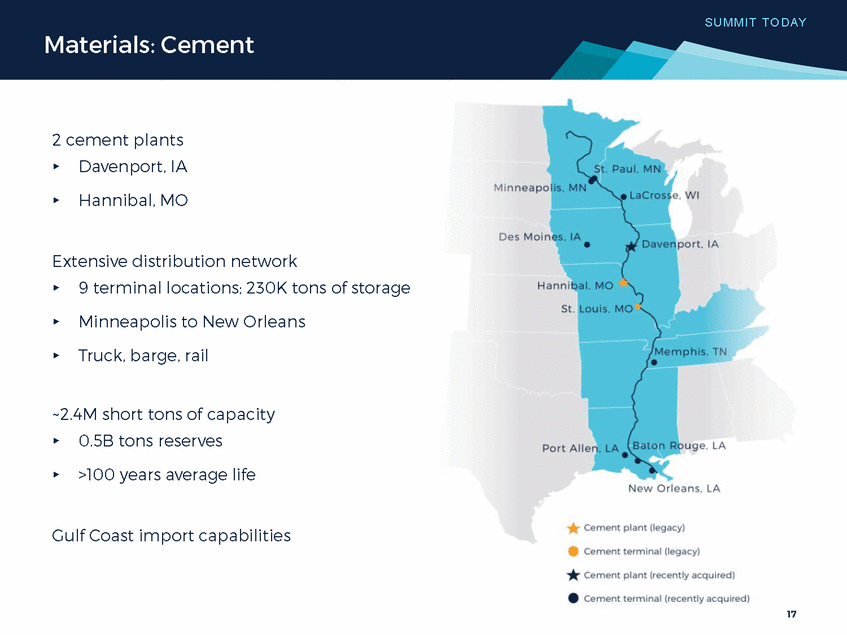
S U MMIT T O D AY Materials: Cement Cement Demand Expected to Outpace Domestic Supply by 2019 150 126 126 120 125 121 115 110 105 99 100 95 84 79 79 78 75 50 25 - - - 2002A 2004A Public 2006A Residential 2008A 2010A 2012A 2014E 2016E 2018E 2020E Non-Residential Other Total Cement Capacity Source: USGS, PCA 18 (Millions Short Tons) 141 141 134 129 107 1 4 12 13 26 12 24 11 23 22 21 88 39 36 34 32 30 48 46 45 44 42
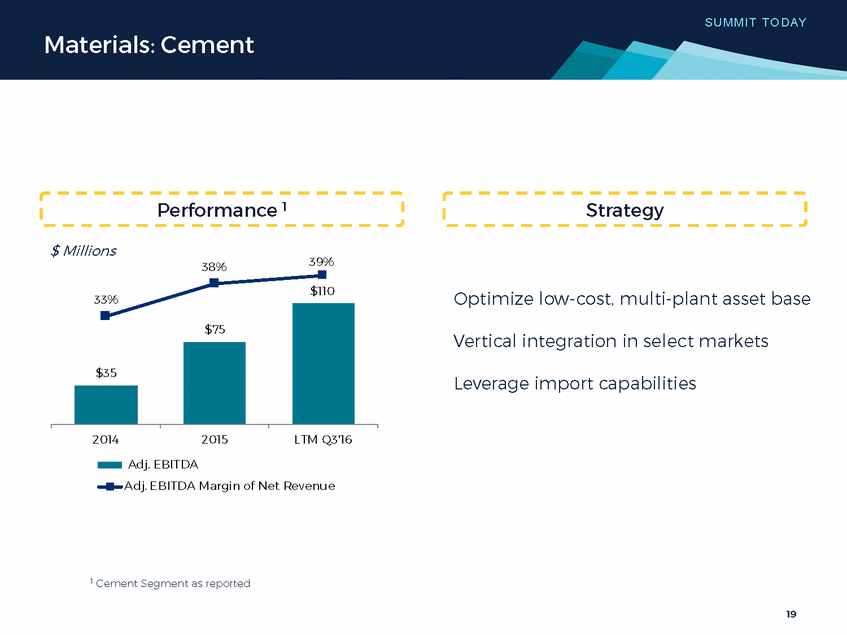
S U MMIT T O D AY Materials: Cement Performance 1 Strategy $ Millions 39% 38% $110 Optimize low-cost, multi-plant asset base 33% Vertical integration in select markets Leverage import capabilities 2014 2015 LTM Q3'16 Adj. EBITDA Adj. EBITDA Margin of Net Revenue 1 Cement Segment as reported 19 $75 $35
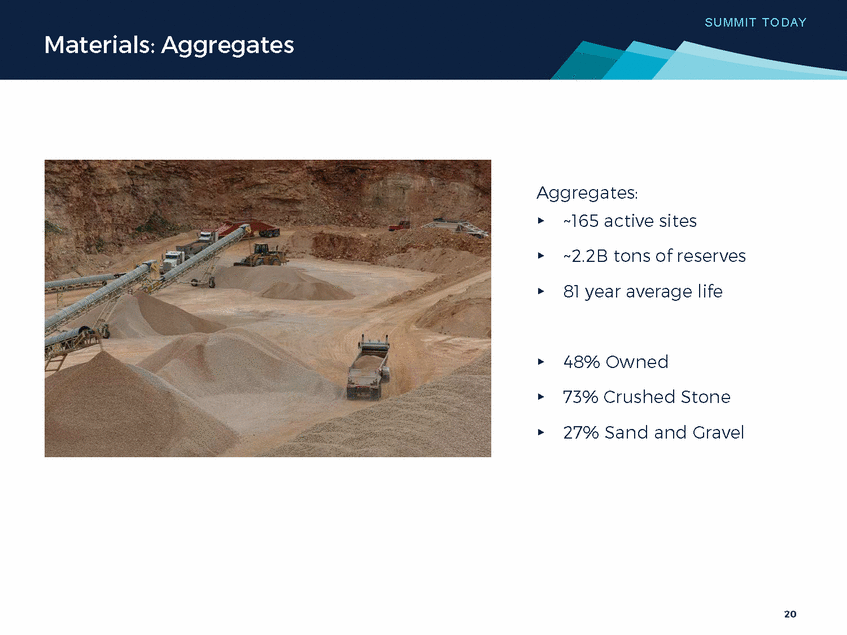
S U MMIT T O D AY Materials: Aggregates Aggregates: ▸ ▸ ▸ ~165 active sites ~2.2B tons of reserves 81 year average life ▸ ▸ ▸ 48% Owned 73% Crushed Stone 27% Sand and Gravel 20
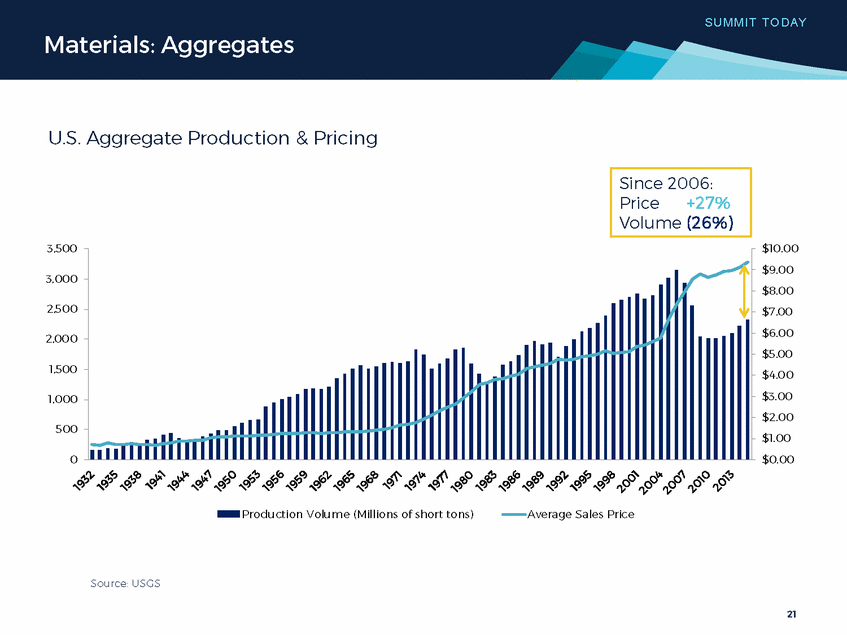
S U MMIT T O D AY Materials: Aggregates U.S. Aggregate Production & Pricing 3,500 $10.00 $9.00 $8.00 $7.00 $6.00 $5.00 $4.0 0 $3.00 $2.00 $1.00 $0.00 3,000 2,500 2,00 0 1,500 1,000 500 0 Production Volume (Millio ns of short to ns) Average Sales Price Source: USGS 21 Since 2006: Price +27% Volume (26%)
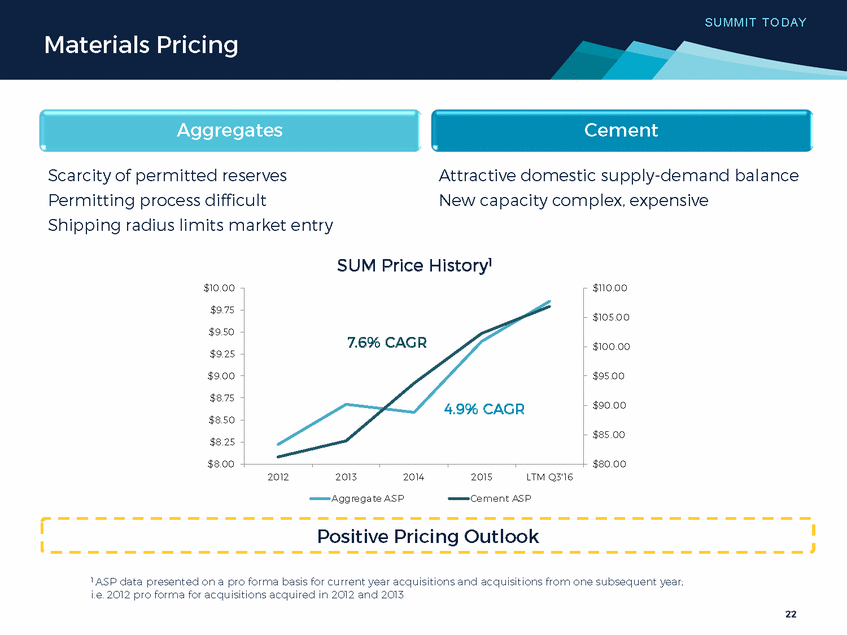
S U MMIT T O D AY Materials Pricing Aggregates Cement Scarcity of permitted reserves Permitting process difficult Shipping radius limits market entry Attractive domestic supply-demand balance New capacity complex, expensive SUM Price History1 $10.00 $110.00 $9.75 $105.0 0 $9.50 $100.00 $9.25 $9.00 $95.00 $8.75 $90.00 $8.50 $85.00 $8.25 $8.00 $80.00 2012 2013 2014 2015 LTM Q3'16 Aggregate ASP Cement ASP Positive Pricing Outlook 1 ASP data presented on a pro forma basis for current year acquisitions and acquisitions from one subsequent year; i.e. 2012 pro forma for acquisitions acquired in 2012 and 2013 22 7.6% CAGR 4.9% CAGR
S U MMIT T O D AY Local Markets 1 Market Characteristics Ultimate local business Platform Location Position Market evaluation: ▸ ▸ ▸ ▸ Materials-based position Competitive dynamics End market trends Barriers to entry ▸ ▸ ▸ ▸ Geology Permitting Capital requirements Scale ▸ Growth opportunities 1 Company reports and management estimates 23 Well-Positioned in Our Local Markets West Salt Lake City, UTTop 3 Vancouver, BC 1 West Houston, TX1 Austin, TXTop 3 Midland/Odessa, TXTop 2 North TX1 East Northeast KS1 Columbia, MO 1 Wichita, KSTop 2 Central KYTop 3 West-Central VA 1 Cement Mississippi River Top 3
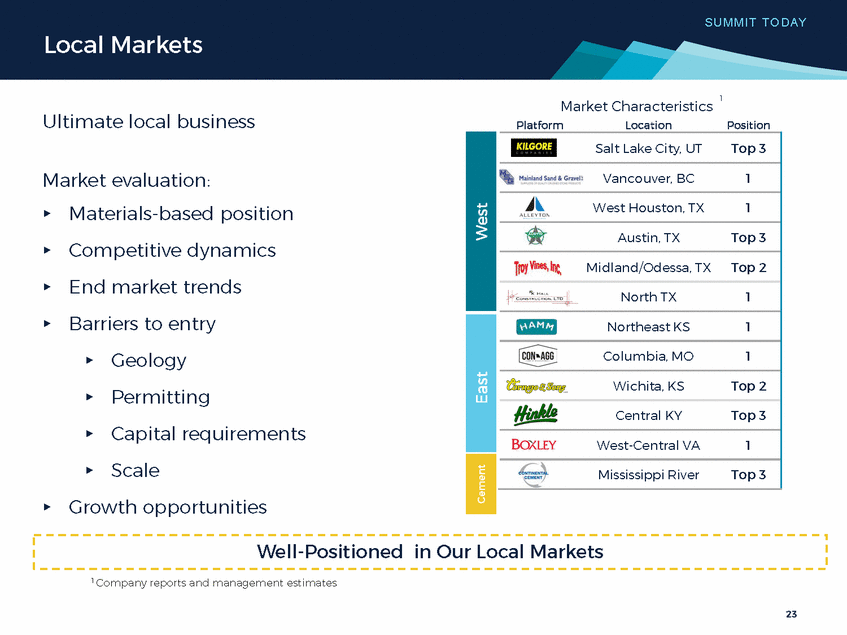
5%, ] 1 34% ···... 1 Portion of total LTM Q3'16 Further Adjusted EBITDA asphalt EBITDA includes earnings associated with liquid asphalt terminals 24 Disciplined Margin Capture at Each Stage of the Vertical PRODUCTS MATERIALS
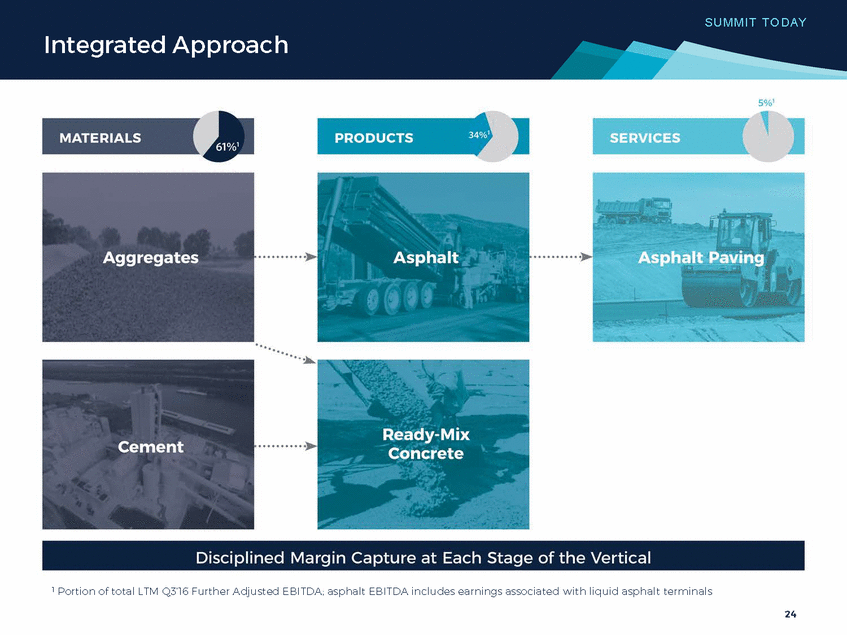
S U MMIT T O D AY Integrated Approach Downstream characteristics Fast-moving dynamic businesses ▸ Same day: order, produce, ship Local decision-making critical ▸ ▸ ▸ Complex pricing structure Multiple products Time sensitive supply Downstream Requires Local Decisions 25
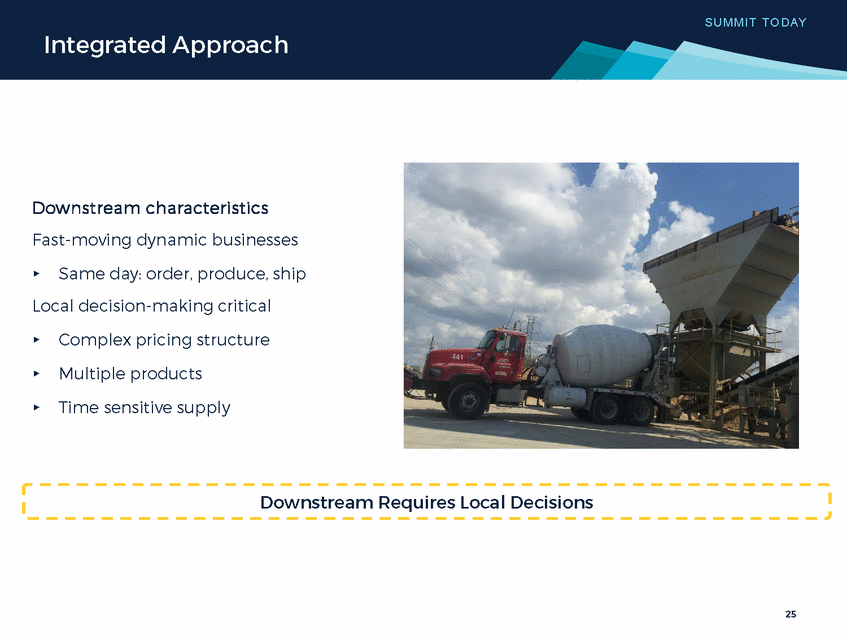
S U MMIT T O D AY 26 Entrance into new market Broader product base Diversify end-use exposure Increase internal aggregates supply Acquired August 2016 Durant, OK 8 fixed, 4 portable RMC plants Preferred supplier Excellent reputation Balanced end-use split Quality assets Acquired November 2010 Paris, Texas Integrated aggregates, asphalt, paving 2 aggregate quarries 12 asphalt plants
Investment Thesis Summit Today Unique Operating Model The Road Ahead Texas 27

UNI Q UE O P E RAT I NG M O DE L Integrated Approach Local matters 12 Local Platforms ▸ ▸ ▸ Aggregates ship 40-50 miles Cement regional but still local No real national “players” Decentralized management ▸ ▸ ▸ Facilitates entrepreneurship Decision-making with accountability Superior downstream performance Adds value ▸ Customer, community, regulatory relationships 28
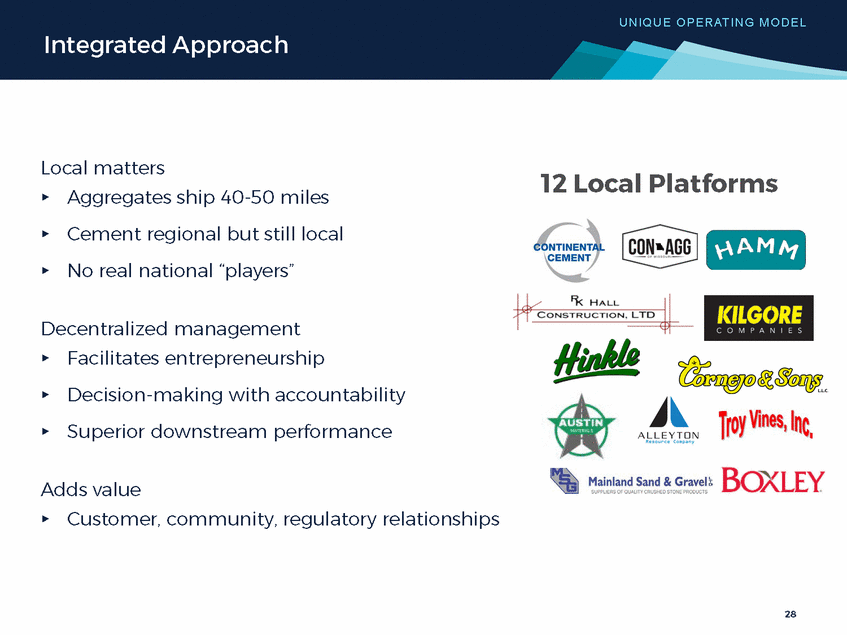
AGGREGATES Productivity Cost Efficiencies PURCHASING Scale Benefits PRICING Optimization Methodologies EQUIPMENT R&M Fleet Management IT FRAMEWORK Core & Customizable Systems Data-Driven Decisions Local Decision-Making Accountability for Results 29 Drive Benefits of Local with Economies of Scale for Sustainable Added Value
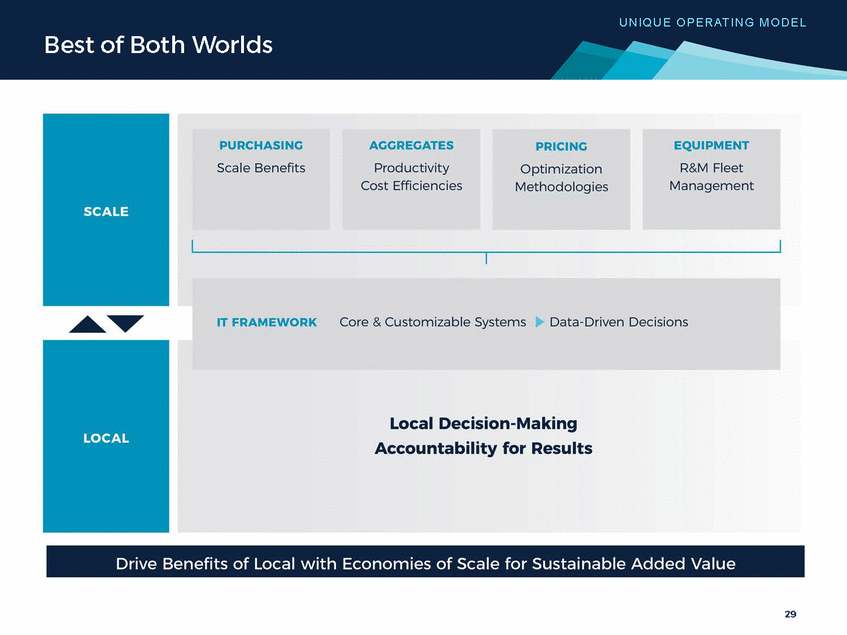
UNI Q UE O P E RAT I NG M O DE L Superior Performance EBITDA Aggregates % of Gross Revenue1 Cement 40.0% 45.0% 32.0% 36.0% 24.0% 27.0% 16.0% 18.0% 8.0% 9.0% 0.0% 0.0% 2015 LTM Q2'16 Peer Group Avg. 2015 LTM Q2'16 Peer Group Avg. SUM SUM Products 18.5% 20.0% 17.7% Summit margins 16.0% ▸ Comparable material margins 12.0% ▸ Outperformance in products 8.0% 4.0% 0.0% 2015 SUM LTM Q2'16 Peer Group Avg. Calculated based on reported filings 1 Peer Group includes MLM, VMC, addition of EXP for cement. Products include ready mix concrete, asphalt, and liquid asphalt terminals. EBITDA presented as Gross Profit, plus DD&A, less SG&A, plus adjustments to EBITDA, all allocated as a % of reported gross revenue if not otherwise provided by line of business. MLM gross revenue for asphalt derived by total volume and prices reported. MLM paving margin assumed at 10% to derive asphalt gross margin in period Q2’16 in which MLM asphalt and paving earnings reported combined, 30 11.0% 8.5% 35.6%36.1% 37.0% 31.5% 33.2%33.9% 25.7% 27.9%
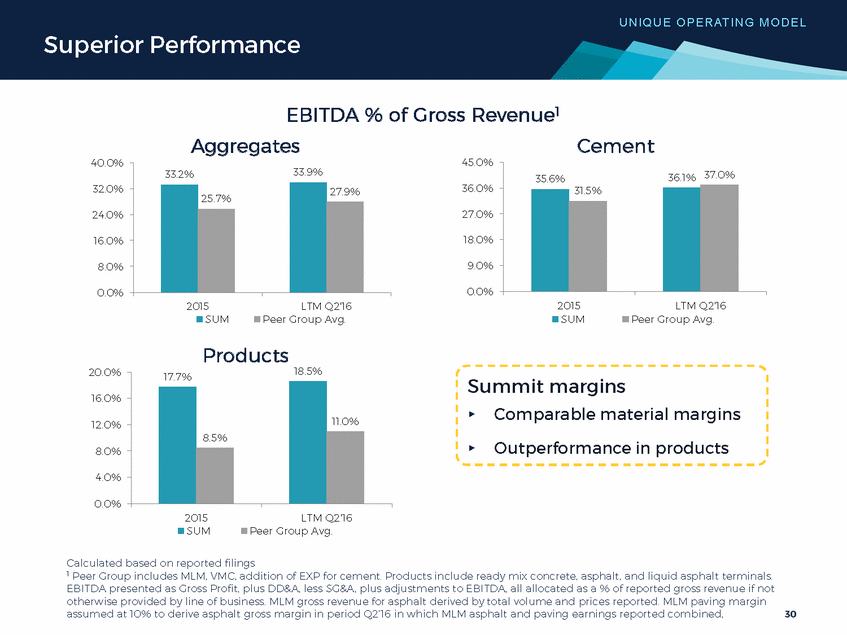
UNI Q UE O P E RAT I NG M O DE L Superior Performance High returns in downstream due to: ▸ ▸ Strong materials positions Entrepreneurial local management Return on Hard Assets + NWC 1 19% % of Total Assets 2 Downstrea 30% Materials 30% Materials Downstream Returns Driven by Materials Foundation 1 Return defined as LTM Q3 2016 EBIT / Average PPE and Net Working Capital as of September 2015 & September 2016 2 Total Assets: Average PPE and Net Working Capital as of September 2015 & September 2016 EBIT: LTM Q3 2016 Adjusted EBITDA minus DDA. Corporate expense allocated to each line-of-business on a net revenue basis 31 11%
UNI Q UE O P E RAT I NG M O DE L Kilgore Vision Create vertically integrated “3rd player” in Salt Lake Scalable platform Tangible Benefits Strong market positions Cost efficiency synergies Speed of integration for bolt-on deals 32
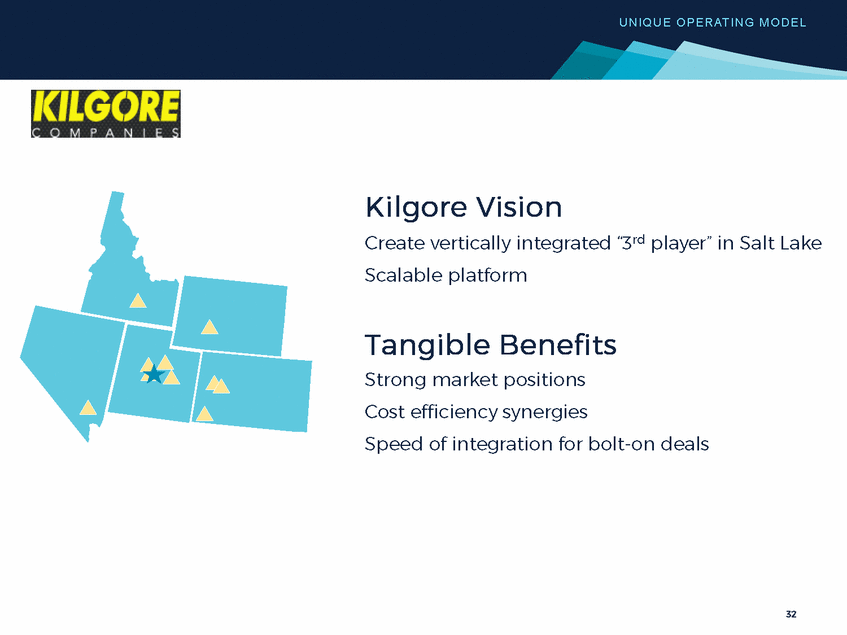
UNI Q UE O P E RAT I NG M O DE L Now1 13 July 2010 2 Companies 1 5 States 11 71 Locations ~550 ~1,400 2 Employees 3 Aggregate Tons Sold < 2Mt > 5Mt 1 Q3 2016 2 Full-time equivalents (FTEs) 3 Reported LTM Q3 2016 33
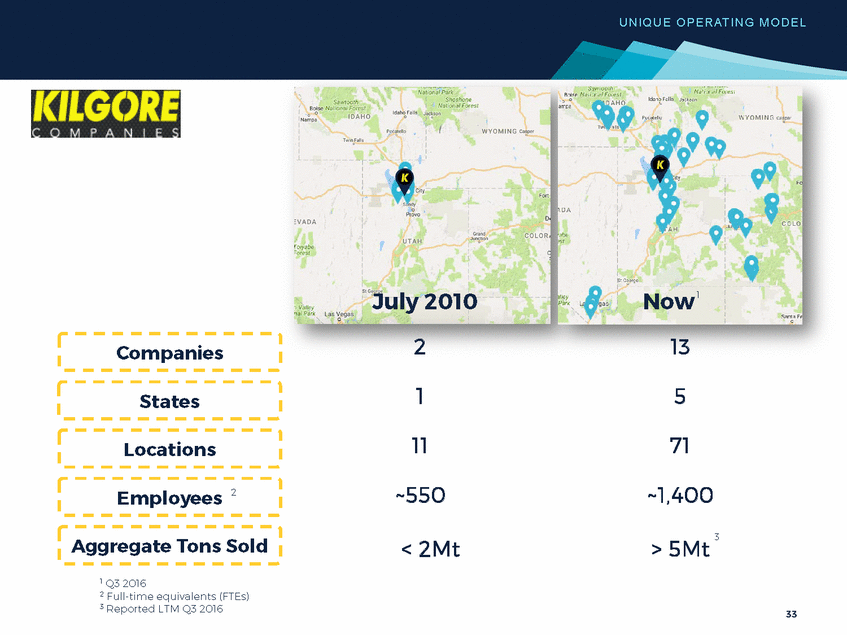
UNI Q UE O P E RAT I NG M O DE L Adjusted EBITDA $ Millions 20.3% 17.9% $61 13.2% 12.1% 2010 2011 2012 2013 2014 2015 LTM Q3'16 Adj, EBITDA Margin of Net Revenue Adjusted EBITDA as defined in reported filings EBITDA margin defined as Adjusted EBITDA divided by Net Revenue 34 8.6%8.4% 6.0%
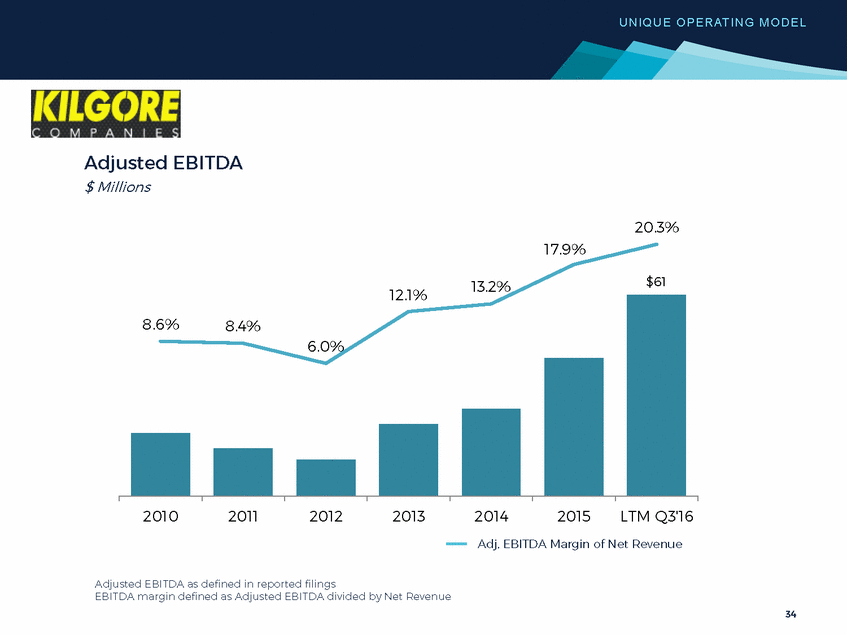
UNI Q UE O P E RAT I NG M O DE L Boxley: Founded 1892 Commitment to customers/quality Stewards of the environment Active participants in community Advocates for employees & their safety Tangible Benefits Market positions, scale Operational efficiencies Premium pricing Ease of permitting 35
UNI Q UE O P E RAT I NG M O DE L Aggregate Pricing 1 Strategic Fit Reputation, 25 year relationship with Summit Establishment of new platform Positive demand dynamics Top market position throughout vertical chain Strong management team 5% Aggregate Gross Margin 1 14% Synergies Captured $1.5M 1 Presented improvements reflect further adjusted pro forma financials as of LTM Q3 2016 compared to LTM Q1 2016 (pre-acquisition close) 36
Investment Thesis Summit Today Unique Operating Model The Road Ahead Texas 37
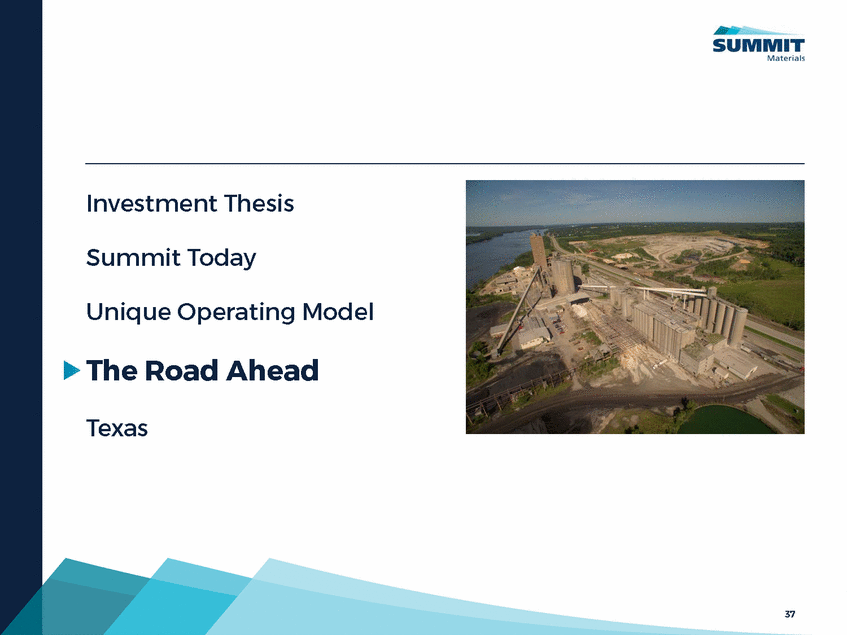
T H E R O AD AH EAD 2016E EBITDA Outlook Adjusted EBITDA $ Millions Midpoint $365 2015 2016 Outlook 2016 Outlook on a reported basis, includes successor earnings for all acquisitions closed to date (inclusive of Midland Concrete) 38 $360-370 $288
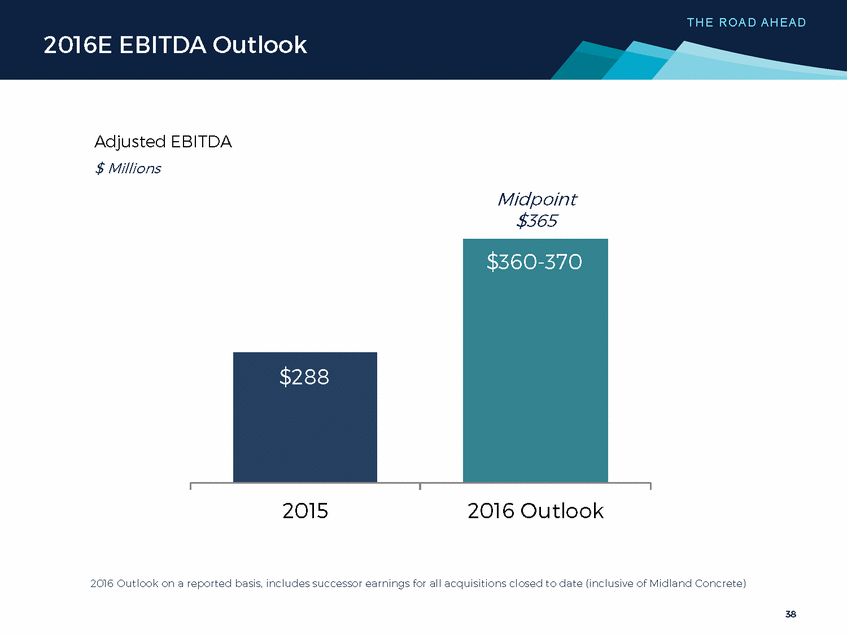
T H E R O AD AH EAD National Outlook 3.6% CAGR 3% CAGR 284 3% CAGR 94 1,423 268 1,373 1,325 1,304 87 1,241 1,188 2015 2016 2017 2018 2019 2020 2021 2015 2016 2017 2018 2019 2020 2021 2015 2016 2017 2018 2019 2020 2021 Total housing starts 1 $B construction spend-PCA $B highway spend-PCA Slow, lengthy recovery FAST Act Follows res improvement ▸ ~1.5M starts ▸ ▸ +5% in year one ▸ +5% in year one ~3% CAGR thereafter 1 2016-2019 illustrates average housing start estimates per PCA, MetroStudy and JBREC forecasts. 2015-2019 CAGR of 3.6% is utilized to extrapolate estimates through 2021 39 Early Innings of Construction Market Recovery Highways Non-Residential Residential 1,110 92 89 85 82 79 275 259 251 243 232
Operational excellence Driven by decentralized model Steady growth Markets: Underlying market momentum Catch-up post-acquisition - - - Attractive Stable Diverse 40
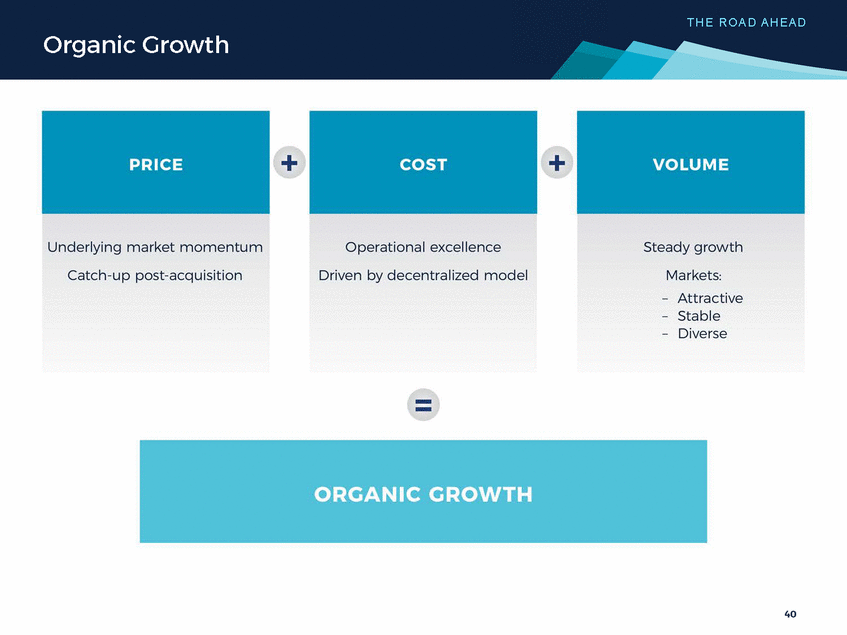
T H E R O AD AH EAD Cycle Definition Mid-Cycle Early Cycle Late Cycle Steady growth Moderating growth Peak volumes Recovery Expansion Late Economic Growth Current estimated position in the cycle Mid-cycle as presented on the following pages 41
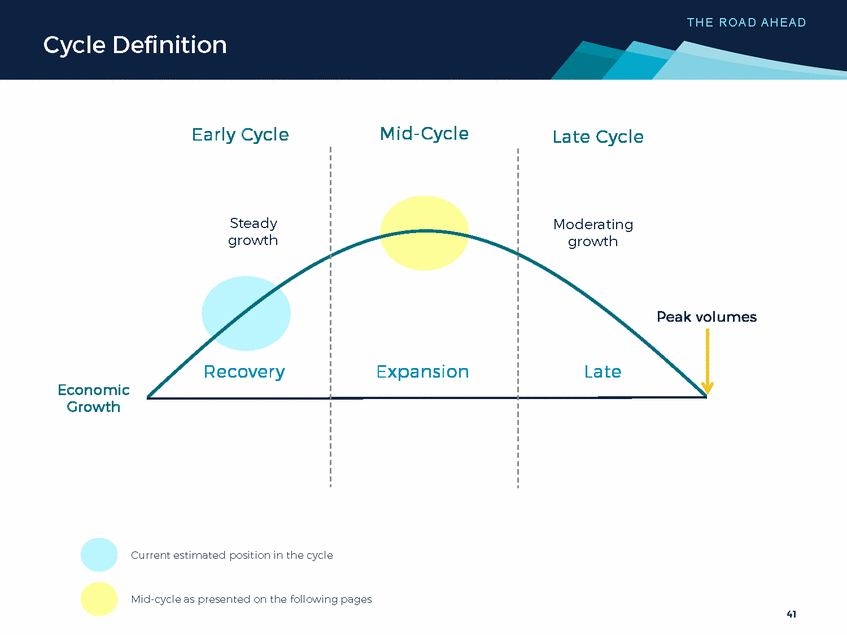
T H E R O AD AH EAD Mid-Cycle Assumptions % CAGR To Mid-Cycle Long Term Avg. Mid to Late Cycle Aggregates Volume 1 +3.8% +1.8% +3.5% +4.5% 2 Price +4.9% +2.3% Cement 3 Volume +3.0% +3.3% +1.5% 2 Price +3.5% +7.6% +7.0% 1 Source: USGS, Crushed Stone and Sand & Gravel sales volumes Aggregate volume depicts 30-year regression analysis for Summit primary operational states weighted by reported LTM Q2’16 volume 2 Source: Internal price growth 2012-LTM Q3 2016 3Source: USGS and PCA, Portland Cement consumption Cement volume depicts ~40 year historical regression analysis for Summit operational states weighted by reported 2015 cement volumes 42
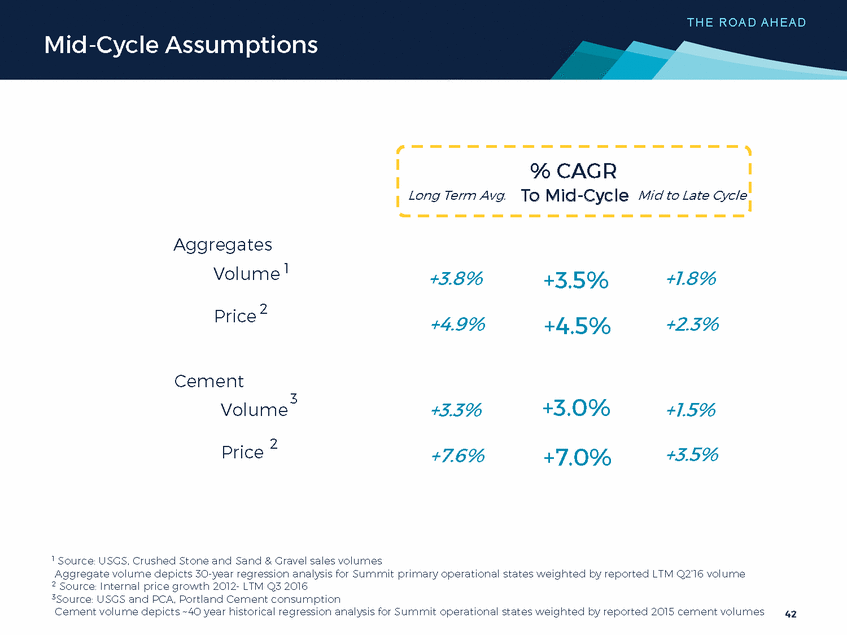
T H E R O AD AH EAD Cycle Outlook Organic Demand Cycle $ Millions Late Cycle Net Revenue Adjusted EBITDA % Margin 1 LTM Q3 2016 2 Estimated 43 1 Early Cycle 2 Mid-Cycle 2 $1,460 $360 25% $1,850-2,000 $500-550 27% $2,125-2,275 $600-650 28%
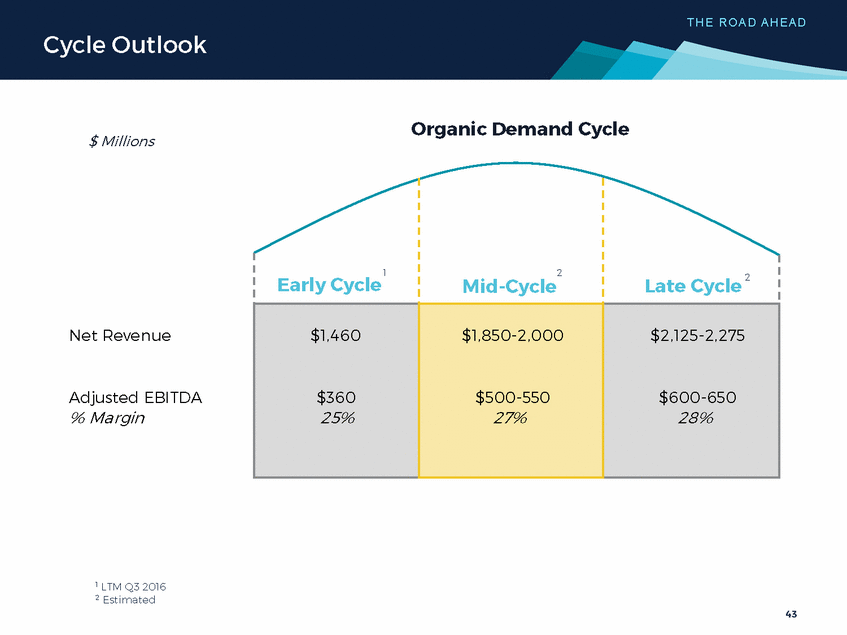
T H E R O AD AH EAD Mid-Cycle Cash Flow $ Millions 1 Mid-Cycle EBITDA $525 2 Less: Net Capex (140) $385 Operating Cash Flow Cash Conversion Ratio 73% Less: Cash Interest Less: Cash Taxes Less: Distributions and TRA Payments Plus: NWC Less: Acq. Related Payments Less: Mandatory Debt Payments (75) (4) (25) (15) (10) (7) Free Cash Flow $250 Mid-cycle analysis assumes excess cash generation is utilized for term loan debt paydown 1 Estimated 2 Net Capex includes capital leases 44
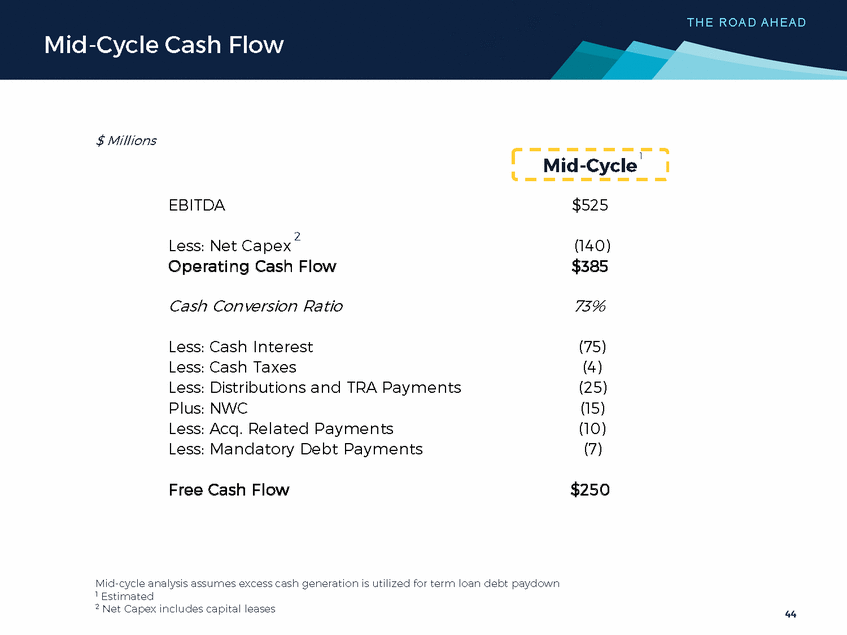
T H E R O AD AH EAD Mid-Cycle Net Leverage Position 4.3x Reported LTM Q3'16 Mid-Cycle Net Leverage defined as Net Debt divided by Further Adjusted EBITDA 45 1.7x
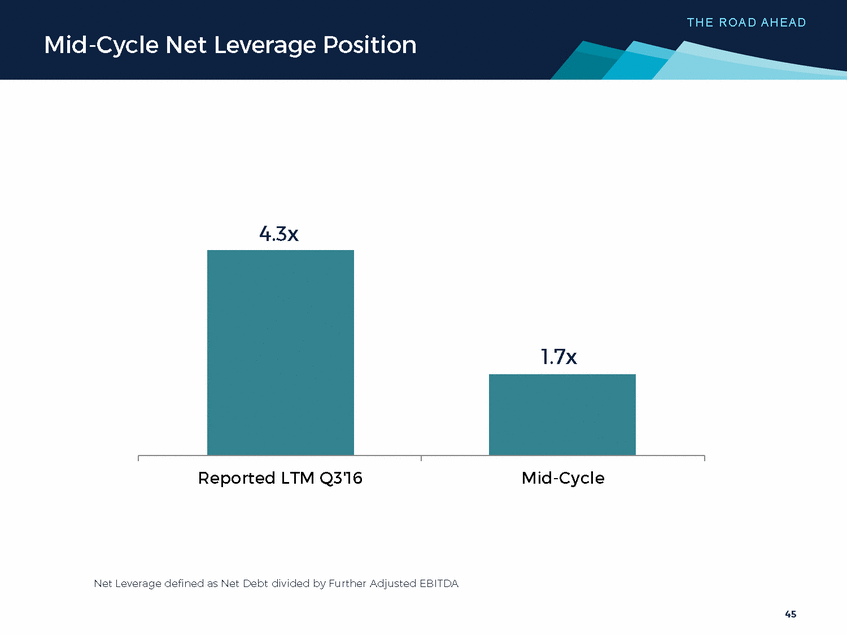
T H E R O AD AH EAD Debt Maturity $ Millions 2017 2018 2019 2020 Payment Year 2021 2022 2023 Term Loans 8.5% Senior No tes 6.125% Senio r Notes Revolving Credit Facility 1 As of Q3 2016 zero revolver, $200M of term loan debt held under IR hedge until Q3 2019 46 $235.0 $250.0 $650.0 $607.8 $6.5$4.9$6.5 $8.1 $6.5 Summit’s outstanding debt: ▸+70% is fixed interest1 ▸Weighted Average Interest Rate of 5.7%
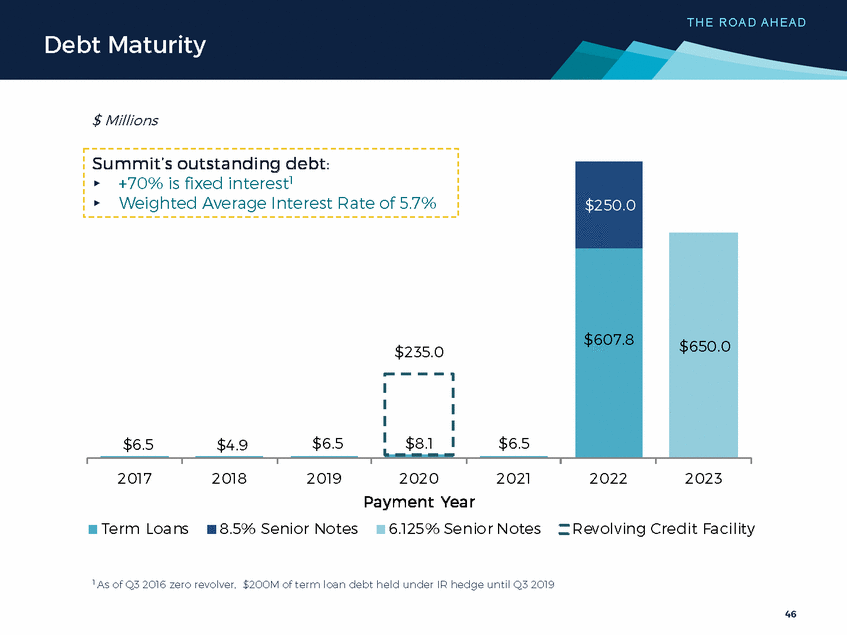
T H E R O AD AH EAD Acquisitions Strategy ▸ Establish new materials-based platforms in attractive markets ▸ Expand, fill-in through bolt-on acquisitions ▸ Diversify through multiple deals, geographies, end-markets ▸ “Buy Right” Grow Improve Integrate Acquire Source Rigorous Investment Criteria Focused on Sustainable Value Creation 47
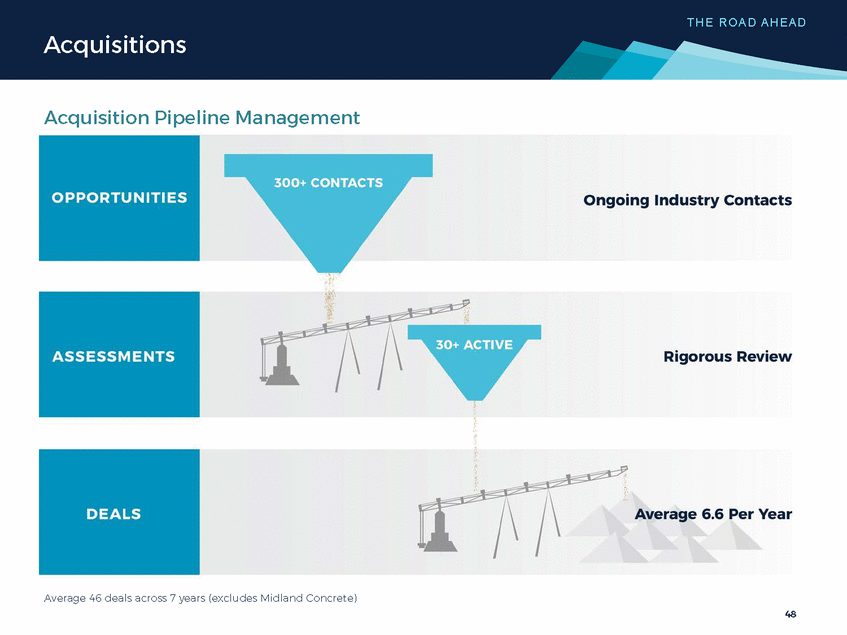
T H E R O AD AH EAD Acquisitions Acquisition Pipeline Management Average 46 deals across 7 years (excludes Midland Concrete) 48
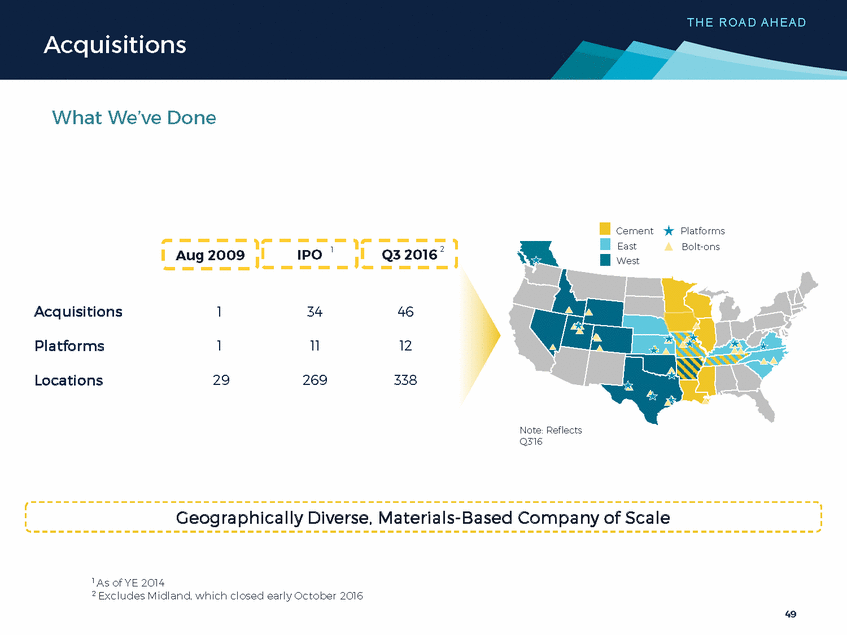
T H E R O AD AH EAD Acquisitions What We’ve Done Cement East West Platforms Bolt-ons 1 2 Aug 2009 IPO Q3 2016 Note: Reflects Q3’16 Geographically Diverse, Materials-Based Company of Scale 1 As of YE 2014 2 Excludes Midland, which closed early October 2016 49 Acquisitions 1 34 46 Platforms 1 11 12 Locations 29 269 338
T H E R O AD AH EAD Acquisitions Adding Value Enhanced safety performance Synergy-driven margin & earnings improvement Operational efficiencies through best practice sharing, scale Investment in human capital Sophisticated IT & financial systems for improved data-driven decision making Capital investment for profitable organic growth Proven Integration Process, Experienced Team Rapid, Sustainable Added Value 50
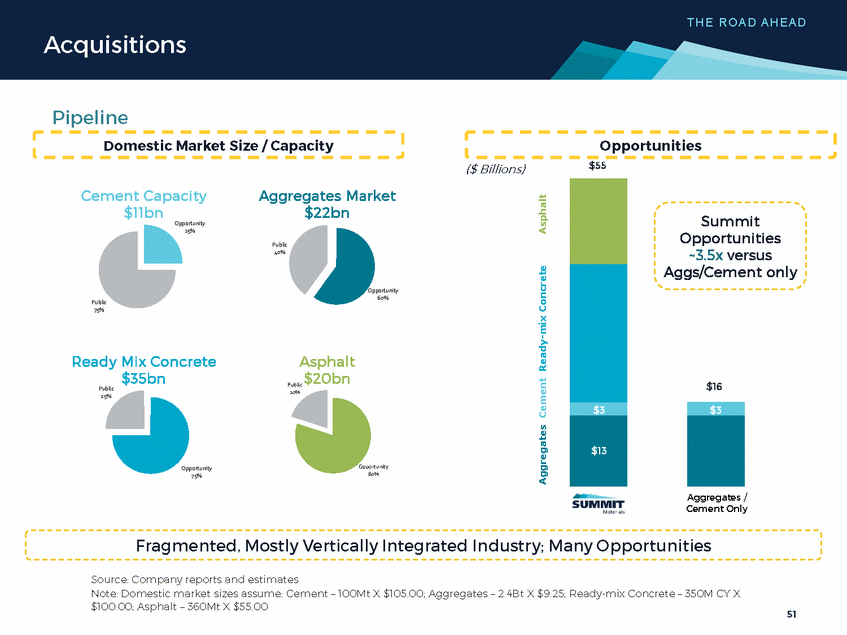
T H E R O AD AH EAD Acquisitions Pipeline Domestic Market Size / Capacity Opportunities $55 ($ Billions) Cement Capacity $11bn Opportunity 25% Aggregates Market $22bn Summit Opportunities ~3.5x versus Aggs/Cement only Public 40% Opportunity 60% Public 75% Ready Mix Concrete $35bn Public 25% Asphalt $20bn Public 20% $16 Opportunity 80% Opportunity 75% Aggregates / Cement Only Fragmented, Mostly Vertically Integrated Industry; Many Opportunities Source: Company reports and estimates Note: Domestic market sizes assume: Cement – 100Mt X $105.00; Aggregates – 2.4Bt X $9.25; Ready-mix Concrete – 350M CY X $100.00; Asphalt – 360Mt X $55.00 51 Aggregates Cement Ready-mix Concrete Asphalt $$33 $13 $16 $26 $$33 $$1133
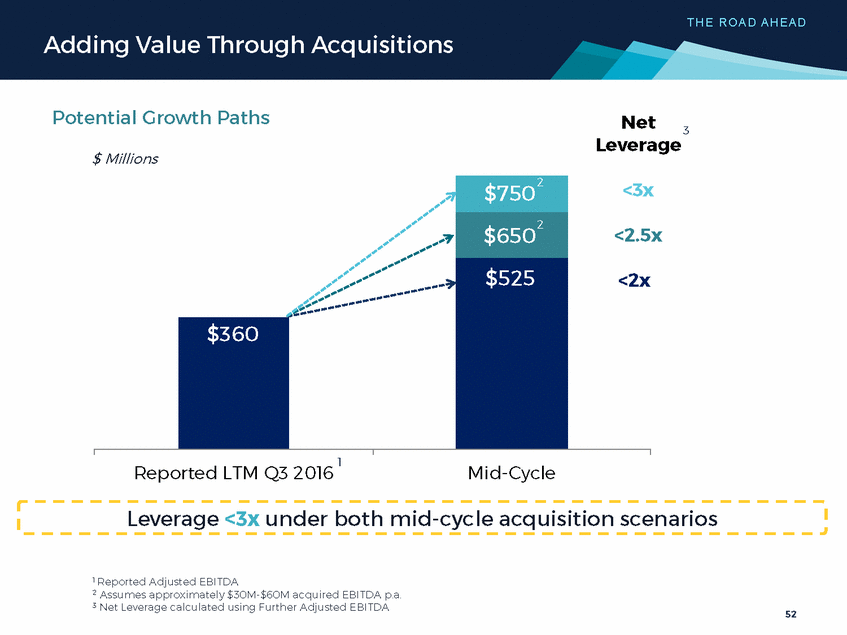
T H E R O AD AH EAD Adding Value Through Acquisitions Potential Growth Paths Net Leverage 3 $ Millions 3x x 1 Reported LTM Q3 2016 Mid-Cycle Leverage <3x under both mid-cycle acquisition scenarios 1 Reported Adjusted EBITDA 2 Assumes approximately $30M-$60M acquired EBITDA p.a. 3 Net Leverage calculated using Further Adjusted EBITDA 52 2 $750 < <2.5 <2x 2 $650 $525 $360
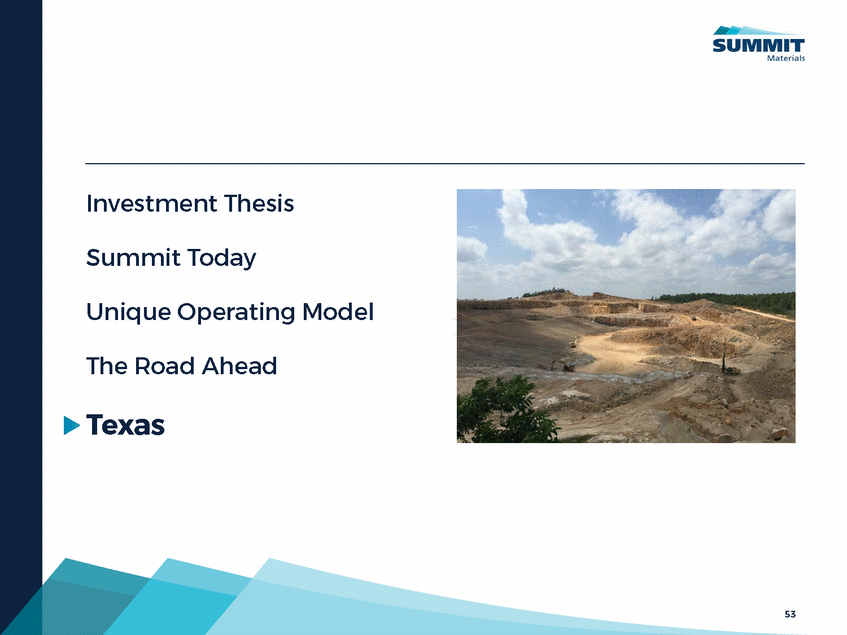
Investment Thesis Summit Today Unique Operating Model The Road Ahead Texas 53
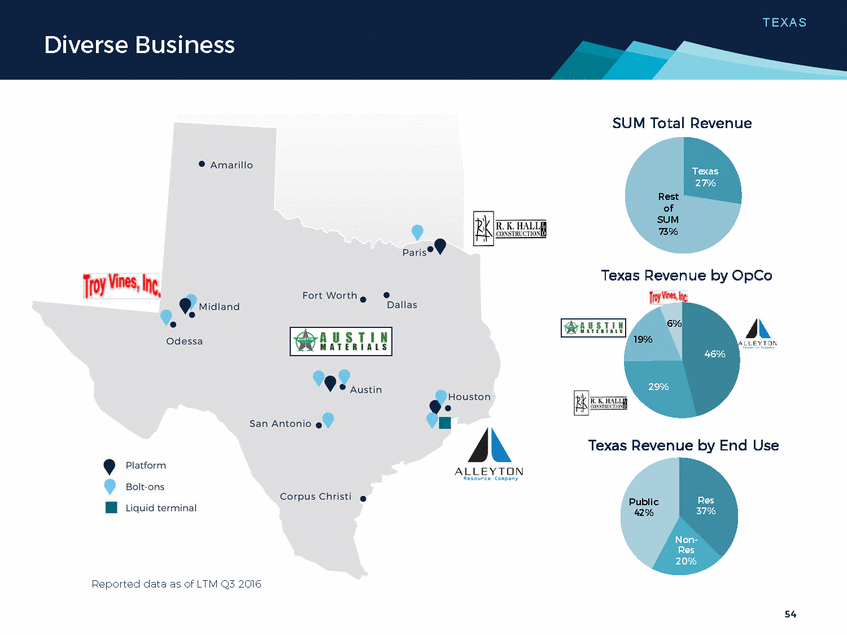
T EX AS Diverse Business SUM Total Revenue Texas 27% Rest of SUM 73% Texas Revenue by OpCo 6% 19% 46% 29% Texas Revenue by End Use Res 37% Public 42% on-Res % Reported data as of LTM Q3 2016 54
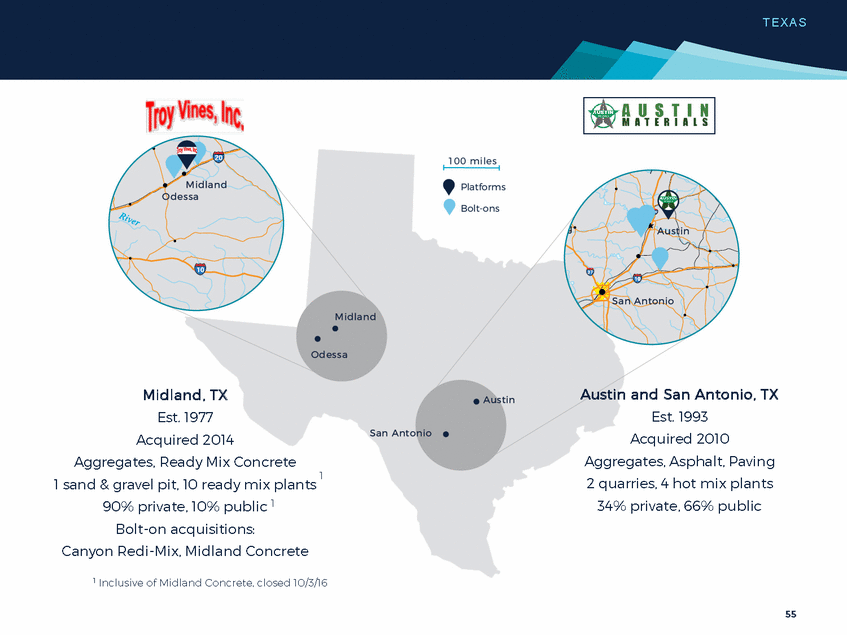
T EX AS Midland, TX Est. 1977 Acquired 2014 Aggregates, Ready Mix Concrete 1 sand & gravel pit, 10 ready mix plants 90% private, 10% public 1 Bolt-on acquisitions: Canyon Redi-Mix, Midland Concrete Austin and San Antonio, TX Est. 1993 Acquired 2010 Aggregates, Asphalt, Paving 2 quarries, 4 hot mix plants 34% private, 66% public 1 1 Inclusive of Midland Concrete, closed 10/3/16 55
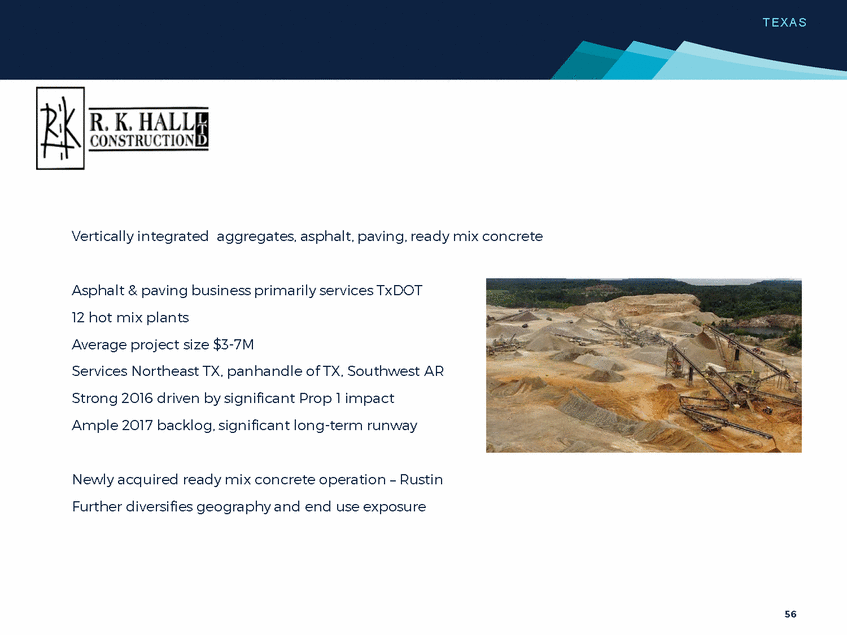
T EX AS Vertically integrated aggregates, asphalt, paving, ready mix concrete Asphalt & paving business primarily services TxDOT 12 hot mix plants Average project size $3-7M Services Northeast TX, panhandle of TX, Southwest AR Strong 2016 driven by significant Prop 1 impact Ample 2017 backlog, significant long-term runway Newly acquired ready mix concrete operation – Rustin Further diversifies geography and end use exposure 56
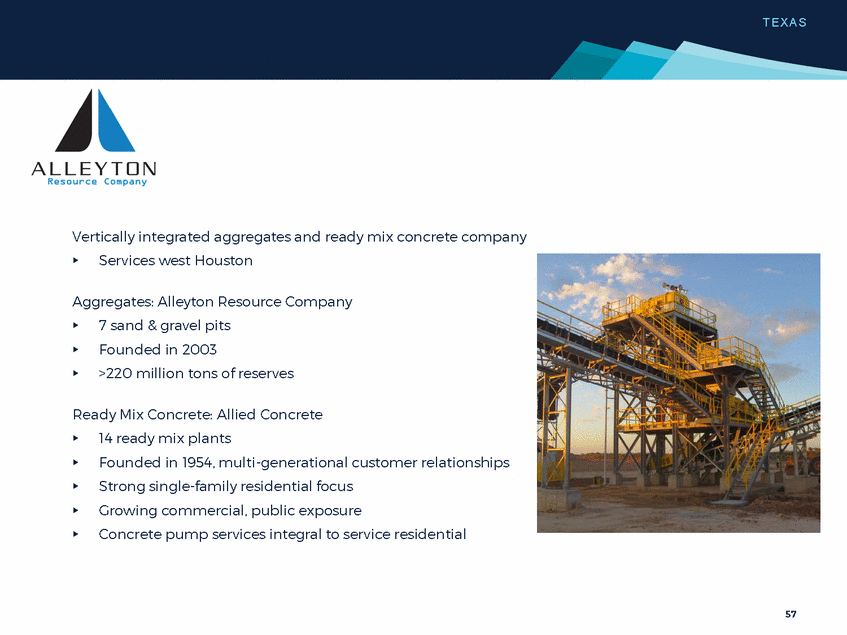
T EX AS Vertically integrated aggregates and ready mix concrete company ▸ Services west Houston Aggregates: Alleyton Resource Company ▸ ▸ ▸ 7 sand & gravel pits Founded in 2003 >220 million tons of reserves Ready Mix Concrete: Allied Concrete ▸ ▸ ▸ ▸ ▸ 14 ready mix plants Founded in 1954, multi-generational customer relationships Strong single-family residential focus Growing commercial, public exposure Concrete pump services integral to service residential 57
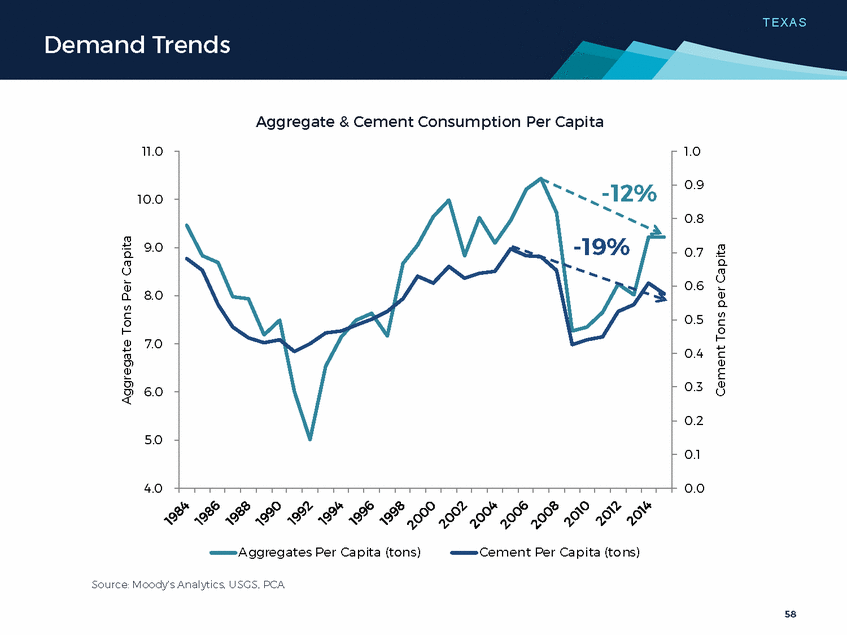
T EX AS Demand Trends Aggregate & Cement Consumption Per Capita 11.0 1.0 0.9 10.0 0.8 9.0 0.7 0.6 8.0 0.5 7.0 0.4 0.3 6.0 0.2 5.0 0.1 4.0 0.0 Aggregates Per Capita (tons) Cement Per Capita (to ns) Source: Moody’s Analytics, USGS, PCA 58 Aggregate Tons Per Capita Cement Tons per Capita -12% -19%
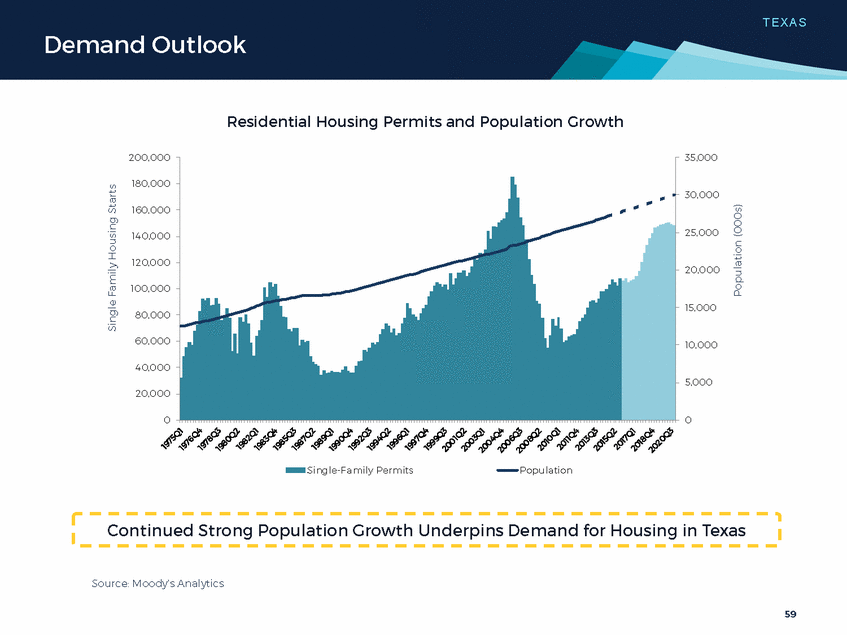
T EX AS Demand Outlook Residential Housing Permits and Population Growth 200,000 35,000 180,000 30,000 160,000 25,000 140,0 00 120,0 00 20,0 00 100,000 15,000 80,000 60,000 10,000 40,0 00 5,000 20,0 00 0 0 Single-Family Permits Population Continued Strong Population Growth Underpins Demand for Housing in Texas Source: Moody’s Analytics 59 Single Family Housing Starts Population (000s)
T EX AS Demand Outlook Unified Transportation Program (UTP) ▸ ▸ ▸ Adopted by Texas Transportation Commission in August 2016 Allocates $70B in funding distributed over 10 years First priority of future funding: maintenance of highway and road system Proposition 1 ▸ ▸ ▸ Overwhelmingly passed by voters by 80% in 2014 Directs portion of oil and gas severance tax revenue to State Highway Fund Generated $1.7B in 2015, estimated $600M in 2017 Proposition 7 ▸ ▸ Directs portion of growth of sales and motor vehicle sales taxes to State Highway Fund Expected to generate $2.5B in 2017, and grow to $3B p.a. by FY 2021 Source: TxDOT, TXAPA 60
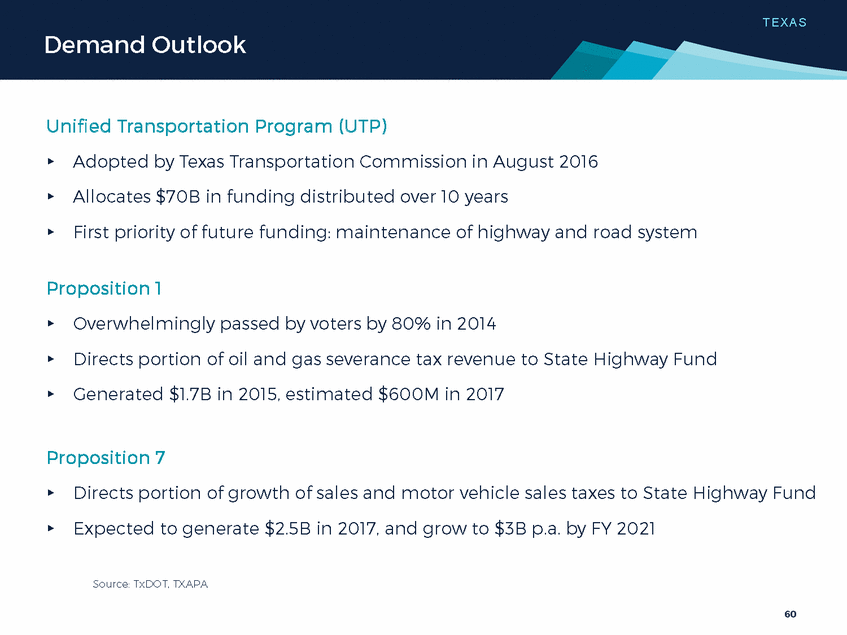
T EX AS Houston Outlook 2017 starts projection – 17% decline from 2015 levels vs. 60% decline peak to trough in 2006 Summit’s west Houston business underpinned by: ▸ ▸ Continued demand for entry-level housing Westward expansion of Grand Parkway, strong infrastructure demand 60,000 8,000 7,000 50,000 6,000 40,000 5,000 30,000 4,000 3,000 20,000 2,000 10,000 1,000 0 0 Single Family Housing Starts Population Source: Moody’s Analytics 61 Single Family Housing Starts 1990 1991 1992 1993 1994 1995 1996 1997 1998 1999 2000 2001 2002 2003 2004 2005 2006 2007 2008 2009 2010 2011 2012 2013 2014 2015 2016 2017 2018 2019 2020 Population (000s)
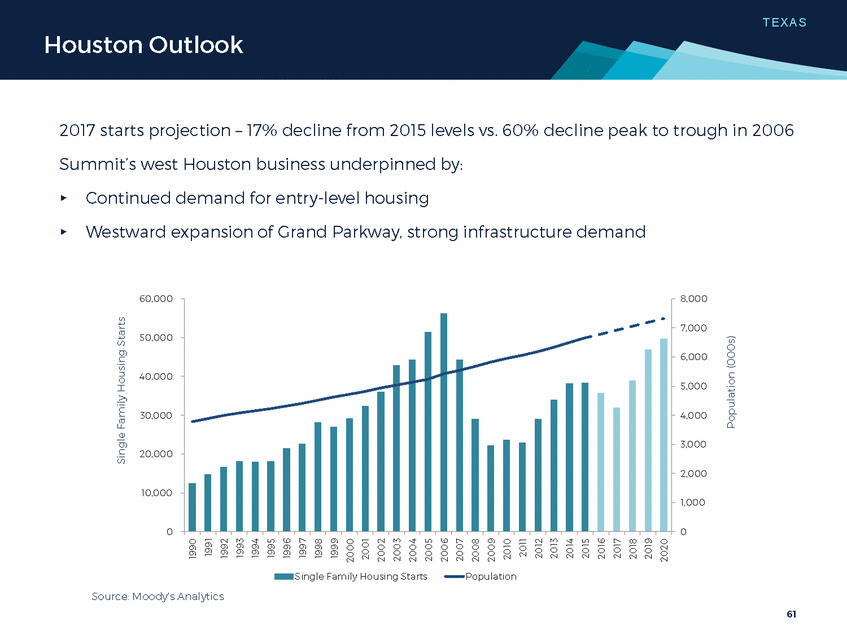
T EX AS Houston Outlook “Our central area continues to show signs of improvement, as the Houston area normalizes and in some ways begins to move into a positive trajectory...As a point of validation, September marked the first month in a year with positive sales growth for us in the Houston market.” - Taylor Morrison “Houston has held up much better than expected, and given the recent rise in oil prices, it could be that the worst is already past.” - Pulte Group “Our sales in Houston were up in the third quarter of 2016 compared to 2015 and our third-quarter sales pace was higher than last year's despite the prolonged relative weakness in the energy sector. Overall, Houston has been better than we expected this year… we are pleased with our results there.” - Meritage Homes “Our sales in Houston were up year-over-year so we've continued to see that [market] at a very strong level…” - D.R. Horton (DHI) Source: Q3 2016 Earnings Releases and Transcripts 62
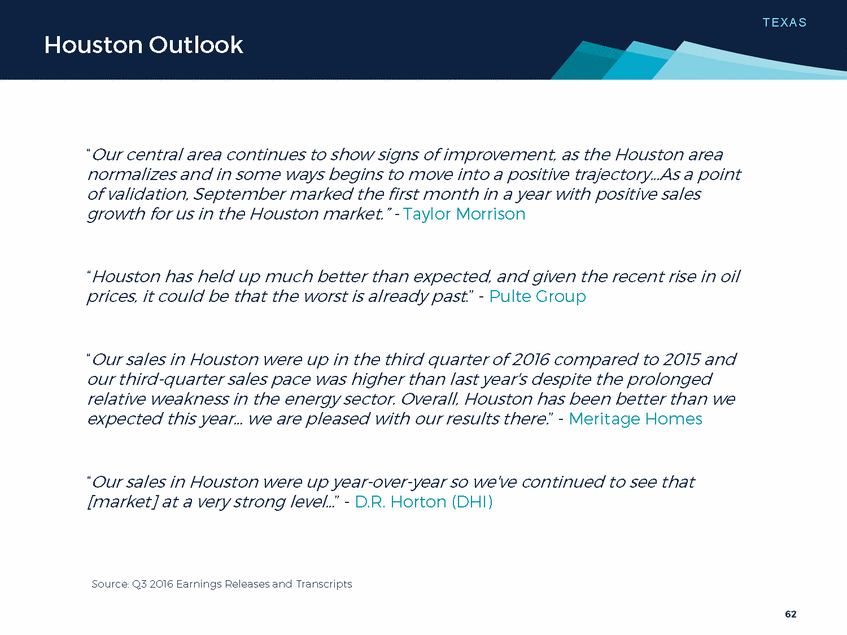
Conclusion 1 2 3 1 Defined as LTM Adjusted EBITDA divided by LTM Net Revenue 2 Product Adjusted EBITDA Margin divided by LTM Gross Revenue; comparable product margin peer group includes, Martin Marietta (MLM) and Vulcan Materials (VMC); products include ready mix concrete, asphalt, and liquid asphalt terminals 3 As of Q3 2016; excludes Midland Concrete, closed 10/3/16 63
Appendix 64
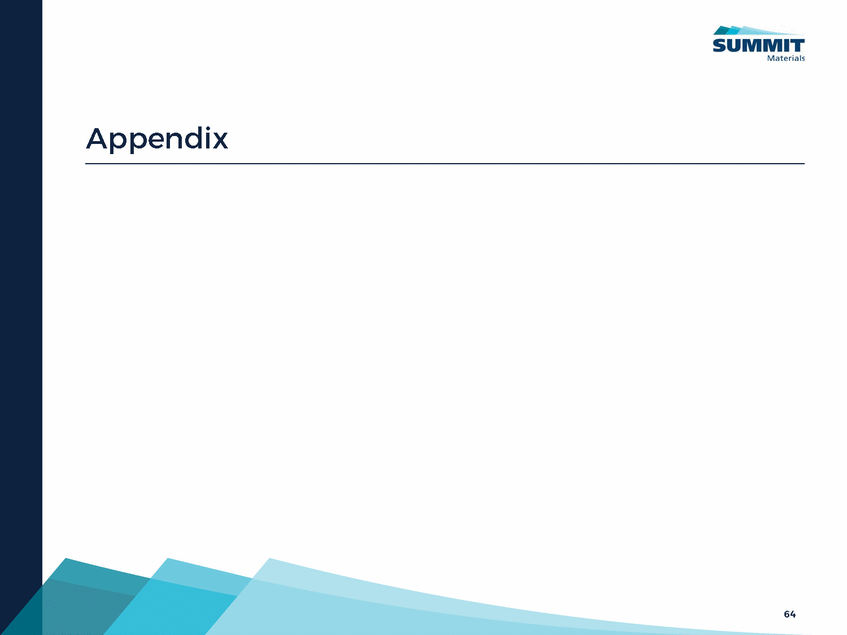
APPEN D I X Mid-Cycle Volume Assumptions Aggregates Tons1 (Indexed to 100) 2 300 250 200 150 100 50 0 1983 1985 1987 1989 1991 1993 1995 1997 1999 2001 2003 2005 2007 2009 2011 2013 2015 2017 2019 Cement Metric Tons3 (Indexed to 100) 2 3.3% CAGR 180 160 140 120 100 80 60 40 20 - Aggregate volume depicts Summit primary operational states weighted by reported LTM Q2’16 volume Cement volume depicts Summit operational states weighted by reported 2015 cement volume 1 Source: USGS, Crushed Stone and Sand & Gravel sales volumes 2 Regression analysis growth rate based on historical long-term trends 3 Source: USGS and PCA, Portland Cement consumption 65 3.8% CAGR
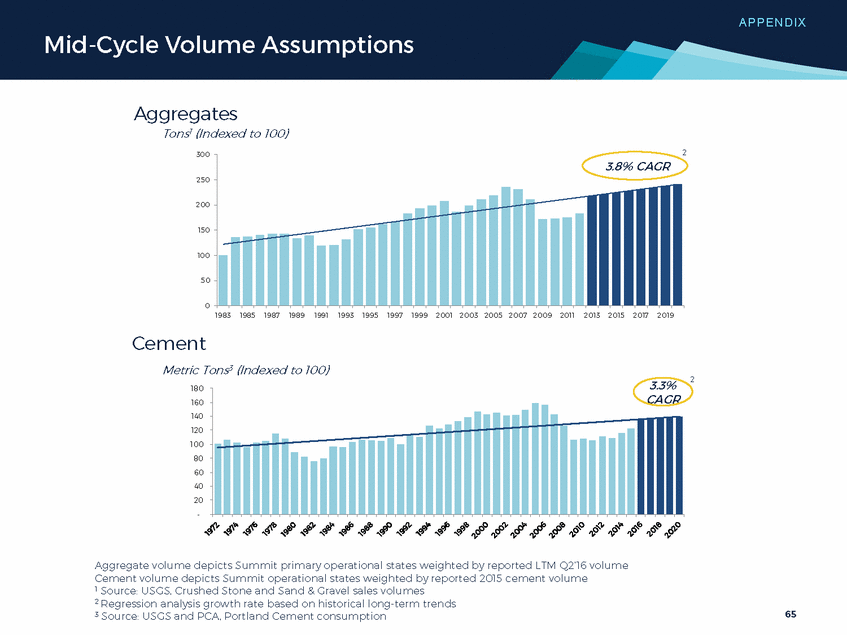
APPEN D I X Gross Profit Reconciliation $ Thousands Reconciliation of Operating Income to Gross Profit 2013 2014 2015 LTM Q3 2016 Operating (loss) income General and administrative expenses Goodwill impairment Depreciation, depletion, amortization and accretion Transaction costs Gross Profit (exclusive of items shown separately) Gross Margin (exclusive of items shown separately) $ (47,977) 142,000 68,202 72,934 3,990 $ 69,959 150,732 — 87,826 8,554 $ 134,641 177,769 — 119,723 9,519 $ 173,420 213,493 — 142,100 6,765 $ 239,149 $ 317,071 $ 441,652 $ 535,778 29.0 % 29.6 % 34.2 % 36.7 % 66
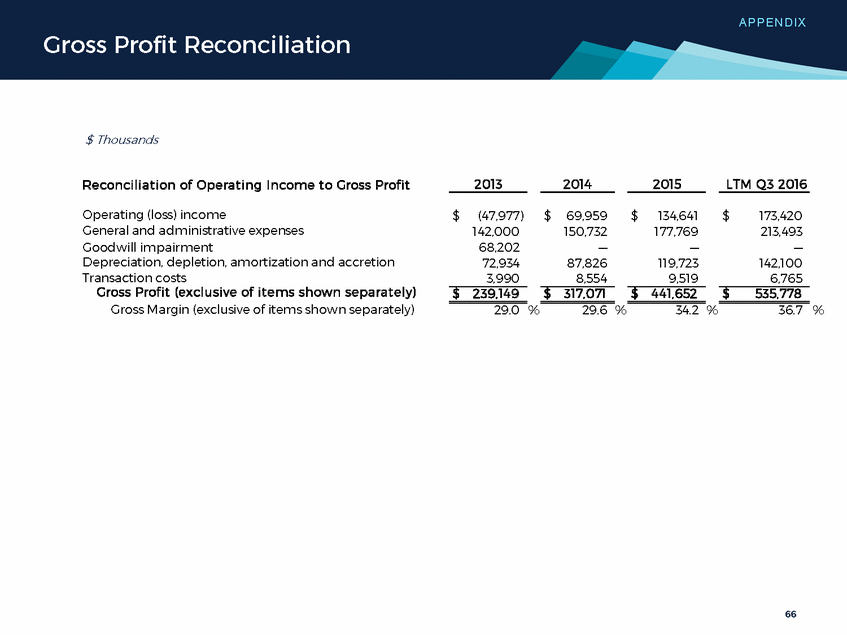
APPEN D I X Adjusted EBITDA Bridge $ Millions Last Twelve Months Ended October 1, 2016 January 2, 2016 December 27, 2014 December 28, 2013 Net income (loss) Interest expense Income tax expense (benefit) Depreciation, depletion, amortization, and accretion IPO/ Legacy equity modification costs Loss on debt financings Goodwill impairment Acquisition transaction expenses Management fees and expenses Non-cash compensation Other Adjusted EBITDA $ 87 95 (14) 142 37 7 0 7 0 10 (11) 360 19 379 $ 1 85 (18) 120 28 72 0 10 1 5 (16) 288 20 308 $ (6) 87 (7) 88 0 0 0 9 5 2 11 189 23 212 $ (104) 56 (3) 73 0 3 68 4 3 2 28 130 (2) 128 $ $ $ $ EBITDA for certain completed acquisitions Further Adjusted EBITDA 1 $ $ $ $ Adjusted EBITDA By Segment West East Cement Corporate Adjusted EBITDA $ 167 120 110 (37) 360 $ 151 92 75 (30) 288 $ 102 74 35 (22) 189 $ 42 67 37 (16) 130 $ $ $ $ 1 LTM Further Adjusted EBITDA is pro forma for all acquisitions as of the date listed 67
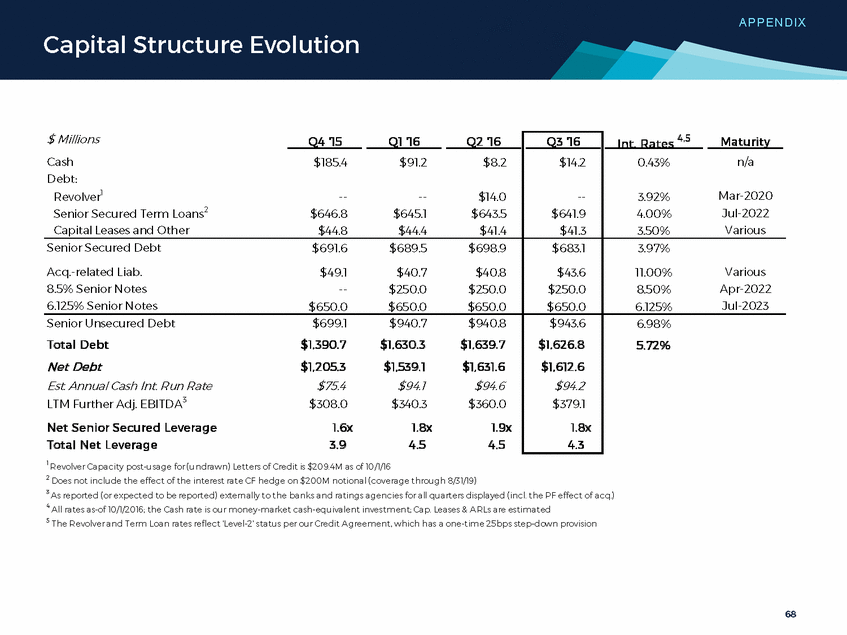
APPEN D I X Capital Structure Evolution 1 Revolver Capacity post-usage for (undrawn) Letters of Credit is $209.4M as of 10/1/16 2 Does not include the effect of the interest rate CF hedge on $200M notional (coverage through 8/31/19) 3 As reported (or expected to be reported) externally to the banks and ratings agencies for all quarters displayed (incl. the PF effect of acq.) 4 All rates as-of 10/1/2016; the Cash rate is our money-market cash-equivalent investment; Cap. Leases & ARLs are estimated 5 The Revolver and Term Loan rates reflect 'Level-2' status per our Credit Agreement, which has a one-time 25bps step-down provision 68 $ Millions Q4 '15 Q1 '16 Q2 '16 Cash $185.4$91.2$8.2 Debt: Revolver1---- $14.0 Senior Secured Term Loans2 $646.8 $645.1$643.5 Capital Leases and Other $44.8$44.4$41.4 Q3 '16 $14.2 --$641.9 $41.3 Int. Rates 4,5 Maturity 0.43%n/a 3.92% Mar-2020 4.00%Jul-2022 3.50% Various Senior Secured Debt $691.6$689.5 $698.9 Acq.-related Liab.$49.1$40.7$40.8 8.5% Senior Notes--$250.0$250.0 6.125% Senior Notes$650.0$650.0$650.0 $683.1 $43.6 $250.0 $650.0 3.97% 11.00%Various 8.50%Apr-2022 6.125%Jul-2023 Senior Unsecured Debt $699.1$940.7$940.8 Total Debt $1,390.7$1,630.3$1,639.7 Net Debt $1,205.3$1,539.1$1,631.6 Est. Annual Cash Int. Run Rate $75.4$94.1$94.6 LTM Further Adj. EBITDA3 $308.0$340.3$360.0 Net Senior Secured Leverage 1.6x1.8x1.9x Total Net Leverage 3.94.54.5 $943.6 $1,626.8 $1,612.6 $94.2 $379.1 1.8x 4.3 6.98% 5.72%
