Attached files
| file | filename |
|---|---|
| EX-32.1 - EXHIBIT 32.1 - Sino-Global Shipping America, Ltd. | v452673_ex32-1.htm |
| EX-31.2 - EXHIBIT 31.2 - Sino-Global Shipping America, Ltd. | v452673_ex31-2.htm |
| EX-31.1 - EXHIBIT 31.1 - Sino-Global Shipping America, Ltd. | v452673_ex31-1.htm |
U.S. SECURITIES AND EXCHANGE COMMISSION
WASHINGTON, DC 20549
FORM 10-Q
x Quarterly report pursuant to Section 13 or 15(d) of the Securities Exchange Act of 1934
For the period ended September 30, 2016
¨ Transition report pursuant to Section 13 or 15(d) of the Securities Exchange Act of 1934
For the transition period from ___________ to ___________.
Commission File Number 001-34024
Sino-Global Shipping America, Ltd.
(Exact name of registrant as specified in its charter)
| Virginia | 11-3588546 | |
| (State or other jurisdiction of | (I.R.S. employer | |
| Incorporation or organization) | identification number) |
1044 Northern Boulevard, Suite 305
Roslyn, New York 11576-1514
(Address of principal executive offices and zip code)
(718) 888-1814
(Registrant’s telephone number, including area code)
Indicate by check mark whether the registrant (1) has filed all reports required to be filed by Section 13 or 15(d) of the Securities Exchange Act of 1934 during the preceding 12 months (or for such shorter period that the registrant was required to file such reports) and (2) has been subject to such filing requirements for the past 90 days. Yes x No ¨
Indicate by check mark whether the registrant has submitted electronically and posted on its corporate Web site, if any, every Interactive Data File required to be submitted and posted pursuant to Rule 405 of Regulation S-T (§232.405 of this chapter) during the preceding 12 months (or for such shorter period that the registrant was required to submit and post such files). Yes x No ¨
Indicate by check mark whether the registrant is a large accelerated filer, an accelerated filer, a non-accelerated filer, or a smaller reporting company.
| Large accelerated filer ¨ | Accelerated filer ¨ |
| Non-accelerated filer ¨ (Do not check if a smaller reporting company) | Smaller reporting company x |
Indicate by check mark whether the registrant is a shell company (as defined in Rule 12b-2 of the Exchange Act). Yes ¨ No x
Indicate the number of shares outstanding of each of the issuer’s classes of common stock, as of the latest practicable date. As of November 8, 2016, the Company has 8,280,535 issued and outstanding shares of common stock.
SINO-GLOBAL SHIPPING AMERICA, LTD.
FORM 10-Q
INDEX
| 2 |
SPECIAL NOTE REGARDING FORWARD-LOOKING STATEMENTS
This document contains certain statements of a forward-looking nature. Such forward-looking statements, including but not limited to projected growth, trends and strategies, future operating and financial results, financial expectations and current business indicators are based upon current information and expectations and are subject to change based on factors beyond the control of the Company. Forward-looking statements typically are identified by the use of terms such as “look,” “may,” “will,” “should,” “might,” “believe,” “plan,” “expect,” “anticipate,” “estimate” and similar words, although some forward-looking statements are expressed differently. The accuracy of such statements may be impacted by a number of business risks and uncertainties that could cause actual results to differ materially from those projected or anticipated, including but not limited to the following:
| · | Our ability to timely and properly deliver our services; |
| · | Our dependence on a limited number of major customers and related parties; |
| · | Political and economic factors in the Peoples’ Republic of China (“PRC”); |
| · | Our ability to expand and grow our lines of business; |
| · | Unanticipated changes in general market conditions or other factors, which may result in cancellations or reductions in the need for our services; |
| · | Economic conditions which would reduce demand for services provided by the Company and could adversely affect profitability; |
| · | The effect of terrorist acts, or the threat thereof, on the demand for the shipping and logistic industry which could, adversely affect the Company’s operations and financial performance; |
| · | The acceptance in the marketplace of our new lines of business; |
| · | Foreign currency exchange rate fluctuations; |
| · | Hurricanes or other natural disasters; and |
| · | Our ability to attract, retain and motivate skilled personnel. |
Readers are cautioned not to place undue reliance on these forward-looking statements, which speak only as of the date hereof. The Company undertakes no obligation to update this forward-looking information unless required by applicable law or regulations.
| 3 |
| Item 1. | Financial Statements |
SINO-GLOBAL SHIPPING AMERICA, LTD. AND AFFILIATES
INDEX TO FINANCIAL STATEMENTS
| F-1 |
SINO-GLOBAL SHIPPING AMERICA, LTD. AND AFFILIATES
CONDENSED CONSOLIDATED BALANCE SHEETS
(UNAUDITED)
| September 30, | June 30, | |||||||
| 2016 | 2016 | |||||||
| Assets | ||||||||
| Current assets | ||||||||
| Cash and cash equivalents | $ | 2,896,265 | $ | 1,385,994 | ||||
| Accounts receivable, less allowance for doubtful accounts of $97,534 and $207,028 as of September 30, 2016 and June 30, 2016 , respectively | 778,491 | 2,333,024 | ||||||
| Other receivables, less allowance for doubtful accounts of $145,242 and $145,186 as of September 30, 2016 and June 30, 2016, respectively | 191,084 | 290,907 | ||||||
| Advances to suppliers | 3,615,343 | 2,192,910 | ||||||
| Prepaid expense and other current assets | 562,723 | 826,631 | ||||||
| Due from related parties | 1,117,695 | 1,622,519 | ||||||
| Total Current Assets | 9,161,601 | 8,651,985 | ||||||
| Property and equipment, net | 162,759 | 176,367 | ||||||
| Prepaid expenses | 122,920 | 178,982 | ||||||
| Other long-term assets | 47,061 | 46,810 | ||||||
| Total Assets | $ | 9,494,341 | $ | 9,054,144 | ||||
| Liabilities and Equity | ||||||||
| Current Liabilities | ||||||||
| Advances from customers | $ | 24,377 | $ | 24,373 | ||||
| Accounts payable | 6,832 | 489,490 | ||||||
| Taxes payable | 1,713,337 | 1,637,197 | ||||||
| Accrued expenses and other current liabilities | 490,488 | 286,322 | ||||||
| Total Current Liabilities | 2,235,034 | 2,437,382 | ||||||
| Total Liabilities | 2,235,034 | 2,437,382 | ||||||
| Commitments and Contingencies | ||||||||
| Equity | ||||||||
| Preferred stock, 2,000,000 shares authorized, no par value, none issued. | - | - | ||||||
| Common stock, 50,000,000 shares authorized, no par value; 8,456,032 and 8,456,032 shares issued as of September 30, 2016 and June 30, 2016; 8,280,535 and 8,280,535 outstanding as of September 30, 2016 and June 30, 2016, respectively | 15,500,391 | 15,500,391 | ||||||
| Additional paid-in capital | 1,160,292 | 1,140,962 | ||||||
| Treasury stock, at cost - 175,497 and 175,497 shares as of Septemer 30, 2016 and June 30, 2016 | (417,538 | ) | (417,538 | ) | ||||
| Accumulated deficit | (3,873,079 | ) | (4,518,799 | ) | ||||
| Accumulated other comprehensive loss | (306,021 | ) | (280,907 | ) | ||||
| Total Sino-Global Shipping America Ltd. Stockholders' Equity | 12,064,045 | 11,424,109 | ||||||
| Non-controlling Interest | (4,804,738 | ) | (4,807,347 | ) | ||||
| Total Equity | 7,259,307 | 6,616,762 | ||||||
| Total Liabilities and Equity | $ | 9,494,341 | $ | 9,054,144 | ||||
The accompanying notes are an integral part of these unaudited condensed consolidated financial statements
| F-2 |
SINO-GLOBAL SHIPPING AMERICA, LTD. AND AFFILIATES
CONDENSED CONSOLIDATED STATEMENTS OF OPERATIONS AND COMPREHENSIVE INCOME
(UNAUDITED)
| For the Three Months Ended September 30, | ||||||||
| 2016 | 2015 | |||||||
| Net revenues | $ | 1,944,402 | $ | 2,699,218 | ||||
| Cost of revenues | (306,339 | ) | (1,240,676 | ) | ||||
| Gross profit | 1,638,063 | 1,458,542 | ||||||
| General and administrative expenses | (859,914 | ) | (930,842 | ) | ||||
| Selling expenses | (65,309 | ) | (14,623 | ) | ||||
| Total operating expenses | (925,223 | ) | (945,465 | ) | ||||
| Operating income | 712,840 | 513,077 | ||||||
| Financial expense, net | (3,434 | ) | (117,207 | ) | ||||
| Total other expense | (3,434 | ) | (117,207 | ) | ||||
| Net income before provision for income taxes | 709,406 | 395,870 | ||||||
| Income tax expense | (71,621 | ) | (240,822 | ) | ||||
| Net income | 637,785 | 155,048 | ||||||
| Net loss attributable to non-controlling interest | (7,935 | ) | (29,110 | ) | ||||
| Net income attributable to Sino-Global Shipping America, Ltd. | $ | 645,720 | $ | 184,158 | ||||
| Comprehensive income | ||||||||
| Net income | $ | 637,785 | $ | 155,048 | ||||
| Foreign currency translation (loss) gain | (14,570 | ) | (120,636 | ) | ||||
| Comprehensive income | 623,215 | 34,412 | ||||||
| Less: Comprehensive income (loss) attributable to non-controlling interest | 2,609 | (58,532 | ) | |||||
| Comprehensive income attributable to Sino-Global Shipping America Ltd. | $ | 620,606 | $ | 92,944 | ||||
| Earnings per share | ||||||||
| -Basic and diluted | $ | 0.08 | $ | 0.02 | ||||
| Weighted average number of common shares used in computation | ||||||||
| -Basic and diluted | 8,280,535 | 8,321,928 | ||||||
The accompanying notes are an integral part of these unaudited condensed consolidated financial statements
| F-3 |
SINO-GLOBAL SHIPPING AMERICA LTD. AND AFFILIATE
CONDENSED CONSOLIDATED STATEMENTS OF CASH FLOWS
(UNAUDITED)
| For the three months ended September 30, | ||||||||
| 2016 | 2015 | |||||||
| Operating Activities | ||||||||
| Net income | $ | 637,785 | $ | 155,048 | ||||
| Adjustment to reconcile net income to net cash provided by (used in) operating activities | ||||||||
| Stock-based compensation expense | 19,330 | - | ||||||
| Amortization of stock-based compensation to consultants | 398,996 | 246,125 | ||||||
| Depreciation and amortization | 13,342 | 15,352 | ||||||
| Recovery of doubtful accounts | (109,693 | ) | (14,415 | ) | ||||
| Deferred tax benefit | - | (19,000 | ) | |||||
| Changes in assets and liabilities | ||||||||
| Decrease in accounts receivable | 1,664,027 | 182,441 | ||||||
| Decrease (increase) in other receivables | 99,823 | (155,078 | ) | |||||
| Increase in advances to suppliers | (1,422,433 | ) | (6,032 | ) | ||||
| Decrease (increase) in prepaid expense | (74,022 | ) | 1,120 | |||||
| Decrease (increase) in other assets | (5,252 | ) | 715 | |||||
| Decrease (increase) in due from related parties | 504,824 | (485,876 | ) | |||||
| Decrease in advances from customers | - | (100,369 | ) | |||||
| Decrease in accounts payable | (482,658 | ) | (352,263 | ) | ||||
| Increase in taxes payable | 76,140 | 321,313 | ||||||
| Increase (decrease) in accrued expenses and other current liabilities | 204,165 | (52,964 | ) | |||||
| Net cash provided by (used in) operating activities | 1,524,374 | (263,883 | ) | |||||
| Investing Activities | ||||||||
| Acquisitions of property and equipment | - | (927 | ) | |||||
| Net cash used in investing activities | - | (927 | ) | |||||
| Financing Activities | ||||||||
| Proceeds from issuance of common stock, net | - | 632,264 | ||||||
| Net cash provided by financing activities | - | 632,264 | ||||||
| Effect of exchange rate fluctuations on cash and cash equivalents | (14,103 | ) | (79,313 | ) | ||||
| Net increase in cash and cash equivalents | 1,510,271 | 288,141 | ||||||
| Cash and cash equivalents at beginning of period | 1,385,994 | 730,322 | ||||||
| - | ||||||||
| Cash and cash equivalents at end of period | $ | 2,896,265 | $ | 1,018,463 | ||||
| Supplemental information | ||||||||
| Income taxes paid | $ | 6,446 | $ | - | ||||
The accompanying notes are an integral part of these unaudited condensed consolidated financial statements
| F-4 |
SINO-GLOBAL SHIPPING AMERICA, LTD. AND AFFILIATES
NOTES TO THE UNAUDITED CONDENSED CONSOLIDATED FINANCIAL STATEMENTS
Note 1. ORGANIZATION AND NATURE OF BUSINESS
Founded in the United States (“US”) in 2001, Sino-Global Shipping America, Ltd. (“Sino-Global” or the “Company”) is a non-asset based global shipping and freight logistic integrated solution provider. The Company provides tailored solutions and value added services to its customers to drive effectiveness and control in related links throughout the entire shipping and freight logistic chain. The Company conducts its business primarily through its wholly-owned subsidiaries in the U.S., China (including Hong Kong), Australia and Canada. Currently, a significant portion of the Company’s business is generated from the clients located in the People’s Republic of China (the “PRC”), and its operations are currently primarily conducted in the PRC.
The Company’s subsidiary in China, Trans Pacific Shipping Limited (“Trans Pacific Beijing”), a wholly owned foreign enterprise, invested in one 90%-owned subsidiary, Trans Pacific Logistics Shanghai Limited (“Trans Pacific Shanghai”). Trans Pacific Beijing and Trans Pacific Shanghai are referred to collectively as “Trans Pacific”.
The Company’s shipping agency business was operated by its subsidiaries in China (including Hong Kong). The Company’s ship management services were operated by its subsidiary in Hong Kong. The Company’s shipping and chartering services were operated by its subsidiary in the US and subsidiaries in Hong Kong. The Company’s inland transportation management services are operated by its subsidiaries in China and US. The Company’s freight logistic services are operated by its subsidiaries in the US.
In January 2016, the Company formed a subsidiary, Sino-Global Shipping LA Inc. (“Sino LA”), for the purpose of expanding its business to provide freight logistic services to importers who ship goods into the U.S. The Company expects to generate increased revenue from this new service platform in the near future.
In the fiscal year of 2016, affected by the worsening market conditions in the shipping industry, the Company’s shipping agency business segment suffered a significant decrease due to a reduced number of ships served. Therefore, the Company has temporarily suspended its shipping agency services business. Also, suffered by this market condition changes, the Company has temporarily suspended its ship management services. In addition, in December 2015, the Company also temporarily suspended its shipping and chartering services business primarily as a result of the termination of its previously contemplated vessel acquisition. As of September 30, 2016, the Company’s current service offerings consist of inland transportation management services and freight logistic services.
In August 2016, the Company’s Board of Directors (the “Board”) authorized management to move forward with the development of a mobile application that will provide a full-service logistics platform between the US and China for short-haul trucking in the US. The decision follows an extensive review by the Company's management team and Board in identifying Sino-Global's key competitive advantages as an expert in global logistics between the US and China, and then leveraging that experience to both address the needs of its customer base and provide solutions to current issues affecting logistics and supply chain. The Company completed a market analysis and feasibility study related to building a mobile based logistics application for short-haul trucking in US ports to better manage the over 25 million containers, or TEU moving between China and the US each year.
Note 2. SUMMARY OF SIGNIFICANT ACCOUNTING POLICIES
(a) Basis of Presentation
The accompanying unaudited condensed consolidated financial statements have been prepared in accordance with accounting principles generally accepted in the United States of America (“US GAAP”) for interim financial information pursuant to the rules and regulations of the Securities and Exchange Commission (“SEC”). All significant intercompany transactions and balances have been eliminated in consolidation. In the opinion of management, all adjustments considered necessary to give a fair presentation have been included. Interim results are not necessarily indicative of results of a full year. The information in this Form 10-Q should be read in conjunction with information included in the Company’s annual report on Form 10-K for the fiscal year ended June 30, 2016 filed with the SEC on September 19, 2016.
(b) Basis of Consolidation
The unaudited condensed consolidated financial statements include the accounts of the Company, its subsidiaries, and its affiliates. All significant intercompany transactions and balances are eliminated in consolidation. Sino-Global Shipping Agency Ltd. (“Sino-China”) is considered a variable interest entity (“VIE”), and the Company is the primary beneficiary. The Company through Trans Pacific Beijing entered into agreements with Sino-China, pursuant to which the Company receives 90% of Sino-China’s net income. The Company does not receive any payment from Sino-China unless Sino-China recognizes net income during its fiscal year. These agreements do not entitle the Company to any consideration if Sino-China incurs a net loss during its fiscal year. If Sino-China incurs a net loss during its fiscal year, the Company is not required to absorb such net loss.
| F-5 |
As a VIE, Sino-China’s revenues are included in the Company’s total revenues, and its loss from operations is consolidated with that of the Company. Because of the contractual arrangements, the Company had a pecuniary interest in Sino-China that requires consolidation of the financial statements of the Company and Sino-China.
The Company has consolidated Sino-China’s operating results because the entities are under common control in accordance with ASC 805-10, “Business Combinations”. The agency relationship between the Company and Sino-China and its branches is governed by a series of contractual arrangements pursuant to which the Company has substantial control over Sino-China. Management makes ongoing reassessments of whether the Company is the primary beneficiary of Sino-China. As mentioned elsewhere in this report, due to the worsening market conditions in the shipping industry, Sino-China’s shipping agency business suffered a significant decrease due to a reduced number of ships served. Therefore, the Company has temporarily suspended this business.
The carrying amount and classification of Sino-China's assets and liabilities included in the Company’s Unaudited Condensed Consolidated Balance Sheets were as follows:
| September 30, | June 30, | |||||||
| 2016 | 2016 | |||||||
| Total current assets | $ | 30,713 | $ | 31,128 | ||||
| Total assets | 125,377 | 129,463 | ||||||
| Total current liabilities | 7,197 | 7,222 | ||||||
| Total liabilities | 7,197 | 7,222 | ||||||
(c) Use of Estimates and Assumptions
The preparation of the unaudited condensed consolidated financial statements in conformity with US GAAP requires management to make estimates and assumptions that affect the reported amounts of assets and liabilities and disclosure of contingent assets and liabilities at the dates of the financial statements and the reported amounts of revenues and expenses during the reporting periods. Estimates are adjusted to reflect actual experience when necessary. Significant accounting estimates reflected in the Company’s unaudited condensed consolidated financial statements include revenue recognition, fair value of stock based compensation, cost of revenues, allowance for doubtful accounts, deferred income taxes, and the useful lives of property and equipment.
Since the use of estimates is an integral component of the financial reporting process, actual results could differ from those estimates.
(d) Revenue Recognition Policy
| ● | Revenues from shipping agency services are recognized upon completion of services, which coincides with the date of departure of the relevant vessel from port. Advance payments and deposits received from customers prior to the provision of services and recognition of the related revenues are presented as advances from customers. |
| ● | Revenues from shipping and chartering services are recognized upon performance of services as stipulated in the underlying contracts. |
| ● | Revenues from inland transportation management services are recognized when commodities are being released from the customers’ warehouse. |
| ● | Revenues from ship management services are recognized when the related contractual services are rendered. |
| ● | Revenues from freight logistic services are recognized when the related contractual services are rendered. |
(e) Translation of Foreign Currency
The accounts of the Company and its subsidiaries, including Sino-China and each of its branches are measured using the currency of the primary economic environment in which the entity operates (the “functional currency”). The Company’s functional currency is the US dollar (“USD”) while its subsidiaries in China, including Sino-China report its financial position and results of operations in Renminbi (“RMB”). The accompanying unaudited condensed consolidated financial statements are presented in US dollars. Foreign currency transactions are translated into USD using fixed exchange rates in effect at the time of the transaction. Generally foreign exchange gains and losses resulting from the settlement of such transactions are recognized in the unaudited condensed consolidated statements of operations. The Company translates foreign currency financial statements of Sino-China, Sino-Global Shipping Australia, Sino-Global Shipping Hong Kong, Sino-Global Shipping Canada, Trans Pacific Beijing and Trans Pacific Shanghai in accordance with ASC 830-10, “Foreign Currency Matters”. Assets and liabilities are translated at current exchange rates quoted by the People’s Bank of China at the balance sheet dates and revenues and expenses are translated at average exchange rates in effect during the year. Resulting translation adjustments are recorded as other comprehensive income (loss) and accumulated other comprehensive loss as a separate component of equity of the Company and also included in non-controlling interest.
| F-6 |
The exchange rates as of September 30, 2016 and June 30, 2016 and for the three months ended September 30, 2016 and 2015 are as follows:
| September 30, | June 30, | Three months ended September 30, | ||||||||||||||
| 2016 | 2016 | 2016 | 2015 | |||||||||||||
| Foreign currency | Balance Sheet | Balance Sheet | Profits/Loss | Profits/Loss | ||||||||||||
| RMB:1USD | 6.6714 | 6.6487 | 6.6668 | 6.3031 | ||||||||||||
| 1AUD:USD | 1.3044 | 1.3433 | 1.3194 | 1.3792 | ||||||||||||
| 1HKD:USD | 7.7558 | 7.7595 | 7.7565 | 7.7517 | ||||||||||||
| 1CAD:USD | 1.3119 | 1.2992 | 1.3045 | 1.3086 | ||||||||||||
(f) Cash and Cash Equivalents
Cash and cash equivalents consist of cash on hand, and other highly liquid investments which are unrestricted as to withdrawal or use, and which have maturities of three months or less when purchased. The Company maintains cash and cash equivalents with various financial institutions mainly in the PRC, Australia, Hong Kong and the United States. As of September 30 and June 30, 2016, cash balances of $2,855,598 and $1,333,713, respectively, were maintained at financial institutions in the PRC, and are not insured by the Federal Deposit Insurance Corporation or other programs.
(g) Accounts Receivable
Accounts receivable are presented at net realizable value. The Company maintains allowances for doubtful accounts for estimated losses. The Company reviews the accounts receivable on a periodic basis and makes general and specific allowances when there is doubt as to the collectability of individual receivable balances. In evaluating the collectability of individual receivable balances, the Company considers many factors, including the age of the balances, customers’ historical payment history, their current credit-worthiness and current economic trends. Receivables are considered past due after 365 days. Accounts Receivable is written off against the allowance after exhaustive efforts at collection.
(h) Earnings (loss) per Share
Basic earnings (loss) per share is computed by dividing net income (loss) attributable to holders of common shares by the weighted average number of common shares outstanding during the applicable period. Diluted earnings per share reflect the potential dilution that could occur if securities or other contracts to issue common shares were exercised or converted into common shares. Common share equivalents are excluded from the computation of diluted earnings per share if their effects would be anti-dilutive.
The effect of 66,000 stock options and 139,032 warrants for all periods presented was not included in the calculation of diluted EPS because they would be anti-dilutive.
The effect of 150,000 stock options was not included in the calculation of diluted EPS because such options were anti-dilutive.
(i) Stock-based Compensation
Valuations are based upon highly subjective assumptions about the future, including stock price volatility and exercise patterns. The fair value of share-based payment awards was estimated using the Black-Scholes option pricing model. Expected volatilities are based on the historical volatility of the Company’s stock. The Company uses historical data to estimate option exercise and employee terminations. The expected term of options granted represents the period of time that options granted are expected to be outstanding. The risk-free rate for periods within the expected life of the option is based on the U.S. Treasury yield curve in effect at the time of the grant.
(j) Risks and Uncertainties
The Company’s business, financial position and results of operations may be influenced by the political, economic, and legal environments in the PRC, as well as by the general state of the PRC economy. The Company’s operations in the PRC are subject to special considerations and significant risks not typically associated with companies in North America and Western Europe. These include risks associated with, among others, the political, economic and legal environment and foreign currency exchange. The Company’s results may be adversely affected by changes in the political, regulatory and social conditions in the PRC, and by changes in governmental policies or interpretations with respect to laws and regulations, anti-inflationary measures, currency conversion, remittances abroad, and rates and methods of taxation, among other things. Moreover, the Company’s ability to grow its business and maintain its profitability could be negatively affected by the nature and extent of services provided to its major customers, Tianjin Zhi Yuan Investment Group Co., Ltd. (the “Zhiyuan Investment Group”) and Tengda Northwest Ferroalloy Co., Ltd. (“Tengda Northwest”).
| F-7 |
(k) Reclassifications
Certain prior year amounts have been reclassified to conform to the current period presentation. These reclassifications have no effect on the results of operations and cash flows.
(l) Recent Accounting Pronouncements
In August 2016, the Financial Accounting Standards Board (the “FASB”) has issued Accounting Standards Update (ASU) No. 2016-15, Statement of Cash Flows (Topic 230): Classification of Certain Cash Receipts and Cash Payments, to address diversity in how certain cash receipts and cash payments are presented and classified in the statement of cash flows. The amendments provide guidance on the following eight specific cash flow issues: (1) Debt Prepayment or Debt Extinguishment Costs; (2) Settlement of Zero-Coupon Debt Instruments or Other Debt Instruments with Coupon Interest Rates That Are Insignificant in Relation to the Effective Interest Rate of the Borrowing; (3) Contingent Consideration Payments Made after a Business Combination; (4)Proceeds from the Settlement of Insurance Claims; (5) Proceeds from the Settlement of Corporate-Owned Life Insurance Policies, including Bank-Owned; (6) Life Insurance Policies; (7) Distributions Received from Equity Method Investees; (8) Beneficial Interests in Securitization Transactions; and Separately Identifiable Cash Flows and Application of the Predominance Principle. The amendments are effective for public business entities for fiscal years beginning after December 15, 2017, and interim periods within those fiscal years. For all other entities, the amendments are effective for fiscal years beginning after December 15, 2018, and interim periods within fiscal years beginning after December 15, 2019. Early adoption is permitted, including adoption in an interim period. The amendments should be applied using a retrospective transition method to each period presented. If it is impracticable to apply the amendments retrospectively for some of the issues, the amendments for those issues would be applied prospectively as of the earliest date practicable. The Company is currently evaluating the impact of this new standard on its financial statements and related disclosures.
In October 2016, the FASB has issued ASU No. 2016-16, Income Taxes (Topic 740): Intra-Entity Transfers of Assets Other Than Inventory. The amendments require an entity to recognize income tax consequences of an intra-entity transfer of an asset other than inventory when the transfer occurs and remove the exception to postpone recognition until the asset has been sold to an outside party. The amendments are effective for public business entities for annual reporting periods beginning after December 15, 2017, including interim reporting periods within those annual reporting periods. For all other entities, the amendments are effective for annual reporting periods beginning after December 15, 2018, and interim reporting periods within annual reporting periods beginning after December 15, 2019. Early adoption is permitted. The Company is currently evaluating the impact of this new standard on its financial statements and related disclosures.
In October 2016, the FASB has issued ASU No. 2016-17, Consolidation (Topic 810): Interest Held through Related Parties That Are under Common Control, to provide guidance on the evaluation of whether a reporting entity is the primary beneficiary of a VIE by amending how a reporting entity, that is a single decision maker of a VIE, treats indirect interests in that entity held through related parties that are under common control. The amendments are effective for public business entities for fiscal years beginning after December 15, 2016, including interim periods within those fiscal years. For all other entities, the amendments are effective for fiscal years beginning after December 15, 2016, and interim periods within fiscal years beginning after December 15, 2017. Early adoption is permitted, including adoption in an interim period. The Company is currently evaluating the impact of this new standard on its financial statements and related disclosures.
Note 3. ADVANCES TO SUPPLIERS
The Company’s advances to suppliers are as follows:
| September 30, | June 30, | |||||||
| 2016 | 2016 | |||||||
| Freight fees (a) | $ | 3,610,846 | $ | 2,192,910 | ||||
| Others | 4,497 | - | ||||||
| Total | $ | 3,615,343 | $ | 2,192,910 | ||||
(a) On June 10, 2016, the Company entered into a Memorandum of Understanding (“MOU”) with Singapore Metals & Minerals Pte Ltd. (the “Buyer”) and Galasi Jernsih Sdn BHD (the “Seller”), whereby the Buyer will be the bauxite purchaser for the 3,000,000 MT/year, subject to the results of the tests satisfying the Buyer’s requirements. Both the Buyer and the Seller agree that the Company shall be appointed as general agent to handle logistics and transportation including ocean shipping and inland transportation for both sides, and all door to door transportation services for the shipping of the bauxite to be sold by the Seller and to be purchased by the Buyer as referenced in this MOU. On the same day, the Company signed a supplementary agreement with the Buyer, which states the Company should assist the Buyer in handling transportation service from the source mine to dock to help the Buyer to fulfill the delivery favorably and close the deal smoothly. The Company agrees to make advance payments for freight charges on behalf of the Buyer. As of September 30, 2016, the ending balance of this prepayment was $3,610,846. The Company expects the related advance payments will be recognized as cost of sales during the next 12 months.
Note 4. ACCOUNTS RECEIVABLE, NET
The Company’s net accounts receivable are as follows:
| F-8 |
| September 30, | June 30, | |||||||
| 2016 | 2016 | |||||||
| Trade accounts receivable | $ | 876,025 | $ | 2,540,052 | ||||
| Less: allowances for doubtful accounts | (97,534 | ) | (207,028 | ) | ||||
| Accounts receivables, net | $ | 778,491 | $ | 2,333,024 | ||||
For the three months ended September 30, 2016, recovery of doubtful accounts receivable was $109,693, because the Company fully collected the balance from Tengda Northwest Ferroalloy Co., Ltd. For the three months ended September 30, 2015, recovery of doubtful accounts receivable was $14,415.
Note 5. OTHER RECEIVABLES
Other receivables represent mainly prepaid employee insurance and welfare benefits, which will be subsequently deducted from the employee payroll, guarantee deposits on behalf of ship owners as well as office lease deposits with the landlords.
Note 6. PREPAID EXPENSES AND OTHER CURRENT ASSETS
The Company’s prepaid expenses and other current assets are as follows:
| September 30, | June 30, | |||||||
| 2016 | 2016 | |||||||
| Consultant fees (1) | $ | 520,205 | $ | 845,420 | ||||
| Advance to employees | 105,520 | 105,137 | ||||||
| Other | 59,918 | 55,056 | ||||||
| Total | 685,643 | 1,005,613 | ||||||
| Less current portion | 562,723 | 826,631 | ||||||
| Total noncurrent portion | $ | 122,920 | $ | 178,982 | ||||
(1): The Company entered into management consulting and advisory services agreements with two consultants on June 6, 2014, pursuant to which the consultants should assist the Company in, among other things, financial and tax due diligence, business evaluation and integration, and development of pro forma financial statements. In return for their services, as approved by the Company’s Board of Directors, a total of 600,000 shares of the Company’s common stock were issued to these two consultants. Their service agreements are for the period from July 1, 2014 to December 31, 2016.
In addition, on May 5, 2015, the Company entered into management consulting and advisory services agreements with three consultants, pursuant to which the consultants should assist the Company in, among other things, review of time charter agreements; crew management advisory; development of permanent and preventive maintenance standards related to dry dockings and ship repairs; development of regular technical and marine vessel inspections and quality control procedures; and development and implementation of alternative remedial actions to address any technical problems that may arise. In return for their services, as approved by the Company’s Board of Directors, a total of 500,000 shares of the Company’s common stock were to be issued to these three consultants. Their service agreements are for a period of 18 months, effective May 2015. The value of their consulting services was determined using the fair value of the Company’s common stock of $1.50 per share when the shares were issued to the consultants.
The Company entered into another management consulting services agreement with a consulting company on November 12, 2015, pursuant to which the consulting company should assist the Company for regulatory filings during the period from July 1, 2016 to June 30, 2018. In return for their services, as approved by the Company’s Board of Directors, a total of RMB 2,100,000 ($316,298) was paid to this consulting company.
On December 9, 2015, the Company entered into a consulting and advisory services agreement, pursuant to which the consultant will assist the Company for corporate restructuring, business evaluation and capitalization during the period from November 20, 2015 to November 19, 2016. In return for such services, the Company issued 250,000 shares of the Company’s common stock for services to be rendered during the first six months of the service period. Such shares were issued as restricted shares at $1.02 per share on December 9, 2015. On May 23, 2016, the Company issued an additional 250,000 shares of common stock at $0.72 per share to cover the services from the seventh month to November 19, 2016.
The above-mentioned consulting fees have been and will be ratably charged to expense over the terms of the above-mentioned agreements.
| F-9 |
Note 7. PROPERTY AND EQUIPMENT, NET
The Company’s net property and equipment as follows:
| September 30, | June 30, | |||||||
| 2016 | 2016 | |||||||
| Land and building | $ | 201,761 | $ | 202,450 | ||||
| Motor vehicles | 495,233 | 497,006 | ||||||
| Computer equipment | 156,672 | 156,890 | ||||||
| Office equipment | 59,741 | 59,899 | ||||||
| Furniture and fixtures | 164,442 | 164,701 | ||||||
| System software | 119,574 | 119,964 | ||||||
| Leasehold improvement | 63,886 | 64,105 | ||||||
| Total | 1,261,309 | 1,265,015 | ||||||
| Less: Accumulated depreciation and amortization | 1,098,550 | 1,088,648 | ||||||
| Property and equipment, net | $ | 162,759 | $ | 176,367 | ||||
Depreciation and amortization expense for the three months ended September 30, 2016 and 2015 were $13,342 and $15,352, respectively.
Note 8. ACCRUED EXPENSES AND OTHER CURRENT LIABILITIES
Accrued expenses and other current liabilities represent mainly payroll and welfare payable, accrued expenses and other miscellaneous items.
Note 9. SHARE-BASED COMPENSATION
The issuance of the Company’s Options is exempted from registration under of the Securities Act of 1933, as amended (the “Act”). The Common Stock underlying the Options granted may be sold in compliance with Rule 144 under the Act. Each option may be exercised to purchase one share of Common Stock. Payment for the options may be made in cash or by exchanging shares of Common Stock at their Fair Market Value. The Fair Market Value will be equal to the average of the highest and lowest registered sales prices of Company Stock on the date of exercise.
The term of the 56,000 options granted in 2009 is 10 years and the exercise price of the 56,000 options issued in 2009 is $7.75. The fair value of the 56,000 stock options was estimated using the Black-Scholes option-pricing model with the following assumptions: volatility of 173.84%, risk free interest rate of 3.02% and expected life of 5 years. The total fair value of the options was $413,107. In accordance with the vesting periods, the Company recorded no operating expense-stock compensation for the three months ended September 30, 2016 and 2015.
The term of the 10,000 options granted in 2013 is 10 years and the exercise price of the 10,000 options issued in 2013 is $2.01. The fair value of the 10,000 stock options was calculated at the grant date using the Black-Scholes option-pricing model with the following assumptions: volatility of 452.04%, risk free interest rate of 0.88% and expected life of 5 years. The total fair value of the options was $19,400. In accordance with the vesting periods, the Company recorded no operating expense-stock compensation for the three months ended September 30, 2016 and 2015.
Pursuant to the Company’s 2014 Stock Incentive Plan, effective on July 26, 2016, the Company granted 150,000 options to purchase an aggregate of 150,000 shares of the Company's common stock to two employees with a one-year vesting period, one half of which vested on October 26, 2016, and the other half vested on July 26, 2017. The exercise price of the 150,000 options is $1.10, which was equal to the share price of the Company’s ordinary shares on July 26, 2016. The grand date fair value of such options was $0.77 per share. The fair value of the 150,000 options was calculated using the Black-Scholes options pricing model with the following assumptions: volatility of 99.68%, risk free interest rate of 1.15%, and expected life of 5 years. The total fair value of the options was $115,979. In accordance with the vesting periods, $19,330 was recorded as part of operating expense-stock compensation for the 150,000 options for the three months ended September 30, 2016. The Company recorded no operating expense-stock compensation for the three months ended September 30, 2015.
A summary of the options is presented in the table below:
| Shares | Weighted Average Exercise Price | |||||||
| Options outstanding, as of June 30, 2016 | 66,000 | $ | 6.88 | |||||
| Granted | 150,000 | 1.10 | ||||||
| Canceled, forfeited or expired | - | $ | - | |||||
| Options outstanding, as of September 30, 2016 | 216,000 | $ | 2.87 | |||||
| Options exercisable, as of September 30, 2016 | 62,000 | $ | 7.19 | |||||
| F-10 |
Following is a summary of the status of options outstanding and exercisable at September 30, 2016:
| Outstanding Options | Exercisable Options | |||||||||||||||||||
| Exercise Price | Number | Average Remaining Contractual Life | Average Exercise Price | Number | Average Remaining Contractual Life | |||||||||||||||
| $ | 7.75 | 56,000 | 1.63 years | $ | 7.75 | 56,000 | 1.63 years | |||||||||||||
| $ | 2.01 | 10,000 | 6.64 years | $ | 2.01 | 6,000 | 6.64 years | |||||||||||||
| $ | 1.10 | 150,000 | 4.82 years | $ | - | - | - | |||||||||||||
| 216,000 | 62,000 | |||||||||||||||||||
Following is a summary of the status of warrants outstanding and exercisable at September 30, 2016:
| Warrants Outstanding | Warrants Exercisable | Weighted Average Exercise Price | Average Remaining Contractual Life | |||||||||
| 139,032 | 139,032 | $ | 9.30 | 1.63 years | ||||||||
Note 10. NON-CONTROLLING INTEREST
The Company’s non-controlling interest consists of the following:
| September 30, | June 30, | |||||||
| 2016 | 2016 | |||||||
| Sino-China: | ||||||||
| Original paid-in capital | $ | 356,400 | $ | 356,400 | ||||
| Additional paid-in capital | 1,044 | 1,044 | ||||||
| Accumulated other comprehensive income | 167,655 | 157,019 | ||||||
| Accumulated deficit | (5,355,112 | ) | (5,349,210 | ) | ||||
| (4,830,013 | ) | (4,834,747 | ) | |||||
| Trans Pacific Logistics Shanghai Ltd. | 25,275 | 27,400 | ||||||
| Total | $ | (4,804,738 | ) | $ | (4,807,347 | ) | ||
Note 11. COMMITMENTS AND CONTINGENCIES
Lease Obligations
The Company leases certain office premises and apartments for employees under operating leases through April 16, 2020. Future minimum lease payments under operating lease agreements are as follows:
| Amount | ||||
| Twelve months ending September 30, | ||||
| 2017 | $ | 233,932 | ||
| 2018 | 132,999 | |||
| 2019 | 106,201 | |||
| 2020 | 22,468 | |||
| $ | 495,600 | |||
Rent expense for the three months ended September 30, 2016 and 2015 was $62,335 and $50,518, respectively.
| F-11 |
Legal proceedings
During the quarter ended December 31, 2015, a former Vice President of the Company, Mr. Alexander Chen, filed a complaint with the U.S. Department of Labor-Occupational Safety and Health Administration (“OSHA”) against the Company and three current or former executives. Mr. Chen is seeking $350,000 plus attorney’s fees for the alleged retaliation and a purported breach of his employment agreement. The Company has responded to the complaint filed with OSHA, providing argument and information supporting the Company’s position that no violation of law in connection with Chen’s employment. As of the date of this report, the Company offered to settle the complaint by $90,000 and has accrued $90,000 as the Company’s liability, which was expensed directly in the three months ended September 30, 2016.
Contingency
The Labor Contract Law of the PRC requires employers to insure the liability of the severance payments if employees are terminated and have been working for the employers for at least two years prior to January 1, 2008. The employers will be liable for one month for severance pay for each year of the service provided by the employees. As of September 30, 2016 and June 30, 2016, the Company has estimated its severance payments of approximately $61,000 and $62,500, respectively, which has not been reflected in its consolidated financial statements, because management cannot predict what the actual payment, if any, will be in the future.
Note 12. INCOME TAXES
The income tax expense for the three months ended September 30, 2016 and 2015 are as follows:
| For the three months ended September 30, | ||||||||
| 2016 | 2015 | |||||||
| Current | ||||||||
| Hong Kong | $ | (6,525 | ) | $ | - | |||
| China | (65,096 | ) | (259,822 | ) | ||||
| (71,621 | ) | (259,822 | ) | |||||
| Deferred | ||||||||
| USA | - | 19,000 | ||||||
| - | 19,000 | |||||||
| Total | $ | (71,621 | ) | $ | (240,822 | ) | ||
The Company’s deferred tax assets are comprised of the following:
| September 30, | June 30, | |||||||
| 2016 | 2016 | |||||||
| Allowance for doubtful accounts | $ | 65,000 | $ | 65,000 | ||||
| Stock-based compensation | 743,000 | 735,000 | ||||||
| Net operating loss | 3,570,000 | 3,752,000 | ||||||
| Total deferred tax assets | 4,378,000 | 4,552,000 | ||||||
| Valuation allowance | (4,378,000 | ) | (4,552,000 | ) | ||||
| Deferred tax assets, net - long-term | $ | - | $ | - | ||||
The Company’s operations in the U.S. have incurred a cumulative net operating loss of approximately $7,966,000 and $8,629,000, respectively, as of September 30, 2016 and June 30, 2016, which may reduce future taxable income. During the three months ended September 30, 2016 the amount of utilization of Federal Net Operating Losses (“NOL”) is $400,144 and the tax benefit derived from such NOL is $136,000, in the corresponding period for the three months ended September 30, 2015 the utilization of NOL is nil and no tax benefit derived from NOL. This carry-forward will expire if not utilized by 2036.
| F-12 |
The Company periodically evaluates the likelihood of the realization of deferred tax assets, and reduces the carrying amount of the deferred tax assets by a valuation allowance to the extent it believes a portion will not be realized. The Company considers many factors when assessing the likelihood of future realization of the deferred tax assets, including its recent cumulative earnings experience, expectation of future income, the carry forward periods available for tax reporting purposes, and other relevant factors. Part of the Company’s traditional business, such as shipping agency services and shipping & chartering services, is temporarily suspended. In addition, the Company’s new business of mobile application is still in developing stage. Management concluded that the profitability of the Company’s U.S. entities is difficult to be predicted, and accordingly a 100% valuation allowance has been provided against the deferred tax assets balance as of September 30, 2016 based on management’s estimate. The net decrease in the valuation allowance for the three months ended September 30, 2016 was $174,000 and the net increase in the valuation allowance for the same period of 2015 was $171,000, respectively.
The Company’s taxes payable consists of the following:
| September 30, | June 30, | |||||||
| 2016 | 2016 | |||||||
| VAT tax payable | $ | 486,084 | $ | 475,066 | ||||
| Corporate income tax payable | 1,160,477 | 1,100,380 | ||||||
| Others | 66,776 | 61,751 | ||||||
| Total | $ | 1,713,337 | $ | 1,637,197 | ||||
Note 13. CONCENTRATIONS
Major Customers
For the three months ended September 30, 2016, three customers accounted for 44%, 33% and 13% of the Company’s revenues, respectively. At September 30, 2016, one of these three customers accounted for 100% of the Company’s due from related parties and the remaining two customers accounted for approximately 83% of the Company’s accounts receivable, respectively. See Note 15.
For the three months ended September 30, 2015, three customers accounted for approximately 28%, 19% and 13% of the Company’s revenues, respectively. At September 30, 2015, one of these three customers accounted for approximately 87% of the Company’s due from related parties balance and the remaining two customers accounted for 80% and 15% of the Company’s accounts receivable, respectively. See Note 15.
Major Suppliers
For the three months ended September 30, 2016, two suppliers accounted for 18% and 10% of the total cost of revenues, respectively. For the three months ended September 30, 2015, two suppliers accounted for 43% and 29% of the total cost of revenues, respectively.
Note 14. SEGMENT REPORTING
ASC 280, “Segment Reporting,” establishes standards for reporting information about operating segments on a basis consistent with the Company's internal organizational structure as well as information about geographical areas, business segments and major customers in financial statements for details on the Company's business segments.
The Company's chief operating decision maker has been identified as the Chief Executive Office who reviews the financial information of separate operating segments when making decisions about allocating resources and assessing performance of the group. As the Company has determined that it has four operating segments: shipping agency & ship management services, shipping & chartering services, inland transportation management services, and freight logistics services. However, due to the downturn of the shipping industry, the Company has decided to temporarily suspend to provide shipping agency & ship management services, and shipping & chartering services.
The following tables present summary information by segment for the three months ended September 30, 2016 and 2015, respectively:
| For the three months Ended September 30, 2016 | ||||||||||||||||||||
| Shipping Agency & Ship Management Services | Shipping & Chartering Services | Inland Transportation Management Services | Freight Logistic Services | Total | ||||||||||||||||
| Revenues | $ | - | $ | - | $ | 1,485,735 | $ | 458,667 | $ | 1,944,402 | ||||||||||
| Cost of revenues | $ | - | $ | - | $ | 104,001 | $ | 202,338 | $ | 306,339 | ||||||||||
| Gross profit | $ | - | $ | - | $ | 1,381,734 | $ | 256,329 | $ | 1,638,063 | ||||||||||
| Depreciation and amortization | $ | - | $ | - | $ | 7,972 | $ | 5,370 | $ | 13,342 | ||||||||||
| Total capital expenditures | $ | - | $ | - | $ | - | $ | - | $ | - | ||||||||||
| F-13 |
| For the three months Ended September 30, 2015 | ||||||||||||||||||||
| Shipping Agency & Ship Management Services | Shipping & Chartering Services | Inland Transportation Management Services | Freight Logistic Services | Total | ||||||||||||||||
| Revenues | $ | 1,059,385 | $ | 446,218 | $ | 1,193,615 | $ | - | $ | 2,699,218 | ||||||||||
| Cost of revenues | $ | 847,613 | $ | 204,510 | $ | 188,553 | $ | - | $ | 1,240,676 | ||||||||||
| Gross profit | $ | 211,772 | $ | 241,708 | $ | 1,005,062 | $ | - | $ | 1,458,542 | ||||||||||
| Depreciation and amortization | $ | 9,910 | $ | 176 | $ | 5,266 | $ | - | $ | 15,352 | ||||||||||
| Total capital expenditures | $ | 927 | $ | - | $ | - | $ | - | $ | 927 | ||||||||||
Total assets as of:
| September 30, | June 30, | |||||||
| 2016 | 2016 | |||||||
| Shipping Agency and Ship Management Services | $ | - | $ | 1,271,948 | ||||
| Shipping & Chartering Services | - | 534,896 | ||||||
| Inland Transportation Management Services | 9,331,229 | 7,247,300 | ||||||
| Freight Logistic Services | 163,112 | - | ||||||
| Total Assets | $ | 9,494,341 | $ | 9,054,144 | ||||
Note 15. RELATED PARTY TRANSACTIONS
In June 2013, the Company signed a five-year global logistic service agreement with TianJin Zhi Yuan Investment Group Co., Ltd. (the “Zhiyuan Investment Group”) and TEWOO Chemical & Light Industry Zhiyuan Trade Co., Ltd. (together with Zhiyuan Investment Group, “Zhiyuan”). Zhiyuan Investment Group is owned by Mr. Zhang, the largest shareholder of the Company. In September 2013, the Company executed an inland transportation management service contract with the Zhiyuan Investment Group whereby it would provide certain advisory services and help control its potential commodities loss during the transportation process. As a result of the inland transportation management services provided to Zhiyuan, the Company generated revenue of $857,635 (44% of the Company’s total revenue) and $753,597 (28% of the Company’s total revenue) for the three months ended September 30, 2016 and 2015, respectively. The amount due from Zhiyuan Investment Group at June 30, 2016 was $1,622,519. During the three months ended September 30, 2016, the Company continued to provide inland transportation management services to Zhiyuan and also collected approximately $1.4 million from Zhiyuan to reduce the outstanding accounts receivable. As of September 30, 2016, the amount due from Zhiyuan was $1,117,695. Management expects the receivable will be substantially collected in the second half of fiscal year 2017.
| F-14 |
| Item 2. | Management’s Discussion and Analysis of Financial Condition and Results of Operations |
The following discussion and analysis of our company’s financial condition and results of operations should be read in conjunction with our unaudited condensed consolidated financial statements and the related notes included elsewhere in this report. This discussion contains forward-looking statements that involve risks and uncertainties. Actual results and the timing of selected events could differ materially from those anticipated in these forward-looking statements as a result of various factors.
Overview
Sino-Global Shipping America, Ltd. (“Sino”), a Virginia corporation, was founded in 2001. Sino is a non-asset based global shipping and freight logistic integrated solution provider. Sino provides tailored solutions and value added services to its customers to drive effectiveness and control in related aspects throughout the entire shipping and freight logistic chain. Our current service offerings consist of inland transportation management services and freight logistic services. We temporarily suspended our shipping agency and ship management services primarily due to market condition changes. We also temporarily suspended our shipping and chartering services primarily as a result of the termination of the vessel acquisition in December 2015.
Company Structure
The Company conducts its business primarily through its wholly-owned subsidiaries in China (including Hong Kong), Australia, Canada, and U.S. (New York and Los Angeles).
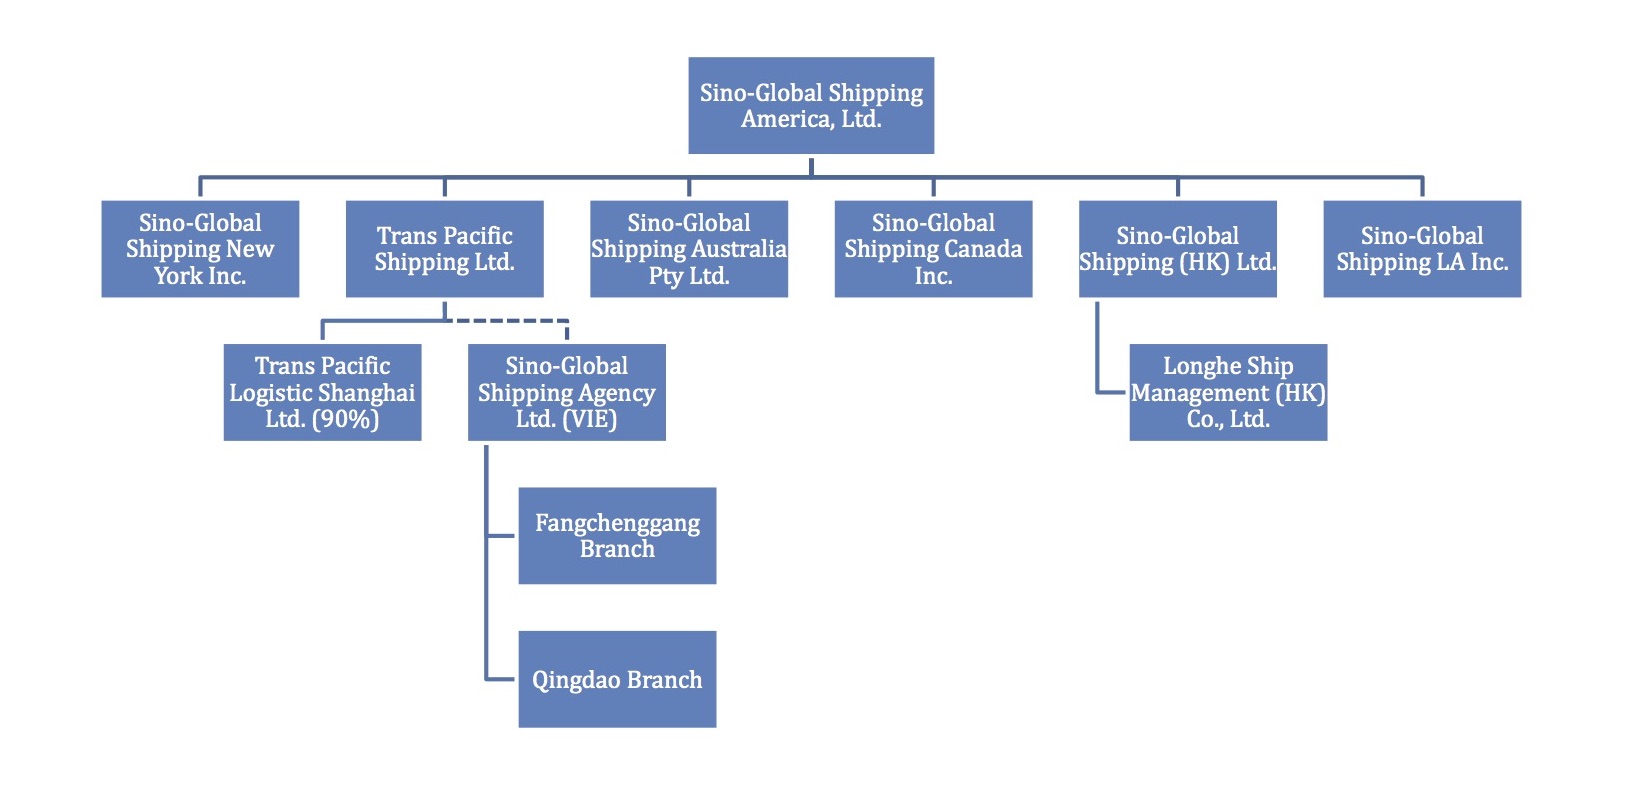
Currently, the Company’s inland transportation management services are operated by its subsidiaries in China (including Hong Kong) and the US. The freight logistic services are operated by the Company’s subsidiaries in New York and Los Angeles.
Fiscal Year 2017 Trends
China’s economy is declining due to the growing foreign debt, declining factory activities and devaluation in foreign exchange reserves, which has prolonged negative impact on the shipping industry. Although we expect China’s economy will have a soft landing, the difficult macroeconomic conditions in fiscal year 2016 will likely continue into fiscal year 2017. On the other hand, recent US economic data paints a picture of an economy in strong recovery mode and consumer spending is likely to receive a positive bounce from low energy prices. The economy outlook has led us to believe we must continue to diversify our service platform; reduce our dependency on businesses generated from China; and promote US-based complementary shipping logistics services to create a new driver to stimulate the development for our business. Furthermore, in the age of “Internet Plus”, we believe information and communication technologies can be adopted to traditional industries to meet the current challenges of supply and demand. We will continue to foster strong relationships with our strategic partners and draw upon our technical ability and in-depth industry knowledge to develop innovative value-added logistic solutions for our customers in the fiscal year of 2017.
4
In July 2016, the Company signed a Strategic Cooperation Agreement (the "Agreement") with COSCO Logistics (Americas) Inc. ("COSCO Logistics"), which belongs to China's largest integrated shipping company, China COSCO Holdings Company Ltd. Pursuant to the Agreement, both parties will mutually provide logistics services between China and the US and develop shipping customers as an end-to-end global logistics service. The Company expects to work with COSCO Logistics to provide inland transportation services in the US for shipments to and from China. According to the Agreement, the two companies will also assess locations in the US to potentially establish warehouse and/or distribution facilities in the coming months and share pricing information for short-haul trucking services across selected regions of the country.
In August 2016, the Company announced the development of an internet-based application that will provide a full-service logistics platform between the US and China to short-haul trucking companies in the US. The decision follows an extensive review by the Company's management team and the Board in identifying Sino’s key competitive advantages as an expert in global logistics between the US and China, and then leveraging that experience to both address the needs of its customer base and provide solutions to current issues affecting logistics and supply chain. After speaking with few potential and existing customers, our internet-based application expect to be launch by the end of 2016, and the management team believes this will move the Company to a new stage.
Results of Operations
Three Months Ended September 30, 2016 Compared to Three Months Ended September 30, 2015
Revenues. Total revenues decreased by $754,816 or 28.0% from $2,699,218 for the three months ended September 30, 2015 to $1,944,402 for the comparable period in 2016. The decrease was mainly due to the declined revenues generated from our shipping agency services segment due to the decreased number of ships served. In addition, due to termination of the vessel acquisition, revenue from our shipping and chartering services segment decreased to nil.
The following table presents summary information by segment for the three months ended September 30, 2016 and 2015:
| For the three months Ended September 30, 2016 | ||||||||||||||||||||
| Shipping Agency & Ship Management Services | Shipping & Chartering Services | Inland Transportation Management Services | Freight Logistic Services | Total | ||||||||||||||||
| Revenues | $ | - | $ | - | $ | 1,485,735 | $ | 458,667 | $ | 1,944,402 | ||||||||||
| Cost of revenues | $ | - | $ | - | $ | 104,001 | $ | 202,338 | $ | 306,339 | ||||||||||
| Gross profit | $ | - | $ | - | $ | 1,381,734 | $ | 256,329 | $ | 1,638,063 | ||||||||||
| Gross margin | - | % | - | % | 93.00 | % | 55.90 | % | 84.20 | % | ||||||||||
| For the three months Ended September 30, 2015 | ||||||||||||||||||||
| Shipping Agency & Ship Management Services | Shipping & Chartering Services | Inland Transportation Management Services | Freight Logistic Services | Total | ||||||||||||||||
| Revenues | $ | 1,059,385 | $ | 446,218 | $ | 1,193,615 | $ | - | $ | 2,699,218 | ||||||||||
| Cost of revenues | $ | 847,613 | $ | 204,510 | $ | 188,553 | $ | - | $ | 1,240,676 | ||||||||||
| Gross profit | $ | 211,772 | $ | 241,708 | $ | 1,005,062 | $ | - | $ | 1,458,542 | ||||||||||
| Gross margin | 20.00 | % | 54.20 | % | 84.20 | % | - | % | 54.00 | % | ||||||||||
Revenues
(1) Revenues from Shipping Agency and Ship Management Services
| l | Shipping Agency Services |
For the three months ended September 30, 2016 and 2015, our revenue generated from the shipping agency segment was nil and $1,059,385, respectively. The Company has mentioned on its annual report for the fiscal year ended June 30, 2016, the management team decided to temporarily suspend the shipping agency services as the shipping industry is during downturn. The decline in revenues was mainly due to the decrease in the total number of ships the Company served from 10 ships for the three months ended September 30, 2015 to 0 ship for the three months ended September 30, 2016. The decrease in the number of ships served for the three months ended September 30, 2016 was largely due to the general economy slow-down, the rising labor costs in China and intense competition in the industry, with established and new competitors offering rates that in many cases are lower than we can offer. On the other hand, the rising labor costs and increased overhead costs also reduced our profitability in this business line. However, we will provide the shipping agency services once the shipping industry turns positive.
5
| For the three months ended September 30, | ||||||||||||||||
| 2016 | 2015 | Change | % | |||||||||||||
| Number of ships served | ||||||||||||||||
| Loading/discharging | - | 10 | (10 | ) | (100 | ) | ||||||||||
| Protective | - | - | - | - | ||||||||||||
| Total | - | 10 | (10 | ) | (100 | ) | ||||||||||
| l | Ship Management Services |
We did not generate any revenue from the ship management service segment for the three months ended September 30, 2016 and 2015. In connection with our acquisition of Longhe Ship Management (Hong Kong) Co. Limited in 2014, we launched ship management services in 2014 but considering the market conditions, risk control and the future development of ship management services, and our costs and profitability of this business segment, the management decided to temporarily suspend the ship management business from the beginning of fiscal year 2016.
(2) Revenues from Shipping and Chartering Services
In connection with the termination of the acquisition of Rong Yao International Shipping Limited (“Rong Yao”) on December 7, 2015, the Company realigned its developing strategy and temporarily suspended the shipping and chartering services. As a result, we reported nil and $446,218 revenue from this segment for the three months ended September 30, 2016 and 2015, respectively.
(3) Revenues from Inland Transportation Management Services
In September 2013, the Company executed an inland transportation management service contract with Zhiyuan Investment Group whereby the Company provides certain solutions to help it control potential commodities loss during the transportation process. The Company started to provide inland transportation management services to a third-party customer, Tengda Northwest Ferroalloy Co., Ltd. (“Tengda Northwest”), following the quarter ended September 2014. As a result, for the three months ended September 30, 2016 and 2015, the inland transportation management services generated revenues of $1,485,735 and $1,193,615, respectively, and gross profit of $1,381,734 and $1,005,062, respectively. The increase of revenue from this segment is due to the increase in commodities transported by Zhiyuan Investment Group and Tengda Northwest.
(4) Revenues from Freight Logistic Services
Since the Company formed new subsidiary Sino-Global Shipping LA Inc. in January 2016, we started to provide freight logistic services, which include cargo forwarding and truck transportation services. During this quarter, the portion of revenue generated by freight logistic service has largely increased, hence the Company discloses the related revenue as a separate business segment. The Company has signed an agreement with LJC Trading New York Ltd., and Zhiyuan (Hongkong) Chromium Group Co., to provide freight logistic services. The management expects this business segment will bring a positive outcome for the Company. For the three months ended September 30, 2016, the revenue generated from freight logistic services was $458,667, and the related gross profit was $256,329.
Operating Costs and Expenses
Total Operating Costs and Expenses. Total operating costs and expenses decreased by $954,579 or 43.7% from $2,186,141 for the three months ended September 30, 2015 to $1,231,562 for the three months ended September 30, 2016. This decrease was primarily due to the decrease in cost of revenues and general and administrative expenses, partially offset by the increase in selling expenses, as discussed below.
The following tables set forth the components of the Company’s costs and expenses for the periods indicated.
| For the three months ended September 30, | ||||||||||||||||||||||||
| 2016 | 2015 | Change | ||||||||||||||||||||||
| US$ | % | US$ | % | US$ | % | |||||||||||||||||||
| Revenues | 1,944,402 | 100.0 | % | 2,699,218 | 100.0 | % | (754,816 | ) | (28.0 | )% | ||||||||||||||
| Cost of revenues | 306,339 | 15.8 | % | 1,240,676 | 46.0 | % | (934,337 | ) | (75.3 | )% | ||||||||||||||
| Gross margin | 84.2 | % | 54.0 | % | 30.2 | % | ||||||||||||||||||
| General and administrative expenses | 859,914 | 44.2 | % | 930,842 | 34.5 | % | (70,928 | ) | (7.6 | )% | ||||||||||||||
| Selling expenses | 65,309 | 3.4 | % | 14,623 | 0.5 | % | 50,686 | 346.6 | % | |||||||||||||||
| Total Costs and Expenses | 1,231,562 | 63.4 | % | 2,186,141 | 81.0 | % | (954,579 | ) | (43.7 | )% | ||||||||||||||
6
Costs of Revenues
The cost of revenue was $306,339 for the three months ended September 30, 2016, a decrease of $934,337 or 75.3% as compared to $1,240,676 for the three months ended September 30, 2015. The overall cost of revenues as a percentage of our revenues decreased from 46.0% for the three months ended September 30, 2015 to 15.8% for the three months ended September 30, 2016. The decrease in the overall cost of revenue in percentage term for the three months ended September 30, 2016 was mainly because the majority of our revenue during the three months ended September 30, 2016 came from more profitable inland transportation business lines and freight logistic service with higher gross profit margin rather than from less profitable shipping agency service segment. As the revenue from shipping agency services has been decreased to nil, the inland transportation management service and freight logistic service were considered as our essential revenue sources.
General and Administrative Expenses
Our general and administrative expenses consist primarily of salaries and benefits, office rent, office expenses, regulatory filing and listing fees, amortization of stock-based compensation expenses, legal, accounting and other professional service fees. For the three months ended September 30, 2016, we had $859,914 of general and administrative expenses as compared to $930,842 for the three months ended September 30, 2015, a decrease of $70,928 or 7.6%. The decline was mainly due to effective cost control procedures in effect and also a recovery of allowance for doubtful accounts, partially offset by increased stock-based compensation expenses. As a percentage of revenue, our general and administrative expenses increased from 34.5% to 44.2% of the revenues for the three months ended September 30, 2015 and 2016, respectively. This increase was largely due to our reduced revenue in the three months ended September 30, 2016 as compared to the same period of 2015.
Selling Expenses
The selling expenses consist primarily of business development costs and commissions for our operating staff to the ports at which we provide services. For the three months ended September 30, 2016, we had $65,309 of selling expenses as compared to $14,623 for the three months ended September 30, 2015, an increase of $50,686 or 346.6%. As a percentage of revenue, our selling expenses increased from 0.5% for the three months ended September 30, 2015 to 3.4% for the corresponding quarter in 2016. During the three months ended September 30, 2016, we made more efforts on business development to explore new business opportunities while maintaining our current customer relationship. As mentioned above, the Company formed a new subsidiary Sino-Global Shipping LA Inc. in January 2016 and started to provide freight logistic services, which led to increased selling expenses in the three months ended September 30, 2016. On the other hand, the rising labor costs also increased our overall selling expense as compared to the same period of 2015.
Operating Income. The Company had an operating income of $712,840 for the three months ended September 30, 2016, compared to an operating income of $513,077 for the comparable period ended September 30, 2015. The increase was due mainly to increased revenue generated from the inland transportation management services and freight logistic services with strong margin contribution, and the declined general and administrative expenses as discussed above.
Financial Expense, Net. The Company’s net financial expense was $3,434 for the three months ended September 30, 2016, compared to net financial expense of $117,207 for the same period of 2015. We have operations in the US, Canada, Australia, Hong Kong and China. Our financial expense for each reporting period mainly reflected the effect of depreciation/appreciation of foreign currencies in terms of USD.
Taxation. The income tax expense was $71,621 for the three months ended September 30, 2016, compared to income tax expense of $240,822 for the three months ended September 30, 2015. The decrease in income tax expense was due mainly to decreased taxable income of Trans Pacific.
Net Income. As a result of the foregoing, the Company had net income of $637,785 for the three months ended September 30, 2016, compared to net income of $155,048 for the three months ended September 30, 2015. After deduction of non-controlling interest, net income attributable to Sino-Global was $645,720 for the three months ended September 30, 2016, compared to net income of $184,158 for the three months ended September 30, 2015. With comprehensive income (loss) from foreign currency translation, comprehensive income attributable to the Company was $620,606 for the three months ended September 30, 2016, compared to comprehensive income of $92,944 for the three months ended September 30, 2015.
7
Liquidity and Capital Resources
Cash Flows and Working Capital
As of September 30, 2016, we had $2,896,265 in cash and cash equivalents. We had approximately 1.1% of our cash in banks located in New York, Los Angeles, Canada, Australia and Hong Kong and had approximately 98.9% of cash in banks located in China.
The following table sets forth a summary of our cash flows for the periods indicated:
| For the three months ended September 30, | ||||||||
| 2016 | 2015 | |||||||
| Net cash provided by (used in) operating activities | $ | 1,524,374 | $ | (263,883 | ) | |||
| Net cash used in investing activities | $ | - | $ | (927 | ) | |||
| Net cash provided by financing activities | $ | - | $ | 632,264 | ||||
| Net increase in cash and cash equivalents | $ | 1,510,271 | $ | 288,141 | ||||
| Cash and cash equivalents at the beginning of period | $ | 1,385,994 | $ | 730,322 | ||||
| Cash and cash equivalents at the end of period | $ | 2,896,265 | $ | 1,018,463 | ||||
The following table sets forth a summary of our working capital:
| September 30, 2016 | June 30, 2016 | Difference | % | |||||||||||||
| Total Current Assets | $ | 9,161,601 | $ | 8,651,985 | $ | 509,616 | 5.9 | % | ||||||||
| Total Current Liabilities | $ | 2,235,034 | $ | 2,437,382 | $ | (202,348 | ) | (8.3 | )% | |||||||
| Working Capital | $ | 6,926,567 | $ | 6,214,603 | $ | 711,964 | 11.5 | % | ||||||||
| Current Ratio | 4.10 | 3.55 | 0.55 | 15.5 | % | |||||||||||
We finance our ongoing operating activities primarily by using funds from our operations. We routinely monitor current and expected operational requirements to evaluate the use of available funding sources. In assessing its liquidity, management monitors and analyzes the Company’s cash on-hand, its ability to generate sufficient revenue source in the future and its operating and capital expenditure commitments. The Company plans to fund continuing operations through identifying new prospective joint venture and strategic alliance opportunities for new revenue sources, and reducing costs to improve profitability and replenish working capital. Considering our existing working capital position and our ability to access other funding sources, management believes that the foregoing measures collectively will provide sufficient liquidity for the Company to meet its future liquidity and capital obligations.
Operating Activities
Net cash provided by operating activities was $1,524,374 for the three months ended September 30, 2016, which included our operating income of $0.64 million due to increased revenue generated from inland transportation management services and freight logistic services with strong margin contribution, and the declined general and administrative expenses. In addition, the accounts receivable decreased by $1.66 million because we strengthened our cash collection efforts and received payment of $1.8 million from Tengda Northwest, our major third-party customer of inland transportation management services, and due from related parties decreased by $0.5 million because we collected $1.4 million from our related party customer, Zhiyuan. However, the advances to suppliers increased by $1.42 million because we prepaid freight fees of RMB 20.18 million (USD$3.0 million) based on our Memorandum of Understanding with Singapore Metals & Minerals Pte Ltd. and Galasi Jernsih Sdn BHD (See Note 3). The Company’s cash inflows from operating activities for the three months ended September 30, 2016 reflected the above mentioned factors.
Net cash used in operating activities was $263,883 for the three months ended September 30, 2015, which included our net income of $0.16 million and an increase in tax payable of $321,313, offset by a decrease in accounts payable of $352,263 and an increase in due from related parties of $485,876. Our cash outflows from the operating activities for the three months ended September 30, 2015 reflected the above factors.
8
Investing Activities
Net cash used in investing activities was nil for the three months ended September 30, 2016 compared to net cash used in investing activities of $927 for the same period of 2015, respectively. $927 was spent on the property and equipment purchase during the three months ended September 30, 2015 while there were no investing activities during the same period this year.
Financing Activities
Net cash provided by financing activities was nil for the three months ended September 30, 2016 while it was $632,264 for the three months ended September 30, 2015, due to the net proceeds from our issuance of 500,000 shares of restricted shares to Mr. Weixiong Yang in a private sale transaction on July 10, 2015.
Critical Accounting Policies
We prepare the unaudited condensed consolidated financial statements in accordance with US GAAP. These accounting principles require us to make judgments, estimates and assumptions on the reported amounts of assets and liabilities at the end of each fiscal period, and the reported amounts of revenues and expenses during each fiscal period. We continually evaluate these judgments and estimates based on our own historical experience, knowledge and assessment of current business and other conditions, our expectations regarding the future based on available information and assumptions that we believe to be reasonable.
There have been no other material changes during the three months ended September 30, 2016 in our significant accounting policies to those previously disclosed in the Company’s annual report for the fiscal year ended June 30, 2016.
The selection of critical accounting policies, the judgments and other uncertainties affecting application of those policies and the sensitivity of reported results to changes in conditions and assumptions are factors that should be considered when reviewing our financial statements. We believe the following accounting policies involve the most significant judgments and estimates used in the preparation of our unaudited condensed consolidated financial statements.
Revenue Recognition
| · | Revenues from shipping agency services are recognized upon completion of services, which coincides with the date of departure of the relevant vessel from port. Advance payments and deposits received from customers prior to the provision of services and recognition of the related revenues are presented as advances from customers. |
| · | Revenues from shipping and chartering services are recognized upon performance of services as stipulated in the underlying contracts. |
| · | Revenues from inland transportation management services are recognized when commodities are being released from the customers’ warehouse. |
| · | Revenues from ship management services are recognized when the related contractual services are rendered. |
| · | Revenues from freight logistic services are recognized when the related contractual services are rendered. |
Basis of Consolidation
The Company’s unaudited condensed consolidated financial statements include the accounts of the parent and its subsidiaries. All inter-company transactions and balances are eliminated in consolidation. Sino-Global Shipping Agency Ltd. (“Sino-China”) is considered to be a Variable Interest Entity (VIE) and the Company is the primary beneficiary. Because of the contractual arrangements, the Company had a pecuniary interest in Sino-China that requires consolidation of our and Sino-China’s financial statements. The accounts of Sino-China are consolidated in the accompanying unaudited condensed consolidated financial statements pursuant to Accounting Standard Codification (“ASC”) 810-10, “Consolidation”. As a VIE, Sino-China’s revenues are included in our total revenues, its net loss from operations is consolidated with our net income (loss) before non-controlling interest. Our non-controlling interest in its net loss is then subtracted in calculating the net income attributable to the Company. The Company temporarily suspended its business with Sino-China in June 2014, therefore, there is no net income generated by Sino-China in the present.
Use of Estimates and Assumptions
The preparation of the unaudited condensed consolidated financial statements in conformity with US GAAP requires management to make estimates and assumptions that affect the reported amounts of assets and liabilities and disclosure of contingent assets and liabilities at the dates of the financial statements and the reported amounts of revenues and expenses during the reporting periods. Estimates are adjusted to reflect actual experience when necessary. Significant accounting estimates reflected in the Company’s unaudited condensed consolidated financial statements include revenue recognition, fair value of stock based compensation, cost of revenues, allowance for doubtful accounts, deferred income taxes, and the useful lives of property and equipment.
Since the use of estimates is an integral component of the financial reporting process, actual results could differ from those estimates.
9
Accounts Receivable
Accounts receivable are recognized at net realizable value. The Company maintains allowances for doubtful accounts for estimated losses resulting from the failure of customers to make required payments in the relevant time period. Management reviews the accounts receivable on a periodic basis and record general and specific allowances when there is doubt as to the collectability of individual balances. In evaluating the collectability of individual receivable balances, we consider many factors, including the age of the balance, the customer’s historical payment history, its current credit-worthiness and current economic trends. Receivables are considered past due after 365 days. Accounts are written off against the allowance only after exhaustive collection efforts.
Off-Balance Sheet Commitments and Arrangements
We have not entered into any financial guarantees or other commitments to guarantee the payment obligations of any third parties. We have not entered into any derivative contracts that are indexed to our shares and classified as shareholders’ equity or that are not reflected in our condensed consolidated financial statements. Furthermore, we do not have any retained or contingent interest in assets transferred to an unconsolidated entity that serve as credit, liquidity or market risk support to such entity. We do not have any variable interest in any unconsolidated entity that provides financing, liquidity, market risk or credit support to us or engages in leasing, hedging or research and development services with us.
| Item 3. | Quantitative and Qualitative Disclosures about Market Risk |
This Item is not applicable because we are a smaller reporting company.
| Item 4. | Controls and Procedures |
Evaluation of Disclosure Controls and Procedures
The Company maintains controls and procedures designed to ensure that information required to be disclosed by the issuer in the reports that it files or submits under the Act (15 U.S.C. 78a et seq.) is recorded, processed, summarized and reported, within the time periods specified in the Securities and Exchange Commission’s rules and forms. Disclosure controls and procedures include, without limitation, controls and procedures designed to ensure that information required to be disclosed by an issuer in the reports that it files or submits under the Act is accumulated and communicated to the issuer’s management, including its principal executive and principal financial officers, or persons performing similar functions, as appropriate to allow timely decisions regarding required disclosure.
As of September 30, 2016, the Company carried out an evaluation, under the supervision of and with the participation of its management, including the Company’s Chief Executive Officer and Acting Chief Financial Officer, of the effectiveness of the design and operation of the Company’s disclosure controls and procedures. Based on the foregoing evaluation, Chief Executive Officer and Acting Chief Financial Officer concluded that the Company’s disclosure controls and procedures (as defined in Rules 13a-15(e) and 15d-15(e) under the Securities Exchange Act of 1934, as amended (the “Exchange Act”)) were effective and adequately designed to ensure that the information required to be disclosed by the Company in the reports it files or submits under the Exchange Act is recorded, processed, summarized and reported within the time periods specified in the applicable rules and forms, and that such information was accumulated and communicated to the management, including Chief Executive Officer and Acting Chief Financial Officer, in a manner that allowed for timely decisions regarding required disclosure.
Changes in Internal Control over Financial Reporting.
There were no changes in the Company’s internal control over financial reporting (as defined in Rule 13a-15(f) of the Exchange Act) during the three months ended September 30, 2016 that have materially affected, or are reasonably likely to materially affect, the Company’s internal control over financial reporting.
10
| Item 2. | Unregistered Sales of Equity Securities and Use of Proceeds |
Issuer Purchases of Equity Securities
On October 13, 2015, we announced that our board of directors had authorized the repurchase of up to $100,000 worth of our common stock in open market transactions or in privately negotiated transactions (the “Repurchase Program”).
The Company did not make any repurchase during the quarter ended September 30, 2016 and the Repurchase Program expired on October 19, 2016. In summary, the Company had repurchased a total of 50,306 shares of common stock at an average stock price of $0.89 per share pursuant to the Repurchase Program.
| Item 6. | Exhibits |
The following exhibits are filed herewith:
| Number | Exhibit | |
| 31.1 | Certifications pursuant to Rule 13a-14(a) or 15d-14(a) under the Securities Exchange Act of 1934, as amended, as adopted pursuant to Section 302 of the Sarbanes-Oxley Act of 2002. | |
| 31.2 | Certifications pursuant to Rule 13a-14(a) or 15d-14(a) under the Securities Exchange Act of 1934, as amended, as adopted pursuant to Section 302 of the Sarbanes-Oxley Act of 2002. | |
| 32.1 | Certifications pursuant to 18 U.S.C. Section 1350, as adopted pursuant to Section 906 of the Sarbanes-Oxley Act of 2002. | |
| EX-101.INS | XBRL Instance Document. | |
| EX-101.SCH | XBRL Taxonomy Extension Schema Document. | |
| EX-101.CAL | XBRL Taxonomy Extension Calculation Linkbase Document. | |
| EX-101.DEF | XBRL Taxonomy Extension Definition Linkbase Document. | |
| EX-101.LAB | XBRL Taxonomy Extension Label Linkbase Document. | |
| EX-101.PRE | XBRL Taxonomy Extension Presentation Linkbase Document. |
11
SIGNATURES
In accordance with the requirements of the Exchange Act, the registrant caused this report to be signed on its behalf by the undersigned, thereunto duly authorized.
| SINO-GLOBAL SHIPPING AMERICA, LTD. | ||
| November 14, 2016 | By: | /s/ Lei Cao |
| Lei Cao | ||
| Chief Executive Officer | ||
| (Principal Executive Officer) | ||
| November 14, 2016 | By: | /s/ Tuo Pan |
| Tuo Pan | ||
| Acting Chief Financial Officer | ||
| (Principal Financial Officer and Principal Accounting Officer) | ||
12