Attached files
|
BLUE
DOLPHIN ENERGY COMPANY
|
|
FORM
10-Q 9/30/16
|
UNITED STATES
SECURITIES AND EXCHANGE COMMISSION
Washington, D.C. 20549
FORM 10-Q
(Mark
One)
☑
Quarterly Report Pursuant to Section 13 or 15(d) of the Securities
Exchange Act of 1934
For the quarterly period ended: September 30, 2016
☐
Transition Report Pursuant to Section 13 or 15(d) of the Securities
Exchange Act of 1934
For the
transition period from _____________ to_____________
Commission
File Number: 0-15905
BLUE DOLPHIN ENERGY COMPANY
(Exact
name of registrant as specified in its charter)
|
Delaware
|
|
73-1268729
|
|
(State
or other jurisdiction of
incorporation
or organization)
|
|
(I.R.S.
Employer
Identification
No.)
|
801 Travis Street, Suite 2100, Houston, Texas 77002
(Address
of principal executive offices)
(713) 568-4725
(Registrant’s
telephone number, including area code)
Indicate
by check mark whether the registrant (1) filed all reports required
to be filed by Section 13 or 15(d) of the Securities Exchange Act
of 1934 during the preceding 12 months (or for such shorter period
that the registrant was required to file such reports), and (2) has
been subject to such filing requirements for the past 90
days. Yes ☒ No ☐
Indicate
by check mark whether the registrant has submitted electronically
and posted on its corporate website, if any, every Interactive Data
File required to be submitted and posted pursuant to Rule 405 of
Regulation S-T (§232.405 of this chapter) during the preceding
12 months (or for such shorter period that the registrant was
required to submit and post such files). Yes ☒ No
☐
Indicate
by check mark whether the registrant is a large accelerated filer,
an accelerated filer, a non-accelerated filer, or a smaller
reporting company. See the definitions of “large
accelerated filer,” “accelerated filer” and
“smaller reporting company” in Rule 12b-2 of the
Exchange Act.
|
Large
accelerated filer
|
☐
|
Accelerated
filer
|
☐
|
|
|
|
|
|
|
Non-accelerated
filer
|
☐
|
Smaller
reporting company
|
☒
|
|
(Do not
check if a smaller reporting company)
|
|
|
|
Indicate
by check mark whether the registrant is a shell company (as defined
in Rule 12b-2 of the Exchange Act).
Yes
☐ No ☒
Number
of shares of common stock, par value $0.01 per share outstanding as
of November 14, 2016: 10,474,714
|
BLUE
DOLPHIN ENERGY COMPANY
|
|
FORM
10-Q 9/30/16
|
TABLE OF CONTENTS
|
GLOSSARY OF SELECTED OIL AND GAS TERMS
|
3
|
|
|
|
|
|
|
PART I.
|
FINANCIAL
INFORMATION
|
5
|
|
|
|
|
|
ITEM 1.
|
FINANCIAL
STATEMENTS
|
5
|
|
|
Consolidated
Balance Sheets (Unaudited)
|
5
|
|
Consolidated
Statements of Operations (Unaudited)
|
6
|
|
|
Consolidated
Statements of Cash Flows (Unaudited)
|
7
|
|
|
Notes
to Consolidated Financial Statements
|
8
|
|
|
|
|
|
|
ITEM 2.
|
MANAGEMENT'S
DISCUSSION AND ANALYSIS OF FINANCIAL CONDITION AND RESULTS OF
OPERATIONS
|
37
|
|
ITEM 3.
|
QUANTITATIVE
AND QUALITATIVE DISCLOSURES ABOUT MARKET RISK
|
59
|
|
ITEM 4.
|
CONTROLS
AND PROCEDURES
|
59
|
|
|
|
|
|
PART II
|
OTHER
INFORMATION
|
60
|
|
|
|
|
|
ITEM 1.
|
LEGAL
PROCEEDINGS
|
60
|
|
ITEM 1A.
|
RISK
FACTORS
|
60
|
|
ITEM 2.
|
UNREGISTERED
SALES OF EQUITY SECURITIES AND USE OF PROCEEDS
|
61
|
|
ITEM 3.
|
DEFAULTS
UPON SENIOR SECURITIES
|
61
|
|
ITEM 4.
|
MINE
SAFETY DISCLOSURES
|
61
|
|
ITEM 5.
|
OTHER
INFORMATION
|
61
|
|
ITEM 6.
|
EXHIBITS
|
61
|
|
|
|
|
|
SIGNATURES
|
|
63
|
2
|
BLUE
DOLPHIN ENERGY COMPANY
|
|
FORM
10-Q 9/30/16
|
GLOSSARY OF SELECTED OIL AND GAS TERMS
The
following are abbreviations and definitions of certain commonly
used oil and gas industry terms that are used in this Form 10-Q for
the quarterly period ended September 30, 2016 (this
“Quarterly Report”):
Atmospheric gas oil (“AGO”). The heaviest
product boiled by a crude distillation unit operating at
atmospheric pressure. This fraction ordinarily sells as distillate
fuel oil, either in pure form or blended with cracked stocks.
Blended AGO usually serves as the premium quality component used to
lift lesser streams to the standards of saleable furnace oil or
diesel engine fuel. Certain ethylene plants, called heavy oil
crackers, can take AGO as feedstock.
Barrel (“bbl”). One stock tank bbl, or 42 U.S.
gallons of liquid volume, used in reference to oil or other liquid
hydrocarbons.
Blending. The physical mixture of a number of different
liquid hydrocarbons to produce a finished product with certain
desired characteristics. Products can be blended in-line through a
manifold system, or batch blended in tanks and vessels. In-line
blending of gasoline, distillates, jet fuel and kerosene is
accomplished by injecting proportionate amounts of each component
into the main stream where turbulence promotes thorough mixing.
Additives, including octane enhancers, metal deactivators,
anti-oxidants, anti-knock agents, gum and rust inhibitors, and
detergents, are added during and/or after blending to result in
specifically desired properties not inherent in
hydrocarbons.
Barrels per Day (“bpd”). A measure of the bbls
of daily output produced in a refinery or transported through a
pipeline.
Complexity. A numerical score that denotes, for a given
refinery, the extent, capability, and capital intensity of the
refining processes downstream of the crude oil distillation unit.
The higher a refinery’s complexity, the greater the
refinery’s capital investment and number of operating units
used to separate feedstock into fractions, improve their quality,
and increase the production of higher-valued products. Refinery
complexities range from the relatively simple crude oil
distillation unit (“topping unit”), which has a
complexity of 1.0, to the more complex deep conversion
(“coking”) refineries, which have a complexity of
12.0.
Condensate. Liquid hydrocarbons that are produced in
conjunction with natural gas. Condensate is chemically more complex
than LPG. Although condensate is sometimes similar to crude oil, it
is usually lighter.
Crude oil. A mixture of thousands of chemicals and
compounds, primarily hydrocarbons. Crude oil quality is measured in
terms of density (light to heavy) and sulfur content (sweet to
sour). Crude oil must be broken down into its various components by
distillation before these chemicals and compounds can be used as
fuels or converted to more valuable products.
Depropanizer unit. A distillation column that is used to
isolate propane from a mixture containing butane and other heavy
components.
Distillates. The result of crude distillation and therefore
any refined oil product. Distillate is more commonly used as an
abbreviated form of middle distillate. There are mainly four (4)
types of distillates: (i) very light oils or light distillates
(such as our LPG mix and naphtha), (ii) light oils or middle
distillates (such as our jet fuel), (iii) medium oils, and (iv)
heavy oils (such as diesel and our heavy oil-based mud blendstock
(“HOBM”), reduced crude, and AGO).
Distillation. The first step in the refining process whereby
crude oil and condensate is heated at atmospheric pressure in the
base of a distillation tower. As the temperature increases, the
various compounds vaporize in succession at their various boiling
points and then rise to prescribed levels within the tower
according to their densities, from lightest to heaviest. They then
condense in distillation trays and are drawn off individually for
further refining. Distillation is also used at other points in the
refining process to remove impurities. Lighter products produced in
this process can be further refined in a catalytic cracking unit or
reforming unit. Heavier products, which cannot be vaporized and
separated in this process, can be further distilled in a vacuum
distillation unit or coker.
Distillation tower. A tall column-like vessel in which crude
oil and condensate is heated and its vaporized components distilled
by means of distillation trays.
Feedstocks. Crude oil and other hydrocarbons, such as
condensate and/or intermediate products, that are used as basic
input materials in a refining process. Feedstocks are transformed
into one or more finished products.
Finished petroleum products. Materials or products which
have received the final increments of value through processing
operations, and which are being held in inventory for delivery,
sale, or use.
Intermediate petroleum products. A petroleum product that
might require further processing before it is saleable to the
ultimate consumer. This further processing might be done by the
producer or by another processor. Thus, an intermediate petroleum
product might be a final product for one company and an input for
another company that will process it further.
Jet fuel. A high-quality kerosene product primarily used in
aviation. Kerosene-type jet fuel (including Jet A and Jet A-1) has
a carbon number distribution between about 8 and 16 carbon atoms
per molecule; wide-cut or naphtha-type jet fuel (including Jet B)
has between about 5 and 15 carbon atoms per molecule.
Kerosene. A middle distillate fraction of crude oil
that is produced at higher temperatures than naphtha and lower
temperatures than gas oil. It is usually used as jet turbine fuel
and sometimes for domestic cooking, heating, and
lighting.
Leasehold interest. The interest of a lessee under an oil
and gas lease.
Light crude. A liquid petroleum that has a low density and
flows freely at room temperature. It has a low viscosity, low
specific gravity, and a high American Petroleum Institute gravity
due to the presence of a high proportion of light hydrocarbon
fractions.
Liquefied petroleum gas
(“LPG”). Manufactured during the
refining of crude oil and condensate; burns relatively cleanly with
no soot and very few sulfur emissions.
MMcf. One
million cubic feet; a measurement of gas volume only.
Naphtha. A refined or partly refined light distillate
fraction of crude oil. Blended further or mixed with other
materials it can make high-grade motor gasoline or jet fuel. It is
also a generic term applied to the lightest and most volatile
petroleum fractions.
3
|
BLUE
DOLPHIN ENERGY COMPANY
|
|
FORM
10-Q 9/30/16
|
Petroleum. A naturally occurring flammable liquid consisting
of a complex mixture of hydrocarbons of various molecular weights
and other liquid organic compounds. The name petroleum covers both
the naturally occurring unprocessed crude oils and petroleum
products that are made up of refined crude oil.
Propane. A by-product of natural gas processing and
petroleum refining. Propane is one of a group of LPGs. The others
include butane, propylene, butadiene, butylene, isobutylene and
mixtures thereof. (See also definition of LPG.)
Refined petroleum products. Refined petroleum products are
derived from crude oil and condensate that have been processed
through various refining methods. The resulting products include
gasoline, home heating oil, jet fuel, diesel, lubricants and the
raw materials for fertilizer, chemicals, and
pharmaceuticals.
Refinery. Within the oil and gas industry, a refinery is an
industrial processing plant where crude oil and condensate is
separated and transformed into petroleum products.
Sour crude. Crude oil containing sulfur content of more than
0.5%.
Stabilizer unit. A distillation column intended to remove
the lighter boiling compounds, such as butane or propane, from a
product.
Sweet crude. Crude oil containing sulfur content of less
than 0.5%.
Sulfur. Present at various levels of concentration in many
hydrocarbon deposits, such as petroleum, coal, or natural gas. Also
produced as a by-product of removing sulfur-containing contaminants
from natural gas and petroleum. Some of the most commonly used
hydrocarbon deposits are categorized according to their sulfur
content, with lower sulfur fuels usually selling at a higher,
premium price and higher sulfur fuels selling at a lower, or
discounted, price.
Topping unit. A type of petroleum refinery that engages in
only the first step of the refining process -- crude distillation.
A topping unit uses atmospheric distillation to separate crude oil
and condensate into constituent petroleum products. A topping unit
has a refinery complexity range of 1.0 to 2.0.
Throughput. The volume processed through a unit or a
refinery or transported through a pipeline.
Turnaround. Scheduled large-scale maintenance activity
wherein an entire process unit is taken offline for a week or more
for comprehensive revamp and renewal.
Yield. The percentage of refined petroleum products that is
produced from crude oil and other feedstocks.
4
|
BLUE
DOLPHIN ENERGY COMPANY
|
|
FORM
10-Q 9/30/16
|
|
|
September 30,
|
December 31,
|
|
|
2016
|
2015
|
|
|
|
|
|
ASSETS
|
|
|
|
CURRENT
ASSETS
|
|
|
|
Cash
and cash equivalents
|
$1,677,485
|
$1,853,875
|
|
Restricted
cash
|
4,160,999
|
3,175,299
|
|
Accounts
receivable, net
|
7,412,697
|
5,457,245
|
|
Prepaid
expenses and other current assets
|
196,101
|
939,690
|
|
Deposits
|
136,970
|
395,414
|
|
Inventory
|
8,819,980
|
7,808,318
|
|
Total
current assets
|
22,404,232
|
19,629,841
|
|
|
|
|
|
Total
property and equipment, net
|
61,283,727
|
48,841,812
|
|
Restricted
cash, noncurrent
|
4,358,581
|
15,616,478
|
|
Surety
bonds
|
710,000
|
1,022,000
|
|
Trade
name
|
303,346
|
303,346
|
|
Deferred
tax assets, net
|
7,342,277
|
3,607,237
|
|
Total
long-term assets
|
73,997,931
|
69,390,873
|
|
TOTAL
ASSETS
|
$96,402,163
|
$89,020,714
|
|
|
|
|
|
LIABILITIES AND STOCKHOLDERS' EQUITY
|
|
|
|
|
|
|
|
CURRENT
LIABILITIES
|
|
|
|
Accounts
payable
|
$23,886,185
|
$14,882,714
|
|
Accounts
payable, related party
|
-
|
300,000
|
|
Asset
retirement obligations, current portion
|
25,972
|
38,644
|
|
Accrued
expenses and other current liabilities
|
3,063,080
|
2,990,891
|
|
Interest
payable, current portion
|
158,706
|
81,467
|
|
Long-term
debt less unamortized debt issue costs, current
portion
|
32,120,782
|
1,934,932
|
|
Long-term
debt, related party, current portion
|
500,000
|
-
|
|
Total
current liabilities
|
59,754,725
|
20,228,648
|
|
|
|
|
|
Long-term
liabilities:
|
|
|
|
Asset
retirement obligations, net of current portion
|
1,983,042
|
1,947,220
|
|
Deferred
revenues and expenses
|
93,814
|
125,085
|
|
Long-term
debt less unamortized debt issue costs, net of current
portion
|
1,342,363
|
32,846,254
|
|
Long-term
debt, related party, net of current portion
|
6,398,931
|
-
|
|
Long-term
interest payable, net of current portion
|
1,638,952
|
1,482,801
|
|
Total
long-term liabilities
|
11,457,102
|
36,401,360
|
|
TOTAL
LIABILITIES
|
71,211,827
|
56,630,008
|
|
|
|
|
|
Commitments
and contingencies (Note 19)
|
|
|
|
|
|
|
|
STOCKHOLDERS'
EQUITY
|
|
|
|
Common
stock ($0.01 par value, 20,000,000 shares authorized; 10,614,715
and
|
|
|
|
10,603,802
shares issued at September 30, 2016 and December 31, 2015,
respectively)
|
106,148
|
106,038
|
|
Additional
paid-in capital
|
36,788,628
|
36,738,737
|
|
Accumulated
deficit
|
(10,904,440)
|
(3,654,069)
|
|
Treasury
stock, 150,000 shares at cost
|
(800,000)
|
(800,000)
|
|
Total
stockholders' equity
|
25,190,336
|
32,390,706
|
|
TOTAL
LIABILITIES AND STOCKHOLDERS' EQUITY
|
$96,402,163
|
$89,020,714
|
See
accompanying notes to consolidated financial
statements.
5
|
BLUE
DOLPHIN ENERGY COMPANY
|
|
FORM
10-Q 9/30/16
|
|
|
Three
Months Ended September 30,
|
Nine Months Ended September 30,
|
||
|
|
2016
|
2015
|
2016
|
2015
|
|
|
|
|
|
|
|
REVENUE
FROM OPERATIONS
|
|
|
|
|
|
Refined
petroleum product sales
|
$53,951,293
|
$54,924,070
|
$126,546,716
|
$174,830,292
|
|
Tank
rental revenue
|
717,487
|
286,892
|
1,624,461
|
860,676
|
|
Pipeline
operations
|
19,526
|
45,925
|
71,865
|
119,882
|
|
Total
revenue from operations
|
54,688,306
|
55,256,887
|
128,243,042
|
175,810,850
|
|
|
|
|
|
|
|
COST
OF OPERATIONS
|
|
|
|
|
|
Cost
of refined products sold
|
51,689,474
|
48,415,627
|
125,316,249
|
151,604,774
|
|
Refinery
operating expenses
|
3,153,646
|
2,953,528
|
9,468,409
|
8,420,650
|
|
Joint
Marketing Agreement profit share
|
965,627
|
1,435,376
|
392,062
|
4,812,674
|
|
Pipeline
operating expenses
|
91,969
|
63,099
|
266,454
|
170,582
|
|
Lease
operating expenses
|
9,005
|
(1,143)
|
32,112
|
20,271
|
|
General
and administrative expenses
|
891,210
|
312,365
|
1,503,533
|
1,058,267
|
|
Depletion,
depreciation and amortization
|
504,719
|
414,837
|
1,415,519
|
1,217,005
|
|
Recovery
of bad debt
|
-
|
-
|
(139,868)
|
-
|
|
Accretion
expense
|
28,186
|
52,720
|
84,558
|
158,655
|
|
Total
cost of operations
|
57,333,836
|
53,646,409
|
138,339,028
|
167,462,878
|
|
|
|
|
|
|
|
Income
(loss) from operations
|
(2,645,530)
|
1,610,478
|
(10,095,986)
|
8,347,972
|
|
|
|
|
|
|
|
OTHER
INCOME (EXPENSE)
|
|
|
|
|
|
Easement,
interest and other income
|
157,840
|
724,349
|
415,700
|
856,816
|
|
Interest
and other expense
|
(485,659)
|
(382,191)
|
(1,305,125)
|
(1,322,562)
|
|
Total
other income (expense)
|
(327,819)
|
342,158
|
(889,425)
|
(465,746)
|
|
|
|
|
|
|
|
Income
(loss) before income taxes
|
(2,973,349)
|
1,952,636
|
(10,985,411)
|
7,882,226
|
|
|
|
|
|
|
|
Income
tax benefit (expense)
|
1,034,798
|
(688,403)
|
3,735,040
|
(2,778,750)
|
|
Net
income (loss)
|
$(1,938,551)
|
$1,264,233
|
$(7,250,371)
|
$5,103,476
|
|
|
|
|
|
|
|
|
|
|
|
|
|
Income
(loss) per common share:
|
|
|
|
|
|
Basic
|
$(0.19)
|
$0.12
|
$(0.69)
|
$0.49
|
|
Diluted
|
$(0.19)
|
$0.12
|
$(0.69)
|
$0.49
|
|
|
|
|
|
|
|
Weighted
average number of common shares outstanding:
|
|
|
|
|
|
Basic
|
10,464,715
|
10,453,802
|
10,460,849
|
10,451,168
|
|
Diluted
|
10,464,715
|
10,453,802
|
10,460,849
|
10,451,168
|
|
|
|
|
|
|
See
accompanying notes to consolidated financial
statements.
6
|
BLUE
DOLPHIN ENERGY COMPANY
|
|
FORM
10-Q 9/30/16
|
|
|
Nine Months
Ended September 30,
|
|
|
|
2016
|
2015
|
|
OPERATING
ACTIVITIES
|
|
|
|
Net
income (loss)
|
$(7,250,371)
|
$5,103,476
|
|
Adjustments
to reconcile net income (loss) to net cash
|
|
|
|
provided
by (used in) operating activities:
|
|
|
|
Depletion,
depreciation and amortization
|
1,415,519
|
1,217,005
|
|
Unrealized
loss (gain) on derivatives
|
1,143,490
|
362,750
|
|
Deferred
tax expense (benefit)
|
(3,735,040)
|
2,479,823
|
|
Amortization
of debt issue costs
|
96,364
|
517,652
|
|
Accretion
expense
|
84,558
|
158,655
|
|
Common
stock issued for services
|
50,000
|
19,999
|
|
Recovery
of bad debt
|
(139,868)
|
-
|
|
Changes
in operating assets and liabilities
|
|
|
|
Accounts
receivable
|
(1,815,584)
|
506,784
|
|
Prepaid
expenses and other current assets
|
945,539
|
(274,435)
|
|
Deposits
and other assets
|
570,444
|
(1,711,073)
|
|
Inventory
|
(1,011,662)
|
(2,420,176)
|
|
Accounts
payable, accrued expenses and other liabilities
|
5,269,224
|
1,172,976
|
|
Accounts
payable, related party
|
(300,000)
|
(1,174,168)
|
|
Net
cash provided by (used in) operating activities
|
(4,677,387)
|
5,959,268
|
|
|
|
|
|
INVESTING
ACTIVITIES
|
|
|
|
Capital
expenditures
|
(11,255,725)
|
(8,156,298)
|
|
Change
in restricted cash for investing activities
|
11,257,897
|
(13,021,438)
|
|
Net
cash provided by (used in) investing activities
|
2,172
|
(21,177,736)
|
|
|
|
|
|
FINANCING
ACTIVITIES
|
|
|
|
Proceeds
from issuance of debt
|
6,898,931
|
28,000,000
|
|
Payments
on long-term debt
|
(1,414,406)
|
(9,474,720)
|
|
Change
in restricted cash for financing activities
|
(985,700)
|
(3,081,686)
|
|
Net
cash provided by financing activities
|
4,498,825
|
15,443,594
|
|
Net
increase (decrease) in cash and cash equivalents
|
(176,390)
|
225,126
|
|
|
|
|
|
CASH
AND CASH EQUIVALENTS AT BEGINNING OF PERIOD
|
1,853,875
|
1,293,233
|
|
CASH
AND CASH EQUIVALENTS AT END OF PERIOD
|
$1,677,485
|
$1,518,359
|
|
|
|
|
|
Supplemental
Information:
|
|
|
|
Non-cash
investing and financing activities:
|
|
|
|
Financing
of capital expenditures via accounts payable
|
$2,601,709
|
$1,743,997
|
|
Interest
paid
|
$1,827,794
|
$959,665
|
|
Income
taxes paid
|
$-
|
$139,500
|
See
accompanying notes to consolidated financial
statements.
7
|
BLUE
DOLPHIN ENERGY COMPANY
|
|
FORM
10-Q 9/30/16
|
Nature of Operations. Blue Dolphin Energy Company
(“Blue Dolphin,”) is primarily an independent refiner
and marketer of petroleum products. Our primary asset is a 15,000
bpd crude oil and condensate processing facility that is located in
Nixon, Texas (the “Nixon Facility”). As part of our
refinery business segment, we conduct petroleum storage and
terminaling operations under third-party lease agreements at the
Nixon Facility. We also own and operate pipeline assets and have
leasehold interests in oil and gas properties. (See “Note (4)
Business Segment Information” for further discussion of our
business segments.)
Structure and Management. Blue Dolphin was formed as a
Delaware corporation in 1986. We are currently controlled by
Lazarus Energy Holdings, LLC (“LEH”), which owns
approximately 81% of our common stock, par value $0.01 per share
(the “Common Stock). LEH manages and operates all of our
properties pursuant to an Operating Agreement (the “Operating
Agreement”). Jonathan Carroll is Chairman of the Board of
Directors (the “Board”), Chief Executive Officer, and
President of Blue Dolphin, as well as a majority owner of LEH. (See
“Note (8) Related Party Transactions,” “Note (9)
Long-Term Debt, Net,” and “Note (19) Commitments and
Contingencies – Financing Agreements” for additional
disclosures related to LEH, the Operating Agreement, and Jonathan
Carroll.)
Our
operations are conducted through the following active
subsidiaries:
●
Lazarus Energy,
LLC, a Delaware limited liability company
(“LE”).
●
Lazarus Refining
& Marketing, LLC, a Delaware limited liability company
(“LRM”).
●
Blue Dolphin Pipe
Line Company (“BDPL”), a Delaware
corporation.
●
Blue Dolphin
Petroleum Company, a Delaware corporation.
●
Blue Dolphin
Services Co., a Texas corporation.
See
"Part I, Item 1. Business and Item 2. Properties” in our Form
10-K for the fiscal year ended December 31, 2015 (the “Annual
Report”) as filed with the Securities and Exchange Commission
(the “SEC”) for additional information regarding our
operating subsidiaries, principal facilities, and
assets.
References
in this Quarterly Report to “we,” “us,” and
“our” are to Blue Dolphin and its subsidiaries unless
otherwise indicated or the context otherwise requires.
Operating Risks. Execution of our business strategy depends
on several factors, including adequate crude oil and condensate
sourcing, levels of accounts receivable, refined petroleum product
inventories, accounts payable, capital expenditures, and adequate
access to credit on satisfactory terms. These factors may be
impacted by general economic, political, financial, competitive,
and other factors that are beyond our control. There can
be no assurance that our business and operational strategy will
achieve anticipated outcomes. Our operations, liquidity,
and financial condition may be materially adversely affected if:
(i) our strategy is not successful, (ii) our working capital
requirements are not funded through Operations Payments by GEL TEX
Marketing, LLC (“GEL”) under a Joint Marketing
Agreement (the “Joint Marketing Agreement”), our profit
share under the Joint Marketing Agreement, or certain advances from
LEH, or (iii) we have future covenant violations under our loan
agreements that are not waived.
For the
three months ended September 30, 2016, we had a net loss of
$1,938,551 compared to net income of $1,264,233 for the three
months ended September 30, 2015. For the nine months ended
September 30, 2016, we had a net loss of $7,250,371 compared to net
income of $5,103,476 for the nine months ended September 30,
2015.
8
|
BLUE
DOLPHIN ENERGY COMPANY
|
|
FORM
10-Q 9/30/16
|
Notes
to Consolidated Financial Statements (Continued)
As of
September 30, 2016, we had cash and cash equivalents and restricted
cash (current portion) of $1,677,485 and $4,160,999, respectively.
As of September 30, 2016, we had current assets of $22,404,232 and
current liabilities (including the current portion of long-term
debt) of $59,754,725, reflecting a working capital deficit of
$37,350,493. Excluding the current portion of long-term debt, we
had a working capital deficit of $5,229,711 as of September 30,
2016. Non-payment of Operations Payments to us by GEL under the
Joint Marketing Agreement resulting from a contract-related dispute
between the parties contributed to the working capital deficit as
of September 30, 2016. (See “Note (19) Commitments and
Contingencies – Genesis Agreements and Legal Matters”
for a discussion related to Operations Payments and the Joint
Marketing Agreement.)
As of
December 31, 2015, we had cash and cash equivalents and restricted
cash (current portion) of $1,853,875 and $3,175,299, respectively.
As of December 31, 2015, we had current assets of $19,629,841 and
current liabilities (including the current portion of long-term
debt) of $20,228,648, reflecting a working capital deficit of
$598,807.
In
addition to the Joint Marketing Agreement, we are party to a
variety of contracts and agreements with Genesis and its affiliates
that enable the purchase of crude oil and condensate,
transportation of crude oil and condensate, and other services.
Certain of these agreements with Genesis and its affiliates have
successive one-year renewals until August 2019 unless sooner
terminated by Genesis or its affiliates with 180 days’ prior
written notice. An adverse change in our relationship
with Genesis could have a material adverse effect on our
operations, liquidity, and financial condition. We are
currently involved in a dispute with Genesis over certain
contractual matters. (See “Note (19) Commitments and
Contingencies – Genesis Agreements” and “Legal
Matters,” as well as “Part II. Other Information, Item
1A. Risk Factors” for a summary of the Joint Marketing
Agreement and Crude Supply Agreement and information regarding the
current contract-related dispute with Genesis.)
As of
September 30, 2016, we were in violation of certain financial
covenants in secured loan agreements with Sovereign Bank
(“Sovereign”). As a result of these covenant defaults,
Sovereign could declare the amounts owed under these loan
agreements immediately due and payable, exercise its rights with
respect to collateral securing our obligations under these loan
agreements, and/or exercise any other rights and remedies
available. Sovereign waived
the financial covenant defaults as of the quarter ended September
30, 2016. However, the debt associated with these loans was
classified within the current portion of long-term debt on our
consolidated balance sheets due to the uncertainty of our ability
to meet the financial covenants in the future. There can be no
assurance that Sovereign will provide future waivers, which may
have an adverse impact on our financial position and results of
operations. (See “Note (9) Long-Term Debt, Net”
and “Note (20) Subsequent Events” for additional
disclosures related to our long-term debt and financial covenant
violations.)
|
(2)
|
Basis of Presentation
|
The
accompanying unaudited consolidated financial statements, which
include Blue Dolphin and subsidiaries, have been prepared in
accordance with U.S. generally accepted accounting principles
(“GAAP”) for interim consolidated financial information
and with the instructions to Form 10-Q and Article 10 of Regulation
S-X. Accordingly, certain information and footnote disclosures
normally included in our audited financial statements have been
condensed or omitted pursuant to the SEC’s rules and
regulations. Significant intercompany transactions have been
eliminated in the consolidation. In management’s opinion, all
adjustments considered necessary for a fair presentation have been
included, disclosures are adequate, and the presented information
is not misleading.
The
consolidated balance sheet as of December 31, 2015 has been derived
from the audited financial statements at that date. The
accompanying consolidated financial statements should be read in
conjunction with the consolidated financial statements and notes
thereto included in our Annual Report. Operating results for the
three and nine months ended September 30, 2016 are not necessarily
indicative of the results that may be expected for the fiscal year
ending December 31, 2016, or for any other period.
|
(3)
|
Significant Accounting Policies
|
The
summary of significant accounting policies of Blue Dolphin is
presented to assist in understanding our consolidated financial
statements. Our consolidated financial statements and accompanying
notes are representations of management who is responsible for
their integrity and objectivity. These accounting policies conform
to GAAP and have been consistently applied in the preparation of
our consolidated financial statements.
9
|
BLUE
DOLPHIN ENERGY COMPANY
|
|
FORM
10-Q 9/30/16
|
Notes
to Consolidated Financial Statements (Continued)
Cash and Cash Equivalents. Cash and cash equivalents
represent liquid investments with an original maturity of three
months or less. Cash balances are maintained in depository and
overnight investment accounts with financial institutions that, at
times, may exceed insured deposit limits. We monitor the financial
condition of the financial institutions and have experienced no
losses associated with these accounts. Cash and cash equivalents
totaled $1,677,485 and $1,853,875 as of September 30, 2016 and
December 31, 2015, respectively.
Restricted Cash. As of September 30, 2016, total
restricted cash was $8,519,580, comprised of restricted cash
(current portion) totaling $4,160,999 and restricted cash,
noncurrent totaling $4,358,581. As of December 31, 2015, total
restricted cash was $18,791,777, comprised of restricted cash
(current portion) totaling $3,175,299 and restricted cash,
noncurrent totaling $15,616,478. Restricted cash (current portion)
primarily represents: (i) amounts held in our disbursement account
with Sovereign attributable to construction invoices awaiting
payment from that account, (ii) a payment reserve account held by
Sovereign as security for payments under a loan agreement, and
(iii) a construction contingency account under which Sovereign will
fund contingencies. Restricted cash, noncurrent represents funds
held in the Sovereign disbursement account for payment of future
construction related expenses to build new petroleum storage tanks.
(See “Note (9) Long-Term Debt, Net” for additional
disclosures related to our loan agreements with
Sovereign.)
Accounts Receivable and Allowance for Doubtful
Accounts. Accounts receivable are customer
obligations due under normal trade terms. The allowance for
doubtful accounts represents our estimate of the amount of probable
credit losses existing in our accounts receivable. We have a
limited number of customers with individually large amounts due on
any given date. Any unanticipated change in any one of these
customers’ credit worthiness or other matters affecting the
collectability of amounts due from such customers could have a
material adverse effect on our results of operations in the period
in which such changes or events occur. We regularly review all of
our aged accounts receivable for collectability and establish an
allowance for individual customer balances as necessary. Allowance
for doubtful accounts totaled $0 and $139,868 as of September 30,
2016 and December 31, 2015, respectively.
Inventory. The
nature of our business requires us to maintain inventory, which
primarily consists of refined petroleum products and chemicals. Our
overall inventory is valued at lower of cost or market with costs
being determined by the average cost method. If the market value of
our refined petroleum product inventories declines to an amount
less than our average cost, we record a write-down of inventory and
an associated adjustment to cost of refined products sold. (See
“Note (6) Inventory” for additional disclosures related
to our inventory.)
Derivatives. We
are exposed to commodity prices and other market risks including
gains and losses on certain financial assets as a result of our
inventory risk management policy. Under our inventory risk
management policy, commodity futures contracts may be used to
mitigate the change in value for certain of our refined petroleum
product inventories subject to market price fluctuations. The
physical inventory volumes are not exchanged and these contracts
are net settled with cash.
Although
these commodity futures contracts are not subject to hedge
accounting treatment under Financial Accounting Standards Board
(the “FASB”) Accounting Standards Codification
(“ASC”) guidance, we record the fair value of these
hedges in our consolidated balance sheet each financial reporting
period because of contractual arrangements under which we are
effectively exposed to the potential gains or losses. We recognize
all commodity hedge positions as either current assets or current
liabilities in our consolidated balance sheets, and those
instruments are measured at fair value. Changes in the fair value
from financial reporting period to financial reporting period are
recognized in our consolidated statements of operations. Net gains
or losses associated with these transactions are recognized within
cost of refined products sold in our consolidated statements of
operations using mark-to-market accounting.
(See
“Note (17) Fair Value Measurement” and “Note (18)
Inventory Risk Management” for additional disclosures related
to derivatives.)
10
|
BLUE
DOLPHIN ENERGY COMPANY
|
|
FORM
10-Q 9/30/16
|
Notes
to Consolidated Financial Statements (Continued)
Property and Equipment.
Refinery and Facilities. Additions to refinery and
facilities assets are capitalized. Expenditures for repairs and
maintenance are expensed as incurred and are included as operating
expenses under the Operating Agreement. Management expects to
continue making improvements to the Nixon Facility based on
technological advances.
We record refinery and facilities at cost less any adjustments for
depreciation or impairment. Adjustment of the asset and the
related accumulated depreciation accounts are made for the refinery
and facilities asset’s retirement and disposal, with the
resulting gain or loss included in the consolidated statements of
operations. For financial reporting purposes, depreciation of
refinery and facilities assets is computed using the straight-line
method using an estimated useful life of 25 years beginning when
the refinery and facilities assets are placed in service. We did
not record any impairment of our refinery and facilities assets for
any period presented.
Pipelines and Facilities. We record pipelines and facilities
at cost less any adjustments for depreciation or impairment.
Depreciation is computed using the straight-line method over
estimated useful lives ranging from 10 to 22 years. In accordance
with FASB ASC guidance on accounting for the impairment or disposal
of long-lived assets, we periodically evaluate our long-lived
assets for impairment. Additionally, we evaluate our long-lived
assets when events or circumstances indicate that the carrying
value of these assets may not be recoverable.
Oil and Gas Properties. We account for our oil and gas
properties using the full-cost method of accounting, whereby all
costs associated with acquisition, exploration and development of
oil and gas properties, including directly related internal costs,
are capitalized on a cost center basis. Amortization of
such costs and estimated future development costs are determined
using the unit-of-production method. Our oil and gas properties had
no production during the three and nine months ended September 30,
2016 and 2015. All leases associated with our oil and gas
properties have expired, and our oil and gas properties were fully
impaired as of December 31, 2012.
Construction in Progress. Construction in progress
expenditures, which relate to construction and refurbishment
activities at the Nixon Facility, are capitalized as incurred.
Depreciation begins once the asset is placed in
service.
(See
“Note (7) Property, Plant and Equipment, Net” for
additional disclosures related to our refinery and facilities
assets, oil and gas properties, pipelines and facilities assets,
and construction in progress.)
Intangibles – Other. We have an intangible asset
consisting of the Blue Dolphin Energy Company trade name in the
amount of $303,346 on our consolidated balance sheets as of
September 30, 2016 and December 31, 2015. We have determined the
trade name to have an indefinite useful life. We account for other
intangible assets under FASB ASC guidance related to intangibles,
goodwill, and other. Under the guidance, we test intangible assets
with indefinite lives annually for impairment. Management performed
its regular annual impairment testing of trade name in the fourth
quarter of 2015. Upon completion of that testing, we determined
that no impairment was necessary as of December 31,
2015.
Revenue Recognition.
Refined Petroleum Products Revenue. Jet fuel, our only
finished product, is sold in nearby markets to wholesalers. Our
intermediate products, including LPG, naphtha, HOBM, and AGO, are
primarily sold in nearby markets to wholesalers and refiners for
further blending and processing. Revenue from refined petroleum
products sales is recognized when sales prices are fixed or
determinable, collectability is reasonably assured, and title
passes. Title passage occurs when refined petroleum products are
delivered in accordance with the terms of the respective sales
agreements, and customers assume the risk of loss when title is
transferred. Transportation, shipping, and handling costs incurred
are included in cost of refined products sold. Excise and other
taxes that are collected from customers and remitted to
governmental authorities are not included in revenue.
Tank Rental Revenue. Tank rental fees are invoiced monthly
in accordance with the terms of the related lease agreement and
recognized in revenue as earned.
Easement Revenue. Land easement revenue is recognized
monthly as earned and is included in other income.
11
|
BLUE
DOLPHIN ENERGY COMPANY
|
|
FORM
10-Q 9/30/16
|
Notes
to Consolidated Financial Statements (Continued)
Pipeline Transportation Revenue. Revenue from our pipeline
operations is derived from fee-based contracts and is typically
based on transportation fees per unit of volume transported
multiplied by the volume delivered. Revenue is recognized when
volumes have been physically delivered for the customer through the
pipeline.
Deferred Revenue. In 2014, we increased the ownership
interest in our pipeline assets from approximately 83% to 100%
pursuant to an Asset Sale Agreement (the “Purchase
Agreement”) with a former partner. Pursuant to the Purchase
Agreement, the former partner paid us $100,000 in cash, and a
surety company $850,000 in cash as collateral for supplemental
pipeline bonds for our benefit in exchange for the payment and
discharge of any and all payables, claims, and obligations related
to the pipeline assets. We recorded the amount received for our
benefit related to the supplemental pipeline bonds as deferred
revenue. We recognized the deferred revenue on a straight-line
basis through December 31, 2018, the expected retirement date of
the associated assets. In 2015, a significant portion of the
remaining deferred revenue was recognized as a result of abandoning
a segment of the pipeline assets. (See “Part I, Business
– Governmental Regulation – Offshore Safety and
Environmental Oversight – Decommissioning Requirements”
in our Annual Report for a discussion related to supplemental
pipeline bonds.)
Income Taxes. We account for income taxes under FASB ASC
guidance related to income taxes, which requires recognition of
income taxes based on amounts payable with respect to the current
three and nine month periods and the effects of deferred taxes for
the expected future tax consequences of events that have been
included in our financial statements or tax
returns. Under this method, deferred tax assets and
liabilities are determined based on the differences between the
financial accounting and tax basis of assets and liabilities, as
well as for operating losses and tax credit carryforwards using
enacted tax rates in effect for the year in which the differences
are expected to reverse.
As of
each reporting date, management considers new evidence, both
positive and negative, to determine the realizability of deferred
tax assets. Management considers whether it is more likely than not
that a portion or all of the deferred tax assets will be realized,
which is dependent upon the generation of future taxable income
prior to the expiration of any net operating loss
(“NOL”) carryforwards. When management determines that
it is more likely than not that a tax benefit will not be realized,
a valuation allowance is recorded to reduce deferred tax
assets.
The
guidance also prescribes a recognition threshold and measurement
attribute for the financial statement recognition and measurement
of a tax position taken or expected to be taken in a tax return, as
well as guidance on derecognition, classification, interest and
penalties, accounting in interim periods, disclosures, and
transition.
(See
“Note (15) Income Taxes” for further information
related to income taxes.)
Impairment or Disposal of Long-Lived Assets. In accordance
with FASB ASC guidance on accounting for the impairment or disposal
of long-lived assets, we periodically evaluate our long-lived
assets for impairment. Additionally, we evaluate our long-lived
assets when events or circumstances indicate that the carrying
value of these assets may not be recoverable. The carrying value is
not recoverable if it exceeds the sum of the undiscounted cash
flows expected to result from the use and eventual disposition of
the asset or group of assets. If the carrying value exceeds the sum
of the undiscounted cash flows, an impairment loss equal to the
amount by which the carrying value exceeds the fair value of the
asset or group of assets is recognized. Significant management
judgment is required in the forecasting of future operating results
that are used in the preparation of projected cash flows and,
should different conditions prevail or judgments be made, material
impairment charges could be necessary.
Asset Retirement Obligations. FASB ASC guidance related to
asset retirement obligations (“AROs”) requires that a
liability for the discounted fair value of an ARO be recorded in
the period in which it is incurred and the corresponding cost
capitalized by increasing the carrying amount of the related
long-lived asset. The liability is accreted towards its future
value each period, and the capitalized cost is depreciated over the
useful life of the related asset. If the liability is settled for
an amount other than the recorded amount, a gain or loss is
recognized.
Management
has concluded that there is no legal or contractual obligation to
dismantle or remove the refinery and facilities assets. Further,
management believes that these assets have indeterminate lives
under FASB ASC guidance for estimating AROs because dates or ranges
of dates upon which we would retire these assets cannot reasonably
be estimated at this time. When a legal or contractual obligation
to dismantle or remove the refinery and facilities assets arises
and a date or range of dates can reasonably be estimated for the
retirement of these assets, we will estimate the cost of performing
the retirement activities and record a liability for the fair value
of that cost using present value techniques.
12
|
BLUE
DOLPHIN ENERGY COMPANY
|
|
FORM
10-Q 9/30/16
|
Notes
to Consolidated Financial Statements (Continued)
We
recorded an ARO liability related to future asset retirement costs
associated with dismantling, relocating, or disposing of our
offshore platform, pipeline systems, and related onshore
facilities, as well as for plugging and abandoning wells and
restoring land and sea beds. We developed these cost estimates for
each of our assets based upon regulatory requirements, structural
makeup, water depth, reservoir characteristics, reservoir depth,
equipment demand, current retirement procedures, and construction
and engineering consultations. Because these costs typically extend
many years into the future, estimating future costs are difficult
and require management to make judgments that are subject to future
revisions based upon numerous factors, including changing
technology, political, and regulatory environments. We review our
assumptions and estimates of future abandonment costs on an annual
basis.
(See
“Note (11) Asset Retirement Obligations” for additional
information related to our AROs.)
Computation of Earnings Per Share. We apply the provisions
of FASB ASC guidance for computing earnings per share
(“EPS”). The guidance requires the presentation of
basic EPS, which excludes dilution and is computed by dividing net
income available to common stockholders by the weighted-average
number of shares of common stock outstanding for the period. The
guidance requires dual presentation of basic EPS and diluted EPS on
the face of our consolidated statements of operations and requires
a reconciliation of the numerators and denominators of basic EPS
and diluted EPS. Diluted EPS is computed by dividing net income
available to common stockholders by the diluted weighted average
number of common shares outstanding, which includes the potential
dilution that could occur if securities or other contracts to issue
shares of common stock were converted to common stock that then
shared in the earnings of the entity.
The
number of shares related to options, warrants, restricted stock,
and similar instruments included in diluted EPS is based on the
“Treasury Stock Method” prescribed in FASB ASC guidance
for computation of EPS. This method assumes theoretical repurchase
of shares using proceeds of the respective stock option or warrant
exercised, and, for restricted stock, the amount of compensation
cost attributed to future services that has not yet been recognized
and the amount of any current and deferred tax benefit that would
be credited to additional paid-in-capital upon the vesting of the
restricted stock, at a price equal to the issuer’s average
stock price during the related earnings period. Accordingly, the
number of shares includable in the calculation of EPS in respect of
the stock options, warrants, restricted stock, and similar
instruments is dependent on this average stock price and will
increase as the average stock price increases. (See “Note
(16) Earnings Per Share” for additional information related
to EPS.)
Stock-Based Compensation. In accordance with FASB ASC
guidance for stock-based compensation, share-based payments to
directors, including the issuance of restricted common stock, are
measured at fair value as of the date of grant and are expensed in
our consolidated statements of operations over the service period
(generally the vesting period).
Treasury Stock. We account for treasury stock under the cost
method. When treasury stock is re-issued, the net change in share
price subsequent to acquisition of the treasury stock is recognized
as a component of additional paid-in-capital in our consolidated
balance sheets. (See “Note (12) Treasury Stock” for
additional disclosures related to treasury stock.)
New Pronouncements Adopted. The FASB issues an Accounting
Standards Update (“ASU”) to communicate changes to the
FASB ASC, including changes to non-authoritative SEC content. For
the three and nine months ended September 30, 2016, we adopted the
following recently issued ASU’s:
ASU 2015-17, Income Taxes
(Topic 740). In November 2015, FASB issued ASU 2015-17. This
guidance simplifies the presentation of deferred income taxes by
requiring that deferred tax liabilities and assets be classified as
noncurrent instead of separated into current and noncurrent. We
adopted this accounting pronouncement effective April 1, 2016.
Accordingly, our consolidated balance sheet as of December 31, 2015
has been changed to reclassify approximately $3.5 million
previously reported as deferred tax assets, current portion, net to
deferred tax assets, net. The adoption of ASU 2015-17 had no impact
on our results of operations or cash flows.
ASU 2015-03, Imputation of Interest (Topic 835): Simplifying the
Presentation of Debt Issuance Costs. In April 2015, FASB
issued ASU 2015-03. This guidance requires debt issue costs to be
presented as an offset to their related debt. We adopted this
accounting pronouncement effective January 1, 2016. Accordingly, our consolidated balance sheet as of
December 31, 2015 has been changed to reclassify approximately $2.4
million previously reported as debt issue costs as a direct
deduction of long-term debt. The adoption of ASU 2015-03 had no
impact on our results of operations or cash
flows.
New Pronouncements Issued But Not Yet Effective. The
following are recently issued, but not yet effective, ASU’s
that may have an effect on our consolidated financial position,
results of operations, or cash flows:
13
|
BLUE
DOLPHIN ENERGY COMPANY
|
|
FORM
10-Q 9/30/16
|
Notes
to Consolidated Financial Statements (Continued)
ASU 2016-15, Statement of Cash Flows (Topic 230): Classification of
Certain Cash Receipts and Cash Payments. In August 2016, FASB issued ASU 2016-15. This
guidance addresses eight specific cash flow issues in order to
reduce future diversity of practice. For public business entities,
the amendments in ASU 2016-15 are effective for fiscal years
beginning after December 15, 2018, and interim periods within
fiscal years beginning after December 15, 2019. Early adoption is
permitted. We are evaluating the impact that adoption of this
guidance will have on our consolidated statements of cash
flows.
ASU 2016-13, Financial Instruments —
Credit Losses (Topic 326): Measurement of Credit Losses on
Financial Instruments). In June
2016, FASB issued ASU 2016-13. This
guidance updates the current impairment model to incorporate both
expected and incurred credit losses, eliminating potential
overstatements of assets and resulting in more timely recognition
of losses. For a public business
entity, the amendments in ASU 2016-13 are effective for fiscal
years beginning after December 15, 2019, including interim periods
within those fiscal years. Early application as of the fiscal years
beginning after December 15, 2018, including interim periods within
those fiscal years, is permitted. We are evaluating the impact that
adoption of this guidance will have on our consolidated financial
statements.
ASU 2016-02, Leases (Topic
842). In February 2016, FASB
issued ASU 2016-02. This
guidance increases transparency and
comparability among organizations by recognizing lease assets and
lease liabilities on the balance sheet and disclosing key
information about leasing arrangements. For a public business
entity, the amendments in ASU 2016-02 are effective for fiscal
years beginning after December 15, 2018, including interim periods
within those fiscal years. Early application is permitted. We are
evaluating the impact that adoption of this guidance will have on
our consolidated balance sheets.
ASU 2015-11, Inventory
(Topic 330): Simplifying
the Measurement of Inventory. In July 2015, FASB issued ASU
2015-11. Current guidance requires an entity to measure inventory
at the lower of cost or market. Market could be replacement cost,
net realizable value, or net realizable value less an approximately
normal profit margin. Under ASU 2015-11, an entity should measure
inventory at the lower of cost or net realizable value. Net
realizable value is the estimated selling price in the ordinary
course of business, less reasonably predictable costs of
completion, disposal, and transportation. Amendments under ASU
2015-11 more closely align the measurement of inventory in GAAP
with the measurement of inventory in International Financial
Reporting Standards. For public business entities, ASU 2015-11 is
effective for fiscal years beginning after December 15, 2016,
including interim periods within those fiscal years. ASU 2015-11
should be applied prospectively with earlier application permitted
as of the beginning of an interim or annual reporting period.
We do not anticipate adoption of this
guidance to have a material effect on our consolidated financial
statements.
ASU 2014-15, Disclosure of Uncertainties about an Entity’s
Ability to Continue as a Going Concern (Subtopic 205-40). In
August 2014, FASB issued ASU 2014-15, which requires management to
perform interim and annual assessments of an entity’s ability
to continue as a going concern for a one-year period subsequent to
the date of the financial statements. An entity must provide
certain disclosures if conditions or events raise substantial doubt
about the entity’s ability to continue as a going concern.
The guidance is effective for all entities for the first annual
period ending after December 15, 2016 and interim periods
thereafter, with early adoption permitted. We do not anticipate adoption of this guidance to
have a material effect on our consolidated financial
statements.
ASU 2014-09, Revenue from
Contracts with Customers (Topic 606). In May 2014, FASB and
the International Accounting Standards Board (the
“IASB”) issued ASU 2014-09, a converged standard on
recognition of revenue from contracts with customers. In June 2014,
the FASB and the IASB (collectively, the “Accounting
Boards”) formed the FASB-IASB Joint Transition Resource Group
for Revenue Recognition (the “TRG”). The primary
objective of the TRG is to inform the Accounting Boards about
potential implementation issues that could arise when organizations
implement the new revenue guidance. Resultant ASU’s as part
of the TRG process include:
●
August 2015 –
ASU 2015-14, Revenue from Contracts with Customers (Topic
606): Deferral of the Effective Date, which defers the
effective date of ASU 2014-09 for all entities by one
year. The effective
date for public business entities is annual reporting periods
beginning after December 15, 2017. Public business entities would
apply the new revenue standard to interim reporting periods after
December 15, 2017. As such, for a public business entity with a
calendar year-end, ASU 2014-09 would be effective on January 1,
2018, for both its interim and annual reporting periods. This
represents a one-year deferral from the original effective date.
The new effective date guidance allows early adoption for all
entities as of the original effective date (December 15,
2016).
14
|
BLUE
DOLPHIN ENERGY COMPANY
|
|
FORM
10-Q 9/30/16
|
Notes
to Consolidated Financial Statements (Continued)
●
March 2016 –
ASU 2016-08, Revenue from Contracts with Customers (Topic
606): Principal Versus Agent Considerations (Reporting Revenue
Gross Versus Net), which clarifies the implementation
guidance on principal versus agent considerations. When another
party, along with the entity, is involved in providing a good or a
service to a customer, the entity must determine whether the nature
of its promise is to provide that good or service to the customer
(e.g., entity as principal) or to arrange for the good or service
to be provided to the customer by the other party (e.g., entity as
agent). Such determination is based upon whether the entity
controls the good or the service before it is transferred to the
customer.
●
April 2016 –
ASU 2016-10, Revenue from Contracts with Customers (Topic
606): Identifying Performance Obligations and Licensing.
This ASU: (i) clarifies when promised goods or services are
separately identifiable (i.e., distinct within the context of a
contract), an important step in determining whether goods and
services should be accounted for as separate performance
obligations, (ii) allows entities to disregard goods or services
that are immaterial in the context of a contract and provide an
accounting policy election for accounting for certain shipping and
handling activities, (iii) clarifies how an entity should evaluate
the nature of its promise in granting a license of intellectual
property, which will determine whether the entity recognizes
revenue over time or at a point in time, and (iv) revises the
guidance to address how entities should apply the exception for
sales and usage-based royalties to licenses of intellectual
property, recognize revenue for licenses that are not separate
performance obligations, and evaluate different types of license
restrictions (e.g., time-based, geography-based).
●
May 2016 –
ASU 2016-11, Revenue Recognition
(Topic 605) and Derivatives and Hedging (Topic 815): Rescission of
SEC Guidance Because of Accounting Standards Updates 2014-09 and
2014-16 Pursuant to Staff Announcements at the March 3, 2016 EITF
Meeting (SEC Update). Upon the adoption of ASU
2014-16, Determining Whether
the Host Contract in a Hybrid Financial Instrument Issued in the
Form of a Share Is More Akin to Debt or to Equity, and ASU
2014-09, several ASC
guidance standards related to revenue recognition will be rescinded
as no longer needed. These include ASC guidance standards for
determining the nature of a host contract related to a hybrid
financial instrument issued in the form of a share, revenue and
expense recognition for freight services in process, accounting for
shipping and handling fees and costs, accounting for consideration
given by a vendor to a customer, and accounting for gas-balancing
arrangements.
●
May 2016 –
ASU 2016-12, Revenue from
Contracts with Customers (Topic 606): Narrow-Scope Improvements and
Practical Expedients addresses issues such as
collectability, contract modifications, completed contracts at
transition, and noncash considerations as they relate to the new
revenue recognition standard.
We are
evaluating the impact that adoption of ASU 2014-09, ASU 2015-14,
ASU 2016-08, ASU 2016-10, ASU 2016-11, and ASU 2016-12, all of
which relate to Revenue from Contracts with Customers (Topic 606),
will have on our consolidated financial statements.
Other new pronouncements issued but not effective until after
September 30, 2016 are not expected to have a material impact on
our financial position, results of operations, or
liquidity.
Reclassification. We have
reclassified certain prior year amounts to conform to our 2016
presentation.
Remainder of Page Intentionally Left Blank
15
|
BLUE
DOLPHIN ENERGY COMPANY
|
|
FORM
10-Q 9/30/16
|
Notes
to Consolidated Financial Statements (Continued)
|
(4)
|
Business
Segment Information
|
We have two reportable business segments: (i) Refinery Operations
and (ii) Pipeline Transportation. Business activities related to
our Refinery Operations business segment are conducted at the Nixon
Facility. Business activities related to our Pipeline
Transportation business segment are primarily conducted in the Gulf
of Mexico through our Pipeline Assets and leasehold interests in
oil and gas properties.
Business
segment information for the periods indicated (and as of the dates
indicated), was as follows:
|
|
Three Months Ended September 30, 2016
|
Three Months Ended September 30, 2015
|
||||||
|
|
Segment
|
|
|
Segment
|
|
|
||
|
|
Refinery
|
Pipeline
|
Corporate &
|
|
Refinery
|
Pipeline
|
Corporate &
|
|
|
|
Operations
|
Transportation
|
Other
|
Total
|
Operations
|
Transportation
|
Other
|
Total
|
|
Revenue from
operations
|
$54,668,780
|
$19,526
|
$-
|
$54,688,306
|
$55,210,962
|
$45,925
|
$-
|
$55,256,887
|
|
Less: cost of operations(1)
|
(55,495,575)
|
(129,160)
|
(238,755)
|
(55,863,490)
|
(51,444,705)
|
(114,675)
|
(236,816)
|
(51,796,196)
|
|
Other non-interest income(2)
|
-
|
156,396
|
-
|
156,396
|
-
|
62,500
|
660,000
|
722,500
|
|
Adjusted EBITDA(3)
|
(826,795)
|
46,762
|
(238,755)
|
(1,018,788)
|
3,766,257
|
(6,250)
|
423,184
|
4,183,191
|
|
Less: JMA Profit Share(4)
|
(965,627)
|
-
|
-
|
(965,627)
|
(1,435,376)
|
-
|
-
|
(1,435,376)
|
|
EBITDA(3)
|
$(1,792,422)
|
$46,762
|
$(238,755)
|
|
$2,330,881
|
$(6,250)
|
$423,184
|
|
|
|
|
|
|
|
|
|
|
|
|
Depletion,
depreciation and amortization
|
|
|
(504,719)
|
|
|
|
(414,837)
|
|
|
Interest
expense, net
|
|
|
|
(484,215)
|
|
|
|
(380,342)
|
|
|
|
|
|
|
|
|
|
|
|
Income (loss)
before income taxes
|
|
|
|
(2,973,349)
|
|
|
|
1,952,636
|
|
|
|
|
|
|
|
|
|
|
|
Income tax
benefit (expense)
|
|
|
|
1,034,798
|
|
|
|
(688,403)
|
|
Net income
(loss)
|
|
|
|
$(1,938,551)
|
|
|
|
$1,264,233
|
|
|
|
|
|
|
|
|
|
|
|
Capital expenditures(5)
|
$4,182,747
|
$-
|
$-
|
$4,182,747
|
$2,355,811
|
$-
|
$-
|
$2,355,811
|
|
|
|
|
|
|
|
|
|
|
|
Identifiable assets(6)
|
$85,585,499
|
$3,106,327
|
$7,710,337
|
$96,402,163
|
$78,145,626
|
$3,303,803
|
$3,405,977
|
$84,855,406
|
|
(1)
|
Operation
cost within the Refinery Operations and Pipeline Transportation
segments includes related general, administrative, and accretion
expenses. Operation cost within Corporate and Other includes
general and administrative expenses associated with corporate
maintenance costs, such as accounting fees, director fees, and
legal expense.
|
|
(2)
|
Other
non-interest income reflects FLNG easement revenue. (See
“Note (19) Commitments and Contingencies – FLNG Master
Easement Agreement” for further discussion related to
FLNG.)
|
|
(3)
|
Adjusted EBITDA and EBITDA are non-GAAP financial measures. See
“Item 2. Management’s Discussion and Analysis of
Financial Condition and Results of Operations – Results of
Operations – Non-GAAP Financial Measures” for
additional information related to adjusted EBITDA and
EBITDA.
|
|
(4)
|
The JMA Profit Share represents the GEL TEX Marketing, LLC
Profit Share plus the Performance Fee
for the period pursuant to the Joint Marketing Agreement.
(See “Note (19) Commitments and Contingencies –
Genesis Agreements” for further discussion related to the
Joint Marketing Agreement.)
|
|
(5)
|
Capital expenditures for the prior year period reflect
reclassification of capital expenditures funded by credit
facilities to conform to the 2016 presentation.
|
|
(6)
|
Identifiable assets for the prior year period reflect
reclassification of debt issue costs as a reduction in long-term
debt to conform to the 2016 presentation.
|
|
|
|
16
|
BLUE
DOLPHIN ENERGY COMPANY
|
|
FORM
10-Q 9/30/16
|
Notes
to Consolidated Financial Statements (Continued)
Business
segment information for the periods indicated (and as of the dates
indicated), was as follows:
|
|
Nine Months Ended September 30, 2016
|
Nine Months Ended September 30, 2015
|
||||||
|
|
Segment
|
|
|
Segment
|
|
|
||
|
|
Refinery
|
Pipeline
|
Corporate &
|
|
Refinery
|
Pipeline
|
Corporate &
|
|
|
|
Operations
|
Transportation
|
Other
|
Total
|
Operations
|
Transportation
|
Other
|
Total
|
|
Revenue from
operations
|
$128,171,177
|
$71,865
|
$-
|
$128,243,042
|
$175,690,968
|
$119,882
|
$-
|
$175,810,850
|
|
Less: cost of operations(1)
|
(135,452,537)
|
(383,124)
|
(695,786)
|
(136,531,447)
|
(160,208,576)
|
(296,291)
|
(928,331)
|
(161,433,198)
|
|
Other non-interest income(2)
|
-
|
412,061
|
-
|
412,061
|
-
|
187,500
|
660,000
|
847,500
|
|
Adjusted EBITDA(3)
|
(7,281,360)
|
100,802
|
(695,786)
|
(7,876,344)
|
15,482,392
|
11,091
|
(268,331)
|
15,225,152
|
|
Less: JMA Profit Share(4)
|
(392,062)
|
-
|
-
|
(392,062)
|
(4,812,674)
|
-
|
-
|
(4,812,674)
|
|
EBITDA(3)
|
$(7,673,422)
|
$100,802
|
$(695,786)
|
|
$10,669,718
|
$11,091
|
$(268,331)
|
|
|
|
|
|
|
|
|
|
|
|
|
Depletion,
depreciation and
|
|
|
|
|
|
|
|
|
|
amortization
|
|
|
|
(1,415,519)
|
|
|
|
(1,217,005)
|
|
Interest
expense, net
|
|
|
|
(1,301,486)
|
|
|
|
(1,313,247)
|
|
|
|
|
|
|
|
|
|
|
|
Income (loss)
before income taxes
|
|
|
|
(10,985,411)
|
|
|
|
7,882,226
|
|
|
|
|
|
|
|
|
|
|
|
Income tax
benefit (expense)
|
|
|
|
3,735,040
|
|
|
|
(2,778,750)
|
|
Net income
(loss)
|
|
|
|
$(7,250,371)
|
|
|
|
$5,103,476
|
|
|
|
|
|
|
|
|
|
|
|
Capital expenditures(5)
|
$11,255,725
|
$-
|
$-
|
$11,255,725
|
$8,156,298
|
$-
|
$-
|
$8,156,298
|
|
|
|
|
|
|
|
|
|
|
|
Identifiable assets(6)
|
$85,585,499
|
$3,106,327
|
$7,710,337
|
$96,402,163
|
$78,145,626
|
$3,303,803
|
$3,405,977
|
$84,855,406
|
|
(1)
|
Operation
cost within the Refinery Operations and Pipeline Transportation
segments includes related general, administrative, and accretion
expenses. Operation cost within Corporate and Other includes
general and administrative expenses associated with corporate
maintenance costs, such as accounting fees, director fees, and
legal expense.
|
|
(2)
|
Other
non-interest income reflects FLNG easement revenue. (See
“Note (19) Commitments and Contingencies – FLNG Master
Easement Agreement” for further discussion related to
FLNG.)
|
|
(3)
|
Adjusted EBITDA and EBITDA are non-GAAP financial measures. See
“Item 2. Management’s Discussion and Analysis of
Financial Condition and Results of Operations – Results of
Operations – Non-GAAP Financial Measures” for
additional information related to adjusted EBITDA and
EBITDA.
|
|
(4)
|
The JMA Profit Share represents the GEL TEX Marketing, LLC
Profit Share plus the Performance Fee
for the period pursuant to the Joint Marketing Agreement.
(See “Note (19) Commitments and Contingencies –
Genesis Agreements” for further discussion related to the
Joint Marketing Agreement.)
|
|
(5)
|
Capital expenditures for the prior year period reflect
reclassification of capital expenditures funded by credit
facilities to conform to the 2016 presentation.
|
|
(6)
|
Identifiable assets for the prior year period reflect
reclassification of debt issue costs as a reduction in long-term
debt to conform to the 2016 presentation.
|
|
|
|
|
(5)
|
Prepaid Expenses and Other Current Assets
|
Prepaid
expenses and other current assets as of the dates indicated
consisted of the following:
|
|
September 30,
|
December 31,
|
|
|
2016
|
2015
|
|
|
|
|
|
Prepaid
insurance
|
$192,351
|
$315,120
|
|
Prepaid
listing fees
|
3,750
|
-
|
|
Prepaid
related party operating expenses
|
-
|
624,570
|
|
|
|
|
|
|
$196,101
|
$939,690
|
17
|
BLUE
DOLPHIN ENERGY COMPANY
|
|
FORM
10-Q 9/30/16
|
Notes
to Consolidated Financial Statements (Continued)
|
(6)
|
Inventory
|
Inventory
as of the dates indicated consisted of the following:
|
|
September 30,
|
December 31,
|
|
|
2016
|
2015
|
|
|
|
|
|
HOBM
|
$4,069,203
|
$5,007,576
|
|
Jet
fuel
|
3,744,702
|
2,045,784
|
|
Naphtha
|
417,223
|
309,850
|
|
AGO
|
280,277
|
278,278
|
|
Chemicals
|
261,518
|
122,777
|
|
Propane
|
24,860
|
17,860
|
|
Crude
oil and condensate
|
19,041
|
19,041
|
|
LPM
mix
|
3,156
|
7,152
|
|
|
|
|
|
|
$8,819,980
|
$7,808,318
|
|
(7)
|
Property, Plant and Equipment, Net
|
Property,
plant and equipment, net, as of the dates indicated consisted of
the following:
|
|
September 30,
|
December 31,
|
|
|
2016
|
2015
|
|
|
|
|
|
Refinery
and facilities
|
$50,516,486
|
$40,195,928
|
|
Pipelines
and facilities
|
2,127,207
|
2,127,207
|
|
Onshore
separation and handling facilities
|
325,435
|
325,435
|
|
Land
|
602,938
|
602,938
|
|
Other
property and equipment
|
652,795
|
644,795
|
|
|
54,224,861
|
43,896,303
|
|
|
|
|
|
Less:
Accumulated depletion, depreciation, and amortization
|
(7,649,077)
|
(6,234,161)
|
|
|
46,575,784
|
37,662,142
|
|
|
|
|
|
Construction
in progress
|
14,707,943
|
11,179,670
|
|
|
|
|
|
|
$61,283,727
|
$48,841,812
|
We
capitalize interest cost incurred on funds used to construct
property, plant, and equipment. The capitalized interest is
recorded as part of the asset to which it relates and is
depreciated over the asset’s useful life. Interest cost
capitalized was $1,776,863 and $556,032 as of September 30, 2016
and December 31, 2015, respectively.
18
|
BLUE
DOLPHIN ENERGY COMPANY
|
|
FORM
10-Q 9/30/16
|
Notes
to Consolidated Financial Statements (Continued)
|
(8)
|
Related Party Transactions
|
We are
party to several agreements with related parties. We believe these
related party transactions were consummated on terms equivalent to
those that prevail in arm's-length transactions. A summary of these
agreements follows:
LEH. We are party to an Operating Agreement, a Product Sales
Agreement, a Terminal Services Agreement, a Loan and Security
Agreement, and a Promissory Note with LEH. LEH, our controlling
shareholder, owns approximately 81% of our Common Stock. Jonathan
Carroll, Chairman of the Board, Chief Executive Officer, and
President of Blue Dolphin, is the majority owner of
LEH.
Operating Agreement. LEH manages and operates all of our
properties pursuant to the Operating Agreement. The Operating
Agreement expires upon the earliest to occur of: (a) the date of
the termination of the Joint Marketing Agreement pursuant to its
terms, (b) August 2018, or (c) upon written notice of either party
to the Operating Agreement of a material breach of the Operating
Agreement by the other party. For services rendered under the
Operating Agreement, LEH receives reimbursements and fees as
follows:
●
Reimbursements – For management
and operation of all properties excluding the Nixon Facility, LEH
is reimbursed at cost for all reasonable expenses incurred while
performing the services. Unsettled reimbursements to LEH are either
reflected within prepaid expenses and other current assets or
accounts payable, related party in our consolidated balance sheets.
(See “Note (5) Prepaid Expenses and Other Current
Assets” for additional disclosures with respect to prepaid
related party operating expenses.)
●
Fees – For management and
operation of the Nixon Facility, LEH receives: (i) weekly payments
from GEL to cover direct expenses incurred in an amount not to
exceed $750,000 per month (the “Operations Payments”),
(ii) $0.25 for each bbl processed at the Nixon Facility up to a
maximum quantity of 10,000 bbls per day determined on a monthly
basis, and (iii) $2.50 for each bbl processed at the Nixon Facility
in excess of 10,000 bbls per day determined on a monthly basis.
Amounts expensed as fees to LEH are reflected within refinery
operating expenses in our consolidated statements of operations.
Fees owed to LEH under the Operating Agreement are reflected within
accounts payable, related party in our consolidated balance
sheets.
Product Sales Agreement. Under a Product Sales Agreement,
LEH purchases jet fuel from the Nixon Facility for resale to third
parties. Sales to LEH under the Product Sales Agreement are
reflected within refined petroleum product sales in our
consolidated statements of operations.
Terminal Services Agreement. Pursuant to a Terminal Services
Agreement, LEH leases a petroleum storage tank at the Nixon
Facility. The Terminal Services Agreement has an initial term of 12
months and automatically renews for additional terms of 6 months.
The parties may terminate the Terminal Services Agreement upon 45
days’ written notice. Rental fees received from LEH under the
Terminal Services Agreement are reflected within tank rental
revenue in our consolidated statements of operations.
Loan and Security Agreement. In August 2016, BDPL entered
into a loan and security agreement with LEH as evidenced by a
promissory note in the original principal amount of $4.0 million
(the “LEH Loan Agreement”). The LEH Loan Agreement
matures in August 2018, and accrues interest at rate of 16.00%.
Under the LEH Loan Agreement, BDPL will make payments of $500,000
per year from the annual payment received from FLNG pursuant to a
Master Easement Agreement between BDPL and FLNG dated December 11,
2013. A final balloon payment is due at maturity.
The
proceeds of the LEH Loan Agreement were used for working capital.
There are no financial maintenance covenants associated with the
LEH Loan Agreement. The LEH Loan Agreement is secured by: (i) the
assignment of payments received by BDPL from FLNG under the Master
Easement Agreement and (ii) certain real estate assets of BDPL.
Outstanding principal and interest less associated debt issue costs
owed to LEH under the LEH Loan Agreement are reflected in long-term
debt, related party, current portion and long-term debt, related
party, net of current portion in our consolidated balance
sheets.
Promissory Note. In September 2016, Blue Dolphin entered
into a promissory note with LEH in the original principal amount of
$1,797,172 (the “LEH Note”). The LEH Note accrues
interest, compounded annually, at a rate of 8.00%. The principal
amount and any accrued but unpaid interest are due and payable in
January 2018. Under the LEH Note, prepayment, in whole or in part,
is permissible at any time and from time to time, without premium
or penalty. Outstanding
principal and interest owed to LEH under the LEH Note are reflected
in long-term debt, related party, net of current portion in our
consolidated balance sheets.
19
|
BLUE
DOLPHIN ENERGY COMPANY
|
|
FORM
10-Q 9/30/16
|
Notes
to Consolidated Financial Statements (Continued)
Ingleside Crude, LLC (“Ingleside”). We are party
to an Amended and Restated Tank Lease Agreement and a Promissory
Note with Ingleside. Ingleside is a related party of LEH and
Jonathan Carroll.
Amended and Restated Tank Lease Agreement. Pursuant to an
Amended and Restated Tank Lease Agreement with Ingleside, we lease
petroleum storage tanks to meet periodic, additional storage needs.
The Amended and Restated Tank Lease Agreement had an initial term
of 30 days with automatic 30-day renewal periods. The parties may
terminate the tank lease agreement upon 30 days’ written
notice. Renatal fees owed to Ingleside under the tank lease
agreement are reflected within accounts payable, related party in
our consolidated balance sheets. Amounts expensed as rental fees to
Ingleside under the Amended and Restated Tank Lease Agreement are
reflected within refinery operating expenses in our consolidated
statements of operations.
Promissory Note. In September 2016, Blue Dolphin entered
into a promissory note with Ingleside in the original principal
amount of $679,385 (the “Ingleside Note”). The
Ingleside Note accrues interest, compounded annually, at a rate of
8.00%. The principal amount and any accrued but unpaid interest are
due and payable in January 2018. Under the Ingleside Note,
prepayment, in whole or in part, is permissible at any time and
from time to time, without premium or penalty. Outstanding
principal and interest owed to Ingleside under the Ingleside Note
are reflected in long-term debt, related party, net of current
portion in our consolidated balance sheets.
Jonathan Carroll. We are party to Guaranty Fee Agreements
and a Promissory Note with Jonathan Carroll. Jonathan Carroll is
Chairman of the Board, Chief Executive Officer, and President of
Blue Dolphin.
Guaranty Fee Agreements. Pursuant to Guaranty Fee
Agreements, Jonathan Carroll receives fees for providing his
personal guarantee on certain of our long-term debt. Jonathan
Carroll was required to guarantee repayment of funds borrowed and
interest accrued under certain loan agreements. Amounts owed to
Jonathan Carroll under Guaranty Fee Agreements are reflected within
accounts payable, related party in our consolidated balance sheets.
(See “Note (9) Long-Term Debt, Net” for further
discussion related to the Guaranty Fee Agreements.)
Promissory Note. In September 2016, Blue Dolphin entered
into a promissory note with Jonathan Carroll in the original
principal amount of $422,374 (the “Carroll Note”). The
Carroll Note accrues interest, compounded annually, at a rate of
8.00%. The principal amount and any accrued but unpaid interest are
due and payable in January 2018. Under the Carroll Note,
prepayment, in whole or in part, is permissible at any time and
from time to time, without premium or penalty. Outstanding
principal and interest owed to Jonathan Carroll under the Carroll
Note are reflected in long-term debt, related party, net of current
portion in our consolidated balance sheets.
As of
September 30, 2016, accounts receivable related to LEH totaled
$2,869,805.
Unsettled
reimbursements associated with the Operating Agreement and
reflected within prepaid expenses and other current assets as of
the dates indicated were as follows:
|
|
September 30,
|
December 31,
|
|
|
2016
|
2015
|
|
|
|
|
|
LEH
|
$-
|
$624,570
|
|
|
|
|
|
|
$-
|
$624,570
|
20
|
BLUE
DOLPHIN ENERGY COMPANY
|
|
FORM
10-Q 9/30/16
|
Notes
to Consolidated Financial Statements (Continued)
Long-term
debt, related party associated with the LEH Loan Agreement, LEH
Note, Ingleside Note, and Carroll Note as of the dates indicated
was as follows:
|
|
September 30,
|
December 31,
|
|
|
2016
|
2015
|
|
|
|
|
|
LEH
|
$5,797,172
|
$-
|
|
Ingleside
|
679,385
|
|
|
Jonathan
Carroll
|
422,374
|
|
|
|
|
|
|
|
6,898,931
|
-
|
|
|
|
|
|
Less:
Long-term debt,
|
|
|
|
related
party,
|
|
|
|
current
portion
|
(500,000)
|
-
|
|
|
|
|
|
|
$6,398,931
|
$-
|
Accrued
interest associated with the LEH Loan Agreement as of the dates
indicated was as follows:
|
|
September 30,
|
December 31,
|
|
|
2016
|
2015
|
|
|
|
|
|
LEH
|
$80,000
|
$-
|
|
|
|
|
|
|
80,000
|
-
|
|
|
|
|
|
Less:
Interest payable,
|
|
|
|
current
portion
|
(80,000)
|
-
|
|
|
|
|
|
|
$-
|
$-
|
Accounts
payable, related party associated with the Amended and Restated
Tank Lease Agreement as of the dates indicated was as
follows:
|
|
September 30,
|
December 31,
|
|
|
2016
|
2015
|
|
|
|
|
|
Ingleside
|
$-
|
$300,000
|
|
|
|
|
|
|
$-
|
$300,000
|
21
|
BLUE
DOLPHIN ENERGY COMPANY
|
|
FORM
10-Q 9/30/16
|
Notes
to Consolidated Financial Statements (Continued)
Refinery
operating expenses associated with the Operating Agreement Amended
and Restated Tank Lease Agreement for the periods indicated were as
follows:
|
|
Three Months Ended September 30,
|
Nine Months Ended September 30,
|
||||||
|
|
2016
|
2015
|
2016
|
2015
|
||||
|
|
Amount
|
Per bbl
|
Amount
|
Per bbl
|
Amount
|
Per bbl
|
Amount
|
Per bbl
|
|
|
|
|
|
|
|
|
|
|
|
LEH
|
$3,028,646
|
$2.66
|
$2,953,528
|
$2.66
|
$8,618,409
|
$2.84
|
$8,420,650
|
$2.73
|
|
Ingleside
|
125,000
|
$0.11
|
-
|
$0.00
|
850,000
|
$0.28
|
-
|
$0.00
|
|
|
|
|
|
|
|
|
|
|
|
|
$3,153,646
|
$2.77
|
$2,953,528
|
$2.66
|
$9,468,409
|
$3.12
|
$8,420,650
|
$2.73
|
Revenue
associated with the Product Sales Agreement and Terminal Services
Agreement for the periods indicated was as follows:
|
|
Three Months Ended September 30,
|
Nine Months Ended September 30,
|
||
|
|
2016
|
2015
|
2016
|
2015
|
|
|
|
|
|
|
|
Refined
petroleum product sales
|
|
|
|
|
|
LEH
|
$14,536,997
|
$-
|
$23,449,071
|
$-
|
|
Other
customers
|
39,414,296
|
54,924,070
|
103,097,645
|
174,830,292
|
|
Total
refined petroleum product sales
|
53,951,293
|
54,924,070
|
126,546,716
|
174,830,292
|
|
Tank
rental revenue
|
|
|
|
|
|
LEH
|
426,000
|
-
|
750,000
|
-
|
|
Other
customers
|
291,487
|
286,892
|
874,461
|
860,676
|
|
Total
tank rental revenue
|
717,487
|
286,892
|
1,624,461
|
860,676
|
|
|
|
|
|
|
|
Pipeline
operations
|
|
|
|
|
|
Other
customers
|
19,526
|
45,925
|
71,865
|
119,882
|
|
|
|
|
|
|
|
Total
revenue from operations
|
$54,688,306
|
$55,256,887
|
$128,243,042
|
$175,810,850
|
Interest
expense associated with the LEH Loan Agreement and Guaranty Fee
Agreements for the periods indicated were as follows:
|
|
Three Months Ended September 30,
|
Nine Months Ended September 30,
|
||
|
|
2016
|
2015
|
2016
|
2015
|
|
|
|
|
|
|
|
Jonathan
Carroll
|
$172,300
|
$165,008
|
$522,931
|
$165,008
|
|
LEH
|
80,000
|
-
|
80,000
|
-
|
|
|
|
|
|
|
|
|
$252,300
|
$165,008
|
$602,931
|
$165,008
|
22
|
BLUE
DOLPHIN ENERGY COMPANY
|
|
FORM
10-Q 9/30/16
|
Notes
to Consolidated Financial Statements (Continued)
|
(9)
|
Long-Term Debt, Net
|
Effective
January 1, 2016, we adopted the provisions of the FASB ASC guidance
that requires debt issue costs to be presented as an offset to
their related debt. Accordingly, our consolidated balance sheet as
of December 31, 2015 has been changed to reclassify approximately
$2.4 million previously reported debt issue costs as a direct
deduction of long-term debt.
Long-term
debt, net, which represents the outstanding principal and interest
of long-term debt less associated debt issue costs, as of the dates
indicated consisted of the following:
|
|
September 30, 2016
|
December 31, 2015
|
||||
|
|
|
Debt Issue
|
Long-Term
|
|
Debt Issue
|
Long-Term
|
|
|
Principal
|
Costs
|
Debt, Net
|
Principal
|
Costs
|
Debt, Net
|
|
|
|
|
|
|
|
|
|
First
Term Loan Due 2034
|
$24,111,986
|
$(1,557,748)
|
$22,554,238
|
$24,643,081
|
$(1,623,810)
|
$23,019,271
|
|
Second
Term Loan Due 2034
|
9,797,549
|
(737,370)
|
9,060,179
|
10,000,000
|
(767,672)
|
9,232,328
|
|
Notre
Dame Debt
|
1,300,000
|
-
|
1,300,000
|
1,300,000
|
-
|
1,300,000
|
|
Term
Loan Due 2017
|
369,987
|
-
|
369,987
|
924,969
|
-
|
924,969
|
|
Capital
Leases
|
178,741
|
-
|
178,741
|
304,618
|
-
|
304,618
|
|
|
$35,758,263
|
$(2,295,118)
|
$33,463,145
|
$37,172,668
|
$(2,391,482)
|
$34,781,186
|
|
|
|
|
|
|
|
|
|
Less:
Long-term debt less
|
|
|
|
|
|
|
|
unamortized
debt issue
|
|
|
|
|
|
|
|
costs,
current portion
|
|
|
(32,120,782)
|
|
|
(1,934,932)
|
|
|
|
|
|
|
|
|
|
|
|
|
$1,342,363
|
|
|
$32,846,254
|
Accrued
interest related to our long-term debt, net (reflected as interest
payable, current portion and long-term interest payable, net of
current portion in our consolidated balance sheets) as of the dates
indicated consisted of the following:
|
|
September 30,
|
December 31,
|
|
|
2016
|
2015
|
|
|
|
|
|
Notre
Dame Debt
|
$1,638,952
|
$1,482,801
|
|
LEH
Loan Agreement
|
80,000
|
-
|
|
Second
Term Loan Due 2034
|
43,836
|
39,193
|
|
First
Term Loan Due 2034
|
33,030
|
34,883
|
|
Capital
Leases
|
1,531
|
2,612
|
|
Term
Loan Due 2017
|
309
|
4,779
|
|
|
|
|
|
|
1,797,658
|
1,564,268
|
|
|
|
|
|
Less:
Interest payable, current portion
|
(158,706)
|
(81,467)
|
|
|
|
|
|
|
$1,638,952
|
$1,482,801
|
(See
“Note (8) Related Party Transactions” for disclosures
related to related party long-term debt.)
23
|
BLUE
DOLPHIN ENERGY COMPANY
|
|
FORM
10-Q 9/30/16
|
Notes
to Consolidated Financial Statements (Continued)
First Term Loan Due 2034. In June 2015, LE entered into a
loan agreement and related security agreement with Sovereign as administrative
agent and lender, providing
for a term loan in the principal amount of $25.0 million
(the “First Term Loan Due 2034”). The First Term Loan
Due 2034 matures in June 2034, has a current monthly payment of
principal and interest of $188,416, and accrues interest at a rate
based on the Wall Street Journal Prime Rate plus 2.75%. Pursuant to
a construction rider in the First Term Loan Due 2034, proceeds
available for use were placed in a disbursement account whereby
Sovereign makes payments for construction related expenses. Amounts
held in the disbursement account are reflected as restricted cash
(current portion) and restricted cash, noncurrent in our
consolidated balance sheets.
As of
September 30, 2016, LE was in violation of the debt service
coverage ratio, the current ratio, and debt to net worth ratio
financial covenants related to the First Term Loan Due 2034. As a
result of these covenant defaults, Sovereign could declare the
amounts owed under the First Term Loan Due 2034 immediately due and
payable, exercise its rights with respect to collateral securing
LE’s obligations under the loan agreement, and/or exercise
any other rights and remedies available. Sovereign waived
the financial covenant defaults as of the quarter ended September
30, 2016. However, the debt associated with the loan was classified
within the current portion of long-term debt on our consolidated
balance sheets due to the uncertainty of our ability to meet the
financial covenants in the future. There can be no assurance that
Sovereign will provide future waivers, which may have an adverse
impact on our financial position and results of operations.
(See “Note (1) Organization – Operating Risks”
and “Note (20) Subsequent Events” for additional
disclosures related to the First Term Loan Due 2034 and financial
covenant violations.)
As a
condition of the First Term Loan Due 2034, Jonathan Carroll was
required to guarantee repayment of funds borrowed and
interest accrued under the loan. For his personal guarantee, LE
entered into a Guaranty Fee Agreement with Jonathan Carroll whereby
he receives a fee equal to 2.00% per annum, paid monthly, of the
outstanding principal balance owed under the First Term Loan Due
2034. For the three months ended
September 30, 2016 and 2015, guaranty fees related to the First
Term Loan Due 2034 totaled $121,048 and $142,002, respectively. For
the nine months ended September 30, 2016 and 2015, guaranty fees
related to the First Term Loan Due 2034 totaled $365,420 and
$142,002, respectively. Guaranty fees are recognized monthly as
incurred and are included in interest and other expense in our
consolidated statements of operations. LEH, LRM and Blue
Dolphin also guaranteed the First Term Loan Due 2034. (See
“Note (8) Related Party Transactions” for additional
disclosures related to LEH and Jonathan Carroll.)
A
portion of the proceeds of the First Term Loan Due 2034 were used
to refinance approximately $8.5 million of debt owed under a
previous debt facility with American First National Bank. Remaining
proceeds are being used primarily to construct new petroleum
storage tanks at the Nixon Facility. The First Term Loan Due 2034
is secured by: (i) a first lien on all Nixon Facility business
assets (excluding accounts receivable and inventory), (ii)
assignment of all Nixon Facility contracts, permits, and licenses,
(iii) absolute assignment of Nixon Facility rents and leases,
including tank rental income, (iv) a $1.0 million payment reserve
account held by Sovereign, and (v) a pledge of $5.0 million of a
life insurance policy on Jonathan Carroll. The First Term Loan Due
2034 contains representations and warranties, affirmative,
restrictive, and financial covenants, as well as events of default
which are customary for credit facilities of this
type.
Second Term Loan Due 2034. In December 2015, LRM entered
into a loan agreement and related security agreement with Sovereign
as administrative agent and lender, providing for a term loan in
the principal amount of $10.0 million (the “Second Term Loan
Due 2034”). The Second Term Loan Due 2034 matures in December
2034, has a current monthly payment of principal and interest of
$74,111, and accrues interest at a rate based on the Wall Street
Journal Prime Rate plus 2.75%. Pursuant to a construction rider in
the Second Term Loan Due 2034, proceeds available for use were
placed in a disbursement account whereby Sovereign makes payments
for construction related expenses. Amounts held in the disbursement
account are reflected as restricted cash (current portion) and
restricted cash, noncurrent in our consolidated balance
sheets.
As of
September 30, 2016, LRM was in violation of the debt service
coverage ratio, the current ratio, and the debt to net worth ratio
financial covenants related to the Second Term Loan Due 2034. As a
result of these covenant defaults, Sovereign could declare the
amounts owed under the Second Term Loan Due 2034 immediately due
and payable, exercise its rights with respect to collateral
securing LRM’s obligations under the loan agreement, and/or
exercise any other rights and remedies available.
Sovereign
waived the financial covenant defaults as of the quarter ended
September 30, 2016. However, the debt associated with the loan was
classified within the current portion of long-term debt on our
consolidated balance sheets due to the uncertainty of our ability
to meet the financial covenants in the future. There can be no
assurance that Sovereign will provide future waivers, which may
have an adverse impact on our financial position and results of
operations. (See “Note (1) Organization –
Operating Risks” and “Note (20) Subsequent
Events” for additional disclosures related to the Second Term
Loan Due 2034 and financial covenant violations.)
24
|
BLUE
DOLPHIN ENERGY COMPANY
|
|
FORM
10-Q 9/30/16
|
Notes
to Consolidated Financial Statements (Continued)
As a
condition of the Second Term Loan Due 2034, Jonathan Carroll was
required to guarantee repayment of funds borrowed and interest
accrued under the loan. For his personal guarantee, LRM entered
into a Guaranty Fee Agreement with Jonathan Carroll whereby he
receives a fee equal to 2.00% per annum, paid monthly, of the
outstanding principal balance owed under the Second Term Loan Due
2034. For the three months ended September 30, 2016 and 2015,
guaranty fees related to the Second Term Loan Due 2034 totaled
$49,094 and $0, respectively. For the nine months ended September
30, 2016 and 2015, guaranty fees related to the Second Term Loan
Due 2034 totaled $148,261 and $0, respectively. Guaranty fees are
recognized monthly as incurred and are included in interest and
other expense in our consolidated statements of operations. LEH, LE
and Blue Dolphin also guaranteed the Second Term Loan Due 2034.
(See “Note (8) Related Party Transactions” for
additional disclosures related to LEH and Jonathan
Carroll.)
A
portion of the proceeds of the Second Term Loan Due 2034 were used
to refinance a previous bridge loan from Sovereign in the amount of
$3.0 million. Remaining proceeds are being used primarily to
construct additional new petroleum storage tanks at the Nixon
Facility. The Second Term Loan Due 2034 is secured by: (i) a second
priority lien on the rights of LE in the Nixon Facility and the
other collateral of LE pursuant to a security agreement; (ii) a
first priority lien on the real property interests of LRM; (iii) a
first priority lien on all of LRM’s fixtures, furniture,
machinery and equipment; (iv) a first priority lien on all of
LRM’s contractual rights, general intangibles and
instruments, except with respect to LRM’s rights in its
leases of certain specified tanks, with respect to which Sovereign
has a second priority lien in such leases subordinate to a prior
lien granted by LRM to Sovereign to secure obligations of LRM under
the Term Loan Due 2017; and (v) all other collateral as described
in the security documents. The Second Term Loan Due 2034 contains
representations and warranties, affirmative, restrictive, and
financial covenants, as well as events of default which are
customary for credit facilities of this type.
Notre Dame Debt. LE entered into a loan with Notre Dame
Investors, Inc. as evidenced by a promissory note in the original
principal amount of $8.0 million, which is currently held by John
Kissick (the “Notre Dame Debt”). The Notre Dame Debt
matures in January 2018, and accrues interest at a rate of
16.00%.
The
Notre Dame Debt is secured by a Deed of Trust, Security Agreement
and Financing Statements (the “Subordinated Deed of
Trust”), which encumbers the Nixon Facility and general
assets of LE. There are no financial maintenance
covenants associated with the Notre Dame Debt. Pursuant to a
Subordination Agreement dated June 2015, the holder of the Notre
Dame Debt agreed to subordinate any security interest and liens on
the Nixon Facility, as well as its right to payments, in favor of
Sovereign as holder of the First Term Loan Due 2034.
Term Loan Due 2017. LRM entered into a Loan and Security
Agreement with Sovereign in May 2014, for a term loan facility in
the principal amount of $2.0 million (the “Term Loan Due
2017”). The Term Loan Due 2017 was amended in March 2015,
pursuant to a Loan Modification Agreement (the “March Loan
Modification Agreement”). Under the March Loan Modification
Agreement, the interest rate was modified to be the greater of the
Wall Street Journal Prime Rate plus 2.75% or 6.00%, and the due
date was extended to March 2017. Pursuant to the March Loan
Modification Agreement, the Term Loan Due 2017 has a current
monthly principal payment of $61,665 plus interest. Due to its
maturity date, the Term Loan Due 2017 was classified within the
current portion of long-term debt on our consolidated balance sheet
as of September 30, 2016.
As of
September 30, 2016, LRM was in violation of the debt service
coverage ratio financial covenant related to the Term Loan Due
2017. As a result of this covenant default, Sovereign could declare
the amounts owed under the Term Loan Due 2017 immediately due and
payable, exercise its rights with respect to collateral securing
LRM’s obligations under the loan agreement, and/or exercise
any other rights and remedies available. The Term Loan Due 2017 was
already classified within the current portion of long-term debt on
our consolidated balance sheets due to the loan’s short-term
maturity date. Sovereign waived the financial covenant default as
of the quarter ended September 30, 2016. There can be no assurance
that Sovereign will provide future waivers, which may have an
adverse impact on our financial position and results of operations.
(See “Note (1) Organization – Operating Risks”
and “Note (20) Subsequent Events” for additional
disclosures related to the Second Term Loan Due 2034 and financial
covenant violations.)
As a
condition of the Term Loan Due 2017, Jonathan Carroll was required
to guarantee repayment of funds borrowed and
interest accrued under the loan. For his personal guarantee, LRM
entered into a Guaranty Fee Agreement with Jonathan Carroll whereby
he receives a fee equal to 2.00% per annum, paid monthly, of the
outstanding principal balance owed under the Term Loan Due 2017.
For the three months ended September
30, 2016 and 2015, guaranty fees related to the Term Loan Due 2017
totaled $2,158 and $6,506, respectively. For the nine months ended
September 30, 2016 and 2015, guaranty fees related to the Term Loan
Due 2017 totaled $9,250 and $6,506, respectively. Guaranty fees are
recognized monthly as incurred and are included in interest and
other expense in our consolidated statements of
operations.
25
|
BLUE
DOLPHIN ENERGY COMPANY
|
|
FORM
10-Q 9/30/16
|
Notes
to Consolidated Financial Statements (Continued)
The
proceeds of the Term Loan Due 2017 were used primarily to finance
costs associated with refurbishment of the Nixon Facility’s
naphtha stabilizer and depropanizer units. The Term Loan Due 2017
is: (i) subject to a financial maintenance covenant pertaining to
debt service coverage ratio and (ii) secured by the assignment of
certain leases of LRM and certain assets of LEH. (See “Note
(8) Related Party Transactions” for additional disclosures
related to LEH and Jonathan Carroll.)
Capital Leases. LRM entered into a 36-month build-to-suit
capital lease in August 2014 for the purchase of new boiler
equipment for the Nixon Facility. The equipment, which was
delivered in December 2014, was added to construction in progress.
Once placed in service, the equipment will be reclassified to
refinery and facilities and depreciation will begin. The capital
lease, which requires a quarterly payment in the amount of $44,258,
is guaranteed by Blue Dolphin.
A
summary of equipment held under long-term capital leases as of the
dates indicated follows:
|
|
September 30,
|
December 31,
|
|
|
2016
|
2015
|
|
|
|
|
|
Boiler
equipment
|
$538,598
|
$538,598
|
|
Less:
accumulated depreciation
|
-
|
-
|
|
|
|
|
|
|
$538,598
|
$538,598
|
|
(10)
|
Accrued Expenses and Other Current Liabilities
|
Accrued
expenses and other current liabilities as of the dates indicated
consisted of the following:
|
|
September 30,
|
December 31,
|
|
|
2016
|
2015
|
|
|
|
|
|
Unrealized
hedging loss
|
$1,326,890
|
$183,400
|
|
Unearned
revenue
|
597,162
|
781,859
|
|
Customer
deposits
|
450,000
|
-
|
|
Genesis
JMA Profit Share payable
|
245,255
|
388,364
|
|
Other
payable
|
166,314
|
157,714
|
|
Board
of director fees payable
|
133,929
|
86,429
|
|
Property
taxes
|
92,678
|
-
|
|
Transportation
and inspection
|
38,000
|
-
|
|
Excise
and income taxes payable
|
12,852
|
1,290,101
|
|
Insurance
|
-
|
103,024
|
|
|
|
|
|
|
$3,063,080
|
$2,990,891
|
|
(11)
|
Asset Retirement Obligations
|
Refinery and Facilities. Management has concluded that there
is no legal or contractual obligation to dismantle or remove the
refinery and facilities assets. Management believes that the
refinery and facilities assets have indeterminate lives under FASB
ASC guidance for estimating AROs because dates or ranges of dates
upon which we would retire these assets cannot reasonably be
estimated at this time. When a legal or contractual obligation to
dismantle or remove the refinery and facilities assets arises and a
date or range of dates can reasonably be estimated for the
retirement of these assets, we will estimate the cost of performing
the retirement activities and record a liability for the fair value
of that cost using present value techniques.
26
|
BLUE
DOLPHIN ENERGY COMPANY
|
|
FORM
10-Q 9/30/16
|
Notes
to Consolidated Financial Statements (Continued)
Pipelines and Facilities and Oil and Gas Properties. We have
AROs associated with the dismantlement and abandonment in place of
our pipelines and facilities assets, as well as the plugging and
abandonment of our oil and gas properties. We recorded a discounted
liability for the fair value of an ARO with a corresponding
increase to the carrying value of the related long-lived asset at
the time the asset was installed or placed in service. We
depreciate the amount added to property and equipment and recognize
accretion expense in connection with the discounted liability over
the remaining life of the asset. Plugging and abandonment costs are
recorded during the period incurred or as information becomes
available to substantiate actual and/or probable
costs.
Changes
to our ARO liability for the periods indicated were as
follows:
|
|
September 30,
|
December 31,
|
|
|
2016
|
2015
|
|
|
|
|
|
Asset
retirement obligations, at the beginning of the period
|
$1,985,864
|
$1,866,770
|
|
New
asset retirement obligations and adjustments
|
-
|
49
|
|
Liabilities
settled
|
(61,408)
|
(92,330)
|
|
Accretion
expense
|
84,558
|
211,375
|
|
|
2,009,014
|
1,985,864
|
|
Less:
asset retirement obligations, current portion
|
(25,972)
|
(38,644)
|
|
|
|
|
|
Long-term
asset retirement obligations, at the end of the period
|
$1,983,042
|
$1,947,220
|
Liabilities
settled represents amounts paid for plugging and abandonment costs
against the asset’s ARO liability and are reflected in our
consolidated balance sheets. As of September 30, 2016 and December
31, 2015, we recognized $61,408 and $92,330, respectively, in
liabilities settled. Abandonment expense represents amounts paid
for plugging and abandonment costs that exceed the asset’s
ARO liability and are reflected in our consolidated statements of
operations. For the three months ended September 30, 2016 and 2015,
we recognized $0 in abandonment expense. For the nine months ended
September 30, 2016 and 2015, we recognized $0 in abandonment
expense.
|
(12)
|
Treasury Stock
|
As of
September 30, 2016 and December 31, 2015, we had 150,000 shares of
treasury stock.
|
(13)
|
Concentration of Risk
|
Bank Accounts. Financial instruments that potentially
subject us to concentrations of risk consist primarily of cash,
trade receivables and payables. We maintain our cash balances at
financial institutions located in Houston, Texas. In the U.S., the
Federal Deposit Insurance Corporation (the “FDIC”)
insures certain financial products up to a maximum of $250,000 per
depositor. As of September 30, 2016 and December 31, 2015, we had
cash balances in excess of the FDIC insurance limit per depositor
in the amount of $9,345,560 and $19,594,883,
respectively.
Key Supplier. Under a Crude Oil and Supply Throughput
Services Agreement dated in August 2011 (the “Crude Supply
Agreement”), GEL supplies crude oil and condensate to the
Nixon Facility. The initial term of the Crude Supply Agreement was
to expire in August 2014. However, in October 2013, we entered into
a Letter Agreement Regarding Certain Advances and Related
Agreements with GEL and Milam
Services, Inc., another Genesis
affiliate (“Milam”), (the “October
2013 Letter Agreement”), effective in October 2013. In
accordance with the terms of the October 2013 Letter Agreement, we
agreed not to terminate the Crude Supply Agreement and GEL agreed
to automatically renew the Crude Supply Agreement at the end of the
initial term for successive one year periods until August 2019,
unless sooner terminated by GEL with 180 days’ prior written
notice.
(See
“Note (19) Commitments and Contingencies – Genesis
Agreements” and “Legal Matters,” as well as
“Part II. Other Information, Item 1A. Risk Factors” for
a summary of the Crude Supply Agreement and a discussion of the
current contract-related dispute with Genesis.)
27
|
BLUE
DOLPHIN ENERGY COMPANY
|
|
FORM
10-Q 9/30/16
|
Notes
to Consolidated Financial Statements (Continued)
Significant Customers. We routinely assess the financial
strength of our customers and have not experienced significant
write-downs in our accounts receivable balances. As a result, we
believe that our accounts receivable credit risk exposure is
limited.
For the
three months ended September 30, 2016, we had 4 customers that
accounted for approximately 70% of our refined petroleum products
sales. These 4 customers represented approximately $6.7 million in
accounts receivable as of September 30, 2016. For the three months
ended September 30, 2015, we had 5 customers that accounted for
approximately 81% of our refined petroleum products sales. These 5
customers represented approximately $5.7 million in accounts
receivable as of September 30, 2015.
For the
nine months ended September 30, 2016, we had 4 customers that
accounted for approximately 64% of our refined petroleum products
sales. These 4 customers represented approximately $5.5 million in
accounts receivable as of September 30, 2016. For the nine months
ended September 30, 2015, we had 3 customers that accounted for
approximately 55% of our refined petroleum products sales. These 3
customers represented approximately $4.4 million in accounts
receivable as of September 30, 2015.
For the
three months ended September 30, 2016, 1 of our 4 significant
customers was LEH, a related party. LEH accounted for approximately
27% of our refined petroleum product sales. For the nine months
ended September 30, 2016, LEH accounted for approximately 19% of
our refined petroleum product sales. As of September 30, 2016, LEH
represented approximately $2.9 million in accounts receivable. LEH
was not a customer during 2015. (See “Note (8) Related Party
Transactions” for additional disclosures with respect to
related parties.)
Refined Petroleum Product Sales. Our refined petroleum
products are primarily sold in the U.S. However, with the opening
of the Mexican diesel market to private companies, we began
exporting low sulfur diesel to Mexico during the second quarter of
2016. Total refined petroleum product sales by distillation (from
light to heavy) for the periods indicated consisted of the
following:
|
|
Three Months Ended September 30,
|
Nine Months Ended September 30,
|
||||||
|
|
2016
|
2015
|
2016
|
2015
|
||||
|
|
|
|
|
|
|
|
|
|
|
LPG
mix
|
$237,009
|
0.4%
|
$617,715
|
1.1%
|
$621,313
|
0.5%
|
$909,207
|
0.5%
|
|
Naphtha
|
11,870,484
|
22.0%
|
11,218,381
|
20.4%
|
28,183,809
|
22.3%
|
38,048,064
|
21.8%
|
|
Jet
fuel
|
15,104,900
|
28.0%
|
17,782,534
|
32.4%
|
41,150,686
|
32.5%
|
51,713,507
|
29.6%
|
|
HOBM
|
14,206,759
|
26.4%
|
9,609,536
|
17.5%
|
25,259,753
|
20.0%
|
40,640,975
|
23.2%
|
|
Reduced
Crude
|
0.0%
|
50,407
|
0.1%
|
3,791,919
|
3.0%
|
50,407
|
0.0%
|
|
|
AGO
|
12,532,141
|
23.2%
|
15,645,497
|
28.5%
|
27,539,236
|
21.7%
|
43,468,132
|
24.9%
|
|
|
|
|
|
|
|
|
|
|
|
|
$53,951,293
|
100.0%
|
$54,924,070
|
100.0%
|
$126,546,716
|
100.0%
|
$174,830,292
|
100.0%
|
|
(14)
|
Leases
|
Our
company headquarters is located in downtown Houston, Texas. We
lease 13,878 square feet of office space, 7,389 square feet of
which is used and paid for by LEH. The office lease has a 10-year
term that expires in September 2017. The lease included a free rent
period, has escalating rent payment provisions, and requires
payment of a portion of operating expenses. Rent expense is
recognized on a straight-line basis. For the three months ended
September 30, 2016 and 2015, rent expense totaled $33,251 and $29,857, respectively. For the
nine months ended September 30, 2016 and 2015, rent expense totaled
$92,966 and $112,746, respectively.
28
|
BLUE
DOLPHIN ENERGY COMPANY
|
|
FORM
10-Q 9/30/16
|
Notes
to Consolidated Financial Statements (Continued)
|
(15)
|
Income Taxes
|
Income Tax Benefit (Expense). Income tax benefit (expense)
for the periods indicated consisted of the following:
|
|
Three Months Ended September 30,
|
Nine Months Ended September 30,
|
||
|
|
2016
|
2015
|
2016
|
2015
|
|
|
|
|
|
|
|
Current:
|
|
|
|
|
|
Federal
|
$-
|
$(37,620)
|
$-
|
$(122,863)
|
|
State
|
-
|
(36,102)
|
-
|
(148,656)
|
|
Deferred:
|
|
|
|
|
|
Federal
|
1,034,798
|
(614,681)
|
3,735,040
|
(2,507,231)
|
|
|
|
|
|
|
|
|
$1,034,798
|
$(688,403)
|
$3,735,040
|
$(2,778,750)
|
The
state of Texas has a Texas margins tax (“TMT”), which
is a form of business tax imposed on gross margin. Although TMT is
imposed on an entity’s gross margin rather than on its net
income, certain aspects of TMT make it similar to an income tax.
Accordingly, TMT is treated as an income tax for financial
reporting purposes.
Deferred Income Taxes. Deferred income tax balances reflect
the effects of temporary differences between the carrying amounts
of assets and liabilities and their tax basis, as well as from NOL
carryforwards. We state those balances at the enacted tax rates we
expect will be in effect when taxes are actually paid. NOL
carryforwards and deferred tax assets represent amounts available
to reduce future taxable income.
NOL Carryforwards. Under Section 382 of the Internal Revenue
Code of 1986, as amended (“IRC Section 382”), a
corporation that undergoes an “ownership change” is
subject to limitations on its use of pre-change NOL carryforwards
to offset future taxable income. Within the meaning of IRC Section
382, an “ownership change” occurs when the aggregate
stock ownership of certain stockholders (generally 5% shareholders,
applying certain look-through rules) increases by more than 50
percentage points over such stockholders' lowest percentage
ownership during the testing period (generally three years). For
income tax purposes, we experienced ownership changes in 2005, in
connection with a series of private placements, and in 2012, as a
result of a reverse acquisition, that limit the use of pre-change
NOL carryforwards to offset future taxable income. In general, the
annual use limitation equals the aggregate value of common stock at
the time of the ownership change multiplied by a specified
tax-exempt interest rate. The 2012 ownership change will subject
approximately $18.8 million in NOL carryforwards that were
generated prior to the ownership change to an annual use limitation
of $638,196 per year. Unused portions of the annual use limitation
amount may be used in subsequent years. As a result of the annual
use limitation, approximately $6.7 million in NOL carryforwards
that were generated prior to the 2012 ownership change will expire
unused. NOL carryforwards that were generated after the 2012
ownership change are not subject to an annual use limitation under
IRC Section 382 and may be used for a period of 20 years in
addition to available amounts of NOL carryforwards generated prior
to the ownership change.
Remainder
of Page Intentionally Left Blank
29
|
BLUE
DOLPHIN ENERGY COMPANY
|
|
FORM
10-Q 9/30/16
|
Notes
to Consolidated Financial Statements (Continued)
NOL
carryforwards that remained available for future use for the
periods indicated were as follow (amounts shown are net of NOLs
that will expire unused as a result of the IRC Section 382
limitation):
|
|
Net
Operating Loss Carryforward
|
|
|
|
|
Pre-Ownership
Change
|
Post-Ownership
Change
|
Total
|
|
|
|
|
|
|
Balance
at December 31, 2014
|
$10,766,912
|
$12,145,789
|
$22,912,701
|
|
|
|
|
|
|
Net
operating loss carryforwards utilized
|
(1,152,463)
|
(2,528,848)
|
(3,681,311)
|
|
|
|
|
-
|
|
Balance
at December 31, 2015
|
9,614,449
|
9,616,941
|
19,231,390
|
|
|
|
|
|
|
Net
operating losses
|
-
|
5,871,350
|
5,871,350
|
|
|
|
|
|
|
Balance
at March 31, 2016
|
9,614,449
|
15,488,291
|
25,102,740
|
|
|
|
|
|
|
Net
operating losses
|
-
|
4,230,763
|
4,230,763
|
|
|
|
|
|
|
Balance
at June 30, 2016
|
9,614,449
|
19,719,054
|
29,333,503
|
|
|
|
|
|
|
Net
operating losses
|
-
|
2,487,642
|
2,487,642
|
|
|
|
|
|
|
Balance
at September 30, 2016
|
$9,614,449
|
$22,206,696
|
$31,821,145
|
Deferred Tax Assets and Liabilities. As of September 30,
2016 and December 31, 2015, approximately $7.3 million and $3.6
million, respectively, of net deferred tax assets remained
available for future use. Significant components of deferred tax
assets and liabilities as of the dates indicated were as
follow:
|
|
September 30,
|
December 31,
|
|
|
2016
|
2015
|
|
|
|
|
|
Deferred
tax assets:
|
|
|
|
Net
operating loss and capital loss carryforwards
|
$13,089,512
|
$8,815,794
|
|
Start-up
costs (Nixon Facility)
|
1,407,697
|
1,510,699
|
|
Asset
retirement obligations liability/deferred revenue
|
714,961
|
717,723
|
|
Unrealized
hedges
|
451,141
|
62,356
|
|
AMT
credit and other
|
257,323
|
302,086
|
|
Total
deferred tax assets
|
15,920,634
|
11,408,658
|
|
|
|
|
|
Deferred
tax liabilities:
|
|
|
|
Fair
market value adjustments
|
(46,116)
|
(46,116)
|
|
Unrealized
hedges
|
-
|
-
|
|
Basis
differences in property and equipment
|
(6,261,919)
|
(5,484,983)
|
|
Total
deferred tax liabilities
|
(6,308,035)
|
(5,531,099)
|
|
|
|
|
|
|
9,612,599
|
5,877,559
|
|
|
|
|
|
Valuation
allowance
|
(2,270,322)
|
(2,270,322)
|
|
|
|
|
|
Deferred
tax assets, net
|
$7,342,277
|
$3,607,237
|
30
|
BLUE
DOLPHIN ENERGY COMPANY
|
|
FORM
10-Q 9/30/16
|
Notes
to Consolidated Financial Statements (Continued)
Valuation Allowance. As of each reporting date, management
considers new evidence, both positive and negative, that could
impact management’s view with regard to future realization of
deferred tax assets. As of September 30, 2016 and December 31,
2015, management determined that sufficient positive evidence
existed to conclude that it was more likely than not that net
deferred tax assets of approximately $7.3 million and $3.6 million,
respectively, were realizable, and as a result, reflected a
valuation allowance of $2.3 million at each date.
Current Versus Long-Term. Effective April 1, 2016, we
adopted the provisions of the FASB ASC guidance that simplifies the
presentation of deferred income taxes by requiring that deferred
tax liabilities and assets be classified as noncurrent instead of
separated into current and noncurrent. Accordingly, our
consolidated balance sheet as of December 31, 2015 has been changed
to reclassify approximately $3.5 million previously reported as
deferred tax assets, current portion, net to deferred tax assets,
net.
Uncertain Tax Positions. We adopted the provisions of the
FASB ASC guidance on accounting for uncertainty in income taxes.
The guidance clarifies the accounting for uncertainty in income
taxes recognized in an enterprise’s financial statements. The
guidance also prescribes a recognition threshold and measurement
attribute for the financial statement recognition and measurement
of a tax position taken or expected to be taken in a tax return.
The standard also provides guidance on de-recognition,
classification, interest and penalties, accounting in interim
periods, disclosure and transition.
As part
of this guidance, we record income tax related interest and
penalties, if applicable, as a component of the provision for
income tax benefit (expense). However, there were no amounts
recognized relating to interest and penalties in the consolidated
statements of operations for the three and nine months ended
September 30, 2016 and 2015. Our federal income tax returns are
subject to examination by the Internal Revenue Service for tax
years ending December 31, 2012, or after and by the state of Texas
for tax years ending December 31, 2011, or after. We believe there
are no uncertain tax positions for both federal and state income
taxes.
|
(16)
|
Earnings Per Share
|
A
reconciliation between basic and diluted income per share for the
periods indicated was as follows:
|
|
Three Months Ended September 30,
|
Nine Months Ended September 30,
|
||
|
|
2016
|
2015
|
2016
|
2015
|
|
|
|
|
|
|
|
Net
income (loss)
|
$(1,938,551)
|
$1,264,233
|
$(7,250,371)
|
$5,103,476
|
|
|
|
|
|
|
|
Basic
and diluted income per share
|
$(0.19)
|
$0.12
|
$(0.69)
|
$0.49
|
|
|
|
|
|
|
|
Basic and Diluted
|
|
|
|
|
|
Weighted
average number of shares of
|
|
|
|
|
|
common
stock outstanding and potential
|
|
|
|
|
|
dilutive
shares of common stock
|
10,464,715
|
10,453,802
|
10,460,849
|
10,451,168
|
Diluted
EPS is computed by dividing net income available to common
stockholders by the weighted average number of shares of common
stock outstanding. Diluted EPS for the three and nine months ended
September 30, 2016 and 2015 was the same as basic EPS as there were
no stock options or other dilutive instruments
outstanding.
|
(17)
|
Fair Value Measurement
|
The
purchase and sale of financial instruments may be executed for the
purpose of economically hedging commodity price risks associated
with our refined petroleum products and the purchase of crude oil
and condensate. When executed these financial instruments are
direct contractual obligations of our crude supplier and not us.
However, we financially benefit from any gains and financially bear
any losses associated with the purchase and/or sale of such
financial instruments. Because such instruments represent embedded
derivatives for the purpose of financial reporting, we account for
such embedded derivatives in our financial records by utilizing the
market approach when measuring fair value of our financial
instruments (typically in current assets and/or liabilities, as
discussed below). The market approach uses prices and other
relevant information generated by such market transactions executed
on our behalf involving identical or comparable assets or
liabilities.
Generally
accepted accounting principles establish a framework for measuring
fair value. That framework provides a fair value hierarchy that
prioritizes the inputs to valuation techniques used to measure fair
value. The hierarchy gives the highest priority to unadjusted
quoted prices in active markets for identical assets or liabilities
(Level 1 measurements) and the lowest priority to unobservable
inputs (Level 3 measurements). The fair value hierarchy consists of
the following three levels:
31
|
BLUE
DOLPHIN ENERGY COMPANY
|
|
FORM
10-Q 9/30/16
|
Notes
to Consolidated Financial Statements (Continued)
|
Level
1
|
Inputs
are quoted prices (unadjusted) in active markets for identical
assets or liabilities.
|
|
|
|
|
Level
2
|
Inputs
are quoted prices for similar assets or liabilities in an active
market, quoted prices for identical or similar assets or
liabilities in markets that are not active, inputs other than
quoted prices that are observable and market-corroborated inputs,
which are derived principally from or corroborated by observable
market data.
|
|
|
|
|
Level
3
|
Inputs
are derived from valuation techniques in which one or more
significant inputs or value drivers are unobservable and cannot be
corroborated by market data or other entity-specific
inputs.
|
The
carrying amounts of accounts receivable, accounts payable, and
accrued liabilities approximated their fair values as of September
30, 2016 and December 31, 2015 due to their short-term maturities.
The fair value of our long-term debt, net including the current
portion as of September 30, 2016 and December 31, 2015 was
$39,758,263 and $37,172,668, respectively. The fair value of our
debt was determined using a Level 3 hierarchy.
The
following table represents our assets and liabilities measured at
fair value on a recurring basis as of September 30, 2016 and
December 31, 2015 and the basis for the measurement:
|
|
|
Fair Value Measurement at September 30, 2016 Using
|
||
|
Financial
assets (liabilities):
|
Carrying Value at September 30, 2016
|
Quoted Prices in
Active Markets for Identical Assets or Liabilities (Level
1)
|
Significant
Other Observable Inputs (Level 2)
|
Significant
Unobservable Inputs (Level 3)
|
|
|
|
|
|
|
|
Commodity
contracts
|
$(1,326,890)
|
$(1,326,890)
|
$-
|
$-
|
|
|
|
Fair Value Measurement at December 31, 215 Using
|
||
|
Financial
assets (liabilities):
|
Carrying Value at December 31, 2015
|
Quoted Prices in
Active Markets for Identical Assets or Liabilities (Level
1)
|
Significant
Other Observable Inputs (Level 2)
|
Significant
Unobservable Inputs (Level 3)
|
|
|
|
|
|
|
|
Commodity
contracts
|
$(183,400)
|
$(183,400)
|
$-
|
$-
|
Carrying
amounts of commodity contracts are reflected as other current
assets or other current liabilities in our consolidated balance
sheets.
|
(18)
|
Inventory Risk Management
|
Management
periodically determines whether to maintain, increase, or decrease
inventory levels based on various factors, including the crude
pricing market in the U.S. Gulf Coast region, the refined petroleum
products market in the same region, the relationship between these
two markets, fulfilling contract demands, and other factors that
may impact our operations, financial condition, and cash flows.
Under our inventory risk management policy, commodity futures
contracts may be used to mitigate the change in value for certain
of our refined petroleum product inventories subject to market
price fluctuations in our inventory. The physical inventory volumes
are not exchanged, and these contracts are net settled with
cash.
The
fair value of commodity futures contracts is reflected in our
consolidated balance sheets and the related net gain or loss is
recorded within cost of refined products sold in our consolidated
statements of operations. Quoted prices for identical assets or
liabilities in active markets (Level 1) are considered to determine
the fair values for the purpose of marking to market the financial
instruments at each period end.
Commodity
transactions are executed to minimize transaction costs, monitor
consolidated net exposures, and allow for increased responsiveness
to changes in market factors. Due to mark-to-market accounting
during the term of the commodity futures contracts, significant
unrealized non-cash net gains and losses could be recorded in our
results of operations.
As of
September 30, 2016, we had the following obligations based on
futures contracts of refined petroleum products and crude oil and
condensate that were entered into as economic hedges. The
information presents the notional volume of open commodity
instruments by type and year of maturity (volumes in
bbls):
|
|
Notional Contract Volumes by Year of Maturity
|
||
|
Inventory positions (futures):
|
2016
|
2017
|
2018
|
|
|
|
|
|
|
Refined
petroleum products and crude oil -
|
|
|
|
|
net
short positions
|
290,000
|
-
|
-
|
The
following table provides the location and fair value amounts of
derivative instruments that are reported in our consolidated
balance sheets as of September 30, 2016 and December 31,
2015:
|
|
|
|
|
Fair Value
|
||
|
Asset Derivatives
|
|
Balance Sheets Location
|
|
September
30, 2016
|
|
December
31, 2015
|
|
|
|
|
|
|
|
|
|
|
|
Prepaid expenses and other current
|
|
|
|
|
|
|
|
assets (accrued expenses and other
|
|
|
|
|
|
Commodity contracts
|
|
current liabilities)
|
|
$(1,326,890)
|
|
$(183,400)
|
The
following table provides the effect of derivative instruments in
our consolidated statements of operations for the three and nine
months ended September 30, 2016 and 2015:
|
|
|
|
Gain (Loss) Recognized
|
|||
|
|
|
|
Three Months Ended September 30,
|
Nine Months Ended September 30,
|
||
|
Derivatives
|
|
Statements of Operations Location
|
2016
|
2015
|
2016
|
2015
|
|
|
|
|
|
|
|
|
|
Commodity
contracts
|
|
Cost
of refined products sold
|
$770,838
|
$2,205,291
|
$(2,588,734)
|
$1,762,582
|
Remainder
of Page Intentionally Left Blank
32
|
BLUE
DOLPHIN ENERGY COMPANY
|
|
FORM
10-Q 9/30/16
|
Notes
to Consolidated Financial Statements (Continued)
|
(19)
|
Commitments and Contingencies
|
Operating Agreement. (See “Note (8) Related Party
Transactions” for additional disclosures related to the
Operating Agreement.)
Genesis Agreements. Our relationship with Genesis and its
affiliates is currently governed by two agreements, as
follows:
Crude Supply Agreement. Under the Crude Supply Agreement,
GEL supplies crude oil and condensate to the Nixon Facility. GEL
supplies crude oil and condensate to us at cost plus freight
expense and any costs associated with hedging. All crude oil and
condensate supplied to us pursuant to the Crude Supply Agreement is
paid for pursuant to the terms of the Joint Marketing Agreement as
described within this section. In addition, GEL has a first right
of refusal to use three petroleum storage tanks at the Nixon
Facility during the term of the Crude Supply Agreement. Subject to
certain termination rights, the Crude Supply Agreement had an
initial term of three years expiring in August 2014. In accordance
with the terms of the October 2013 Letter Agreement, we agreed not
to terminate the Crude Supply Agreement and GEL agreed to
automatically renew the Crude Supply Agreement at the end of the
initial term for successive one year periods until August 2019,
unless sooner terminated by GEL with 180 days’ prior written
notice; and
Joint Marketing Agreement. Under the Joint Marketing
Agreement, we, together with GEL, jointly market and sell certain
output produced at the Nixon Facility and share the associated
Gross Profits (as defined below) from such sales. Payments for the
sale of certain output produced at the Nixon Facility are made
directly to GEL as collection agent, and associated customers must
satisfy GEL’s customer credit approval process. The Joint
Marketing Agreement also provides for the sharing of “Gross
Profits” (defined as the total revenue from the sale of
certain output from the Nixon Facility minus the cost of crude oil
and condensate pursuant to the Crude Supply Agreement). Key
provisions of the Joint Marketing Agreement are as
follows:
–
We are entitled to
receive weekly payments to cover direct expenses in operating the
Nixon Facility (the “Operations Payments”) in an amount
not to exceed $750,000 per month. In addition, we are entitled to
receive reimbursement for accounting fees, if incurred, not to
exceed $50,000 per month. We assigned our rights to the Operations
Payments and reimbursement of accounting fees under the Joint
Marketing Agreement to LEH pursuant to the Operating Agreement. If
Gross Profits are insufficient to cover Operations Payments, then
GEL may: (i) reduce Operations Payments by an amount representing
the difference between the Operations Payments and the Gross
Profits for such monthly period, or (ii) provide the Operations
Payments with such Operations Payments being considered deficit
amounts owing to GEL. If Gross Profits are negative, then we are
not entitled to receive Operations Payments and GEL may recoup any
losses sustained by a special allocation of 80% of Gross Profits
until such losses are covered in full, after which the prevailing
Gross Profits allocation shall be reinstated; and
–
GEL is entitled to
receive an administrative fee in the amount of $150,000 per month
relating to the performance of its obligations under the Joint
Marketing Agreement (the “Performance Fee”). GEL is
entitled to receive 30% of the remaining Gross Profit up to
$600,000 (the “Threshold Amount”) as the GEL Profit
Share, and we are entitled to receive 70% of the remaining Gross
Profit as our Profit Share. Any amount of remaining Gross Profit
that exceeds the Threshold Amount for a calendar month is payable
to GEL and us in the following manner: (i) GEL is entitled to
receive 20% of the remaining Gross Profits over the Threshold
Amount as the GEL Profit Share and (ii) we are entitled to receive
80% of the remaining Gross Profits over the Threshold Amount as our
Profit Share. The GEL Profit Share plus the Performance Fee are
collectively referred to as the “Joint Marketing Agreement
Profit Share” or the “JMA Profit
Share”.
The
Joint Marketing Agreement contains negative covenants that restrict
our actions under certain circumstances. The Joint Marketing
Agreement had an initial term of three years expiring in August
2014. In accordance with the terms of the October 2013 Letter
Agreement, we agreed not to terminate the Joint Marketing Agreement
and GEL agreed to automatically renew the Joint Marketing Agreement
at the end of the initial term for successive one year periods
until August 2019, unless sooner terminated by GEL with 180
days’ prior written notice.
Pursuant
to a Letter Agreement Regarding Subordination of GEL Transaction
Documents dated in June 2015, we, among other things, assigned our
rights to payments under the Crude Supply Agreement and Joint
Marketing Agreement as collateral in favor of Sovereign Bank, as
lender and lienholder pursuant to the First Term Loan Due 2034.
(See “Note (9) Long-Term Debt, Net” for further
discussion related to the First Term Loan Due 2034.)
33
|
BLUE
DOLPHIN ENERGY COMPANY
|
|
FORM
10-Q 9/30/16
|
Notes
to Consolidated Financial Statements (Continued)
Genesis Contract-Related Dispute. LE currently has a
contract-related dispute with GEL related to the Joint Marketing
Agreement and Crude Supply Agreement. (See “Legal
Matters” below for a discussion of the current
contract-related dispute with Genesis.)
FLNG Master Easement Agreement. Pursuant to a Master
Easement Agreement dated in December 2013, we provide FLNG Land II,
Inc., a Delaware corporation (“FLNG”) with: (i)
uninterrupted pedestrian and vehicular ingress and egress to and
from State Highway 332, across certain of our property to certain
property of FLNG (the “Access Easement”) and (ii) a
pipeline easement and right of way across certain of our property
to certain property owned by FLNG (the “Pipeline
Easement” and together with the Access Easement, the
“Easements”). Under the agreement, FLNG will make
payments to us in the amount of $500,000 in October of each year
through 2019. Thereafter, FLNG will make payments to us in the
amount of $10,000 in October of each year for so long as FLNG
desires to use the Access Easement.
Supplemental Pipeline Bonds. In August 2015, we received a
letter from the Bureau of Ocean Energy Management (the
“BOEM”) requiring additional supplemental bonds or
acceptable financial assurance of approximately $4.2 million for
existing pipeline rights-of-way. In July 2016, the BOEM issued
Notice to Lessees (“NTL”) No. 2016-N01 (Requiring
Additional Security), which changes the way that lessees and
rights-of-way holders demonstrate financial strength and
reliability to plug and abandon wells, as well as decommission and
remove platforms and pipelines at the end of production or service
activities. The NTL, which changed an earlier supplemental waiver
process to a self-insurance model, became effective in September
2016. Pursuant to the NTL, the BOEM requested that lessees submit
any relevant information needed for an overall financial review of
the lessees account. The BOEM indicated that it would use this
information to evaluate a lessees’ ability to carry out its
obligations and determine whether, and/or how much self-insurance a
lessee can use.
In
October 2016, we received a letter from the BOEM summarizing the
amount required as additional security on our existing pipeline
rights-of-way. The letter, which is a courtesy and does not
constitute a formal order by the BOEM, requested that we provide
additional supplemental pipeline bonds or acceptable financial
reassurance of approximately $4.6 million. As of September 30, 2016
and December 31, 2015, we maintained approximately $0.9 million in
credit and cash-backed rights-of-way bonds issued to the BOEM. Of
the 5 rights-of-ways reflected in the BOEM’s October 2016
letter, one right-of-way was abandoned-in-place in May 1997. We
requested permits from the Bureau of Safety and Environmental
Enforcement (the “BSEE”) to decommission and
abandon-in-place 3 of the rights-of-way in April 2016, one of which
also requires approval from the U.S. Army Corps of Engineers. There
can be no assurance that the BOEM will accept a reduced amount of
supplemental financial assurance or not require additional
supplemental pipeline bonds related to our existing pipeline
rights-of-way. If we are required by the BOEM to provide
significant additional supplemental bonds or acceptable financial
assurance, we may experience a significant and material adverse
effect on our operations, liquidity, and financial
condition.
Financing Agreements. (See “Note (9) Long-Term Debt,
Net” for additional disclosures related to financing
agreements.)
Nixon Facility Expansion. We have made and continue to make
capital and efficiency improvements to the Nixon Facility. As a
result, we have incurred and will continue to incur capital
expenditures related to these improvements, which include, among
other things, facility and land improvements and construction of
additional petroleum storage tanks.
Legal Matters.
Genesis Contract-Related Dispute. As described above under
“Genesis Agreements,” we are party to a variety of
contracts and agreements with Genesis and its affiliates, including
GEL that enable the purchase of crude oil and condensate,
transportation of crude oil and condensate, and other
services.
In May
2016, GEL filed, in state district court in Harris County, Texas, a
petition and application for a temporary restraining order,
temporary injunction, and permanent injunction (the
“Petition”) against LE and LEH. The Petition alleges
that LE breached the Joint Marketing Agreement, and that LEH
tortiously interfered with the Joint Marketing Agreement, in
connection with an agreement by LEH to supply jet fuel acquired
from LE to a customer. The Petition primarily sought temporary and
permanent injunctions related to sales of product from the Nixon
Facility to this customer. In June 2016, the court issued a
temporary injunction against LE and LEH as requested by GEL. LE
believes that GEL’s claims in the Petition are without merit
and intends to defend the matter vigorously.
34
|
BLUE
DOLPHIN ENERGY COMPANY
|
|
FORM
10-Q 9/30/16
|
Notes
to Consolidated Financial Statements (Continued)
In a
matter separate from the above referenced Petition, LE filed a
demand for arbitration in June 2016, pursuant to the terms of a
Dispute Resolution Agreement between the parties (the
“Arbitration”). The Arbitration alleges that GEL
breached the Crude Supply Agreement related to:
(i)
failure to provide
crude oil and condensate at cost as defined in the Crude Supply
Agreement, and
(ii)
significant under
delivery of crude oil and condensate, resulting in significant
refinery downtime and a significant decrease in refinery
throughput, refinery production, and refined petroleum product
sales for the nine months ended September 30, 2016.
With
regard to the Petition, a trial date has been set for December 5,
2016, although the parties may elect arbitration prior to that
date. With respect to the Arbitration, an initial hearing was held
on November 9, 2016 at which the parties presented evidence
supporting their position. The next hearing date related to
Arbitration is November 16, 2016.
We do
not expect the temporary injunction issued by the court related to
the Litigation to have a material effect on our results of
operations or financial condition. However, although GEL resumed
normal delivery of crude oil and condensate to the Nixon Facility
in July 2016, the adverse change in our relationship with Genesis
has had a material adverse effect on our operations, liquidity, and
financial condition. In addition, the contract-related
dispute has disrupted our normal business operations and diverted
management’s focus away from operations. We are unable to
predict the outcome of the current proceedings with Genesis and GEL
or their ultimate impact, if any, on our business, financial
condition or results of operations. Accordingly, we have not
recorded an asset or a liability on our consolidated balance sheet
as of September 30, 2016.
Other Legal Matters. From time to time we are involved in
routine lawsuits, claims, and proceedings incidental to the conduct
of our business, including mechanic’s liens and
administrative proceedings. Management does not believe that such
matters will have a material adverse effect on our financial
position, earnings, or cash flows.
Health, Safety and Environmental Matters. All of our
operations and properties are subject to extensive federal, state,
and local environmental, health, and safety regulations governing,
among other things, the generation, storage, handling, use and
transportation of petroleum and hazardous substances; the emission
and discharge of materials into the environment; waste management;
characteristics and composition of jet fuel and other products; and
the monitoring, reporting and control of greenhouse gas emissions.
Our operations also require numerous permits and authorizations
under various environmental, health, and safety laws and
regulations. Failure to obtain and comply with these permits or
environmental, health, or safety laws generally could result in
fines, penalties or other sanctions, or a revocation of our
permits.
|
(20)
|
Subsequent Events
|
Financial Covenant Defaults. As of September 30, 2016, LE
and LRM were in violation of certain financial covenants related to
the First Term Loan Due 2034, Second Term Loan Due 2034, and Term
Loan Due 2017. As a result of these covenant defaults, Sovereign
could declare the amounts owed under these loan agreements
immediately due and payable, exercise its rights with respect to
collateral securing our obligations under these loan agreements,
and/or exercise any other rights and remedies
available.
By
letter dated November 10, 2016, Sovereign waived the financial
covenant defaults as of the quarter ended September 30, 2016.
However, the debt associated with these loans was classified within
the current portion of long-term debt on our consolidated balance
sheets due to the uncertainty of our ability to meet the financial
covenants in the future. There can be no assurance that Sovereign
will provide future waivers, which may have an adverse impact on
our financial position and results of operations.
Remainder
of Page Intentionally Left Blank
35
|
BLUE
DOLPHIN ENERGY COMPANY
|
|
FORM
10-Q 9/30/16
|
In this Quarterly Report, references to “Blue Dolphin,”
“we,” “us” and “our” are to
Blue Dolphin Energy Company and its subsidiaries, unless otherwise
indicated or the context otherwise requires. You should read the
following discussion together with the financial statements and the
related notes included elsewhere in this Quarterly Report, as well
as with the risk factors, financial statements, and related notes
included thereto in our Form 10-Q for the quarterly periods ended
March 31, 2016 and June 30, 2016 and our Form 10-K for the fiscal
year ended December 31, 2015 (the “Annual
Report”).
Forward Looking Statements
Certain
statements included in this Quarterly Report, including in this
“Management’s Discussion and Analysis of Financial
Condition and Results of Operations” are forward-looking
statements within the meaning of the Private Securities Litigation
Reform Act of 1935. Forward-looking statements represent
management’s beliefs and assumptions based on currently
available information. Forward-looking statements relate to
matters such as our industry, business strategy, goals and
expectations concerning our market position, future operations,
margins, profitability, capital expenditures, liquidity and capital
resources, commitments and contingencies, and other financial and
operating information. We have used the words
“anticipate,” “assume,”
“believe,” “budget,”
“continue,” “could,”
“estimate,” “expect,” “intend,”
“may,” “plan,” “potential,”
“predict,” “project,” “will,”
“future” and similar terms and phrases to identify
forward-looking statements.
Forward-looking
statements reflect our current expectations regarding future
events, results, or outcomes. These expectations may or may not be
realized. Some of these expectations may be based upon assumptions
or judgments that prove to be incorrect. In addition, our business
and operations involve numerous risks and uncertainties, many of
which are beyond our control, which could result in our
expectations not being realized, or materially affect our financial
condition, results of operations and cash flows. Actual events,
results and outcomes may differ materially from our expectations
due to a variety of factors. Although it is not possible to
identify all of these factors, they include, among others, the
following and the other factors described under the heading
“Risk Factors” in the Annual Report and this Quarterly
Report:
Risks Related to Our Business and Industry
●
Dangers inherent in
oil and gas operations that could cause disruptions and expose us
to potentially significant losses, costs or liabilities and reduce
our liquidity.
●
Geographic
concentration of our assets, which creates a significant exposure
to the risks of the regional economy.
●
Competition from
companies having greater financial and other
resources.
●
Laws and
regulations regarding personnel and process safety, as well as
environmental, health, and safety, for which failure to comply may
result in substantial fines, criminal sanctions, permit
revocations, injunctions, facility shutdowns, and/or significant
capital expenditures.
●
Insurance coverage
that may be inadequate or expensive.
●
Related party
transactions with Lazarus Energy Holdings, LLC (“LEH”)
and its affiliates, which may cause conflicts of
interest.
●
Capital needs for
which our internally generated cash flows and other sources of
liquidity may not be adequate.
●
Failure to comply
with certain financial covenants related to certain of our loan
agreements.
●
Our ability to use
net operating loss (“NOL”) carryforwards to offset
future taxable income for U.S. federal income tax purposes, which
are subject to limitation.
●
Terrorist attacks,
cyber-attacks, threats of war, or actual war may negatively affect
our operations, financial condition, results of operations, and
cash flows.
Risks Related to Our Refinery Operations Business
Segment
●
Our dependence on
Genesis Energy, LLC (“Genesis”) and its affiliates for
crude oil and condensate sourcing, inventory risk management,
hedging, and refined petroleum product marketing.
●
An unfavorable
outcome of litigation and contract-related disputes, which could
have a material adverse effect on us.
●
Our dependence on
LEH for financing and management of our properties.
36
|
BLUE
DOLPHIN ENERGY COMPANY
|
|
FORM
10-Q 9/30/16
|
Management’s
Discussion and Analysis of Financial Condition and Results of
Operations (Continued)
●
Potential refinery
downtime, which could result in lost margin opportunity, increased
maintenance costs, increased inventory, and a reduction in cash
available for payment of our obligations.
●
Loss of executive
officers or key employees, as well as a shortage of skilled labor
or disruptions in our labor force, which may make it difficult to
maintain productivity.
●
Volatility of
refining margins.
●
Volatility of crude
oil, other feedstocks, refined petroleum products, and fuel and
utility services.
●
Loss of market
share by a key customer or consolidation among our customer
base.
●
Failure to grow or
maintain the market share for our refined petroleum
products.
●
Our reliance on
third-parties for the transportation of crude oil and condensate
into and refined petroleum products out of the Nixon
Facility.
●
Interruptions in
the supply of crude oil and condensate sourced in the Eagle Ford
Shale.
●
Changes in the
supply/demand balance in the Eagle Ford Shale that could result in
lower margins on refined petroleum products.
●
Hedging of our
refined petroleum products and crude oil and condensate inventory,
which may limit our gains and expose us to other
risks.
●
Regulation of
greenhouse gas emissions, which could increase our operational
costs and reduce demand for our products.
Risks Related to Our Pipelines and Oil and Gas
Properties
●
Required increases
in bonds or other sureties in order to maintain compliance with
regulatory requirements, which could significantly impact our
liquidity and financial condition.
●
More stringent
regulatory requirements related to asset retirement obligations
(“AROs”), which could significantly increase our
estimated future AROs.
Any one
of these factors or a combination of these factors could materially
affect our future results of operations and could influence whether
any forward-looking statements ultimately prove to be accurate. Our
forward-looking statements are not guarantees of future
performance, and actual results and future performance may differ
materially from those suggested in any forward-looking statements.
We do not intend to update these statements unless we are required
to do so.
Overview
Blue
Dolphin is primarily an independent refiner and marketer of
petroleum products. Our primary asset is a 15,000 bpd crude oil and
condensate processing facility that is located in Nixon, Texas (the
“Nixon Facility”). As part of our refinery business
segment, we conduct petroleum storage and terminaling operations
under third-party lease agreements at the Nixon Facility. We also
own and operate pipeline assets. Information on or accessible
through our website (http://www.blue-dolphin-energy.com)
is not incorporated by reference in or otherwise made a part of
this Quarterly Report.
Refinery Operations
The
Nixon Facility is situated on approximately 56 acres in Nixon,
Wilson County, Texas. The Nixon Facility consists of a distillation
unit, naphtha stabilizer unit, depropanizer unit, and related
loading and unloading facilities and utilities. As of September 30,
2016, the site contained approximately 842,000 bbls of crude oil,
condensate, and refined petroleum product storage capacity. We are
currently constructing an additional 256,000 bbls of petroleum
storage capacity at the Nixon Facility. When construction is
complete, total crude oil, condensate, and refined petroleum
product storage capacity at the Nixon Facility will exceed
1,000,000 bbls.
With a
current capacity of 15,000 bpd, the Nixon Facility is considered a
“topping unit” because it is primarily comprised of a
crude distillation unit, the first stage of the crude oil refining
process. The Nixon Facility’s current level of complexity
allows us to refine crude oil and condensate into finished and
intermediate petroleum products. Our refined petroleum products are
primarily sold in the U.S. Jet fuel, our only finished product, is
sold in nearby markets to wholesalers. Our intermediate products,
including LPG, naphtha, HOBM, and AGO are primarily sold in nearby
markets to wholesalers and refiners as a feedstock for further
blending and processing. With the opening of the Mexican diesel
market to private companies, we began exporting low sulfur diesel
to Mexico during the second quarter of 2016.
37
|
BLUE
DOLPHIN ENERGY COMPANY
|
|
FORM
10-Q 9/30/16
|
Management’s
Discussion and Analysis of Financial Condition and Results of
Operations (Continued)
The
Nixon Facility uses light crude oil and condensate sourced in the
Eagle Ford Shale as feedstock. The following diagram reflects a
high level overview of the current refining process at the Nixon
Facility:
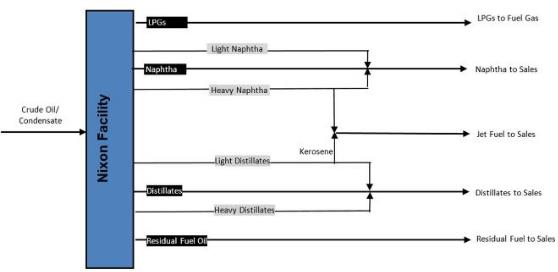
Example represents a simplified plant configuration. The specific
configuration will vary based on various market and operational
factors.
Pipeline Transportation
Our
pipeline transportation operations involve the gathering and
transportation of oil and natural gas for producers/shippers
operating offshore in the vicinity of our pipelines, as well as
leasehold interests in oil and natural gas properties, in the Gulf
of Mexico. Our pipeline transportation operations represented less
than 1% of total revenue for the three and nine months ended
September 30, 2016 and 2015.
Structure and Management
We were
formed as a Delaware corporation in 1986. We are currently
controlled by Lazarus Energy Holdings, LLC (“LEH”),
which owns approximately 81% of our common stock, par value $0.01
per share (the “Common Stock). LEH manages and operates all
of our properties pursuant to an Operating Agreement (the
“Operating Agreement”). Jonathan Carroll is Chairman of
the Board of Directors (the “Board”), Chief Executive
Officer and President of Blue Dolphin, as well as a majority owner
of LEH. (See “Part I, Financial Information, Item 1.
Financial Statements – Note (8) Related Party
Transactions,” “Note (9) Long-Term Debt, Net,”
and “Note (19) Commitments and Contingencies –
Financing Agreements” for additional disclosures related to
LEH, the Operating Agreement, and Jonathan Carroll.)
Our
operations are conducted through the following active
subsidiaries:
●
Lazarus Energy,
LLC, a Delaware limited liability company
(“LE”).
●
Lazarus Refining
& Marketing, LLC, a Delaware limited liability company
(“LRM”).
●
Blue Dolphin Pipe
Line Company, a Delaware corporation.
●
Blue Dolphin
Petroleum Company, a Delaware corporation.
●
Blue Dolphin
Services Co., a Texas corporation.
(See
"Part I, Item 2. Properties” of the Annual Report for
additional information regarding our operating
subsidiaries.)
38
|
BLUE
DOLPHIN ENERGY COMPANY
|
|
FORM
10-Q 9/30/16
|
Management’s
Discussion and Analysis of Financial Condition and Results of
Operations (Continued)
Operating Risks
Execution
of our business strategy depends on several factors, including
adequate crude oil and condensate sourcing, levels of accounts
receivable, refined petroleum product inventories, accounts
payable, capital expenditures, and adequate access to credit on
satisfactory terms. These factors may be impacted by general
economic, political, financial, competitive, and other factors that
are beyond our control. There can be no assurance that
our business and operational strategy will achieve anticipated
outcomes. Our operations, liquidity, and financial
condition may be materially adversely affected if: (i) our strategy
is not successful, (ii) our working capital requirements are not
funded through Operations Payments by GEL TEX Marketing, LLC
(“GEL”) under a Joint Marketing Agreement (the
“Joint Marketing Agreement”), our profit share under
the Joint Marketing Agreement, or certain advances from LEH, or
(iii) we have future covenant violations under our loan agreements
that are not waived.
For the
three months ended September 30, 2016, we had a net loss of
$1,938,551 compared to net income of $1,264,233 for the three
months ended September 30, 2015. For the nine months ended
September 30, 2016, we had a net loss of $7,250,371 compared to net
income of $5,103,476 for the nine months ended September 30,
2015.
As of
September 30, 2016, we had cash and cash equivalents and restricted
cash (current portion) of $1,677,485 and $4,160,999, respectively.
As of September 30, 2016, we had current assets of $22,404,232 and
current liabilities (including the current portion of long-term
debt) of $59,754,725, reflecting a working capital deficit of
$37,350,493. Excluding the current portion of long-term debt, we
had a working capital deficit of $5,229,711 as of September 30,
2016. Non-payment of Operations Payments to us by GEL under the
Joint Marketing Agreement resulting from a contract-related dispute
between the parties contributed to the working capital deficit as
of September 30, 2016. (See “Part I. Financial Information,
Item 1. Financial Statements – Note (19) Commitments and
Contingencies – Genesis Agreements and Legal Matters,”
as well as “Part II. Other Information, Item 1A. Risk
Factors” for a discussion related to Operations Payments, the
Joint Marketing Agreement, and the contract-related dispute with
Genesis.)
As of
December 31, 2015, we had cash and cash equivalents and restricted
cash (current portion) of $1,853,875 and $3,175,299, respectively.
As of December 31, 2015, we had current assets of $19,629,841 and
current liabilities (including the current portion of long-term
debt) of $20,228,648, reflecting a working capital deficit of
$598,807.
In
addition to the Joint Marketing Agreement, we are party to a
variety of contracts and agreements with Genesis and its affiliates
that enable the purchase of crude oil and condensate,
transportation of crude oil and condensate, and other services.
Certain of these agreements with Genesis and its affiliates have
successive one-year renewals until August 2019 unless sooner
terminated by Genesis or its affiliates with 180 days’ prior
written notice. An adverse change in our relationship
with Genesis could have a material adverse effect on our
operations, liquidity, and financial condition. We are
currently involved in a dispute with Genesis over certain
contractual matters. (See “Part I. Financial Information,
Item 1. Financial Statements – Note (19) Commitments and
Contingencies – Genesis Agreements” and “Legal
Matters,” as well as “Part II. Other Information, Item
1A. Risk Factors” for a summary of the Joint Marketing
Agreement and Crude Supply Agreement and information regarding the
current contract-related dispute with Genesis.)
As of
September 30, 2016, we were in violation of certain financial
covenants in secured loan agreements with Sovereign Bank
(“Sovereign”). As a result of these covenant defaults,
Sovereign could declare the amounts owed under these loan
agreements immediately due and payable, exercise its rights with
respect to collateral securing our obligations under these loan
agreements, and/or exercise any other rights and remedies
available. Sovereign waived
the financial covenant defaults as of the quarter ended September
30, 2016. However, the debt associated with these loans was
classified within the current portion of long-term debt on our
consolidated balance sheets due to the uncertainty of our ability
to meet the financial covenants in the future. There can be no
assurance that Sovereign will provide future waivers, which may
have an adverse impact on our financial position and results of
operations. (See “Part I. Financial Information, Item
1. Financial Statements – Note (9) Long-Term Debt, Net and
Note (20) Subsequent Events” for additional disclosures
related to our long-term debt and financial covenant
violations.)
39
|
BLUE
DOLPHIN ENERGY COMPANY
|
|
FORM
10-Q 9/30/16
|
Management’s
Discussion and Analysis of Financial Condition and Results of
Operations (Continued)
Major Influences on Results of Operations
Our
earnings and cash flows from our refinery operations business
segment are primarily affected by the relationship between refined
petroleum product prices and the prices for crude oil and other
feedstocks. Crude oil refining is primarily a margin-based
business, and in order to increase profitability, it is important
for a refinery to maximize the yields of higher value finished and
intermediate products and to minimize the costs of feedstock and
operating expenses. Our cost to acquire crude oil and condensate
and the price for which our refined petroleum products are
ultimately sold depend on several factors, many of which are beyond
our control, including the supply of, and demand for, crude oil and
refined petroleum products, which depend on changes in domestic and
foreign economies, weather conditions, domestic and foreign
political affairs, production levels, availability of and access to
transportation infrastructure, the availability of imports, the
marketing of competitive fuel, and governmental regulations, among
other factors.
Crude
oil and refined petroleum product prices are also affected by other
factors, such as local and general market conditions and the
operating levels of competing refineries. Crude oil costs and the
prices of refined petroleum products have historically been subject
to wide fluctuations. An expansion or upgrade of our
competitors’ facilities, price volatility, international
political and economic developments, and other factors beyond our
control are likely to continue to play an important role in crude
oil refining industry economics. Moreover, the refining industry
typically experiences seasonal fluctuations in demand for refined
petroleum products, such as increases in the demand for gasoline
during the summer driving season and for home heating oil during
the winter. These factors can impact, among other things, the level
of inventories in the market, resulting in price volatility and a
negative impact on product margins. In addition to current market
conditions, there are long-term factors that may impact the demand
for refined petroleum products. These factors include mandated
renewable fuels standards, proposed climate change laws and
regulations, and increased mileage standards for
vehicles.
Key Relationships
Relationship with LEH
We
currently rely on Operations Payments and our profit share under
the Joint Marketing Agreement and advances from LEH to fund our
working capital requirements. If GEL
does not advance Operations Payments and the profit share is
insufficient to fund our working capital requirements, LEH may, but
is not required to, fund our working capital requirements. There
can be no assurances that LEH will continue to fund our working
capital requirements.
LEH
also manages and operates all of our properties pursuant to the
Operating Agreement. For services rendered, LEH receives
reimbursements and fees. (See “Part I, Financial Information,
Item 1. Financial Statements – Note (8) Related Party
Transactions” for additional disclosures related to LEH and
the Operating Agreement.)
Relationship with Genesis
We are
party to a variety of contracts and agreements with Genesis and its
affiliates that enable the purchase of crude oil and condensate,
transportation of crude oil and condensate, and other services.
(See “Part I, Financial Information, Item 1. Financial
Statements – Note (19) Commitments and Contingencies –
Genesis Agreements” for a summary of these agreements.) We
currently have a contract-related dispute with GEL related to these
agreements. In connection with this dispute, GEL significantly
under delivered crude oil and condensate to the Nixon Facility
under the Crude Supply Agreement during the second quarter of 2016.
This resulted in significant refinery downtime and a significant
decrease in refinery throughput, refinery production, and refined
petroleum product sales for the nine months ended September 30,
2016. Although GEL resumed normal delivery of crude oil and
condensate to the Nixon Facility in July 2016, the adverse change
in our relationship with Genesis has had a material adverse effect
on our operations, liquidity, and financial condition. In
addition, the contract-related dispute has disrupted our normal
business operations and diverted management’s focus away from
operations. (See “Part I. Financial Information, Item 1.
Financial Statements – Note (19) Commitments and
Contingencies – Legal Matters” and “Part II.
Other Information, Item 1A. Risk Factors” for a discussion of
the current contract-related dispute with Genesis.)
40
|
BLUE
DOLPHIN ENERGY COMPANY
|
|
FORM
10-Q 9/30/16
|
Management’s
Discussion and Analysis of Financial Condition and Results of
Operations (Continued)
Results of Operations
We
have two reportable business segments: (i) Refinery Operations and
(ii) Pipeline Transportation. Business activities related to our
Refinery Operations business segment are conducted at the Nixon
Facility and represent approximately 99% of our operations.
Business activities related to our Pipeline Transportation business
segment are primarily conducted in the Gulf of Mexico through our
pipeline assets and leasehold interests in oil and gas properties
and represent less than 1% of our operations.
In
this Results of Operations section, we review:
●
definitions
of key financial performance measures used by
management;
●
consolidated
results, which include our Pipeline Transportation business
segment;
●
non-GAAP
financial results; and
●
Refinery
Operations business segment results.
Remainder
of Page Intentionally Left Blank
41
|
BLUE
DOLPHIN ENERGY COMPANY
|
|
FORM
10-Q 9/30/16
|
Management’s
Discussion and Analysis of Financial Condition and Results of
Operations (Continued)
GLOSSARY OF SELECTED FINANCIAL AND PERFORMANCE
MEASURES
Management
uses generally accepted accounting principles (“GAAP”)
and certain non-GAAP performance measures to assess our results of
operations. Certain performance measures used by management to
assess our operating results and the effectiveness of our business
segments are considered non-GAAP performance measures. These
performance measures may differ from similar calculations used by
other companies within the petroleum industry, thereby limiting
their usefulness as a comparative measure.
For
our refinery operations business segment, we refer to certain
refinery throughput and production data in the explanation of our
period over period changes in results of operations. For our
consolidated results, we refer to our consolidated statements of
operations in the explanation of our period over period changes in
results of operations.
Below
are definitions of key financial performance measures used by
management:
Adjusted Earnings Before Interest, Income Taxes and Depreciation
(“EBITDA”). Reflects EBITDA excluding the JMA Profit
Share.
Refinery
Operations Adjusted EBITDA.
Reflects adjusted EBITDA for our refinery operations business
segment.
Total
Adjusted EBITDA. Reflects adjusted EBITDA for our refinery
operations and pipeline transportation business segments, as well
as corporate and other.
Capacity Utilization Rate. A percentage measure that
indicates the amount of available capacity that is being used in a
refinery or transported through a pipeline. With respect to the
Nixon Facility, the rate is calculated by dividing total refinery
throughput or total refinery production on a bpd basis by the total
capacity of the Nixon Facility (currently 15,000 bpd).
Cost
of Refined Products Sold. Primarily includes purchased crude oil and
condensate costs, as well as transportation, freight and storage
costs.
Depletion,
Depreciation and Amortization.
Represents property and equipment, as well as intangible assets
that are depreciated or amortized based on the straight-line method
over the estimated useful life of the related
asset.
Downtime. Scheduled and/or unscheduled periods in which the
Nixon Facility is not operating. Downtime may occur for a variety
of reasons, including bad weather, power failures, preventive
maintenance, equipment inspection, equipment repair due to
mechanical failure, voluntary regulatory compliance measures,
cessation or suspension by regulatory authorities, and inventory
management.
Easement,
Interest and Other Income. Reflects income related to an easement agreement
with FLNG Land II, Inc., a Delaware corporation
(“FLNG”), which is recorded as land easement revenue
and recognized monthly as earned.
EBITDA. Reflects earnings before: (i) interest income
(expense), (ii) income taxes, and (iii) depreciation and
amortization.
Refinery
Operations EBITDA. Reflects
EBITDA for our refinery operations business
segment.
Total
EBITDA. Reflects EBITDA for our
refinery operations and pipeline transportation business segments,
as well as corporate and other.
General
and Administrative Expenses. Primarily include corporate costs, such as
accounting and legal fees, office lease expenses, and
administrative expenses.
Income
Tax Expense. Includes federal and state taxes, as well as
deferred taxes, arising from temporary differences between income
for financial reporting and income tax
purposes.
JMA
Profit Share. Represents the GEL TEX Marketing, LLC
(“GEL”) Profit Share plus
the Performance Fee for the period pursuant to the Joint Marketing
Agreement; is an indirect operating expense.
Net
Income. Represents total
revenue from operations less total cost of operations, total other
expense, and income tax expense.
Operating Days. Represents the number of days in a period in
which the Nixon Facility operated. Operating days is calculated by
subtracting downtime in a period from calendar days in the same
period.
Refinery
Operating Expenses. Reflect the direct operating expenses of the Nixon
Facility, including direct costs of labor, maintenance materials
and services, chemicals and catalysts and utilities. Includes fees
paid to LEH to manage and operate the Nixon Facility pursuant to
the Operating Agreement.
Refinery Operating Income. Reflects refined petroleum product
sales less direct operating costs (including cost of refined
products sold and refinery operating expenses) and the JMA profit
share.
Revenue from Operations.
Primarily consists of refined petroleum product sales, but also
includes tank rental and pipeline transportation revenue.
Excise and other taxes that are collected from customers and
remitted to governmental authorities are not included in
revenue.
Total Refinery Production. Refers to the volume processed as
output through the Nixon Facility. Refinery production includes
finished petroleum products, such as jet fuel, and intermediate
petroleum products, such as LPG, naphtha, HOBM and
AGO.
Total Refinery Throughput. Refers to the volume processed as
input through the Nixon Facility. Refinery throughput includes
crude oil and condensate and other feedstocks.
42
|
BLUE
DOLPHIN ENERGY COMPANY
|
|
FORM
10-Q 9/30/16
|
Management’s
Discussion and Analysis of Financial Condition and Results of
Operations (Continued)
Consolidated
Results
Three Months Ended September 30, 2016 (the “Current Three
Months”) Compared to Three Months Ended September 30, 2015
(the “Prior Three Months”).
Total Revenue from Operations. For the Current Three Months
we had total revenue from operations of $54,688,306 compared to
total revenue from operations of $55,256,887 for the Prior Three
Months. The slight increase in sales volume between the periods was
offset by a decrease in commodity prices. The majority of revenue
in the Current Three Months came from refined petroleum product
sales, which generated revenue of $53,951,293, or approximately 99%
of total revenue from operations, compared to $54,924,070, or more
than 99% of total revenue from operations, in the Prior Three
Months. We recognized $717,487 in tank rental revenue in the
Current Three Months compared to $286,892 in the Prior Three
Months. The significant increase in tank rental revenue between the
Current Three Months and Prior Three Months related to the addition
of a new tank rental lease agreement.
Cost of Refined Products Sold. Cost of refined products sold
was $51,689,474 for the Current Three Months compared to
$48,415,627 for the Prior Three Months. The approximate 7% increase
in cost of refined products sold was primarily the result of an
increase in sales volume.
Refinery Operating Expenses. We recorded refinery operating
expenses of $3,153,646 in the Current Three Months compared to
$2,953,528 in the Prior Three Months, an increase of approximately
7%. Refinery operating expenses per bbl of throughput were $2.77 in
the Current Three Months compared to $2.66 in the Prior Three
Months. The $0.11 increase in refinery operating expenses per bbl
of throughput between the periods was a result of an increase in
off-site tank leasing expense in the Current Three Months. (See
“Part I, Financial Information, Item 1. Financial Statements
– Note (8) Related Party Transactions” for additional
disclosures related to components of refinery operating
expenses.)
JMA Profit Share. Under
the Joint Marketing Agreement with GEL, Gross Profits are shared
between the parties. If Gross Profits are positive, then the JMA
Profit Share will reflect an expense to us. If Gross Profits are
negative, then the JMA Profit Share will reflect a credit to us.
For the Current Three Months, the JMA
Profit Share was $965,627 compared to $1,435,376 for the Prior
Three Months. The significant reduction in JMA Profit
Share between the periods was a result of the significant decrease
in Gross Profits related to lower commodity prices. (See
“Part I, Financial Information, Item 1. Financial Statements
– Note (19) Commitments and Contingencies – Genesis
Agreements” for further discussion related to the Joint
Marketing Agreement, JMA Profit Share, and Gross
Profits.)
General and Administrative Expenses. We
incurred general and administrative expenses of $891,210 in the
Current Three Months compared to $312,365 in the Prior Three
Months. The significant increase in general and administrative
expenses in the Current Three Months compared to the Prior Three
Months primarily related to legal fees associated with the Genesis
litigation.
Depletion, Depreciation and Amortization. We recorded
depletion, depreciation and amortization expenses of $504,719 in
the Current Three Months compared to $414,837 in the Prior Three
Months. The approximate 22% increase in depletion, depreciation and
amortization expenses for the Current Three Months compared to the
Prior Three Months primarily related to additional depreciable
refinery assets that were placed in service.
Easement, Interest and Other Income. We recorded $157,840 in easement, interest and
other income for the Current Three Months compared to $724,349 in
the Prior Three Months. Easement, interest and other income in the
Prior Three Months included recognition of a one-time gain of
$660,000 related to settlement proceeds from a nearly two
decades-old case involving Jack J. Grynberg and several defendants
in the oil and gas industry, including Blue Dolphin Pipe Line
Company (the “Grynberg Matter”).
Income Tax Benefit (Expense). We recognized an income tax
benefit of $1,034,798 in the Current Three Months compared to an
income tax expense of $688,403 in the Prior Three Months, which
primarily related to deferred federal income taxes. The shift from
an income tax expense to an income tax benefit between the periods
was due to additional NOLs being generated in the Current Three
Months, increasing deferred tax assets. (See “Part I,
Financial Information, Item 1. Financial Statements – Note
(15) Income Taxes” for additional disclosures related to
income taxes.)
43
|
BLUE
DOLPHIN ENERGY COMPANY
|
|
FORM
10-Q 9/30/16
|
Management’s
Discussion and Analysis of Financial Condition and Results of
Operations (Continued)
Net Income (Loss). For the Current Three Months, we reported
a net loss of $1,938,551, or a loss of $0.19 per share, compared to
net income of $1,264,233, or income of $0.12 per share, for the
Prior Three Months. The $0.31 per share decrease in net income
between the periods was primarily the result of lower margins on
refined petroleum products and higher refinery operating expenses,
which was partially offset by an income tax benefit of $1,034,798
for the Current Three Months. Lower margins on refined petroleum
products primarily related to a decrease in commodity
prices.
Nine Months Ended September 30, 2016 (the “Current Nine
Months”) Compared to Nine Months Ended September 30, 2015
(the “Prior Nine Months”).
Total Revenue from Operations. For the Current Nine Months
we had total revenue from operations of $128,243,042 compared to
total revenue from operations of $175,810,850 for the Prior Nine
Months. The approximate 28% decrease in total revenue from
operations between the periods was primarily the result of: (i) a
decrease in commodity prices in the Current Nine Months compared to
the Prior Nine Months and (ii) significant under delivery of crude
oil and condensate by GEL under the Crude Supply Agreement during
the second quarter of 2016, which contributed to a decrease in
sales volume. The majority of our revenue in the Current Nine
Months came from refined petroleum product sales, which generated
revenue of $126,546,716, or more than 99% of total revenue from
operations, compared to $174,830,292, or more than 99% of total
revenue from operations, in the Prior Nine Months. We recognized
$1,624,461 in tank rental revenue in the Current Nine Months
compared to $860,676 in the Prior Nine Months. The significant
increase in tank rental revenue between the Current Nine Months and
Prior Nine Months related to the addition of a new tank rental
lease agreement.
Cost of Refined Products Sold. Cost of refined products sold
was $125,316,249 for the Current Nine Months compared to
$151,604,774 for the Prior Nine Months. The approximate 17%
decrease in cost of refined products sold was the result of
decreases in commodity prices and sales volume in the Current Nine
Months compared to the Prior Nine Months.
Refinery Operating Expenses. We recorded refinery operating
expenses of $9,468,409 in the Current Nine Months compared to
$8,420,650 in the Prior Nine Months, an increase of approximately
12%. Refinery operating expenses per bbl of throughput were $3.12
in the Current Nine Months compared to $2.73 in the Prior Nine
Months. The $0.39 increase in refinery operating expenses per bbl
of throughput between the periods was primarily the result of an
increase in off-site tank leasing expense in the Current Nine
Months. (See “Part I, Financial Information, Item 1.
Financial Statements – Note (8) Related Party
Transactions” for additional disclosures related to
components of refinery operating expenses.)
JMA Profit Share. Under
the Joint Marketing Agreement, Gross Profits are shared between the
parties. If Gross Profits are positive, then the JMA Profit Share
will reflect an expense to us. If Gross Profits are negative, then
the JMA Profit Share will reflect a credit to us. For the Current
Nine Months, the JMA Profit Share was
$392,062 compared to $4,812,674 for the Prior Nine
Months. The significant reduction in JMA Profit Share
between the periods was a result of the significant decrease in
Gross Profits driven by lower commodity prices between the
periods. (See “Part I, Financial Information, Item 1.
Financial Statements – Note (19) Commitments and
Contingencies – Genesis Agreements” for further
discussion related to the Joint Marketing Agreement, JMA Profit
Share, and Gross Profits.)
General and Administrative Expenses. We
incurred general and administrative expenses of $1,503,533 in the
Current Nine Months compared to $1,058,267 in the Prior Nine
Months. The significant increase in general and administrative
expenses in the Current Nine Months compared to the Prior Nine
Months primarily related to an increase in legal fees associated
with the Genesis litigation.
Depletion, Depreciation and Amortization. We recorded
depletion, depreciation and amortization expenses of $1,415,519 in
the Current Nine Months compared to $1,217,005 in the Prior Nine
Months. The approximate 16% increase in depletion, depreciation and
amortization expenses for the Current Nine Months compared to the
Prior Nine Months primarily related to additional depreciable
refinery assets that were placed in service.
Easement, Interest and Other Income. We recorded $415,700 in easement, interest and
other income for the Current Nine Months compared to $856,816 in
the Prior Nine Months. Easement, interest and other income in the
Prior Nine Months included recognition of a one-time gain of
$660,000 related to the Grynberg Matter.
44
|
BLUE
DOLPHIN ENERGY COMPANY
|
|
FORM
10-Q 9/30/16
|
Management’s
Discussion and Analysis of Financial Condition and Results of
Operations (Continued)
Income Tax Benefit (Expense). We recognized an income tax
benefit of $3,735,040 in the Current Nine Months compared to an
income tax expense of $2,778,750 in the Prior Nine Months, which
primarily related to deferred federal income taxes. The shift from
an income tax expense to an income tax benefit between the periods
was due to additional NOLs being generated in the Current Nine
Months, increasing deferred tax assets. (See “Part I,
Financial Information, Item 1. Financial Statements – Note
(15) Income Taxes” for additional disclosures related to
income taxes.)
Net Income (Loss). For the Current Nine Months, we reported
a net loss of $7,250,371, or a loss of $0.69 per share, compared to
net income of $5,103,476, or income of $0.49 per share, for the
Prior Nine Months. The $1.18 per share decrease in net income
between the periods was the result of lower margins on refined
petroleum products and higher refinery operating expenses, which
was partially offset by an income tax benefit of $3,735,040 for the
Current Nine Months. Lower margins on refined petroleum products
primarily related to significant under delivery of crude oil and
condensate by GEL under the Crude Supply Agreement during the
second quarter of 2016 and a decrease in commodity
prices.
Non-GAAP Financial Measures
To
supplement our consolidated results, management uses certain
non-GAAP financial measures. These non-GAAP financial measures are
reconciled to GAAP-based results below. These non-GAAP financial
measures should not be considered an alternative for GAAP results.
The adjustments are provided to enhance an overall understanding of
our financial performance for the applicable periods and are
indicators management believes are relevant and useful. These
performance measures may differ from similar calculations used by
other companies within the petroleum industry, thereby limiting
their usefulness as a comparative measure. (See “Part I,
Financial Information, Item 1. Financial Statements” for
comparative GAAP results.)
Adjusted EBITDA and EBITDA, Reconciliation to GAAP.
|
|
Three Months Ended September 30, 2016
|
Three Months Ended September 30, 2015
|
||||||
|
|
Segment
|
|
|
Segment
|
|
|
||
|
|
Refinery
|
Pipeline
|
Corporate &
|
|
Refinery
|
Pipeline
|
Corporate &
|
|
|
|
Operations
|
Transportation
|
Other
|
Total
|
Operations
|
Transportation
|
Other
|
Total
|
|
Revenue from
operations
|
$54,668,780
|
$19,526
|
$-
|
$54,688,306
|
$55,210,962
|
$45,925
|
$-
|
$55,256,887
|
|
Less: cost of operations(1)
|
(55,495,575)
|
(129,160)
|
(238,755)
|
(55,863,490)
|
(51,444,705)
|
(114,675)
|
(236,816)
|
(51,796,196)
|
|
Other non-interest income(2)
|
-
|
156,396
|
-
|
156,396
|
-
|
62,500
|
660,000
|
722,500
|
|
Adjusted
EBITDA
|
(826,795)
|
46,762
|
(238,755)
|
(1,018,788)
|
3,766,257
|
(6,250)
|
423,184
|
4,183,191
|
|
Less: JMA Profit Share(3)
|
(965,627)
|
-
|
-
|
(965,627)
|
(1,435,376)
|
-
|
-
|
(1,435,376)
|
|
EBITDA
|
$(1,792,422)
|
$46,762
|
$(238,755)
|
$(1,984,415)
|
$2,330,881
|
$(6,250)
|
$423,184
|
$2,747,815
|
|
|
|
|
|
|
|
|
|
|
|
Depletion,
depreciation and
|
|
|
|
|
|
|
|
|
|
amortization
|
|
|
|
(504,719)
|
|
|
|
(414,837)
|
|
Interest
expense, net
|
|
|
|
(484,215)
|
|
|
|
(380,342)
|
|
|
|
|
|
|
|
|
|
|
|
Income before
income taxes
|
|
|
|
(2,973,349)
|
|
|
|
1,952,636
|
|
|
|
|
|
|
|
|
|
|
|
Income tax
benefit (expense)
|
|
|
|
1,034,798
|
|
|
|
(688,403)
|
|
|
|
|
|
|
|
|
|
|
|
Net
income
|
|
|
|
$(1,938,551)
|
|
|
|
$1,264,233
|
|
(1)
|
Operation
cost within the Refinery Operations and Pipeline Transportation
segments includes related general, administrative, and accretion
expenses. Operation cost within Corporate and Other includes
general and administrative expenses associated with corporate
maintenance costs, such as accounting fees, director fees, and
legal expense.
|
|
(2)
|
Other
non-interest income reflects FLNG easement revenue. (See
“Part I, Financial Information, Item 1. Financial Statements
– Note (19) Commitments and Contingencies – FLNG Master
Easement Agreement” for further discussion related to
FLNG.)
|
|
(3)
|
The JMA Profit Share represents the GEL Profit Share plus the
Performance Fee for the period pursuant to the Joint Marketing
Agreement. (See “Part I, Financial Information, Item
1. Financial Statements – Note (19) Commitments and
Contingencies – Genesis Agreements” for further
discussion of the Joint Marketing Agreement.)
|
|
|
|
45
|
BLUE
DOLPHIN ENERGY COMPANY
|
|
FORM
10-Q 9/30/16
|
Management’s
Discussion and Analysis of Financial Condition and Results of
Operations (Continued)
|
|
Nine Months Ended September 30, 2016
|
Nine Months Ended September 30, 2015
|
||||||
|
|
Segment
|
|
|
Segment
|
|
|
||
|
|
Refinery
|
Pipeline
|
Corporate
&
|
|
Refinery
|
Pipeline
|
Corporate
&
|
|
|
|
Operations
|
Transportation
|
Other
|
Total
|
Operations
|
Transportation
|
Other
|
Total
|
|
Revenue from
operations
|
$128,171,177
|
$71,865
|
$-
|
$128,243,042
|
$175,690,968
|
$119,882
|
$-
|
$175,810,850
|
|
Less: cost of operations(1)
|
(135,452,537)
|
(383,124)
|
(695,786)
|
(136,531,447)
|
(160,208,576)
|
(296,291)
|
(928,331)
|
(161,433,198)
|
|
Other non-interest income(2)
|
-
|
412,061
|
-
|
412,061
|
-
|
187,500
|
660,000
|
847,500
|
|
Adjusted
EBITDA
|
(7,281,360)
|
100,802
|
(695,786)
|
(7,876,344)
|
15,482,392
|
11,091
|
(268,331)
|
15,225,152
|
|
Less: JMA Profit Share(3)
|
(392,062)
|
-
|
-
|
(392,062)
|
(4,812,674)
|
-
|
-
|
(4,812,674)
|
|
EBITDA
|
$(7,673,422)
|
$100,802
|
$(695,786)
|
$(8,268,406)
|
$10,669,718
|
$11,091
|
$(268,331)
|
$10,412,478
|
|
|
|
|
|
|
|
|
|
|
|
Depletion,
depreciation and
|
|
|
|
|
|
|||
|
amortization
|
|
|
|
(1,415,519)
|
|
|
|
(1,217,005)
|
|
Interest
expense, net
|
|
(1,301,486)
|
|
|
|
(1,313,247)
|
||
|
|
|
|
|
|
|
|
|
|
|
Income before
income taxes
|
(10,985,411)
|
|
|
|
7,882,226
|
|||
|
|
|
|
|
|
|
|
|
|
|
Income tax
benefit (expense)
|
3,735,040
|
|
|
|
(2,778,750)
|
|||
|
|
|
|
|
|
|
|
|
|
|
Net
income
|
|
|
|
$(7,250,371)
|
|
|
|
$5,103,476
|
|
(1)
|
Operation
cost within the Refinery Operations and Pipeline Transportation
segments includes related general, administrative, and accretion
expenses. Operation cost within Corporate and Other includes
general and administrative expenses associated with corporate
maintenance costs, such as accounting fees, director fees, and
legal expense.
|
|
(2)
|
Other
non-interest income reflects FLNG easement revenue. (See
“Part I, Financial Information, Item 1. Financial Statements
– Note (19) Commitments and Contingencies – FLNG Master
Easement Agreement” for further discussion related to
FLNG.)
|
|
(3)
|
The JMA Profit Share represents the GEL Profit Share plus the
Performance Fee for the period pursuant to the Joint Marketing
Agreement. (See “Part I, Financial Information, Item
1. Financial Statements – Note (19) Commitments and
Contingencies – Genesis Agreements” for further
discussion of the Joint Marketing Agreement.)
|
|
|
|
Adjusted EBITDA and EBITDA, Current Three Months Compared to Prior
Three Months.
For the
Current Three Months, refinery operations adjusted EBITDA, total
adjusted EBITDA, refinery operations EBITDA, and total EBITDA
decreased significantly compared to the Prior Three Months. The
significant decreases were primarily the result of lower margins
from refined petroleum products in the Current Three Months,
relating to a decrease in commodity prices. (See “Part I,
Financial Information, Item 1. Financial Statements – Note
(19) Commitments and Contingencies – Legal Matters,” as
well as “Part II. Other Information, Item 1A. Risk
Factors” for a discussion of the current contract-related
dispute with Genesis.)
Refinery Operations Adjusted EBITDA. Refinery operations
adjusted EBITDA for the Current Three Months was a loss of $826,795
compared to income of $3,766,257 for the Prior Three Months. This
represented a decrease in refinery operations adjusted EBITDA of
$4,593,052 for the Current Three Months compared to the Prior Three
Months.
Total Adjusted EBITDA. Total adjusted EBITDA for the Current
Three Months was a loss of $1,018,788 compared to income of
$4,183,191 for the Prior Three Months. This represented a decrease
in total adjusted EBITDA of $5,201,979 for the Current Three Months
compared to the Prior Three Months.
Refinery Operations EBITDA. Refinery operations EBITDA for
the Current Three Months was a loss of $1,792,422 compared to
income of $2,330,881 for the Prior Three Months. This represented a
decrease in refinery operations EBITDA of $4,123,303 for the
Current Three Months compared to the Prior Three
Months.
Total EBITDA. Total EBITDA for the Current Three Months was
a loss of $1,984,415 compared to an income of $2,747,815 for the
Prior Three Months. This represented a decrease in total EBITDA of
$4,732,230 for the Current Three Months compared to the Prior Three
Months.
46
|
BLUE
DOLPHIN ENERGY COMPANY
|
|
FORM
10-Q 9/30/16
|
Management’s
Discussion and Analysis of Financial Condition and Results of
Operations (Continued)
Adjusted EBITDA and EBITDA, Current Nine Months Compared to Prior
Nine Months.
For the
Current Nine Months, refinery operations adjusted EBITDA, total
adjusted EBITDA, refinery operations EBITDA, and total EBITDA
decreased significantly compared to the Prior Nine Months. The
significant decreases were primarily the result of lower margins
from refined petroleum products and higher refinery operating
expenses in the Current Nine Months, relating to: (i) significant
under delivery of crude oil and condensate by GEL under the Crude
Supply Agreement during the second quarter of 2016 and (ii) a
decrease in commodity prices. (See “Part I, Financial
Information, Item 1. Financial Statements – Note (19)
Commitments and Contingencies – Legal Matters,” as well
as “Part II, Other Information, Item 1A. Risk Factors”
for a discussion of the current contract-related dispute with
Genesis.)
Refinery Operations Adjusted EBITDA. Refinery operations
adjusted EBITDA for the Current Nine Months was a loss of
$7,281,360 compared to income of $15,482,392 for the Prior Nine
Months. This represented a decrease in refinery operations adjusted
EBITDA of $22,763,752 for the Current Nine Months compared to the
Prior Nine Months.
Total Adjusted EBITDA. Total adjusted EBITDA for the Current
Nine Months was a loss of $7,876,344 compared to income of
$15,225,152 for the Prior Nine Months. This represented a decrease
in total adjusted EBITDA of $23,101,496 for the Current Nine Months
compared to the Prior Nine Months.
Refinery Operations EBITDA. Refinery operations EBITDA for
the Current Nine Months was a loss of $7,673,422 compared to income
of $10,669,718 for the Prior Nine Months. This represented a
decrease in refinery operations EBITDA of $18,343,140 for the
Current Nine Months compared to the Prior Nine Months.
Total EBITDA. Total EBITDA for the Current Nine Months was a
loss of $8,268,406 compared to an income of $10,412,478 for the
Prior Nine Months. This represented a decrease in total EBITDA of
$18,680,884 for the Current Nine Months compared to the Prior Nine
Months.
Refinery Operating Income (Loss), Reconciliation to
GAAP.
|
|
Three Months Ended September 30,
|
Nine Months Ended September 30,
|
||
|
|
2016
|
2015
|
2016
|
2015
|
|
|
|
|
|
|
|
Total
refined petroleum product sales
|
$53,951,293
|
$54,924,070
|
$126,546,716
|
$174,830,292
|
|
Less:
Cost of refined petroleum products sold
|
(51,689,474)
|
(48,415,627)
|
(125,316,249)
|
(151,604,774)
|
|
Less:
Refinery operating expenses
|
(3,153,646)
|
(2,953,528)
|
(9,468,409)
|
(8,420,650)
|
|
Refinery
operating income before JMA Profit Share
|
(891,827)
|
3,554,915
|
(8,237,942)
|
14,804,868
|
|
Less:
JMA Profit Share
|
(965,627)
|
(1,435,376)
|
(392,062)
|
(4,812,674)
|
|
|
|
|
|
|
|
Refinery
operating income (loss)
|
$(1,857,454)
|
$2,119,539
|
$(8,630,004)
|
$9,992,194
|
|
|
|
|
|
|
|
Total
refined petroleum product sales (bbls)
|
1,125,433
|
1,035,275
|
2,919,909
|
2,958,865
|
Refinery Operating Income (Loss), Current Three Months Compared to
Prior Three Months and Current Nine Months Compared to Prior Nine
Months.
For the
Current Three Months, refinery operating loss totaled $1,857,454
compared to refinery operating income of $2,119,539 for the Prior
Three Months, representing a decrease of $3,976,993. Refinery
operating income for the Current Three Months declined compared to
the Prior Three Months as a result of lower margins on refined
petroleum products.
For the
Current Nine Months, refinery operating loss totaled $8,630,004
compared to refinery operating income of $9,992,194 for the Prior
Nine Months, representing a decrease of $18,622,198. Refinery
operating income (loss) for the Current Nine Months decreased
significantly compared to the prior period primarily as a result of
lower margins from refined petroleum products and higher refinery
operating expenses, which related to several factors including: (i)
significant under delivery of crude oil and condensate by GEL under
the Crude Supply Agreement during the second quarter of 2016 and
(ii) a decrease in commodity prices. (See “Part I, Financial
Information, Item 1. Financial Statements – Note (19)
Commitments and Contingencies – Legal Matters,” as well
as “Part II. Other Information, Item 1A. Risk Factors”
for a discussion of the current contract-related dispute with
Genesis.)
47
|
BLUE
DOLPHIN ENERGY COMPANY
|
|
FORM
10-Q 9/30/16
|
Management’s
Discussion and Analysis of Financial Condition and Results of
Operations (Continued)
Refinery Operations Business Segment Results
During
the Current Nine Months, GEL significantly under delivered crude
oil and condensate to the Nixon Facility under the Crude Supply
Agreement. This resulted in significant refinery downtime and a
significant decrease in refinery throughput and refinery production
in the Current Nine Months. Although GEL resumed normal delivery of
crude oil and condensate to the Nixon Facility in July 2016, the
adverse change in our relationship with Genesis has had a material
adverse effect on our operations, liquidity, and financial
condition. In addition, the contract-related dispute has disrupted
our normal business operations and diverted management’s
focus away from operations. (See “Part I. Financial
Information, Item 1. Financial Statements – Note (19)
Commitments and Contingencies – Legal Matters,” as well
as Part II. Other Information, Item 1A. Risk Factors” for a
discussion of the current contract-related dispute with
Genesis.)
Refinery Throughput and Production Data.
Following are
refinery operational metrics for the Nixon Facility:
|
|
Three Months Ended September 30,
|
Nine Months Ended September 30,
|
||
|
|
2016
|
2015
|
2016
|
2015
|
|
|
|
|
|
|
|
Calendar
Days
|
92
|
92
|
274
|
273
|
|
Refinery
downtime
|
(1)
|
(5)
|
(30)
|
(16)
|
|
Operating
Days
|
91
|
87
|
244
|
257
|
|
|
|
|
|
|
|
Total
refinery throughput (bbls)
|
1,139,458
|
1,109,411
|
3,034,256
|
3,086,749
|
|
Operating
days:
|
|
|
|
|
|
bpd
|
12,522
|
12,752
|
12,435
|
12,011
|
|
Capacity
utilization rate
|
83.5%
|
85.0%
|
82.9%
|
80.1%
|
|
Calendar
days:
|
|
|
|
|
|
bpd
|
12,385
|
12,059
|
11,074
|
11,307
|
|
Capacity
utilization rate
|
82.6%
|
80.4%
|
73.8%
|
75.4%
|
|
|
|
|
|
|
|
Total
refinery production (bbls)
|
1,106,415
|
1,084,246
|
2,948,281
|
3,024,579
|
|
Operating
days:
|
|
|
|
|
|
bpd
|
12,158
|
12,463
|
12,083
|
11,769
|
|
Capacity
utilization rate
|
81.1%
|
83.1%
|
80.6%
|
78.5%
|
|
Calendar
days:
|
|
|
|
|
|
bpd
|
12,026
|
11,785
|
10,760
|
11,079
|
|
Capacity
utilization rate
|
80.2%
|
78.6%
|
71.7%
|
73.9%
|
|
|
|
|
|
|
|
Note:
|
The
difference between total refinery throughput (volume processed as
input) and total refinery production (volume processed as output)
represents refinery fuel use and loss.
|
48
|
BLUE
DOLPHIN ENERGY COMPANY
|
|
FORM
10-Q 9/30/16
|
Management’s
Discussion and Analysis of Financial Condition and Results of
Operations (Continued)
Current Three Months Compared to Prior Three Months.
Refinery Downtime. The
Nixon Facility operated for a total of 91 days in the Current Three
Months, reflecting a single day of refinery downtime.
Comparatively, the Nixon Facility operated for a total of 87 days
in the Prior Three Months, reflecting 5 days of refinery downtime.
During the Current Three Months, the single day of refinery
downtime related to maintenance. Refinery downtime in the Prior
Three Months related to unscheduled maintenance and a maintenance
turnaround. (See “Part I, Financial Information, Item 1.
Financial Statements – Note (19) Commitments and
Contingencies – Legal Matters,” as well as “Part
II. Other Information, Item 1A. Risk Factors” for a
discussion of the current contract-related dispute with
Genesis.)
Total Refinery Throughput. On an operating day basis, the
Nixon Facility processed 12,522 bpd of crude oil and condensate for
the Current Three Months compared to 12,752 bpd of crude oil and
condensate for the Prior Three Months, which represented a slight
decrease of 230 bpd.
Total Refinery Production. On an operating day basis, the
Nixon Facility produced 12,158 bpd of refined petroleum products
for the Current Three Months compared to 12,463 bpd of refined
petroleum products for the Prior Three Months, which represented a
slight decrease of 305 bpd.
Capacity Utilization Rate. On an operating day basis, the
capacity utilization rate for: (i) refinery throughput for the
Current Three Months was 83.5% compared to 85.0% for the Prior
Three Months, reflecting a less than 2% decrease and (ii) refinery
production for the Current Three Months was 81.1% compared to 83.1%
for the Prior Three Months, reflecting an approximate 2% decrease.
Capacity utilization rate between the periods decreased as a result
of lower total refinery throughput and total refinery production on
a barrel per day basis.
Current Nine Months Compared to Prior Nine Months.
Refinery Downtime. The
Nixon Facility operated for a total of 244 days in the Current Nine
Months, reflecting 30 days of refinery downtime. Comparatively, the
Nixon Facility operated for a total of 257 days in the Prior Nine
Months, reflecting 16 days of refinery downtime. The significant
decrease in operating days between the periods was primarily the
result of significant under delivery of crude oil and condensate by
GEL under the Crude Supply Agreement during the second quarter of
2016. Refinery downtime in the Prior Nine Months related to
unscheduled maintenance and a maintenance turnaround. (See
“Part I, Financial Information, Item 1. Financial Statements
– Note (19) Commitments and Contingencies – Legal
Matters,” as well as “Part II. Other Information, Item
1A. Risk Factors” for a discussion of the current
contract-related dispute with Genesis.)
Total Refinery Throughput. On an operating day basis, the
Nixon Facility processed 12,435 bpd of crude oil and condensate for
the Current Nine Months compared to 12,011 bpd of crude oil and
condensate for the Prior Nine Months, which represented an increase
of 424 bpd.
Total Refinery Production. On an operating day basis, the
Nixon Facility produced 12,083 bpd of refined petroleum products
for the Current Nine Months compared to 11,769 bpd of refined
petroleum products for the Prior Nine Months, which represented a
slight increase of 314 bpd.
Capacity Utilization Rate. On an operating day basis, the
capacity utilization rate for: (i) refinery throughput for the
Current Nine Months was 82.9% compared to 80.1% for the Prior Nine
Months, reflecting an approximate 3% increase and (ii) refinery
production for the Current Nine Months was 80.6% compared to 78.5%
for the Prior Nine Months, reflecting an approximate 3% increase.
Capacity utilization rate between the periods increased as a result
of higher total refinery throughput and total refinery production
on a barrel per day basis.
Refined Petroleum Product Sales Summary.
(See
“Part I, Financial Information, Item 1. Financial Statements
- Note (13) Concentration of Risk” for a discussion of
refined petroleum product sales.)
49
|
BLUE
DOLPHIN ENERGY COMPANY
|
|
FORM
10-Q 9/30/16
|
Management’s
Discussion and Analysis of Financial Condition and Results of
Operations (Continued)
Refined Petroleum Product Economic Hedges.
Under
our inventory risk management policy, commodity futures contracts
are used to mitigate the volatile change in value for certain of
our refined petroleum product inventories. For the Current Three
Months, our refinery operations business segment recognized a gain
of $2,299,678 on settled transactions and a loss of $1,528,840 on
the change in value of open contracts from June 30, 2016 to
September 30, 2016. For the Prior Three Months, our refinery
operations business segment recognized a gain of $2,101,041 on
settled transactions and a gain of $104,250 on the change in value
of open contracts from June 30, 2015 to September 30, 2015.
Although commodity price increases were similar between the
periods, larger volumes were hedged in the Current Three Months
compared to the Prior Three Months.
For the
Current Nine Months, our refinery operations business segment
recognized a loss of $1,445,244 on settled transactions and a loss
of $1,143,490 on the change in value of open contracts from
December 31, 2015 to September 30, 2016. For the Prior Nine Months,
our refinery operations business segment recognized a gain of
$2,125,332 on settled transactions and a loss of $362,750 on the
change in value of open contracts from December 31, 2014 to
September 30, 2015. Although commodity price increases were similar
between the periods, larger volumes were hedged in the Current Nine
Months compared to the Prior Nine Months.
Liquidity and Capital Resources
For the
three months ended September 30, 2016, we had a net loss of
$1,938,551 compared to net income of $1,264,233 for the three
months ended September 30, 2015. For the nine months ended
September 30, 2016, we had a net loss of $7,250,371 compared to net
income of $5,103,476 for the nine months ended September 30,
2015.
As of
September 30, 2016, we had cash and cash equivalents and restricted
cash (current portion) of $1,677,485 and $4,160,999, respectively.
As of September 30, 2016, we had current assets of $22,404,232 and
current liabilities (including the current portion of long-term
debt) of $59,754,725, reflecting a working capital deficit of
$37,350,493. Excluding the current portion of long-term debt, we
had a working capital deficit of $5,229,711 as of September 30,
2016. Non-payment of Operations Payments to us by GEL under the
Joint Marketing Agreement resulting from a contract-related dispute
between the parties contributed to the working capital deficit as
of September 30, 2016. (See “Part I. Financial Information,
Item 1. Financial Statements – Note (19) Commitments and
Contingencies – Genesis Agreements and Legal Matters,”
as well as “Part II. Other Information, Item 1A. Risk
Factors” for a discussion related to Operations Payments,
Joint Marketing Agreement, and the contract-related dispute with
Genesis.)
As of
December 31, 2015, we had cash and cash equivalents and restricted
cash (current portion) of $1,853,875 and $3,175,299, respectively.
As of December 31, 2015, we had current assets of $19,629,841 and
current liabilities (including the current portion of long-term
debt) of $20,228,648, reflecting a working capital deficit of
$598,807.
As of
September 30, 2016, we were in violation of certain financial
covenants in loan agreements with Sovereign. As a result of these covenant defaults, Sovereign
could declare the amounts owed under these loan agreements
immediately due and payable, exercise its rights with respect to
collateral securing our obligations under these loan agreements,
and/or exercise any other rights and remedies
available. Sovereign waived
the financial covenant defaults as of the quarter ended September
30, 2016. However, the debt associated with these loans was
classified within the current portion of long-term debt on our
consolidated balance sheets due to the uncertainty of our ability
to meet the financial covenants in the future. There can be no
assurance that Sovereign will provide future waivers, which may
have an adverse impact on our financial position and results of
operations. (See “Part I, Financial Information, Item
1. Financial Statements – Note (9) Long-Term Debt, Net and
Note (20) Subsequent Events” for additional disclosures
related to Sovereign, our long-term debt, and financial covenant
violations.)
Execution
of our business strategy depends on several factors, including
adequate crude oil and condensate sourcing, levels of accounts
receivable, refined petroleum product inventories, accounts
payable, capital expenditures, and adequate access to credit on
satisfactory terms. These factors may be impacted by general
economic, political, financial, competitive and other factors that
are beyond our control. There can be no assurance that
our business and operational strategy will achieve anticipated
outcomes. Our operations, liquidity, and financial
condition may be materially adversely affected if: (i) our strategy
is not successful, (ii) our working capital requirements are not
funded through Operations Payments, our profit share under the
Joint Marketing Agreement, or certain advances from LEH, or (iii)
we have future covenant violations under our loan agreements that
are not waived.
(See “Capital Spending” within the “Liquidity and
Capital Resources” section for a discussion of our plans to
expand the Nixon Facility.)
50
|
BLUE
DOLPHIN ENERGY COMPANY
|
|
FORM
10-Q 9/30/16
|
Management’s
Discussion and Analysis of Financial Condition and Results of
Operations (Continued)
Cash Flow
Our
cash flow from operations for the periods indicated was as
follows:
|
|
Three Months Ended September 30,
|
Nine Months Ended September 30,
|
||
|
|
2016
|
2015
|
2016
|
2015
|
|
|
|
|
|
|
|
Cash
flow from operations
|
|
|
|
|
|
Adjusted
income (loss) from operations
|
$(879,483)
|
$2,231,898
|
$(8,335,348)
|
$9,859,360
|
|
Change
in assets and current liabilities
|
(5,493,430)
|
(1,147,370)
|
3,657,961
|
(3,900,092)
|
|
|
|
|
|
|
|
Total
cash flow from operations
|
(6,372,913)
|
1,084,528
|
(4,677,387)
|
5,959,268
|
|
|
|
|
|
|
|
Cash
inflows (outflows)
|
|
|
|
|
|
Proceeds
from issuance of debt
|
6,898,931
|
-
|
6,898,931
|
28,000,000
|
|
Payments
on debt
|
(469,541)
|
(403,561)
|
(1,414,406)
|
(9,474,720)
|
|
Change
in restricted cash for investing activities
|
3,595,042
|
478,562
|
11,257,897
|
(13,021,438)
|
|
Capital
expenditures
|
(4,182,747)
|
(2,355,811)
|
(11,255,725)
|
(8,156,298)
|
|
Change
in restricted cash for financing activities
|
25,151
|
206,127
|
(985,700)
|
(3,081,686)
|
|
|
|
|
|
|
|
Total
cash outflows
|
5,866,836
|
(2,074,683)
|
4,500,997
|
(5,734,142)
|
|
|
|
|
|
|
|
Total
change in cash flows
|
$(506,077)
|
$(990,155)
|
$(176,390)
|
$225,126
|
|
|
|
|
|
|
We
experienced negative cash flow from operations of $6,372,913 for
the Current Three Months compared to positive cash flow from
operations of $1,084,528 for the Prior Three Months, reflecting a
$7,457,441 decrease in cash flow from operations between the
periods. The decrease was primarily the result of a net loss
increase, as well as a decrease in accounts payable. This was
slightly offset by a decrease in inventory and a decrease in
accounts receivable.
We
experienced negative cash flow from operations of $4,677,387
compared to positive cash flow from operations of $5,959,268 for
the Prior Nine Months, reflecting a $10,636,655 decrease in cash
flow from operations between the periods. The decrease was
primarily the result of sustaining net losses for the Current Nine
Months compared to net income for the Prior Nine Months. The net
loss for the Current Nine Months was primarily the result of lower
margins from refined petroleum products and higher refinery
operating expenses, which primarily related to a decrease in
commodity prices. These negative impacts on cash flow were
partially mitigated by a significant increase in accounts payable,
accrued expenses, and other liabilities.
Capital Spending
We are
currently expanding the Nixon Facility and believe that capital and
efficiency improvements will enable us to remain competitive by:
(i) generating additional revenue from leasing product and crude
storage to third parties; (ii) having crude and product storage to
support refinery throughput and future expansion of up to 30,000
bbls per day; and (iii) increasing the processing capacity and
complexity of the Nixon Facility.
During
the Current Nine Months, we:
●
Completed
construction of an additional 444,000 bbls of petroleum storage
capacity at the Nixon Facility.
●
Increased HOBM
orders from new customers by barge.
●
Increased exports
of low sulfur diesel to Mexico via truck.
51
|
BLUE
DOLPHIN ENERGY COMPANY
|
|
FORM
10-Q 9/30/16
|
Management’s
Discussion and Analysis of Financial Condition and Results of
Operations (Continued)
We are
constructing an additional 256,000 bbls of petroleum storage at the
Nixon Facility. When expansion of the Nixon Facility is complete,
total crude oil, condensate, and refined petroleum product storage
capacity will exceed 1,000,000 bbls. Capital expenditures at the Nixon Facility are
being funded primarily through borrowings. Amounts held in
our disbursement account with Sovereign attributable to
construction invoices awaiting payment and to fund construction
contingencies are reflected in restricted cash (current portion).
Restricted cash (current portion) totaled $4,160,999 and $3,175,299
as of September 30, 2016 and December 31, 2015, respectively.
Amounts held in our disbursement account with Sovereign for payment
of construction related expenses to build new petroleum storage
tanks are reflected in restricted cash, noncurrent. Restricted cash, noncurrent totaled $4,358,581 and
$15,616,478 as of September 30, 2016 and December 31, 2015,
respectively. (See “Part I, Financial Information, Item 1.
Financial Statements – Note (9) Long-Term Debt, Net”
for additional disclosures related to borrowings for capital
spending.)
Capital
expenditures in the Current Three Months totaled $4,182,747
compared to $2,355,811 in the Prior Three Months, primarily
reflecting the completed construction of 122,000 bbls of petroleum
storage capacity at the Nixon Facility in the period. Capital
expenditures in the Current Nine Months totaled $11,255,725
compared to $8,156,298 in the Prior Nine Months, primarily
reflecting the completed construction of 444,000 bbls of petroleum
storage capacity at the Nixon Facility in the period.
Contractual Obligations
Related Party.
We are
a party to agreements with Ingleside Crude, LLC
(“Ingleside”), LEH, and Jonathan Carroll. Ingleside is
a related party of LEH and Jonathan Carroll. LEH, our controlling
shareholder, owns approximately 81% of our Common Stock. Jonathan
Carroll, Chairman of the Board, Chief Executive Officer, and
President of Blue Dolphin, is the majority owner of LEH. We believe
these related party transactions were consummated on terms
equivalent to those that prevail in arm’s-length
transactions.
As of September 30, 2016, accounts receivable related to LEH
totaled $2,869,805.
Unsettled
reimbursements associated with the Operating Agreement and
reflected within prepaid expenses and other current assets as of
the dates indicated were as follows:
|
|
September 30,
|
December 31,
|
|
|
2016
|
2015
|
|
|
|
|
|
LEH
|
$-
|
$624,570
|
|
|
|
|
|
|
$-
|
$624,570
|
Long-term
debt, related party associated with the LEH Loan Agreement, LEH
Note, Ingleside Note, and Carroll Note as of the dates indicated
was as follows:
|
|
September 30,
|
December 31,
|
|
|
2016
|
2015
|
|
|
|
|
|
LEH
|
$5,797,172
|
$-
|
|
Ingleside
|
679,385
|
|
|
Jonathan
Carroll
|
422,374
|
|
|
|
|
|
|
|
6,898,931
|
-
|
|
|
|
|
|
Less:
Long-term debt,
|
|
|
|
related
party,
|
|
|
|
current
portion
|
(500,000)
|
-
|
|
|
|
|
|
|
$6,398,931
|
$-
|
52
|
BLUE
DOLPHIN ENERGY COMPANY
|
|
FORM
10-Q 9/30/16
|
Management’s
Discussion and Analysis of Financial Condition and Results of
Operations (Continued)
Accrued
interest associated with the LEH Loan Agreement as of the dates
indicated was as follows:
|
|
September 30,
|
December 31,
|
|
|
2016
|
2015
|
|
|
|
|
|
LEH
|
$80,000
|
$-
|
|
|
|
|
|
|
80,000
|
-
|
|
|
|
|
|
Less:
Interest payable,
|
|
|
|
current
portion
|
(80,000)
|
-
|
|
|
|
|
|
|
$-
|
$-
|
Accounts
payable, related party associated with the Amended and Restated
Tank Lease Agreement as of the dates indicated was as
follows:
|
|
September 30,
|
December 31,
|
|
|
2016
|
2015
|
|
|
|
|
|
Ingleside
|
$-
|
$300,000
|
|
|
|
|
|
|
$-
|
$300,000
|
Refinery
operating expenses associated with the Operating Agreement and
Amended and Restated Tank Lease Agreement for the periods indicated
were as follows:
|
|
Three Months Ended September 30,
|
Nine Months Ended September 30,
|
||||||
|
|
2016
|
2015
|
2016
|
2015
|
||||
|
|
Amount
|
Per bbl
|
Amount
|
Per bbl
|
Amount
|
Per bbl
|
Amount
|
Per bbl
|
|
|
|
|
|
|
|
|
|
|
|
LEH
|
$3,028,646
|
$2.66
|
$2,953,528
|
$2.66
|
$8,618,409
|
$2.84
|
$8,420,650
|
$2.73
|
|
Ingleside
|
125,000
|
$0.11
|
-
|
$0.00
|
850,000
|
$0.28
|
-
|
$0.00
|
|
|
|
|
|
|
|
|
|
|
|
|
$3,153,646
|
$2.77
|
$2,953,528
|
$2.66
|
$9,468,409
|
$3.12
|
$8,420,650
|
$2.73
|
Remainder
of Page Intentionally Left Blank
53
|
BLUE
DOLPHIN ENERGY COMPANY
|
|
FORM
10-Q 9/30/16
|
Management’s
Discussion and Analysis of Financial Condition and Results of
Operations (Continued)
Revenue
associated with the Product Sales Agreement and Terminal Services
Agreement for the periods indicated was as follows:
|
|
Three Months Ended September 30,
|
Nine Months Ended September 30,
|
||
|
|
2016
|
2015
|
2016
|
2015
|
|
|
|
|
|
|
|
Refined
petroleum product sales
|
|
|
|
|
|
LEH
|
$14,536,997
|
$-
|
$23,449,071
|
$-
|
|
Other
customers
|
39,414,296
|
54,924,070
|
103,097,645
|
174,830,292
|
|
Total
refined petroleum product sales
|
53,951,293
|
54,924,070
|
126,546,716
|
174,830,292
|
|
Tank
rental revenue
|
|
|
|
|
|
LEH
|
426,000
|
-
|
750,000
|
-
|
|
Other
customers
|
291,487
|
286,892
|
874,461
|
860,676
|
|
Total
tank rental revenue
|
717,487
|
286,892
|
1,624,461
|
860,676
|
|
|
|
|
|
|
|
Pipeline
operations
|
|
|
|
|
|
Other
customers
|
19,526
|
45,925
|
71,865
|
119,882
|
|
|
|
|
|
|
|
Total
revenue from operations
|
$54,688,306
|
$55,256,887
|
$128,243,042
|
$175,810,850
|
Interest
expense associated with the LEH Loan Agreement and Guaranty Fee
Agreements for the periods indicated was as follows:
|
|
Three Months Ended September 30,
|
Nine Months Ended September 30,
|
||
|
|
2016
|
2015
|
2016
|
2015
|
|
|
|
|
|
|
|
Jonathan
Carroll
|
$172,300
|
$165,008
|
$522,931
|
$165,008
|
|
LEH
|
80,000
|
-
|
80,000
|
-
|
|
|
|
|
|
|
|
|
$252,300
|
$165,008
|
$602,931
|
$165,008
|
(See
“Part I, Financial Information, Item 1. Financial Statements
– Note (5) Prepaid Expenses and Other Current Assets and Note
(8) Related Party Transactions” for additional disclosures
related to Ingleside, LEH, and Jonathan Carroll.)
Genesis.
We are party to a variety of contracts and agreements with Genesis
and its affiliates that enable the purchase of crude oil and
condensate, transportation of crude oil and condensate, and other
services. Certain of these agreements with Genesis and its
affiliates have successive one-year renewals until August 2019
unless sooner terminated by Genesis or its affiliates with 180
days’ prior written notice. An adverse change in
our relationship with Genesis could have a material adverse effect
on our operations, liquidity and financial condition. We are
currently involved in a dispute with Genesis over certain
contractual matters. (See “Part I, Financial Information,
Item 1. Financial Statements – Note (19) Commitments and
Contingencies – Genesis Agreements” and “Legal
Matters,” as well as “Part II. Other Information, Item
1A. Risk Factors” for a summary of the Joint Marketing
Agreement and Crude Supply Agreement and information regarding the
current contract-related dispute with Genesis.)
Supplemental Pipeline Bonds.
As of September 30, 2016, LE and LRM were in violation of certain
financial covenants related to the First Term Loan Due 2034, Second
Term Loan Due 2034, and Term Loan Due 2017. As a result of these
covenant defaults, Sovereign could declare the amounts owed under
these loan agreements immediately due and payable, exercise its
rights with respect to collateral securing our obligations under
these loan agreements, and/or exercise any other rights and
remedies available. Sovereign waived the financial covenant
defaults as of the quarter ended September 30, 2016. However, the
debt associated with these loans was classified within the current
portion of long-term debt on our consolidated balance sheets due to
the uncertainty of our ability to meet the financial covenants in
the future. There can be no assurance that Sovereign will provide
future waivers, which may have an adverse impact on our financial
position and results of operations. (See “Part I, Financial
Information, Item 1. Financial Statements - Note (1) Organization -
Operating Risks, Note (9) Long-Term Debt, Net, and Note (20)
Subsequent Events” for additional disclosures related to
long-term debt financial covenant
violations.)
54
|
BLUE
DOLPHIN ENERGY COMPANY
|
|
FORM
10-Q 9/30/16
|
Management’s
Discussion and Analysis of Financial Condition and Results of
Operations (Continued)
Indebtedness
The principal balances outstanding on our long-term debt, net for
the periods indicated were as follow:
|
|
September 30,
|
December 31,
|
|
|
2016
|
2015
|
|
|
|
|
|
First
Term Loan Due 2034
|
$24,111,986
|
$24,643,081
|
|
Second
Term Loan Due 2034
|
9,797,549
|
10,000,000
|
|
Notre
Dame Debt
|
1,300,000
|
1,300,000
|
|
Term
Loan Due 2017
|
369,987
|
924,969
|
|
Capital
Leases
|
178,741
|
304,618
|
|
|
35,758,263
|
37,172,668
|
|
|
|
|
|
Less:
Unamoritized debt issue costs
|
(2,295,118)
|
(2,391,482)
|
|
|
|
|
|
|
$33,463,145
|
$34,781,186
|
As of
September 30, 2016, LE and LRM were in violation of certain
financial covenants related to the First Term Loan Due 2034, Second
Term Loan Due 2034, and Term Loan Due 2017. As a result of these
covenant defaults, Sovereign could declare the amounts owed under
these loan agreements immediately due and payable, exercise its
rights with respect to collateral securing our obligations under
these loan agreements, and/or exercise any other rights and
remedies available. Sovereign waived the financial covenant
defaults as of the quarter ended September 30, 2016. However, the
debt associated with these loans was classified within the current
portion of long-term debt on our consolidated balance sheets due to
the uncertainty of our ability to meet the financial covenants in
the future. There can be no assurance that Sovereign will provide
future waivers, which may have an adverse impact on our financial
position and results of operations. (See “Part I, Financial
Information, Item 1. Financial Statements – Note (1)
Organization – Operating Risks, Note (9) Long-Term Debt, Net,
and Note (20) Subsequent Events” for additional disclosures
related to long-term debt financial covenant
violations.)
See
“Contractual Obligations – Related Party” within
the Liquidity and Capital Resources section for additional
disclosures with respect to related party
indebtedness.
Remainder
of Page Intentionally Left Blank
55
|
BLUE
DOLPHIN ENERGY COMPANY
|
|
FORM
10-Q 9/30/16
|
Management’s
Discussion and Analysis of Financial Condition and Results of
Operations (Continued)
Critical Accounting Policies
Long-Lived Assets
Refinery and
Facilities. Additions to
refinery and facilities assets are capitalized. Expenditures for
repairs and maintenance are included as operating expenses under
the Operating Agreement and covered by LEH. Management expects to
continue making improvements to the Nixon Facility based on
technological advances.
We
record refinery and facilities at cost less any adjustments for
depreciation or impairment. Adjustment of the asset and the related
accumulated depreciation accounts are made for the refinery and
facilities asset’s retirement and disposal, with the
resulting gain or loss included in the consolidated statements of
operations. For financial reporting purposes, depreciation of
refinery and facilities assets is computed using the straight-line
method using an estimated useful life of 25 years beginning when
the refinery and facilities assets are placed in service. We did
not record any impairment of our refinery and facilities assets for
the three and nine months ended September 30, 2016 and
2015.
Pipelines and Facilities
Assets. We record pipelines and
facilities at cost less any adjustments for depreciation or
impairment. Depreciation is computed using the straight-line method
over estimated useful lives ranging from 10 to 22 years. In
accordance with Financial Accounting Standards Board
(“FASB”) Accounting Standards Codification
(“ASC”) guidance on accounting for the impairment or
disposal of long-lived assets, assets are grouped and evaluated for
impairment based on the ability to identify separate cash flows
generated therefrom.
Construction in
Progress. Construction in
progress expenditures, which relate to construction and
refurbishment activities at the Nixon Facility, are capitalized as
incurred. Depreciation begins once the asset is placed in
service.
Revenue Recognition
Jet
fuel, our only finished product, is sold in nearby markets to
wholesalers. Our intermediate products, including LPG, naphtha,
HOBM, and AGO, are primarily sold to wholesalers and refiners for
further blending and processing. Revenue from refined petroleum product sales is
recognized when sales prices are fixed or determinable,
collectability is reasonably assured, and title passes. Title
passage occurs when refined petroleum products are delivered in
accordance with the terms of the respective sales agreements, and
customers assume the risk of loss when title is transferred.
Transportation, shipping and handling costs incurred are included
in cost of refined products sold. Excise and other taxes that are
collected from customers and remitted to governmental authorities
are not included in revenue.
Tank
rental fees are invoiced monthly in accordance with the terms of
the related lease agreement and recognized in revenue as earned.
Land easement revenue is recognized monthly as earned and included
in other income.
Revenue
from our pipeline operations is derived from fee-based contracts
and is typically based on transportation fees per unit of volume
transported multiplied by the volume delivered. Revenue is
recognized when volumes have been physically delivered for the
customer through the pipeline.
Asset Retirement Obligations
FASB
ASC guidance related to AROs requires that a liability for the
discounted fair value of an ARO be recorded in the period in which
it is incurred and the corresponding cost capitalized by increasing
the carrying amount of the related long-lived asset. The liability
is accreted towards its future value each period, and the
capitalized cost is depreciated over the useful life of the related
asset. If the liability is settled for an amount other than the
recorded amount, a gain or loss is recognized.
Management
has concluded that there is no legal or contractual obligation to
dismantle or remove the refinery and facilities assets. Further,
management believes that these assets have indeterminate lives
under FASB ASC guidance for estimating AROs because dates or ranges
of dates upon which we would retire these assets cannot reasonably
be estimated at this time. When a legal or contractual obligation
to dismantle or remove the refinery and facility assets arises and
a date or range of dates can reasonably be estimated for the
retirement of these assets, we will estimate the cost of performing
the retirement activities and record a liability for the fair value
of that cost using present value techniques.
56
|
BLUE
DOLPHIN ENERGY COMPANY
|
|
FORM
10-Q 9/30/16
|
Management’s
Discussion and Analysis of Financial Condition and Results of
Operations (Continued)
We
recorded an ARO liability related to future asset retirement costs
associated with dismantling, relocating or disposing of our
offshore platform, pipeline systems and related onshore facilities,
as well as plugging and abandoning wells and restoring land and sea
beds. We developed these cost estimates for each of our assets
based upon regulatory requirements, structural makeup, water depth,
reservoir characteristics, reservoir depth, equipment demand,
current retirement procedures, and construction and engineering
consultations. Because these costs typically extend many years into
the future, estimating future costs are difficult and require
management to make judgments that are subject to future revisions
based upon numerous factors, including changing technology,
political, and regulatory environments. We review our assumptions
and estimates of future abandonment costs on an annual
basis.
Income Taxes
We
account for income taxes under FASB ASC guidance related to income
taxes, which requires recognition of income taxes based on amounts
payable with respect to the current reporting period and the
effects of deferred taxes for the expected future tax consequences
of events that have been included in our financial statements or
tax returns. Under this method, deferred tax assets and liabilities
are determined based on the differences between the financial
accounting and tax basis of assets and liabilities, as well as for
operating losses and tax credit carryforwards using enacted tax
rates in effect for the year in which the differences are expected
to reverse.
As of
each reporting date, management considers new evidence, both
positive and negative, to determine the realizability of deferred
tax assets. Management considers whether it is more likely than not
that some portion or all of the deferred tax assets will be
realized, which is dependent upon the generation of future taxable
income prior to the expiration of any NOL carryforwards. When
management determines that it is more likely than not that a tax
benefit will not be realized, a valuation allowance is recorded to
reduce deferred tax assets.
In
assessing the realizability of deferred tax assets, management
considers whether it is more likely than not that some portion or
all of the deferred tax assets will be realized. The ultimate
realization of deferred tax assets is dependent upon the generation
of future taxable income prior to the expiration of any NOL
carryforwards.
The
guidance also prescribes a recognition threshold and measurement
attribute for the financial statement recognition and measurement
of a tax position taken or expected to be taken in a tax return, as
well as guidance on derecognition, classification, interest and
penalties, accounting in interim periods, disclosures, and
transition.
(See
“Part I, Financial Information, Item 1. Financial Statements
- Note (15) Income Taxes” for further information related to
income taxes.)
Recently Adopted Accounting Guidance
The
Financial Accounting Standards Board (“FASB”) issues an
Accounting Standards Update (“ASU”) to communicate
changes to the FASB Accounting Standards Codification, including
changes to non-authoritative SEC content. For the three and nine
months ended September 30, 2016, we adopted the following recently
issued ASU’s:
ASU 2015-17, Income Taxes
(Topic 740). In November 2015, FASB issued ASU 2015-17. This
guidance simplifies the presentation of deferred income taxes by
requiring that deferred tax liabilities and assets be classified as
noncurrent instead of separated into current and noncurrent. We
adopted this accounting pronouncement effective April 1, 2016.
Accordingly, our consolidated balance sheet as of December 31, 2015
has been changed to reclassify approximately $3.5 million
previously reported as deferred tax assets, current portion, net to
deferred tax assets, net. The adoption of ASU 2015-17 had no impact
on our results of operations or cash flows.
ASU 2015-03, Imputation of Interest (Topic 835): Simplifying the
Presentation of Debt Issuance Costs. In April 2015, FASB
issued ASU 2015-03. This guidance requires debt issue costs to be
presented as an offset to their related debt. We adopted this
accounting pronouncement effective January 1, 2016. Accordingly, our consolidated balance sheet as of
December 31, 2015 has been changed to reclassify approximately $2.4
million previously reported as debt issue costs as a direct
deduction of long-term debt. The adoption of ASU 2015-03 had no
impact on our results of operations or cash
flows.
57
|
BLUE
DOLPHIN ENERGY COMPANY
|
|
FORM
10-Q 9/30/16
|
ITEM 3. QUANTITATIVE AND QUALITATIVE DISCLOSURES ABOUT MARKET
RISK
Not
applicable.
Evaluation of Disclosure Controls and Procedures
Under
the supervision of, and with the participation of our management,
including our Chief Executive Officer (principal executive officer)
and Chief Financial Officer (principal financial officer), we
conducted an evaluation of the effectiveness of our disclosure
controls and procedures, as defined in Rules 13a-15(e) and
15d-15(e) under the Securities Exchange Act of 1934, as amended
(the “Exchange Act”), as of the end of the period
covered by this Quarterly Report. Based on our evaluation, our
Chief Executive Officer (principal executive officer) and Chief
Financial Officer (principal financial officer) concluded that our
disclosure controls and procedures were effective as of the end of
the period covered by this report to ensure that information
required to be disclosed by us in reports that we file or submit
under the Exchange Act, are recorded, processed, summarized and
reported within the time periods specified in the SEC’s rules
and forms.
Changes in Internal Control over Financial Reporting
During
2015, we took a number of steps to fully remediate previously
identified material weakness related to a lack of formally
documented accounting policies and procedures. As a result,
management concluded that our internal control over financial
reporting was effective as of December 31, 2015. There has been no
change in our internal control over financial reporting (as defined
in Rule 13a-15(f) and 15d-15(f) under the Exchange Act) that
occurred during the three and nine months ended September 30, 2016
that has materially affected, or is reasonably likely to materially
affect, our internal control over financial reporting. (See
“Part II, Item 9. Changes In and Disagreements with
Accountants on Accounting and Financial Disclosure” and
“Part II, Item 9A. Controls and Procedures” of our
Annual Report for a discussion related to controls and
procedures.)
Remainder
of Page Intentionally Left Blank
58
|
BLUE
DOLPHIN ENERGY COMPANY
|
|
FORM
10-Q 9/30/16
|
ITEM 1. LEGAL PROCEEDINGS
Genesis Contract-Related Dispute
We are
party to a variety of contracts and agreements with Genesis Energy,
LLC “(Genesis”) and its affiliates, including GEL Tex
Marketing, LLC (“GEL”) that enable the purchase of
crude oil and condensate, transportation of crude oil and
condensate, and other services.
In May
2016, GEL filed, in state district court in Harris County, Texas, a
petition and application for a temporary restraining order,
temporary injunction, and permanent injunction (the
“Petition”) against Lazarus Energy, LLC ("LE") and
Lazarus Energy Holdings, LLC ("LEH"). The Petition alleges that LE
breached the Joint Marketing Agreement, and that LEH tortiously
interfered with the Joint Marketing Agreement, in connection with
an agreement by LEH to supply jet fuel acquired from LE to a
customer. The Petition primarily sought temporary and permanent
injunctions related to sales of product from the Nixon Facility to
this customer. In June 2016, the court issued a temporary
injunction against LE and LEH as requested by GEL. LE believes that
GEL’s claims in the Petition are without merit and intends to
defend the matter vigorously.
In a
matter separate from the above referenced Petition, LE filed a
demand for arbitration in June 2016, pursuant to the terms of the
Dispute Resolution Agreement between the parties (the
“Arbitration”). The Arbitration alleges that GEL
breached the Crude Supply Agreement related to:
(i)
failure to provide
crude oil and condensate at cost as defined in the Crude Supply
Agreement, and
(ii)
significant under
delivery of crude oil and condensate, resulting in significant
refinery downtime and a significant decrease in refinery
throughput, refinery production, and refined petroleum product
sales for the three and nine months ended September 30,
2016.
With
regard to the Petition, a trial date has been set for December 5,
2016, although the parties may elect arbitration prior to that
date. With respect to the Arbitration, an initial hearing was held
on November 9, 2016 at which the parties presented evidence
supporting their position. The next hearing date related to
Arbitration is November 16, 2016.
We do
not expect the temporary injunction issued by the court related to
the Litigation to have a material effect on our results of
operations or financial condition. However, although GEL resumed
normal delivery of crude oil and condensate to the Nixon Facility
in July 2016, the adverse change in our relationship with Genesis
has had a material adverse effect on our operations, liquidity, and
financial condition. In addition, the contract-related dispute has
disrupted our normal business operations and diverted
management’s focus away from operations. We are unable to
predict the outcome of the current proceedings with Genesis and GEL
or their ultimate impact, if any, on our business, financial
condition or results of operations. Accordingly, we have not
recorded an asset or a liability on our consolidated balance sheet
as of September 30, 2016.
Other Legal Matters
From
time to time we are involved in routine lawsuits, claims, and
proceedings incidental to the conduct of our business, including
mechanic’s liens and administrative proceedings. Management
does not believe that such matters will have a material adverse
effect on our financial position, earnings, or cash
flows.
In
addition to the other information set forth in this Form 10-Q for
the quarterly period ended September 30, 2016 (this
“Quarterly Report”), careful consideration should be
given to the risk factors discussed under “Part I, Item 1A.
Risk Factors” and elsewhere in our Form 10-K for the fiscal
year ended December 31, 2015 (the “Annual Report”) and
our Form 10-Q’s for the quarterly periods ended March 31,
2016 and June 30, 2016. These risks and uncertainties could
materially and adversely affect our business, financial condition
and results of operations. Our operations could also be affected by
additional factors that are not presently known to us or by factors
that we currently consider immaterial to our business. With the
exception of the risk factor noted below, there have been no
material changes in our assessment of our risk factors from those
set forth in our Annual Report and our Form 10-Q for the quarterly
period ended June 30, 2016.
59
|
BLUE
DOLPHIN ENERGY COMPANY
|
|
FORM
10-Q 9/30/16
|
An unfavorable outcome of litigation and contract-related disputes
could have a material adverse effect on us.
We are
a party to a contract related dispute with Genesis and GEL.
Litigation and contract related disputes through arbitration can be
expensive, lengthy, disruptive to normal business operations, and
divert management’s focus away from operations. Moreover, the
outcomes of complex legal proceedings or contract-related disputes
can be difficult to predict. An unfavorable resolution of a legal
proceeding or contract-related dispute could have a material
adverse effect on our business, results of operations, financial
condition, and reputation.
We
record provisions for pending litigation when we determine that an
unfavorable outcome is likely and the loss can reasonably be
estimated. Due to the inherent uncertain nature of litigation, the
ultimate outcome or actual cost of settlement may materially differ
from estimates. We are unable to predict the outcome of the current
proceedings with Genesis and GEL or their ultimate impact, if any,
on our business, financial condition or results of operations.
Accordingly, we have not recorded an asset or a liability on our
consolidated balance sheet as of September 30, 2016.
We are in violation of certain financial covenants in secured loan
agreements with Sovereign Bank (“Sovereign”), and our
failure to comply could materially and adversely affect our
operating results and our financial condition.
As of
September 30, 2016, we were in violation of certain financial
covenants in secured loan agreements with Sovereign. As a result of
these covenant defaults, Sovereign could declare the amounts owed
under these loan agreements immediately due and payable, exercise
its rights with respect to collateral securing our obligations
under these loan agreements, and/or exercise any other rights and
remedies available. Sovereign waived the financial covenant
defaults as of the quarter ended September 30, 2016. However,
$30,423,203 of debt associated with these loans was classified
within the current portion of long-term debt on our consolidated
balance sheets as of September 30, 2016, due to the uncertainty of
our ability to meet the financial covenants in the
future.
There
can be no assurance that: (i) our assets or cash flow would be
sufficient to fully repay borrowings under our outstanding
long-term debt, either upon maturity or if accelerated, (ii) we
would be able to refinance or restructure the payments on the
long-term debt, and/or (ii) Sovereign will provide future waivers.
If we fail to comply with financial covenants associated with
certain of our long-term debt and such failure is not cured or
waived, then Sovereign may exercise any rights and remedies
available under the loan agreement(s). Any such action by Sovereign
would have a material adverse effect on our financial condition and
ability to continue as a going concern. (See “Part I.,
Financial Information, Item 1. Financial Statements ñ Note
(9), Long-Term Debt, Net and Note (20) Subsequent Events” for
additional disclosures related to our long-term debt and financial
covenant violations.)
None.
See
“Part I, Financial Information, Item. 1. Financial Statements
– Note (9) Long-Term Debt, Net” for disclosures related
to defaults on our debt.
Not
applicable.
Item
1.01 Entry into a Material Definitive Agreement.
LEH Note
On
September 30, 2016, we entered into a promissory note with LEH in
the original principal amount of $1,797,172 (the “LEH
Note”). The LEH Note accrues interest, compounded annually,
at a rate of 8.00%. The principal amount and any accrued but unpaid
interest are due and payable in January 2018. Under the LEH Note,
prepayment, in whole or in part, is permissible at any time and
from time to time, without premium or penalty.
Ingleside Note
On
September 30, 2016, we entered into a promissory note with
Ingleside Crude, LLC in the original principal amount of $679,385
(the “Ingleside Note”). The Ingleside Note accrues
interest, compounded annually, at a rate of 8.00%. The principal
amount and any accrued but unpaid interest are due and payable in
January 2018. Under the Ingleside Note, prepayment, in whole or in
part, is permissible at any time and from time to time, without
premium or penalty.
Carroll Note
On September 30, 2016, we entered into a promissory note with
Jonathan Carroll in the original principal amount of $422,374 (the
“Carroll Note”). The Carroll Note accrues interest,
compounded annually, at a rate of 8.00%. The principal amount and
any accrued but unpaid interest are due and payable in January
2018. Under the Carroll Note, prepayment, in whole or in part, is
permissible at any time and from time to time, without premium or
penalty.
The foregoing summarizes the material terms of the LEH Note,
Ingleside Note, and Carroll Note. This summary does not purport to
be complete and is qualified in its entirety by reference to the
full text of the respective notes, which are filed as exhibits to
this Quarterly Report.
LEH,
our controlling shareholder, owns approximately 81% of our common
stock, par value $0.01 per share. Jonathan Carroll, Chairman of the
Board of Directors, Chief Executive Officer, and President of Blue
Dolphin, is the majority owner of LEH. Ingleside is a related party
of LEH and Jonathan Carroll.
Item
2.03. Creation of a Direct Financial Obligation or an
Obligation under an Off-Balance SheetArrangement of a
Registrant.
The
information set forth in Item 1.01 above is incorporated by
reference in this Item 2.03 in its entirety.
ITEM 6. EXHIBITS
Exhibits Index
|
No.
|
Description
|
|
10.1*
|
Loan
and Security Agreement by and between Lazarus Energy Holdings, LLC
and Blue Dolphin Pipe Line Company dated August 15, 2016 (filed as
Exhibit 10.1 to Blue Dolphin’s Form 8-K as filed with the SEC
on August 15, 2016).
|
|
10.2*
|
Promissory
Note by and between Lazarus Energy Holdings, LLC and Blue Dolphin
Pipe Line Company dated August 15, 2016 (filed as Exhibit 10.2 to
Blue Dolphin’s Form 8-K as filed with the SEC on August 15,
2016).
|
|
10.3*
|
Deed of
Trust, Mortgage, Security Agreement, Assignment of Leases and
Rents, Financing Statement and Fixture Filing for Blue Dolphin Pipe
Line Company dated August 15, 2016 (filed as Exhibit 10.3 to Blue
Dolphin’s Form 8-K as filed with the SEC on August 15,
2016).
|
|
10.4*
|
Collateral
Assignment of Master Easement Agreement by Blue Dolphin Pipe Line
Company for the benefit of Lazarus Energy Holdings, LLC dated
August 15, 2016 (filed as Exhibit 10.4 to Blue Dolphin’s Form
8-K as filed with the SEC on August 15, 2016).
|
|
10.5
|
Letter
dated November 10, 2016 from Sovereign Bank to Lazarus Energy, LLC
and Lazarus Refining & Marketing, LLC.
|
|
10.6
|
Promissory
Note between Blue Dolphin Energy Company and Lazarus Energy
Holdings, LLC in the principal amount of $1,797,172 dated September
30, 2016.
|
|
10.7
|
Promissory
Note between Blue Dolphin Energy Company and Ingleside Crude, LLC
in the principal amount of $679,385 dated September 30,
2016.
|
|
10.8
|
Promissory
Note between Blue Dolphin Energy Company and Lazarus Capital, LLC
in the principal amount of $422,374 dated September 30,
2016.
|
|
31.1
|
Jonathan
P. Carroll Certification Pursuant to 18 U.S.C. Section 1350, as
adopted pursuant to section 302 of the Sarbanes-Oxley Act of
2002.
|
|
31.2
|
Tommy
L. Byrd Certification Pursuant to 18 U.S.C. Section 1350, as
adopted pursuant to section 302 of the Sarbanes-Oxley Act of
2002.
|
|
32.1
|
Jonathan
P. Carroll Certification Pursuant to 18 U.S.C. Section 1350, as
adopted pursuant to section 906 of the Sarbanes-Oxley Act of
2002.
|
|
32.2
|
Tommy
L. Byrd Certification Pursuant to 18 U.S.C. Section 1350, as
adopted pursuant to section 906 of the Sarbanes-Oxley Act of
2002.
|
|
101.INS
|
XBRL
Instance Document.
|
|
101.SCH
|
XBRL
Taxonomy Schema Document.
|
|
101.CAL
|
XBRL
Calculation Linkbase Document.
|
|
101.LAB
|
XBRL
Label Linkbase Document.
|
|
101.PRE
|
XBRL
Presentation Linkbase Document.
|
|
101.DEF
|
XBRL
Definition Linkbase Document.
|
*
Exhibit
incorporated by reference as indicated; all other exhibits are
filed herewith.
61
|
BLUE
DOLPHIN ENERGY COMPANY
|
|
FORM
10-Q 9/30/16
|
Pursuant to the
requirements of the Securities Exchange Act of 1934, the registrant
has duly caused this report to be signed on its behalf by the
undersigned, thereunto duly authorized.
|
|
BLUE
DOLPHIN ENERGY COMPANY
(Registrant)
|
|
|
|
|
|
|
|
|
|
|
|
|
|
|
|
|
|
|
|
|
|
|
|
Date: November 14,
2016
|
By:
|
/s/ JONATHAN P.
CARROLL
|
|
|
|
|
Jonathan P.
Carroll
|
|
|
|
|
Chairman of the
Board,
Chief Executive
Officer, President,
Assistant Treasurer
and Secretary
(Principal
Executive Officer)
|
|
|
|
|
|
|
|
|
|
|
|
|
|
|
|
|
|
|
|
|
|
|
Date: November 14,
2016
|
By:
|
/s/ TOMMY L.
BYRD
|
|
|
|
|
Tommy L.
Byrd
|
|
|
|
|
Chief Financial
Officer,
Treasurer and
Assistant Secretary
(Principal
Financial Officer)
|
|
62