Attached files
| file | filename |
|---|---|
| EX-99.1 - EX-99.1 - TRIBUNE MEDIA CO | d247171dex991.htm |
| 8-K - 8-K - TRIBUNE MEDIA CO | d247171d8k.htm |

|
Exhibit 99.2
Q3 2016 Performance Summary
NOVEMBER 2016
|
Cautionary Statement Regarding Forward Looking Statements
This presentation contains “forward-looking statements” within the meaning of the federal securities laws. Forward-looking statements are subject to known and unknown
risks and uncertainties, many of which may be beyond our control. Forward-looking statements may include, but are not limited to, statements concerning our financial outlook and guidance, including our 2016 forecasted revenues, Adjusted EBITDA and
other consolidated and segment financial performance guidance, our real estate monetization strategy, our cost savings initiatives, exploration of strategic and financial alternatives and other corporate initiatives, the conditions in our industry,
our operations, our economic performance and financial condition, including, in particular, statements relating to our business and growth strategy and product development efforts. Important factors that could cause actual results, developments and
business decisions to differ materially from these forward-looking statements are uncertainties discussed below and in the “Risk Factors” section of the Company’s Annual Report on Form 10-K filed with the U.S. Securities and Exchange
Commission (the “SEC”) on February 29, 2016. “Forward-looking statements” include all statements that do not relate solely to historical or current facts, and can be identified by the use of words such as “may,”
“might,” “will,” “could” “should,” “estimate,” “project,” “plan,” “anticipate,” “expect,” “intend,” “outlook,” “seek,”
“designed,” “assume,” “implied,” “believe” and other similar expressions. You are cautioned not to place undue reliance on these forward-looking statements, which speak only as of their dates. These
forward-looking statements are based on estimates and assumptions by our management that, although we believe to be reasonable, are inherently uncertain and subject to a number of risks and uncertainties.
The following list represents some, but not necessarily all, of the factors that could cause actual results to differ from projected or historical results or those anticipated or
predicted by these forward-looking statements: changes in advertising demand and audience shares; competition and other economic conditions including incremental fragmentation of the media landscape and competition from other media alternatives;
changes in the overall market for broadcast and cable television advertising, including through regulatory and judicial rulings; our ability to protect our intellectual property and other proprietary rights; availability and cost of quality network,
syndicated and sports programming affecting our television ratings; the loss, cost and / or modification of our network affiliation agreements; our ability to renegotiate retransmission consent agreements with multichannel video programming
distributors; our ability to expand our Digital and Data business operations internationally; our ability to realize the full value, or successfully complete the planned divestitures of our real estate assets; the incurrence of additional
tax-related liabilities related to historical income tax returns; our ability to expand our operations internationally; the timing and administration by the FCC of a potential auction of spectrum and our ability to monetize our spectrum through
sales channel sharing arrangements or relocations; the incurrence of costs to address contamination issues at sites owned, operated or used by our businesses; adverse results from litigation, governmental investigations or tax-related proceedings or
audits; our ability to settle unresolved claims filed in connection with our and certain of our direct and indirect wholly-owned subsidiaries’ Chapter 11 cases and resolve the appeals seeking to overturn the bankruptcy court order confirming
the First Amended Joint Plan of Reorganization for Tribune Company and its Subsidiaries; our ability to satisfy pension and other postretirement employee benefit obligations; our ability to attract and retain employees; the effect of labor strikes,
lock-outs and labor negotiations; our ability to realize benefits or synergies from acquisitions or divestitures or to operate our businesses effectively following acquisitions or divestitures; our ability to successfully execute our business
strategy, including our exploration of strategic and financial alternatives to enhance shareholder value; the financial performance of our equity method investments; the impairment of our existing goodwill and other intangible assets; compliance
with government regulations applicable to the television and radio broadcasting industry; changes in accounting standards; the payment of cash dividends on our common stock; impact of increases in interest rates on our variable rate indebtedness or
refinancings thereof; impact of foreign currency exchange rate changes; our indebtedness and ability to comply with covenants applicable to our debt financing and other contractual commitments; our ability to satisfy future capital and liquidity
requirements; our ability to access the credit and capital markets at the times and in the amounts needed and on acceptable terms and other events beyond our control that may result in unexpected adverse operating results. In addition, in light of
these risks and uncertainties, the matters referred to in the forward-looking statements contained in this press release may not in fact occur. Any forward-looking information presented herein is made only as of the date of this press release and we
undertake no obligation to update or revise any forward-looking statement as a result of new information, future events or otherwise, except as otherwise required by law.
|
Non-GAAP Financial Measures
This presentation
includes a discussion of Adjusted EBITDA, Adjusted EBITDA Margin and Adjusted EPS for the Company and Adjusted EBITDA and Adjusted EBITDA Margin for our operating segments (Television and Entertainment, Digital and Data, and Corporate and Other) and
presents Broadcast Cash Flow for our Television and Entertainment segment. Adjusted EPS, Adjusted EBITDA, Adjusted EBITDA Margin and Broadcast Cash Flow are financial measures that are not recognized under accounting principles generally accepted in
the U.S. (“GAAP”). With respect to our expectations under “Financial Guidance” above, no reconciliation of the forecasted range for Adjusted EBITDA on a consolidated or segment basis for fiscal 2016 is included in this release
because we are unable to quantify certain amounts that would be required to be included in the GAAP measure without unreasonable efforts and we believe such reconciliations would imply a degree of precision that would be confusing or misleading to
investors. In particular, reconciliation of guidance for Consolidated Adjusted EBITDA or Adjusted EBITDA on a segment basis to the closest corresponding GAAP measure is not available without unreasonable efforts on a forward-looking basis due to the
high variability, complexity and low visibility with respect to the charges excluded from these non-GAAP measures such as the measures and effects of stock-based compensation expense specific to equity compensation awards that are directly impacted
by unpredictable fluctuations in our stock price and other non-recurring or unusual items such as impairment charges, transaction-related costs and gains or losses on sales of assets. We expect the variability of the above items to have a
significant, and potentially unpredictable, impact on our future GAAP financial results. Adjusted EPS is calculated based on net income (loss) before investment transactions, loss on extinguishment of debt, certain special items (including
severance), certain income tax charges, non-operating items, gain (loss) on sales of real estate, impairments and other non-cash charges and reorganization items per common share. Adjusted EBITDA for the Company is defined as net income (loss)
before income taxes, investment transactions, loss on extinguishment of debt, interest and dividend income, interest expense, pension expense (credit), equity income and losses, depreciation and amortization, stock-based compensation, certain
special items (including severance), non-operating items, gain (loss) on sales of real estate, goodwill and other intangible asset and program impairments and other non-cash charges and reorganization items. Adjusted EBITDA for the Company’s
operating segments is calculated as segment operating profit plus depreciation, amortization, pension expense (credit), stock-based compensation, goodwill and other intangible asset and program impairments and other non-cash charges, gain (loss) on
sales of real estate and certain special items (including severance). Broadcast Cash Flow for the Television and Entertainment segment is calculated as Television and Entertainment Adjusted EBITDA plus broadcast rights amortization expense less
broadcast rights cash payments. Adjusted EBITDA Margin for the Company and its operating segments is calculated as Adjusted EBITDA divided by revenue, on a consolidated or segment basis, as the case may be. We believe that Adjusted EBITDA, Adjusted
EBITDA Margin and Broadcast Cash Flow are measures commonly used by investors to evaluate our performance with that of our competitors. We also present Adjusted EBITDA because we believe investors, analysts and rating agencies consider it useful in
measuring our ability to meet our debt service obligations. We further believe that the disclosure of Adjusted EPS, Adjusted EBITDA, Adjusted EBITDA Margin and Broadcast Cash Flow is useful to investors as these non-GAAP measures are used, among
other measures, by our management to evaluate our performance. By disclosing Adjusted EPS, Adjusted EBITDA and Broadcast Cash Flow, we believe that we create for investors a greater understanding of, and an enhanced level of transparency into, the
means by which our management operates our company. Adjusted EPS, Adjusted EBITDA, Adjusted EBITDA Margin and Broadcast Cash Flow are not measures presented in accordance with GAAP, and our use of these terms may vary from that of others in our
industry. Adjusted EPS, Adjusted EBITDA, Adjusted EBITDA Margin and Broadcast Cash Flow should not be considered as an alternative to net income, operating profit, revenues, cash provided by operating activities or any other measures derived in
accordance with GAAP as measures of operating performance or liquidity. The tables at the end of this press release include reconciliations of consolidated Adjusted EPS and Adjusted EBITDA and segment Adjusted EBITDA and Broadcast Cash Flow to the
most directly comparable financial measures calculated and presented in accordance with GAAP.
|
Tribune Media
A diverse combination of media assets
that meaningfully touch millions of people every day, including compelling content in news and entertainment, significant broadcast distribution, an emerging cable network, and a cutting-edge digital and data business.
| • |
|
Broadcast: 42 owned or operated broadcast television stations in major markets across the country. |
| • |
|
WGN America: A national, general entertainment cable network airing high quality original content whose reach is approaching 80 million homes. |
| • |
|
Digital and Data: Growing global metadata business, powering some of the biggest media brands in the world. |
| • |
|
Real Estate and Investments: 66 real estate properties and equity investments in a variety of media, online and other properties. |
|
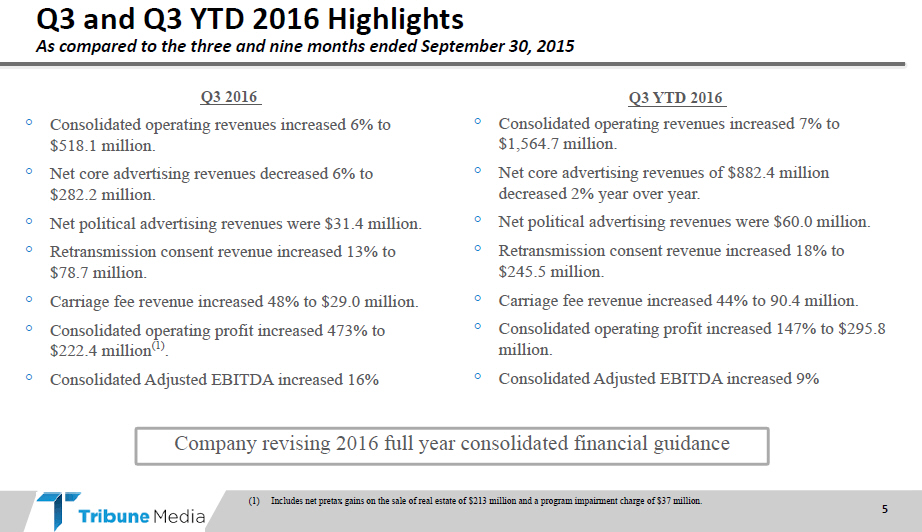
Q3 and Q3 YTD 2016 Highlights
As compared to the
three and nine months ended September 30, 2015
| Q3 2016 | Q3 YTD 2016 | |
| • Consolidated operating revenues increased 6% to | • Consolidated operating revenues increased 7% to | |
| $518.1 million. | $1,564.7 million. | |
| • Net core advertising revenues decreased 6% to | • Net core advertising revenues of $882.4 million | |
| $282.2 million. | decreased 2% year over year. | |
| • Net political advertising revenues were $31.4 million. | • Net political advertising revenues were $60.0 million. | |
| • Retransmission consent revenue increased 13% to | • Retransmission consent revenue increased 18% to | |
| $78.7 million. | $245.5 million. | |
| • Carriage fee revenue increased 48% to $29.0 million. | • Carriage fee revenue increased 44% to 90.4 million. | |
| • Consolidated operating profit increased 473% to | • Consolidated operating profit increased 147% to $295.8 | |
| $222.4 million(1) . | million. | |
| • Consolidated Adjusted EBITDA increased 16% | • Consolidated Adjusted EBITDA increased 9% |
Company revising 2016 full year consolidated financial guidance
(1) Includes net pretax gains on the sale of real estate of $213 million and a program impairment charge of $37 million.
|
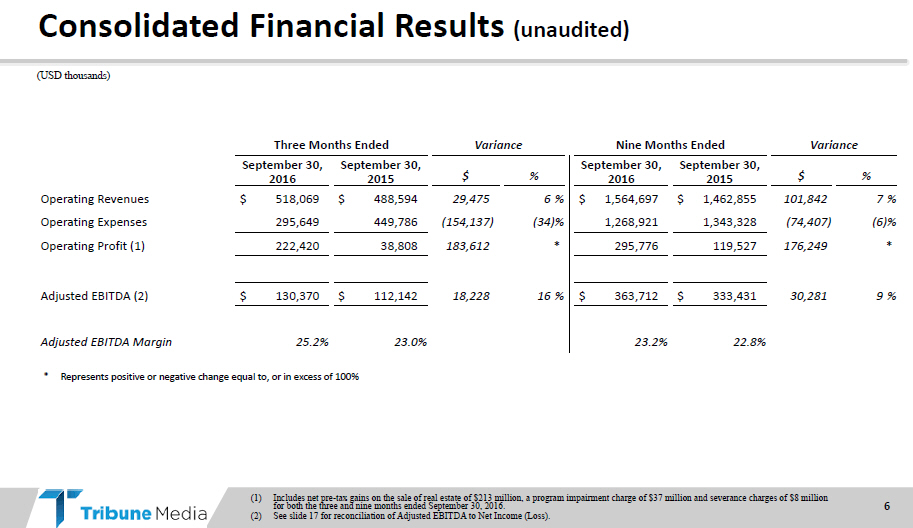
Consolidated Financial Results (unaudited)
(USD
thousands)
| Three Months Ended | Variance | Nine Months Ended | Variance | |||||||||||||
| September 30, |
September 30, |
September 30, |
September 30, |
|||||||||||||
| 2016 | 2015 | $% | 2016 | 2015 | $% | |||||||||||
| Operating Revenues | $518,069 | $488,594 | 29,475 | 6% | $1,564,697 | $1,462,855 | 101,842 | 7% | ||||||||
| Operating Expenses | 295,649 | 449,786 | (154,137) | (34)% | 1,268,921 | 1,343,328 | (74,407) | (6)% | ||||||||
| Operating Profit (1) | 222,420 | 38,808 | 183,612 | * | 295,776 | 119,527 | 176,249 | * | ||||||||
| Adjusted EBITDA (2) | $130,370 | $112,142 | 18,228 | 16% | $363,712 | $333,431 | 30,281 | 9% | ||||||||
| Adjusted EBITDA Margin | 25.2% | 23.0% | 23.2% | 22.8% | ||||||||||||
| * | Represents positive or negative change equal to, or in excess of 100% |
(1) Includes net pre-tax gains on the sale of real estate of $213 million, a program impairment charge of $37 million and severance charges of $8 million for both the three and nine months ended September 30, 2016.
| (2) | See slide 17 for reconciliation of Adjusted EBITDA to Net Income (Loss). |
|
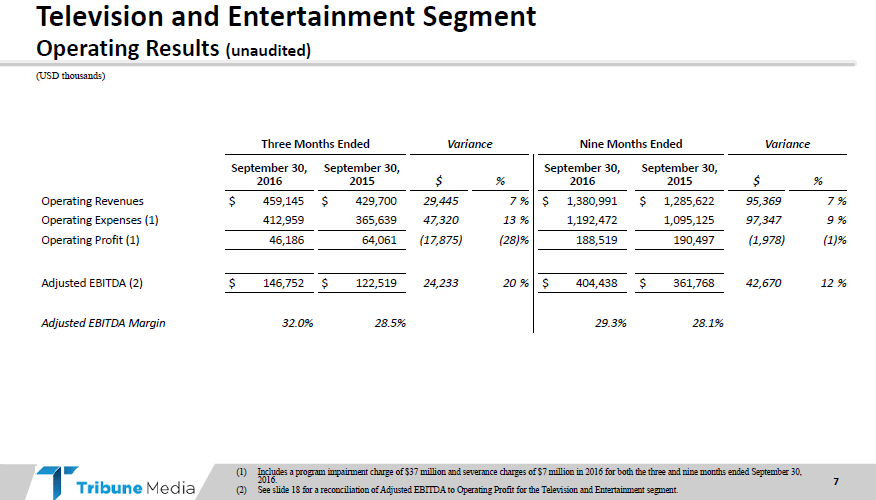
Television and Entertainment Segment
Operating
Results (unaudited)
(USD thousands)
| Three Months Ended | Variance | Nine Months Ended | Variance | |||||||||||||
| September 30, |
September 30, |
September 30, |
September 30, |
|||||||||||||
| 2016 | 2015 | $% | 2016 | 2015 | $% | |||||||||||
| Operating Revenues | $459,145 | $429,700 | 29,445 | 7% | $1,380,991 | $1,285,622 | 95,369 | 7% | ||||||||
| Operating Expenses (1) | 412,959 | 365,639 | 47,320 | 13% | 1,192,472 | 1,095,125 | 97,347 | 9% | ||||||||
| Operating Profit (1) | 46,186 | 64,061 | (17,875) | (28)% | 188,519 | 190,497 | (1,978) | (1)% | ||||||||
| Adjusted EBITDA (2) | $146,752 | $122,519 | 24,233 | 20% | $404,438 | $361,768 | 42,670 | 12% | ||||||||
| Adjusted EBITDA Margin | 32.0% | 28.5% | 29.3% | 28.1% | ||||||||||||
(1) Includes a program impairment charge of $37 million and severance charges of $7 million in 2016 for both the three and nine months
ended September 30, 2016.
(2) See slide 18 for a reconciliation of Adjusted EBITDA to Operating Profit for the Television and Entertainment segment.
|
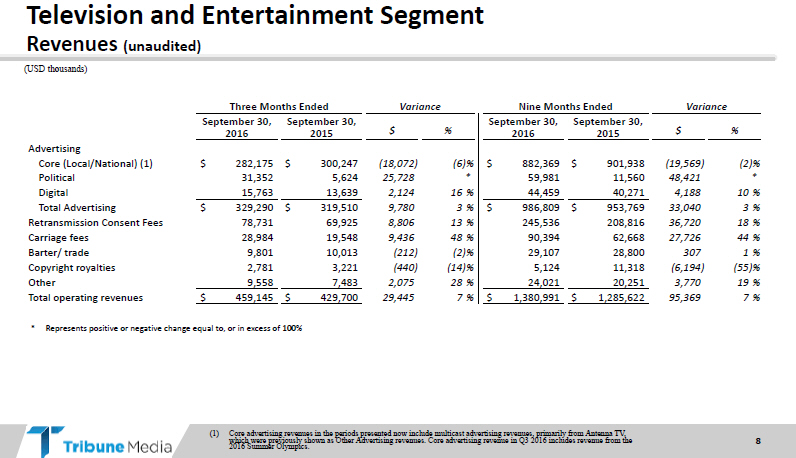
Television and Entertainment Segment
Revenues
(unaudited)
(USD thousands)
| Three Months Ended | Variance | Nine Months Ended | Variance | |||||||||||||
| September 30, |
September 30, |
September 30, |
September 30, |
|||||||||||||
| 2016 | 2015 | $% | 2016 | 2015 | $% | |||||||||||
| Advertising | ||||||||||||||||
| Core (Local/National) (1) | $282,175 | $300,247 | (18,072) | (6)% | $882,369 | $901,938 | (19,569) | (2)% | ||||||||
| Political | 31,352 | 5,624 | 25,728 | * | 59,981 | 11,560 | 48,421 | * | ||||||||
| Digital | 15,763 | 13,639 | 2,124 | 16% | 44,459 | 40,271 | 4,188 | 10% | ||||||||
| Total Advertising | $329,290 | $319,510 | 9,780 | 3% | $986,809 | $953,769 | 33,040 | 3% | ||||||||
| Retransmission Consent Fees | 78,731 | 69,925 | 8,806 | 13% | 245,536 | 208,816 | 36,720 | 18% | ||||||||
| Carriage fees | 28,984 | 19,548 | 9,436 | 48% | 90,394 | 62,668 | 27,726 | 44% | ||||||||
| Barter/ trade | 9,801 | 10,013 | (212) | (2)% | 29,107 | 28,800 | 307 | 1% | ||||||||
| Copyright royalties | 2,781 | 3,221 | (440) | (14)% | 5,124 | 11,318 | (6,194) | (55)% | ||||||||
| Other | 9,558 | 7,483 | 2,075 | 28% | 24,021 | 20,251 | 3,770 | 19% | ||||||||
| Total operating revenues | $459,145 | $429,700 | 29,445 | 7% | $1,380,991 | $1,285,622 | 95,369 | 7% | ||||||||
| * | Represents positive or negative change equal to, or in excess of 100% |
(1) Core advertising revenues in the periods presented now include multicast advertising revenues, primarily from Antenna TV, which were previously shown as Other Advertising revenues. Core advertising revenue in Q3 2016 includes revenue from the 2016 Summer Olympics.
|
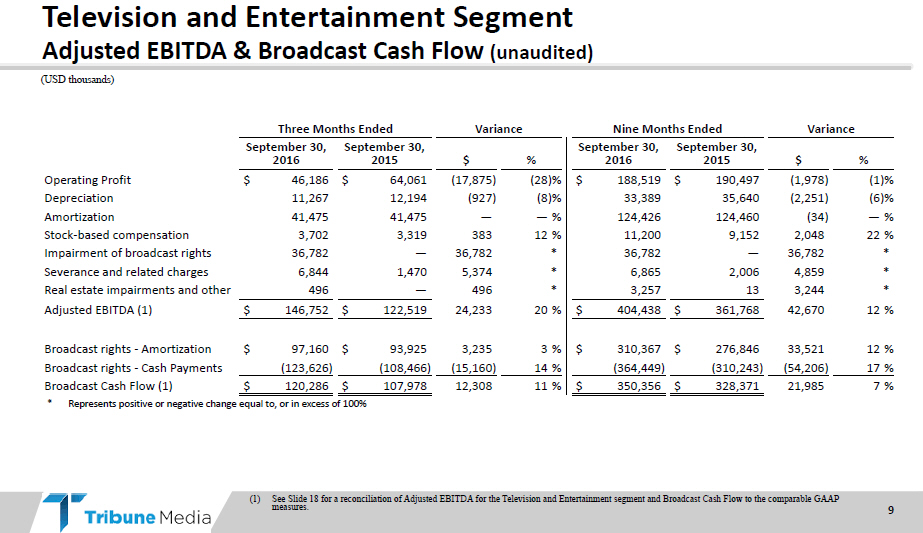
Television and Entertainment Segment
Adjusted
EBITDA & Broadcast Cash Flow (unaudited)
(USD thousands)
| Three Months Ended | Variance | Nine Months Ended | Variance | |||||||||||||
| September 30, |
September 30, |
September 30, |
September 30, |
|||||||||||||
| 2016 | 2015 | $% | 2016 | 2015 | $% | |||||||||||
| Operating Profit | $46,186 | $64,061 | (17,875) | (28)% | $188,519 | $190,497 | (1,978) | (1)% | ||||||||
| Depreciation | 11,267 | 12,194 | (927) | (8)% | 33,389 | 35,640 | (2,251) | (6)% | ||||||||
| Amortization | 41,475 | 41,475 | — | —% | 124,426 | 124,460 | (34) | —% | ||||||||
| Stock-based compensation | 3,702 | 3,319 | 383 | 12% | 11,200 | 9,152 | 2,048 | 22% | ||||||||
| Impairment of broadcast rights | 36,782 | — | 36,782 | * | 36,782 | — | 36,782 | * | ||||||||
| Severance and related charges | 6,844 | 1,470 | 5,374 | * | 6,865 | 2,006 | 4,859 | * | ||||||||
| Real estate impairments and other | 496 | — | 496 | * | 3,257 | 13 | 3,244 | * | ||||||||
| Adjusted EBITDA (1) | $146,752 | $122,519 | 24,233 | 20% | $404,438 | $361,768 | 42,670 | 12% | ||||||||
| Broadcast rights - Amortization | $97,160 | $93,925 | 3,235 | 3% | $310,367 | $276,846 | 33,521 | 12% | ||||||||
| Broadcast rights - Cash Payments | (123,626) | (108,466) | (15,160) | 14% | (364,449) | (310,243) | (54,206) | 17% | ||||||||
| Broadcast Cash Flow (1) | $120,286 | $107,978 | 12,308 | 11% | $350,356 | $328,371 | 21,985 | 7% | ||||||||
| * | Represents positive or negative change equal to, or in excess of 100% |
(1) See Slide 18 for a reconciliation of Adjusted EBITDA for the Television and Entertainment segment and Broadcast Cash Flow to the comparable GAAP measures.
|
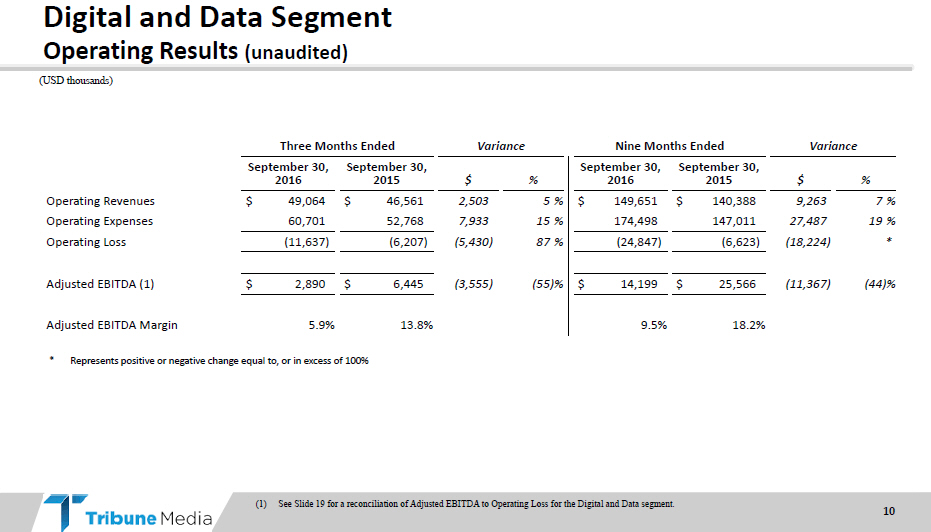
Digital and Data Segment
Operating Results
(unaudited)
(USD thousands)
| Three Months Ended | Variance | Nine Months Ended | Variance | |||||||||||||
| September 30, |
September 30, |
September 30, |
September 30, |
|||||||||||||
| 2016 | 2015 | $% | 2016 | 2015 | $% | |||||||||||
| Operating Revenues | $49,064 | $46,561 | 2,503 | 5% | $149,651 | $140,388 | 9,263 | 7% | ||||||||
| Operating Expenses | 60,701 | 52,768 | 7,933 | 15% | 174,498 | 147,011 | 27,487 | 19% | ||||||||
| Operating Loss | (11,637) | (6,207) | (5,430) | 87% | (24,847) | (6,623) | (18,224) | * | ||||||||
| Adjusted EBITDA (1) | $2,890 | $6,445 | (3,555) | (55)% | $14,199 | $25,566 | (11,367) | (44)% | ||||||||
| Adjusted EBITDA Margin | 5.9% | 13.8% | 9.5% | 18.2% | ||||||||||||
| * | Represents positive or negative change equal to, or in excess of 100% |
| (1) | See Slide 19 for a reconciliation of Adjusted EBITDA to Operating Loss for the Digital and Data segment. |
|
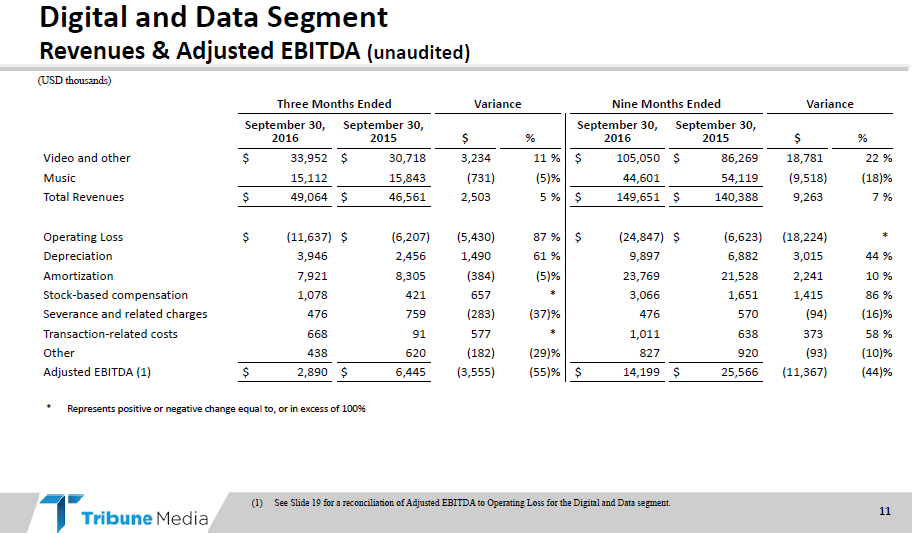
Digital and Data Segment
Revenues & Adjusted
EBITDA (unaudited)
(USD thousands)
| Three Months Ended | Variance | Nine Months Ended | Variance | |||||||||||||
| September 30, |
September 30, |
September 30, |
September 30, |
|||||||||||||
| 2016 | 2015 | $% | 2016 | 2015 | $% | |||||||||||
| Video and other | $33,952 | $30,718 | 3,234 | 11% | $105,050 | $86,269 | 18,781 | 22% | ||||||||
| Music | 15,112 | 15,843 | (731) | (5)% | 44,601 | 54,119 | (9,518) | (18)% | ||||||||
| Total Revenues | $49,064 | $46,561 | 2,503 | 5% | $149,651 | $140,388 | 9,263 | 7% | ||||||||
| Operating Loss | $(11,637) | $(6,207) | (5,430) | 87% | $(24,847) | $(6,623) | (18,224) | * | ||||||||
| Depreciation | 3,946 | 2,456 | 1,490 | 61% | 9,897 | 6,882 | 3,015 | 44% | ||||||||
| Amortization | 7,921 | 8,305 | (384) | (5)% | 23,769 | 21,528 | 2,241 | 10% | ||||||||
| Stock-based compensation | 1,078 | 421 | 657 | * | 3,066 | 1,651 | 1,415 | 86% | ||||||||
| Severance and related charges | 476 | 759 | (283) | (37)% | 476 | 570 | (94) | (16)% | ||||||||
| Transaction-related costs | 668 | 91 | 577 | * | 1,011 | 638 | 373 | 58% | ||||||||
| Other | 438 | 620 | (182) | (29)% | 827 | 920 | (93) | (10)% | ||||||||
| Adjusted EBITDA (1) | $2,890 | $6,445 | (3,555) | (55)% | $14,199 | $25,566 | (11,367) | (44)% | ||||||||
| * | Represents positive or negative change equal to, or in excess of 100% |
| (1) | See Slide 19 for a reconciliation of Adjusted EBITDA to Operating Loss for the Digital and Data segment. |
|
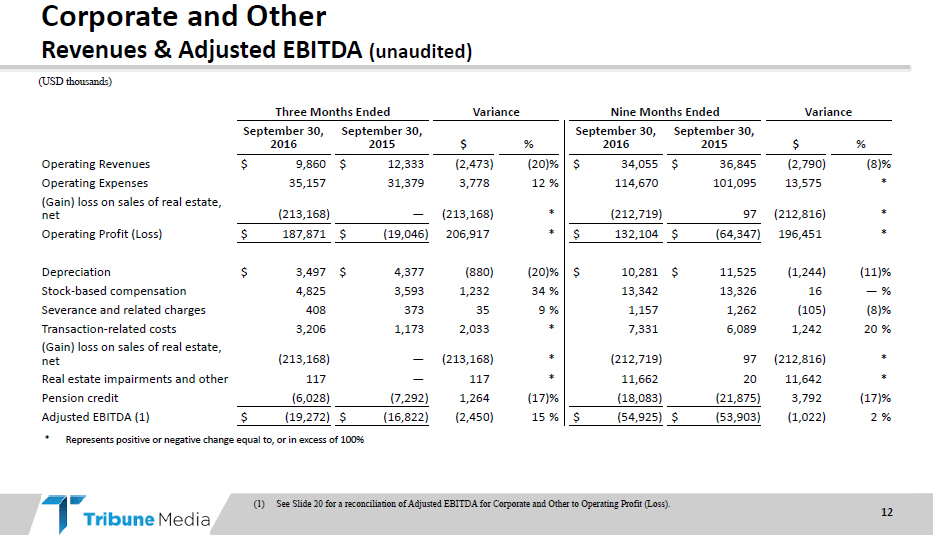
Corporate and Other
Revenues & Adjusted
EBITDA (unaudited)
(USD thousands)
| Three Months Ended | Variance | Nine Months Ended | Variance | |||||||||||||
| September 30, |
September 30, |
September 30, |
September 30, |
|||||||||||||
| 2016 | 2015 | $% | 2016 | 2015 | $% | |||||||||||
| Operating Revenues | $9,860 | $12,333 | (2,473) | (20)% | $34,055 | $36,845 | (2,790) | (8)% | ||||||||
| Operating Expenses | 35,157 | 31,379 | 3,778 | 12% | 114,670 | 101,095 | 13,575 | * | ||||||||
| (Gain) loss on sales of real estate, net | (213,168) | — | (213,168) | * | (212,719) | 97 | (212,816) | * | ||||||||
| Operating Profit (Loss) | $187,871 | $(19,046) | 206,917 | * | $132,104 | $(64,347) | 196,451 | * | ||||||||
| Depreciation | $3,497 | $4,377 | (880) | (20)% | $10,281 | $11,525 | (1,244) | (11)% | ||||||||
| Stock-based compensation | 4,825 | 3,593 | 1,232 | 34% | 13,342 | 13,326 | 16 | —% | ||||||||
| Severance and related charges | 408 | 373 | 35 | 9% | 1,157 | 1,262 | (105) | (8)% | ||||||||
| Transaction-related costs | 3,206 | 1,173 | 2,033 | * | 7,331 | 6,089 | 1,242 | 20% | ||||||||
| (Gain) loss on sales of real estate, net | (213,168) | — | (213,168) | * | (212,719) | 97 | (212,816) | * | ||||||||
| Real estate impairments and other | 117 | — | 117 | * | 11,662 | 20 | 11,642 | * | ||||||||
| Pension credit | (6,028) | (7,292) | 1,264 | (17)% | (18,083) | (21,875) | 3,792 | (17)% | ||||||||
| Adjusted EBITDA (1) | $(19,272) | $(16,822) | (2,450) | 15% | $(54,925) | $(53,903) | (1,022) | 2% | ||||||||
| * | Represents positive or negative change equal to, or in excess of 100% |
| (1) | See Slide 20 for a reconciliation of Adjusted EBITDA for Corporate and Other to Operating Profit (Loss). |
|
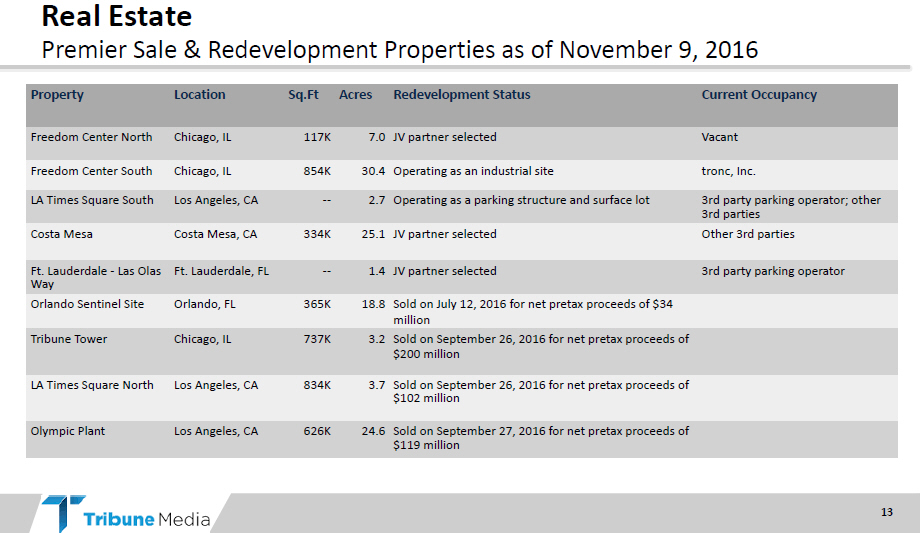
Real Estate
Premier Sale & Redevelopment
Properties as of November 9, 2016
| Property | Location | Sq.Ft | Acres | Redevelopment Status | Current Occupancy | |||||
| Freedom Center North | Chicago, IL | 117K | 7.0 | JV partner selected | Vacant | |||||
| Freedom Center South | Chicago, IL | 854K | 30.4 | Operating as an industrial site | tronc, Inc. | |||||
| LA Times Square South | Los Angeles, CA | — | 2.7 | Operating as a parking structure and surface lot | 3rd party parking operator; other | |||||
| 3rd parties | ||||||||||
| Costa Mesa | Costa Mesa, CA | 334K | 25.1 | JV partner selected | Other 3rd parties | |||||
| Ft. Lauderdale - Las Olas | Ft. Lauderdale, FL | — | 1.4 | JV partner selected | 3rd party parking operator | |||||
| Way | ||||||||||
| Orlando Sentinel Site | Orlando, FL | 365K | 18.8 | Sold on July 12, 2016 for net pretax proceeds of $34 | ||||||
| million | ||||||||||
| Tribune Tower | Chicago, IL | 737K | 3.2 | Sold on September 26, 2016 for net pretax proceeds of | ||||||
| $200 million | ||||||||||
| LA Times Square North | Los Angeles, CA | 834K | 3.7 | Sold on September 26, 2016 for net pretax proceeds of | ||||||
| $102 million | ||||||||||
| Olympic Plant | Los Angeles, CA | 626K | 24.6 | Sold on September 27, 2016 for net pretax proceeds of | ||||||
| $119 million |
|
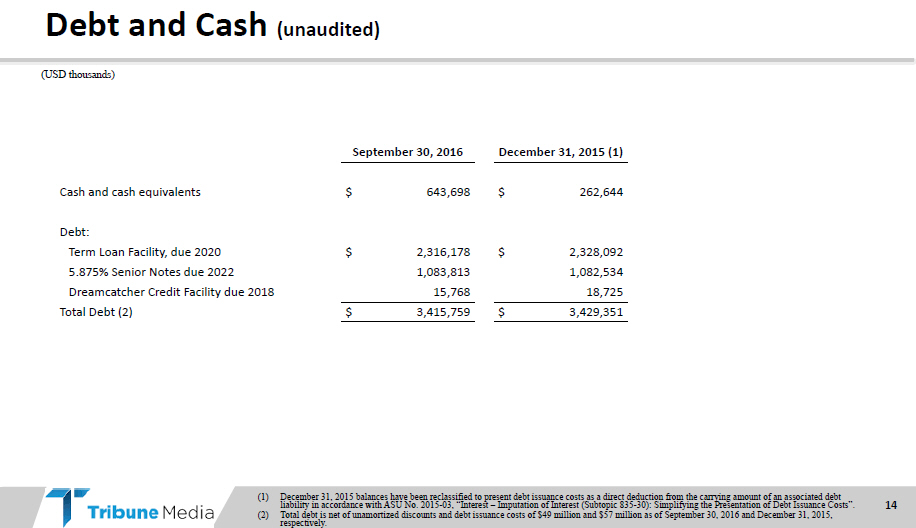
Debt and Cash (unaudited)
(USD thousands)
| September 30, 2016 |
December 31, 2015 (1) | |||
| Cash and cash equivalents | $643,698 | $262,644 | ||
| Debt: | ||||
| Term Loan Facility, due 2020 | $2,316,178 | $2,328,092 | ||
| 5.875% Senior Notes due 2022 | 1,083,813 | 1,082,534 | ||
| Dreamcatcher Credit Facility due 2018 | 15,768 | 18,725 | ||
| Total Debt (2) | $3,415,759 | $3,429,351 |
(1) December 31, 2015 balances have been reclassified to present debt issuance costs as a direct deduction from the carrying amount of an associated debt liability in accordance with ASU No. 2015-03, “Interest – Imputation of Interest (Subtopic 835-30): Simplifying the Presentation of Debt Issuance Costs”. (2) Total debt is net of unamortized discounts and debt issuance costs of $49 million and $57 million as of September 30, 2016 and December 31, 2015, respectively.
|
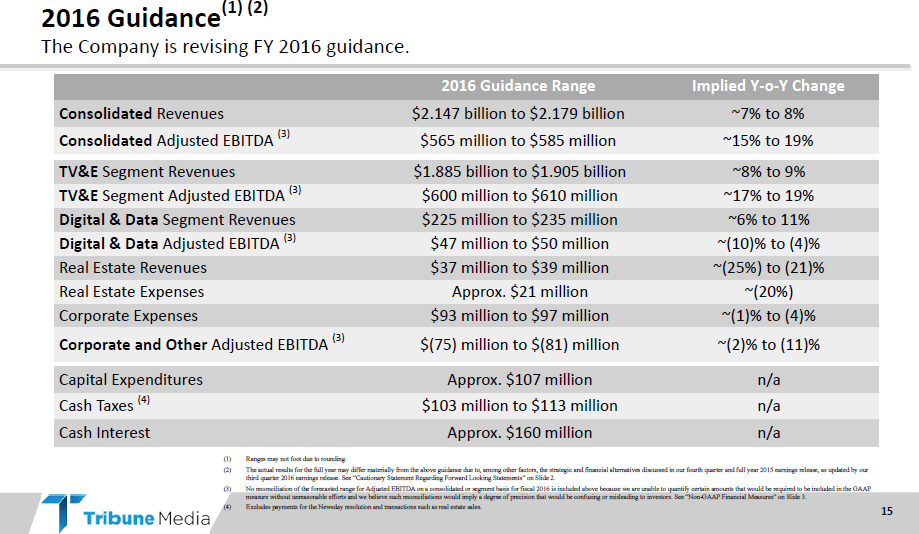
2016 Guidance(1) (2)
The Company is revising FY 2016
guidance.
| 2016 Guidance Range | Implied Y-o-Y Change | |||||||||
| Consolidated Revenues | $2.147 billion to $2.179 billion | ~7% to 8% | ||||||||
| Consolidated Adjusted EBITDA (3) | $565 million to $585 million | ~15% to 19% | ||||||||
| TV&E Segment Revenues | $1.885 billion to | $ | 1.905 billion | ~8% to 9% | ||||||
| TV&E Segment Adjusted EBITDA (3) | $600 | million to | $ | 610 million | ~17% to 19% | |||||
| Digital & Data Segment Revenues | $225 | million to | $ | 235 million | ~6% to 11% | |||||
| Digital & Data Adjusted EBITDA (3) | $47 | million to | $ | 50 million | ~(10)% to (4)% | |||||
| Real Estate Revenues | $37 | million to | $ | 39 million | ~(25%) to (21)% | |||||
| Real Estate Expenses | Approx. $21 million | ~(20%) | ||||||||
| Corporate Expenses | $93 | million to | $ | 97 million | ~(1)% to (4)% | |||||
| Corporate and Other Adjusted EBITDA (3) | $(75) | million to | $ | (81) million | ~(2)% to (11)% | |||||
| Capital Expenditures | Approx. $107 million | n/a | ||||||||
| Cash Taxes (4) | $103 | million to | $ | 113 million | n/a | |||||
| Cash Interest | Approx. $160 million | n/a |
| (1) | Ranges may not foot due to rounding. |
(2) The actual results for the full year may differ materially from the above guidance due to, among other factors, the strategic and financial alternatives discussed in
our fourth quarter and full year 2015 earnings release, as updated by our third quarter 2016 earnings release. See “Cautionary Statement Regarding Forward Looking Statements” on Slide 2.
(3) No reconciliation of the forecasted range for Adjusted EBITDA on a consolidated or segment basis for fiscal 2016 is included above because we are unable to quantify certain
amounts that would be required to be included in the GAAP measure without unreasonable efforts and we believe such reconciliations would imply a degree of precision that would be confusing or misleading to investors. See “Non-GAAP Financial
Measures” on Slide 3.
| (4) | Excludes payments for the Newsday resolution and transactions such as real estate sales. |

|
Non-GAAP Reconciliations
|
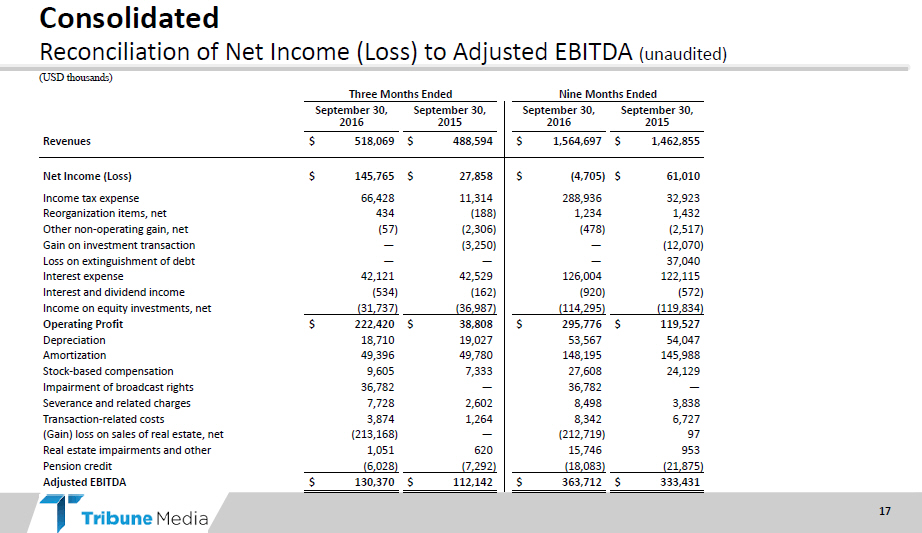
Consolidated
Reconciliation of Net Income (Loss) to
Adjusted EBITDA (unaudited)
(USD thousands)
| Three Months Ended | Nine Months Ended | |||||||
| September 30, | September 30, | September 30, | September 30, | |||||
| 2016 | 2015 | 2016 | 2015 | |||||
| Revenues | $ 518,069 | $488,594 | $1,564,697 | $1,462,855 | ||||
| Net Income (Loss) | $ 145,765 | $27,858 | $(4,705) | $61,010 | ||||
| Income tax expense | 66,428 | 11,314 | 288,936 | 32,923 | ||||
| Reorganization items, net | 434 | (188) | 1,234 | 1,432 | ||||
| Other non-operating gain, net | (57) | (2,306) | (478) | (2,517) | ||||
| Gain on investment transaction | — | (3,250) | — | (12,070) | ||||
| Loss on extinguishment of debt | — | — | — | 37,040 | ||||
| Interest expense | 42,121 | 42,529 | 126,004 | 122,115 | ||||
| Interest and dividend income | (534) | (162) | (920) | (572) | ||||
| Income on equity investments, net | (31,737) | (36,987) | (114,295) | (119,834) | ||||
| Operating Profit | $222,420 | $38,808 | $295,776 | $119,527 | ||||
| Depreciation | 18,710 | 19,027 | 53,567 | 54,047 | ||||
| Amortization | 49,396 | 49,780 | 148,195 | 145,988 | ||||
| Stock-based compensation | 9,605 | 7,333 | 27,608 | 24,129 | ||||
| Impairment of broadcast rights | 36,782 | — | 36,782 | — | ||||
| Severance and related charges | 7,728 | 2,602 | 8,498 | 3,838 | ||||
| Transaction-related costs | 3,874 | 1,264 | 8,342 | 6,727 | ||||
| (Gain) loss on sales of real estate, net | (213,168) | — | (212,719) | 97 | ||||
| Real estate impairments and other | 1,051 | 620 | 15,746 | 953 | ||||
| Pension credit | (6,028) | (7,292) | (18,083) | (21,875) | ||||
| Adjusted EBITDA | $130,370 | $112,142 | $363,712 | $333,431 | ||||
|
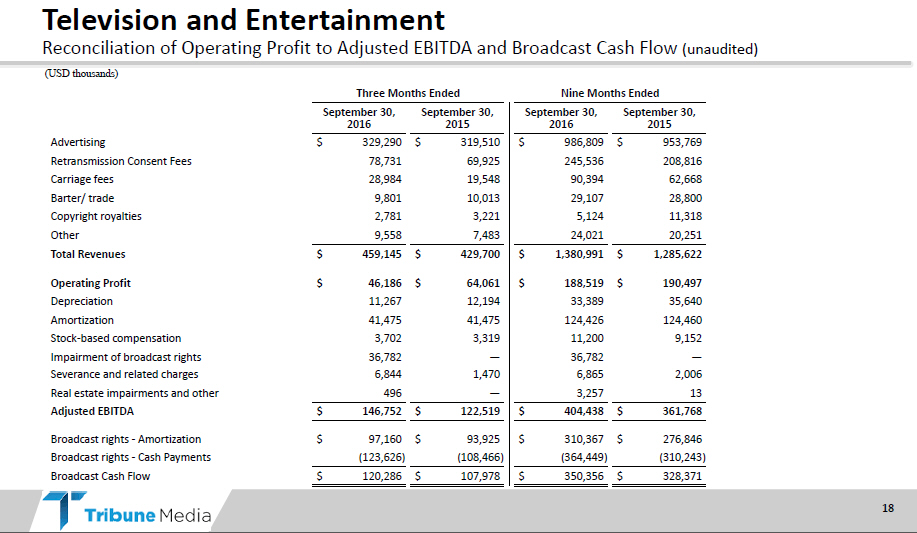
Television and Entertainment
Reconciliation of
Operating Profit to Adjusted EBITDA and Broadcast Cash Flow (unaudited)
(USD thousands)
| Three Months Ended | Nine Months Ended | |||||||
| September 30, | September 30, | September 30, | September 30, | |||||
| 2016 | 2015 | 2016 | 2015 | |||||
| Advertising | $329,290 | $319,510 | $986,809 | $953,769 | ||||
| Retransmission Consent Fees | 78,731 | 69,925 | 245,536 | 208,816 | ||||
| Carriage fees | 28,984 | 19,548 | 90,394 | 62,668 | ||||
| Barter/ trade | 9,801 | 10,013 | 29,107 | 28,800 | ||||
| Copyright royalties | 2,781 | 3,221 | 5,124 | 11,318 | ||||
| Other | 9,558 | 7,483 | 24,021 | 20,251 | ||||
| Total Revenues | $459,145 | $429,700 | $1,380,991 | $1,285,622 | ||||
| Operating Profit | $46,186 | $64,061 | $188,519 | $190,497 | ||||
| Depreciation | 11,267 | 12,194 | 33,389 | 35,640 | ||||
| Amortization | 41,475 | 41,475 | 124,426 | 124,460 | ||||
| Stock-based compensation | 3,702 | 3,319 | 11,200 | 9,152 | ||||
| Impairment of broadcast rights | 36,782 | — | 36,782 | — | ||||
| Severance and related charges | 6,844 | 1,470 | 6,865 | 2,006 | ||||
| Real estate impairments and other | 496 | — | 3,257 | 13 | ||||
| Adjusted EBITDA | $146,752 | $122,519 | $404,438 | $361,768 | ||||
| Broadcast rights - Amortization | $97,160 | $93,925 | $310,367 | $276,846 | ||||
| Broadcast rights - Cash Payments | (123,626) | (108,466) | (364,449) | (310,243) | ||||
| Broadcast Cash Flow | $120,286 | $107,978 | $350,356 | $328,371 | ||||
|
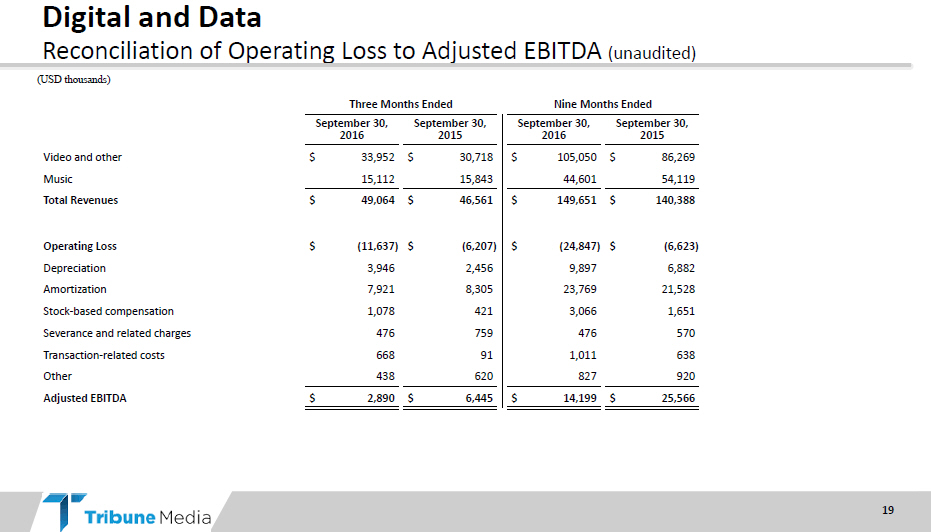
Digital and Data
Reconciliation of Operating Loss to
Adjusted EBITDA (unaudited)
(USD thousands)
| Three Months Ended |
Nine Months Ended | |||||||
| September 30, | September 30, | September 30, | September 30, | |||||
| 2016 | 2015 | 2016 | 2015 | |||||
| Video and other | $33,952 | $30,718 | $105,050 | $86,269 | ||||
| Music | 15,112 | 15,843 | 44,601 | 54,119 | ||||
| Total Revenues | $49,064 | $46,561 | $149,651 | $140,388 | ||||
| Operating Loss | $(11,637) | $(6,207) | $(24,847) | $(6,623) | ||||
| Depreciation | 3,946 | 2,456 | 9,897 | 6,882 | ||||
| Amortization | 7,921 | 8,305 | 23,769 | 21,528 | ||||
| Stock-based compensation | 1,078 | 421 | 3,066 | 1,651 | ||||
| Severance and related charges | 476 | 759 | 476 | 570 | ||||
| Transaction-related costs | 668 | 91 | 1,011 | 638 | ||||
| Other | 438 | 620 | 827 | 920 | ||||
| Adjusted EBITDA | $2,890 | $6,445 | $14,199 | $25,566 | ||||
|
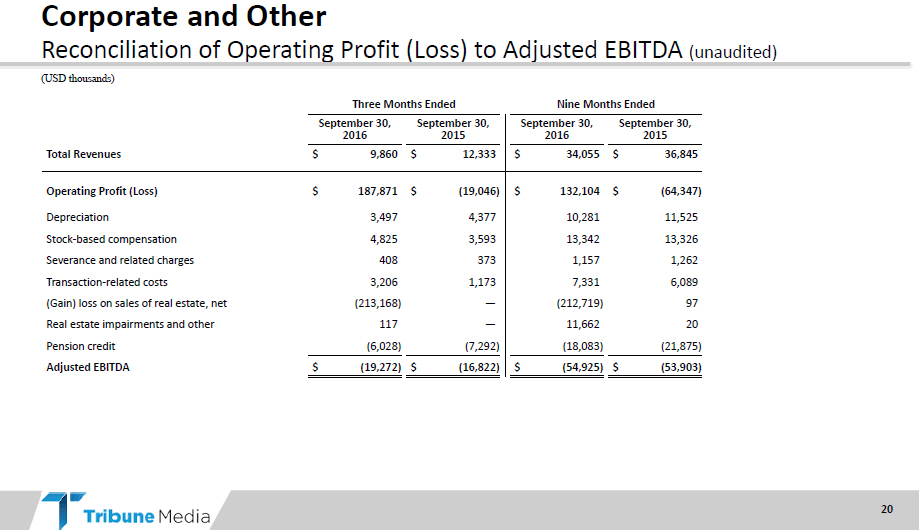
Corporate and Other
Reconciliation of Operating
Profit (Loss) to Adjusted EBITDA (unaudited)
(USD thousands)
| Three Months Ended | Nine Months Ended | |||||||||
| September 30, | September 30, | September 30, | September 30, | |||||||
| 2016 | 2015 | 2016 | 2015 | |||||||
| Total Revenues | $9,860 | $12,333 | $34,055 | $36,845 | ||||||
| Operating Profit (Loss) | $ 187,871 | $(19,046) | $132,104 | $(64,347) | ||||||
| Depreciation | 3,497 | 4,377 | 10,281 | 11,525 | ||||||
| Stock-based compensation | 4,825 | 3,593 | 13,342 | 13,326 | ||||||
| Severance and related charges | 408 | 373 | 1,157 | 1,262 | ||||||
| Transaction-related costs | 3,206 | 1,173 | 7,331 | 6,089 | ||||||
| (Gain) loss on sales of real estate, net | (213,168) | — | (212,719) | 97 | ||||||
| Real estate impairments and other | 117 | — | 11,662 | 20 | ||||||
| Pension credit | (6,028) | (7,292) | (18,083) | (21,875) | ||||||
| Adjusted EBITDA | $(19,272) | $(16,822) | $(54,925) | $(53,903) | ||||||
|
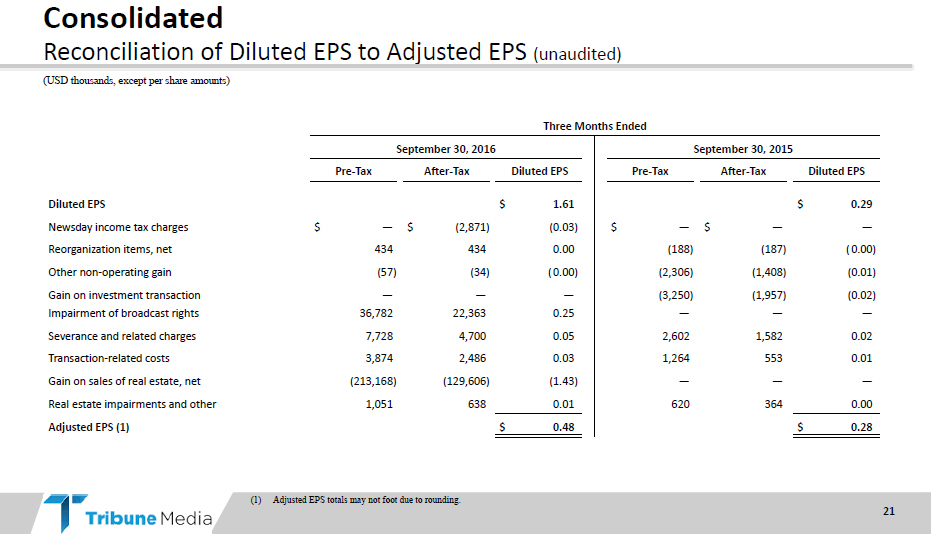
Consolidated
Reconciliation of Diluted EPS to
Adjusted EPS (unaudited)
(USD thousands, except per share amounts)
| Three Months Ended |
||||||||||||||
| September 30, 2016 | September 30, 2015 | |||||||||||||
| Pre-Tax | After-Tax | Diluted EPS |
Pre-Tax | After-Tax | Diluted EPS | |||||||||
| Diluted EPS | $1.61 | $0.29 | ||||||||||||
| Newsday income tax charges | $ | —$ | (2,871) | (0.03) | $— | $— | — | |||||||
| Reorganization items, net | 434 | 434 | 0.00 | (188) | (187) | (0.00) | ||||||||
| Other non-operating gain | (57) | (34) | (0.00) | (2,306) | (1,408) | (0.01) | ||||||||
| Gain on investment transaction | — | — | — | (3,250) | (1,957) | (0.02) | ||||||||
| Impairment of broadcast rights | 36,782 | 22,363 | 0.25 | — | — | — | ||||||||
| Severance and related charges | 7,728 | 4,700 | 0.05 | 2,602 | 1,582 | 0.02 | ||||||||
| Transaction-related costs | 3,874 | 2,486 | 0.03 | 1,264 | 553 | 0.01 | ||||||||
| Gain on sales of real estate, net | (213,168) | (129,606) | (1.43) | — | — | — | ||||||||
| Real estate impairments and other | 1,051 | 638 | 0.01 | 620 | 364 | 0.00 | ||||||||
| Adjusted EPS (1) | $0.48 | $0.28 | ||||||||||||
| (1) | Adjusted EPS totals may not foot due to rounding. |
|
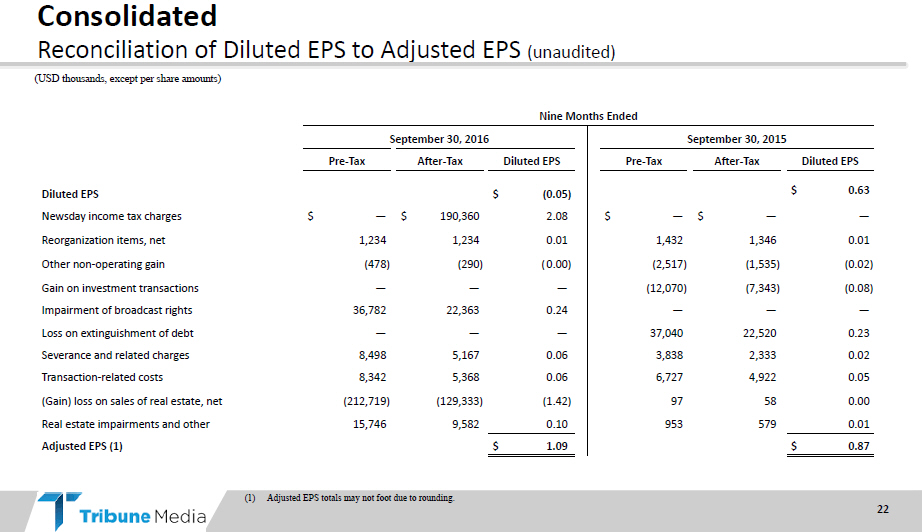
Consolidated
Reconciliation of Diluted EPS to
Adjusted EPS (unaudited)
(USD thousands, except per share amounts)
| Nine Months Ended |
||||||||||||||
| September 30, 2016 | September 30, 2015 | |||||||||||||
| Pre-Tax | After-Tax | Diluted EPS |
Pre-Tax | After-Tax | Diluted EPS | |||||||||
| Diluted EPS | $(0.05) | $0.63 | ||||||||||||
| Newsday income tax charges | $— | $190,360 | 2.08 | $— | $— | — | ||||||||
| Reorganization items, net | 1,234 | 1,234 | 0.01 | 1,432 | 1,346 | 0.01 | ||||||||
| Other non-operating gain | (478) | (290) | (0.00) | (2,517) | (1,535) | (0.02) | ||||||||
| Gain on investment transactions | — | — | — | (12,070) | (7,343) | (0.08) | ||||||||
| Impairment of broadcast rights | 36,782 | 22,363 | 0.24 | — | — | — | ||||||||
| Loss on extinguishment of debt | — | — | — | 37,040 | 22,520 | 0.23 | ||||||||
| Severance and related charges | 8,498 | 5,167 | 0.06 | 3,838 | 2,333 | 0.02 | ||||||||
| Transaction-related costs | 8,342 | 5,368 | 0.06 | 6,727 | 4,922 | 0.05 | ||||||||
| (Gain) loss on sales of real estate, net | (212,719) | (129,333) | (1.42) | 97 | 58 | 0.00 | ||||||||
| Real estate impairments and other | 15,746 | 9,582 | 0.10 | 953 | 579 | 0.01 | ||||||||
| Adjusted EPS (1) | $1.09 | $0.87 | ||||||||||||
(1) Adjusted EPS totals may not foot due to rounding.

|
Q3 2016 Performance Summary
NOVEMBER 2016