Attached files
| file | filename |
|---|---|
| 8-K - 8-K - HarborOne Bancorp, Inc. | hone_corporatorspresentatio.htm |
Exhibit 99.1
|
|
HarborOne Mutual Bancshares Corporators’ Meeting Presentation November 9, 2016 |
|
|
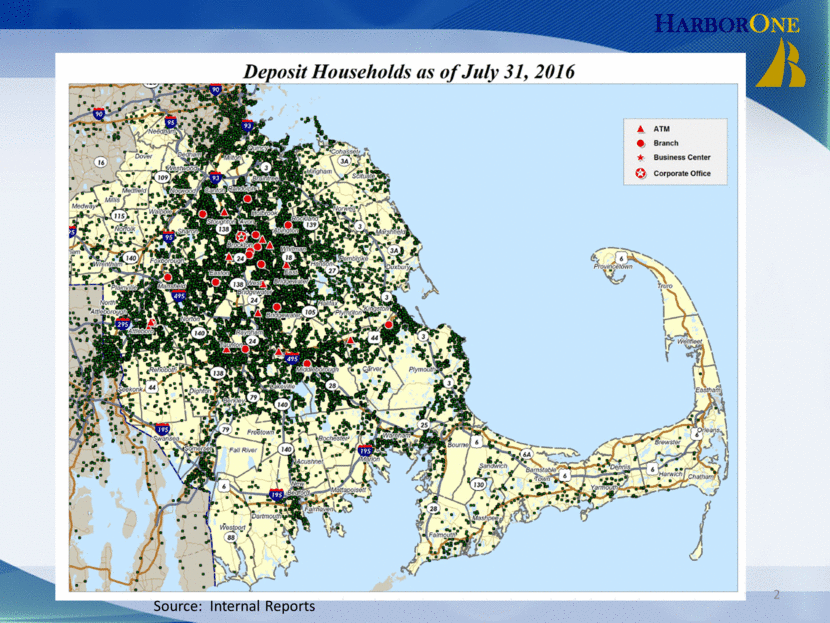
Harbor One Deposit Households as of July 31, 2016, Atm Branch Business Center Corporate Office Source : Internal Reports 2 |
|
|
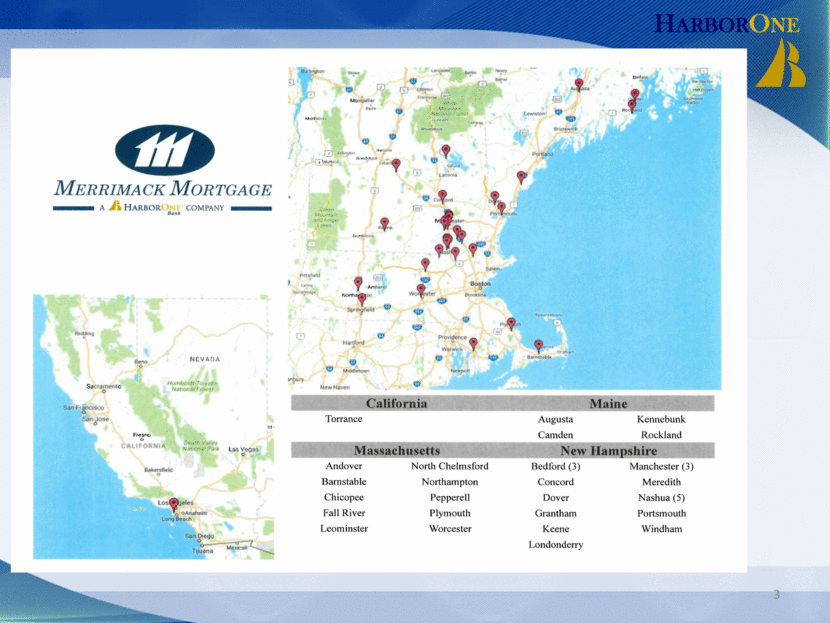
Merrimach Mortgage A Harborone Company California Maine Torrance Augusta Camden Kennebunk Rockland Massachusetts New Hampshire Andover Barnstable Chicopee Fall River Leominster North Chelmsford Northampton Pepperell Plymouth Worcester Bedford (3) Concord Dover Grantham, Keene, Londonderry Manchester (3) Meredith Nashua (5) Portsmouth Windham 3 |
|
|
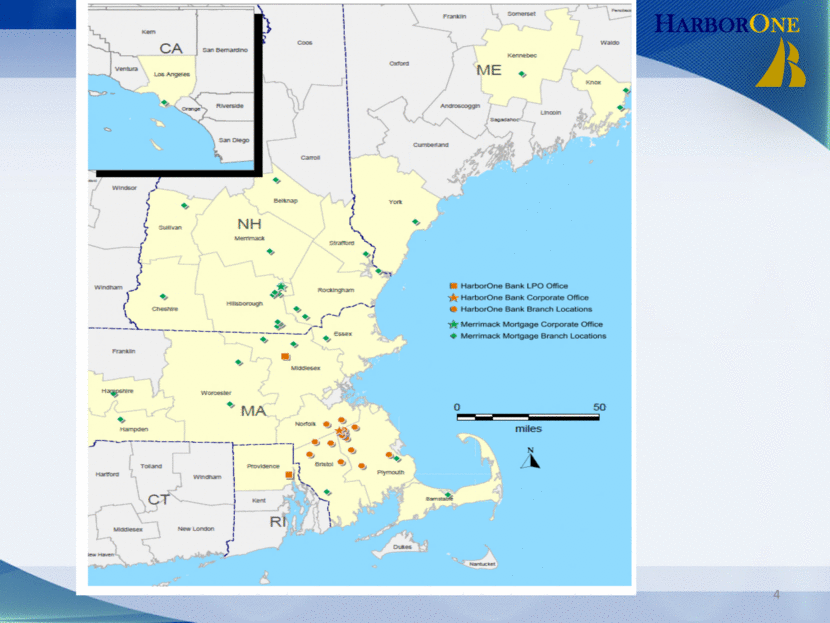
4 HarBorOne HarborOne Bank LPO Office HarborOne Bank Corporate Office HarborOne Bank Branch Locations Merrimack Mortgage Corporate Office Merrimack Mortgage Branch Locations 0 50 miles N ME CA NH MA CT RI |
|
|
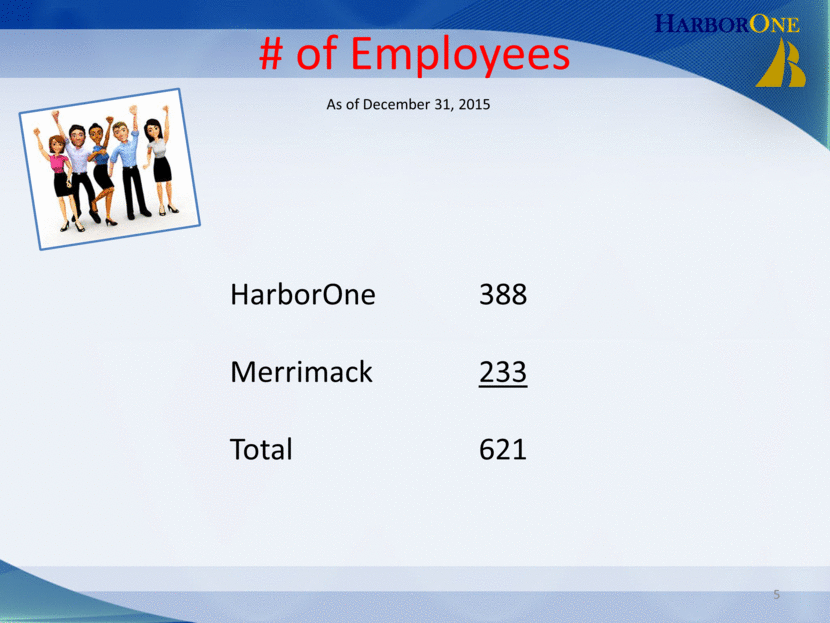
HarborOne # of Employees 5 HarborOne 388 Merrimack 233 Total 621 As of December 31, 2015 |
|
|
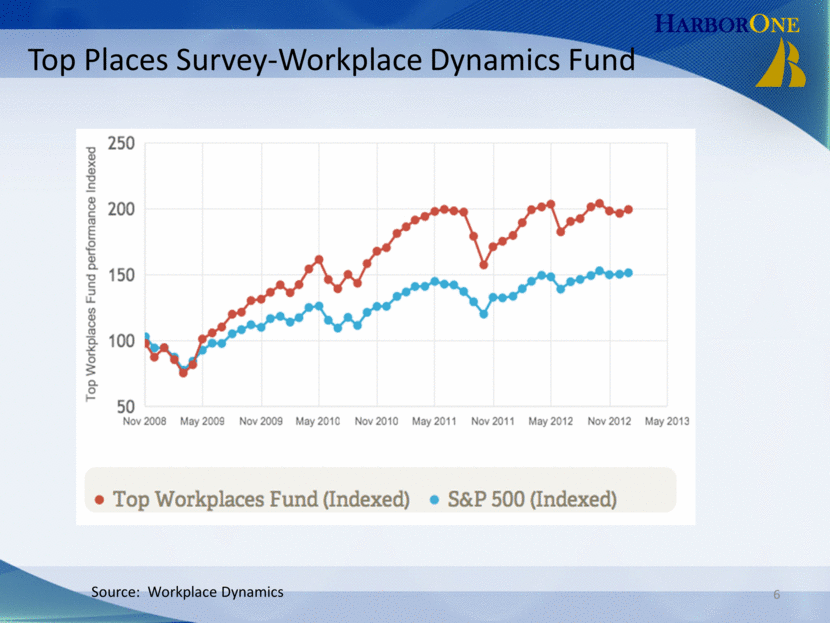
6 HarBorOne Top Places Survey-Workplace Dynamics Fund Top workplaces Fund performance Indexed 250 200 150 100 50 Nov 2008 May 2009 Nov 2009 May 2010 Nov 2010 May 2011 Nov 2011 May 2012 Nov 2012 May 2013 Top Workplaces Fund (Indexed) S&P 500 (Indexed) Sources: Workplace Dynamics |
|
|
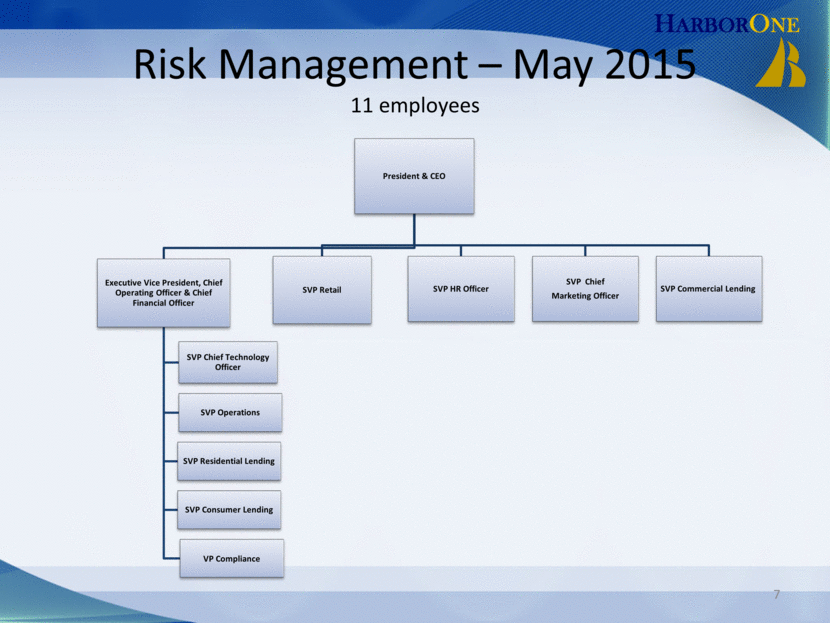
HarBorOne Risk Management – May 2015 11 employees 7 President & CEO Executive Vice President, Chief Operating Officer & Chief Financial Officer SVP Operations SVP Chief Technology Officer SVP Residential Lending SVP Consumer Lending VP Compliance SVP Retail SVP HR Officer SVP Chief Marketing Officer SVP Commercial Lending |
|
|
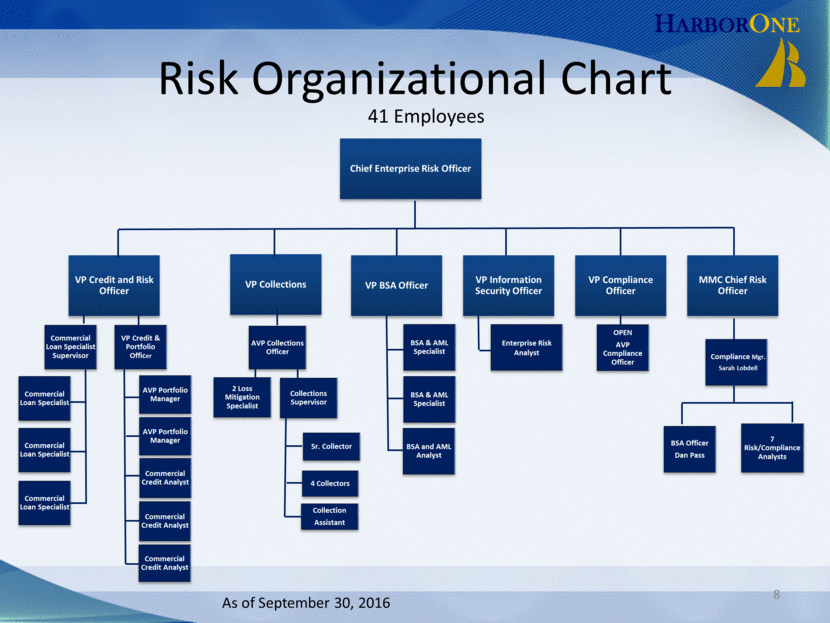
HarBorOne Risk Organizational Chart Chief Enterprise Risk Officer VP Credit and Risk Officer VP Collections VP BSA Officer VP Information Security Officer VP Compliance Officer MMC Chief Risk Officer BSA & AML Specialist BSA & AML Specialist BSA and AML Analyst AVP Collections Officer 2 Loss Mitigation Specialist Sr. Collector 4 Collectors Collections Supervisor OPEN AVP Compliance Officer Collection Assistant Compliance Mgr. Sarah Lobdell 7 Risk/Compliance Analysts BSA Officer Dan Pass VP Credit & Portfolio Officer Commercial Loan Specialist Supervisor AVP Portfolio Manager Commercial Loan Specialist Commercial Loan Specialist Commercial Loan Specialist AVP Portfolio Manager Commercial Credit Analyst Commercial Credit Analyst Commercial Credit Analyst 41 Employees Enterprise Risk Analyst 8 As of September 30, 2016 |
|
|
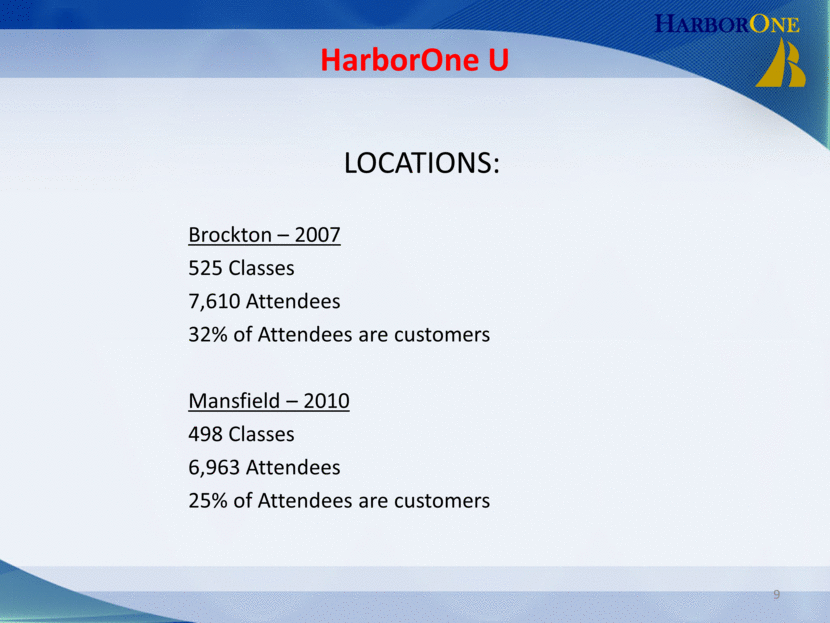
HarborOne LOCATIONS: Brockton – 2007 525 Classes 7,610 Attendees 32% of Attendees are customers Mansfield – 2010 498 Classes 6,963 Attendees 25% of Attendees are customers 9 HarborOne U |
|
|
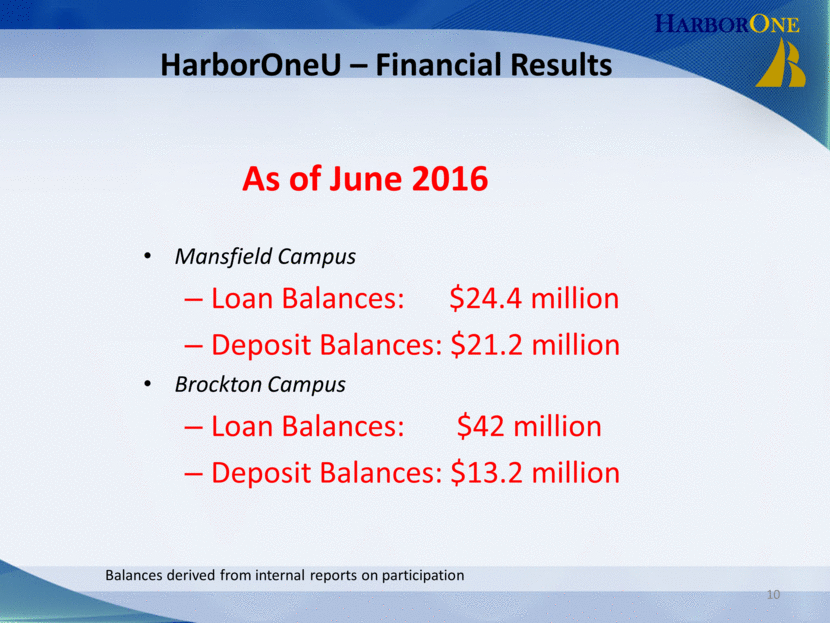
HarborOneU – Financial Results As of June 2016 Mansfield Campus Loan Balances: $24.4 million Deposit Balances: $21.2 million Brockton Campus Loan Balances: $42 million Deposit Balances: $13.2 million 10 Balances derived from internal reports on participation HarborOne |
|
|
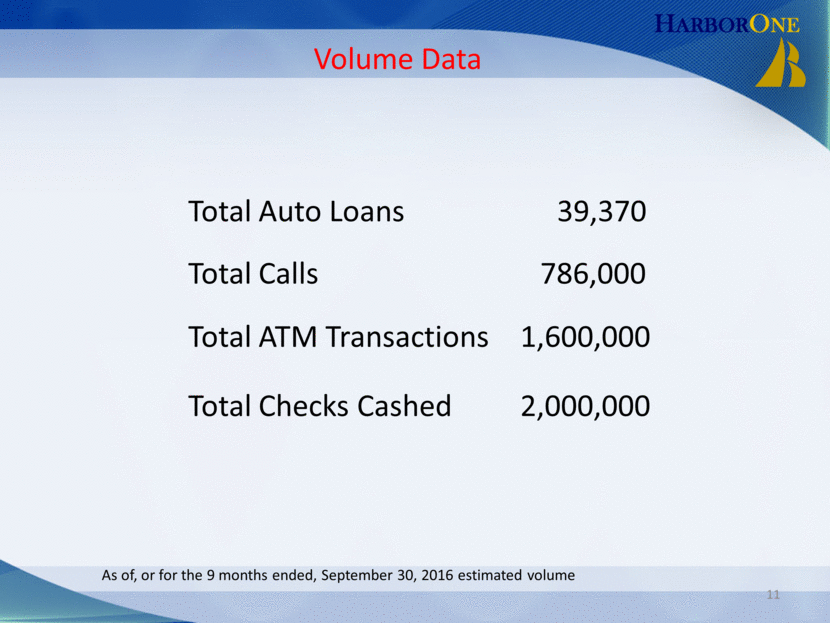
HarborOne 11 Total Auto Loans 39,370 Total Calls 786,000 Total ATM Transactions 1,600,000 Total Checks Cashed 2,000,000 Volume Data As of, or for the 9 months ended, September 30, 2016 estimated volume |
|
|
HarborOne 12 |
|
|
HarborOne 13 FINANCIAL INFORMATION |
|
|
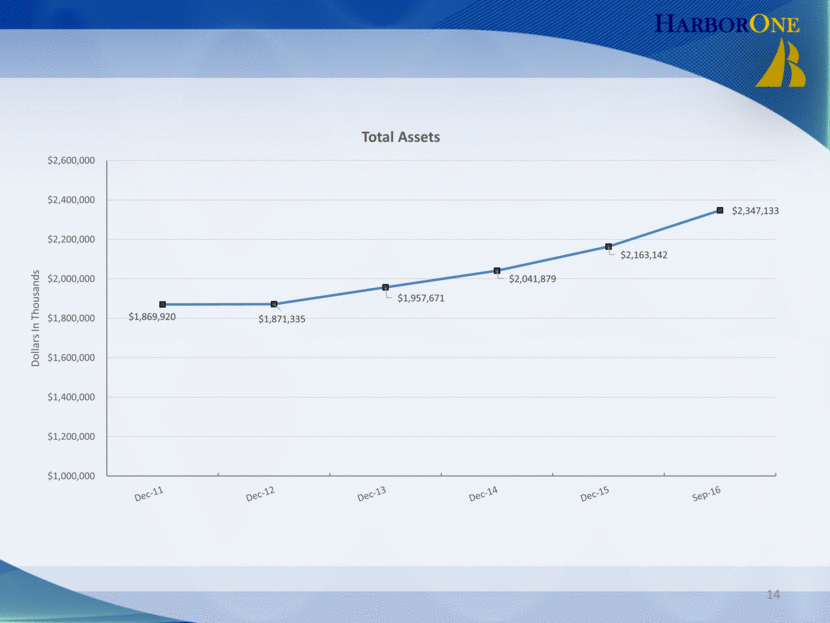
HARBORONE Dollars In Thousands Total Assets $1,869,920 $1,871,335 $1,957,671 $2,041,879 $2,163,142 $2,347,133 $1,000,000 $1,200,000 $1,400,000 $1,600,000 $1,800,000 $2,000,000 $2,200,000 $2,400,000 $2,600,000 Dec-11 Dec-12 Dec-13 Dec-14 Dec-15 Sep-16 14 |
|
|
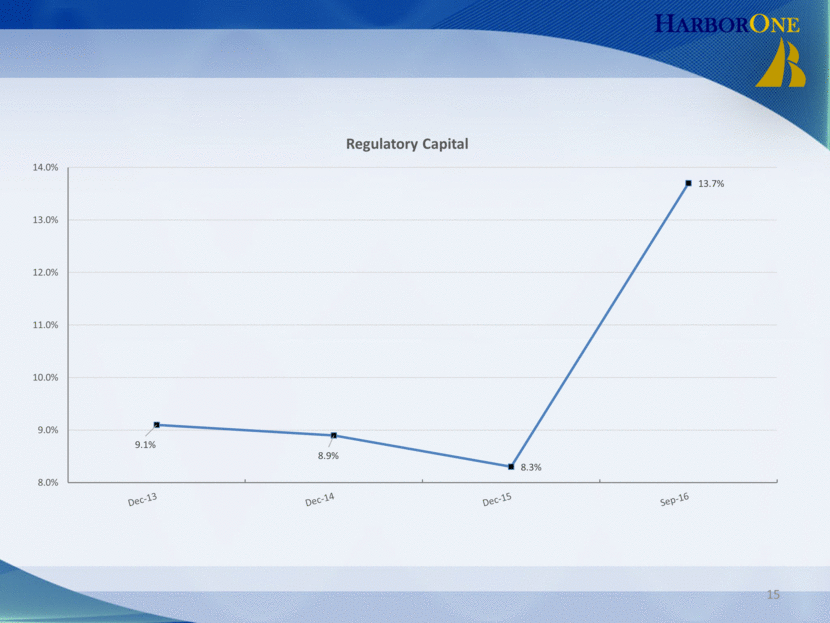
HARBORONE Regulatory Capital8.0% 9.0% 10.0% 11.0% 12.0% 13.0% 14.0%9.1% 8.9% 8.3% 13.7% Dec-13 Dec-14 Dec-15 Sep-1615 |
|
|
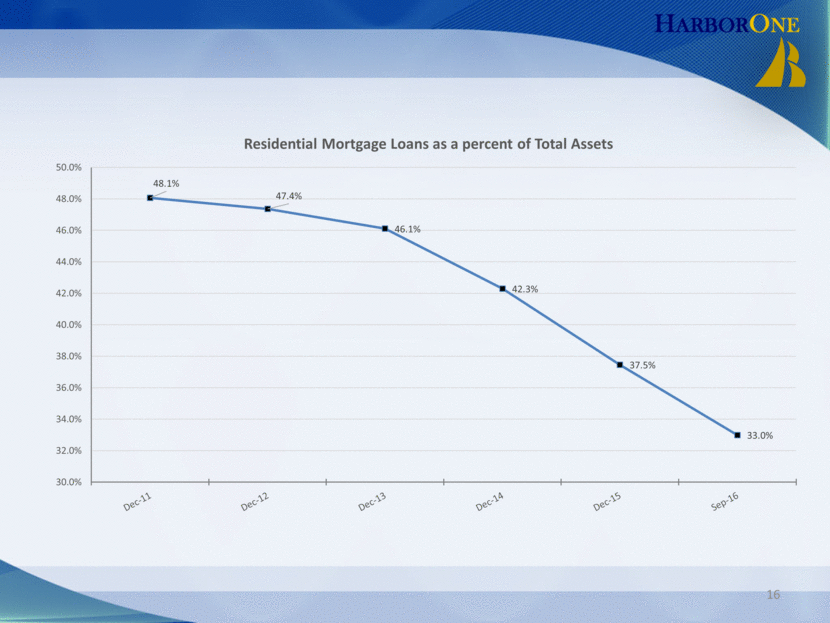
HARBORONE Residential Mortgage Loans as a percent of Total Assets 50.0% 48.0% 46.0% 44.0% 42.0% 40.0% 38.0% 36.0% 34.0% 32.0% 30.0% 48.1% 47.4% 46.1% 42.3% 37.5% 33.0% Dec-11 Dec-12 Dec-13 Dec-14 Dec-15 Sep-16 16 |
|
|
|
|
|
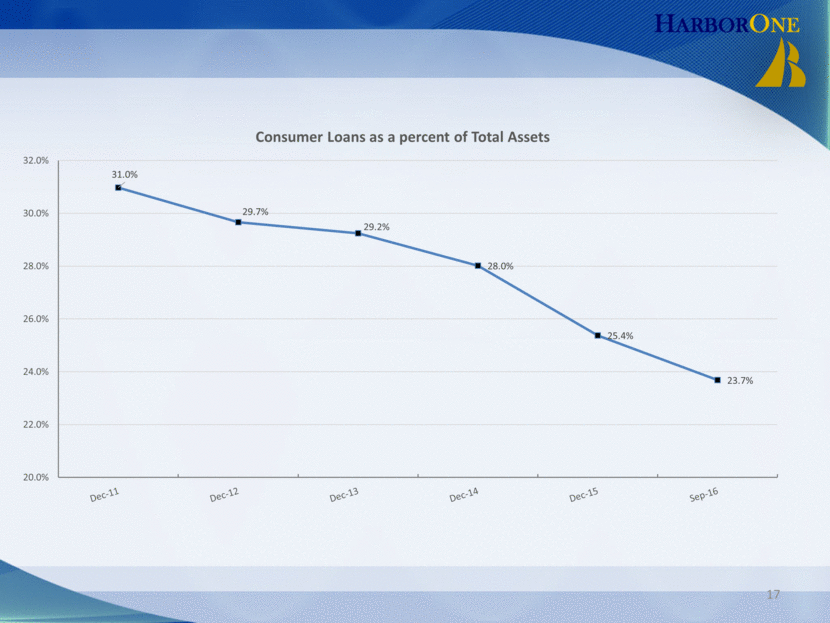
HARBORONE Consumer Loans as a percent of Total Assets 32.0% 30.0% 28.0% 26.0% 24.0% 22.0% 20.0% 31.0% 29.7% 29.2% 28.0% 25.4% 23.7% Dec-11 Dec-12 Dec-13 Dec-14 Dec-15 Sep-16 17 |
|
|
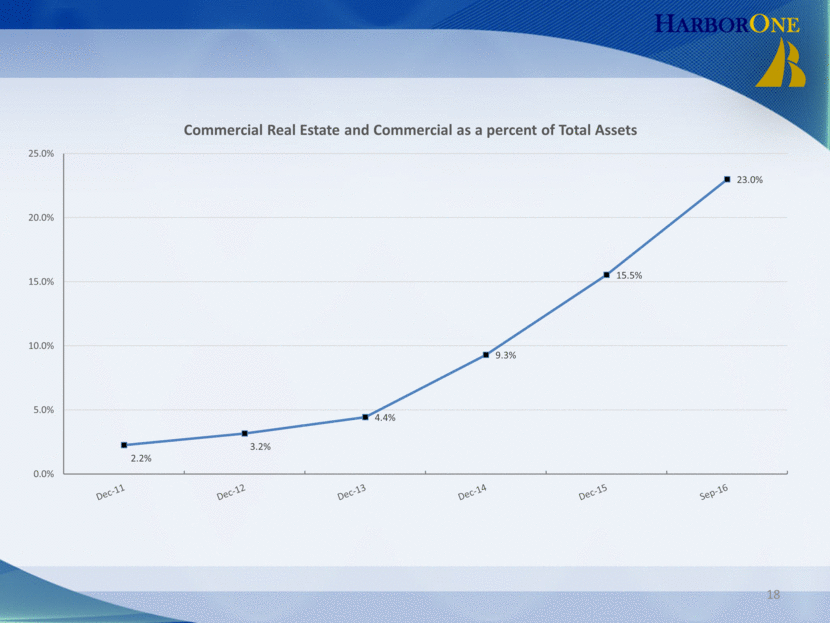
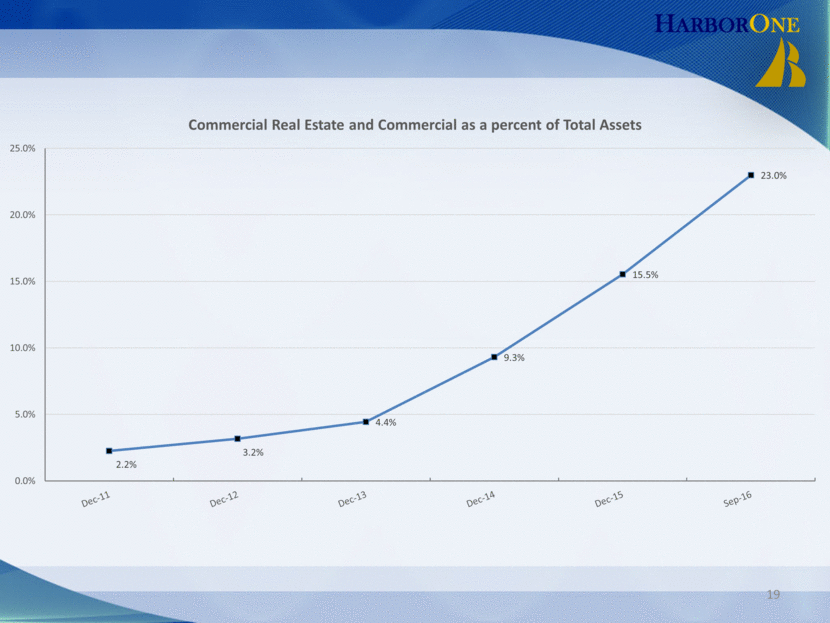
18 HarBorOne Commercial Real Estate and Commercial as a percent of Total Assets 25.0% 20.0% 15.0% 10.0% 5.0% 0.0% 2.2% 3.2% 4.4% 9.3% 15.5% 23.0% Dec-11 Dec-12 Dec-13 Dec-14 Dec-15 Sep-16 |
|
|
19 HarBorOne Commercial Real Estate and Commercial as a percent of Total Assets 25.0% 20.0% 15.0% 10.0% 5.0% 0.0% 2.2% 3.2% 4.4% 9.3% 15.5% 23.0% Dec-11 Dec-12 Dec-13 Dec-14 Dec-15 Sep-16 |
|
|
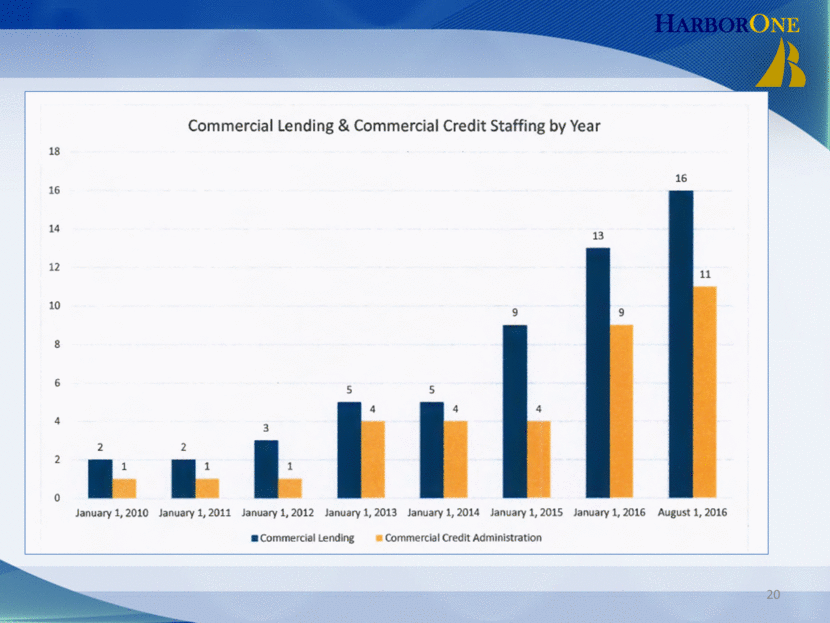
HARBORONE Commercial Lending & Commercial Credit Staffing by Year 0 2 4 6 8 10 12 14 16 18 2 1 21 31 5 4 5 4 9 4 13 9 16 11 January 1, 2010 January 1, 2011 January 1, 2012 January 1, 2013 January 1, 2014 January 1, 2015 January 1, 2016 August 1, 2016 Commercial Lending Commercial Credit Administration 20 |
|
|
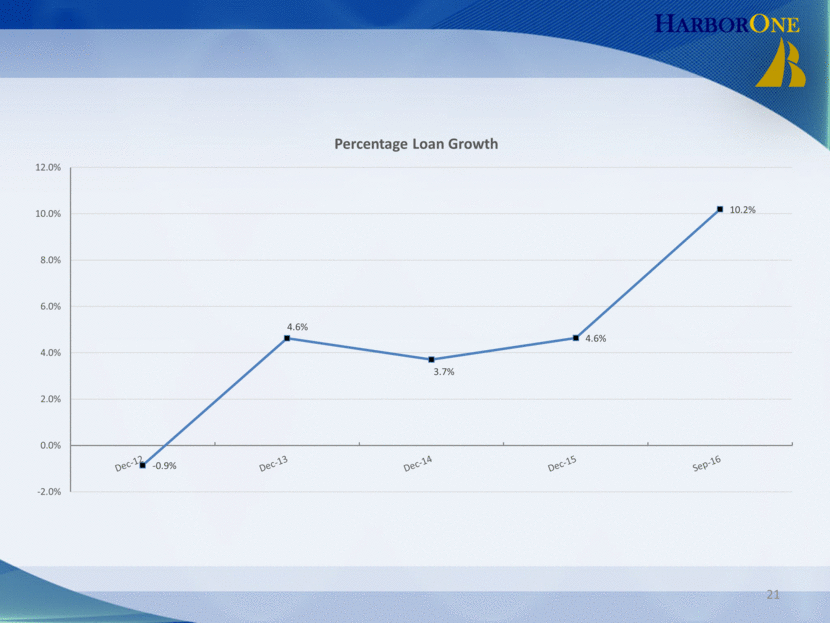
HARBORONE Percentage Loan Growth -2.0% 0.0% 2.0% 4.0% 6.0% 8.0% 10.0% 12.0% - 0.9% 4.6% 3.7% 4.6% 10.2% Dec-12 Dec-13 Dec-14 Dec-15 Sep-16 21 |
|
|
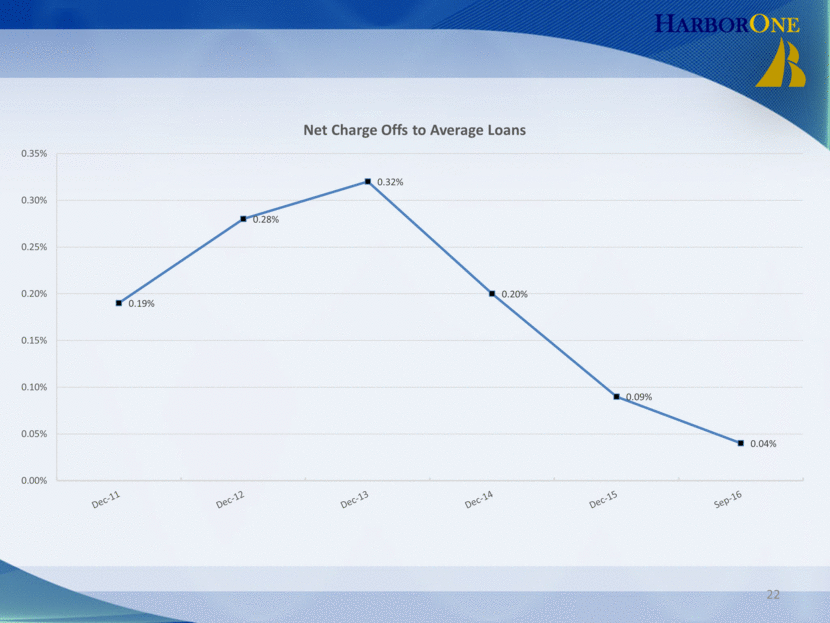
HARBORONE Net Charge Offs to Average Loans 0.35% 0.30% 0.25% 0.20% 0.15% 0.10% 0.05% 0.00% 0.19% 0.28% 0.32% 0.20% 0.09% 0.04% Dec-11 Dec-12 Dec-13 Dec-14 Dec-15 Sep-16 22 |
|
|
|
|
|
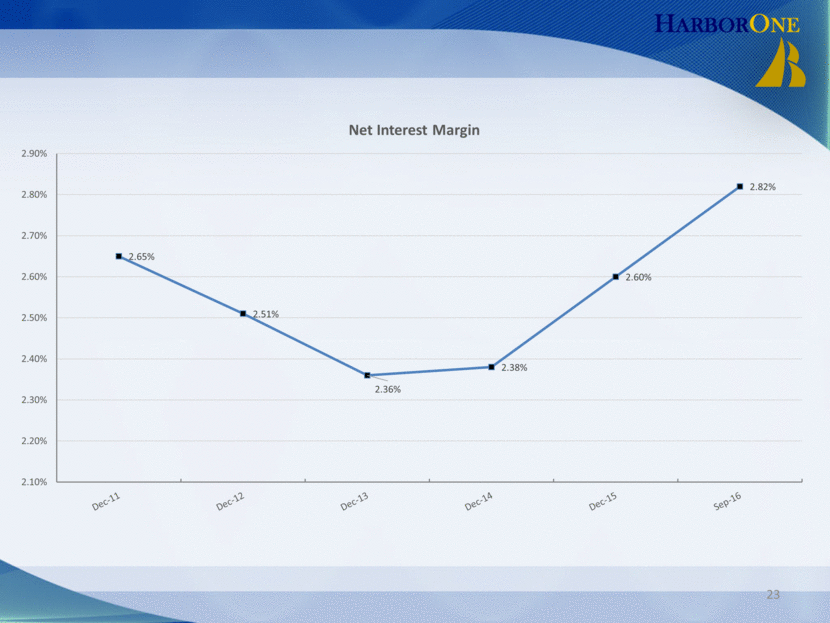
HARBORONE Net Interest Margin 2.90% 2.80% 2.70% 2.60% 2.50% 2.40% 2.30% 2.20% 2.10% 2.65% 2.51% 2.36% 2.38% 2.60% 2.82% Dec-11 Dec-12 Dec-13 Dec-14 Dec-15 Sep-16 23 |
|
|
|
|
|
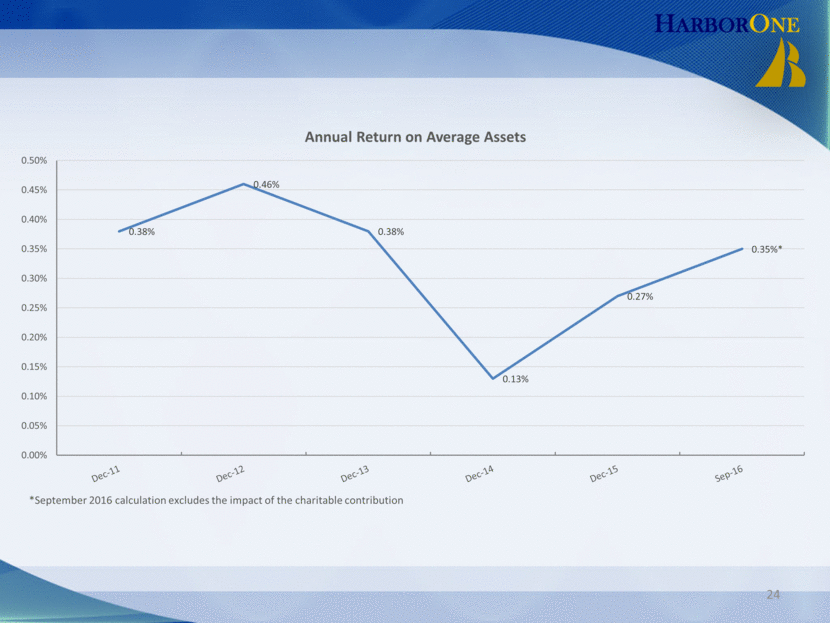
HARBORONE Annual Return on Average Assets 0.50% 0.45% 0.40% 0.35% 0.30% 0.25% 0.20% 0.15% 0.10% 0.05% 0.00% 0.38% 0.46% 0.38% 0.13% 0.27% 0.35%* Dec-11 Dec-12 Dec-13 Dec-14 Dec-15 Sep-16 *September 2016 calculation excludes the impact of the charitable contribution 24 |
|
|
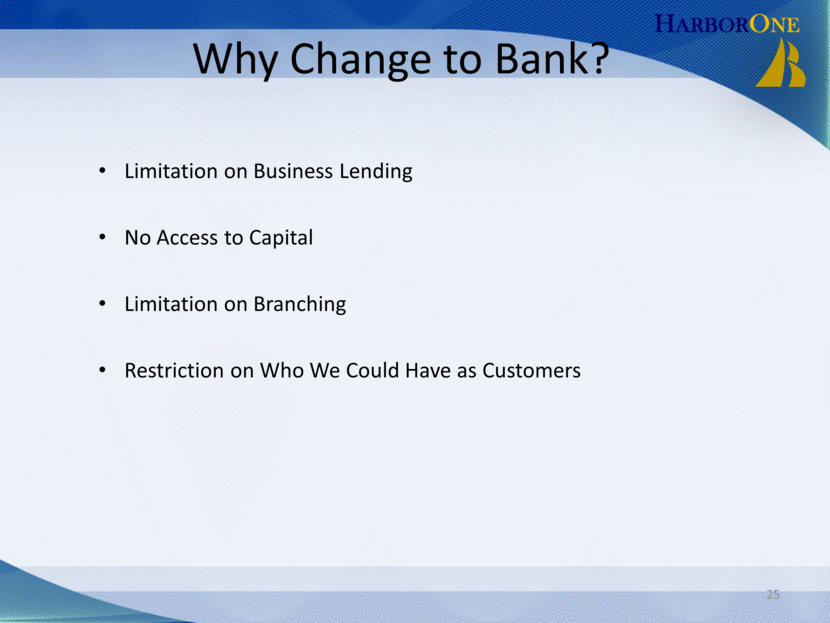
HARBORONE Why Change to Bank? Limitation on Business Lending No Access to Capital Limitation on Branching Restriction on Who We Could Have as Customers 25 |
|
|
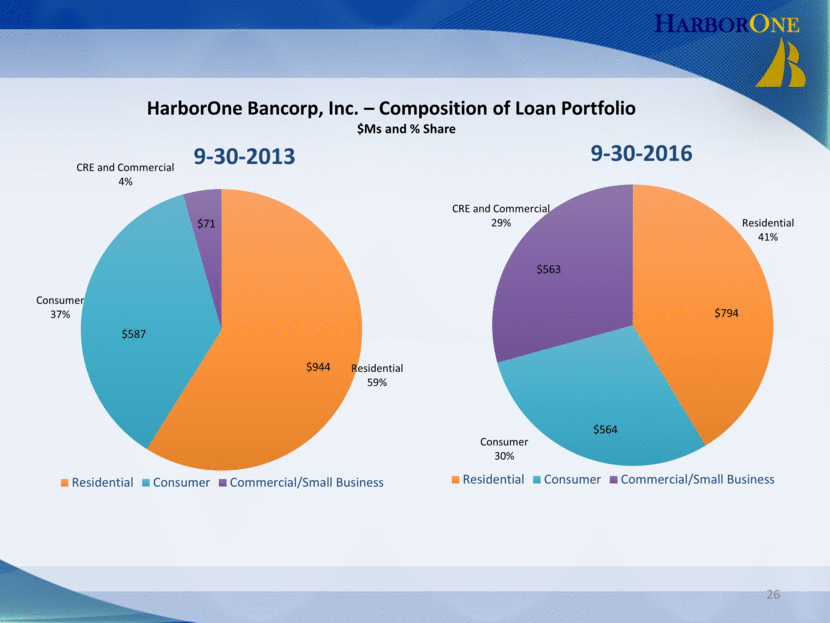
HarborOne Bancorp, Inc. – Composition of Loan Portfolio $Ms and % Share $587 $944 $71 $794 $563 $564 26 Residential 59% Consumer 37% CRE and Commercial 4% 9 - 30 - 2013 Residential Consumer Commercial/Small Business Residential 41% Consumer 30% CRE and Commercial 29% 9 - 30 - 2016 Residential Consumer Commercial/Small Business |
|
|
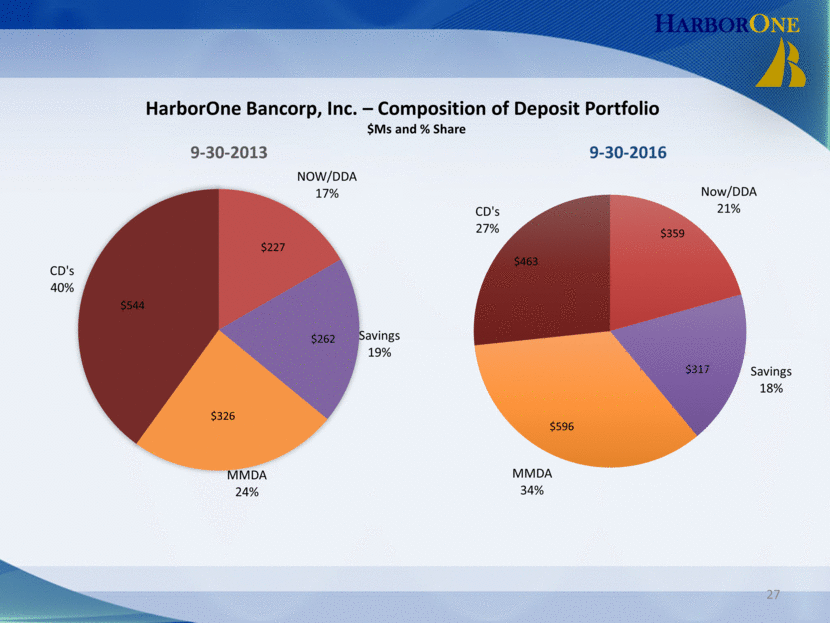
HarborOne Bancorp, Inc. – Composition of Deposit Portfolio $Ms and % Share $326 $262 $544 $227 $317 $359 $463 $596 27 NOW/DDA 17% Savings 19% MMDA 24% CD's 40% 9 - 30 - 2013 Now/DDA 21% Savings 18% MMDA 34% CD's 27% 9 - 30 – 2016 HARBORONE |
|
|
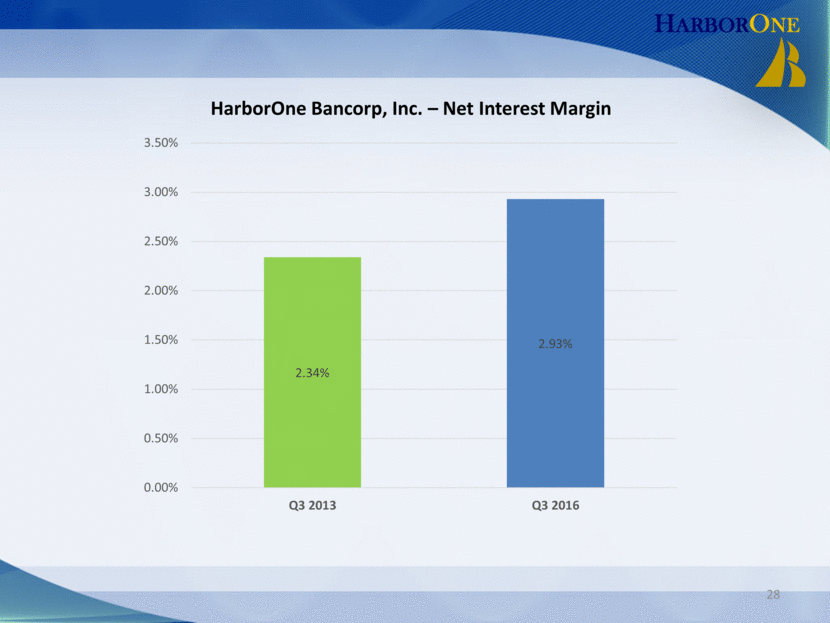
HarborOne Bancorp, Inc. – Net Interest Margin 28 2.34% 2.93% 0.00% 0.50% 1.00% 1.50% 2.00% 2.50% 3.00% 3.50% Q3 2013 Q3 2016 HARBORONE |
|
|
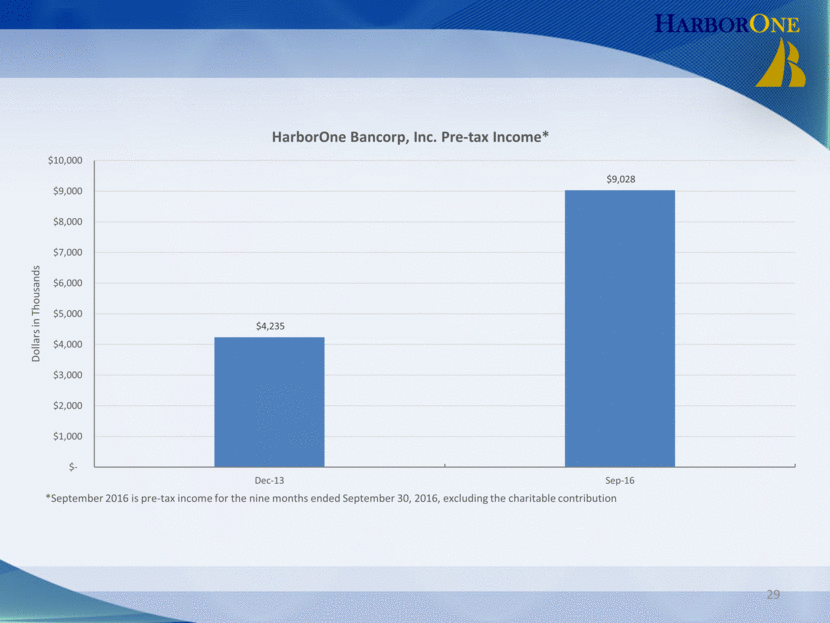
HARBORONE 29 $4,235 $9,028 $- $1,000 $2,000 $3,000 $4,000 $5,000 $6,000 $7,000 $8,000 $9,000 $10,000 Dec-13 Sep-16 Dollars in Thousands *September 2016 is pre - tax income for the nine months ended September 30, 2016, excluding the charitable contribution HarborOne Bancorp, Inc. Pre - tax Income* |
|
|
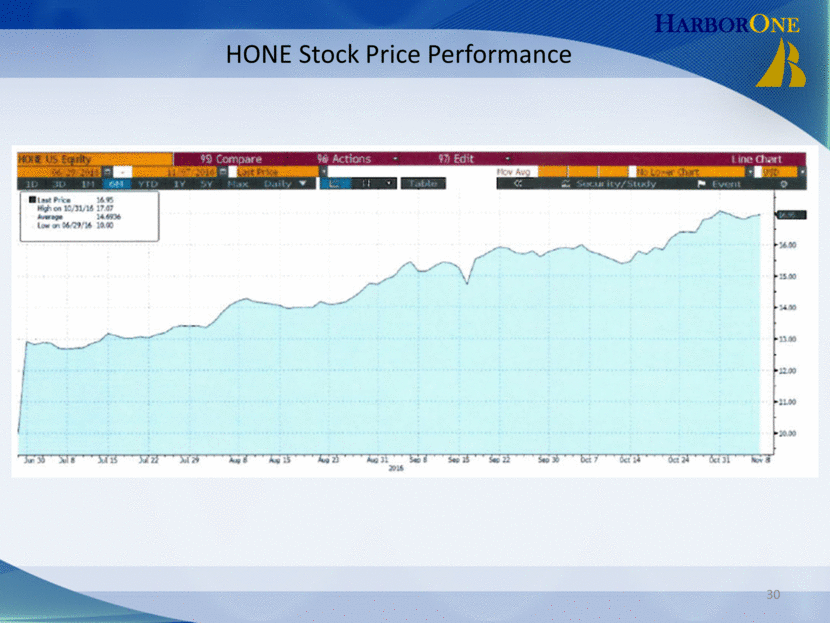
HarborOne Hone Stock Price Performance Home Us Equity 95) Compare 96) Actions 97) Edit 06/29/2016 11/07/2016 Last Price Mov Avg No Lower Chart USD 1D 3D 1M 0M YTD 1Y 5Y Max Daily Table CC Security/Study Event Last Price 16.95 High on 10/31/16 17.07 Average 14.6936 Low on 06/29/16 10.00 Jun 30 Jul 8 Jul 15 Jul 22 Jul 29 Aug 8 Aug 15 Aug 23 Aug 31 Sep 8 Sep 15 Sep 22 Sep 30 Oct 7 Oct 14 Oct 24 Oct 31 Nov 8 16.95 16.00 15.00 14.00 13.00 12.00 11.00 20.00 |
|
|
HarborOne 31 Questions? |

