Attached files
| file | filename |
|---|---|
| EX-99.1 - EX-99.1 - ARCH RESOURCES, INC. | a16-21308_1ex99d1.htm |
| 8-K - 8-K - ARCH RESOURCES, INC. | a16-21308_18k.htm |
Exhibit 99.2
Supplemental Information November 9, 2016

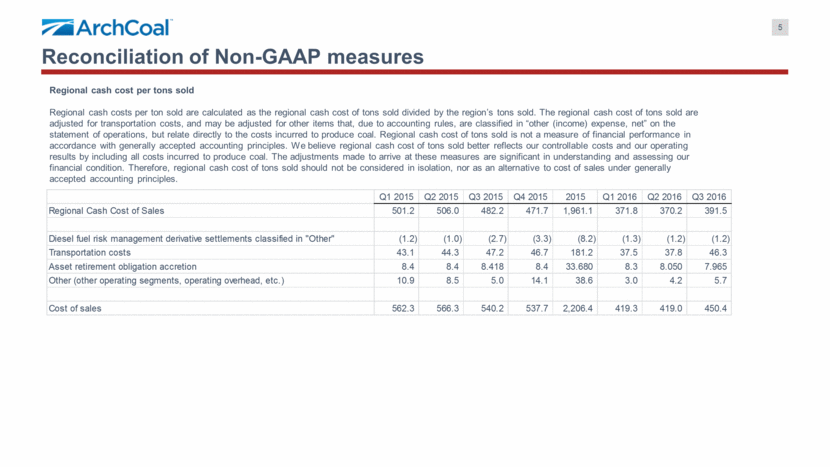
2 (1): Includes metallurgical and thermal coal mining complexes (2): Prior to restructuring, Arch included this non-cash reclamation charge in cash costs per ton Note: Reconciliation located at the end of this presentation REGIONAL PERFORMANCE (PER TON) (IN MILLIONS) Q1 2015 Q2 2015 Q3 2015 Q4 2015 2015 Q1 2016 Q2 2016 Q3 2016 Powder River Basin Tons sold (in millions) 28.5 25.5 29.5 25.0 108.5 16.5 15.6 22.8 Sales price per ton $13.48 $13.24 $13.07 $12.77 $13.15 $13.24 $13.08 $12.79 Cash cost per ton $10.77 $10.77 $9.91 $10.79 $10.54 $12.47 $11.72 $9.34 Cash margin per ton $2.71 $2.47 $3.16 $1.98 $2.61 $0.77 $1.36 $3.45 Appalachia (1) Tons sold (in millions) 3.0 3.1 3.0 2.8 11.9 2.8 2.7 2.9 Sales price per ton $65.23 $65.83 $62.24 $56.06 $62.47 $51.40 $52.62 $54.48 Cash cost per ton $51.59 $62.06 $48.13 $59.28 $55.26 $48.58 $56.46 $50.12 Cash margin per ton $13.64 $3.77 $14.11 ($3.22) $7.21 $2.82 ($3.84) $4.36 Bituminous Thermal Tons sold (in millions) 1.6 1.9 2.3 1.3 7.2 0.8 1.1 1.8 Sales price per ton $33.42 $30.37 $30.20 $30.32 $30.99 $32.55 $31.13 $28.92 Cash cost per ton $24.75 $19.93 $19.68 $25.50 $21.96 $35.08 $30.65 $17.48 Cash margin per ton $8.67 $10.44 $10.52 $4.82 $9.03 ($2.53) $0.48 $11.44 Arch Coal, Inc. Tons sold (in millions) 33.1 30.6 34.8 29.1 127.6 20.1 19.5 27.5 Sales price per ton $19.17 $19.66 $18.45 $17.76 $18.77 $19.38 $19.65 $18.30 Cash cost per ton $15.17 $16.55 $13.85 $16.14 $15.37 $18.46 $19.08 $14.23 Cash margin per ton $4.00 $3.10 $4.60 $1.62 $3.40 $0.92 $0.57 $4.07 Total Regional Cash Margin $132.4 $94.9 $160.0 $47.1 $434.6 $18.5 $11.1 $112.0 SG&A (22.6) (24.3) (25.7) (26.2) (98.8) (19.8) (19.0) (20.5) ARO Accretion (2) (8.4) (8.4) (8.4) (8.4) (33.7) (8.3) (8.0) (8.0) Liquidated Damages (13.0) (14.3) (13.0) (12.6) (52.9) (1.6) - - Other Income/(Expense) (6.5) (2.6) 21.9 (11.6) 1.2 1.2 7.6 (2.2) EBITDAR $81.8 $45.3 $134.8 ($11.8) $250.1 ($10.0) ($8.4) $81.4 Chapter 11 Period
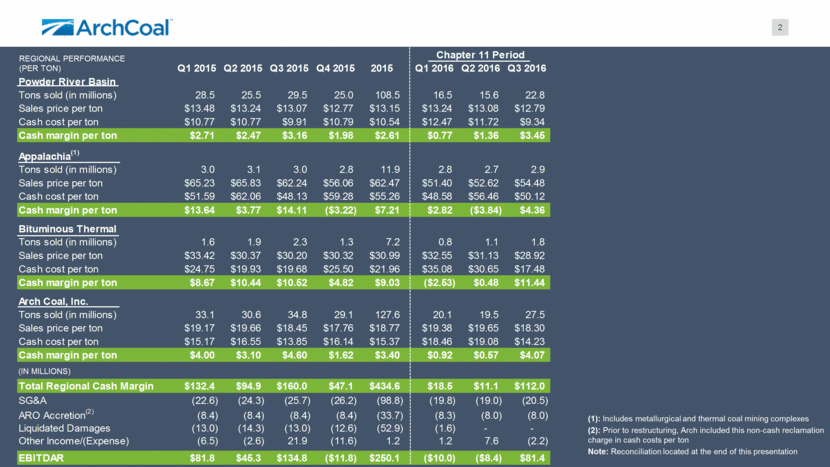
3 Arch’s proforma liquidity position at October 5 (1) Primarily consists of professional fees, exit collateral and cure payments Note: In addition to the bankruptcy exit payments made prior to or upon our emergence, we expect to make additional exit related payments totaling $77.7 million subsequent to emergence. The remaining payments primarily relate to exit collateral, professional fees, remaining settlement payments to general unsecured creditors, and cure payments. We expect a majority of the payments to be made by the end of 2016. ($ IN MILLIONS) Cash at 9/30 $512 Restructuring Exit Payments Additional First-Lien Adequate Protection (80) General Unsecured Creditor Settlement (23) Warrant Redemption (10) Other Exit Costs (1) (12) Cash at Emergence $387 Additional Restructuring Payments (78) Proforma Cash at Emergence $309 ($ IN MILLIONS)
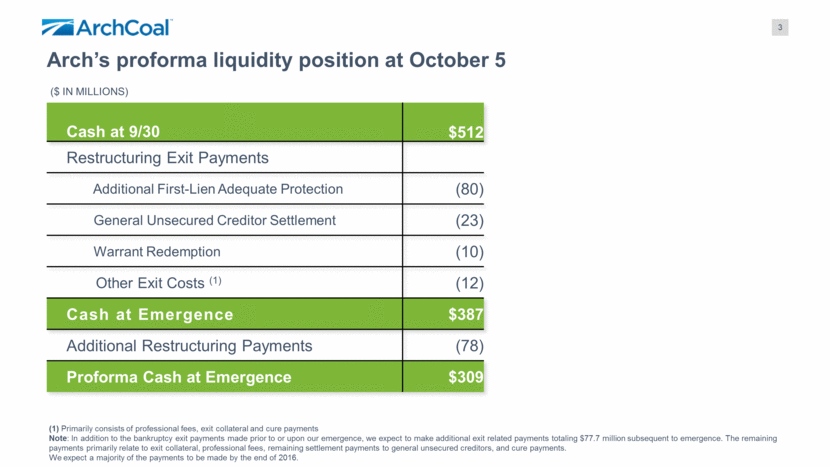
4 Reconciliation of Non-GAAP measures Included in the this presentation, we have disclosed certain non-GAAP measures as defined by Regulation G. The following reconciles these items to net income and cash flows as reported under GAAP. Adjusted EBITDAR condition. Therefore, Adjusted EBITDAR should not be considered in isolation, nor as an alternative to net income, income Adjusted EBITDAR is defined as net income attributable to the Company before the effect of net interest expense, income taxes, depreciation, depletion and amortization, the amortization of acquired sales contracts and reorganization items, net. Adjusted EBITDAR may also be adjusted for items that may not reflect the trend of future results. Adjusted EBITDAR is not a measure of financial performance in accordance with generally accepted accounting principles, and items excluded from Adjusted EBITDAR are significant in understanding and assessing our financial from operations, cash flows from operations or as a measure of our profitability, liquidity or performance under generally accepted accounting principles. We believe that Adjusted EBITDAR presents a useful measure of our ability to incur and service debt based on ongoing operations. Furthermore, analogous measures are used by industry analysts to evaluate our operating performance. In addition, acquisition related expenses are excluded to make results more comparable between periods. Investors should be aware that our presentation of Adjusted EBITDAR may not be comparable to similarly titled measures used by other companies. The table below shows how we calculate Adjusted EBITDAR. 2016 2015 2016 2015 Net loss (51,421) $ (1,999,476) $ (434,010) $ (2,280,774) $ Income tax (benefit) expense (3,270) (343,865) (4,626) (351,332) Interest expense, net 45,582 99,087 133,235 294,578 Depreciation, depletion and amortization 69,423 103,965 191,581 306,211 Amortization of acquired sales contracts, net 104 (1,994) (728) (7,028) Asset impairment and mine closure costs 46 2,120,292 129,267 2,139,438 Losses from disposed operations resulting from Patriot Coal bankruptcy - 149,314 - 149,314 Expenses related to debt restructuring - 7,482 2,213 11,498 Reorganization items, net 20,904 - 46,050 - Adjusted EBITDAR 81,368 $ 134,805 $ 62,982 $ 261,905 $ Three Months Ended September 30, Nine Months Ended September 30, (Unaudited) (Unaudited)
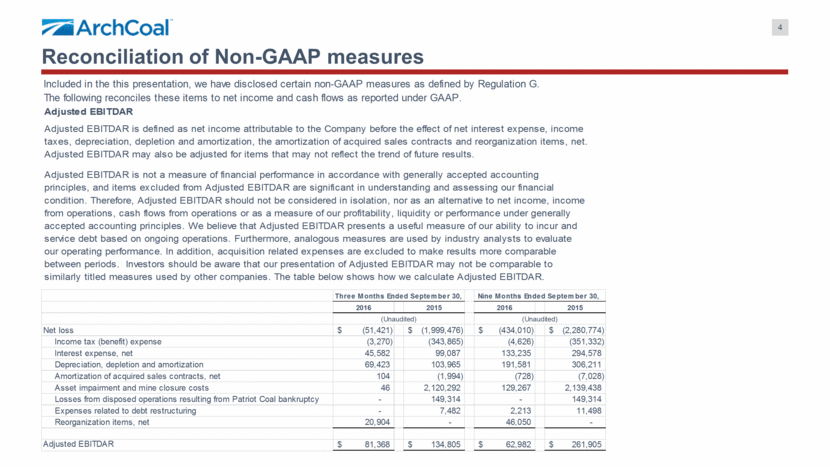
5 Reconciliation of Non-GAAP measures Regional cash cost per tons sold Regional cash costs per ton sold are calculated as the regional cash cost of tons sold divided by the region’s tons sold. The regional cash cost of tons sold are adjusted for transportation costs, and may be adjusted for other items that, due to accounting rules, are classified in “other (income) expense, net” on the statement of operations, but relate directly to the costs incurred to produce coal. Regional cash cost of tons sold is not a measure of financial performance in accordance with generally accepted accounting principles. We believe regional cash cost of tons sold better reflects our controllable costs and our operating results by including all costs incurred to produce coal. The adjustments made to arrive at these measures are significant in understanding and assessing our financial condition. Therefore, regional cash cost of tons sold should not be considered in isolation, nor as an alternative to cost of sales under generally accepted accounting principles. Q1 2015 Q2 2015 Q3 2015 Q4 2015 2015 Q1 2016 Q2 2016 Q3 2016 Regional Cash Cost of Sales 501.2 506.0 482.2 471.7 1,961.1 371.8 370.2 391.5 Diesel fuel risk management derivative settlements classified in "Other" (1.2) (1.0) (2.7) (3.3) (8.2) (1.3) (1.2) (1.2) Transportation costs 43.1 44.3 47.2 46.7 181.2 37.5 37.8 46.3 Asset retirement obligation accretion 8.4 8.4 8.418 8.4 33.680 8.3 8.050 7.965 Other (other operating segments, operating overhead, etc.) 10.9 8.5 5.0 14.1 38.6 3.0 4.2 5.7 Cost of sales 562.3 566.3 540.2 537.7 2,206.4 419.3 419.0 450.4
