Attached files
| file | filename |
|---|---|
| EX-32.2 - EXHIBIT 32.2 - CST BRANDS, INC. | cstq3-16exhibit322.htm |
| EX-32.1 - EXHIBIT 32.1 - CST BRANDS, INC. | cstq3-16exhibit321.htm |
| EX-31.2 - EXHIBIT 31.2 - CST BRANDS, INC. | cstq3-16exhibit312.htm |
| EX-31.1 - EXHIBIT 31.1 - CST BRANDS, INC. | cstq3-16exhibit311.htm |
UNITED STATES
SECURITIES AND EXCHANGE COMMISSION
WASHINGTON, D.C. 20549
FORM 10–Q
(Mark One) | |
þ | QUARTERLY REPORT PURSUANT TO SECTION 13 OR 15(d) OF THE SECURITIES EXCHANGE ACT OF 1934 |
For the quarterly period ended September 30, 2016
OR
o | TRANSITION REPORT PURSUANT TO SECTION 13 OR 15(d) OF THE SECURITIES EXCHANGE ACT OF 1934 |
For the transition period from _______________ to _______________ | |
Commission File No. 001-35743

CST BRANDS, INC.
(Exact name of registrant as specified in its charter)
Delaware (State or Other Jurisdiction of Incorporation or Organization) | 46-1365950 (I.R.S. Employer Identification No.) | |
19500 Bulverde Road
Suite 100
San Antonio, Texas
(Address of Principal Executive Offices)
78259
(Zip Code)
(210) 692-5000
(Registrant’s telephone number, including area code)
Indicate by check mark whether the registrant (1) has filed all reports required to be filed by Section 13 or 15(d) of the Securities Exchange Act of 1934 during the preceding 12 months (or for such shorter period that the registrant was required to file such reports), and (2) has been subject to such filing requirements for the past 90 days. Yes þ No ¨
Indicate by check mark whether the registrant has submitted electronically and posted on its corporate Web site, if any, every Interactive Data File required to be submitted and posted pursuant to Rule 405 of Regulation S-T (§232.405 of this chapter) during the preceding 12 months (or for such shorter period that the registrant was required to submit and post such files). Yes þ No ¨
Indicate by check mark whether the Registrant is a large accelerated filer, an accelerated filer, a non-accelerated filer, or a smaller reporting company. See the definitions of “large accelerated filer,” “accelerated filer” and “small reporting company” in Rule 12b-2 of the Exchange Act. (Check one):
Large accelerated filer þ | Accelerated filer o | Non-accelerated filer o (do not check if a smaller reporting company) | Smaller reporting company o |
Indicate by check mark whether the registrant is a shell company (as defined in Rule 12b-2 of the Exchange Act). Yes ¨ No þ
As of November 4, 2016, there were 75,691,878 common shares outstanding.
TABLE OF CONTENTS
PAGE | |
Commonly Used Defined Terms
The following is a list of certain acronyms and terms generally used in the industry and throughout this document: | |
CST Brands, Inc. and subsidiaries: | |
CST | CST Brands, Inc., a Delaware corporation, and, where appropriate in context, to one or more of CST’s subsidiaries without the inclusion or consolidation of the operations or subsidiaries of CrossAmerica. CST includes CST’s ownership of 100% of the equity interests in the sole member of CrossAmerica GP LLC, 100% of the outstanding IDRs of CrossAmerica and any common units of CrossAmerica owned by CST |
We, us, our, Company | The consolidated results and accounts of CST and CrossAmerica, or individually as the context implies |
CrossAmerica | CrossAmerica Partners LP, a Delaware limited partnership and, where appropriate in context, one or more of its subsidiaries, or all of them taken as a whole |
General Partner | CrossAmerica GP LLC, the General Partner of CrossAmerica |
CST Services | CST Services LLC |
Guarantor Subsidiaries | CST’s 100% owned, domestic subsidiaries |
CST Fuel Supply | CST Fuel Supply LP is the Parent of CST Marketing and Supply, CST’s wholesale motor fuel supply business, which provides wholesale fuel distribution to the majority of CST’s U.S. retail convenience stores on a fixed markup per gallon |
CrossAmerica Partners LP related and affiliated parties: | |
DMS | Dunne Manning Stores LLC (formerly known as Lehigh Gas-Ohio, LLC), an entity associated with Joseph V. Topper, Jr., a member of the Board of Directors and a related party. DMS is an operator of retail motor fuel stations. DMS leases retail sites from CrossAmerica in accordance with a master lease agreement with CrossAmerica and DMS purchases substantially all of its motor fuel for these sites from CrossAmerica on a wholesale basis under rack plus pricing |
Topstar | Topstar Enterprises, an entity associated with Joseph V. Topper, Jr. Topstar is an operator of convenience stores that leases retail site from CrossAmerica, but does not purchase fuel from CrossAmerica |
Recent Acquisitions: | |
PMI | Petroleum Marketers, Inc., acquired in April 2014 |
Erickson | Erickson Oil Products, Inc., acquired by CrossAmerica in February 2015 |
One Stop | M&J Operations, LLC, acquired in July 2015 |
Flash Foods | Flash Foods, LLC and other entities acquired from the Jones Company, a Georgia corporation, and certain other sellers in February 2016 |
Franchised Holiday Stores | The franchised Holiday stores acquired by CrossAmerica from S/S/G Corporation in March 2016 |
State Oil Assets | The assets acquired from State Oil Company in September 2016 |
Other Defined Terms: | |
Amended Omnibus Agreement | The Amended and Restated Omnibus Agreement, dated October 1, 2014, as amended on February 17, 2016 by and among CrossAmerica, the General Partner, Dunne Manning Inc., DMS, CST Services and Joseph V. Topper, Jr., which amends and restates the original omnibus agreement that was executed in connection with CrossAmerica’s initial public offering on October 30, 2012 |
ASC | Accounting Standards Codification |
ASU | Accounting Standards Update |
the Board of Directors | the Board of Directors of CST |
Brent | Brent crude oil |
the Conversion | The conversion of all outstanding subordinated units representing limited partner interests in CrossAmerica into common units on a one-for-one basis |
Couche-Tard | Alimentation Couche-Tard Inc. (TSX: ATD.A ATD.B) |
CPG | Cents per gallon |
DTW | Dealer tank wagon contracts, which are variable cent per gallon priced wholesale motor fuel distribution or supply contracts; DTW also refers to the pricing methodology under such contracts |
EBITDA | Earnings before interest, taxes, depreciation and amortization, a non-GAAP financial measure |
Exchange Act | Securities Exchange Act of 1934, as amended |
FASB | Financial Accounting Standards Board |
Form 10-K | CST’s Annual Report on Form 10-K for the year ended December 31, 2015 |
GCC | U.S. Gulf Coast conventional gasoline |
GP Purchase | CST’s purchase from Lehigh Gas Corporation of 100% of the equity interests in the sole member of Lehigh Gas GP LLC (the “General Partner”), the General Partner of Lehigh Gas Partners LP, a publicly traded limited partnership, now known as CrossAmerica Partners LP (NYSE:CAPL) |
IDRs | Incentive Distribution Rights, which are partnership interests on CrossAmerica’s common units that provide for special distributions associated with increasing distributions. CST is the owner of 100% of the outstanding IDRs of CrossAmerica |
IRS | Internal Revenue Service |
MD&A | Management’s Discussion and Analysis of Financial Condition and Results of Operations |
Merger | The merger of Ultra Acquisition Corp. with CST, with CST surviving the merger as a wholly owned subsidiary of Circle K Stores Inc. See Merger Agreement below |
Merger Agreement | Our Agreement and Plan of Merger (the “Merger Agreement”) entered into on August 21, 2016 with Circle K Stores Inc., a Texas corporation (“Parent”), and Ultra Acquisition Corp., a Delaware corporation and an indirect, wholly owned subsidiary of Parent (“Merger Sub”). Under and subject to the terms and conditions of the Merger Agreement, Merger Sub will be merged with and into CST, with CST surviving the Merger as a wholly owned subsidiary of Parent. Parent is a wholly owned subsidiary of Alimentation Couche-Tard Inc. |
NTI | Our new to industry stores in our U.S. Retail and Canadian Retail segments opened after January 1, 2008, which is generally when we began designing and operating our larger format stores that accommodate broader merchandise categories and food offerings and have more fuel dispensers than our legacy stores |
NYHC | New York Harbor conventional gasoline |
Rack | The price at which a wholesale distributor generally purchases motor fuel from an integrated oil company or refiner at the terminal |
Retail site | A general term to refer to convenience stores, including those operated by commission agents, independent dealers or lessee dealers and company-operated sites, as well as cardlock locations |
SEC | U.S. Securities and Exchange Commission |
Spin-off | The separation and distribution of the retail business from Valero’s other businesses and the creation of an independent publicly traded company, CST, on May 1, 2013, to hold the assets and liabilities associated with the retail business from and after the distribution |
U.S. GAAP | United States Generally Accepted Accounting Principles |
Valero | Valero Energy Corporation (NYSE: VLO) and, where appropriate in context, one or more of its subsidiaries, or all of them taken as a whole |
Valero Fuel Supply Agreements | The Branded Distributor Marketing Agreement, Petroleum Product Sale Agreement and Master Agreement CST entered into with Valero in connection with the spin-off for the supply of motor fuel for its U.S. operations, and all amendments thereto |
WTI | West Texas Intermediate crude oil |
PART I - FINANCIAL INFORMATION
ITEM 1. FINANCIAL STATEMENTS
CST BRANDS, INC.
CONSOLIDATED BALANCE SHEETS
(Millions of Dollars)
September 30, | December 31, | |||||||
2016 | 2015 | |||||||
ASSETS | (Unaudited) | |||||||
Current assets: | ||||||||
Cash (CrossAmerica: $3 and $1, respectively) | $ | 192 | $ | 314 | ||||
Restricted cash | 25 | — | ||||||
Accounts receivable, net of allowances of $1 and $1, at September 30, 2016 and December 31, 2015, respectively (CrossAmerica: $32 and $18, respectively) | 165 | 135 | ||||||
Inventories (CrossAmerica: $13 and $16, respectively) | 240 | 224 | ||||||
Prepaid taxes (CrossAmerica: $1 and $1, respectively) | 1 | 27 | ||||||
Prepaid expenses and other (CrossAmerica: $10 and $10, respectively) | 26 | 20 | ||||||
Total current assets | 649 | 720 | ||||||
Property and equipment, at cost (CrossAmerica: $815 and $738, respectively) | 3,467 | 3,010 | ||||||
Accumulated depreciation (CrossAmerica: $84 and $47, respectively) | (885 | ) | (786 | ) | ||||
Property and equipment, net (CrossAmerica: $731 and $691, respectively) | 2,582 | 2,224 | ||||||
Intangible assets, net (CrossAmerica: $329 and $340, respectively) | 368 | 359 | ||||||
Goodwill (CrossAmerica: $391 and $383, respectively) | 622 | 420 | ||||||
Deferred income taxes | 63 | 63 | ||||||
Other assets, net (CrossAmerica: $19 and $11, respectively) | 57 | 54 | ||||||
Total assets | $ | 4,341 | $ | 3,840 | ||||
LIABILITIES AND STOCKHOLDERS’ EQUITY | ||||||||
Current liabilities: | ||||||||
Current portion of debt and capital lease obligations (CrossAmerica: $3 and $9, respectively) | $ | 109 | $ | 139 | ||||
Accounts payable (CrossAmerica: $35 and $32, respectively) | 213 | 186 | ||||||
Accounts payable to Valero | 172 | 152 | ||||||
Accrued expenses (CrossAmerica: $15 and $16, respectively) | 82 | 71 | ||||||
Taxes other than income taxes (CrossAmerica: $11 and $10, respectively) | 61 | 42 | ||||||
Income taxes payable (CrossAmerica: $0 and $1, respectively) | 93 | 26 | ||||||
Dividends payable | — | 5 | ||||||
Total current liabilities | 730 | 621 | ||||||
Debt and capital lease obligations, less current portion (CrossAmerica: $506 and $431, respectively) | 1,356 | 1,317 | ||||||
Deferred income taxes (CrossAmerica: $53 and $54, respectively) | 252 | 186 | ||||||
Asset retirement obligations (CrossAmerica: $27 and $23, respectively) | 128 | 113 | ||||||
Other long-term liabilities (CrossAmerica: $49 and $19, respectively) | 89 | 58 | ||||||
Total liabilities | 2,555 | 2,295 | ||||||
Commitments and contingencies (Note 9) | ||||||||
Stockholders’ equity: | ||||||||
CST Brands, Inc. stockholders’ equity: | ||||||||
Common stock, 250,000,000 shares authorized at $0.01 par value; 77,849,780 and 77,749,964 shares issued as of September 30, 2016 and December 31, 2015, respectively | 1 | 1 | ||||||
Additional paid-in capital (APIC) | 621 | 627 | ||||||
Treasury stock, at cost: 2,159,699 and 2,134,198 common shares as of September 30, 2016 and December 31, 2015, respectively | (88 | ) | (87 | ) | ||||
Retained earnings | 696 | 399 | ||||||
Accumulated other comprehensive income (loss) (AOCI) | (18 | ) | (30 | ) | ||||
Total CST Brands, Inc. stockholders’ equity | 1,212 | 910 | ||||||
Noncontrolling interest | 574 | 635 | ||||||
Total stockholders’ equity | 1,786 | 1,545 | ||||||
Total liabilities and stockholders’ equity | $ | 4,341 | $ | 3,840 | ||||
See Condensed Notes to Consolidated Financial Statements.
5
CST BRANDS, INC.
CONSOLIDATED STATEMENTS OF INCOME
(Millions of Dollars, Except Share and per Share Amounts)
(Unaudited)
Three Months Ended September 30, | Nine Months Ended September 30, | |||||||||||||||
2016 | 2015 | 2016 | 2015 | |||||||||||||
Operating revenues(a) | $ | 2,908 | $ | 3,092 | $ | 8,256 | $ | 8,914 | ||||||||
Cost of sales(b) | 2,518 | 2,663 | 7,159 | 7,860 | ||||||||||||
Gross profit | 390 | 429 | 1,097 | 1,054 | ||||||||||||
Operating expenses: | ||||||||||||||||
Operating expenses | 214 | 191 | 633 | 567 | ||||||||||||
General and administrative expenses | 41 | 41 | 124 | 128 | ||||||||||||
Depreciation, amortization and accretion expense | 65 | 51 | 192 | 156 | ||||||||||||
Total operating expenses | 320 | 283 | 949 | 851 | ||||||||||||
Gain on sale of assets, net | 350 | 2 | 351 | 9 | ||||||||||||
Operating income | 420 | 148 | 499 | 212 | ||||||||||||
Other income (expense), net | (1 | ) | 2 | 13 | 6 | |||||||||||
Interest expense | (16 | ) | (15 | ) | (50 | ) | (44 | ) | ||||||||
Income before income tax expense | 403 | 135 | 462 | 174 | ||||||||||||
Income tax expense | 147 | 45 | 170 | 59 | ||||||||||||
Consolidated net income | 256 | 90 | 292 | 115 | ||||||||||||
Net loss (income) attributable to noncontrolling interests | 4 | (5 | ) | 14 | 9 | |||||||||||
Net income attributable to CST stockholders | $ | 260 | $ | 85 | $ | 306 | $ | 124 | ||||||||
Earnings per common share | ||||||||||||||||
Basic earnings per common share | $ | 3.42 | $ | 1.12 | $ | 4.03 | $ | 1.61 | ||||||||
Weighted-average common shares outstanding (in thousands) | 75,684 | 75,565 | 75,603 | 76,384 | ||||||||||||
Earnings per common share – assuming dilution | ||||||||||||||||
Diluted earnings per common share | $ | 3.41 | $ | 1.12 | $ | 4.02 | $ | 1.61 | ||||||||
Weighted-average common shares outstanding - assuming dilution (in thousands) | 76,221 | 75,903 | 76,053 | 76,724 | ||||||||||||
Dividends per common share | $ | — | $ | 0.0625 | $ | 0.1250 | $ | 0.1875 | ||||||||
Supplemental information: | ||||||||||||||||
(a) Includes excise taxes of: | $ | 608 | $ | 501 | $ | 1,756 | $ | 1,474 | ||||||||
(a) Includes revenues from fuel sales to related parties of: | $ | 69 | $ | 90 | $ | 193 | $ | 258 | ||||||||
(a) Includes income from rentals of: | $ | 16 | $ | 14 | $ | 47 | $ | 41 | ||||||||
(b) Includes expenses from fuel sales to related parties of: | $ | 67 | $ | 87 | $ | 187 | $ | 251 | ||||||||
(b) Includes expenses from rentals of: | $ | 5 | $ | 4 | $ | 15 | $ | 12 | ||||||||
See Condensed Notes to Consolidated Financial Statements.
6
CST BRANDS, INC.
CONSOLIDATED STATEMENTS OF COMPREHENSIVE INCOME
(Millions of Dollars)
(Unaudited)
Three Months Ended September 30, | Nine Months Ended September 30, | |||||||||||||||
2016 | 2015 | 2016 | 2015 | |||||||||||||
Consolidated net income | $ | 256 | $ | 90 | $ | 292 | $ | 115 | ||||||||
Other comprehensive income (loss): | ||||||||||||||||
Foreign currency translation adjustment | (5 | ) | (38 | ) | 12 | (81 | ) | |||||||||
Other comprehensive income (loss) before income taxes | (5 | ) | (38 | ) | 12 | (81 | ) | |||||||||
Income taxes related to items of other comprehensive income | — | — | — | — | ||||||||||||
Other comprehensive income (loss) | (5 | ) | (38 | ) | 12 | (81 | ) | |||||||||
Comprehensive income | 251 | 52 | 304 | 34 | ||||||||||||
Income (loss) attributable to noncontrolling interests | (4 | ) | 5 | (14 | ) | (9 | ) | |||||||||
Comprehensive income attributable to CST stockholders | $ | 255 | $ | 47 | $ | 318 | $ | 43 | ||||||||
See Condensed Notes to Consolidated Financial Statements.
7
CST BRANDS, INC.
CONSOLIDATED STATEMENTS OF CASH FLOWS
(Millions of Dollars)
(Unaudited)
Nine Months Ended September 30, | ||||||||
2016 | 2015 | |||||||
Cash flows from operating activities: | ||||||||
Consolidated net income | $ | 292 | $ | 115 | ||||
Adjustments to reconcile net income to net cash provided by operating activities: | ||||||||
Stock-based compensation expense | 13 | 14 | ||||||
Depreciation, amortization and accretion expense | 192 | 156 | ||||||
Gain on the sale of assets, net | (351 | ) | (9 | ) | ||||
Deferred income tax (benefit) expense | 55 | (36 | ) | |||||
Changes in working capital, net of acquisitions | 110 | 95 | ||||||
Other operating activities | — | 5 | ||||||
Net cash provided by operating activities | $ | 311 | $ | 340 | ||||
Cash flows from investing activities: | ||||||||
Capital expenditures | $ | (251 | ) | $ | (210 | ) | ||
Proceeds from sale of California and Wyoming stores | 408 | — | ||||||
Proceeds from California and Wyoming sale restricted for use | (25 | ) | — | |||||
Proceeds from the sale of assets | 2 | 24 | ||||||
CST acquisitions, net of cash acquired | (438 | ) | (22 | ) | ||||
CrossAmerica acquisitions, net of cash acquired | (94 | ) | (168 | ) | ||||
Other investing activities, net | — | 7 | ||||||
Net cash used in investing activities | $ | (398 | ) | $ | (369 | ) | ||
Cash flows from financing activities: | ||||||||
Borrowings under the CST revolving credit facility | $ | 402 | $ | — | ||||
Payments on the CST revolving credit facility | (412 | ) | — | |||||
Payments on the CST term loan facility | (50 | ) | (34 | ) | ||||
CST debt issuance costs | (1 | ) | — | |||||
Borrowings under the CrossAmerica revolving credit facility | 178 | 335 | ||||||
Payments on the CrossAmerica revolving credit facility | (82 | ) | (185 | ) | ||||
Proceeds from issuance of CrossAmerica common units, net | — | 145 | ||||||
CST repurchases of common shares | — | (65 | ) | |||||
CST purchases of CrossAmerica common units | — | (4 | ) | |||||
CrossAmerica repurchases of common units | (3 | ) | — | |||||
Payments of capital lease obligations | (3 | ) | (3 | ) | ||||
CST dividends paid | (15 | ) | (15 | ) | ||||
CrossAmerica distributions paid | (48 | ) | (41 | ) | ||||
Receivables repaid by CrossAmerica related parties | — | 2 | ||||||
Net cash provided by (used in) financing activities | (34 | ) | 135 | |||||
Effect of foreign exchange rate changes on cash | (1 | ) | (30 | ) | ||||
Net increase (decrease) in cash | (122 | ) | 76 | |||||
Cash at beginning of period | 314 | 368 | ||||||
Cash at end of period | $ | 192 | $ | 444 | ||||
See Condensed Notes to Consolidated Financial Statements.
8
CST BRANDS, INC.
CONDENSED NOTES TO CONSOLIDATED FINANCIAL STATEMENTS
Note 1. | DESCRIPTION OF BUSINESS AND OTHER DISCLOSURES |
Our Merger Agreement
On August 21, 2016, our Board of Directors unanimously approved, and we entered into, the Merger Agreement, under which, subject to the terms and conditions thereof, a U.S. subsidiary of Couche-Tard will acquire all of the shares of CST for $48.53 per share in cash, representing a total enterprise value of approximately $4.4 billion, including the assumption of net debt. The transaction is currently expected to close early calendar year 2017, subject to the approval of CST’s stockholders and regulatory approvals in the United States and Canada. On September 16, 2016, each of CST and Couche-Tard filed a premerger notification and report form under the Hart-Scott-Rodino Antitrust Improvements Act of 1976, as amended (the “HSR Act”), with the United States Federal Trade Commission (the “FTC”) and the Antitrust Division of the United States Department of Justice (the “Antitrust Division”) in connection with the Merger. Couche-Tard voluntarily withdrew its premerger notification and report form under the HSR Act on October 14, 2016, and re-filed its premerger notification and report form on October 17, 2016. As a result, the applicable waiting period under the HSR Act will expire on November 16, 2016 at 11:59 p.m. Eastern Time, unless otherwise earlier terminated or extended by the FTC and the Antitrust Division. As previously announced, we have scheduled a special meeting of its stockholders for November 16, 2016 to consider and vote on the transaction. ISS and Glass Lewis, two prominent proxy advisory firms, have recently issued their recommendations for a vote in favor of approving the Merger Agreement. See our Current Reports on Form 8-K filed with the SEC on August 23, 2016 and October 18, 2016, and our Definitive Proxy Statement filed with the SEC on October 11, 2016 for additional information.
Description of Business and Current Developments
CST is a holding company and conducts substantially all of its operations through its subsidiaries. CST was incorporated in Delaware in 2012, formed solely in contemplation of the spin-off and, prior to May 1, 2013, had not commenced operations and had no material assets, liabilities or commitments.
CST owns 100% of the equity interests of the sole member of the General Partner, 100% of the IDRs and 19.6% (as of September 30, 2016) of the outstanding limited partner units of CrossAmerica. CrossAmerica is a separate publicly traded Delaware master limited partnership. CST controls the General Partner and has the right to appoint all members of the board of directors of the General Partner. The General Partner is managed and operated by the executive officers of the General Partner, under the oversight of the board of directors of the General Partner. Therefore, we control the operations and activities of CrossAmerica even though we do not have a majority ownership of CrossAmerica’s outstanding limited partner units. As a result, under the guidance in ASC 810–Consolidation, CrossAmerica is a consolidated variable interest entity.
On a consolidated basis, we have three operating segments, U.S. Retail, Canadian Retail and CrossAmerica. The U.S. Retail, Canadian Retail and CrossAmerica segments are each managed as individual strategic business units. Each segment experiences different operating income margins due to certain unique operating characteristics, geographic supply and demand attributes, specific country and local regulatory environments, and is exposed to variability in gross profit from the volatility of crude oil prices. Our Canadian Retail segment also experiences variability from the volatility of foreign currency exchange rates.
Our U.S. Retail segment operations are substantially a company-owned and operated convenience store business. We generate profit on motor fuel sales, prepared foods and convenience merchandise and services (car wash, lottery, money orders, air/water/vacuum services, video and game rentals, and access to ATMs). Our retail sites are operated by company employees.
Our Canadian Retail segment includes company-owned and operated convenience stores, commission agents, independent dealers, cardlocks and business and home energy operations. We generate profit on motor fuel sales, and, at our company-owned and operated convenience stores, profit is also generated on prepared foods and convenience merchandise and services (similar to our U.S. Retail segment).
CrossAmerica is engaged in the wholesale distribution of motor fuels, the operation of convenience stores and the ownership and leasing of real estate used in the retail distribution of motor fuels. CrossAmerica’s operations are conducted entirely within the U.S.
Interim Financial Information
These unaudited financial statements have been prepared in accordance with U.S. GAAP for interim financial information and with the instructions to Form 10-Q and Article 10 of Regulation S-X of the Exchange Act. Accordingly, they do not include all of the information and notes required by U.S. GAAP for complete financial statements. In the opinion of management, all adjustments considered necessary for a fair presentation have been included. All such adjustments are of a normal recurring nature unless disclosed otherwise. Management believes that the disclosures made are adequate to keep the information presented from being
9
CST BRANDS, INC.
CONDENSED NOTES TO CONSOLIDATED FINANCIAL STATEMENTS
misleading. The financial statements contained herein should be read in conjunction with the consolidated and combined financial statements and notes thereto included in our Form 10-K. Financial information as of September 30, 2016 and for the three and nine months ended September 30, 2016 and 2015 included in the consolidated financial statements has been derived from our unaudited financial statements. Financial information as of December 31, 2015, has been derived from our audited financial statements and notes thereto as of that date.
Operating results for the three and nine months ended September 30, 2016 are not necessarily indicative of the results that may be expected for the year ending December 31, 2016. Our business exhibits seasonality due to our wholesale and retail sites being located in certain geographic areas that are affected by seasonal weather and temperature trends and associated changes in retail customer activity during different seasons. Historically, sales volumes and operating income have been highest in the second and third quarters (during the summer activity months) and lowest during the winter months in the first and fourth quarters.
Our effective income tax rates for the three and nine months ended September 30, 2016 were 36% and 37%, respectively, compared with 33% and 34% for the corresponding periods of 2015. CST’s effective tax rate differs from the federal statutory rate of 35% for 2016 primarily as a result of our consolidation of CrossAmerica, which had a loss that was not fully tax deductible. As a limited partnership, CrossAmerica is not subject to Federal and State income tax with the exception of its operations in its corporate subsidiaries. CST’s effective tax rate, excluding CrossAmerica, was 36% for the three and nine months ended September 30, 2016. CST’s effective tax rate differs from the federal statutory rate of 35% primarily due to state income taxes.
Reclassifications
Certain reclassifications were made to prior year amounts to conform to the current year presentation. Such reclassifications had no effect on net income or total equity.
Use of Estimates
The preparation of financial statements in conformity with U.S. GAAP requires management to make estimates and assumptions that affect the reported amounts of assets and liabilities at the date of the financial statements and the reported amounts of revenues and expenses during the reporting periods. Actual results and outcomes could differ from those estimates and assumptions. On an ongoing basis, management reviews its estimates based on currently available information. Changes in facts and circumstances could result in revised estimates and assumptions.
Significant Accounting Policies
There have been no material changes to our significant accounting policies.
New Accounting Pronouncements
In May 2014, the FASB issued ASU 2014-09—Revenue from Contracts with Customers (Topic 606), which results in comprehensive new revenue accounting guidance, requires enhanced disclosures to help users of financial statements better understand the nature, amount, timing, and uncertainty of revenue that is recognized, and develops a common revenue standard under U.S. GAAP and International Financial Reporting Standards. Specifically, the core principle of the guidance is that an entity should recognize revenue to depict the transfer of promised goods or services to customers in an amount that reflects the consideration to which the entity expects to be entitled in exchange for those goods and services. With the issuance of ASU 2015-14, which deferred the effective date by one year, this guidance is effective January 1, 2018. Early adoption is permitted, but no earlier than January 1, 2017. The guidance can be applied either retrospectively to each prior reporting period presented, or as a cumulative-effect adjustment as of the date of adoption. Management does not expect the adoption of this ASU to have a material impact on its consolidated financial statements.
In February 2016, the FASB issued ASU 2016-02—Leases (Topic 842). This standard modifies existing guidance for reporting organizations that enter into leases to increase transparency by recognizing lease assets and lease liabilities on the balance sheet and disclosing key information about leasing arrangements. ASU 2016-02 is effective for fiscal years and interim periods within those years beginning after December 15, 2018, and requires a modified retrospective approach to adoption. Early adoption is permitted. Management is currently evaluating the impact of this new guidance in addition to the timing of adoption.
In March 2016, the FASB issued ASU 2016-09—Compensation–Stock Compensation (Topic 718): Improvements to Employee Share-Based Payment Accounting. This standard is issued as part of a simplification initiative involving several aspects of the accounting for share-based payment transactions, including the income tax consequences, classification of awards as either equity or liabilities and classification on the statement of cash flows. ASU 2016-09 is effective for fiscal years and interim periods within those years beginning after December 15, 2016. The approach to adoption is dependent upon which amendments are applicable. Early adoption is permitted. Management is currently evaluating the impact of this new guidance in addition to the timing of adoption.
10
CST BRANDS, INC.
CONDENSED NOTES TO CONSOLIDATED FINANCIAL STATEMENTS
In August 2016, the FASB issued ASU 2016-15—Statement of Cash Flows (Topic 230): Classification of Certain Cash Receipts and Cash Payments. This standard provides additional guidance on the classification of eight specific cash flow issues with the objective of reducing the existing diversity in practice. ASU 2016-15 is effective for fiscal years and interim periods within those years beginning after December 15, 2017, and requires a modified retrospective approach to adoption. Management is currently evaluating the impact of this new guidance in addition to the timing of adoption.
Certain other new financial accounting pronouncements have become effective for our financial statements but the adoption of these pronouncements will not affect our financial position or results of operations, nor will they require any additional disclosures.
Concentration Risk
Valero supplied over 90% of the motor fuel purchased by our U.S. Retail and Canadian Retail segments for resale during all periods presented. Our retail segments purchased motor fuel from Valero totaling $1.5 billion and $1.7 billion for the three months ended September 30, 2016 and 2015, respectively, and $4.2 billion and $5.0 billion for the nine months ended September 30, 2016 and 2015, respectively.
CrossAmerica also supplies motor fuel to 43 of our convenience stores in the U.S. Retail segment. For more information regarding transactions with CrossAmerica, see Note 8.
No customers are individually material to our U.S. Retail and Canadian Retail segment operations. For the three and nine months ended September 30, 2016, CrossAmerica distributed approximately 16% and 17%, respectively, of its total wholesale distribution volumes to DMS and DMS accounted for approximately 25% and 27%, respectively, of CrossAmerica’s rental income, respectively. For more information regarding transactions with DMS, see Note 8.
For the three months ended September 30, 2016, CrossAmerica received 10% of its rental income from a third party dealer that operates certain of the sites acquired through the PMI and One Stop acquisitions.
Note 2. ACQUISITIONS AND DIVESTITURES
CST Acquisition of Flash Foods
On February 1, 2016, we closed on the acquisition of Flash Foods for approximately $425 million plus working capital, assets under construction and other closing adjustments. Flash Foods operates 165 Flash Foods-branded convenience stores located in Georgia and Florida (which sell Flash Foods-branded fuel), 21 branded quick service restaurants, a land bank of 15 real estate sites to build NTIs, on which we have completed the construction of 2 NTIs, a merchandise distribution company with a 90,000 square foot distribution center that it operates in Georgia and a fuel supply company with access to the Colonial and Plantation pipelines, leased storage and a company-owned transportation fleet.
The preliminary fair value of the assets acquired and liabilities assumed on the date of acquisition were as follows (in millions):
Current assets (excluding inventories) | $ | 13 | |
Inventories | 24 | ||
Property and equipment | 225 | ||
Intangibles | 26 | ||
Goodwill | 194 | ||
Current liabilities | (31 | ) | |
Asset retirement obligations | (13 | ) | |
Total consideration, net of cash acquired | 438 | ||
Net working capital | (7 | ) | |
Assets under construction | (6 | ) | |
Purchase price, net | $ | 425 | |
Operating revenues since the date of acquisition were $232 million and $599 million for the three and nine months ended September 30, 2016.
During the second quarter of 2016, the Company updated its appraisal of the acquired assets to include certain trademarks and tradenames, as well as to adjust the value of certain property and equipment based on additional information received. The result of these adjustments was to increase property and equipment by $16 million, recognize intangible assets of $26 million, and reduce
11
CST BRANDS, INC.
CONDENSED NOTES TO CONSOLIDATED FINANCIAL STATEMENTS
goodwill by $42 million. These adjustments resulted in a charge to depreciation and amortization expense of $3 million recorded during the second quarter of 2016. Additional immaterial adjustments were made during the third quarter of 2016 upon further management review of the valuation.
The fair value of property and equipment, which consisted of land, buildings and equipment, was based on a cost approach. The buildings and equipment are being depreciated on a straight-line basis, with estimated remaining useful lives of up to 30 years for the buildings and 1 to 20 years for equipment.
The intangibles, which consist of trademarks and tradenames, had a fair value of $22 million and was based on an income approach, with the fair value estimated to be the present value of incremental after-tax cash flows attributable solely to the trademarks and tradenames. The remaining $4 million of acquired intangibles consist of fuel supply agreements and pipeline shipping rights. The trademarks, tradenames and other intangible assets are being amortized on a straight-line basis over an estimated useful life of approximately 10 years.
Goodwill recorded is primarily attributable to expected synergies of the combined operations as well as an assembled workforce not eligible for recognition as an intangible asset. All of the goodwill is deductible for tax purposes and was assigned to our U.S. Retail segment.
Management is reviewing the valuation and confirming the result to determine the final purchase price allocation.
CrossAmerica Acquisition of State Oil Assets
On September 27, 2016, CrossAmerica closed on the acquisition of 57 controlled sites (56 fee sites and 1 leased site) and certain other assets of State Oil Company being operated as 55 lessee dealer accounts and 2 non-fuel tenant locations, as well as 25 independent dealer accounts located in the greater Chicago market for approximately $42 million, including working capital.
The preliminary fair value of the assets acquired and liabilities assumed on the date of acquisition were as follows (in millions):
Current assets (excluding inventories) | $ | 1 | |
Property and equipment | 35 | ||
Intangibles | 7 | ||
Other noncurrent assets | 3 | ||
Current liabilities | (1 | ) | |
Asset retirement obligations | (2 | ) | |
Other long-term liabilities | (1 | ) | |
Total consideration, net of cash acquired | $ | 42 | |
The $3 million fair value of the notes receivable, which is included within current and other noncurrent assets, was based on an income approach using relevant market participant assumptions.
The fair value of property and equipment, which consisted of land, buildings and equipment, was based on a cost approach. The buildings and equipment are being depreciated on a straight-line basis, with estimated remaining useful lives of 20 years for the buildings and 5 to 10 years for equipment.
The $5 million fair value of the wholesale fuel distribution rights included in intangibles was based on an income approach and management believes the level and timing of cash flows represent relevant market participant assumptions. The wholesale fuel distribution rights are being amortized on a straight-line basis over an estimated useful life of approximately 10 years.
The $2 million fair value of the wholesale fuel supply agreements was based on an income approach, and management believes the level and timing of cash flows represent relevant market participant assumptions. The wholesale fuel supply agreements are being amortized over an estimated useful life of approximately 10 years.
Management is reviewing the valuation and confirming the result to determine the final purchase price allocation.
12
CST BRANDS, INC.
CONDENSED NOTES TO CONSOLIDATED FINANCIAL STATEMENTS
CrossAmerica Acquisition of Franchised Holiday Stores
On March 29, 2016, CrossAmerica closed on the acquisition of 31 Franchised Holiday Stores and three company-operated liquor stores from S/S/G Corporation for approximately $52 million, including working capital. Of the 34 company-operated stores, 31 are located in Wisconsin and three are located in Minnesota.
The preliminary fair value of the assets acquired and liabilities assumed on the date of acquisition were as follows (in millions):
Inventories | $ | 4 | |
Property and equipment | 32 | ||
Intangibles | 8 | ||
Goodwill | 9 | ||
Asset retirement obligation | (1 | ) | |
Total consideration, net of cash acquired | $ | 52 | |
Operating revenues since the date of acquisition were $29 million and $58 million for the three and nine months ended September 30, 2016, respectively.
The fair value of inventory was estimated at retail selling price less estimated costs to sell and a reasonable profit allowance for the selling effort.
The fair value of property and equipment, which consisted of land, buildings and equipment, was based on a cost approach. The buildings and equipment are being depreciated on a straight-line basis, with estimated remaining useful lives of 20 years for the buildings and 5 to 10 years for equipment.
The fair value of intangible assets, which consisted primarily of $7 million of wholesale fuel distribution rights, was based on an income approach and management believes the level and timing of cash flows represent relevant market participant assumptions. The wholesale fuel distribution rights are being amortized on a straight-line basis over an estimated useful life of approximately 10 years.
Goodwill recorded was primarily attributable to the end-customer relationships not eligible for recognition as an intangible asset. Goodwill deductible for tax purposes amounted to $29 million.
Management is reviewing the valuation and confirming the result to determine the final purchase price allocation. The goodwill recorded was assigned to our CrossAmerica segment.
Finalization of Purchase Accounting associated with the CrossAmerica Acquisition of Erickson
In the first quarter of 2016, CrossAmerica recorded a $1 million receivable related to a working capital settlement as agreed to with the sellers, reducing net consideration and goodwill. No other adjustments were recorded in 2016 and CrossAmerica has finalized the purchase accounting for this acquisition.
Sale of Wholesale Fuel Supply Contracts to CrossAmerica
In February 2016, CST sold 21 independent dealer contracts and 11 subwholesaler contracts to CrossAmerica for $3 million.
CST Sale of California and Wyoming Assets
In July 2016, CST consummated the sale of all 79 stores in the California and Wyoming markets to 7-Eleven, Inc. and its wholly-owned subsidiary, SEI Fuel Services, Inc. (“Purchasers”) and recognized a gain of $347 million, or $220 million net of tax, which is included in our U.S. Retail segment. The closing purchase price for the transaction was $408 million plus adjustments for inventory and working capital. With the closing of this transaction, CST realized a deferred tax benefit from the completion of a like-kind exchange strategy with its acquisition of the Flash Foods properties in Georgia and Florida that closed on February 1, 2016. The sale resulted in income tax expense of $127 million, with $88 million recognized in current taxes payable and $39 million recognized in deferred income taxes. The divestiture will result in a permanent reduction to our minimum volume commitments contained in the Valero Fuel Supply Agreements. The Company used $297 million of the cash proceeds from the sale to repay borrowings under CST’s revolving credit facility. Additionally, in accordance with the asset purchase agreement, we were required to make deposits into an escrow account to secure certain of our obligations and indemnify the Purchasers against any preexisting environmental liabilities arising from the divested stations, which we classified as restricted cash on our consolidated
13
CST BRANDS, INC.
CONDENSED NOTES TO CONSOLIDATED FINANCIAL STATEMENTS
balance sheet. The balance in this account at September 30, 2016 was $25 million. See Note 8 for information on the payment to CrossAmerica related to its interest in CST Fuel Supply.
We determined that these properties did not meet the criteria under ASC 205-20—Discontinued Operations to be classified as discontinued operations because the disposal did not represent a strategic shift that will have a major effect on our operations and financial results or a significant component. Therefore, we have not separately presented the results of operations of these properties in our consolidated financial statements.
Pro Forma Results
CST’s pro forma results, giving effect to the 2016 and 2015 acquisitions and assuming an acquisition date of January 1, 2015 for each acquisition, would have been (in millions, except per share amounts):
Three Months Ended September 30, | Nine Months Ended September 30, | |||||||||||||||
2016 | 2015 | 2016 | 2015 | |||||||||||||
Total revenues | $ | 2,943 | $ | 3,401 | $ | 8,447 | $ | 9,959 | ||||||||
Net income attributable to CST stockholders | $ | 260 | $ | 90 | $ | 306 | $ | 139 | ||||||||
Net income per share - diluted | $ | 3.40 | $ | 1.18 | $ | 4.02 | $ | 1.80 | ||||||||
Note 3. INVENTORIES
Inventories consisted of the following (in millions):
September 30, | December 31, | |||||||
2016 | 2015 | |||||||
Convenience store merchandise | $ | 159 | $ | 139 | ||||
Motor fuel | 79 | 83 | ||||||
Supplies | 2 | 2 | ||||||
Inventories | $ | 240 | $ | 224 | ||||
The cost of convenience store merchandise and supplies is determined principally under the weighted-average cost method. We account for our motor fuel inventory in our U.S. Retail segment on the LIFO basis. As of September 30, 2016, the replacement cost (market value) of our U.S. motor fuel inventories exceeded their LIFO carrying amounts by approximately $4 million. As of December 31, 2015, the replacement cost (market value) of our U.S. motor fuel inventories equaled their LIFO carrying amount. We account for our motor fuel inventory in our Canadian Retail and CrossAmerica segments under the weighted-average cost method.
14
CST BRANDS, INC.
CONDENSED NOTES TO CONSOLIDATED FINANCIAL STATEMENTS
Note 4. PROPERTY AND EQUIPMENT
Property and equipment, net consisted of the following (in millions):
September 30, | December 31, | |||||||
2016 | 2015 | |||||||
Land | $ | 806 | $ | 710 | ||||
Buildings | 889 | 759 | ||||||
Equipment | 969 | 876 | ||||||
Land improvements and leasehold improvements | 375 | 323 | ||||||
Other(a) | 225 | 197 | ||||||
Asset retirement obligations | 89 | 78 | ||||||
Construction in progress | 114 | 67 | ||||||
Property and equipment, at cost | 3,467 | 3,010 | ||||||
Accumulated depreciation | (885 | ) | (786 | ) | ||||
Property and equipment, net | $ | 2,582 | $ | 2,224 | ||||
(a) Other property and equipment noted in the table above consists primarily of signage and other imaging assets and computer hardware and software.
Note 5. GOODWILL
Changes in goodwill during the nine months ended September 30, 2016 consisted of the following (in millions):
U.S. Retail Segment | Canadian Retail Segment | CrossAmerica | Consolidated | ||||||||||||
Balance at December 31, 2015 | $ | 35 | $ | 2 | $ | 383 | $ | 420 | |||||||
Acquisitions | 194 | — | 8 | 202 | |||||||||||
Balance at September 30, 2016 | $ | 229 | $ | 2 | $ | 391 | $ | 622 | |||||||
See Note 2 for additional information on the changes to goodwill.
15
CST BRANDS, INC.
CONDENSED NOTES TO CONSOLIDATED FINANCIAL STATEMENTS
Note 6. INTANGIBLE ASSETS
Intangible assets consisted of the following (in millions):
September 30, 2016 | December 31, 2015 | |||||||||||||||||||||||
Gross Amount | Accumulated Amortization | Net Carrying Amount | Gross Amount | Accumulated Amortization | Net Carrying Amount | |||||||||||||||||||
US Retail Segment: | ||||||||||||||||||||||||
Flash Foods trademarks/tradenames | $ | 22 | $ | (1 | ) | $ | 21 | $ | — | $ | — | $ | — | |||||||||||
Other(a) | 12 | (2 | ) | 10 | 8 | (1 | ) | 7 | ||||||||||||||||
US total | 34 | (3 | ) | 31 | 8 | (1 | ) | 7 | ||||||||||||||||
Canadian Retail Segment: | ||||||||||||||||||||||||
Customer lists(b) | 96 | (88 | ) | 8 | 92 | (80 | ) | 12 | ||||||||||||||||
Total CST | 130 | (91 | ) | 39 | 100 | (81 | ) | 19 | ||||||||||||||||
CrossAmerica: | ||||||||||||||||||||||||
Wholesale fuel supply contracts/rights | 401 | (79 | ) | 322 | 388 | (56 | ) | 332 | ||||||||||||||||
Below market leases | 12 | (7 | ) | 5 | 11 | (5 | ) | 6 | ||||||||||||||||
Other | 5 | (3 | ) | 2 | 6 | (4 | ) | 2 | ||||||||||||||||
Total CrossAmerica | 418 | (89 | ) | 329 | 405 | (65 | ) | 340 | ||||||||||||||||
CST consolidated total | $ | 548 | $ | (180 | ) | $ | 368 | $ | 505 | $ | (146 | ) | $ | 359 | ||||||||||
(a) | Other consists of fuel supply agreements, franchise agreements, pipeline shipping rights, licenses and permits. |
(b) | Our customer lists in our Canadian Retail segment are amortized on a straight-line basis over their remaining life. As these assets are recorded in the local currency, Canadian dollars, historical gross carrying amounts are translated at each balance sheet date, resulting in changes to historical amounts presented. |
16
CST BRANDS, INC.
CONDENSED NOTES TO CONSOLIDATED FINANCIAL STATEMENTS
Note 7. DEBT
Our balances for long-term debt and capital leases are as follows (in millions):
September 30, | December 31, | |||||||
2016 | 2015 | |||||||
CST debt and capital leases:(a) | ||||||||
$500 million revolving credit facility | $ | 50 | $ | 60 | ||||
Term loan due 2019 | 356 | 406 | ||||||
5.00% senior notes due 2023 | 550 | 550 | ||||||
Total CST outstanding debt | 956 | 1,016 | ||||||
Deferred financing fees | (12 | ) | (14 | ) | ||||
Capital leases | 12 | 14 | ||||||
Total CST debt and capital leases | $ | 956 | $ | 1,016 | ||||
CrossAmerica debt and capital leases:(b) | ||||||||
$550 million revolving credit facility | $ | 455 | $ | 358 | ||||
Other debt | 1 | 27 | ||||||
Total CrossAmerica outstanding debt | 456 | 385 | ||||||
Deferred financing fees | (5 | ) | (4 | ) | ||||
Capital leases | 58 | 59 | ||||||
Total CrossAmerica debt and capital leases | $ | 509 | $ | 440 | ||||
Total consolidated debt and capital lease obligations outstanding | $ | 1,465 | $ | 1,456 | ||||
Less current portion–CST | 106 | 130 | ||||||
Less current portion–CrossAmerica | 3 | 9 | ||||||
Consolidated debt and capital lease obligations, less current portion | $ | 1,356 | $ | 1,317 | ||||
(a) The assets of CST can only be used to settle the obligations of CST and creditors of CST have no recourse to the assets or general credit of CrossAmerica. CST has pledged its equity ownership in CrossAmerica to secure the CST Credit Facility.
(b) The assets of CrossAmerica can only be used to settle the obligations of CrossAmerica and creditors of CrossAmerica have no recourse to the assets or general credit of CST.
Financial Covenants and Interest Rate
On January 29, 2016, CST amended its Credit Facility to increase borrowing capacity from $300 million to $500 million and immediately drew $307 million under the amended Credit Facility to fund a portion of the Flash Foods acquisition and pay fees of $1 million associated with the amendment. The amended CST Credit Facility contains financial covenants (as defined in the credit agreement) consisting of (a) a maximum total lease adjusted leverage ratio set at 3.50 to 1.00, (b) a minimum fixed charge coverage ratio set at 1.30 to 1.00 and (c) limitations on capital expenditures. As of September 30, 2016, CST was in compliance with these covenants.
The CrossAmerica revolving credit facility requires CrossAmerica to maintain a total leverage ratio (as defined in the Credit Agreement) for the most recently completed four fiscal quarters of less than or equal to 5.00 to 1.00 and a consolidated interest coverage ratio (as defined in the Credit Agreement) of greater than or equal to 2.75 to 1.00. The total leverage ratio covenant is 5.00 to 1.00 for the two quarters following a material acquisition (as defined in the credit facility). As such, the total leverage ratio steps down to 4.50 to 1.00 on December 31, 2016 assuming there are no material acquisitions for the remainder of 2016. As of September 30, 2016, CrossAmerica was in compliance with these covenants.
Outstanding borrowings currently under the amended CST Credit Facility bear a weighted average interest rate of 2.28% as of September 30, 2016. Outstanding borrowings under CrossAmerica’s revolving credit facility bear a weighted average interest rate of 3.52% as of September 30, 2016.
As of September 30, 2016, approximately $444 million was available for future borrowings under the amended CST Credit Facility. As of September 30, 2016, approximately $57 million was available for future borrowings under CrossAmerica’s revolving credit facility.
17
CST BRANDS, INC.
CONDENSED NOTES TO CONSOLIDATED FINANCIAL STATEMENTS
CrossAmerica’s Renegotiation of Rocky Top Purchase Obligation
In connection with CrossAmerica’s Rocky Top acquisition in 2013, CrossAmerica entered into a deferred seller financing arrangement, which obligated CrossAmerica to purchase certain sites for an average $5 million per year beginning in 2016. In June 2016, CrossAmerica renegotiated the terms with the sellers, eliminating the deferred seller financing obligation and agreeing to terms of a new lease of the assets. However, because of the continuing involvement CrossAmerica has with the sites through the lease and sublease of the properties, CrossAmerica recorded the liability on its balance sheet at fair value on the date of the reclassification, which approximated its carrying value. During the second quarter of 2016, CrossAmerica reclassified the liability from debt and capital lease obligations to accrued expenses and other current liabilities and other noncurrent liabilities on the consolidated balance sheet.
Note 8. RELATED-PARTY TRANSACTIONS
We consider transactions with CrossAmerica to be with a related party and account for these transactions as entities under common control, all of which are eliminated upon consolidation.
Rent and Purchased Motor Fuel
CrossAmerica leases certain retail sites and sells motor fuel to the U.S. Retail segment operating the leased sites under a master fuel distribution agreement and a master lease agreement, each having initial 10-year terms. The fuel distribution agreement provides CrossAmerica with a fixed wholesale mark-up per gallon. The lease agreement is a triple net lease with an annual lease rate of 7.5% of the fair value of the leased property at inception. The U.S. Retail segment purchased motor fuel from CrossAmerica of approximately 21 million gallons during the three months ended September 30, 2016 and 2015 and approximately 60 million and 58 million gallons during the nine months ended September 30, 2016 and 2015, respectively. We incurred rent expense on retail sites leased from CrossAmerica of $4 million during the three months ended September 30, 2016 and 2015 and $13 million and $6 million during the nine months ended September 30, 2016 and 2015, respectively. Amounts payable to CrossAmerica totaled $3 million and $2 million at September 30, 2016 and December 31, 2015, respectively, related to these transactions.
CST Fuel Supply
CST Fuel Supply provides wholesale motor fuel distribution to the majority of CST’s U.S. Retail convenience stores on a fixed markup per gallon. CrossAmerica currently owns a 17.5% equity interest in CST Fuel Supply. CST records the monthly distributions to CrossAmerica in cost of sales, which is eliminated upon consolidation of CrossAmerica.
CST distributed $4 million and $12 million in cash to CrossAmerica during the three and nine months ended September 30, 2016, respectively, related to CrossAmerica’s equity ownership interests in CST Fuel Supply. CST distributed $4 million and $6 million in cash to CrossAmerica during the three and nine months ended September 30, 2015, respectively, related to its equity ownership interests in CST Fuel Supply.
Refund payment related to CST sale of California and Wyoming Assets
In July 2016, we provided a refund payment to CrossAmerica related to its 17.5% interest in CST Fuel Supply as a result of our sale of the California and Wyoming retail sites, to which CST Fuel Supply no longer supplies motor fuel. The purpose of the refund was to make CrossAmerica whole for the decrease in the value of its interest in CST Fuel Supply arising from sales volume decreases. The total purchase price refund we paid CrossAmerica, as approved by the independent conflicts committee of the board of directors of the General Partner and by the executive committee of our Board of Directors, was approximately $18 million.
Sale of Wholesale Fuel Supply Contracts to CrossAmerica
In February 2016, CST sold 21 independent dealer contracts and 11 subwholesaler contracts to CrossAmerica for $3 million.
Amended Omnibus Agreement
CST provides management and corporate support services to CrossAmerica and charged CrossAmerica $10 million and $8 million under the terms of the Amended Omnibus Agreement for these services during the nine months ended September 30, 2016 and 2015, respectively. CST charged non-cash stock-based compensation and incentive compensation costs to CrossAmerica of $3 million for the nine months ended September 30, 2016 and 2015. Receivables from CrossAmerica were $9 million at September 30, 2016 and December 31, 2015.
Effective January 1, 2016, the fixed billing component of the management fee under the Amended Omnibus Agreement was increased to $856,000 per month, which increase was approved by the executive committee of the Board of Directors and on behalf of CrossAmerica by the independent conflicts committee of the board of directors of the General Partner. CST and
18
CST BRANDS, INC.
CONDENSED NOTES TO CONSOLIDATED FINANCIAL STATEMENTS
CrossAmerica have the right to negotiate the amount of the management fee on an annual basis, or more often as circumstances require.
As approved by the independent conflicts committee of the board of directors of the General Partner and the executive committee of our Board of Directors, CrossAmerica and CST may mutually agree to settle, from time to time, the amounts due under the terms of the Amended Omnibus Agreement in newly issued common units representing limited partner interests in CrossAmerica. CrossAmerica issued the following common units to us as consideration for amounts due under the terms of the Amended Omnibus Agreement:
Period | Date of Issuance | Number of Units Issued | |||
Quarter ended December 31, 2015 | March 31, 2016 | 145,137 | |||
Quarter ended March 31, 2016 | May 9, 2016 | 83,218 | |||
Quarter ended June 30, 2016 | August 2, 2016 | 101,087 | |||
Quarter ended September 30, 2016 | October 27, 2016 | 110,824 | |||
IDR and Common Unit Distributions
CST received cash distributions related to its ownership of CrossAmerica’s IDRs and common units as follows (in millions):
Three Months Ended September 30, | Nine Months Ended September 30, | |||||||||||||||
2016 | 2015 | 2016 | 2015 | |||||||||||||
IDRs | $ | 1 | $ | — | $ | 2 | $ | 1 | ||||||||
Common unit distributions | 4 | 1 | 12 | 5 | ||||||||||||
Total | $ | 5 | $ | 1 | $ | 14 | $ | 6 | ||||||||
CrossAmerica Wholesale Motor Fuel Sales and Real Estate Rentals
Revenues from motor fuel sales and rental income from DMS were as follows (in millions):
Three Months Ended September 30, | Nine Months Ended September 30, | |||||||||||||||
2016 | 2015 | 2016 | 2015 | |||||||||||||
Revenues from motor fuel sales to DMS | $ | 68 | $ | 90 | $ | 193 | $ | 258 | ||||||||
Rental income from DMS | $ | 5 | $ | 6 | $ | 16 | $ | 17 | ||||||||
Receivables from DMS totaled $9 million and $7 million at September 30, 2016 and December 31, 2015, respectively.
Revenues from rental income from Topstar Enterprises was $0.2 million and $0.1 million for the three months ended September 30, 2016 and 2015, and $0.4 million and $0.3 million for the nine months ended September 30, 2016 and 2015, respectively.
CrossAmerica leases real estate from certain entities affiliated with Joseph V. Topper, Jr. Rent expense paid to these entities was $0.2 million for the three months ended September 30, 2016 and 2015 and $0.6 million and $0.7 million for the nine months ended September 30, 2016 and 2015, respectively.
Aircraft Usage Costs
From time to time, we lease, on a non-exclusive basis, an aircraft owned by an entity that is jointly owned by Kimberly S. Lubel, our Chief Executive Officer, President and Chairman of the Board of Directors and her husband, as previously approved in March 2015 by the Audit Committee of the Board of Directors. Lease costs incurred by us for use of this aircraft were $0.1 million for the nine months ended September 30, 2016 and were not significant for all other periods presented.
From time to time, we lease, on a non-exclusive basis, aircraft owned by a group of individuals that includes Joseph V. Topper, Jr. and John B. Reilly, III, members of CrossAmerica’s board of directors, as previously approved in August 2013 by the independent conflicts committee of the board of directors of the General Partner. Lease costs incurred by CrossAmerica for use of these aircraft were insignificant for the three and nine months ended September 30, 2016 and 2015.
19
CST BRANDS, INC.
CONDENSED NOTES TO CONSOLIDATED FINANCIAL STATEMENTS
Maintenance and Environmental Costs
Certain maintenance and environmental monitoring and remediation activities are provided by a related party of Joseph V. Topper, Jr. CrossAmerica incurred expenses with this related party of $0.3 million and $0.4 million for the three months ended September 30, 2016 and 2015 and $1.2 million and $1.1 million for the nine months ended September 30, 2016 and 2015, respectively.
CrossAmerica Principal Executive Offices
The CrossAmerica principal executive offices are in Allentown, Pennsylvania in office space leased from a related party of Joseph V. Topper, Jr. and John B. Reilly, III. Total rent expense for the office space was $0.2 million and $0.1 million for the three months ended September 30, 2016 and 2015 and $0.4 million and $0.2 million for the nine months ended September 30, 2016 and 2015, respectively.
Conversion of Subordinated Units
On February 25, 2016, all 7,525,000 outstanding subordinated units representing limited partner interests in CrossAmerica automatically converted into common units on a one-for-one basis.
Joseph V. Topper, Jr. and entities wholly owned and managed by Mr. Topper collectively owned 6,786,499 subordinated units and therefore received 6,786,499 common units as a result of the Conversion. CST may be deemed to have beneficial ownership of the 6,786,499 common units as a result of a voting agreement with Mr. Topper and his affiliates.
Note 9. COMMITMENTS AND CONTINGENCIES
We are from time to time party to various lawsuits, claims and other legal and administrative proceedings that arise in the ordinary course of business. These actions typically seek, among other things, compensation for alleged personal injury, breach of contract and/or property damages, environmental damages, infringement, indemnification, employment-related claims and damages, punitive damages, civil penalties or other losses, or injunctive or declaratory relief. With respect to all such lawsuits, claims and proceedings, we record a reserve when it is probable that a liability has been incurred and the amount of loss can be reasonably estimated. In addition, we disclose matters for which management believes a material loss is at least reasonably possible. None of these proceedings, separately or in the aggregate, are expected to have a material adverse effect on our consolidated financial position, results of operations or cash flows. In all instances, management has assessed the matter based on current information and made a judgment concerning its potential outcome, giving due consideration to the nature of the claim, the amount and nature of damages sought and the probability of success. Management’s judgment may prove materially inaccurate, and such judgment is made subject to the known uncertainties of litigation.
Four separate complaints have been filed by purported stockholders of CST commencing putative class action lawsuits challenging the Merger in the San Antonio Division of the United States District Court in the Western District of Texas. The first complaint, captioned Richard Malone v. CST Brands, Inc. et. al. (No. 5:16-cv-0955), was filed on September 26, 2016 and names as defendants CST and the directors of CST. That complaint alleges, among other things, that the defendants violated Sections 14(a) and 20(a) of the Exchange Act and Rule 14a-9 promulgated under the Exchange Act by filing or permitting to be filed a proxy statement that was allegedly materially incomplete and misleading. The second complaint, captioned Harry Savage v. CST Brands, Inc. et. al. (No. 5:16-cv-0968), was filed on September 29, 2016 and names as defendants CST, the directors of CST, Parent and Merger Sub. That complaint alleges, among other things, that the directors of CST breached their fiduciary duties by agreeing to an allegedly unfair price in an allegedly unfair process and that they violated Sections 14(a) and 20(a) of the Exchange Act by filing or permitting to be filed a proxy statement that was allegedly materially incomplete and misleading, and that Parent and Merger Sub allegedly aided and abetted their breaches of fiduciary duty. The third complaint, captioned Jacob Kempler Family Trust v. CST Brands, Inc. (No. 5:16-cv-00982), was filed on October 4, 2016 and names as defendants CST and the directors of CST. That complaint alleges, among other things, that the defendants violated Sections 14(a) and 20(a) of the Exchange Act and Rule 14a-9 promulgated under the Exchange Act by filing or permitting to be filed a proxy statement that was allegedly materially incomplete and misleading. The fourth complaint, captioned Patrick Zellner vs. CST Brands, Inc., et al. (No. 5:16-cv-01012-FB). That complaint alleges, among other things, that the defendants violated Sections 14(a) and 20(a) of the Exchange Act and Rule 14a-9 promulgated under the Exchange Act by filing or permitting to be filed a proxy statement that was allegedly materially incomplete and misleading. In each suit, the plaintiff seeks, among other things, injunctive relief enjoining completion of the merger, monetary damages and costs and attorneys’ fees. On October 11, 2016 a Motion for Preliminary Injunction was filed in the Malone litigation and briefings were completed by November 5, 2016. We believe these claims are without merit.
20
CST BRANDS, INC.
CONDENSED NOTES TO CONSOLIDATED FINANCIAL STATEMENTS
Note 10. FAIR VALUE MEASUREMENTS
Fair value is the price that would be received to sell an asset or paid to transfer a liability in an orderly transaction between market participants at the measurement date (exit price). U.S. GAAP specifies a three-level hierarchy that is used when measuring and disclosing fair value. The fair value hierarchy gives the highest priority to quoted prices available in active markets (i.e., observable inputs) and the lowest priority to data lacking transparency (i.e., unobservable inputs). An instrument’s categorization within the fair value hierarchy is based on the lowest level of significant input to its valuation. The following is a description of the three hierarchy levels.
Level 1—Unadjusted quoted prices in active markets that are accessible at the measurement date for identical, unrestricted assets or liabilities. Active markets are considered to be those in which transactions for the assets or liabilities occur in sufficient frequency and volume to provide pricing information on an ongoing basis.
Level 2—Quoted prices in markets that are not active, or inputs which are observable, either directly or indirectly, for substantially the full term of the asset or liability. This category includes quoted prices for similar assets or liabilities in active markets and quoted prices for identical or similar assets or liabilities in inactive markets.
Level 3—Unobservable inputs are not corroborated by market data. This category is comprised of financial and non-financial assets and liabilities whose fair value is estimated based on internally developed models or methodologies using significant inputs that are generally less readily observable from objective sources.
Transfers into or out of any hierarchy level are recognized at the end of the reporting period in which the transfers occurred. There were no transfers between any levels in 2016 or 2015.
Financial Instruments
The aggregate fair value and carrying amount of the CST senior notes, credit facility and term loan at September 30, 2016 and December 31, 2015 were $1.0 billion and $1.0 billion, respectively. The fair value of the CST term loan and credit facility approximate their carrying value due to the frequency with which interest rates are reset. The fair value of the CST senior notes is determined primarily using quoted prices of over-the-counter traded securities. These quoted prices are considered Level 1 inputs.
The fair value of CrossAmerica’s revolving credit facility approximated its carrying values of $455 million as of September 30, 2016 and $358 million as of December 31, 2015 due to the frequency with which interest rates are reset.
Note 11. EQUITY
CST Treasury Stock
For the nine months ended September 30, 2016, we withheld 42,623 shares of our common stock with a total fair value of $1.6 million in connection with withholding taxes related to the vesting of restricted stock and restricted stock units.
CST Dividends
We paid regular quarterly cash dividends of $0.0625 per CST common share each quarter, commencing with the quarter ended September 30, 2013 through the quarter ended June 30, 2016. Our indebtedness restricts our ability to pay dividends. The Merger Agreement also prohibits, among other things, us from declaring and paying quarterly cash dividends between August 21, 2016 and completion of our Merger. As such, there can be no assurance we will pay dividends in the future. Dividend activity for 2016 was as follows:
Quarter Ended | Record Date | Payment Date | Cash Distribution (per share) | Cash Distribution (in millions) | ||||||||
December 31, 2015 | December 31, 2015 | January 15, 2016 | $ | 0.0625 | $ | 5 | ||||||
March 31, 2016 | March 31, 2016 | April 15, 2016 | $ | 0.0625 | $ | 5 | ||||||
June 30, 2016 | June 30, 2016 | July 15, 2016 | $ | 0.0625 | $ | 5 | ||||||
21
CST BRANDS, INC.
CONDENSED NOTES TO CONSOLIDATED FINANCIAL STATEMENTS
CST Purchases of CrossAmerica Common Units
On September 21, 2015, CST announced that the independent executive committee of its Board of Directors approved a unit purchase program under Rule 10b-18 of the Exchange Act, authorizing CST to purchase up to an aggregate of $50 million of the common units representing limited partner interests in CrossAmerica. The unit purchase program does not have a fixed expiration date and may be modified, suspended or terminated at any time at CST’s discretion.
CST made no purchases under the unit purchase program during the nine months ended September 30, 2016. From inception until September 30, 2016, CST had purchased $20 million, or 804,667 common units, at an average price of $24.64 per common unit, which units cannot be transferred absent registration with the SEC or an available exemption from the SEC’s registration requirements.
CrossAmerica Distributions
Distribution activity for 2016 was as follows:
Quarter Ended | Record Date | Payment Date | Cash Distribution (per unit) | Cash Distribution (in millions) | ||||||||
December 31, 2015 | February 12, 2016 | February 24, 2016 | $ | 0.5925 | $ | 20 | ||||||
March 31, 2016 | May 19, 2016 | May 31, 2016 | $ | 0.5975 | $ | 20 | ||||||
June 30, 2016 | August 8, 2016 | August 15, 2016 | $ | 0.6025 | $ | 20 | ||||||
On October 24, 2016, the board of directors of the General Partner approved a quarterly distribution of $0.6075 per unit attributable to the third quarter of 2016. The distribution is payable on November 15, 2016 to all unitholders of record on November 4, 2016.
The amount of any distribution is subject to the discretion of the board of directors of the General Partner, which may modify or revoke CrossAmerica’s cash distribution policy at any time. CrossAmerica’s partnership agreement does not require CrossAmerica to pay any distributions. As such, there can be no assurance CrossAmerica will continue to pay distributions in the future.
CrossAmerica Common Unit Repurchase Program
In November 2015, the board of directors of the General Partner approved a common unit repurchase program under Rule 10b-18 of the Exchange Act authorizing CrossAmerica to repurchase up to an aggregate of $25 million of the common units representing limited partner interests in CrossAmerica. Under the program, CrossAmerica may make purchases in the open market in accordance with Rule 10b-18 of the Exchange Act, or in privately negotiated transactions, pursuant to a trading plan under Rule 10b5-1 of the Exchange Act or otherwise. Any purchases will be funded from available cash on hand. The common unit repurchase program does not require CrossAmerica to acquire any specific number of common units and may be suspended or terminated by CrossAmerica at any time without prior notice. The purchases will not be made from any officer, director or control person of CrossAmerica or CST. The following table shows the purchases during the nine months ended September 30, 2016:
Period | Total Number of Units Purchased | Average Price Paid per Unit | Total Cost of Units Purchased | Amount Remaining under the Program | |||||||||||
January 1 - March 31, 2016 | 112,492 | $ | 24.47 | $ | 2,752,240 | $ | 18,644,689 | ||||||||
April 1 - June 30, 2016 | 20,971 | $ | 23.86 | $ | 500,413 | $ | 18,144,276 | ||||||||
July 1 - September 30, 2016 | — | — | — | 18,144,276 | |||||||||||
January 1 - September 30, 2016 | 133,463 | $ | 24.37 | $ | 3,252,653 | $ | 18,144,276 | ||||||||
CrossAmerica did not repurchase any common units from October 1, 2016 through the date of this filing.
22
CST BRANDS, INC.
CONDENSED NOTES TO CONSOLIDATED FINANCIAL STATEMENTS
Accumulated Comprehensive Income (Loss)
Comprehensive income for a period encompasses net income and all other changes in equity other than from transactions with our stockholders. Foreign currency translation adjustments are the only component of our accumulated other comprehensive income. Our other comprehensive income or loss before reclassifications results from changes in the value of foreign currencies (the Canadian dollar) in relation to the U.S. dollar. Changes in foreign currency translation adjustments were as follows for the three and nine months ended September 30, 2016 and 2015 (in millions):
Three Months Ended September 30, | Nine Months Ended September 30, | |||||||||||||||
2016 | 2015 | 2016 | 2015 | |||||||||||||
Balance at the beginning of the period | $ | (13 | ) | $ | 34 | $ | (30 | ) | $ | 77 | ||||||
Other comprehensive income (loss) before reclassifications | (5 | ) | (38 | ) | 12 | (81 | ) | |||||||||
Amounts reclassified from other comprehensive income | — | — | — | — | ||||||||||||
Net other comprehensive income (loss) | (5 | ) | (38 | ) | 12 | (81 | ) | |||||||||
Balance at the end of the period | $ | (18 | ) | $ | (4 | ) | $ | (18 | ) | $ | (4 | ) | ||||
Note 12. EQUITY-BASED COMPENSATION
Overview
We record equity-based compensation as a component of operating expenses and general and administrative expenses in the consolidated statements of income.
We recognized equity-based compensation expense as follows (in millions):
Three Months Ended September 30, | Nine Months Ended September 30, | |||||||||||||||
2016 | 2015 | 2016 | 2015 | |||||||||||||
Equity-based compensation related to CST | $ | 2 | $ | 2 | $ | 10 | $ | 10 | ||||||||
Equity-based compensation related to CrossAmerica | 1 | 1 | 3 | 4 | ||||||||||||
Total equity-based compensation expense | $ | 3 | $ | 3 | $ | 13 | $ | 14 | ||||||||
During the nine months ended September 30, 2016, we recognized $4 million of equity-based compensation expense, of which $3 million was attributable to CST and $1 million was attributable to CrossAmerica, related to equity-based awards granted to employees who were retirement eligible at the date of grant. During the nine months ended September 30, 2015, we recognized $4 million of equity-based compensation expense, of which $2 million was attributable to CST and $2 million was attributable to CrossAmerica, related to equity-based awards granted to employees who were retirement eligible at the date of grant.
CrossAmerica Equity-Based Awards
The Partnership grants equity-based awards to employees of CST who perform services for the Partnership pursuant to the Amended Omnibus Agreement. As these grants may be settled in cash, unvested phantom units and vested and unvested profits interests receive fair value variable accounting treatment. As such, they are measured at fair value at each balance sheet reporting date and the cumulative compensation cost recognized is classified as a liability, which is included in accrued expenses and other current liabilities on the consolidated balance sheet. The balance of the accrual at September 30, 2016 and December 31, 2015 totaled $2 million and $3 million, respectively.
23
CST BRANDS, INC.
CONDENSED NOTES TO CONSOLIDATED FINANCIAL STATEMENTS
Note 13. EARNINGS PER COMMON SHARE
Earnings per common share are computed after adjustment for net income or loss attributable to noncontrolling interest; therefore, all earnings per common share information relates solely to CST common stockholders.
Earnings per common share were computed as follows (in millions, except shares outstanding, common equivalent shares and per share amounts):
Three Months Ended September 30, | ||||||||||||||||
2016 | 2015 | |||||||||||||||
Participating Awards | Common Stock | Participating Awards | Common Stock | |||||||||||||
Earnings per common share: | ||||||||||||||||
Net income attributable to CST stockholders | $ | 260 | $ | 85 | ||||||||||||
Less dividends declared: | ||||||||||||||||
Common stock | — | 5 | ||||||||||||||
Undistributed earnings | $ | 260 | $ | 80 | ||||||||||||
Weighted-average common shares outstanding (in thousands) | 383 | 75,684 | 369 | 75,565 | ||||||||||||
Earnings per common share | ||||||||||||||||
Distributed earnings | $ | — | $ | — | $ | 0.06 | $ | 0.06 | ||||||||
Undistributed earnings | 3.42 | 3.42 | 1.06 | 1.06 | ||||||||||||
Total earnings per common share | $ | 3.42 | $ | 3.42 | $ | 1.12 | $ | 1.12 | ||||||||
Earnings per common share - assuming dilution: | ||||||||||||
Net income attributable to CST stockholders | $ | 260 | $ | 85 | ||||||||
Weighted-average common shares outstanding (in thousands) | 75,684 | 75,565 | ||||||||||
Common equivalent shares: | ||||||||||||
Stock options (in thousands) | 288 | 102 | ||||||||||
Restricted stock (in thousands) | 2 | 95 | ||||||||||
Restricted stock units (in thousands) | 189 | 141 | ||||||||||
Market share units (in thousands) | 58 | — | ||||||||||
Weighted-average common shares outstanding - assuming dilution (in thousands) | 76,221 | 75,903 | ||||||||||
Earnings per common share - assuming dilution | $ | 3.41 | $ | 1.12 | ||||||||
24
CST BRANDS, INC.
CONDENSED NOTES TO CONSOLIDATED FINANCIAL STATEMENTS
Nine Months Ended September 30, | ||||||||||||||||
2016 | 2015 | |||||||||||||||
Participating Awards | Common Stock | Participating Awards | Common Stock | |||||||||||||
Earnings per common share: | ||||||||||||||||
Net income attributable to CST stockholders | $ | 306 | $ | 124 | ||||||||||||
Less dividends declared: | ||||||||||||||||
Common stock | 10 | 15 | ||||||||||||||
Undistributed earnings | $ | 296 | $ | 109 | ||||||||||||
Weighted-average common shares outstanding (in thousands) | 407 | 75,603 | 360 | 76,384 | ||||||||||||
Earnings per common share | ||||||||||||||||
Distributed earnings | $ | 0.12 | $ | 0.12 | $ | 0.18 | $ | 0.18 | ||||||||
Undistributed earnings | 3.91 | 3.91 | 1.43 | 1.43 | ||||||||||||
Total earnings per common share | $ | 4.03 | $ | 4.03 | $ | 1.61 | $ | 1.61 | ||||||||
Earnings per common share - assuming dilution: | ||||||||||||
Net income attributable to CST stockholders | $ | 306 | $ | 124 | ||||||||
Weighted-average common shares outstanding (in thousands) | 75,603 | 76,384 | ||||||||||
Common equivalent shares: | ||||||||||||
Stock options (in thousands) | 163 | 122 | ||||||||||
Restricted stock (in thousands) | 54 | 99 | ||||||||||
Restricted stock units (in thousands) | 174 | 119 | ||||||||||
Market share units (in thousands) | 59 | — | ||||||||||
Weighted-average common shares outstanding - assuming dilution (in thousands) | 76,053 | 76,724 | ||||||||||
Earnings per common share - assuming dilution | $ | 4.02 | $ | 1.61 | ||||||||
The table below presents securities that have been excluded from the computation of diluted earnings per share because they would have been anti-dilutive for the periods presented:
Three Months Ended September 30, | Nine Months Ended September 30, | |||||||||||
2016 | 2015 | 2016 | 2015 | |||||||||
Weighted-average anti-dilutive stock awards (in thousands) | 195 | 712 | 995 | 523 | ||||||||
Note 14. SEGMENT INFORMATION
We have three reportable segments: U.S. Retail, Canadian Retail and CrossAmerica. The U.S. Retail, Canadian Retail and CrossAmerica segments are managed separately as individual strategic business units. Each segment experiences different operating income margins due to certain unique operating characteristics, geographic supply and demand attributes, specific country and local regulatory environments, and is exposed to variability in gross profit from the volatility of crude oil prices. Operating revenues from our business and home energy operations were less than 5% of our operating revenues for each period presented and have been included within the Canadian Retail segment information.
Results that are not included in our reportable segments are included in the corporate category, which consist primarily of general and administrative costs. Management evaluates the performance of our CrossAmerica segment without considering the effects of the fair value adjustments to CrossAmerica’s historical account balances required under ASC 805—Business Combinations.
25
CST BRANDS, INC.
CONDENSED NOTES TO CONSOLIDATED FINANCIAL STATEMENTS
As a result, we have included a fair value column to reconcile to our consolidated results. The elimination column represents wholesale motor fuel supplied to our U.S. Retail segment from CrossAmerica, CrossAmerica’s income from CST Fuel Supply and rental income for retail sites owned by CrossAmerica and leased to our U.S. Retail segment.
The following table reflects activity related to our reportable segments (in millions):
U.S. Retail | Canadian Retail | CrossAmerica | Corporate | Eliminations | Fair value adjustments | Consolidated | ||||||||||||||||||||||
Three months ended September 30, 2016: | ||||||||||||||||||||||||||||
Operating revenues | $ | 1,637 | $ | 829 | $ | 442 | $ | — | $ | — | $ | — | $ | 2,908 | ||||||||||||||
Intersegment revenues | — | — | 47 | — | (47 | ) | — | — | ||||||||||||||||||||
Gross profit | 256 | 95 | 39 | — | — | — | 390 | |||||||||||||||||||||
Depreciation, amortization and accretion expense | 34 | 10 | 13 | — | — | 8 | 65 | |||||||||||||||||||||
Operating income (loss) | 418 | 35 | 16 | (41 | ) | — | (8 | ) | 420 | |||||||||||||||||||
Three months ended September 30, 2015: | ||||||||||||||||||||||||||||
Operating revenues | $ | 1,641 | $ | 865 | $ | 586 | $ | — | $ | — | $ | — | $ | 3,092 | ||||||||||||||
Intersegment revenues | — | — | 42 | — | (42 | ) | — | — | ||||||||||||||||||||
Gross profit | 286 | 92 | 52 | — | (1 | ) | — | 429 | ||||||||||||||||||||
Depreciation, amortization and accretion expense | 25 | 9 | 13 | — | — | 4 | 51 | |||||||||||||||||||||
Operating income (loss) | 136 | 32 | 25 | (41 | ) | — | (4 | ) | 148 | |||||||||||||||||||
U.S. Retail | Canadian Retail | CrossAmerica | Corporate | Eliminations | Fair value adjustments | Consolidated | ||||||||||||||||||||||
Nine months ended September 30, 2016: | ||||||||||||||||||||||||||||
Operating revenues | $ | 4,704 | $ | 2,314 | $ | 1,238 | $ | — | $ | — | $ | — | $ | 8,256 | ||||||||||||||
Intersegment revenues | — | — | 130 | — | (130 | ) | — | — | ||||||||||||||||||||
Gross profit | 706 | 274 | 117 | — | — | — | 1,097 | |||||||||||||||||||||
Depreciation, amortization and accretion expense | 98 | 30 | 41 | — | — | 23 | 192 | |||||||||||||||||||||
Operating income (loss) | 516 | 88 | 42 | (124 | ) | — | (23 | ) | 499 | |||||||||||||||||||
Nine months ended September 30, 2015: | ||||||||||||||||||||||||||||
Operating revenues | $ | 4,641 | $ | 2,627 | $ | 1,646 | $ | — | $ | — | $ | — | $ | 8,914 | ||||||||||||||
Intersegment revenues | — | — | 114 | — | (114 | ) | — | — | ||||||||||||||||||||
Gross profit | 648 | 276 | 131 | — | (1 | ) | — | 1,054 | ||||||||||||||||||||
Depreciation, amortization and accretion expense | 72 | 28 | 36 | — | — | 20 | 156 | |||||||||||||||||||||
Operating income (loss) | 227 | 88 | 45 | (128 | ) | — | (20 | ) | 212 | |||||||||||||||||||
26
CST BRANDS, INC.
CONDENSED NOTES TO CONSOLIDATED FINANCIAL STATEMENTS
Note 15. SUPPLEMENTAL CASH FLOW INFORMATION
In order to determine net cash provided by operating activities, net income is adjusted by, among other things, changes in current assets and current liabilities as follows (in millions):
Nine Months Ended September 30, | ||||||||
2016 | 2015 | |||||||
Decrease (increase): | ||||||||
Receivables, net | $ | (20 | ) | $ | 4 | |||
Inventories | 12 | 14 | ||||||
Prepaid expenses and other | (8 | ) | 4 | |||||
Increase (decrease): | ||||||||
Accounts payable | (6 | ) | 5 | |||||
Accounts payable to related parties | 8 | — | ||||||
Accounts payable to Valero | 16 | 19 | ||||||
Accrued expenses | 6 | 11 | ||||||
Taxes other than income taxes | 9 | 4 | ||||||
Income taxes payable | 93 | 34 | ||||||
Changes in working capital | $ | 110 | $ | 95 | ||||
The above changes in current assets and current liabilities may differ from changes between amounts reflected in the applicable balance sheets for the respective periods for the following reasons:
• | acquisitions; |
• | amounts accrued for capital expenditures are reflected in investing activities when such amounts are paid; and |
• | certain differences between balance sheet changes and the changes reflected above result from translating foreign currency denominated amounts at the applicable exchange rates as of each balance sheet date. |
Additionally, cash transactions between CST and CrossAmerica, including sales of CST Fuel Supply equity interests, IDR and common unit distributions, are eliminated from the statements of cash flows.
Cash flows related to interest and income taxes were as follows (in millions):
Nine Months Ended September 30, | ||||||||
2016 | 2015 | |||||||
Interest paid in excess of amount capitalized | $ | 39 | $ | 33 | ||||
Income taxes paid | $ | 21 | $ | 45 | ||||
Note 16. TERMINATION BENEFITS
A rollforward of our liability for severance and other termination benefits is as follows (in millions):
Balance at December 31, 2015 | $ | 9 | ||
Provision for termination benefits | 2 | |||
Termination benefits paid | (9 | ) | ||
Balance at September 30, 2016 | $ | 2 | ||
Note 17. GUARANTOR SUBSIDIARIES
The Guarantor Subsidiaries fully and unconditionally guarantee, on a joint and several basis, CST’s 5% senior notes due 2023. CrossAmerica is not a guarantor under CST’s 5% senior notes due 2023. The following consolidating schedules present financial information on a consolidated basis in conformity with the SEC’s Regulation S-X Rule 3–10(f):
27
CST BRANDS, INC.
CONDENSED NOTES TO CONSOLIDATED FINANCIAL STATEMENTS
CONSOLIDATING BALANCE SHEETS
(Millions of Dollars)
September 30, 2016 | |||||||||||||||||||||||||||||||
Parent Company | Guarantor Subsidiaries | Non-Guarantor Subsidiaries | CST Eliminations | Total CST | CrossAmerica | Eliminations | Total Consolidated | ||||||||||||||||||||||||
US | Canada | ||||||||||||||||||||||||||||||
ASSETS | |||||||||||||||||||||||||||||||
Current assets: | |||||||||||||||||||||||||||||||
Cash | $ | — | $ | 145 | $ | 44 | $ | — | $ | 189 | $ | 3 | $ | — | $ | 192 | |||||||||||||||
Restricted cash | — | 25 | — | — | 25 | — | — | 25 | |||||||||||||||||||||||
Receivables, net | 1 | 77 | 63 | — | 141 | 35 | (11 | ) | 165 | ||||||||||||||||||||||
Inventories | — | 171 | 56 | — | 227 | 13 | — | 240 | |||||||||||||||||||||||
Prepaid taxes | — | — | — | — | — | 1 | — | 1 | |||||||||||||||||||||||
Prepaid expenses and other | — | 10 | 6 | — | 16 | 10 | — | 26 | |||||||||||||||||||||||
Total current assets | 1 | 428 | 169 | — | 598 | 62 | (11 | ) | 649 | ||||||||||||||||||||||
Property and equipment, at cost | — | 2,105 | 548 | — | 2,653 | 815 | (1 | ) | 3,467 | ||||||||||||||||||||||
Accumulated depreciation | — | (605 | ) | (196 | ) | — | (801 | ) | (84 | ) | — | (885 | ) | ||||||||||||||||||
Property and equipment, net | — | 1,500 | 352 | — | 1,852 | 731 | (1 | ) | 2,582 | ||||||||||||||||||||||
Intangible assets, net | — | 31 | 8 | — | 39 | 329 | — | 368 | |||||||||||||||||||||||
Goodwill | — | 229 | 2 | — | 231 | 391 | — | 622 | |||||||||||||||||||||||
Investment in subsidiaries | 2,737 | — | — | (2,737 | ) | — | — | — | — | ||||||||||||||||||||||
Investment in CrossAmerica | — | 265 | — | — | 265 | — | (265 | ) | — | ||||||||||||||||||||||
Deferred income taxes | — | — | 63 | — | 63 | — | — | 63 | |||||||||||||||||||||||
Other assets, net | 11 | 22 | 5 | 38 | 20 | (1 | ) | 57 | |||||||||||||||||||||||
Total assets | $ | 2,749 | $ | 2,475 | $ | 599 | $ | (2,737 | ) | $ | 3,086 | $ | 1,533 | $ | (278 | ) | $ | 4,341 | |||||||||||||
Historical amounts for CrossAmerica were adjusted in consolidation with CST as a result of the GP Purchase as follows as of September 30, 2016: | |||||||||||||||||||||||||||||||
Property and equipment, net | $ | 52 | |||||||||||||||||||||||||||||
Intangibles, net | $ | 244 | |||||||||||||||||||||||||||||
Goodwill | $ | 302 | |||||||||||||||||||||||||||||
28
CST BRANDS, INC.
CONDENSED NOTES TO CONSOLIDATED FINANCIAL STATEMENTS
September 30, 2016 | |||||||||||||||||||||||||||||||
Parent Company | Guarantor Subsidiaries | Non-Guarantor Subsidiaries | CST Eliminations | Total CST | CrossAmerica | Eliminations | Total Consolidated | ||||||||||||||||||||||||
US | Canada | ||||||||||||||||||||||||||||||
LIABILITIES AND STOCKHOLDERS’ EQUITY | |||||||||||||||||||||||||||||||
Current liabilities: | |||||||||||||||||||||||||||||||
Current portion of debt and capital lease obligations | $ | 105 | $ | 1 | $ | — | $ | — | $ | 106 | $ | 3 | $ | — | $ | 109 | |||||||||||||||
Accounts payable | — | 142 | 39 | — | 181 | 43 | (11 | ) | 213 | ||||||||||||||||||||||
Accounts payable to Valero | (1 | ) | 97 | 76 | — | 172 | — | — | 172 | ||||||||||||||||||||||
Accrued expenses | 12 | 38 | 17 | — | 67 | 15 | — | 82 | |||||||||||||||||||||||
Taxes other than income taxes | — | 49 | 1 | — | 50 | 11 | — | 61 | |||||||||||||||||||||||
Income taxes payable | (1 | ) | 91 | 3 | — | 93 | — | — | 93 | ||||||||||||||||||||||
Total current liabilities | 115 | 418 | 136 | — | 669 | 72 | (11 | ) | 730 | ||||||||||||||||||||||
Debt and capital lease obligations, less current portion | 839 | 7 | 5 | — | 851 | 506 | (1 | ) | 1,356 | ||||||||||||||||||||||
Deferred income taxes | (1 | ) | 200 | — | — | 199 | 53 | — | 252 | ||||||||||||||||||||||
Intercompany payables (receivables) | 558 | (685 | ) | 127 | — | — | — | — | — | ||||||||||||||||||||||
Asset retirement obligations | — | 85 | 16 | — | 101 | 27 | — | 128 | |||||||||||||||||||||||
Other long-term liabilities | 12 | 14 | 14 | — | 40 | 49 | — | 89 | |||||||||||||||||||||||
Total liabilities | 1,523 | 39 | 298 | — | 1,860 | 707 | (12 | ) | 2,555 | ||||||||||||||||||||||
Commitments and contingencies | |||||||||||||||||||||||||||||||
Stockholders’ equity: | |||||||||||||||||||||||||||||||
Common stock | 1 | — | — | — | 1 | — | — | 1 | |||||||||||||||||||||||
APIC | 635 | 1,774 | 63 | (1,837 | ) | 635 | — | (14 | ) | 621 | |||||||||||||||||||||
Treasury stock | (88 | ) | — | — | — | (88 | ) | — | — | (88 | ) | ||||||||||||||||||||
Retained earnings | 696 | 662 | 238 | (900 | ) | 696 | — | — | 696 | ||||||||||||||||||||||
AOCI | (18 | ) | — | — | — | (18 | ) | — | — | (18 | ) | ||||||||||||||||||||
Partners’ capital | — | — | — | — | — | 826 | (826 | ) | — | ||||||||||||||||||||||
Noncontrolling interest | — | — | — | — | — | — | 574 | 574 | |||||||||||||||||||||||
Total stockholders’ equity | 1,226 | 2,436 | 301 | (2,737 | ) | 1,226 | 826 | (266 | ) | 1,786 | |||||||||||||||||||||
Total liabilities and stockholders’ equity | $ | 2,749 | $ | 2,475 | $ | 599 | $ | (2,737 | ) | $ | 3,086 | $ | 1,533 | $ | (278 | ) | $ | 4,341 | |||||||||||||
Deferred taxes and noncontrolling interest for CrossAmerica include $9 million and $589 million, respectively, related to the consolidation of CrossAmerica with CST as a result of the GP Purchase.
29
CST BRANDS, INC.
CONDENSED NOTES TO CONSOLIDATED FINANCIAL STATEMENTS
CONSOLIDATING BALANCE SHEETS
(Millions of Dollars)
December 31, 2015 | |||||||||||||||||||||||||||||||
Parent Company | Guarantor Subsidiaries | Non-Guarantor Subsidiaries | CST Eliminations | Total CST | CrossAmerica | Eliminations | Total Consolidated | ||||||||||||||||||||||||
US | Canada | ||||||||||||||||||||||||||||||
ASSETS | |||||||||||||||||||||||||||||||
Current assets: | |||||||||||||||||||||||||||||||
Cash | $ | — | $ | 66 | $ | 247 | $ | — | $ | 313 | $ | 1 | $ | — | $ | 314 | |||||||||||||||
Receivables, net | 2 | 61 | 54 | — | 117 | 22 | (4 | ) | 135 | ||||||||||||||||||||||
Inventories | — | 151 | 57 | — | 208 | 16 | — | 224 | |||||||||||||||||||||||
Prepaid taxes | — | 26 | — | — | 26 | 1 | — | 27 | |||||||||||||||||||||||
Prepaid expenses and other | — | 6 | 4 | — | 10 | 10 | — | 20 | |||||||||||||||||||||||
Total current assets | 2 | 310 | 362 | — | 674 | 50 | (4 | ) | 720 | ||||||||||||||||||||||
Property and equipment, at cost | — | 1,780 | 493 | — | 2,273 | 738 | (1 | ) | 3,010 | ||||||||||||||||||||||
Accumulated depreciation | — | (574 | ) | (165 | ) | — | (739 | ) | (47 | ) | — | (786 | ) | ||||||||||||||||||
Property and equipment, net | — | 1,206 | 328 | — | 1,534 | 691 | (1 | ) | 2,224 | ||||||||||||||||||||||
Intangible assets, net | — | 7 | 12 | — | 19 | 340 | — | 359 | |||||||||||||||||||||||
Goodwill | — | 35 | 2 | — | 37 | 383 | — | 420 | |||||||||||||||||||||||
Investment in subsidiaries | 1,939 | — | — | (1,939 | ) | — | — | — | — | ||||||||||||||||||||||
Investment in CrossAmerica | — | 271 | — | — | 271 | — | (271 | ) | — | ||||||||||||||||||||||
Deferred income taxes | — | — | 63 | — | 63 | — | — | 63 | |||||||||||||||||||||||
Other assets, net | 15 | 24 | 4 | — | 43 | 13 | (2 | ) | 54 | ||||||||||||||||||||||
Total assets | $ | 1,956 | $ | 1,853 | $ | 771 | $ | (1,939 | ) | $ | 2,641 | $ | 1,477 | $ | (278 | ) | $ | 3,840 | |||||||||||||
Historical amounts for CrossAmerica were adjusted in consolidation with CST as a result of the GP Purchase discussed in the Form 10-K for the year ended December 31, 2015. These adjustments were as follows: | |||||||||||||||||||||||||||||||
Property and equipment, net | $ | 62 | |||||||||||||||||||||||||||||
Intangibles, net | $ | 258 | |||||||||||||||||||||||||||||
Goodwill | $ | 302 | |||||||||||||||||||||||||||||
30
CST BRANDS, INC.
CONDENSED NOTES TO CONSOLIDATED FINANCIAL STATEMENTS
December 31, 2015 | |||||||||||||||||||||||||||||||
Parent Company | Guarantor Subsidiaries | Non-Guarantor Subsidiaries | CST Eliminations | Total CST | CrossAmerica | Eliminations | Total Consolidated | ||||||||||||||||||||||||
US | Canada | ||||||||||||||||||||||||||||||
LIABILITIES AND STOCKHOLDERS’ EQUITY | |||||||||||||||||||||||||||||||
Current liabilities: | |||||||||||||||||||||||||||||||
Current portion of debt and capital lease obligations | $ | 129 | $ | 1 | $ | — | $ | — | $ | 130 | $ | 9 | $ | — | $ | 139 | |||||||||||||||
Accounts payable | 2 | 105 | 68 | (17 | ) | 158 | 32 | (4 | ) | 186 | |||||||||||||||||||||
Accounts payable to Valero | (1 | ) | 92 | 61 | — | 152 | — | — | 152 | ||||||||||||||||||||||
Accrued expenses | 5 | 35 | 15 | — | 55 | 16 | — | 71 | |||||||||||||||||||||||
Taxes other than income taxes | — | 31 | 1 | — | 32 | 10 | — | 42 | |||||||||||||||||||||||
Income taxes payable | — | 3 | 5 | 17 | 25 | 1 | — | 26 | |||||||||||||||||||||||
Dividends payable | 5 | — | — | — | 5 | — | — | 5 | |||||||||||||||||||||||
Total current liabilities | 140 | 267 | 150 | — | 557 | 68 | (4 | ) | 621 | ||||||||||||||||||||||
Debt and capital lease obligations, less current portion | 874 | 8 | 5 | — | 887 | 431 | (1 | ) | 1,317 | ||||||||||||||||||||||
Deferred income taxes | — | 132 | — | — | 132 | 54 | — | 186 | |||||||||||||||||||||||
Intercompany payables (receivables) | (9 | ) | (353 | ) | 362 | — | — | — | — | — | |||||||||||||||||||||
Asset retirement obligations | — | 75 | 15 | — | 90 | 23 | — | 113 | |||||||||||||||||||||||
Other long-term liabilities | 15 | 11 | 13 | — | 39 | 19 | — | 58 | |||||||||||||||||||||||
Total liabilities | 1,020 | 140 | 545 | — | 1,705 | 595 | (5 | ) | 2,295 | ||||||||||||||||||||||
Commitments and contingencies | |||||||||||||||||||||||||||||||
Stockholders’ equity: | |||||||||||||||||||||||||||||||
Common stock | 1 | — | — | — | 1 | — | — | 1 | |||||||||||||||||||||||
APIC | 653 | 1,334 | 60 | (1,394 | ) | 653 | — | (26 | ) | 627 | |||||||||||||||||||||
Treasury stock | (87 | ) | — | — | — | (87 | ) | — | — | (87 | ) | ||||||||||||||||||||
Retained earnings | 399 | 379 | 166 | (545 | ) | 399 | — | — | 399 | ||||||||||||||||||||||
AOCI | (30 | ) | — | — | — | (30 | ) | — | — | (30 | ) | ||||||||||||||||||||
Partners’ capital | — | — | — | — | — | 882 | (882 | ) | — | ||||||||||||||||||||||
Noncontrolling interest | — | — | — | — | — | — | 635 | 635 | |||||||||||||||||||||||
Total stockholders’ equity | 936 | 1,713 | 226 | (1,939 | ) | 936 | 882 | (273 | ) | 1,545 | |||||||||||||||||||||
Total liabilities and stockholders’ equity | $ | 1,956 | $ | 1,853 | $ | 771 | $ | (1,939 | ) | $ | 2,641 | $ | 1,477 | $ | (278 | ) | $ | 3,840 | |||||||||||||
Deferred taxes and noncontrolling interest for CrossAmerica include $11 million and $612 million, respectively, related to the consolidation of CrossAmerica with CST as a result of the GP Purchase discussed in Form 10-K for the year ended December 31, 2015.
31
CST BRANDS, INC.
CONDENSED NOTES TO CONSOLIDATED FINANCIAL STATEMENTS
CONSOLIDATING STATEMENTS OF INCOME AND COMPREHENSIVE INCOME
(Millions of Dollars)
Three Months Ended September 30, 2016 | |||||||||||||||||||||||||||||||
Parent Company | Guarantor Subsidiaries | Non-Guarantor Subsidiaries | CST Eliminations | Total CST | CrossAmerica | Eliminations | Total Consolidated | ||||||||||||||||||||||||
US | Canada | ||||||||||||||||||||||||||||||
Operating revenues | $ | — | $ | 1,637 | $ | 829 | $ | — | $ | 2,466 | $ | 489 | $ | (47 | ) | $ | 2,908 | ||||||||||||||
Cost of sales | — | 1,381 | 734 | — | 2,115 | 450 | (47 | ) | 2,518 | ||||||||||||||||||||||
Gross profit | — | 256 | 95 | — | 351 | 39 | — | 390 | |||||||||||||||||||||||
Income from CST Fuel Supply Equity | — | — | — | — | — | 4 | (4 | ) | — | ||||||||||||||||||||||
Operating expenses: | |||||||||||||||||||||||||||||||
Operating expenses | — | 151 | 53 | — | 204 | 14 | (4 | ) | 214 | ||||||||||||||||||||||
General and administrative expenses | 2 | 28 | 5 | — | 35 | 6 | — | 41 | |||||||||||||||||||||||
Depreciation, amortization and accretion expense | — | 34 | 10 | — | 44 | 21 | (a) | — | 65 | ||||||||||||||||||||||
Total operating expenses | 2 | 213 | 68 | — | 283 | 41 | (4 | ) | 320 | ||||||||||||||||||||||
Gain on the sale of assets, net | — | 347 | 3 | — | 350 | — | — | 350 | |||||||||||||||||||||||
Operating (loss) income | (2 | ) | 390 | 30 | — | 418 | 2 | — | 420 | ||||||||||||||||||||||
Other income, net | — | 2 | (2 | ) | — | — | — | (1 | ) | (1 | ) | ||||||||||||||||||||
Interest expense | (10 | ) | — | (1 | ) | — | (11 | ) | (5 | ) | — | (16 | ) | ||||||||||||||||||
Intercompany interest expense | 1 | — | (1 | ) | — | — | — | — | — | ||||||||||||||||||||||
Equity in earnings of CrossAmerica | (1 | ) | — | — | — | (1 | ) | — | 1 | — | |||||||||||||||||||||
Equity in earnings of subsidiaries | 272 | — | — | (272 | ) | — | — | — | — | ||||||||||||||||||||||
Income (loss) before income tax expense | 260 | 392 | 26 | (272 | ) | 406 | (3 | ) | — | 403 | |||||||||||||||||||||
Income tax expense | — | 139 | 7 | — | 146 | 1 | — | 147 | |||||||||||||||||||||||
Net income (loss) | 260 | 253 | 19 | (272 | ) | 260 | (4 | ) | — | 256 | |||||||||||||||||||||
Net loss attributable to noncontrolling interest | — | — | — | — | — | 3 | 1 | 4 | |||||||||||||||||||||||
Net income (loss) attributable to CST stockholders | $ | 260 | $ | 253 | $ | 19 | $ | (272 | ) | $ | 260 | $ | (1 | ) | $ | 1 | $ | 260 | |||||||||||||
Other comprehensive income (loss), net of tax: | |||||||||||||||||||||||||||||||
Net income (loss) | $ | 260 | $ | 253 | $ | 19 | $ | (272 | ) | $ | 260 | $ | (4 | ) | $ | — | $ | 256 | |||||||||||||
Foreign currency translation adjustment | (5 | ) | — | — | — | (5 | ) | — | — | (5 | ) | ||||||||||||||||||||
Comprehensive income (loss) | 255 | 253 | 19 | (272 | ) | 255 | (4 | ) | — | 251 | |||||||||||||||||||||
Comprehensive loss attributable to noncontrolling interests | — | — | — | — | — | (3 | ) | (1 | ) | (4 | ) | ||||||||||||||||||||
Comprehensive income (loss) attributable to CST stockholders | $ | 255 | $ | 253 | $ | 19 | $ | (272 | ) | $ | 255 | $ | (1 | ) | $ | (1 | ) | $ | 255 | ||||||||||||
(a) Depreciation, amortization and accretion expense for CrossAmerica includes $8 million of additional depreciation and amortization expense related to the consolidation of CrossAmerica with CST as a result of the GP Purchase.
32
CST BRANDS, INC.
CONDENSED NOTES TO CONSOLIDATED FINANCIAL STATEMENTS
CONSOLIDATING STATEMENTS OF INCOME AND COMPREHENSIVE INCOME
(CONTINUED)
(Millions of Dollars)
Three Months Ended September 30, 2015 | |||||||||||||||||||||||||||||||
Parent Company | Guarantor Subsidiaries | Non-Guarantor Subsidiaries | CST Eliminations | Total CST | CrossAmerica | Eliminations | Total Consolidated | ||||||||||||||||||||||||
US | Canada | ||||||||||||||||||||||||||||||
Operating revenues | $ | — | $ | 1,641 | $ | 865 | $ | — | $ | 2,506 | $ | 628 | $ | (42 | ) | $ | 3,092 | ||||||||||||||
Cost of sales | — | 1,355 | 773 | — | 2,128 | 576 | (41 | ) | 2,663 | ||||||||||||||||||||||
Gross profit | — | 286 | 92 | — | 378 | 52 | (1 | ) | 429 | ||||||||||||||||||||||
Income from CST Fuel Supply Equity | — | — | — | — | — | 4 | (4 | ) | — | ||||||||||||||||||||||
Operating expenses: | |||||||||||||||||||||||||||||||
Operating expenses | — | 125 | 51 | — | 176 | 20 | (5 | ) | 191 | ||||||||||||||||||||||
General and administrative expenses | 1 | 25 | 5 | — | 31 | 10 | — | 41 | |||||||||||||||||||||||
Depreciation, amortization and accretion expense | — | 25 | 9 | — | 34 | 17 | (a) | — | 51 | ||||||||||||||||||||||
Total operating expenses | 1 | 175 | 65 | — | 241 | 47 | (5 | ) | 283 | ||||||||||||||||||||||
Gain on the sale of assets, net | — | — | — | — | — | 2 | — | 2 | |||||||||||||||||||||||
Operating (loss) income | (1 | ) | 111 | 27 | — | 137 | 11 | — | 148 | ||||||||||||||||||||||
Other income, net | (1 | ) | 2 | 1 | — | 2 | 1 | (1 | ) | 2 | |||||||||||||||||||||
Interest expense | (9 | ) | — | (1 | ) | — | (10 | ) | (5 | ) | — | (15 | ) | ||||||||||||||||||
Equity in earnings of CrossAmerica | 1 | — | — | — | 1 | — | (1 | ) | — | ||||||||||||||||||||||
Equity in earnings of subsidiaries | 95 | — | — | (95 | ) | — | — | — | — | ||||||||||||||||||||||
Income (loss) before income tax expense | 85 | 113 | 27 | (95 | ) | 130 | 7 | (2 | ) | 135 | |||||||||||||||||||||
Income tax expense (benefit) | — | 38 | 7 | — | 45 | — | — | 45 | |||||||||||||||||||||||
Net income (loss) | 85 | 75 | 20 | (95 | ) | 85 | 7 | (2 | ) | 90 | |||||||||||||||||||||
Net loss attributable to noncontrolling interest | — | — | — | — | — | — | (5 | ) | (5 | ) | |||||||||||||||||||||
Net income (loss) attributable to CST stockholders | $ | 85 | $ | 75 | $ | 20 | $ | (95 | ) | $ | 85 | $ | 7 | $ | (7 | ) | $ | 85 | |||||||||||||
Other comprehensive income (loss), net of tax: | |||||||||||||||||||||||||||||||
Net income (loss) | $ | 85 | $ | 75 | $ | 20 | $ | (95 | ) | $ | 85 | $ | 7 | $ | (2 | ) | $ | 90 | |||||||||||||
Foreign currency translation adjustment | (38 | ) | — | — | — | (38 | ) | — | — | (38 | ) | ||||||||||||||||||||
Comprehensive income (loss) | 47 | 75 | 20 | (95 | ) | 47 | 7 | (2 | ) | 52 | |||||||||||||||||||||
Comprehensive income attributable to noncontrolling interests | — | — | — | — | — | 5 | — | 5 | |||||||||||||||||||||||
Comprehensive income (loss) attributable to CST stockholders | $ | 47 | $ | 75 | $ | 20 | $ | (95 | ) | $ | 47 | $ | 2 | $ | (2 | ) | $ | 47 | |||||||||||||
(a) Depreciation, amortization and accretion expense for CrossAmerica includes $4 million of additional depreciation and amortization expense related to the consolidation of CrossAmerica with CST as a result of the GP Purchase.
33
CST BRANDS, INC.
CONDENSED NOTES TO CONSOLIDATED FINANCIAL STATEMENTS
CONSOLIDATING STATEMENTS OF INCOME AND COMPREHENSIVE INCOME
(Millions of Dollars)
Nine Months Ended September 30, 2016 | |||||||||||||||||||||||||||||||
Parent Company | Guarantor Subsidiaries | Non-Guarantor Subsidiaries | CST Eliminations | Total CST | CrossAmerica | Eliminations | Total Consolidated | ||||||||||||||||||||||||
US | Canada | ||||||||||||||||||||||||||||||
Operating revenues | $ | — | $ | 4,704 | $ | 2,314 | $ | — | $ | 7,018 | $ | 1,368 | $ | (130 | ) | $ | 8,256 | ||||||||||||||
Cost of sales | — | 3,998 | 2,040 | — | 6,038 | 1,251 | (130 | ) | 7,159 | ||||||||||||||||||||||
Gross profit | — | 706 | 274 | — | 980 | 117 | — | 1,097 | |||||||||||||||||||||||
Income from CST Fuel Supply Equity | — | — | — | — | — | 12 | (12 | ) | — | ||||||||||||||||||||||
Operating expenses: | |||||||||||||||||||||||||||||||
Operating expenses | — | 439 | 160 | — | 599 | 46 | (12 | ) | 633 | ||||||||||||||||||||||
General and administrative expenses | 6 | 87 | 13 | — | 106 | 18 | — | 124 | |||||||||||||||||||||||
Depreciation, amortization and accretion expense | — | 98 | 30 | — | 128 | 64 | (a) | — | 192 | ||||||||||||||||||||||
Total operating expenses | 6 | 624 | 203 | — | 833 | 128 | (12 | ) | 949 | ||||||||||||||||||||||
Gain (loss) on the sale of assets, net | — | 347 | 4 | — | 351 | — | — | 351 | |||||||||||||||||||||||
Operating (loss) income | (6 | ) | 429 | 75 | — | 498 | 1 | — | 499 | ||||||||||||||||||||||
Other income, net | — | 5 | 10 | — | 15 | — | (2 | ) | 13 | ||||||||||||||||||||||
Interest expense | (33 | ) | — | (1 | ) | — | (34 | ) | (16 | ) | — | (50 | ) | ||||||||||||||||||
Intercompany interest expense | 2 | — | (2 | ) | — | — | — | — | — | ||||||||||||||||||||||
Equity in earnings of CrossAmerica | (3 | ) | — | — | — | (3 | ) | — | 3 | — | |||||||||||||||||||||
Equity in earnings of subsidiaries | 345 | — | — | (345 | ) | — | — | — | — | ||||||||||||||||||||||
Income (loss) before income tax expense | 305 | 434 | 82 | (345 | ) | 476 | (15 | ) | 1 | 462 | |||||||||||||||||||||
Income tax expense (benefit) | (1 | ) | 151 | 20 | — | 170 | — | — | 170 | ||||||||||||||||||||||
Net income (loss) | 306 | 283 | 62 | (345 | ) | 306 | (15 | ) | 1 | 292 | |||||||||||||||||||||
Net loss attributable to noncontrolling interest | — | — | — | — | — | 12 | 2 | 14 | |||||||||||||||||||||||
Net income (loss) attributable to CST stockholders | $ | 306 | $ | 283 | $ | 62 | $ | (345 | ) | $ | 306 | $ | (3 | ) | $ | 3 | $ | 306 | |||||||||||||
Other comprehensive loss, net of tax: | |||||||||||||||||||||||||||||||
Net income (loss) | $ | 306 | $ | 283 | $ | 62 | $ | (345 | ) | $ | 306 | $ | (15 | ) | $ | 1 | $ | 292 | |||||||||||||
Foreign currency translation adjustment | 12 | — | — | — | 12 | — | — | 12 | |||||||||||||||||||||||
Comprehensive income (loss) | 318 | 283 | 62 | (345 | ) | 318 | (15 | ) | 1 | 304 | |||||||||||||||||||||
Comprehensive loss attributable to noncontrolling interests | — | — | — | — | — | (12 | ) | (2 | ) | (14 | ) | ||||||||||||||||||||
Comprehensive income (loss) attributable to CST stockholders | $ | 318 | $ | 283 | $ | 62 | $ | (345 | ) | $ | 318 | $ | (3 | ) | $ | 3 | $ | 318 | |||||||||||||
34
CST BRANDS, INC.
CONDENSED NOTES TO CONSOLIDATED FINANCIAL STATEMENTS
CONSOLIDATING STATEMENTS OF INCOME AND COMPREHENSIVE INCOME
(CONTINUED)
(Millions of Dollars)
Nine Months Ended September 30, 2015 | |||||||||||||||||||||||||||||||
Parent Company | Guarantor Subsidiaries | Non-Guarantor Subsidiaries | CST Eliminations | Total CST | CrossAmerica | Eliminations | Total Consolidated | ||||||||||||||||||||||||
US | Canada | ||||||||||||||||||||||||||||||
Operating revenues | $ | — | $ | 4,641 | $ | 2,627 | $ | — | $ | 7,268 | $ | 1,760 | $ | (114 | ) | $ | 8,914 | ||||||||||||||
Cost of sales | — | 3,993 | 2,351 | — | 6,344 | 1,629 | (113 | ) | 7,860 | ||||||||||||||||||||||
Gross profit | — | 648 | 276 | — | 924 | 131 | (1 | ) | 1,054 | ||||||||||||||||||||||
Income from CST Fuel Supply Equity | — | — | — | — | — | 6 | (6 | ) | — | ||||||||||||||||||||||
Operating expenses: | |||||||||||||||||||||||||||||||
Operating expenses | — | 356 | 160 | — | 516 | 58 | (7 | ) | 567 | ||||||||||||||||||||||
General and administrative expenses | 5 | 81 | 15 | — | 101 | 27 | — | 128 | |||||||||||||||||||||||
Depreciation, amortization and accretion expense | — | 72 | 28 | — | 100 | 56 | (a) | — | 156 | ||||||||||||||||||||||
Total operating expenses | 5 | 509 | 203 | — | 717 | 141 | (7 | ) | 851 | ||||||||||||||||||||||
Gain on the sale of assets, net | — | 7 | — | — | 7 | 2 | — | 9 | |||||||||||||||||||||||
Operating (loss) income | (5 | ) | 146 | 73 | — | 214 | (2 | ) | — | 212 | |||||||||||||||||||||
Other income, net | — | 4 | 2 | — | 6 | 1 | (1 | ) | 6 | ||||||||||||||||||||||
Interest expense | (29 | ) | — | (1 | ) | — | (30 | ) | (14 | ) | — | (44 | ) | ||||||||||||||||||
Equity in earnings of CrossAmerica | — | — | — | — | — | — | — | — | |||||||||||||||||||||||
Equity in earnings of subsidiaries | 158 | — | — | (158 | ) | — | — | — | — | ||||||||||||||||||||||
Income (loss) before income tax expense | 124 | 150 | 74 | (158 | ) | 190 | (15 | ) | (1 | ) | 174 | ||||||||||||||||||||
Income tax expense | — | 46 | 20 | — | 66 | (7 | ) | — | 59 | ||||||||||||||||||||||
Net income (loss) | 124 | 104 | 54 | (158 | ) | 124 | (8 | ) | (1 | ) | 115 | ||||||||||||||||||||
Net loss attributable to noncontrolling interest | — | — | — | — | — | — | 9 | 9 | |||||||||||||||||||||||
Net income (loss) attributable to CST stockholders | $ | 124 | $ | 104 | $ | 54 | $ | (158 | ) | $ | 124 | $ | (8 | ) | $ | 8 | $ | 124 | |||||||||||||
Other comprehensive income (loss), net of tax: | |||||||||||||||||||||||||||||||
Net income (loss) | $ | 124 | $ | 104 | $ | 54 | $ | (158 | ) | $ | 124 | $ | (8 | ) | $ | (1 | ) | $ | 115 | ||||||||||||
Foreign currency translation adjustment | (81 | ) | — | — | — | (81 | ) | — | — | (81 | ) | ||||||||||||||||||||
Comprehensive income (loss) | 43 | 104 | 54 | (158 | ) | 43 | (8 | ) | (1 | ) | 34 | ||||||||||||||||||||
Comprehensive loss attributable to noncontrolling interests | — | — | — | — | — | (9 | ) | — | (9 | ) | |||||||||||||||||||||
Comprehensive income (loss) attributable to CST stockholders | $ | 43 | $ | 104 | $ | 54 | $ | (158 | ) | $ | 43 | $ | 1 | $ | (1 | ) | $ | 43 | |||||||||||||
(a) Depreciation, amortization and accretion expense for CrossAmerica includes $20 million of additional depreciation and amortization expense related to the consolidation of CrossAmerica with CST as a result of the GP Purchase.
35
CST BRANDS, INC.
CONDENSED NOTES TO CONSOLIDATED FINANCIAL STATEMENTS
CONSOLIDATING STATEMENTS OF CASH FLOWS
(Millions of Dollars)
Nine Months Ended September 30, 2016 | |||||||||||||||||||||||||||||||
Parent Company | Guarantor Subsidiaries | Non-Guarantor Subsidiaries | CST Eliminations | Total CST | CrossAmerica | Eliminations | Total Consolidated | ||||||||||||||||||||||||
US | Canada | ||||||||||||||||||||||||||||||
Cash flows from operating activities: | |||||||||||||||||||||||||||||||
Net cash (used in) provided by operating activities | $ | (34 | ) | $ | 222 | $ | 62 | $ | — | $ | 250 | $ | 63 | $ | (2 | ) | $ | 311 | |||||||||||||
Cash flows from investing activities: | |||||||||||||||||||||||||||||||
Capital expenditures | — | (209 | ) | (30 | ) | — | (239 | ) | (12 | ) | — | (251 | ) | ||||||||||||||||||
Proceeds from sale of California and Wyoming stores | — | 408 | — | — | 408 | — | — | 408 | |||||||||||||||||||||||
Proceeds from California and Wyoming sale restricted for use | — | (25 | ) | — | — | (25 | ) | — | — | (25 | ) | ||||||||||||||||||||
Proceeds from the sale of assets | — | — | 1 | — | 1 | 1 | — | 2 | |||||||||||||||||||||||
CST acquisitions | — | (438 | ) | — | — | (438 | ) | — | — | (438 | ) | ||||||||||||||||||||
CrossAmerica acquisitions | — | — | — | — | — | (94 | ) | — | (94 | ) | |||||||||||||||||||||
CST refund payment to CrossAmerica | — | (18 | ) | — | — | (18 | ) | 18 | — | — | |||||||||||||||||||||
Cash received from sale of dealer contracts | — | 3 | — | — | 3 | (3 | ) | — | — | ||||||||||||||||||||||
Other investing activities, net | — | — | — | — | — | — | — | — | |||||||||||||||||||||||
Net cash used in investing activities | — | (279 | ) | (29 | ) | — | (308 | ) | (90 | ) | — | (398 | ) | ||||||||||||||||||
Cash flows from financing activities: | |||||||||||||||||||||||||||||||
Proceeds under the CrossAmerica revolving credit facility | — | — | — | — | — | 178 | — | 178 | |||||||||||||||||||||||
Payments on the CrossAmerica revolving credit facility | — | — | — | — | — | (82 | ) | — | (82 | ) | |||||||||||||||||||||
Proceeds under the CST revolving credit facility | 402 | — | — | — | 402 | — | — | 402 | |||||||||||||||||||||||
Payments on the CST revolving credit facility | (412 | ) | — | — | — | (412 | ) | — | — | (412 | ) | ||||||||||||||||||||
Debt issuance costs | (1 | ) | — | — | — | (1 | ) | — | — | (1 | ) | ||||||||||||||||||||
Repayment of intercompany payable | — | — | (235 | ) | 235 | — | — | — | — | ||||||||||||||||||||||
Intercompany loan | 235 | — | — | (235 | ) | — | — | — | — | ||||||||||||||||||||||
Payments on the CST term loan facility | (50 | ) | — | — | — | (50 | ) | — | — | (50 | ) | ||||||||||||||||||||
Repurchases of common shares and units | — | — | — | — | — | (3 | ) | — | (3 | ) | |||||||||||||||||||||
Payments of capital lease obligations | — | (1 | ) | — | — | (1 | ) | (2 | ) | — | (3 | ) | |||||||||||||||||||
Dividends paid | (15 | ) | — | — | — | (15 | ) | — | — | (15 | ) | ||||||||||||||||||||
Distributions from CrossAmerica | — | 12 | — | — | 12 | — | (12 | ) | — | ||||||||||||||||||||||
Distributions paid | — | — | — | — | — | (62 | ) | 14 | (48 | ) | |||||||||||||||||||||
Intercompany funding | (125 | ) | 125 | — | — | — | — | — | — | ||||||||||||||||||||||
Net cash provided by (used in) financing activities | 34 | 136 | (235 | ) | — | (65 | ) | 29 | 2 | (34 | ) | ||||||||||||||||||||
Effect of foreign exchange rate changes on cash | — | — | (1 | ) | — | (1 | ) | — | — | (1 | ) | ||||||||||||||||||||
Net (decrease) increase in cash | — | 79 | (203 | ) | — | (124 | ) | 2 | — | (122 | ) | ||||||||||||||||||||
Cash at beginning of year | — | 66 | 247 | — | 313 | 1 | — | 314 | |||||||||||||||||||||||
Cash at end of period | $ | — | $ | 145 | $ | 44 | $ | — | $ | 189 | $ | 3 | $ | — | $ | 192 | |||||||||||||||
36
CST BRANDS, INC.
CONDENSED NOTES TO CONSOLIDATED FINANCIAL STATEMENTS
CONSOLIDATING STATEMENTS OF CASH FLOWS
(CONTINUED)
(Millions of Dollars)
Nine Months Ended September 30, 2015 | |||||||||||||||||||||||||||||||
Parent Company | Guarantor Subsidiaries | Non-Guarantor Subsidiaries | CST Eliminations | Total CST | CrossAmerica | Eliminations | Total Consolidated | ||||||||||||||||||||||||
US | Canada | ||||||||||||||||||||||||||||||
Cash flows from operating activities: | |||||||||||||||||||||||||||||||
Net cash (used in) provided by operating activities | $ | (30 | ) | $ | 213 | $ | 108 | $ | — | $ | 291 | 50 | $ | (1 | ) | $ | 340 | ||||||||||||||
Cash flows from investing activities: | |||||||||||||||||||||||||||||||
Capital expenditures | (174 | ) | (29 | ) | — | (203 | ) | (7 | ) | — | (210 | ) | |||||||||||||||||||
CST acquisitions | (22 | ) | — | (22 | ) | — | — | (22 | ) | ||||||||||||||||||||||
CrossAmerica acquisitions | — | — | (168 | ) | — | (168 | ) | ||||||||||||||||||||||||
Proceeds from the sale of assets | — | 18 | 2 | — | 20 | 4 | — | 24 | |||||||||||||||||||||||
Distributions from CrossAmerica | — | — | (142 | ) | 142 | — | |||||||||||||||||||||||||
Cash received from sale of CST Fuel Supply | — | 17 | — | — | 17 | — | (17 | ) | — | ||||||||||||||||||||||
Cash received from drop down of NTI to CrossAmerica | — | 124 | — | — | 124 | — | (124 | ) | — | ||||||||||||||||||||||
IDR Income | — | 1 | — | — | 1 | — | (1 | ) | — | ||||||||||||||||||||||
Other investing activities, net | 1 | 6 | (2 | ) | — | 5 | 2 | — | 7 | ||||||||||||||||||||||
Net cash used in investing activities | 1 | (30 | ) | (29 | ) | — | (58 | ) | (311 | ) | — | (369 | ) | ||||||||||||||||||
Cash flows from financing activities: | |||||||||||||||||||||||||||||||
Purchase of CrossAmerica common units | — | (4 | ) | — | — | (4 | ) | — | — | (4 | ) | ||||||||||||||||||||
Proceeds under the CrossAmerica revolving credit facility | — | — | — | — | — | 335 | — | 335 | |||||||||||||||||||||||
Payments on the CrossAmerica revolving credit facility | — | — | — | — | — | (185 | ) | — | (185 | ) | |||||||||||||||||||||
Proceeds under the CST revolving credit facility | — | — | — | — | — | — | — | — | |||||||||||||||||||||||
Payments on long-term debt | (34 | ) | — | — | — | (34 | ) | — | — | (34 | ) | ||||||||||||||||||||
Proceeds from issuance of CrossAmerica common units, net | — | — | — | — | — | 145 | — | 145 | |||||||||||||||||||||||
CST purchases of treasury shares | (65 | ) | — | — | — | (65 | ) | — | — | (65 | ) | ||||||||||||||||||||
Payments of capital lease obligations | (1 | ) | — | (1 | ) | (2 | ) | — | (3 | ) | |||||||||||||||||||||
Distributions from CrossAmerica | — | 5 | — | — | 5 | — | (5 | ) | — | ||||||||||||||||||||||
Dividends paid | (15 | ) | — | (15 | ) | — | — | (15 | ) | ||||||||||||||||||||||
Distributions paid | — | — | — | — | — | (47 | ) | 6 | (41 | ) | |||||||||||||||||||||
Receivables repaid by CrossAmerica related parties | — | — | — | — | — | 2 | — | 2 | |||||||||||||||||||||||
Intercompany funding | 143 | (143 | ) | — | — | — | — | — | — | ||||||||||||||||||||||
Net cash provided by (used in) financing activities | 29 | (143 | ) | — | — | (114 | ) | 248 | 1 | 135 | |||||||||||||||||||||
Effect of foreign exchange rate changes on cash | — | — | (30 | ) | — | (30 | ) | — | — | (30 | ) | ||||||||||||||||||||
Net (decrease) increase in cash | — | 40 | 49 | — | 89 | (13 | ) | — | 76 | ||||||||||||||||||||||
Cash at beginning of year | — | 148 | 205 | — | 353 | 15 | — | 368 | |||||||||||||||||||||||
Cash at end of period | $ | — | $ | 188 | $ | 254 | $ | — | $ | 442 | $ | 2 | $ | — | $ | 444 | |||||||||||||||
37
ITEM 2. MANAGEMENT’S DISCUSSION AND ANALYSIS OF FINANCIAL CONDITION AND RESULTS OF OPERATIONS
CAUTIONARY STATEMENT FOR THE PURPOSE OF THE SAFE HARBOR PROVISIONS OF THE PRIVATE SECURITIES LITIGATION REFORM ACT OF 1995
Forward-looking statements, within the meaning of Section 27A of the Securities Act of 1933 and Section 21E of the Exchange Act, are made throughout this quarterly report. This quarterly report includes forward-looking statements, including in the section entitled “Management’s Discussion and Analysis of Financial Condition and Results of Operations.” Forward-looking statements include the information concerning our possible or assumed future results of operations, business strategies, financing plans, competitive position, credit ratings, dividend growth, potential growth opportunities, potential operating performance improvements, potential improvements in return on capital employed, benefits resulting from our separation from Valero, the effects of competition and the effects of future legislation or regulations. You can identify our forward-looking statements by the words “anticipate,” “estimate,” “believe,” “continue,” “could,” “intend,” “may,” “plan,” “potential,” “predict,” “seek,” “should,” “will,” “would,” “expect,” “objective,” “projection,” “forecast,” “guidance,” “outlook,” “effort,” “target” and similar expressions. Such statements are based on management’s current views and assumptions, and involve risks and uncertainties that could affect expected results. These forward-looking statements include, among other things, statements regarding:
• | future retail gross profits, including gasoline, diesel, heating oil and convenience store merchandise gross profits; |
• | our anticipated level of capital investments and the effect of these capital investments on our results of operations; |
• | anticipated trends in the demand for, and volumes sold, of gasoline, diesel and heating oil globally and in the regions where we operate; |
• | expectations regarding environmental, tax and other regulatory initiatives; and |
• | the effect of general economic and other conditions on retail fundamentals. |
The following factors related to the Merger or our Merger Agreement, among others, could cause actual results and events to differ materially from those expressed or implied in the forward-looking statements:
• | the occurrence of any event, change or other circumstances that could give rise to the termination of the Merger Agreement; |
• | the inability to complete the transactions contemplated by the Merger Agreement due to the failure to obtain the required stockholder approval; |
• | the inability to satisfy the other conditions specified in the Merger Agreement, including, without limitation, the receipt of necessary governmental or regulatory approvals required to complete the transactions contemplated by the Merger Agreement; |
• | the risk that the Merger or covenants contained in the Merger Agreement disrupt current plans and operations, increase operating costs and the potential difficulties in customer loss and employee retention as a result of the announcement and consummation of such transactions; |
• | the outcome of legal proceedings instituted against us following announcement of the Merger Agreement and transactions contemplated therein; and |
• | the possibility that the Company may be adversely affected by other economic, business, and/or competitive factors. |
Unless stated otherwise, all forward-looking information contained in this report does not take into account or give any effect to the impact of the proposed Merger. In general, we based the forward-looking statements on our current expectations, estimates and projections about our company and the industry in which we operate. We caution you that these statements are not guarantees of future performance as they involve assumptions that, while made in good faith, may prove to be incorrect, and involve risks and uncertainties we cannot predict. In addition, we based many of these forward-looking statements on assumptions about future events that may prove to be inaccurate. Accordingly, our actual outcomes and results may differ materially from what we have expressed or forecasted in the forward-looking statements. Any differences could result from a variety of factors, including the following:
• | volatility and seasonality in crude oil, wholesale motor fuel costs and motor fuel sales; |
• | political conditions in oil producing regions and global demand for oil; |
38
• | competitive pressures from convenience stores and other non-traditional retailers located in our markets; |
• | changes in our customers’ behavior and travel as a result of changing economic conditions, labor strikes or otherwise; |
• | increasing consumer preference for alternative motor fuel and improvements in fuel efficiency; |
• | future legislation or campaigns to discourage smoking; |
• | our ability to comply with federal, provincial and state regulations, including those related to environmental matters, the sale of alcohol, cigarettes and fresh foods, and employment laws and health benefits; |
• | significant increases in statutory minimum wage; |
• | future regulations and actions that could expand the non-exempt status of employees under the Fair Labor Standards Act; |
• | severe or unfavorable weather conditions; |
• | dependence on senior management and the ability to attract and retain qualified employees; |
• | inability to build or acquire and successfully integrate new retail sites; |
• | fluctuations in the exchange rate between the United States and Canadian currencies; |
• | dependence on Valero and other suppliers for motor fuel and merchandise; |
• | dependence on suppliers, including Valero, for credit terms; |
• | supply chain disruptions; |
• | litigation or adverse publicity concerning food quality, food safety, other health concerns or compliance with franchise agreements related to our food product merchandise or restaurant facilities; |
• | dangers inherent in storing and transporting motor fuel; |
• | pending or future consumer, environmental or other litigation; |
• | dependence on our IT systems and maintaining data security; |
• | acts of terrorism or war; |
• | our and CrossAmerica’s access to capital, credit ratings, debt and ability to raise additional debt or equity financing; |
• | impairment of long-lived assets, intangible assets or goodwill; |
• | our ability to comply with covenants in any credit agreements or other debt instruments and availability, terms and deployment of capital; |
• | our business strategy and operations and potential conflicts of interest with CrossAmerica; |
• | our ability to successfully integrate any acquisition we may make; |
• | future income tax legislation; |
• | a determination by the IRS that the spin-off or certain related transactions should be treated as a taxable transaction; |
• | the Merger or our Merger Agreement and the terms and conditions thereof; |
• | regulatory review of the Merger in the U.S. and Canada; |
• | litigation associated with the Merger Agreement; and |
• | other unforeseen factors. |
39
You should consider the areas of risk described above, as well as those set forth herein in Part II, Item 1A "Risk Factors" and in the section entitled “Risk Factors” included in our Form 10-K for the year ended December 31, 2015, our Forms 10-Q for the quarterly periods ended March 31 and June 30, 2016, and our Definitive Proxy Statement filed with the SEC on October 11, 2016, in connection with considering any forward-looking statements that may be made by us and our businesses generally. We cannot assure you that projected results or events reflected in the forward-looking statements will be achieved or will occur. The forward-looking statements included in this report are made as of the date of this report.
40
MANAGEMENT’S DISCUSSION AND ANALYSIS OF FINANCIAL CONDITION AND RESULTS OF OPERATIONS
The following MD&A is provided as a supplement to, and should be read in conjunction with, our consolidated financial statements and the accompanying notes to these financial statements contained elsewhere in this report, this MD&A section and the consolidated and combined financial statements and accompanying notes to those financial statements in our Form 10-K. Our Form 10-K contains a discussion of other matters not included herein, such as disclosures regarding critical accounting policies and estimates and contractual obligations.
Our MD&A is organized as follows:
• | Merger Agreement—This section provides information on our pending Merger. |
• | Significant Factors Affecting Our Profitability—This section describes the significant impact on our results of operations caused by crude oil commodity price volatility and seasonality. |
• | Recently Acquired Retail Sites—This section describes our operating model related to recently acquired convenience store operations. |
• | Results of Operations—This section provides an analysis of our results of operations, including the results of operations of our business segments, for the three and nine months ended September 30, 2016 and 2015, and an outlook for our business considering the Merger and Merger Agreement. |
• | Liquidity and Capital Resources—This section provides a discussion of our financial condition and cash flows. It also includes a discussion of our debt, capital requirements and other matters impacting our liquidity and capital resources. |
• | New Accounting Policies—This section describes new accounting pronouncements that we have already adopted, those that we are required to adopt in the future, and those that became applicable in the current year as a result of new circumstances. |
• | Critical Accounting Policies Involving Critical Accounting Estimates—This section describes the accounting policies and estimates that we consider most important for our business and that require significant judgment. |
41
Merger Agreement
On August 21, 2016, our Board of Directors unanimously approved, and we entered into, a definitive merger agreement with a subsidiary of Couche-Tard, under which, subject to the terms and conditions thereof, a U.S. subsidiary of Couche-Tard will acquire all of the shares of CST for $48.53 per share in cash, representing a total enterprise value of approximately $4.4 billion, including the assumption of net debt. The transaction is currently expected to close early calendar year 2017, subject to the approval of CST’s stockholders and regulatory approvals in the United States and Canada. The Merger Agreement provides for interim operating covenants as set forth therein, which limit certain activities and operations of CST. On September 16, 2016, each of CST and Couche-Tard filed a premerger notification and report form under the Hart-Scott-Rodino Antitrust Improvements Act of 1976, as amended (the “HSR Act”), with the United States Federal Trade Commission (the “FTC”) and the Antitrust Division of the United States Department of Justice (the “Antitrust Division”) in connection with the Merger. Couche-Tard voluntarily withdrew its premerger notification and report form under the HSR Act on October 14, 2016, and re-filed its premerger notification and report form on October 17, 2016. As a result, the applicable waiting period under the HSR Act will expire on November 16, 2016 at 11:59 p.m. Eastern Time, unless otherwise earlier terminated or extended by the FTC and the Antitrust Division. ISS and Glass Lewis, two prominent proxy advisory firms, have recently issued their recommendations for a vote in favor of approving the Merger Agreement. As previously announced, we have scheduled a special meeting of its stockholders for November 16, 2016 to consider and vote on the transaction. See our Current Reports on Form 8-K filed with the SEC on August 23, 2016 and October 18, 2016, and our Definitive Proxy Statement filed with the SEC on October 11, 2016 for additional information.
Significant Factors Affecting Our Profitability
The Significance of Crude Oil and Wholesale Motor Fuel Prices on Our Revenues, Cost of Sales and Gross Profit
CST
The prices paid to our motor fuel suppliers for wholesale motor fuel are closely correlated to the price of crude oil. The crude oil commodity markets are highly volatile, and the market prices of crude oil and wholesale motor fuel experience significant and rapid fluctuations. We attempt to pass along wholesale motor fuel price changes to our retail customers through “at the pump” retail price changes; however, market conditions do not always allow us to do so immediately. The timing of any related increase or decrease in “at the pump” retail prices is affected by competitive conditions in each geographic market in which we operate. As such, the prices we charge our customers for motor fuel and the gross profit we receive on our motor fuel sales can increase or decrease significantly and rapidly over short periods of time.
Changes in our average motor fuel selling price per gallon and gross margin for the periods ended September 30, 2016 and 2015 were directly related to the changes in crude oil and wholesale motor fuel prices over the same period. Variations in our reported revenues and cost of sales are, therefore, primarily related to the price of crude oil and wholesale motor fuel prices and generally not as a result of changes in motor fuel sales volumes, unless otherwise indicated and discussed below.
Approximately 40% of CST’s gross profit is derived from the sale of motor fuel. CST typically experiences lower motor fuel gross profits in periods when the wholesale cost of motor fuel increases, and higher motor fuel gross profits in periods when the wholesale cost of motor fuel declines rapidly.
42
Historically, the volatility of crude oil and wholesale motor fuel prices has significantly impacted CST’s motor fuel gross profits, and is further discussed in “Results of Operations” below. The following graph provides benchmark information for both crude oil and wholesale motor fuel prices for the thirty-four months ended September 30, 2016:
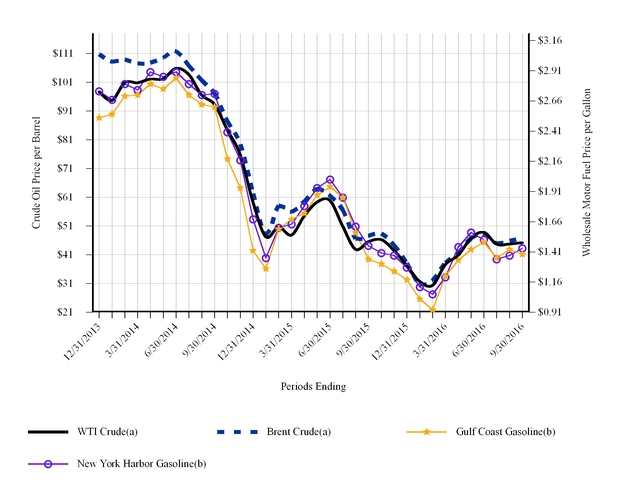
(a) Represents the average monthly spot price per barrel during the periods presented for WTI and Brent crude oil. One barrel represents 42 gallons (source: EIA.gov).
(b) | Represents the average monthly spot price per gallon during the periods presented for GCC gasoline and NYHC gasoline (source: EIA.gov). |
43
The following graph shows the volatility of wholesale motor fuel prices and the impact on our U.S. Retail and Canadian Retail segments’ gross profits for the thirty-four months ended September 30, 2016 (U.S. Retail and Canadian Retail CPG gross profits):
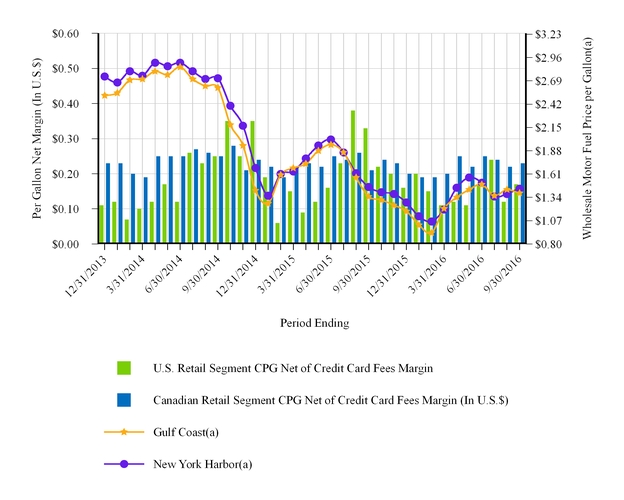
(a) | Represents the average monthly spot price per gallon during the periods presented for GCC gasoline and NYHC gasoline (source: EIA.gov). |
CrossAmerica
As discussed above, our U.S. Retail and Canadian Retail segments typically experience lower motor fuel gross profits in periods when the wholesale cost of motor fuel is increasing, and higher motor fuel gross profits in periods when the wholesale cost of motor fuel is decreasing. As it relates to its retail operations, CrossAmerica generally experiences similar effects on its revenues and gross profits from wholesale motor fuel price changes.
The prices paid to CrossAmerica’s motor fuel suppliers for wholesale motor fuel (which affects our cost of sales) are highly correlated to the price of crude oil. The crude oil commodity markets are highly volatile, and the market prices of crude oil, and, correspondingly, the market prices of wholesale motor fuel, experience significant and rapid fluctuations. CrossAmerica receives a fixed mark-up per gallon on approximately 87% of gallons sold to its customers. The remaining gallons are primarily DTW priced contracts with its customers. These contracts provide for variable, market based pricing that results in motor fuel gross profit effects similar to retail motor fuel gross profits (as crude oil prices decline, motor fuel gross profit generally increases). The increase in DTW gross profit results from the acquisition cost of wholesale motor fuel declining at a faster rate as compared to the rate retail motor fuel prices decline. Alternatively, our DTW motor fuel gross profit declines when the cost of wholesale motor fuel increases at a faster rate as compared to the rate retail motor fuel prices increase.
Regarding CrossAmerica’s supplier relationships, a majority of our total gallons purchased are subject to discounts for prompt payment and other rebates and incentives, which are recorded within cost of sales. Prompt payment discounts are based on a percentage of the purchase price of motor fuel. As such, the dollar value of these discounts increase and decrease corresponding with motor fuel prices. Therefore, in periods of lower wholesale motor fuel prices, our gross profit is negatively affected and, in periods of higher wholesale motor fuel prices, our gross profit is positively affected (as it relates to these discounts). Based on
44
CrossAmerica’s current volumes, we estimate a $10 per barrel change in the price of crude oil would impact CrossAmerica’s overall annual wholesale motor fuel gross profit by approximately $2 million related to these payment discounts.
Seasonality Effects on Volumes
Our business is subject to seasonality due to our wholesale and retail sites being located in certain geographic areas that are affected by seasonal weather and temperature trends and associated changes in retail customer activity during different seasons. Historically, sales volumes and operating income have been highest in the second and third quarters (during the summer months) and lowest during the winter months in the first and fourth quarters.
Impact on Inflation
Inflation affects our financial performance by increasing certain of our operating expenses, cost of goods sold and working capital requirements. Operating expenses include labor costs, leases, and general and administrative expenses. The long term impact of inflation is minimized, as we generally are able to pass along energy cost, merchandise cost and operating expense increases in the form of increased sales prices to our customers over time. Although we believe we have historically been able to pass on increased costs through price increases, there can be no assurance that we will be able to do so in the future.
Recently Acquired Retail Sites
When we acquire wholesale fuel and convenience store operations, we generally do not have a predetermined operating or ownership model for these businesses. Acquisitions can be done by CST or CrossAmerica separately or jointly, with wholesale fuel supply operations generally acquired by CrossAmerica and convenience store operations generally acquired by CST. Subsequent to an acquisition, we have an integration team that evaluates the eventual long-term operation of each convenience store acquired: (a) to be fully integrated into the existing core retail operations of CST, (b) to be converted into a dealer, or (c) other strategic alternatives, including divestiture or longer-term operation by CrossAmerica. All retail convenience stores we acquire are first categorized as non-core and an evaluation process (which could take up to twelve months) is performed to determine if any of the acquired convenience stores are suitable to be converted and integrated into CST’s core store operating model. We believe it is necessary to differentiate the operating performance between core and non-core stores when presenting our operating statistics because non-core stores are not necessarily reflective of our core business practices. Key differentiating factors include the following:
• | Non-core merchandising strategies are often legacy strategies of the former owner, which may be different from our core store merchandising strategies, including the offering of our proprietary products and food programs. |
• | Non-core sites are independently managed by our integration team whereas our President of Retail Operations oversees all core store operations. |
• | Non-core motor fuel pricing, merchandise supply and labor strategies may be different from our core business. |
During the nine months ended September 30, 2016, CrossAmerica converted 72 company-operated convenience stores to third party dealer operated stores. As of September 30, 2016, CrossAmerica continues to operate 78 retail sites (including three company-operated liquor stores) from its recent acquisitions.
Effective April 1, 2016, the 165 stores acquired February 1, 2016 in the Flash Foods acquisition are included in our U.S. Retail Segment’s core-store operations. The assets acquired by CrossAmerica in the Holiday and State Oil acquisitions are included in CrossAmerica’s retail operations.
The following is a rollforward of our non-core convenience stores in our U.S. Retail segment and company-operated convenience stores in our CrossAmerica segment:
Nine Months Ended September 30, 2016 | |||||||||
U.S. Retail | CrossAmerica | Total | |||||||
Beginning of period | — | 116 | 116 | ||||||
Acquisitions | 165 | 34 | 199 | ||||||
Conversion to core site | (165 | ) | — | (165 | ) | ||||
Dealer conversions(a) | — | (72 | ) | (72 | ) | ||||
End of period | — | 78 | 78 | ||||||
(a) Includes one quick service restaurant where CrossAmerica collects rent but does not supply motor fuel.
45
Results of Operations
Consolidated Income Statement Analysis
Below is an analysis of our consolidated income statements, which provides the primary reasons for significant increases and decreases in the various income statement line items from period to period. Our consolidated income statements are as follows (in millions):
Three Months Ended September 30, | Nine Months Ended September 30, | |||||||||||||||
2016 | 2015 | 2016 | 2015 | |||||||||||||
Operating revenues | $ | 2,908 | $ | 3,092 | $ | 8,256 | $ | 8,914 | ||||||||
Cost of sales | 2,518 | 2,663 | 7,159 | 7,860 | ||||||||||||
Gross profit | 390 | 429 | 1,097 | 1,054 | ||||||||||||
Operating expenses: | ||||||||||||||||
Operating expenses | 214 | 191 | 633 | 567 | ||||||||||||
General and administrative expenses | 41 | 41 | 124 | 128 | ||||||||||||
Depreciation, amortization and accretion expense | 65 | 51 | 192 | 156 | ||||||||||||
Total operating expenses | 320 | 283 | 949 | 851 | ||||||||||||
Gain on sale of assets, net | 350 | 2 | 351 | 9 | ||||||||||||
Operating income | 420 | 148 | 499 | 212 | ||||||||||||
Other income (expense), net | (1 | ) | 2 | 13 | 6 | |||||||||||
Interest expense | (16 | ) | (15 | ) | (50 | ) | (44 | ) | ||||||||
Income before income tax expense | 403 | 135 | 462 | 174 | ||||||||||||
Income tax expense | 147 | 45 | 170 | 59 | ||||||||||||
Consolidated net income | 256 | 90 | 292 | 115 | ||||||||||||
Net loss (income) attributable to noncontrolling interests | 4 | (5 | ) | 14 | 9 | |||||||||||
Net income attributable to CST stockholders | $ | 260 | $ | 85 | $ | 306 | $ | 124 | ||||||||
On February 1, 2016, we completed the acquisition of Flash Foods and began consolidating the financial results of Flash Foods. We have quantified the effects of Flash Foods to specific income statement line items in our consolidated discussion of our results of operations, and any significant increase or decrease in the underlying income statement line items attributable to CST excluding the Flash Foods acquisition are then discussed.
46
Three Months Ended September 30, 2016 Compared to Three Months Ended September 30, 2015
Consolidated Results
Operating revenues increased $232 million and gross profit increased $33 million as a result of the acquisition of Flash Foods, which was completed on February 1, 2016.
Excluding the effects of the Flash Foods acquisition, operating revenues declined $416 million, while gross profit declined $72 million.
Operating revenues
Significant items impacting these results (excluding Flash Foods) were:
• | A $236 million decline in our U.S. Retail segment operating revenues primarily attributable to: |
◦ | A decrease in the retail price per gallon of motor fuel that we sold as a result of a decline in wholesale gasoline prices, as more fully described below under the heading “Segment Results—U.S. Retail.” |
◦ | Partially offsetting the decline was an increase in motor fuel gallons sold, as more fully described below under the heading “Segment Results—U.S. Retail.” |
◦ | Further offsetting this decline, our merchandise and services revenues increased primarily from our expanded core network, as more fully described below under the heading “Segment Results—U.S. Retail.” |
•A $36 million decline in our Canadian Retail segment operating revenues primarily attributable to:
◦ | A decrease in the retail price of our motor fuel as a result of a decline in wholesale gasoline prices, as more fully described below under the heading “Segment Results—Canadian Retail.” |
◦ | Partially offsetting this decline was an increase in the volume of motor fuel we sold as more fully described below under the heading “Segment Results—Canadian Retail.” |
◦ | Further offsetting the decline were improvements in same-store merchandise and services revenues as more fully described below under the heading “Segment Results—Canadian Retail.” |
• | A $138 million decline in our CrossAmerica operating revenues primarily as a result of a decline in the price of crude oil and a decline in the volume of motor fuel sold as more fully described below under the heading “Segment Results—CrossAmerica.” |
Cost of sales
Cost of sales increased $199 million as a result of the acquisition of Flash Foods.
Excluding the effects of Flash Foods, cost of sales declined $344 million.
Excluding Flash Foods, the decline in crude oil and wholesale gasoline prices, as discussed above under the heading “The Significance of Crude Oil and Wholesale Motor Fuel Prices on Our Revenues, Cost of Sales and Gross Profit” drove the decline.
Operating expenses
Operating expenses increased $17 million as a result of the acquisition of Flash Foods.
Excluding the effects of Flash Foods, operating expenses increased by $6 million primarily due to our expanded core network, including the 44 NTIs opened in the U.S. since the third quarter of 2015 and an increase of 15 stores in the average number of company-operated convenience stores during 2016 in Canada, partially offset by declines in our CrossAmerica segment, as more fully described below. Additionally, we recorded approximately $2 million of severance costs during the third quarter of 2016 primarily related to the sale of our California and Wyoming convenience store operations as more fully described in Note 2.
General and administrative expenses
Excluding the effects of Flash Foods, general and administrative expenses were slightly down primarily as a result of declines in CrossAmerica’s general and administrative expenses from the integration of prior year acquisitions resulting in the elimination
47
and reduction in duplicative administration costs, partially offset by an increase of $7 million in merger related expenses and legal and professional fees associated with discrete projects in the current year.
Depreciation, amortization and accretion expense
Depreciation, amortization and accretion expense increased $9 million related to the acquisition of Flash Foods.
Excluding the effects of Flash Foods, depreciation, amortization and accretion expense increased $5 million mainly due to our expanded core network of NTIs, partially offset by our sale of California and Wyoming convenience store operations.
Gain on sale of assets, net
The gain recognized during the third quarter of 2016 primarily relates to the sale of our California and Wyoming convenience store operations as more fully described in Note 2.
Income tax expense
Income tax expense increased $102 million, primarily as a result of the increase in income before income taxes. Our effective income tax rate including CrossAmerica was 36% for the three months ended September 30, 2016 compared to 33% for the three months ended September 30, 2015 due to the results of CrossAmerica, as well as lower Canadian earnings. CST’s standalone effective tax rate for the three months ended September 30, 2016 was 36% compared to 35% for the three months ended September 30, 2015 primarily due to a higher portion of our earnings being taxed at the higher U.S. Federal and State statutory tax rates.
48
Nine Months Ended September 30, 2016 Compared to Nine Months Ended September 30, 2015
Consolidated Results
Operating revenues increased $599 million and gross profit increased $86 million as a result of the acquisition of Flash Foods, which was completed on February 1, 2016.
Excluding the effects of the Flash Foods acquisition, operating revenues declined $1,257 million, while gross profit declined $43 million.
Operating revenues
Significant items impacting these results (excluding Flash Foods) were:
• | A $536 million decline in our U.S. Retail segment operating revenues primarily attributable to: |
◦ | A decrease in the retail price per gallon of motor fuel that we sold as a result of a decline in wholesale gasoline prices, as more fully described below under the heading “Segment Results—U.S. Retail.” |
◦ | Partially offsetting the decline was an increase in motor fuel gallons sold from our expanded core network and acquisitions, as more fully described below under the heading “Segment Results—U.S. Retail.” |
◦ | Further offsetting this decline, our merchandise and services revenues increased primarily as a result of our expanded core network and acquisitions as more fully described below under the heading “Segment Results—U.S. Retail.” |
•A $313 million decline in our Canadian Retail segment operating revenues primarily attributable to:
◦ | A decline of $61 million in operating revenues due to the foreign exchange effects of a weakening Canadian dollar relative to the U.S. dollar. On average, Canadian $1 was equal to U.S. $0.76 during the first nine months of 2016, and equal to U.S. $0.79 during the same period in 2015, representing a decrease in value of 4%. |
• | Excluding the effects of foreign exchange rate changes, our operating revenues decreased $251 million. This decrease was primarily attributable to: |
◦ | A decrease in the retail price of our motor fuel as a result of a decline in wholesale gasoline prices, as more fully described below under the heading “Segment Results—Canadian Retail.” |
◦ | A decline related to our business and home energy operations due to a decline in crude oil prices as more fully described below under the heading “Segment Results—Canadian Retail.” |
◦ | Partially offsetting this decline was an increase attributable to the volume of motor fuel we sold as more fully described below under the heading “Segment Results—Canadian Retail.” |
◦ | Further offsetting this decline was an increase from our merchandise and services revenue from an increase in the number of company-operated stores as more fully described below under the heading “Segment Results—Canadian Retail.” |
• | A $392 million decline in our CrossAmerica operating revenues primarily from a decline in the price of crude oil and a decline in the volume of motor fuel sold as more fully described below under the heading “Segment Results—CrossAmerica.” |
Cost of sales
Cost of sales increased $513 million as a result of the acquisition of Flash Foods.
Excluding the effects of Flash Foods, cost of sales declined $1,214 million.
Significant items impacting these results (excluding Flash Foods) were:
• | A $45 million decline as a result of the foreign exchange effects of the weakening of the Canadian dollar relative to the U.S. dollar as discussed above. |
49
• | The decline in crude oil and wholesale gasoline prices, as discussed above under the heading “The Significance of Crude Oil and Wholesale Motor Fuel Prices on Our Revenues, Cost of Sales and Gross Profit” drove the remainder of the decline. |
Operating expenses
Operating expenses increased $50 million as a result of the acquisition of Flash Foods.
Excluding the effects of Flash Foods, operating expenses increased by $16 million primarily due to our expanded core network, including the 44 NTIs opened in the U.S. since the third quarter of 2015, and approximately $2 million of severance costs related to the sale of our California and Wyoming convenience store operations, partially offset by declines in our CrossAmerica segment, as more fully described below.
General and administrative expenses
Excluding the effects of Flash Foods, general and administrative expenses declined by $7 million primarily from CrossAmerica’s integration of prior year acquisitions resulting in the elimination and reduction in duplicative administration costs, partially offset by an increase of $15 million in merger related expenses and legal and professional fees associated with discrete projects in the current year.
Depreciation, amortization and accretion expense
Depreciation, amortization and accretion expense increased $22 million as a result of the acquisition of Flash Foods.
Excluding the effects of Flash Foods, depreciation, amortization and accretion expense increased $14 million mainly due to our expanded core network of NTIs and other acquisitions, partially offset by our sale of California and Wyoming convenience store operations.
Gain on sale of assets, net
The gain recorded during the first nine months of 2016 primarily relates to the sale of our California and Wyoming convenience store operations discussed above. We completed the sale of nine convenience stores in the first nine months of 2015 and recognized a gain of $9 million in the U.S.
Other income, net
Other income, net increased $7 million primarily related to a gain on a U.S. dollar denominated intercompany loan payable from our Canadian subsidiary to the U.S. At September 30, 2016, the outstanding amount of this loan was $125 million. As foreign currency rates fluctuate and the loan remains outstanding, we will continue to recognize gains or losses on this intercompany loan.
Income tax expense
Income tax expense increased $111 million, primarily as a result of the increase in income before income taxes associated with the sale of our California stores. Our effective income tax rate including CrossAmerica was 37% for the nine months ended September 30, 2016 compared to 34% for the nine months ended September 30, 2015 primarily due to the results of CrossAmerica. CST’s standalone effective tax rate for the nine months ended September 30, 2016 was 36% compared to 35% for the nine months ended September 30, 2015 primarily due to a higher portion of our earnings being taxed at the higher U.S. statutory tax rate.
50
Segment Results
We present the results of operations of our segments consistent with how our management views the business. Therefore, the segments are presented before intercompany eliminations (which consist of motor fuel sold from our CrossAmerica segment to our U.S. Retail segment, CST Fuel Supply distributions and rent expense paid by our U.S. Retail segment to our CrossAmerica segment) and before purchase accounting adjustments related to the acquisition of CrossAmerica (primarily depreciation and amortization).
U.S. Retail
The following tables highlight the results of operations and certain operating metrics of our U.S. Retail segment. The narrative following these tables provides an analysis of the results of operations of that segment (millions of dollars, except for the number of convenience stores, per site per day and per gallon amounts):
Three Months Ended September 30, | Nine Months Ended September 30, | ||||||||||||||
2016 | 2015 | 2016 | 2015 | ||||||||||||
Operating revenues: | |||||||||||||||
Motor fuel | $ | 1,162 | $ | 1,236 | $ | 3,341 | $ | 3,499 | |||||||
Merchandise and services(a) | 474 | 404 | 1,361 | 1,140 | |||||||||||
Other(b) | 1 | 1 | 2 | 2 | |||||||||||
Total operating revenues | $ | 1,637 | $ | 1,641 | $ | 4,704 | $ | 4,641 | |||||||
Gross profit: | |||||||||||||||
Motor fuel–before amounts attributable to CrossAmerica | $ | 99 | $ | 155 | $ | 258 | $ | 282 | |||||||
Motor fuel–amounts attributable to CrossAmerica | (4 | ) | (5 | ) | (15 | ) | (10 | ) | |||||||
Motor fuel–after amounts attributable to CrossAmerica | 95 | 150 | 243 | 272 | |||||||||||
Merchandise and services(a) | 160 | 135 | 461 | 374 | |||||||||||
Other(b) | 1 | 1 | 2 | 2 | |||||||||||
Total gross profit | 256 | 286 | 706 | 648 | |||||||||||
Operating expenses: | |||||||||||||||
Operating expenses | 151 | 125 | 439 | 356 | |||||||||||
Depreciation, amortization and accretion expense | 34 | 25 | 98 | 72 | |||||||||||
Total operating expenses | 185 | 150 | 537 | 428 | |||||||||||
Gain on sale of assets, net | 347 | — | 347 | 7 | |||||||||||
Operating income | $ | 418 | $ | 136 | $ | 516 | $ | 227 | |||||||
Core store operating statistics:(c) | |||||||||||||||
End of period core stores | 1,154 | 1,027 | 1,154 | 1,027 | |||||||||||
Motor fuel sales (gallons per store per day) | 5,150 | 5,226 | 5,156 | 5,150 | |||||||||||
Motor fuel sales (per store per day) | $ | 10,661 | $ | 13,053 | $ | 10,271 | $ | 12,435 | |||||||
Motor fuel gross profit per gallon, net of credit card fees | $ | 0.178 | $ | 0.314 | $ | 0.155 | $ | 0.195 | |||||||
CST Fuel Supply wholesale profit attributable to CrossAmerica(e) | (0.009 | ) | (0.009 | ) | (0.009 | ) | (0.005 | ) | |||||||
Motor fuel gross profit per gallon, net of credit card fees(d), (e) | $ | 0.169 | $ | 0.305 | $ | 0.146 | $ | 0.190 | |||||||
Merchandise and services sales (per store per day)(a) | $ | 4,364 | $ | 4,294 | 4,180 | 4,013 | |||||||||
Merchandise and services gross profit percentage, net of credit card fees(a) | 33.7 | % | 33.4 | % | 33.9 | % | 32.9 | % | |||||||
51
U.S. Retail (continued)
Three Months Ended September 30, | Nine Months Ended September 30, | ||||||||||||||
2016 | 2015 | 2016 | 2015 | ||||||||||||
Company-operated retail sites: | |||||||||||||||
Beginning of period | 1,225 | 1,025 | 1,049 | 1,021 | |||||||||||
NTIs opened | 9 | 3 | 22 | 9 | |||||||||||
Acquisitions | — | — | 165 | 22 | |||||||||||
Closed or divested | (80 | ) | (1 | ) | (82 | ) | (25 | ) | |||||||
End of period | 1,154 | 1,027 | 1,154 | 1,027 | |||||||||||
End of period non-core retail stores | — | — | — | — | |||||||||||
End of period core retail stores | 1,154 | 1,027 | 1,154 | 1,027 | |||||||||||
Core store same-store information(c),(f): | |||||||||||||||
Company-operated retail stores(g) | 939 | 939 | 933 | 933 | |||||||||||
NTIs included in core same-store information(f) | 82 | 82 | 76 | 76 | |||||||||||
Motor fuel sales (gallons per store per day) | 5,074 | 5,142 | 5,016 | 5,033 | |||||||||||
Merchandise and services sales (per store per day)(a) | $ | 4,329 | $ | 4,457 | $ | 4,199 | $ | 4,228 | |||||||
Merchandise and services gross profit percent, net of credit card fees(a) | 34.0 | % | 33.4 | % | 34.0 | % | 32.9 | % | |||||||
Merchandise and services sales, ex. cigarettes (per store per day)(a) | $ | 3,225 | $ | 3,303 | $ | 3,106 | $ | 3,106 | |||||||
Merchandise and services gross profit percent, net of credit card fees and ex. cigarettes(a) | 39.9 | % | 39.5 | % | 40.0 | % | 39.0 | % | |||||||
Merchandise and services gross profit dollars(a) | $ | 127 | $ | 129 | $ | 365 | $ | 354 | |||||||
Notes to U.S. Retail Statistical Table
(a) | Includes the results from car wash sales and commissions from lottery, money orders, air/water/vacuum services, video and game rentals and ATM fees. |
(b) | Primarily consists of rental income. |
(c) | Represents the portfolio of core retail stores and excludes recently acquired retail stores that are being integrated or are under performance evaluation to determine if they are: (a) to be fully integrated into the existing core retail operations of CST, (b) to be converted into a dealer-operated site, or (c) other strategic alternatives, including divestiture or longer term operation by CrossAmerica. All NTIs are core stores and accordingly are included in the core system operating statistics. For the period of February 1 to March 31, 2016, Flash Foods stores were classified as non-core. Effective April 1, 2016, the Flash Foods stores are included in the U.S. Retail Segment’s core-store operations. Accordingly, their operations are excluded from the core system operating statistics for a portion of the nine-months period ended September 30, 2016, but are included in full for the three months ended September 30, 2016. |
(d) | Includes $0.05 per gallon of wholesale fuel distribution profit. |
(e) | CrossAmerica owns a 17.5% limited partner equity interest in CST Fuel Supply, which is the sole owner of CST Marketing & Supply, which distributes motor fuel to our retail operations at a net $0.05 per gallon margin. A separate entity, Fuel South LLC, distributes motor fuel to the Flash Foods retail operations. |
(f) | The same-store information consists of aggregated individual store results for all stores in operation substantially throughout both periods presented. Stores that were temporarily closed for a brief period of time during the periods being compared remain in the same-store sales comparison. If a store is replaced, either at the same location or relocated to a new location, it is removed from the comparison until the new store has been in operation for substantially all of the periods being compared. NTIs are included in the core same-store metrics when they meet this criteria. |
(g) | Includes 7 retail sites that do not sell motor fuel, which were acquired in the Nice N Easy acquisition. |
52
Three Months Ended September 30, 2016 Compared to Three Months Ended September 30, 2015
Operating revenues decreased $4 million, gross profit decreased $30 million and operating expenses increased $26 million.
The results were driven by:
Operating revenues
• | Excluding the impact of our California and Wyoming stores discussed below, we had an increase in motor fuel gallons sold of 22%, which increased motor fuel operating revenues by $242 million. The increase in motor fuel gallons sold resulted primarily from our expanded core network, which includes Flash Foods and NTIs. |
• | Excluding the impact of our California and Wyoming stores discussed below, our merchandise and services revenues increased $81 million. This increase was primarily a result of our expanded core network, which includes Flash Foods. |
• | Offsetting these increases was a decrease in the retail price per gallon of motor fuel that we sold, which contributed $240 million of the decrease to our motor fuel operating revenues, and was attributable to the volatility in wholesale gasoline prices, as discussed above under the heading “The Significance of Crude Oil and Wholesale Motor Fuel Prices on Our Revenues, Cost of Sales and Gross Profit.” The average daily spot price of GCC gasoline decreased to $1.39 per gallon during 2016 compared to $1.60 per gallon during 2015, representing a 13% decrease. |
• | Primarily as a result of the divestiture of our convenience store operations in California and Wyoming, motor fuel operating revenues decreased by $76 million due to the decline in motor fuel gallons sold and merchandise and services revenues decreased $11 million. |
Gross profit
• | Excluding the impact of our California and Wyoming stores discussed below, our motor fuel gross profit increased $30 million due to an increase in the gallons of motor fuel that we sold from our expanded core network, which includes Flash Foods. |
• | Our motor fuel gross profit decreased $76 million as a result of crude oil prices being more volatile during the third quarter of 2015 than the third quarter of 2016 and the resulting impact on our motor fuel gross margin. The daily spot price of West Texas Intermediate crude oil decreased approximately 20% during the third quarter of 2015 compared to approximately 3% during the third quarter of 2016. See further discussion under the heading “The Significance of Crude Oil and Wholesale Motor Fuel Prices on Our Revenues, Cost of Sales and Gross Profit.” |
• | Excluding the impact of our California and Wyoming stores discussed below, our merchandise and services gross profit increased $29 million. This increase was primarily from the contribution of the Flash Foods stores and from the contribution of newly constructed NTIs. |
• | Primarily as a result of the divestiture of our convenience store operations in California and Wyoming, motor fuel gross profits decreased by $9 million due to the decline in motor fuel gallons sold and merchandise and services gross profits decreased $4 million. |
Operating expenses
Operating expenses increased $26 million as a result of our expanded core network, including the 44 NTIs opened since the third quarter of 2015 and the acquisition of Flash Foods.
Depreciation, amortization and accretion expense
Depreciation, amortization and accretion expense increased $9 million as a result of our expanded core network, which includes Flash Foods.
53
Nine Months Ended September 30, 2016 Compared to Nine Months Ended September 30, 2015
Operating revenues increased $63 million, gross profit increased $58 million and operating expenses increased $83 million.
The results were driven by:
Operating revenues
• | Excluding the impact of our California and Wyoming stores discussed below, we had an increase in motor fuel gallons sold of 17%, which increased motor fuel operating revenues by $528 million. The increase in motor fuel gallons sold resulted from our expanded core network, which includes Flash Foods and NTIs. |
• | Excluding the impact of our California and Wyoming stores discussed below, our merchandise and services revenues increased $232 million. This increase was from an increase in sales associated with our expanded core network, which includes Flash Foods. |
• | Partially offsetting these increases was a decrease in the retail price per gallon of motor fuel that we sold, which contributed $608 million of the decrease to our motor fuel operating revenues, and was attributable to the volatility in wholesale gasoline prices, as discussed above under the heading “The Significance of Crude Oil and Wholesale Motor Fuel Prices on Our Revenues, Cost of Sales and Gross Profit.” The average daily spot price of GCC gasoline decreased to $1.29 per gallon during 2016 compared to $1.66 per gallon during 2015, representing a 22% decrease. |
• | Primarily as a result of the divestiture of our convenience store operations in California and Wyoming, motor fuel operating revenues decreased by $78 million due to the decline in motor fuel gallons sold and merchandise and services revenues decreased $11 million. |
Gross profit
• | A decrease in motor fuel gross profit due to a $62 million decline from our motor fuel gross profit per gallon. The decline in our motor fuel gross profit per gallon was driven by volatility in crude oil and wholesale motor fuel prices, as discussed under the heading “The Significance of Crude Oil and Wholesale Motor Fuel Prices on Our Revenues, Cost of Sales and Gross Profit.” |
• | The effect of the CST Fuel Supply distributions to CrossAmerica decreased motor fuel gross profit by $6 million. As discussed in Note 8 included elsewhere in this quarterly report, CrossAmerica increased its ownership in CST Fuel Supply to 17.5% during 2015, which resulted in an increase in the distribution to CrossAmerica. |
• | Partially offsetting the decrease to motor fuel gross profit was the increase in motor fuel gallons sold, which increased motor fuel gross profit by $45 million excluding the impact of our California and Wyoming stores. The increase in motor fuel gallons sold resulted from our expanded core network, which includes Flash Foods. |
• | Excluding the impact of our California and Wyoming stores discussed below, our merchandise and services gross profit increased $90 million. This increase was primarily from a $76 million increase in sales associated with our expanded core network, including the 44 NTIs opened since the third quarter of 2015 and the acquisition of Flash Foods, and from an $11 million increase in our gross profit percentage due to a more profitable merchandise mix in our same-store base. |
• | Primarily as a result of the divestiture of our convenience store operations in California and Wyoming, motor fuel gross profits decreased by $6 million due to the decline in motor fuel gallons sold and merchandise and services revenues decreased $3 million. |
Operating expenses
Operating expenses increased $83 million as a result of our expanded core network, including the 44 NTIs opened since the third quarter of 2015 and the acquisition of Flash Foods, and the $5 million impact on rent expense as a result of the sale and lease back transactions with CrossAmerica that occurred in July 2015.
Depreciation, amortization and accretion expense
Depreciation, amortization and accretion expense increased $26 million as a result of our expanded core network, which includes Flash Foods.
54
Canadian Retail
The following tables highlight the results of operations and certain operating metrics of our Canadian Retail segment, expressed in U.S. dollars, except for retail site counts and motor fuel gallons. The narrative following these tables provides an analysis of the results of operations of that segment (which are expressed in millions of U.S. dollars, except where indicated and except for the number of retail sites, per site per day and per gallon amounts):
Three Months Ended September 30, | Nine Months Ended September 30, | ||||||||||||||
2016 | 2015 | 2016 | 2015 | ||||||||||||
Operating revenues: | |||||||||||||||
Motor fuel | $ | 684 | $ | 734 | $ | 1,881 | $ | 2,178 | |||||||
Merchandise and services(a) | 75 | 70 | 202 | 194 | |||||||||||
Other(b) | 70 | 61 | 231 | 255 | |||||||||||
Total operating revenues | $ | 829 | $ | 865 | $ | 2,314 | $ | 2,627 | |||||||
Gross profit: | |||||||||||||||
Motor fuel | $ | 63 | $ | 61 | $ | 169 | $ | 170 | |||||||
Merchandise and services(a) | 22 | 21 | 63 | 61 | |||||||||||
Other(b) | 10 | 10 | 42 | 45 | |||||||||||
Total gross profit | 95 | 92 | 274 | 276 | |||||||||||
Operating expenses: | |||||||||||||||
Operating expenses | 53 | 51 | 160 | 160 | |||||||||||
Depreciation, amortization and accretion expense | 10 | 9 | 30 | 28 | |||||||||||
Total operating expenses | 63 | 60 | 190 | 188 | |||||||||||
Gain on sale of assets, net | 3 | — | 4 | — | |||||||||||
Operating income | $ | 35 | $ | 32 | $ | 88 | $ | 88 | |||||||
Total retail sites (end of period): | |||||||||||||||
Company-operated (fuel and merchandise) | 309 | 291 | 309 | 291 | |||||||||||
Commission agents and dealers (fuel only) | 498 | 497 | 498 | 497 | |||||||||||
Cardlock (fuel only) | 72 | 72 | 72 | 72 | |||||||||||
Total retail sites (end of period) | 879 | 860 | 879 | 860 | |||||||||||
Average retail sites during the period: | |||||||||||||||
Company-operated (fuel and merchandise) | 307 | 292 | 306 | 293 | |||||||||||
Commission agents and dealers (fuel only) | 496 | 496 | 495 | 495 | |||||||||||
Cardlock (fuel only) | 72 | 72 | 72 | 72 | |||||||||||
Average retail sites during the period | 875 | 860 | 873 | 860 | |||||||||||
Total system operating statistics: | |||||||||||||||
Motor fuel sales (gallons per site per day) | 3,355 | 3,270 | 3,171 | 3,188 | |||||||||||
Motor fuel sales (per site per day) | $ | 8,508 | $ | 9,273 | $ | 7,865 | $ | 9,279 | |||||||
Motor fuel gross profit per gallon, net of credit card fees | $ | 0.231 | $ | 0.237 | $ | 0.222 | $ | 0.227 | |||||||
Company-operated retail site statistics: | |||||||||||||||
Merchandise and services sales (per site per day)(a) | $ | 2,630 | $ | 2,603 | $ | 2,405 | $ | 2,425 | |||||||
Merchandise and services gross profit percentage, net of credit card fees(a) | 30.3 | % | 30.4 | % | 31.4 | % | 31.6 | % | |||||||
55
Canadian Retail (continued)
Three Months Ended September 30, | Nine Months Ended September 30, | ||||||||||||||
Company-operated statistics(c) | 2016 | 2015 | 2016 | 2015 | |||||||||||
Retail sites: | |||||||||||||||
Beginning of period | 305 | 292 | 303 | 293 | |||||||||||
NTIs opened | 4 | — | 7 | 2 | |||||||||||
Acquisitions | — | — | — | — | |||||||||||
Conversions, net(d) | — | — | 1 | — | |||||||||||
Closed or divested | — | (1 | ) | (2 | ) | (4 | ) | ||||||||
End of period | 309 | 291 | 309 | 291 | |||||||||||
Average foreign exchange rate for $1 CAD to USD | 0.76390 | 0.76373 | 0.75711 | 0.79413 | |||||||||||
Same-store information ($ amounts in CAD)(e), (f): | |||||||||||||||
Company-operated retail sites | 288 | 288 | 287 | 287 | |||||||||||
NTIs included in same site information | 35 | 35 | 34 | 34 | |||||||||||
Motor fuel sales (gallons per site per day) | 3,517 | 3,478 | 3,395 | 3,415 | |||||||||||
Merchandise and services sales (per site per day)(a) | $ | 3,488 | $ | 3,387 | $ | 3,218 | $ | 3,087 | |||||||
Merchandise and services gross profit percent, net of credit card fees(a) | 30.3 | % | 30.8 | % | 31.5 | % | 31.6 | % | |||||||
Merchandise and services sales, ex. cigarettes (per site per day)(a) | $ | 1,890 | $ | 1,840 | $ | 1,742 | $ | 1,690 | |||||||
Merchandise and services gross profit percent, net of credit card fees and ex. cigarettes(a) | 42.4 | % | 42.3 | % | 43.5 | % | 43.3 | % | |||||||
Merchandise and services gross profit dollars(a) | $ | 28 | $ | 28 | $ | 80 | $ | 76 | |||||||
Commission agent and dealer statistics(c) | |||||||||||||||
Retail sites: | |||||||||||||||
Beginning of period | 496 | 495 | 494 | 495 | |||||||||||
New dealers | 5 | 3 | 12 | 6 | |||||||||||
Conversions, net(d) | — | — | (1 | ) | — | ||||||||||
Closed or de-branded | (3 | ) | (1 | ) | (7 | ) | (4 | ) | |||||||
End of period | 498 | 497 | 498 | 497 | |||||||||||
Same Site Information(f): | |||||||||||||||
Commission agent and dealer retail sites | 467 | 467 | 464 | 464 | |||||||||||
Motor fuel sales (gallons per site per day) | 2,921 | 2,897 | 2,691 | 2,729 | |||||||||||
Notes to Canadian Retail Statistical Table
(a) | Includes the results from car wash sales, commissions from lottery and ATM fees. |
(b) | Primarily consists of our business and home energy operations. |
(c) | Company-operated retail stores sell motor fuel and merchandise. The company sells only motor fuel at commission agent and dealer sites. We do not currently distinguish between core and non-core stores in our Canadian Retail segment. All sites in our Canadian Retail segment are core stores. |
(d) | Conversions represent stores that have changed their classification from commission agents to company-owned and operated or vice versa. Changes in classification result when we either take over the operations of commission agents or convert an existing company-owned and operated store to commission agents. |
(e) | All amounts presented are stated in Canadian dollars to remove the impact of foreign exchange and all fuel information excludes amounts related to cardlock operations. |
56
(f) | The same-store and same-site information consists of aggregated individual store results for all sites in operation substantially throughout both periods presented. Stores that were temporarily closed for a brief period of time during the periods being compared remain in the same-store sales comparison. If a store is replaced, either at the same location or relocated to a new location, it is removed from the comparison until the new store has been in operation for substantially all of the periods being compared. NTIs are included in the same-store metrics when they meet this criteria. |
Three Months Ended September 30, 2016 Compared to Three Months Ended September 30, 2015
Operating revenues declined $36 million, gross profit increased $3 million, operating expenses increased $2 million, and operating income increased $3 million.
Significant items impacting these results included:
Operating revenues
• | A $101 million decrease in operating revenues primarily attributable to a decrease in the retail price of our motor fuel. The average daily spot price of NYHC gasoline decreased to $1.39 per gallon during the third quarter of 2016, compared to $1.65 per gallon during the same period of 2015. |
• | Partially offsetting this decline was a $42 million increase attributable to a 4% increase in the volume of motor fuel we sold mainly related to the increase in the average number of retail sites and the same-store volume increase in our cardlock and company-operated retail stores as compared to the same period of the prior year. |
• | Further offsetting the decline were an increase in merchandise and services revenues of $5 million from an increase in the number of company-operated stores as well as an increase in same-store sales of 3% attributable to growth in the grocery and packaged beverage business, as well as an increase in alcohol sales generated by craft beer. |
• | Other operating revenues increased $9 million primarily related to increased volumes at our wholesale business and home energy operations. |
• | The effects of foreign exchange were not significant to our operating revenues during the quarter. |
Gross profit
• | Our motor fuel gross profit increased $2 million driven by slight increases in both price and volume. |
• | Our merchandise and services gross profit increased $1 million as a result of an increase in the number of company-operated convenience stores during 2016, resulting from NTI openings, as well as growth in same-store merchandise and services as discussed above. |
• | The effects of foreign exchange were not significant to our gross profit during the quarter. |
Operating expenses
Operating expenses increased $2 million primarily from an increase of 15 stores in the average number of company-operated convenience stores during 2016.
57
Nine Months Ended September 30, 2016 Compared to Nine Months Ended September 30, 2015
Operating revenues declined $313 million and gross profit declined $2 million.
Significant items impacting these results included:
Operating revenues
• | A decline of $61 million in operating revenues due to the foreign exchange effects of a weakening Canadian dollar relative to the U.S. dollar. On average, Canadian $1 was equal to U.S. $0.76 during the first nine months of 2016, and equal to U.S. $0.79 during the same period of 2015, representing a decrease in value of 4%. |
• | Excluding the effects of foreign exchange rate changes, our operating revenues decreased $251 million. This decrease was primarily attributable to: |
◦ | A $296 million decrease in operating revenues primarily attributable to a decrease in the retail price of our motor fuel. In terms of Canadian dollars, the average daily spot price of NYHC gasoline decreased to $1.77 per gallon during the first nine months of 2016, compared to $2.15 per gallon during the same period of 2015. |
◦ | Other revenues declined $24 million related to our business and home energy operations as a result of the decline in the base cost of heating oil. |
◦ | Partially offsetting this decline was a $39 million increase attributable to a 1% increase in the volume of motor fuel we sold mainly related to the increase in company-operated retail stores as compared to the same period of the prior year. |
◦ | Further offsetting this decline was an increase of $22 million from our merchandise and services revenue from an increase in the number of company-operated stores as well as an increase in same-store sales of 5% attributable to growth in the grocery and packaged beverage business, as well as an increase in cigarettes and an increase in alcohol sales generated by craft beer. |
Gross profit
• | Our motor fuel gross profit decreased $1 million driven by foreign exchange effects, which was partially offset by increases in both price and volume. |
• | Excluding the effects of foreign exchange, our merchandise and services gross profit increased $7 million as a result of an increase in the number of company-operated convenience stores during 2016, resulting from NTI openings, as well as growth in same-store merchandise and services as discussed above. |
58
CrossAmerica
The following table highlights the results of operations and certain operating metrics of CrossAmerica. CrossAmerica is presented excluding the accounting purchase price adjustments and before elimination of transactions with our U.S. Retail segment to be consistent with how our management reviews its results. The impact of the purchase accounting adjustments is to increase depreciation, amortization and accretion expense by $8 million and $23 million for the three and nine months ended September 30, 2016, respectively, and by $4 million and $20 million for the three and nine months ended September 30, 2015, respectively. As discussed in Note 8 included elsewhere in this quarterly report, transactions with our U.S. Retail segment consisted of a wholesale mark-up on purchased motor fuel, rent income and equity ownership interest in CST Fuel Supply. Additionally, CST provides management and corporate support services to CrossAmerica and charges CrossAmerica a management fee under the terms of the Amended and Restated Omnibus Agreement, as well as an allocation of certain incentive compensation. All transactions between our U.S. Retail segment and CrossAmerica are eliminated from our consolidated financial statements. Approximately 81% and 91% of CrossAmerica’s operating results are attributable to noncontrolling interests for the nine months ended September 30, 2016 and 2015, respectively. CrossAmerica is a publicly traded Delaware limited partnership and its units are listed for trading on the New York Stock Exchange under the symbol “CAPL.” As a result, CrossAmerica is required to file reports with the SEC, where additional information about its results of operations can be found and should be read in conjunction with the table below (millions of dollars).
Three Months Ended September 30, | Nine Months Ended September 30, | ||||||||||||||
2016 | 2015 | 2016 | 2015 | ||||||||||||
Operating revenues | $ | 489 | 628 | $ | 1,368 | $ | 1,760 | ||||||||
Cost of sales | 450 | 576 | 1,251 | 1,629 | |||||||||||
Gross profit | 39 | 52 | 117 | 131 | |||||||||||
Income from CST Fuel Supply | 4 | 4 | 12 | 6 | |||||||||||
Operating expenses: | |||||||||||||||
Operating expenses | 14 | 20 | 46 | 58 | |||||||||||
General and administrative expenses | 6 | 10 | 18 | 27 | |||||||||||
Depreciation, amortization and accretion expense | 13 | 13 | 41 | 36 | |||||||||||
Total operating expenses | 33 | 43 | 105 | 121 | |||||||||||
Gain on sales of assets, net | 1 | 2 | 1 | 2 | |||||||||||
Operating income | $ | 11 | $ | 15 | $ | 25 | $ | 18 | |||||||
Three Months Ended September 30, 2016 Compared to Three Months Ended September 30, 2015
Operating revenues declined $138 million while gross profit declined $13 million.
Operating revenues
Significant items impacting these results were:
• | An $84 million decline primarily attributable to a decline in crude oil and wholesale motor fuel prices, as discussed under the heading “The Significance of Crude Oil and Wholesale Motor Fuel Prices on Our Revenues, Cost of Sales and Gross Profit” and the divestiture of low margin wholesale fuel supply contracts and other assets. |
• | A $38 million decline related to a decline in motor fuel volumes associated with terminating low margin wholesale fuel supply contracts and disposing of other assets acquired in the PMI acquisition. |
• | A $20 million decline in our merchandise and services revenues in our retail segment from converting company-operated sites to the dealer customer group. |
• | Partially offsetting this decline was an increase of $2 million primarily from rental income related to converting company-operated retail stores to the dealer customer group and acquisitions. |
59
Cost of sales
Cost of sales declined $126 million primarily from the decline in crude oil prices discussed above.
Operating expenses
Operating expenses declined $6 million primarily attributable to the conversion of company-operated stores to the dealer customer group and the divestment of certain PMI assets.
General and administrative expenses
General and administrative expenses declined $4 million primarily attributable to the integration of prior year acquisitions.
Nine Months Ended September 30, 2016 Compared to Nine Months Ended September 30, 2015
Operating revenues declined $392 million and gross profit declined $14 million.
Operating revenues
Significant items impacting these results were:
• | A $328 million decline primarily attributable to a decline in crude oil and wholesale motor fuel prices, as discussed under the heading “The Significance of Crude Oil and Wholesale Motor Fuel Prices on Our Revenues, Cost of Sales and Gross Profit” and the divestiture of low margin wholesale fuel supply contracts and other assets. |
• | A $50 million decline related to a decline in volumes associated with terminating low margin wholesale fuel supply contracts and disposing of other assets acquired in the PMI acquisition. |
• | A $27 million decline in our merchandise and services revenues in our retail segment from converting company-operated sites to the dealer customer group. |
• | Partially offsetting this decline was a $13 million increase primarily related to rental income associated with CrossAmerica’s acquisition from CST of NTI convenience stores in July 2015 as well as converting company-operated retail stores to the dealer customer group. |
Cost of sales
Cost of sales declined $378 million primarily from the decline in crude oil prices discussed above.
Income from CST Fuel Supply
Income from CST Fuel Supply increased $6 million driven by an additional 12.5% equity interest acquired by CrossAmerica in July 2015.
Operating expenses
Operating expenses decreased $12 million attributable to the conversion of company-operated stores to the dealer customer group.
General and administrative expenses
General and administrative expenses declined $9 million primarily attributable to the integration of prior year acquisitions.
Depreciation, amortization and accretion expense
Depreciation, amortization and accretion expense increased $5 million primarily driven by CrossAmerica’s 2015 and 2016 acquisitions.
60
Outlook
We periodically review and consider strategic developments and alternatives and the Board of Directors from time to time meets with management to discuss company performance and to consider potential strategic alternatives. To this end, on August 21, 2016, our Board of Directors unanimously approved the Merger, and subject to the terms and conditions thereof, Couche-Tard will acquire all of the shares of CST, with the Merger currently expected to close early calendar year 2017. The Merger is subject to the approval of CST’s stockholders and regulatory approvals in the United States and Canada. We have scheduled a special meeting of our stockholders for November 16, 2016 to consider and vote on the Merger. As discussed under the heading “Merger Agreement”, the applicable waiting period under the HSR Act will expire on November 16, 2016, unless otherwise earlier terminated or extended by the FTC and the Antitrust Division. The Merger Agreement contains certain restrictions that may limit our ability to undertake or continue various strategic initiatives without Couche-Tard’s consent. Additionally, there are a number of other factors related to the Merger and Merger Agreement that could impact our operations, which are included under the heading “Cautionary Statement for the Purpose of the Safe Harbor Provisions of the Private Securities Litigation Reform Act of 1995.”
61
Liquidity and Capital Resources
Capital Structure
CST and CrossAmerica maintain separate debt and equity capital structures. As such, CST and CrossAmerica each maintain credit facilities with separate covenants and restrictions. In addition, CST has outstanding publicly registered 5% senior notes due 2023, the terms of which are covered by a bond indenture. CST’s subsidiary that owns 100% of the membership interests in the General Partner has been designated an “unrestricted” subsidiary under this bond indenture and there are no guarantees of outstanding debt between CST and CrossAmerica. However, the IDRs and any current and future common units representing limited partner interests acquired and owned by CST are considered collateral under CST’s revolving credit facility.
Consolidated Cash Flows
The following table summarizes cash flow activity (in millions):
Nine Months Ended September 30, | ||||||||
2016 | 2015 | |||||||
Net Cash Provided by Operating Activities | $ | 311 | $ | 340 | ||||
Net Cash Used in Investing Activities | $ | (398 | ) | $ | (369 | ) | ||
Net Cash Provided by Financing Activities | $ | (34 | ) | $ | 135 | |||
Operating Activities
The increase in cash provided by operating activities was primarily the result of our recent acquisitions and recently opened NTIs. Changes in cash provided by or used for working capital are shown in Note 15 included elsewhere in this annual report.
Investing Activities
During the nine months ended September 30, 2016, cash used for the Flash Foods, State Oil and Holiday acquisitions was $532 million. We additionally had capital expenditures of $251 million, primarily for our NTIs. These cash outflows were offset by the proceeds from the sale of assets of $410 million, primarily from the sale of our California and Wyoming stores, which was offset by $25 million in cash restricted for use. Cash used in investing activities during the nine months ended September 30, 2015 were primarily the acquisitions of Landmark and Erickson, as well as capital expenditures for NTIs.
Financing Activities
During the nine months ended September 30, 2016, we had net proceeds under the CrossAmerica revolving credit facility of $96 million, net payments under the CST revolving credit facility of $10 million, spent $3 million on CrossAmerica’s unit repurchase program, $15 million for the payment of dividends on CST common stock, $48 million for the payment of CrossAmerica distributions and payments of $50 million on the CST term loan. Borrowings during the period on the CST revolving credit facility, along with cash on hand, were used to finance the Flash Foods acquisition and borrowings on the CrossAmerica revolving credit facility were used to finance the Holiday and State Oil acquisitions.
During the nine months ended September 30, 2015, CrossAmerica had net borrowings of $150 million on its revolving credit facility primarily to finance the Landmark, Erickson and One Stop acquisitions. Additionally, CrossAmerica issued 4.8 million common units in exchange for net cash proceeds of $145 million and used the net proceeds of this offering to repay indebtedness outstanding under its revolving credit facility. Offsetting CrossAmerica's financing cash inflow were distributions paid of $41 million. During this period, CST made payments of $34 million on the CST term loan, repurchased common shares totaling $65 million, and paid dividends of $15 million.
62
Consolidated Debt
As of September 30, 2016, our consolidated debt consisted of the following (in millions):
CST debt:(a) | ||||
$500 million revolving credit facility | $ | 50 | ||
Term loan due 2019 | 356 | |||
5.00% senior notes due 2023 | 550 | |||
Total CST debt | $ | 956 | ||
CrossAmerica debt:(b) | ||||
$550 million revolving credit facility | $ | 455 | ||
Other | 1 | |||
Total CrossAmerica debt | $ | 456 | ||
Total consolidated debt outstanding | $ | 1,412 | ||
Less current portion: | ||||
CST | 105 | |||
CrossAmerica | — | |||
Consolidated debt, less current portion | $ | 1,307 | ||
(a) The assets of CST can only be used to settle the obligations of CST and creditors of CST have no recourse to the assets or general credit of CrossAmerica. CST has pledged its equity ownership in CrossAmerica to secure the CST Credit Facility.
(b) The assets of CrossAmerica can only be used to settle the obligations of CrossAmerica and creditors of CrossAmerica have no recourse to the assets or general credit of CST.
Debt related to CST
On January 29, 2016, CST amended its Credit Facility to increase borrowing capacity from $300 million to $500 million and immediately drew $307 million under the amended Credit Facility to fund a portion of the Flash Foods acquisition and pay fees of $1 million associated with the amendment. The amended credit facility is secured by substantially all of the assets of CST and its subsidiaries. As of September 30, 2016, CST’s outstanding borrowings currently under this Credit Facility bear a weighted average interest of 2.28%. As of November 4, 2016, approximately $349 million was available for future borrowings under the revolving credit facility. The amended Credit Facility contains certain customary representations and warranties, covenants and events of default. Our amended Credit Facility contains financial covenants (as defined in the credit agreement) consisting of (a) a maximum total lease adjusted leverage ratio set at 3.50 to 1.00, (b) a minimum fixed charge coverage ratio set at 1.30 to 1.00, and (c) limitations on capital expenditures. As of September 30, 2016, we were in compliance with these financial covenant ratios.
See Note 7 included elsewhere in this quarterly report for additional information regarding CST’s debt.
Debt related to CrossAmerica
CrossAmerica maintains a revolving credit facility that provides for aggregate outstanding borrowings of up to $550 million. CrossAmerica’s borrowings had an interest rate of 3.52% as of September 30, 2016. The credit facility is secured by substantially all of the assets of CrossAmerica and its subsidiaries. The amount of availability under the revolving credit facility at November 4, 2016, was $53 million. In connection with future acquisitions, the revolving credit facility requires, among other things, that CrossAmerica has, after giving effect to such acquisition, at least $20 million of borrowing availability under its revolving credit facility and unrestricted cash on the balance sheet on the date of such acquisition. CrossAmerica is required to maintain a total leverage ratio (as defined in the revolving credit facility) for the most recently completed four fiscal quarters of less than or equal to 5.00 to 1.00 and a consolidated interest coverage ratio (as defined in the revolving credit facility) of greater than or equal to 2.75 to 1.00. The total leverage ratio covenant is 5.00 to 1.00 for the two quarters following a material acquisition (as defined in the revolving credit facility). As such, the total leverage ratio steps down to 4.50 to 1.00 on December 31, 2016 assuming there are no material acquisitions for the remainder of 2016. As of September 30, 2016, CrossAmerica was in compliance with these financial covenant ratios.
See Note 7 included elsewhere in this quarterly report for additional information regarding CrossAmerica’s debt.
63
Consolidated Capital Requirements
Our capital expenditures and investments relate primarily to the acquisition of land and the construction of NTIs. We also spend capital to improve, renovate and remodel our existing retail sites, which we refer to as sustaining capital and, from time to time, we enter into strategic acquisitions. For the nine months ended September 30, 2016, our sustaining capital expenditures also include $18 million related to the improvement of our distribution warehouse and adjoining service center offices in San Antonio, Texas.
During 2015, CST conducted several transactions with CrossAmerica to help fund CST’s NTI construction and acquisition growth activities including the sale of a 17.5% equity interest in CST Fuel Supply LP and the sale of real property associated with 29 NTIs, which CST leased back from CrossAmerica. In addition, CrossAmerica participated in the Nice N Easy and Landmark acquisitions by purchasing the fuel supply and real property assets related to the acquisitions and subsequently providing motor fuel and leasing the real property to CST.
In the second half of 2015, access to capital tightened for the energy and MLP industries as a whole, which impacted CrossAmerica’s cost of capital and its ability to fund acquisitions of assets from CST on economic terms more favorable than those Cross America has negotiated in recent third-party acquisitions. CST and CrossAmerica regularly evaluate alternative sources of funding including, but not limited to, asset sales and sale-leaseback financing of real property with third parties.
Management believes CST and CrossAmerica will have sufficient cash flow from operations, borrowing capacity under their revolving credit facilities, and access to capital markets and alternative sources of funding to continue to operate and fund our growth for the next twelve months.
During the nine months ended September 30, 2016, CST completed twenty-two NTIs in the U.S., which are located in Texas, Arizona, Georgia and Florida. In Canada, we completed seven NTIs, which are located in Ontario and Québec.
The following table outlines our consolidated capital expenditures and expenditures for acquisitions by segment for the nine months ended September 30, 2016 and 2015. The table includes the elimination of acquisitions between CST and CrossAmerica including the sale of fuel supply interest and NTI sales (in millions):
Nine Months Ended September 30, | ||||||||
2016 | 2015 | |||||||
U.S. Retail Segment | ||||||||
NTI | $ | 170 | $ | 149 | ||||
Acquisitions | 438 | 22 | ||||||
Sustaining capital | 51 | 55 | ||||||
$ | 659 | $ | 226 | |||||
Canadian Retail Segment | ||||||||
NTI | $ | 20 | $ | 12 | ||||
Acquisitions | — | — | ||||||
Sustaining capital | 10 | 17 | ||||||
$ | 30 | $ | 29 | |||||
CrossAmerica | ||||||||
Sustaining capital(a) | $ | 12 | $ | 8 | ||||
Acquisitions(b) | 94 | 167 | ||||||
$ | 106 | $ | 175 | |||||
Total aggregate capital expenditures and acquisitions(c) | $ | 795 | $ | 430 | ||||
(a) CrossAmerica’s sustaining capital expenditures include approximately $11 million and $7 million of growth capital expenditures for the nine months ended September 30, 2016 and 2015, respectively, which are those capital expenditures expected to increase CrossAmerica’s operating income or operating capacity over the long term.
(b) Cash transactions between CST and CrossAmerica, including sales of CST Fuel Supply equity interest and sales of NTIs, are eliminated from the statements of cash flows.
(c) Includes $12 million of accrued capital expenditures in our U.S. Retail segment.
64
Other Matters Impacting Liquidity and Capital Resources
Cash Held by Our Canadian Subsidiary
As of September 30, 2016, $44 million of cash was held in Canada. In December 2015, we established a U.S. dollar denominated intercompany loan from the U.S. to a Canadian subsidiary in the amount of $360 million and incurred a withholding tax of $18 million. During the nine months ended September 30, 2016, the Canadian subsidiary repaid $235 million of this loan. At September 30, 2016, the outstanding amount of this loan was $125 million. As this loan is repaid, no additional income taxes will be incurred. As foreign exchange rates fluctuate, we will recognize either a gain or loss related to the outstanding balance of this loan in “other income” on our consolidated income statement.
Cash Held by CrossAmerica
As of September 30, 2016, $3 million of cash was held by CrossAmerica.
Concentration of Suppliers
For the three and nine months ended September 30, 2016, CST purchased substantially all of its motor fuel for resale from Valero. See Note 1 included elsewhere in this quarterly report for additional information.
Concentration of Customers
CST has no significant concentration of customers. For the three and nine months ended September 30, 2016, CrossAmerica distributed approximately 16% and 17% of its total wholesale distribution volumes to DMS and received 25% and 27% of its rent income from DMS, respectively. For the three and nine months ended September 30, 2016, CrossAmerica distributed 8% of its total wholesale distribution volume to CST and received 21% and 22% of its rent income from CST, respectively.
CST Dividends
We have paid regular quarterly cash dividends of $0.0625 per common share, or $5 million, each quarter, commencing with the quarter ended September 30, 2013 through the quarter ended June 30, 2016. Our indebtedness restricts our ability to pay dividends. The Merger Agreement also prohibits, among other things, us from declaring and paying quarterly cash dividends between August 21, 2016 and completion of our Merger. As such, there can be no assurance we will pay dividends in the future at previous levels or at all. Dividend activity for 2016 was as follows:
Quarter Ended | Record Date | Payment Date | Cash Distribution (per share) | Cash Distribution (in millions) | ||||||||
December 31, 2015 | December 31, 2015 | January 15, 2016 | $ | 0.0625 | $ | 5 | ||||||
March 31, 2016 | March 31, 2016 | April 15, 2016 | $ | 0.0625 | $ | 5 | ||||||
June 30, 2016 | June 30, 2016 | July 15, 2016 | $ | 0.0625 | $ | 5 | ||||||
CrossAmerica Limited Partnership Distributions
Distribution activity for 2016 was as follows:
Quarter Ended | Record Date | Payment Date | Cash Distribution (per unit) | Cash Distribution (in millions) | ||||||||
December 31, 2015 | February 12, 2016 | February 24, 2016 | $ | 0.5925 | $ | 20 | ||||||
March 31, 2016 | May 19, 2016 | May 31, 2016 | $ | 0.5975 | $ | 20 | ||||||
June 30, 2016 | August 8, 2016 | August 15, 2016 | $ | 0.6025 | $ | 20 | ||||||
On October 24, 2016, the board of directors of the General Partner approved a quarterly distribution of $0.6075 per unit attributable to the third quarter of 2016. The distribution is payable on November 15, 2016 to all unitholders of record on November 4, 2016.
The amount of any distribution is subject to the discretion of the board of directors of the General Partner, which may modify or revoke CrossAmerica’s cash distribution policy at any time. CrossAmerica’s partnership agreement does not require CrossAmerica to pay any distributions. As such, there can be no assurance CrossAmerica will continue to pay distributions in the future.
65
For the three and nine months ended September 30, 2016, CrossAmerica distributed $4 million and $12 million to us with respect to our ownership of common units, respectively. For the three and nine months ended September 30, 2015, CrossAmerica distributed $1 million and $5 million to us with respect to our ownership of common units, respectively.
CrossAmerica IDR Distributions to CST
For the three and nine months ended September 30, 2016, CrossAmerica distributed $1 million and $2 million to us with respect to our ownership of CrossAmerica’s IDRs, respectively. For the three and nine months ended September 30, 2015, these distributions were immaterial and $1 million, respectively.
Conversion of CrossAmerica’s Subordinated Units
On February 25, 2016, the 7,525,000 outstanding subordinated units of CrossAmerica converted into common units on a one-for-one basis. Each former subordinated unit now participates in CrossAmerica’s cash distributions pro-rata with the other common units. In addition, CST may be deemed to have beneficial ownership of an additional 6,786,499 common units as a result of a voting agreement with Joseph V. Topper and entities wholly owned and managed by him.
CST Stock Repurchase Plan
On August 5, 2014, our Board of Directors approved a stock repurchase plan under which we are authorized to purchase shares of our common stock up to a maximum dollar amount of $200 million, until such authorization is exhausted or withdrawn by our Board of Directors. Under the stock repurchase program, we are authorized to repurchase, from time-to-time, shares of our outstanding common stock in the open market and in private transactions, at management’s discretion, based on market and business conditions, applicable legal requirements and other factors, or pursuant to an issuer repurchase plan or agreement that may be in effect. The repurchase program does not obligate us to acquire any specific amount of common stock and will continue until otherwise modified or terminated by our Board of Directors at any time at its sole discretion and without notice. We have not repurchased any of our common stock during the nine months ended September 30, 2016 and have $114 million remaining under the plan. The Merger Agreement restricts CST from making any further repurchases of CST common stock.
CST Purchases of CrossAmerica Common Units
On September 21, 2015, CST announced that the independent executive committee of its Board of Directors approved a unit purchase program under Rule 10b-18 of the Exchange Act, authorizing CST to purchase up to an aggregate of $50 million of the common units representing limited partner interests in CrossAmerica. The unit purchase program does not have a fixed expiration date and may be modified, suspended or terminated at any time at CST’s discretion.
CST made no purchases under the unit purchase program during the nine months ended September 30, 2016. From inception until September 30, 2016, CST had purchased $19.8 million, or 804,667 common units, at an average price of $24.64 per common unit, which units cannot be transferred absent registration with the SEC or an available exemption from the SEC’s registration requirements.
CrossAmerica Common Unit Repurchase Program
In November 2015, the board of directors of the General Partner approved a common unit repurchase program under Rule 10b-18 of the Exchange Act authorizing CrossAmerica to repurchase up to an aggregate of $25 million of the common units representing limited partner interests in CrossAmerica. Under the program, CrossAmerica may make purchases in the open market in accordance with Rule 10b-18 of the Exchange Act, or in privately negotiated transactions, pursuant to a trading plan under Rule 10b5-1 of the Exchange Act or otherwise. Any purchases will be funded from available cash on hand. The common unit repurchase program does not require CrossAmerica to acquire any specific number of common units and may be suspended or terminated by CrossAmerica at any time without prior notice. The purchases will not be made from any officer, director or control person of CrossAmerica or CST. The following table shows the purchases made during the nine months ended September 30, 2016:
Period | Total Number of Units Purchased | Average Price Paid per Unit | Total Cost of Units Purchased | Amount Remaining under the Program | |||||||||||
January 1 - March 31, 2016 | 112,492 | $ | 24.47 | $ | 2,752,240 | $ | 18,644,689 | ||||||||
April 1 - June 30, 2016 | 20,971 | $ | 23.86 | $ | 500,413 | $ | 18,144,276 | ||||||||
July 1 - September 30, 2016 | — | $ | — | $ | — | $ | 18,144,276 | ||||||||
January 1 - September 30, 2016 | 133,463 | $ | 24.37 | $ | 3,252,653 | $ | 18,144,276 | ||||||||
66
CST Acquisition of Flash Foods
On February 1, 2016, we closed on the acquisition of Flash Foods from the Jones Company for approximately $425 million plus working capital and other closing adjustments.
See Note 2 included elsewhere in this quarterly report for additional information.
CrossAmerica Acquisition of Franchised Holiday Stores
On March 29, 2016, CrossAmerica closed on the acquisition of 31 franchised Holiday stores and three company-operated liquor stores from S/S/G Corporation for approximately $52 million. Of the 34 company-operated stores, 31 are located in Wisconsin and three are located in Minnesota. The acquisition was funded by borrowings under the CrossAmerica credit facility.
See Note 2 included elsewhere in this quarterly report for additional information.
Finalization of Purchase Accounting associated with the Erickson Acquisition
In the first quarter of 2016, CrossAmerica recorded a $1 million receivable related to a working capital settlement. No other adjustments were recorded in 2016 and CrossAmerica has finalized the purchase accounting for this acquisition.
See Note 2 included elsewhere in this quarterly report for additional information.
Sale of Wholesale Fuel Supply Contracts to CrossAmerica
In February 2016, CST sold 21 independent dealer contracts and 11 subwholesaler contracts to CrossAmerica for $3 million.
See Note 2 included elsewhere in this quarterly report for additional information.
Sale of California and Wyoming Assets
In July 2016, CST consummated the sale of all 79 stores in the California and Wyoming markets to 7-Eleven, Inc. and its wholly-owned subsidiary, SEI Fuel Services, Inc. for $408 million plus adjustments for inventory and working capital and recognized a gain of $347 million, or $220 million net of tax. The sale of assets in California and Wyoming will result in a permanent reduction to our minimum volume commitments contained in the Valero Fuel Supply Agreements. Additionally, in accordance with the asset purchase agreement, we were required to make deposits into an escrow account to secure certain of our obligations and indemnify the Purchasers against any preexisting environmental liabilities arising from the divested stations, which we classified as restricted cash on our consolidated balance sheet. The balance in this account at September 30, 2016 was $25 million. See Note 8 for information on the payment to CrossAmerica related to its interest in CST Fuel Supply.
See Note 2 included elsewhere in this quarterly report for additional information.
Refund payment related to CST sale of California and Wyoming assets
In July 2016, we provided a refund payment to CrossAmerica related to its 17.5% interest in CST Fuel Supply as a result of our sale of the California and Wyoming retail sites, to which we no longer supply motor fuel. The total refund payment to CrossAmerica was $18 million.
See Note 8 included elsewhere in this quarterly report for additional information.
CrossAmerica Acquisition of State Oil Assets
In September 2016, CrossAmerica acquired certain assets of State Oil Company located in the greater Chicago market for approximately $41.8 million.
See Note 2 included elsewhere in this quarterly report for additional information.
67
New Accounting Policies
In May 2014, the FASB issued ASU 2014-09—Revenue from Contracts with Customers (Topic 606), which results in comprehensive new revenue accounting guidance, requires enhanced disclosures to help users of financial statements better understand the nature, amount, timing, and uncertainty of revenue that is recognized, and develops a common revenue standard under U.S. GAAP and International Financial Reporting Standards. Specifically, the core principle of the guidance is that an entity should recognize revenue to depict the transfer of promised goods or services to customers in an amount that reflects the consideration to which the entity expects to be entitled in exchange for those goods and services. With the issuance of ASU 2015-14, which deferred the effective date by one year, this guidance is effective January 1, 2018. Early adoption is permitted, but no earlier than January 1, 2017. The guidance can be applied either retrospectively to each prior reporting period presented, or as a cumulative-effect adjustment as of the date of adoption. Management does not expect the adoption of this ASU to have a material impact on its consolidated financial statements.
In February 2016, the FASB issued ASU 2016-02—Leases (Topic 842). This standard modifies existing guidance for reporting organizations that enter into leases to increase transparency by recognizing lease assets and lease liabilities on the balance sheet and disclosing key information about leasing arrangements. ASU 2016-02 is effective for fiscal years and interim periods within those years beginning after December 15, 2018, and requires a modified retrospective approach to adoption. Early adoption is permitted. Management is currently evaluating the impact of this new guidance in addition to the timing of adoption.
In March 2016, the FASB issued ASU 2016-09—Compensation–Stock Compensation (Topic 718): Improvements to Employee Share-Based Payment Accounting. This standard is issued as part of a simplification initiative involving several aspects of the accounting for share-based payment transactions, including the income tax consequences, classification of awards as either equity or liabilities and classification on the statement of cash flows. ASU 2016-09 is effective for fiscal years and interim periods within those years beginning after December 15, 2016. The approach to adoption is dependent upon which amendments are applicable. Early adoption is permitted. Management is currently evaluating the impact of this new guidance in addition to the timing of adoption.
In August 2016, the FASB issued ASU 2016-15—Statement of Cash Flows (Topic 230): Classification of Certain Cash Receipts and Cash Payments. This standard provides additional guidance on the classification of eight specific cash flow issues with the objective of reducing the existing diversity in practice. ASU 2016-15 is effective for fiscal years and interim periods within those years beginning after December 15, 2017, and requires a modified retrospective approach to adoption. Management is currently evaluating the impact of this new guidance in addition to the timing of adoption.
Certain other new financial accounting pronouncements have become effective for our financial statements but the adoption of these pronouncements will not affect our financial position or results of operations, nor will they require any additional disclosures.
68
Critical Accounting Policies Involving Critical Accounting Estimates
The preparation of financial statements in accordance with U.S. GAAP requires us to make estimates and assumptions that affect the amounts reported in our financial statements and accompanying notes. Actual results could differ from those estimates.
There have been no material changes to the critical accounting policies described in our Form 10-K.
69
ITEM 3. QUANTITATIVE AND QUALITATIVE DISCLOSURES ABOUT MARKET RISK
Interest Rate Risk
CST’s debt includes a $356 million, five-year, amortizing term loan bearing interest at a variable rate. In addition, the CST revolving credit facility has a borrowing capacity of up to $500 million, and any borrowings would bear interest at variable rates. As of September 30, 2016, the weighted average interest rate on outstanding borrowings under the credit facility was 2.28%. A one percentage point change in the average interest rate would impact annual interest expense by approximately $4 million.
As of September 30, 2016, CrossAmerica had $455 million outstanding under its revolving credit facility. Outstanding borrowings under this credit facility had a weighted average interest rate of 3.52%. A one percentage point change in CrossAmerica’s average rate would impact annual interest expense by approximately $5 million.
Commodity Price Risk
We have not historically hedged or managed our price risk in any significant manner with respect to our commodity inventories (gasoline and diesel fuel), as the time period between the purchases of our motor fuel inventory and the sales to our customers is a few days.
Foreign Currency Risk
Our financial statements are reported in U.S. dollars. However, a substantial portion of our operations and assets are located in Canada. As such, our reported results of operations, cash flows and financial position as they relate to our Canadian operations are impacted by fluctuations in the Canadian dollar exchange rate into U.S. dollars. We have not historically hedged our risk associated with our exposure to the Canadian dollar/U.S. dollar exchange rate. A one percent decline in the 2016 weighted average exchange rate would have no material impact to our September 30, 2016 net income.
At September 30, 2016, a Canadian subsidiary had outstanding to the U.S. a U.S. dollar denominated loan in the amount of $125 million. If the Canadian dollar strengthens against the U.S. dollar during a reporting period, we will recognize a gain related to the outstanding balance of this loan in “other income” on our consolidated income statement. If the Canadian dollar weakens against the U.S. dollar during a reporting period, we will recognize a loss related to the outstanding balance of this loan in “other income” on our consolidated income statement.
The operations of CrossAmerica are located in the U.S., and therefore are not subject to foreign currency risk.
ITEM 4. CONTROLS AND PROCEDURES
(a) Evaluation of disclosure controls and procedures.
Our management has evaluated, with the participation of our principal executive officer and principal financial officer, the effectiveness of our disclosure controls and procedures (as defined in Rule 13a-15 under the Exchange Act) as of the end of the period covered by this report, and has concluded that our disclosure controls and procedures were effective as of September 30, 2016.
(b) Changes in internal control over financial reporting.
There were no changes in our internal control over financial reporting (as that term is defined in Rules 13a-15(f) and 15d-15(f) under the Exchange Act) that occurred during the quarter ended September 30, 2016, that have materially affected, or are reasonably likely to materially affect, our internal control over financial reporting, except as noted below.
Management’s evaluation of and conclusion regarding the effectiveness of our internal control over financial reporting for the quarter ended September 30, 2016 excluded the internal control over financial reporting of Flash Foods LLC, and its subsidiaries, which we acquired on February 1, 2016. The Flash Foods acquisition contributed approximately 7% of our total operating revenues for the nine months ended September 30, 2016 and accounted for approximately 11% of our total assets as of September 30, 2016.
As a public company, CrossAmerica’s management is required to report on its evaluation and conclusions regarding the effectiveness of its internal control. As noted in CrossAmerica’s Form 10-Q for the nine months ended September 30, 2016, there were no changes in its internal control over financial reporting that occurred during the three months ended September 30, 2016, that have materially affected, or are reasonably likely to materially affect, its internal control over financial reporting.
70
PART II - OTHER INFORMATION
ITEM 1. LEGAL PROCEEDINGS
We hereby incorporate by reference into this Item our disclosures made in Part I, Item 1 of this quarterly report included in Note 9 of the Condensed notes to Consolidated Financial Statements.
71
ITEM 1A. RISK FACTORS
We have updated the risk factors previously disclosed in Part I, Item 1A. of our Form 10-K, which was filed with the SEC on February 19, 2016, as set forth below. Risks associated with the pending Merger may adversely affect our business, financial performance and stock price. Potential risks and uncertainties related to the Merger include, among others:
• | the inability to consummate the Merger in a timely manner or at all, including due to the inability to obtain or delays in obtaining the approval of our stockholders, the necessary regulatory approvals, or satisfaction of other conditions to the closing of the Merger; |
• | the occurrence of any event, change or other circumstance that could give rise to the termination of the Merger Agreement; |
• | potential adverse effects on our vendor and customer relationships, operating results and business generally resulting from the announcement and pendency of the Merger; |
• | risks related to our ability to retain or recruit key talent as a result of the Merger; |
• | costs, fees, expenses and charges related to or triggered by the Merger; |
• | the initiation or outcome of any legal proceedings or regulatory proceedings that have or may be instituted against us relating to the Merger; |
• | interim operating covenants in the Merger Agreement; |
• | the possibility that the anticipated benefits of the Merger may not be realized; and |
• | other risks detailed in our Definitive Proxy Statement filed with the SEC on October 11, 2016. |
72
Item 2. UNREGISTERED SALES OF EQUITY SECURITIES AND USE OF PROCEEDS
None.
ITEM 3. DEFAULTS UPON SENIOR SECURITIES
None.
ITEM 4. MINE SAFETY DISCLOSURE
None.
ITEM 5. OTHER INFORMATION
None.
ITEM 6. EXHIBITS.
Exhibit No. | Description |
2.1*** | Agreement and Plan of Merger, dated as of August 21, 2016, by and among Circle K Stores Inc., Ultra Acquisition Corp. and CST Brands, Inc. (incorporated by reference to Exhibit 2.1 to the Company’s Current Report on Form 8-K filed with the Securities and Exchange Commission on August 23, 2016) |
10.1 | Unconditional Guaranty, dated as of August 21, 2016, by and between CST Brands, Inc. and Alimentation Couche-Tard Inc. (incorporated by reference to Exhibit 10.1 to the Company’s Current Report on Form 8-K filed with the Securities and Exchange Commission on August 23, 2016) |
31.1* | Certification of Chief Executive Officer Pursuant to Section 302 of the Sarbanes-Oxley Act of 2002 |
31.2* | Certification of Chief Financial Officer Pursuant to Section 302 of the Sarbanes-Oxley Act of 2002 |
32.1** | Certification of Chief Executive Officer Pursuant to Section 906 of the Sarbanes-Oxley Act of 2002 |
32.2** | Certification of Chief Financial Officer Pursuant to Section 906 of the Sarbanes-Oxley Act of 2002 |
101* | Interactive Data Files |
* | Filed herewith. |
** | Furnished herewith. |
*** | Schedules and exhibits omitted pursuant to Item 601(b)(2) of Regulation S-K. The Company agrees to supplementally furnish to the Securities and Exchange Commission upon request any omitted schedule or exhibit to the Merger Agreement. |
73
SIGNATURE
Pursuant to the requirements of Section 13 or 15(d) of the Securities Exchange Act of 1934, the registrant has duly caused this report to be signed on its behalf by the undersigned, thereunto duly authorized.
CST BRANDS, INC.
By: /s/ Clayton E. Killinger
Clayton E. Killinger
Executive Vice President and Chief Financial Officer
(Duly Authorized Officer and Principal Financial and Accounting Officer)
Date: November 7, 2016
74