Attached files
| file | filename |
|---|---|
| EX-99.1 - EXHIBIT 99.1 - Truett-Hurst, Inc. | v452412_ex99-1.htm |
| 8-K - FORM 8-K - Truett-Hurst, Inc. | v452412_8k.htm |
Exhibit 99.2
Truett - Hurst, Inc. FY17 Q1 Earnings Call November 7, 2016 NASDAQ: THST 1
2 Safe Harbor Statement This presentation (including the presentation and any subsequent questions and answers) contains statements that are forward - looking within the meaning of the Private Securities Litigation Reform Act of 1995 , Section 27 A of the Securities Act of 1933 and Section 21 E of the Securities Exchange Act of 1934 . Such forward - looking statements are based on the current beliefs of Truett - Hurst, Inc . ’s management and are not guarantees of future performance . Any such forward - looking statements are and will be, as the case may be, subject to many risks, uncertainties, assumptions and factors relating to the operations and business environments of Truett - Hurst, Inc . and its subsidiaries that may cause the actual results of the companies to be materially different from any future results expressed or implied in such forward - looking statements . These risk factors, include, but are not limited to, a reduction in the supply of grapes and bulk wine available to us ; significant competition ; any change in our relationships with retailers could harm our business ; we may not achieve or maintain profitability in the future ; the loss of key employees ; a reduction in our access to, or an increase in the cost of, the third - party services we use to produce our wine could harm our business ; credit facility restrictions on our current and future operations ; failure to protect, or infringement of, trademarks and proprietary rights ; these factors should not be construed as exhaustive and should be read in conjunction with the other cautionary statements that are included in this report or detailed in our periodic filings (including Forms 8 - K, 10 - K and 10 - Q) or other documents filed with the Securities and Exchange Commission . For more detailed information on us, please refer to our filings with the Securities and Exchange Commission, which are readily available at http : //www . sec . gov, or through the our Investor Relations website at http : //www . truetthurstinc . com . For additional information, see our annual report for the year ended June 30 , 2016 on Form 10 - K filed on September 28 , 2016 , or our other reports currently on file with the Securities and Exchange Commission, which contain a more detailed discussion of risks and uncertainties that may affect future results . We do not undertake to update any forward - looking statements unless otherwise required by law .

Agenda • Evan Meyer Introduction • Financial Update – First Quarter: FY17 vs FY16 – Three Months Ended September 30: Statement of Operations Recap – Three Months Ended September 30: Segment Analysis – Select Balance Sheet Data • Q&A • Appendix – Ownership Structure 3

FINANCIAL UPDATE 4

First Quarter Highlights FY17 vs FY16 ― Revenue dropped 7.6% on net sales of $5.9 million (a decrease of $0.5 million versus prior year) ― 11.7% decline in Wholesale ― 9.1% increase in DTC The company exceeded its case sales goals, however, the product mix varied from expectations so revenues were lower. ― Overall gross margin percent decreased to 31.1% from 33.8% ― Wholesale: 4.1 margin point decrease ― DTC: 4.3 margin point decrease As discussed above, the unexpected mix of products sold during the quarter carried lower margins. In addition, DTC margins were down due to several online promotions and should increase over the course of the fiscal year. ― Operating expenses of $2.1 million, a decrease of $0.3 million versus prior year The decrease in opex was primarily driven by lower employee wages and benefits. Other income includes a net $0.8 million gain from the settlement and termination of the VML tasting room and winery lease. 5
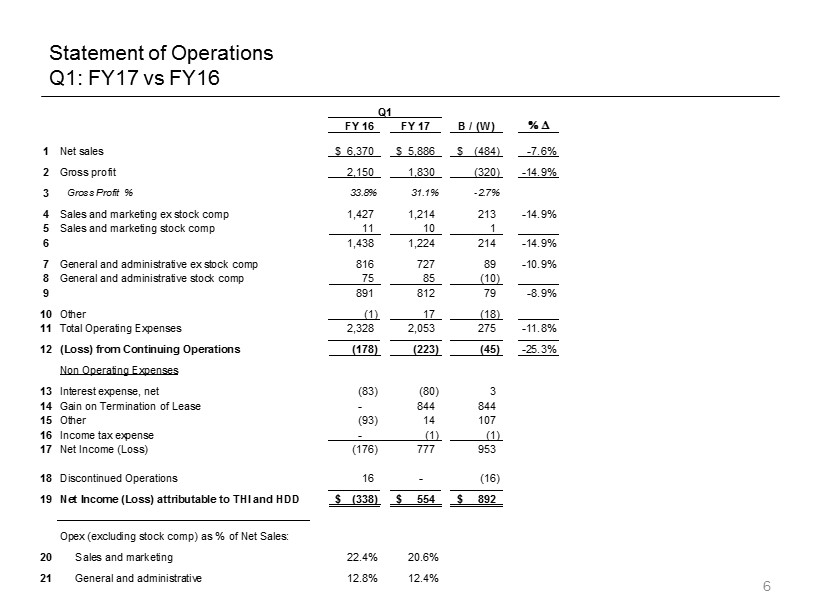
6 Statement of Operations Q1: FY17 vs FY16 FY 16 FY 17 B / (W) % D 1 Net sales 6,370$ 5,886$ (484)$ -7.6% 2 Gross profit 2,150 1,830 (320) -14.9% 3 Gross Profit % 33.8% 31.1% -2.7% 4 Sales and marketing ex stock comp 1,427 1,214 213 -14.9% 5 Sales and marketing stock comp 11 10 1 6 1,438 1,224 214 -14.9% 7 General and administrative ex stock comp 816 727 89 -10.9% 8 General and administrative stock comp 75 85 (10) 9 891 812 79 -8.9% 10 Other (1) 17 (18) 11 Total Operating Expenses 2,328 2,053 275 -11.8% 12 (Loss) from Continuing Operations (178) (223) (45) -25.3% Non Operating Expenses 13 Interest expense, net (83) (80) 3 14 Gain on Termination of Lease - 844 844 15 Other (93) 14 107 16 Income tax expense - (1) (1) 17 Net Income (Loss) (176) 777 953 18 Discontinued Operations 16 - (16) 19 Net Income (Loss) attributable to THI and HDD (338)$ 554$ 892$ Opex (excluding stock comp) as % of Net Sales: 20 Sales and marketing 22.4% 20.6% 21 General and administrative 12.8% 12.4% Q1
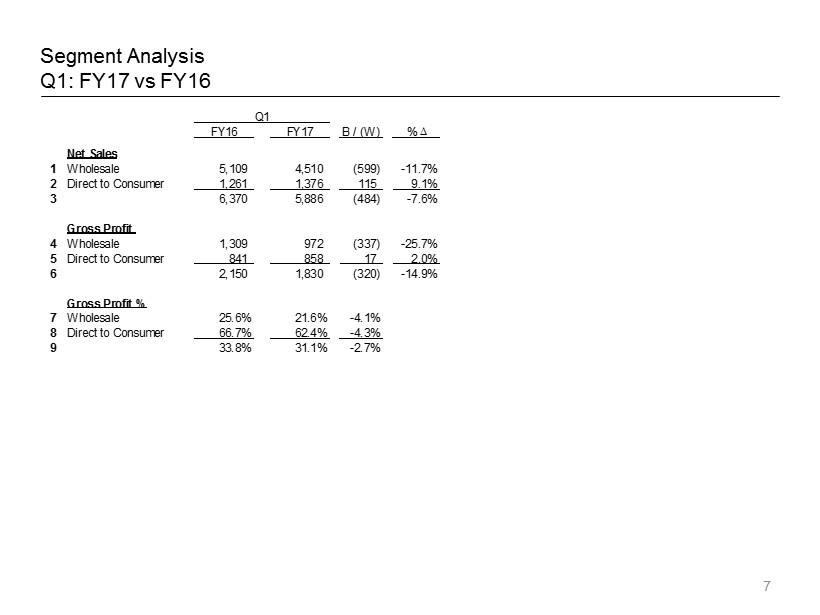
7 Segment Analysis Q1: FY17 vs FY16 FY16 FY17 B / (W) % D Net Sales 1 Wholesale 5,109 4,510 (599) -11.7% 2 Direct to Consumer 1,261 1,376 115 9.1% 3 6,370 5,886 (484) -7.6% Gross Profit 4 Wholesale 1,309 972 (337) -25.7% 5 Direct to Consumer 841 858 17 2.0% 6 2,150 1,830 (320) -14.9% Gross Profit % 7 Wholesale 25.6% 21.6% -4.1% 8 Direct to Consumer 66.7% 62.4% -4.3% 9 33.8% 31.1% -2.7% Q1

8 Select Balance Sheet Data September 30: FY17 vs FY16 FY16 FY17 1 Total Assets 33,505$ 36,520$ 2 Total Liabilities 17,284 19,650 3 Total Equity 16,221 16,870 4 33,505 36,520 5 Cash and cash equivalents 4,043 4,324 6 Property & equipment, net 5,583 5,560 Major Working Capital Accounts source / (use) 7 A/R 2,678 3,890 (1,212) 8 Inventories 19,918 21,666 (1,748) 9 Bulk Wine Deposit 271 - 271 10 AP & Accrueds 2,781 5,707 2,926 11 237 Interest Bearing Debt 12 Credit facilities 10,311 10,034 13 Other Interest Bearing Debt 3,664 3,875 14 13,975 13,909 15 Cash and Cash equivalents (4,043) (4,324) D in Net Debt 16 Net Debt 9,932 9,585 (347) Q1

Q & A 9

A PPENDIX O WNERSHIP S TRUCTURE 10
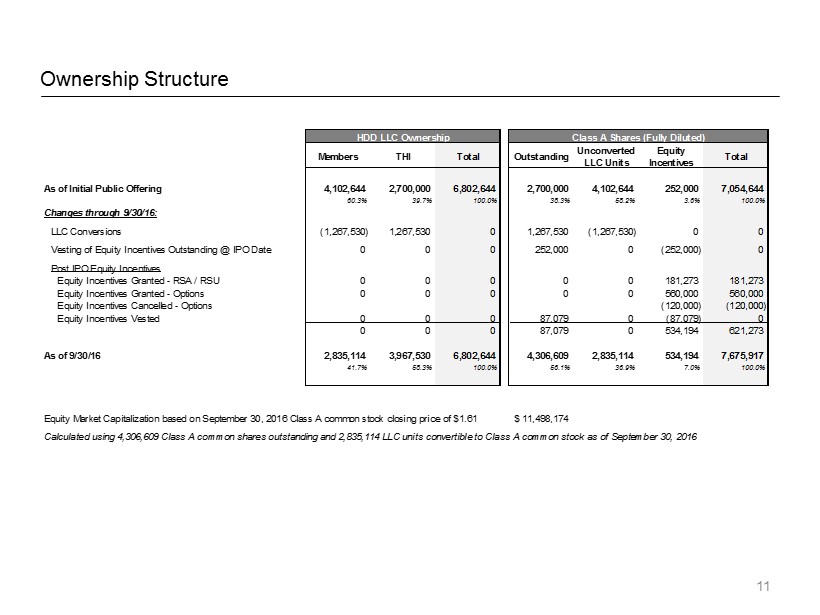
11 Ownership Structure HDD LLC Ownership Class A Shares (Fully Diluted) Members THI Total Outstanding Unconverted LLC Units Equity Incentives Total As of Initial Public Offering 4,102,644 2,700,000 6,802,644 2,700,000 4,102,644 252,000 7,054,644 60.3% 39.7% 100.0% 38.3% 58.2% 3.6% 100.0% Changes through 9/30/16: LLC Conversions (1,267,530) 1,267,530 0 1,267,530 (1,267,530) 0 0 Vesting of Equity Incentives Outstanding @ IPO Date 0 0 0 252,000 0 (252,000) 0 Post IPO Equity Incentives Equity Incentives Granted - RSA / RSU 0 0 0 0 0 181,273 181,273 Equity Incentives Granted - Options 0 0 0 0 0 560,000 560,000 Equity Incentives Cancelled - Options (120,000) (120,000) Equity Incentives Vested 0 0 0 87,079 0 (87,079) 0 0 0 0 87,079 0 534,194 621,273 As of 9/30/16 2,835,114 3,967,530 6,802,644 4,306,609 2,835,114 534,194 7,675,917 41.7% 58.3% 100.0% 56.1% 36.9% 7.0% 100.0% Equity Market Capitalization based on September 30, 2016 Class A common stock closing price of $1.61 11,498,174$ Calculated using 4,306,609 Class A common shares outstanding and 2,835,114 LLC units convertible to Class A common stock as of September 30, 2016

Contact Information 12 Phillip L. Hurst Chief Executive Officer, President Email: phil@truetthurst.com T: 707.431.4408 M: 707.318.7480 Evan B. Meyer Chief Financial Officer Email: evan@truetthurst.com T: 707.431.4423 M: 415.987.2185 www.truetthurstinc.com ir@truetthurstinc.com
Call Playback Information Webcast/PowerPoint/Replay available at: http://www.truetthurstinc.com/index.php?s=151&cat=3 Replay available until November 14, 2016 13