Attached files
| file | filename |
|---|---|
| EX-32.2 - EXHIBIT 32.2 - Renewable Energy Group, Inc. | regi-2016q3xex322.htm |
| EX-32.1 - EXHIBIT 32.1 - Renewable Energy Group, Inc. | regi-2016q3xex321.htm |
| EX-31.2 - EXHIBIT 31.2 - Renewable Energy Group, Inc. | regi-2016q3xex312.htm |
| EX-31.1 - EXHIBIT 31.1 - Renewable Energy Group, Inc. | regi-2016q3xex311.htm |
| EX-10.1 - EXHIBIT 10.1 - Renewable Energy Group, Inc. | regi-2016q3xex101formofprs.htm |
UNITED STATES
SECURITIES AND EXCHANGE COMMISSION
Washington, D.C. 20549
Form 10-Q
x | QUARTERLY REPORT PURSUANT TO SECTION 13 OR 15 (d) OF THE SECURITIES EXCHANGE ACT OF 1934 |
For the Quarterly Period Ended September 30, 2016
OR
¨ | TRANSITION REPORT PURSUANT TO SECTION 13 OR 15 (d) OF THE SECURITIES EXCHANGE ACT OF 1934 |
Commission File Number 001-35397
RENEWABLE ENERGY GROUP, INC.
(Exact name of registrant as specified in its charter)
Delaware | 26-4785427 | |
(State of other jurisdiction of incorporation or organization) | (I.R.S. Employer Identification No.) | |
416 South Bell Avenue Ames, Iowa | 50010 | |
(Address of principal executive offices) | (Zip code) | |
(515) 239-8000
(Registrant’s telephone number, including area code)
Indicate by check mark whether the registrant: (1) has filed all reports required to be filed by Section 13 or 15 (d) of the Securities Exchange Act of 1934 during the preceding 12 months (or for such shorter period that the registrant was required to file such reports), and (2) has been subject to such filing requirements for the past 90 days. YES x NO ¨
Indicate by check mark whether the registrant has submitted electronically and posted on its corporate Web site, if any, every Interactive Data file required to be submitted and posted pursuant to Rule 405 of Regulation S-T (§232.405 of this chapter) during the preceding 12 months (or for such shorter period that the registrant was required to submit and post such files). YES x NO ¨
Indicate by check mark whether the registrant is a large accelerated filer, an accelerated filer, non-accelerated filer, or a smaller reporting company. See the definitions of “large accelerated filer,” “accelerated filer” and “smaller reporting company” in Rule 12b-2 of the Exchange Act. (Check one):
Large accelerated filer ¨ | Accelerated filer x | |
Non-accelerated filer ¨ | Smaller reporting company ¨ | |
Indicate by check mark whether the registrant is a shell company (as defined in Rule 12b-2 of the Exchange Act). YES ¨ NO x
As of October 31, 2016, the registrant had 38,553,413 shares of Common Stock outstanding.
PART I. FINANCIAL INFORMATION
ITEM 1. CONDENSED CONSOLIDATED FINANCIAL INFORMATION
RENEWABLE ENERGY GROUP, INC.
CONDENSED CONSOLIDATED BALANCE SHEETS
(unaudited)
(in thousands, except share and per share amounts)
September 30, 2016 | December 31, 2015 | ||||||
ASSETS | |||||||
CURRENT ASSETS: | |||||||
Cash and cash equivalents | $ | 86,531 | $ | 47,081 | |||
Accounts receivable, net | 105,005 | 310,731 | |||||
Inventories | 98,222 | 85,890 | |||||
Prepaid expenses and other assets | 45,752 | 31,882 | |||||
Total current assets | 335,510 | 475,584 | |||||
Property, plant and equipment, net | 610,560 | 574,584 | |||||
Goodwill | 16,080 | 16,080 | |||||
Intangible assets, net | 29,973 | 30,941 | |||||
Investments | 12,158 | 8,797 | |||||
Other assets | 11,833 | 11,819 | |||||
Restricted cash | 4,000 | 105,815 | |||||
TOTAL ASSETS | $ | 1,020,114 | $ | 1,223,620 | |||
LIABILITIES AND EQUITY | |||||||
CURRENT LIABILITIES: | |||||||
Lines of credit | $ | 6,354 | $ | 23,149 | |||
Current maturities of long-term debt | 10,349 | 5,206 | |||||
Accounts payable | 86,142 | 236,817 | |||||
Accrued expenses and other liabilities | 28,672 | 28,466 | |||||
Deferred revenue | 1,492 | 333 | |||||
Total current liabilities | 133,009 | 293,971 | |||||
Unfavorable lease obligation | 15,972 | 17,343 | |||||
Deferred income taxes | 17,766 | 19,186 | |||||
Long-term contingent consideration for acquisitions | 32,258 | 26,949 | |||||
Convertible debt conversion liability | 23,700 | — | |||||
Long-term debt (net of debt issuance costs of $6,488 and $4,105, respectively) | 201,884 | 247,251 | |||||
Other liabilities | 4,637 | 4,910 | |||||
Total liabilities | 429,226 | 609,610 | |||||
COMMITMENTS AND CONTINGENCIES | |||||||
EQUITY: | |||||||
Common stock ($.0001 par value; 300,000,000 shares authorized; 38,553,413 and 43,837,714 shares outstanding, respectively) | 5 | 4 | |||||
Common stock—additional paid-in-capital | 479,102 | 474,367 | |||||
Retained earnings | 193,810 | 169,680 | |||||
Accumulated other comprehensive loss | (2,832 | ) | (4,009 | ) | |||
Treasury stock (9,246,002 and 3,178,372 shares outstanding, respectively) | (81,824 | ) | (28,762 | ) | |||
Total equity attributable to the Company's shareholders | 588,261 | 611,280 | |||||
Non-controlling interest | 2,627 | 2,730 | |||||
Total equity | 590,888 | 614,010 | |||||
TOTAL LIABILITIES AND EQUITY | $ | 1,020,114 | $ | 1,223,620 | |||
See notes to condensed consolidated financial statements.
1
RENEWABLE ENERGY GROUP, INC.
CONDENSED CONSOLIDATED STATEMENTS OF OPERATIONS
(unaudited)
(in thousands, except share and per share amounts)
Three months ended | Nine months ended | ||||||||||||||
September 30, 2016 | September 30, 2015 | September 30, 2016 | September 30, 2015 | ||||||||||||
REVENUES: | |||||||||||||||
Biomass-based diesel sales | $ | 523,739 | $ | 393,758 | $ | 1,223,294 | $ | 981,239 | |||||||
Biomass-based diesel government incentives | 100,336 | 1,066 | 255,890 | 18,132 | |||||||||||
624,075 | 394,824 | 1,479,184 | 999,371 | ||||||||||||
Other revenue | 565 | 32 | 1,627 | 165 | |||||||||||
624,640 | 394,856 | 1,480,811 | 999,536 | ||||||||||||
COSTS OF GOODS SOLD: | |||||||||||||||
Biomass-based diesel | 575,956 | 390,424 | 1,389,881 | 989,999 | |||||||||||
Biomass-based diesel—related parties | — | — | — | 4,542 | |||||||||||
575,956 | 390,424 | 1,389,881 | 994,541 | ||||||||||||
Other costs of goods sold | 1,336 | 27 | 1,334 | 111 | |||||||||||
577,292 | 390,451 | 1,391,215 | 994,652 | ||||||||||||
GROSS PROFIT | 47,348 | 4,405 | 89,596 | 4,884 | |||||||||||
SELLING, GENERAL AND ADMINISTRATIVE EXPENSES | 20,799 | 18,468 | 61,426 | 51,268 | |||||||||||
RESEARCH AND DEVELOPMENT EXPENSE | 4,805 | 3,527 | 13,158 | 11,778 | |||||||||||
GAIN ON INVOLUNTARY CONVERSION | (3,470 | ) | — | (8,010 | ) | — | |||||||||
INCOME (LOSS) FROM OPERATIONS | 25,214 | (17,590 | ) | 23,022 | (58,162 | ) | |||||||||
OTHER INCOME (EXPENSE), NET: | |||||||||||||||
Change in fair value of contingent consideration | (1,124 | ) | (1,106 | ) | (4,680 | ) | 722 | ||||||||
Change in fair value of convertible debt conversion liability | 3,013 | — | 16,445 | — | |||||||||||
Gain on debt extinguishment | 179 | — | 2,331 | — | |||||||||||
Other income (loss), net | (493 | ) | 4,896 | (430 | ) | 7,240 | |||||||||
Interest expense | (4,487 | ) | (2,921 | ) | (11,536 | ) | (8,592 | ) | |||||||
(2,912 | ) | 869 | 2,130 | (630 | ) | ||||||||||
INCOME (LOSS) BEFORE INCOME TAXES | 22,302 | (16,721 | ) | 25,152 | (58,792 | ) | |||||||||
INCOME TAX (EXPENSE) BENEFIT | 1,203 | 1,050 | (821 | ) | 2,654 | ||||||||||
NET INCOME (LOSS) | 23,505 | (15,671 | ) | 24,331 | (56,138 | ) | |||||||||
LESS—NET INCOME (LOSS) ATTRIBUTABLE TO NONCONTROLLING INTEREST | 63 | 4 | 201 | (355 | ) | ||||||||||
NET INCOME (LOSS) ATTRIBUTABLE TO THE COMPANY | 23,442 | (15,675 | ) | 24,130 | (55,783 | ) | |||||||||
LESS—EFFECT OF PARTICIPATING SHARE-BASED AWARDS | (513 | ) | — | (462 | ) | — | |||||||||
NET INCOME (LOSS) ATTRIBUTABLE TO THE COMPANY’S COMMON STOCKHOLDERS | $ | 22,929 | $ | (15,675 | ) | $ | 23,668 | $ | (55,783 | ) | |||||
NET INCOME (LOSS) PER SHARE ATTRIBUTABLE TO COMMON STOCKHOLDERS: | |||||||||||||||
BASIC | $ | 0.59 | $ | (0.36 | ) | $ | 0.57 | $ | (1.27 | ) | |||||
DILUTED | $ | 0.59 | $ | (0.36 | ) | $ | 0.57 | $ | (1.27 | ) | |||||
WEIGHTED AVERAGE SHARES USED TO COMPUTE NET INCOME (LOSS) PER SHARE ATTRIBUTABLE TO COMMON STOCKHOLDERS: | |||||||||||||||
BASIC | 38,744,878 | 43,844,005 | 41,673,223 | 43,979,266 | |||||||||||
DILUTED | 38,751,706 | 43,844,005 | 41,678,988 | 43,979,266 | |||||||||||
See notes to condensed consolidated financial statements.
2
RENEWABLE ENERGY GROUP, INC.
CONDENSED CONSOLIDATED STATEMENTS OF COMPREHENSIVE INCOME (LOSS)
(unaudited)
(in thousands)
Three months ended | Nine months ended | ||||||||||||||
September 30, 2016 | September 30, 2015 | September 30, 2016 | September 30, 2015 | ||||||||||||
Net income (loss) | $ | 23,505 | $ | (15,671 | ) | $ | 24,331 | $ | (56,138 | ) | |||||
Unrealized gains (losses) on marketable securities, net of taxes of $0 and $0, respectively | — | 14 | — | (1 | ) | ||||||||||
Foreign currency translation adjustments | 766 | (470 | ) | 1,052 | (4,346 | ) | |||||||||
Other comprehensive income (loss) | 766 | (456 | ) | 1,052 | (4,347 | ) | |||||||||
Comprehensive income (loss) | 24,271 | (16,127 | ) | 25,383 | (60,485 | ) | |||||||||
Less—Comprehensive income (loss) attributable to noncontrolling interest | (26 | ) | (53 | ) | (125 | ) | (623 | ) | |||||||
Comprehensive income (loss) attributable to the Company | $ | 24,297 | $ | (16,074 | ) | $ | 25,508 | $ | (59,862 | ) | |||||
See notes to condensed consolidated financial statements.
3
RENEWABLE ENERGY GROUP, INC.
CONDENSED CONSOLIDATED STATEMENTS OF EQUITY
(unaudited)
(in thousands, except share amounts)
Company Stockholders’ Equity | ||||||||||||||||||||||||||||||
Common Stock Shares | Common Stock | Common Stock - Additional Paid-in Capital | Retained Earnings | Accumulated Other Comprehensive Loss | Treasury Stock | Noncontrolling Interest | Total | |||||||||||||||||||||||
BALANCE, January 1, 2015 | 44,422,881 | $ | 4 | $ | 453,109 | $ | 321,083 | $ | (11 | ) | $ | (4,412 | ) | $ | 8,889 | $ | 778,662 | |||||||||||||
Issuance of common stock | 1,712,966 | — | 15,722 | — | — | — | — | 15,722 | ||||||||||||||||||||||
Conversion of restricted stock units to common stock (net of 64,978 shares of treasury stock purchased) | 178,156 | — | — | — | — | (616 | ) | — | (616 | ) | ||||||||||||||||||||
Treasury stock purchases | (2,030,722 | ) | — | — | — | — | (19,313 | ) | — | $ | (19,313 | ) | ||||||||||||||||||
Acquisition of noncontrolling interest | — | — | — | — | — | — | (4,416 | ) | (4,416 | ) | ||||||||||||||||||||
Stock compensation expense | — | — | 3,427 | — | — | — | — | 3,427 | ||||||||||||||||||||||
Other comprehensive loss | — | — | — | — | (3,724 | ) | — | (623 | ) | (4,347 | ) | |||||||||||||||||||
Net loss | — | — | — | (55,783 | ) | — | — | (355 | ) | (56,138 | ) | |||||||||||||||||||
Other | — | — | 350 | — | — | — | — | 350 | ||||||||||||||||||||||
BALANCE, September 30, 2015 | 44,283,281 | $ | 4 | $ | 472,608 | $ | 265,300 | $ | (3,735 | ) | $ | (24,341 | ) | $ | 3,495 | $ | 713,331 | |||||||||||||
BALANCE, January 1, 2016 | 43,837,714 | $ | 4 | $ | 474,367 | $ | 169,680 | $ | (4,009 | ) | $ | (28,762 | ) | $ | 2,730 | $ | 614,010 | |||||||||||||
Issuance of common stock | 33,973 | — | 316 | — | — | — | — | 316 | ||||||||||||||||||||||
Issuance of common stock in acquisition | 500,000 | 1 | 4,049 | — | — | — | — | 4,050 | ||||||||||||||||||||||
Conversion of restricted stock units to common stock (net of 69,307 shares of treasury stock purchased) | 180,049 | — | — | — | — | (752 | ) | — | (752 | ) | ||||||||||||||||||||
Partial termination of capped call options (inclusive of tax impact of $116) | — | — | 1,863 | — | — | — | — | 1,863 | ||||||||||||||||||||||
Convertible debt extinguishment impact (net of tax impact of $2,144) | — | — | (5,560 | ) | — | — | — | — | (5,560 | ) | ||||||||||||||||||||
Treasury stock purchases | (5,998,323 | ) | — | — | — | — | (52,310 | ) | — | (52,310 | ) | |||||||||||||||||||
Acquisition of noncontrolling interest | — | — | — | — | — | — | (179 | ) | (179 | ) | ||||||||||||||||||||
Stock compensation expense | — | — | 4,067 | — | — | — | — | 4,067 | ||||||||||||||||||||||
Other comprehensive income (loss) | — | — | — | — | 1,177 | — | (125 | ) | 1,052 | |||||||||||||||||||||
Net income | — | — | — | 24,130 | — | — | 201 | 24,331 | ||||||||||||||||||||||
BALANCE, September 30, 2016 | 38,553,413 | $ | 5 | $ | 479,102 | $ | 193,810 | $ | (2,832 | ) | $ | (81,824 | ) | $ | 2,627 | $ | 590,888 | |||||||||||||
See notes to condensed consolidated financial statements.
4
RENEWABLE ENERGY GROUP, INC.
CONDENSED CONSOLIDATED STATEMENTS OF CASH FLOWS
(unaudited)
(in thousands)
Nine months ended | |||||||
September 30, 2016 | September 30, 2015 | ||||||
CASH FLOWS FROM OPERATING ACTIVITIES: | |||||||
Net income (loss) | $ | 24,331 | $ | (56,138 | ) | ||
Adjustments to reconcile net income (loss) to net cash flows from operating activities: | |||||||
Depreciation expense | 23,447 | 18,008 | |||||
Amortization expense of assets and liabilities, net | 676 | 369 | |||||
Gain on involuntary conversion | (8,010 | ) | — | ||||
Accretion of convertible note discount | 3,820 | 3,507 | |||||
Amortization of marketable securities | — | 183 | |||||
Change in fair value of contingent consideration | 4,680 | (722 | ) | ||||
Change in fair value of convertible debt conversion liability | (16,445 | ) | — | ||||
Gain on debt extinguishment | (2,331 | ) | — | ||||
Bargain purchase gain from acquisition | — | (5,358 | ) | ||||
Provision for doubtful accounts | 42 | (843 | ) | ||||
Stock compensation expense | 4,067 | 3,427 | |||||
Deferred tax expense (benefit) | 505 | (2,991 | ) | ||||
Other operating activities | (43 | ) | (248 | ) | |||
Changes in asset and liabilities, net of effects from acquisitions: | |||||||
Accounts receivable, net | 205,733 | 262,499 | |||||
Inventories | (10,482 | ) | 36,810 | ||||
Prepaid expenses and other assets | (13,857 | ) | (8,974 | ) | |||
Accounts payable | (147,268 | ) | (124,827 | ) | |||
Accrued expenses and other liabilities | 1,114 | (8,965 | ) | ||||
Deferred revenue | 1,159 | (16,680 | ) | ||||
Net cash flows provided by operating activities | 71,138 | 99,057 | |||||
CASH FLOWS FROM INVESTING ACTIVITIES: | |||||||
Cash paid for marketable securities | — | (52,153 | ) | ||||
Cash received from maturities of marketable securities | — | 61,642 | |||||
Cash receipts for involuntary conversion | 8,010 | 6,500 | |||||
Cash receipts of restricted cash | 1,985 | 13,345 | |||||
Cash paid for purchase of property, plant and equipment | (42,809 | ) | (61,014 | ) | |||
Cash paid for acquisitions and additional interests, net of cash acquired | (12,720 | ) | (40,996 | ) | |||
Cash paid for investments | (3,249 | ) | (639 | ) | |||
Other investing activities | — | — | |||||
Net cash flows used in investing activities | (48,783 | ) | (73,315 | ) | |||
CASH FLOWS FROM FINANCING ACTIVITIES: | |||||||
Net borrowings (repayments) on revolving line of credit | (20,855 | ) | 5,744 | ||||
Borrowings on other lines of credit | 8,807 | — | |||||
Repayments on other lines of credit | (263 | ) | — | ||||
Cash received from notes payable | 163,646 | 410 | |||||
Cash paid on notes payable | (72,548 | ) | (5,084 | ) | |||
Cash paid for debt issuance costs | (5,876 | ) | (383 | ) | |||
Cash paid for treasury stock | (51,474 | ) | (19,929 | ) | |||
Cash paid for contingent consideration settlement | (4,871 | ) | (2,106 | ) | |||
Cash received on partial termination of capped call options | 159 | — | |||||
Net cash flows provided by (used in) financing activities | 16,725 | (21,348 | ) | ||||
NET CHANGE IN CASH AND CASH EQUIVALENTS | 39,080 | 4,394 | |||||
CASH AND CASH EQUIVALENTS, Beginning of period | 47,081 | 63,516 | |||||
Effect of exchange rate changes on cash | 370 | (1,093 | ) | ||||
CASH AND CASH EQUIVALENTS, End of period | $ | 86,531 | $ | 66,817 | |||
(continued)
5
RENEWABLE ENERGY GROUP, INC. AND SUBSIDIARIES
CONDENSED CONSOLIDATED STATEMENTS OF CASH FLOWS
(unaudited)
(in thousands)
Nine months ended | |||||||
September 30, 2016 | September 30, 2015 | ||||||
SUPPLEMENTAL DISCLOSURES OF CASH FLOWS INFORMATION: | |||||||
Cash paid (received) for income taxes | $ | 203 | $ | 50 | |||
Cash paid for interest | $ | 5,496 | $ | 4,418 | |||
SUPPLEMENTAL DISCLOSURE OF NON-CASH INVESTING AND FINANCING ACTIVITIES: | |||||||
Amounts included in period-end accounts payable for: | |||||||
Purchases of property, plant and equipment | $ | 4,220 | $ | 4,043 | |||
Debt issuance cost | $ | 135 | $ | 84 | |||
Incentive stock liability for raw material supply agreement | $ | — | $ | 239 | |||
Issuance of common stock for acquisitions | $ | 4,050 | $ | 15,310 | |||
Contingent consideration for acquisitions | $ | 4,500 | $ | 5,000 | |||
Debt assumed in acquisition | $ | — | $ | 5,225 | |||
Release of restricted cash to pay off the GOZone Bonds | $ | 101,315 | $ | — | |||
Repayment of GOZone Bonds | $ | 100,000 | $ | — | |||
Non-cash transfer of line of credit to long-term debt | $ | 4,498 | $ | — | |||
Accruals of insurance proceeds related to impairment of property, plant and equipment | $ | 1,414 | $ | 11,027 | |||
See "Note 3 - Acquisitions" for noncash items related to the acquisition transactions. | |||||||
(concluded)
See notes to condensed consolidated financial statements.
6
RENEWABLE ENERGY GROUP, INC.
NOTES TO THE CONDENSED CONSOLIDATED FINANCIAL STATEMENTS
For The Three and Nine Months Ended September 30, 2016 and 2015
(unaudited)
(in thousands, except share and per share amounts)
NOTE 1 — BASIS OF PRESENTATION AND NATURE OF THE BUSINESS
The condensed consolidated financial statements have been prepared by Renewable Energy Group, Inc. and its subsidiaries (the "Company" or "REG"), pursuant to the rules and regulations of the U.S. Securities and Exchange Commission ("SEC"). Certain information and footnote disclosures normally included in annual financial statements prepared in accordance with accounting principles generally accepted in the United States of America ("GAAP") have been condensed or omitted as permitted by such rules and regulations. All adjustments, consisting of normal recurring adjustments, have been included. Management believes that the disclosures are adequate to present fairly the financial position, results of operations and cash flows at the dates and for the periods presented. It is suggested that these interim financial statements be read in conjunction with the consolidated financial statements and the notes thereto appearing in the Company’s latest annual report on Form 10-K filed on March 14, 2016. Results for interim periods are not necessarily indicative of those to be expected for the fiscal year.
The preparation of financial statements in conformity with GAAP requires management to make estimates and assumptions that affect the reported amounts and related disclosures. Actual results could differ from those estimates.
As of September 30, 2016, the Company operates a network of twelve biorefineries in North America, which includes eleven operating biomass-based diesel production facilities with aggregate nameplate production capacity of 452 million gallons per year, or mmgy, along with a fermentation facility. The Company's network includes the addition of a 20-million gallon nameplate capacity biomass-based diesel refinery located in DeForest, Wisconsin resulting from its acquisition of the biorefinery and related assets of Sanimax Energy, LLC ("Sanimax Energy") in March 2016. A number of these plants are “multi-feedstock capable” which allows them to use a broad range of lower cost feedstocks, such as inedible corn oil, used cooking oil and inedible animal fats in addition to vegetable oils, such as soybean oil and canola oil.
In December 2014, the Company expanded its business to Europe by acquiring a majority interest in Petrotec AG ("Petrotec"). Petrotec is a fully-integrated company that produces biodiesel at its two biorefineries in Emden and Oeding, Germany to sell to the European market.
The biomass-based diesel industry and the Company’s business have benefited from the continuation of certain federal
and state incentives. The federal biodiesel mixture excise tax credit (the "BTC") is in effect throughout 2016 and, if not reinstated before the end of the year, the BTC will expire on December 31, 2016. It is uncertain whether the BTC will be reinstated thereafter. The expiration, along with other amendments of any one or more of the laws applicable to these incentives, could adversely affect the financial results of the Company.
During the third quarter 2016 close process, the Company identified errors in its previously reported interim financial statements for the quarter ended March 31, 2016 pertaining to certain biomass-based diesel sales completed in that quarter that contained BTC sharing terms resulting in an overstatement of biomass-based diesel sales of $7,724 and a corresponding understatement of accounts payable, deferred income taxes and income tax expense of $7,724, $850 and $850, respectively for the three months ended March 31, 2016 and the six months ended June 30, 2016.
The correction decreased biomass-based diesel sales by $7,724 for the three months ended March 31, 2016 (from previously reported $247,164 to $239,440) and decreased net income (loss) by $8,574 (from the previously reported net income of $1,686 to a net loss of $6,888). The correction also decreased biomass-based diesel sales by $7,724 for the six months ended June 30, 2016 (from previously reported $707,279 to $699,555) and decreased net income (loss) by $8,574 (from the previously reported net income of $8,810 to a net income of $236). This correction is reflected in the accompanying unaudited Condensed Consolidated Statements of Operations for the nine-month period ended September 30, 2016.
Based on an evaluation of all relevant facts, the Company assessed the materiality of these errors on the first and second quarter interim financial statements in accordance with SEC Staff Accounting Bulletin No. 99, codified in the Accounting Standards Classification (ASC) 250, Presentation of Financial Statements. The Company concluded under ASC 250 that the correction was immaterial to the Company’s results for the three months ended March 31, 2016 and six months ended June 30, 2016 and an amendment of previously filed reports was not required. In accordance with ASC 250, the Company elected to correct these errors by revising the consolidated financial statements and other financial information included in this Quarterly Report on Form 10-Q. This correction will be reflected in future 10-K and 10-Q filings.
7
NOTE 2 — SUMMARY OF SIGNIFICANT ACCOUNTING POLICIES
The Company has disclosed a summary of the Company's significant accounting policies in its Annual Report on Form 10-K for the year ended December 31, 2015. There have been no material changes from the policies previously disclosed other than those noted below.
Accounts Receivable
Accounts receivable are carried at invoiced amount less allowance for doubtful accounts. Management estimates the allowance for doubtful accounts based on existing economic conditions, the financial conditions of customers, and the amount and age of past due accounts. Receivables are considered past due if full payment is not received by the contractual due date. Past due accounts are generally written off against the allowance for doubtful accounts only after reasonable collection attempts have been exhausted. Through September 30, 2016, the Company has received approximately $243,737 related to the 2015 biodiesel mixture excise tax credit, which results in $52 remaining as outstanding receivables at September 30, 2016.
Property, Plant and Equipment
Property, plant and equipment is recorded at cost less accumulated depreciation. Maintenance and repairs are expensed as incurred. Depreciation expense is computed on a straight-line method based upon estimated useful lives of the assets.
In April 2015, the Company experienced a fire at its Geismar facility, resulting in the shutdown of the facility. The Company estimated fixed assets with a net book value of approximately $11,027 were impaired as a result of the fire. At September 30, 2016, the Company has received property insurance proceeds of $19,037. The excess of the property insurance proceeds over the net book value of the impaired assets, $3,470 and $8,010, was recorded as gain on involuntary conversion on the Condensed Consolidated Statements of Operations during the three and nine months ended September 30, 2016, respectively. The aforementioned proceeds for property damage were final and have been approved and paid by the insurance carriers.
In September 2015, another fire occurred at the Geismar facility. The Company estimated fixed assets with a net book value of approximately $1,414 were impaired by the September fire. The Company believes it is probable that it will recover all the net book value of the assets damaged by the fire under its insurance policies. As such, a receivable was recorded as an offset to the estimated impairment loss and no impact on earnings was recognized from impairment.
Goodwill
Goodwill is tested for impairment annually on July 31 or when impairment indicators exist. Goodwill is allocated and
tested for impairment by reporting units. At September 30, 2016 and December 31, 2015, the Company had goodwill in the Services reporting unit. The annual impairment test at July 31, 2016 determined that the fair value of the Services reporting unit exceeded its carrying value by approximately 16%. No impairment of goodwill was recorded during the three and nine months ended September 30, 2016.
Convertible Debt
In June 2016, the Company issued $152,000 aggregate principal amount of 4% convertible senior notes due 2036 (the "2036 Convertible Notes"). The Company may not elect to issue shares of common stock upon conversion of the 2036 Convertible Notes to the extent such election would result in the issuance of more than 19.99% of the common stock outstanding immediately before the issuance of the 2036 Convertible Notes until the Company receives stockholder approval for such issuance. As a result, the embedded conversion option is accounted for as an embedded derivative liability. This liability is recorded at fair value, and $3,013 and $16,445 fair value adjustments were recorded for the three and nine months ended September 30, 2016. The Company expects to continue marking the embedded conversion option to market unless and until shareholders authorize additional common shares at its Annual Shareholder Meeting in May 2017. See "Note 7 - Debt" for a further description of the transaction.
Share Repurchase Programs
In February 2015, the Company's board of directors approved a share repurchase program of up to $30,000 of the Company's shares of common stock. Shares may be repurchased from time to time in open market transactions, privately negotiated transactions or by other means. The Company accounts for share repurchases using the cost method. Under this method, the cost of the share repurchase is recorded entirely in treasury stock, a contra equity account. The Company used the remaining available funds authorized under this program to repurchase shares of Common Stock during the first 6 months of 2016.
8
In March 2016, the Company's board of directors approved a repurchase program of up to $50,000 of the Company's
shares of common stock and/or convertible notes, in effect through March 5, 2018. Under the program, which is in addition to the $30,000 common stock repurchase program announced in February 2015, the Company may repurchase shares or convertible notes from time to time in open market transactions, privately negotiated transactions or by other means. The timing and amount of repurchase transactions were determined by the Company's management based on its evaluation of market conditions, share price, bond price, legal requirements and other factors. During the three and nine months ended September 30, 2016, the Company repurchased 627,552 and 5,070,375 shares of Common Stock for $5,590 and $44,019, respectively, under this program. In addition, the Company used approximately $5,584 under this program to repurchase $6,000 principal amount of the Company's 2.75% senior notes due 2019 (the "2019 Convertible Notes") during the three and nine months ended September 30, 2016.
New Accounting Standards
In March 2016, the FASB issued ASU 2016-08, "Revenue from Contracts with Customers (Topic 606): Principal versus Agent Consideration (Reporting Revenue Gross versus Net)" which clarifies how an entity should identify the unit of accounting for the principal versus agent evaluation and how it should apply the control principle to certain types of arrangements, such as service transactions. The guidance also re-frames the indicators to focus on evidence that an entity is acting as a principal rather than an agent. The guidance is effective for public business entities for fiscal years beginning after December 15, 2017, and interim periods within those fiscal years. The Company is evaluating the impact of this guidance, but does not expect it to have any material impact on its consolidated financial statements.
In March 2016, the FASB issued ASU 2016-09, “Improvements to Employee Share-Based Payment Accounting.” The amendments in this updated guidance include changes to simplify the codification for several aspects of the accounting for share-based payment transactions, including the income tax consequences, classification of awards as either equity or liabilities and classification on the statement of cash flows. For public entities, this guidance is effective for fiscal years beginning after December 15, 2016, including interim periods within that reporting period. Early adoption is permitted. The Company is evaluating the impact this new guidance will have on its consolidated financial statements.
In May 2016, the FASB issued ASU 2016-12, which amends certain aspects of the new revenue standard, ASU 2014-09. The amendments address issues such as collectability; presentation of sales tax and other similar taxes collected from customers; noncash consideration; contract modifications and completed contracts at transition; and transition technical correction. The guidance is effective for public business entities for fiscal years beginning after December 15, 2017 and interim periods within those fiscal years. The Company is evaluating the impact of this guidance, but does not expect it to have any material impact on its consolidated financial statements.
In September 2016, the FASB issued ASU 2016-15, Statement of Cash Flows (Topic 230), Classification of Certain Cash Receipts and Cash Payments. The guidance addresses the classification of cash flows related to (1) debt prepayment or extinguishment costs, (2) settlement of zero-coupon debt instruments or other debt instruments with coupon rates that are insignificant in relation to the effective interest rate of the borrowing, (3) contingent consideration payments made after a business combination, (4) proceeds from settlement of insurance claims, (5) proceeds from the settlement of corporate-owned life insurance, (6) distributions received from equity method investees and (7) beneficial interests in securitization transactions. The guidance will generally be applied retrospectively and is effective for public business entities for fiscal years beginning December 15, 2017. The Company has evaluated the impact and elected to early adopt the guidance for the three and nine months ended September 30, 2016, which has no material impact on its consolidated financial statements.
NOTE 3 — ACQUISITIONS
Sanimax Energy, LLC
On March 15, 2016, the Company acquired fixed assets and inventory from Sanimax Energy, including the 20 mmgy nameplate capacity biomass-based diesel refinery in DeForest, Wisconsin. The Company completed its initial accounting of this business combination as the valuation of the real and personal property was finalized as of September 30, 2016.
The following table summarizes the consideration paid for the acquisition from Sanimax Energy:
9
March 15, 2016 | |||
Consideration at fair value for acquisition from Sanimax: | |||
Cash | $ | 12,541 | |
Common stock | 4,050 | ||
Contingent consideration | 4,500 | ||
Total | $ | 21,091 | |
The fair value of the 500,000 shares of Common Stock issued was determined using the closing market price of the Company's common shares at the date of acquisition.
REG Madison may pay contingent consideration of up to $5,000 (Earnout Payments) over a seven-year period after the acquisition, subject to achievement of certain milestones related to the biomass-based diesel gallons produced and sold by REG Madison. The Earnout Payments are payable in cash and cannot exceed $1,700 in any one year period beginning March 15, 2016 through 2023 and up to $5,000 in aggregate. As of September 30, 2016, the Company has recorded a contingent liability of $4,166, approximately $1,532 of which has been classified as current on the Condensed Consolidated Balance Sheets.
The following table summarizes the fair values of the assets acquired at the acquisition date.
March 15, 2016 | |||
Assets acquired from Sanimax Energy: | |||
Inventory | $ | 1,591 | |
Property, plant and equipment | 19,500 | ||
Net identifiable assets acquired | $ | 21,091 | |
The following pro forma condensed combined results of operations assume that the acquisition from Sanimax Energy was completed as of January 1, 2015.
Three Months Ended September 30, 2016 | Three Months Ended September 30, 2015 | Nine Months Ended September 30, 2016 | Nine Months Ended September 30, 2015 | ||||||||||||
Revenues | $ | 624,640 | $ | 399,665 | $ | 1,489,237 | $ | 1,013,963 | |||||||
Net income (loss) | 22,929 | (17,208 | ) | 23,670 | (60,382 | ) | |||||||||
Basic net income (loss) per share | $ | 0.59 | $ | (0.39 | ) | $ | 0.57 | $ | (1.36 | ) | |||||
NOTE 4 — INVENTORIES
Inventories consist of the following:
September 30, 2016 | December 31, 2015 | ||||||
Raw materials | $ | 46,636 | $ | 28,989 | |||
Work in process | 3,879 | 3,014 | |||||
Finished goods | 47,707 | 53,887 | |||||
Total | $ | 98,222 | $ | 85,890 | |||
NOTE 5 — OTHER ASSETS
Prepaid expense and other assets consist of the following:
10
September 30, 2016 | December 31, 2015 | ||||||
Commodity derivatives and related collateral, net | $ | 11,187 | $ | 10,097 | |||
Prepaid expenses | 14,540 | 8,504 | |||||
Deposits | 2,758 | 3,824 | |||||
RIN inventory | 12,229 | 5,656 | |||||
Taxes receivable | 1,135 | 1,814 | |||||
Other | 3,903 | 1,987 | |||||
Total | $ | 45,752 | $ | 31,882 | |||
RIN inventory values were adjusted in the amounts of $1,723 and $3,027 at September 30, 2016 and December 31, 2015, respectively, to reflect the lower of cost or net realizable value.
Other noncurrent assets consist of the following:
September 30, 2016 | December 31, 2015 | ||||||
Spare parts inventory | $ | 2,922 | $ | 2,922 | |||
Deposits | 2,280 | 2,370 | |||||
Other | 6,631 | 6,527 | |||||
Total | $ | 11,833 | $ | 11,819 | |||
NOTE 6— INTANGIBLE ASSETS
Intangible assets consist of the following:
September 30, 2016 | |||||||||||||
Cost | Accumulated Amortization | Net | Weighted Average Remaining Life | ||||||||||
Raw material supply agreement | $ | 6,230 | $ | (1,875 | ) | $ | 4,355 | 9.3 years | |||||
Renewable hydrocarbon diesel technology | 8,300 | (1,291 | ) | 7,009 | 12.8 years | ||||||||
Ground lease | 200 | (123 | ) | 77 | 5.1 years | ||||||||
Acquired customer relationships | 2,900 | (324 | ) | 2,576 | 8.8 years | ||||||||
Total amortizing intangibles | 17,630 | (3,613 | ) | 14,017 | |||||||||
In-process research and development, indefinite lives | 15,956 | — | 15,956 | ||||||||||
Total intangible assets | $ | 33,586 | $ | (3,613 | ) | $ | 29,973 | ||||||
December 31, 2015 | |||||||||||||
Cost | Accumulated Amortization | Net | Weighted Average Remaining Life | ||||||||||
Raw material supply agreement | $ | 6,230 | $ | (1,551 | ) | $ | 4,679 | 10.0 years | |||||
Renewable hydrocarbon diesel technology | 8,300 | (876 | ) | 7,424 | 13.5 years | ||||||||
Ground lease | 200 | (112 | ) | 88 | 5.9 years | ||||||||
Acquired customer relationships | 2,900 | (106 | ) | 2,794 | 9.6 years | ||||||||
Total amortizing intangibles | 17,630 | (2,645 | ) | 14,985 | |||||||||
In-process research and development, indefinite lives | 15,956 | — | 15,956 | ||||||||||
Total intangible assets | $ | 33,586 | $ | (2,645 | ) | $ | 30,941 | ||||||
The Company recorded intangible amortization expense of $328 and $968 for the three and nine months ended September 30, 2016, respectively, and $257 and $745 for the three and nine months ended September 30, 2015, respectively.
The estimated intangible asset amortization expense for the remainder of fiscal year 2016 through fiscal year 2022 and thereafter is as follows:
11
October 1, 2016 through December 31, 2016 | $ | 324 | |
2017 | 1,302 | ||
2018 | 1,309 | ||
2019 | 1,315 | ||
2020 | 1,322 | ||
2021 | 1,328 | ||
2022 and thereafter | 7,117 | ||
Total | $ | 14,017 | |
NOTE 7 — DEBT
The Company’s debt is as follows:
September 30, 2016 | December 31, 2015 | ||||||
4.00% Convertible Senior Notes, $152,000 face amount, due in June 2036 | $ | 112,755 | $ | — | |||
2.75% Convertible Senior Notes, $73,838 face amount, due in June 2019 | 66,619 | 126,053 | |||||
REG Geismar GOZone bonds, secured, variable interest rate of daily LIBOR, due in October 2033 | — | 100,000 | |||||
REG Danville term loan, secured, variable interest rate of LIBOR plus 4%, due in December 2017 | 8,800 | — | |||||
REG Newton term loan, secured, variable interest rate of LIBOR plus 4%, due in December 2018 | 13,789 | 16,800 | |||||
REG Mason City term loan, fixed interest rate of 5%, due in July 2019 | 2,898 | 3,675 | |||||
REG Ames term loans, secured, fixed interest rates of 3.5% and 4.25%, due in January 2018 and December 2019, respectively | 3,651 | 3,901 | |||||
REG Grays Harbor term loan, variable interest of minimum of 3.5% or Prime Rate plus 0.25%, due in May 2022 | 9,500 | 5,225 | |||||
Other | 709 | 908 | |||||
Total term debt before debt issuance costs | 218,721 | 256,562 | |||||
Less: Current portion of long-term debt | 10,349 | 5,206 | |||||
Less: Debt issuance costs (net of accumulated amortization of $2,973 and $2,296, respectively) | 6,488 | 4,105 | |||||
Total long-term debt | $ | 201,884 | $ | 247,251 | |||
REG Danville
On October 31, 2015, REG Danville, LLC entered into a Second Amended and Restated Loan Agreement with Fifth Third Bank regarding the construction/term loan (the "Fifth Third Construction/Term Loan"). The renewed Fifth Third Construction/Term Loan increased the principal amount of the Construction/Term Loan to $12,000 and had a three-year term with the maturity of the loan being extended to December 19, 2017. The loan requires monthly principal payments of $212 and interest to be charged using LIBOR plus 4% per annum. The loan agreement contains various loan covenants. As of September 30, 2016, there was $8,800 outstanding under the Fifth Third Construction/Term Loan.
Convertible Senior Notes
On June 2, 2016, the Company issued $152,000 aggregate principal amount of the 2036 Convertible Notes in a private offering to qualified institutional buyers. The 2036 Convertible Notes bear interest at a rate of 4.00% per year payable semi-annually in arrears on June 15 and December 15 of each year, beginning December 15, 2016. The notes will mature on June 15, 2036, unless repurchased, redeemed or converted in accordance with their terms prior to such date.
Prior to December 15, 2035, the 2036 Convertible Notes will be convertible only upon satisfaction of certain conditions and during certain periods as stipulated in the indenture. On or after December 15, 2035 until the close of business on the second scheduled trading day immediately preceding the maturity date, holders of the 2036 Convertible Notes may convert their notes at any time. Unless and until the Company obtains stockholder approval under applicable NASDAQ Stock Market rules, the 2036 Convertible Notes will be convertible, subject to certain conditions, into cash. If the Company obtains such
12
stockholder approval, the 2036 Convertible Notes may be settled in cash, the Company’s common shares or a combination of cash and the Company’s common shares, at the Company’s election. The Company may not redeem the 2036 Convertible Notes prior to June 15, 2021. Holders of the 2036 Convertible Notes will have the right to require the Company to repurchase for cash all or some of their notes at 100% of their principal, plus any accrued and unpaid interest on each of June 15, 2021, June 15, 2026 and June 15, 2031. Holders of the 2036 Convertible Notes will have the right to require the Company to repurchase for cash all or some of their notes at 100% of their principal, plus any accrued and unpaid interest upon the occurrence of certain fundamental changes. The initial conversion rate is 92.8074 common shares per $1,000 (one thousand) principal amount of 2036 Convertible Notes (equivalent to an initial conversion price of approximately $10.78 per common share).
The net proceeds from the offering of the 2036 Convertible Notes were approximately $147,118, after deducting fees and offering expenses of $4,882, which was capitalized as debt issuance costs and is being amortized through June 2036.
The Company evaluated the terms of the conversion features under the applicable accounting literature, including Derivatives and Hedging, ASC 815, and determined that a certain feature required separate accounting as a derivative. This derivative was recorded as a long-term liability, "Convertible Debt Conversion Liability" on the Condensed Consolidated Balance Sheets and will be adjusted to reflect fair value each reporting date. The fair value of the convertible debt conversion liability at issuance was $40,145. The fair value of the convertible debt conversion liability at September 30, 2016 was $23,700. The Company recognized gains of $3,013 and $16,445 for the three and nine months ended September 30, 2016, respectively, which are reflected in the "Change in Fair Value of Convertible Debt Conversion Liability" on the Condensed Consolidated Statements of Operations. The debt liability component of 2036 Convertible Notes was determined to be $111,855 at issuance, reflecting a debt discount of $40,145. The debt discount is to be amortized through June 2036. The effective interest rate on the debt liability component was 2.45%.
In June 2016, approximately $35,101 of the net proceeds from the offering of the 2036 Convertible Notes were used to repurchase 4,060,323 shares of the Company's Common Stock in privately negotiated transactions. In addition, approximately $61,954 of the net proceeds from the offering were used to repurchase $63,912 principal amount of the Company's 2019 Convertible Notes in privately negotiated transactions, resulting in a gain on debt extinguishment of $2,152, which is reflected on the Condensed Consolidated Statements of Operations.
In September 2016, the Company used approximately $5,584 under the March 2016 share repurchase program to repurchase an additional $6,000 principal amount of the 2019 Convertible Notes.
REG Grays Harbor, LLC
In July 2015, REG Grays Harbor entered into a credit agreement with Umpqua Bank, or Umpqua Credit Agreement, whereby it can borrow up to $10.0 million for capital expenditure projects. Amounts borrowed under the Umpqua Credit Agreement bear interest at a per annum rate at of minimum of 3.50% or Prime Rate plus 0.25%. In addition, in July 2015 REG Grays Harbor entered into a line of credit note or Umpqua Line of Credit Note in conjunction with the Umpqua Credit Agreement for a maximum borrowing amount of $5,000. In September 2016, REG Grays Harbor entered into the first loan modification agreement with Umpqua Bank, or the First Modification, to extend the maturity date of the Umpqua Line of Credit to July 31, 2018. The terms of the Umpqua Credit Agreement provides that any principal outstanding under the Umpqua Line of Credit Note on July 31, 2016 shall be converted into term debt. At September 30, 2016, the total outstanding borrowing under the Umpqua Credit Agreement was all term debt and amounted to $9,500, bearing an interest rate of 4.30% per annum.
REG Geismar
REG Geismar was the obligor with respect to $100,000 aggregate principal amount of Gulf Opportunity Zone tax-exempt bonds, or GOZone Bonds, originally due in October 2033, through a loan agreement with the Louisiana Public Facilities Authority. REG Geismar’s payment obligations on the GOZone Bonds were supported by a letter of credit issued by a financial institution. REG Geismar was party to an agreement to reimburse the financial institution for any draws on the letter of credit and that obligation was secured by a $101,315 certificate of deposit by the Company and pledged in favor of the financial institution. On September 6, 2016, REG Geismar caused the Louisiana Public Facilities Authority to call for redemption all of the outstanding GOZone Bonds as of September 6, 2016. The redemption was funded by application of the funds generated by release of the certificate of deposit.
Lines of Credit
13
September 30, 2016 | December 31, 2015 | ||||||
Amount outstanding under lines of credit | $ | 6,354 | $ | 23,149 | |||
Maximum available to be borrowed under lines of credit | $ | 67,972 | $ | 23,067 | |||
On March 16, 2016, REG Energy Services, LLC ("REG Energy Services") entered into an operating and revolving line of credit agreement (the "Agreement") with Bankers Trust Company (“Bankers Trust”). Pursuant to the Agreement, Bankers Trust agreed to provide an operating and revolving line of credit (the "Line of Credit") to REG Energy Services in the amount of $30,000. Amounts outstanding under the Agreement bear variable interest as stipulated in the Agreement. The Agreement contains various loan covenants that restrict REG Energy Services’ ability to take certain actions, including prohibiting it in certain circumstances from making payments to the Company. In addition, the Line of Credit is secured by substantially all of REG Energy Services’ accounts receivable and inventory.
On September 30, 2016, REG Services Group, LLC and REG Marketing & Logistics Group, LLC, the Company's wholly-owned subsidiaries entered into a Joinder and Amendment No. 11 to Credit Agreement (the “Amendment”) to that certain Credit Agreement originally dated as of December 23, 2011, by and among Borrowers, the lenders party thereto (“Lenders”) and Wells Fargo Capital Finance, LLC, as the agent, and Fifth Third Bank, as a new lender (as amended, the “Revolving Credit Agreement”). Pursuant to the Amendment, the maximum commitment of the Lenders under the Revolving Credit Agreement to make revolving loans was increased from $60,000 to $150,000, and an accordion feature was added to the Revolving Credit Agreement, which allows the Company to request commitments for additional revolving loans in aggregate amount not to exceed to $50,000, subject to customary conditions, including the consent of Lenders providing such additional commitments. The Amendment extends the maturity date of the Revolving Credit Agreement to September 30, 2021. In addition, the interest rate under the Revolving Credit Agreement was modified so that loans advanced thereunder will now bear interest based on a one-month LIBOR rate (which shall not be less than zero), plus a margin based on Quarterly Average Excess Availability (as defined in the Revolving Credit Agreement), which may range from 1.75% per annum to 2.25% per annum. Certain financial covenants applicable to the Borrowers under the Revolving Credit Agreement were also modified.
NOTE 8 — RELATED PARTY TRANSACTIONS
The Company reassesses its related parties at reporting dates and has determined that West Central Cooperative, now known as Landus Cooperative ("Landus"), is no longer a related party because it does not hold ten percent or more of the Company’s outstanding Common Stock, and no longer has the right to a seat on the Company's board for the three and nine months ended September 30, 2016. Transactions with Landus, prior to the Company's determination that Landus was no longer a related party, amounted to $4,542 for the three and nine months ended September 30, 2015, primarily related to raw material purchases at market prices. This amount was included in the "Costs of goods sold - Biomass-based diesel" on the Condensed Consolidated Statements of Operations.
NOTE 9 — DERIVATIVE INSTRUMENTS
The Company enters into New York Mercantile Exchange NY Harbor ULSD ("NY Harbor ULSD" or previously referred to as heating oil) and CBOT Soybean Oil (previously referred to as soybean oil) futures, swaps and options ("commodity contract derivatives") to reduce the risk of price volatility related to anticipated purchases of feedstock raw materials and to protect cash margins from potentially adverse effects of price volatility on biomass-based diesel sales where prices are set at a future date. All of the Company’s commodity contract derivatives are designated as non-hedge derivatives and recorded at fair value on the Condensed Consolidated Balance Sheets. Unrealized gains and losses are recognized as a component of biomass-based diesel costs of goods sold reflected in current results of operations. As of September 30, 2016, the net notional volumes of NY Harbor ULSD and CBOT Soybean Oil covered under the open commodity derivative contracts were approximately 85 million gallons and 51 million pounds, respectively.
The Company offsets the fair value amounts recognized for its commodity contract derivatives with cash collateral with the same counterparty under a master netting agreement. The net position is presented within prepaid and other assets in the Condensed Consolidated Balance Sheets. The following table sets forth the fair value of the Company's commodity contract
14
derivatives and amounts that offset within the Condensed Consolidated Balance Sheets:
September 30, 2016 | December 31, 2015 | ||||||||||||||
Assets | Liabilities | Assets | Liabilities | ||||||||||||
Gross amounts of derivatives recognized at fair value | $ | 861 | $ | 5,831 | $ | 4,644 | $ | 185 | |||||||
Cash collateral | 16,157 | — | 5,638 | — | |||||||||||
Total gross amount recognized | 17,018 | 5,831 | 10,282 | 185 | |||||||||||
Gross amounts offset | (5,831 | ) | (5,831 | ) | (185 | ) | (185 | ) | |||||||
Net amount reported in the condensed consolidated balance sheets | $ | 11,187 | $ | — | $ | 10,097 | $ | — | |||||||
The following table sets forth the commodity contract derivatives gains and (losses) included in the Condensed Consolidated Statements of Operations:
Location of Gain (Loss) Recognized in income | Three Months Ended September 30, 2016 | Three Months Ended September 30, 2015 | Nine Months Ended September 30, 2016 | Nine Months Ended September 30, 2015 | |||||||||||||
Commodity derivatives | Cost of goods sold – Biomass-based diesel | $ | 5,865 | $ | 23,349 | $ | (28,931 | ) | $ | 19,358 | |||||||
NOTE 10 — FAIR VALUE MEASUREMENT
The fair value hierarchy prioritizes the inputs used in measuring fair value as follows:
• | Level 1 — Quoted prices for identical instruments in active markets. |
• | Level 2 — Quoted prices for similar instruments in active markets, quoted prices for identical or similar instruments in markets that are not active and model-derived valuations, in which all significant inputs are observable in active markets. |
• | Level 3 — Unobservable inputs in which there is little or no market data, which require the reporting entity to develop its own assumptions. |
A summary of assets (liabilities) measured at fair value is as follows:
As of September 30, 2016 | |||||||||||||||
Total | Level 1 | Level 2 | Level 3 | ||||||||||||
Commodity contract derivatives | $ | (4,970 | ) | $ | (2,782 | ) | $ | (2,188 | ) | $ | — | ||||
Convertible debt conversion liability | (23,700 | ) | — | (23,700 | ) | — | |||||||||
Contingent considerations for acquisitions | (46,021 | ) | — | — | (46,021 | ) | |||||||||
$ | (74,691 | ) | $ | (2,782 | ) | $ | (25,888 | ) | $ | (46,021 | ) | ||||
As of December 31, 2015 | |||||||||||||||
Total | Level 1 | Level 2 | Level 3 | ||||||||||||
Commodity contract derivatives | $ | 4,459 | $ | 2,196 | $ | 2,263 | $ | — | |||||||
Contingent considerations for acquisitions | (41,712 | ) | — | — | (41,712 | ) | |||||||||
$ | (37,253 | ) | $ | 2,196 | $ | 2,263 | $ | (41,712 | ) | ||||||
The following is a reconciliation of the beginning and ending balances for liabilities measured at fair value on a recurring basis using significant unobservable inputs (Level 3):
15
Contingent Consideration for Acquisitions | |||||||
2016 | 2015 | ||||||
Balance at beginning of period, January 1 | $ | 41,712 | $ | 39,319 | |||
Fair value of contingent consideration at measurement date | 4,500 | — | |||||
Change in estimates included in earnings | (15 | ) | 293 | ||||
Settlements | (581 | ) | (1,052 | ) | |||
Balance at end of period, March 31 | 45,616 | 38,560 | |||||
Change in estimates included in earnings | 3,571 | (2,121 | ) | ||||
Settlements | (809 | ) | (943 | ) | |||
Balance at end of period, June 30 | 48,378 | 35,496 | |||||
Fair value of contingent consideration at measurement date | — | 5,000 | |||||
Change in estimates included in earnings | 1,124 | 1,106 | |||||
Settlements | (3,481 | ) | (111 | ) | |||
Balance at end of period, September 30 | $ | 46,021 | $ | 41,491 | |||
The estimated fair values of the Company’s financial instruments, which are not recorded at fair value, are as follows:
As of September 30, 2016 | As of December 31, 2015 | ||||||||||||||
Asset (Liability) Carrying Amount | Fair Value | Asset (Liability) Carrying Amount | Fair Value | ||||||||||||
Financial liabilities: | |||||||||||||||
Debt and lines of credit | $ | (218,587 | ) | $ | (214,761 | ) | $ | (279,711 | ) | $ | (275,123 | ) | |||
The carrying amounts reported in the Condensed Consolidated Balance Sheets for cash and cash equivalents, accounts receivable, accounts payable and accrued expenses approximate their fair values. Money market funds are included in cash and cash equivalents on the Condensed Consolidated Balance Sheets.
The Company used the following methods and assumptions to estimate fair value of its financial instruments:
Commodity derivatives: The instruments held by the Company consist primarily of futures contracts, swap agreements, purchased put options and written call options. The fair value of contracts based on quoted prices of identical assets in an active exchange-traded market is reflected in Level 1. Contract fair value that is determined based on quoted prices of similar contracts in over-the-counter markets is reflected in Level 2.
Contingent consideration for acquisitions: The fair value of the contingent consideration regarding REG Life Sciences, LLC ("REG Life Sciences") is determined using an expected present value technique. Expected cash flows are determined using the probability weighted-average of possible outcomes that would occur should achievement of certain milestones related to the development and commercialization of products from REG Life Sciences' technology occur. There is no observable market data available to use in valuing the contingent consideration; therefore, the Company developed its own assumptions related to the expected future delivery of product enhancements to estimate the fair value of these liabilities. An 8.0% discount rate is used to estimate the fair value of the expected payments.
The fair value of all other contingent consideration is determined using an expected present value technique. Expected cash flows are determined using the probability weighted-average of possible outcomes that would occur should the achievement of certain milestones related to the production and/or sale of biomass-based diesel at the specific production facility. A discount rate ranging from 5.8% to 10.0% is used to estimate the fair value of the expected payments.
Convertible debt conversion liability: The fair value of the convertible debt conversion liability is estimated using the Black-Scholes model incorporating the terms and conditions of the 2036 Convertible Notes and considering changes in the prices of the Company's common stock, Company stock price volatility, risk-free rates and changes in market rates. The valuations are, among other things, subject to changes in the Company's credit worthiness as well as change in general market conditions. As the majority of the assumptions used in the calculations are based on market sources, the fair value of the convertible conversion liability is reflected in Level 2.
Debt and lines of credit: The fair value of long-term debt and lines of credit was established using discounted cash flow calculations and current market rates reflecting Level 2 inputs.
16
NOTE 11 — NET INCOME (LOSS) PER SHARE
Basic net income (loss) per share is presented in conformity with the two-class method required for participating securities. Participating securities include restricted stock units ("RSUs").
Under the two-class method, net income is reduced for distributed and undistributed dividends earned in the current period. The remaining earnings are then allocated to Common Stock and the participating securities. The Company calculates the effects of participating securities on diluted earnings per share ("EPS") using both the “if-converted or treasury stock” and "two-class" methods and discloses the method which results in a more dilutive effect. The effects of Common Stock options, warrants, stock appreciation rights and convertible notes on diluted EPS are calculated using the treasury stock method unless the effects are anti-dilutive to EPS.
The following potentially dilutive weighted average securities were excluded from the calculation of diluted net income (loss) per share attributable to common stockholders during the periods presented, as the effect was anti-dilutive:
Three Months Ended September 30, 2016 | Three Months Ended September 30, 2015 | Nine Months Ended September 30, 2016 | Nine Months Ended September 30, 2015 | ||||||||
Options to purchase common stock | 87,026 | 87,026 | 87,026 | 87,026 | |||||||
Restricted stock units | — | 709 | — | 709 | |||||||
Stock appreciation rights | 2,484,757 | 2,430,414 | 2,428,095 | 2,120,550 | |||||||
2019 Convertible notes | 5,922,068 | 10,838,218 | 8,677,528 | 10,838,218 | |||||||
2036 Convertible notes | 14,106,725 | — | 6,229,612 | — | |||||||
Total | 22,600,576 | 13,356,367 | 17,422,261 | 13,046,503 | |||||||
The following table presents the calculation of diluted net loss per share:
Three Months Ended September 30, 2016 | Three Months Ended September 30, 2015 | Nine Months Ended September 30, 2016 | Nine Months Ended September 30, 2015 | ||||||||||||
Net income (loss) attributable to the Company’s common stockholders - Basic | $ | 22,929 | $ | (15,675 | ) | $ | 23,668 | $ | (55,783 | ) | |||||
Less: effect of participating securities | — | — | — | — | |||||||||||
Net income (loss) attributable to common stockholders - Dilutive | $ | 22,929 | $ | (15,675 | ) | $ | 23,668 | $ | (55,783 | ) | |||||
Shares: | |||||||||||||||
Weighted-average shares used to compute basic net income (loss) per share | 38,744,878 | 43,844,005 | 41,673,223 | 43,979,266 | |||||||||||
Adjustment to reflect conversion of preferred stock | — | — | |||||||||||||
Adjustment to reflect warrants to purchase common stock | — | — | |||||||||||||
Adjustment to reflect stock appreciation right conversions | 6,828 | — | 5,765 | — | |||||||||||
Weighted-average shares used to compute diluted net income (loss) per share | 38,751,706 | 43,844,005 | 41,678,988 | 43,979,266 | |||||||||||
Net income (loss) per share attributable to common stockholders: | |||||||||||||||
Diluted | $ | 0.59 | $ | (0.36 | ) | $ | 0.57 | $ | (1.27 | ) | |||||
NOTE 12 — REPORTABLE SEGMENTS AND GEOGRAPHIC INFORMATION
The Company reports its reportable segments based on products and services provided to customers. The Company re-assesses its reportable segment on an annual basis. During the fourth quarter of 2015, due to the increasing activities surrounding its renewable chemicals business, the Company changed the composition of its operating segments from two reportable segments to three reportable segments by presenting Renewable Chemicals separate from Biomass-based Diesel. The new reportable segments generally align the Company's external financial reporting segments with its new internal operating segments, which are based on its internal organizational structure, operating decisions and performance assessment. As such, the Company's reportable segments at September 30, 2016 and December 31, 2015 include Biomass-based Diesel, Services, Renewable Chemicals and Corporate and other activities. The accounting policies of the segments are the same as
17
those described in the summary of significant accounting policies. All prior period disclosures below have been recast to present results on a comparable basis.
The Biomass-based Diesel segment processes waste vegetable oils, animal fats, virgin vegetable oils and other feedstocks and methanol into biomass-based diesel. The Biomass-based Diesel segment also includes the Company’s purchases and resale of biomass-based diesel produced by third parties. Revenue is derived from the purchases and sales of biomass-based diesel, RINs and raw material feedstocks acquired from third parties, sales of biomass-based diesel produced under toll manufacturing arrangements with third party facilities, sales of processed biomass-based diesel from Company facilities, related by-products and renewable energy government incentive payments, in the U.S. and internationally.
The Services segment offers services for managing the construction of biomass-based diesel production facilities and managing ongoing operations of third-party plants and collects fees related to the services provided. The Company does not allocate items that are of a non-operating nature or corporate expenses to the business segments. Revenues from services provided to other segments are recorded by the Services segment at cost.
The Renewable Chemicals segment consists of research and development activities involving the production of renewable chemicals, additional advanced biofuels and other products from the Company's proprietary microbial fermentation process and the operations of a demonstration scale facility located in Okeechobee, Florida.
The Corporate and Other segment includes trading activities related to petroleum-based heating oil and diesel fuel as well as corporate activities, which consist of corporate office expenses such as compensation, benefits, occupancy and other administrative costs, including management service expenses. Corporate and Other also includes income/(expense) not associated with the reportable segments, such as corporate general and administrative expenses, shared service expenses, interest expense and interest income, all reflected on an accrual basis of accounting. In addition, Corporate and Other includes cash and other assets not associated with the reportable segments, including investments. Intersegment revenues are reported by the Services and Corporate and Other segments.
18
The following table represents the significant items by reportable segment:
Three Months Ended September 30, 2016 | Three Months Ended September 30, 2015 | Nine Months Ended September 30, 2016 | Nine Months Ended September 30, 2015 | ||||||||||||
Net revenues: | |||||||||||||||
Biomass-based Diesel (includes Petrotec's net sales of $41,671 and $124,388 and $40,777 and $108,851for the three and nine months ended September 30, 2016 and 2015, respectively) | $ | 599,198 | $ | 377,070 | $ | 1,423,867 | $ | 964,359 | |||||||
Services | 21,051 | 28,231 | 63,184 | 71,625 | |||||||||||
Renewable Chemicals | 565 | — | 1,565 | — | |||||||||||
Corporate and Other | 28,781 | 23,154 | 69,412 | 45,716 | |||||||||||
Intersegment revenues | (24,955 | ) | (33,599 | ) | (77,217 | ) | (82,164 | ) | |||||||
$ | 624,640 | $ | 394,856 | $ | 1,480,811 | $ | 999,536 | ||||||||
Income (loss) before income taxes: | |||||||||||||||
Biomass-based Diesel (includes Petrotec's income (loss) of $306 and $1,922 and $135 and ($1,856) for the three and nine months ended September 30, 2016 and 2015, respectively) | $ | 25,598 | $ | (10,358 | ) | $ | 27,143 | $ | (38,458 | ) | |||||
Services | 1,753 | 2,464 | 3,587 | 2,716 | |||||||||||
Renewable Chemicals | (5,783 | ) | (4,573 | ) | (14,388 | ) | (12,780 | ) | |||||||
Corporate and Other | 734 | (4,254 | ) | 8,810 | (10,270 | ) | |||||||||
$ | 22,302 | $ | (16,721 | ) | $ | 25,152 | $ | (58,792 | ) | ||||||
Depreciation and amortization expense, net: | |||||||||||||||
Biomass-based Diesel (includes Petrotec's amounts of $707 and $2,419 and $817 and $2,419 for the three and nine months ended September 30, 2016 and 2015, respectively) | $ | 7,516 | $ | 5,559 | $ | 21,584 | $ | 15,984 | |||||||
Services | 108 | 79 | 321 | 217 | |||||||||||
Renewable Chemicals | 382 | 389 | 1,164 | 1,051 | |||||||||||
Corporate and Other | 265 | 390 | 1,054 | 1,125 | |||||||||||
$ | 8,271 | $ | 6,417 | $ | 24,123 | $ | 18,377 | ||||||||
Cash paid for purchases of property, plant and equipment: | |||||||||||||||
Biomass-based Diesel (includes Petrotec's amounts of $734 and $1,038 and $256 and $1,233 for the three and nine months ended September 30, 2016 and 2015, respectively) | $ | 10,560 | $ | 23,193 | $ | 36,059 | $ | 48,283 | |||||||
Services | 4,647 | 9,855 | 5,812 | 10,980 | |||||||||||
Renewable Chemicals | 16 | 242 | 635 | 546 | |||||||||||
Corporate and Other | 119 | 17 | 303 | 1,205 | |||||||||||
$ | 15,342 | $ | 33,307 | $ | 42,809 | $ | 61,014 | ||||||||
19
September 30, 2016 | December 31, 2015 | ||||||
Goodwill: | |||||||
Services | $ | 16,080 | $ | 16,080 | |||
Assets: | |||||||
Biomass-based Diesel (including Petrotec's assets of $56,159 and $45,471, respectively) | $ | 855,486 | $ | 1,048,923 | |||
Services | 48,892 | 60,308 | |||||
Renewable Chemicals | 23,214 | 23,872 | |||||
Corporate and Other | 275,114 | 308,782 | |||||
Intersegment eliminations | (182,592 | ) | (218,265 | ) | |||
$ | 1,020,114 | $ | 1,223,620 | ||||
Geographic Information:
The following geographic data include net sales attributed to the countries based on the location of the subsidiary making the sale and long-lived assets based on physical location. Long-lived assets represent the net book value of property, plant and equipment.
Three Months Ended September 30, 2016 | Three Months Ended September 30, 2015 | Nine Months Ended September 30, 2016 | Nine Months Ended September 30, 2015 | ||||||||||||
Net revenues: | |||||||||||||||
United States | $ | 582,969 | $ | 354,079 | $ | 1,356,473 | $ | 890,685 | |||||||
Foreign | 41,671 | 40,777 | 124,338 | 108,851 | |||||||||||
$ | 624,640 | $ | 394,856 | $ | 1,480,811 | $ | 999,536 | ||||||||
September 30, 2016 | December 31, 2015 | ||||||
Long-lived assets: | |||||||
United States | $ | 590,780 | $ | 553,987 | |||
Foreign | 19,780 | 20,597 | |||||
$ | 610,560 | $ | 574,584 | ||||
NOTE 13 — COMMITMENTS AND CONTINGENCIES
The Company is involved in legal proceedings in the normal course of business. The Company currently believes that any ultimate liability arising out of such proceedings will not have a material adverse effect on the Company’s financial position, results of operations or cash flows.
ITEM 2. | MANAGEMENT’S DISCUSSION AND ANALYSIS OF FINANCIAL CONDITION AND RESULTS OF OPERATIONS |
This report contains forward-looking statements regarding Renewable Energy Group, Inc., or “we,” “our” or “the Company” that involve risks and uncertainties such as anticipated financial performance, business prospects, technological developments, products, possible strategic initiatives and similar matters. In some cases, you can identify forward-looking statements by terms such as “may,” “might,” “objective,” “intend,” “should,” “could,” “can,” “would,” “expect,” “believe,” “estimate,” “predict,” “potential,” “plan,” or the negative of these terms, and similar expressions intended to identify forward-looking statements.
20
These forward-looking statements include, but are not limited to, statements about facilities currently under development progressing to the construction and operational stages, including the expected capabilities of these facilities, planned capital expenditures and our ability to obtain financing for such construction; existing or proposed legislation affecting the biomass-based diesel industry, including governmental incentives and tax credits; our utilization of forward contracting and hedging strategies to minimize feedstock and other input price risk; our operational management and facility construction services; the expected effect of current and future environmental laws and regulations on our business and financial condition; our ability to renew existing and expired contracts at similar or more favorable terms; expected technological advances in biomass-based diesel production methods; our ability to develop and market renewable chemicals; anticipated future revenue from products from our life sciences business, which have not been fully developed or commercialized; our competitive advantage relating to input costs relative to our competitors; the market for biomass-based diesel, including the factors that affect such market and our operating results and seasonal fluctuations in demand, and potential biomass-based diesel consumers; our ability to further develop our financial, managerial and other internal controls and reporting systems to accommodate future growth; our ability to improve our internal control over financial reporting; expectations regarding the realization of deferred tax assets and the establishment and maintenance of tax reserves and anticipated trends; the ability of insurance to protect against losses, including any loss resulting from the fires at our Geismar facility; expectations regarding our expenses and sales; our credit worthiness and anticipated general market conditions; anticipated cash needs and estimates regarding capital requirements and needs for additional financing; and challenges in our business and the biomass-based diesel market.
These forward-looking statements are based on management’s current expectations, estimates, assumptions and projections, which are subject to risks and uncertainties. These risks and uncertainties could cause actual results to differ materially from those expected. Given these uncertainties, you should not place undue reliance on these forward-looking statements. Risks and uncertainties include, but are not limited to, those risks discussed in Item 1A Part II in this Quarterly Report on Form 10-Q for the three and nine months ended September 30, 2016. We encourage you to read this Management’s Discussion and Analysis of Financial Condition and Results of Operations in conjunction with the accompanying condensed consolidated financial statements and related notes. Forward-looking statements contained in this report present management’s views only as of the date of this report. Except as required under applicable law, we do not intend to issue updates concerning any future revisions of management’s views to reflect events or circumstances occurring after the date of this report.
Overview
Our Company focuses on providing cleaner, lower carbon intensity fuel products and related services while also providing conventional fuel products and related services. We principally generate revenue as a leading North American advanced biofuels producer. We are the largest producer of biomass-based diesel in the United States. We utilize a nationwide production, distribution and logistics system as part of an integrated value chain model to focus on converting natural fats, oils and greases into advanced biofuels. We are also engaged in research and development efforts focused on the conversion of diverse feedstocks into renewable chemicals. We own and operate 12 North American biorefineries, which include 11 biomass-based diesel, or biodiesel and renewable hydrocarbon diesel, production facilities with aggregate nameplate production capacity of 452 million gallons per year, or mmgy, and one demonstration scale fermentation facility.
We are a lower-cost biomass-based diesel producer. We primarily produce our biomass-based diesel from a wide variety of lower cost feedstocks, including inedible corn oil, used cooking oil and inedible animal fat. We also produce biomass-based diesel from virgin vegetable oils, which are more widely available and tend to be higher in price. We believe our ability to process a wide variety of feedstocks provides us with a cost advantage over many biomass-based diesel producers, particularly those that rely primarily on higher cost virgin vegetable oils, such as soybean oil or canola oil.
In 2014, we acquired a development-stage industrial biotechnology business focusing on microbial fermentation to develop and produce renewable chemicals, fuels and other products.
We sell petroleum-based heating oil and diesel fuel, which enables us to offer additional biofuel blends, while expanding our customer base. We sell heating oil and ultra-low sulfur diesel, or ULSD, at terminals throughout the northeastern U.S. as well as BioHeat® blended fuel at one of our existing Northeastern terminal locations. In 2015, we expanded our sales of additional biofuel blends to Midwest terminal locations and look to potentially expand to other areas across North America.
We acquired a 75 mmgy nameplate capacity renewable hydrocarbon diesel biorefinery in Geismar, Louisiana in June 2014. We began production at the Geismar facility in October 2014 after completion of upgrades. The facility was idle from April 2015 to March 2016 while repairs were made related to two separate fires that occurred at the facility in April 2015 and September 2015.
We also expanded our business internationally by acquiring a majority interest in Petrotec AG, or Petrotec, in December 2014. During 2015 and the first nine months of 2016, we acquired additional shares in Petrotec and at September 30, 2016, we owned approximately 91% of Petrotec's outstanding shares. Petrotec is a fully-integrated company utilizing used cooking oil and other waste feedstocks to produce biodiesel at its two biorefineries in Emden and Oeding, Germany. Petrotec’s nameplate production capacity is approximately 50 mmgy.
In August 2015, we acquired our Grays Harbor facility, a 100 mmgy nameplate biodiesel plant and terminal at the Port of Grays Harbor, Washington. This acquisition expanded our production fleet to the west coast of the United States. The Grays
21
Harbor location includes 18 million gallons of storage capacity and a terminal that can accommodate feedstock intake and fuel delivery on deep-water PANAMAX class vessels as well as possessing significant rail and truck transport capabilities. To date, the production facility's primary feedstock has been canola oil sourced nearby in the Pacific Northwest.
In March 2016, we acquired our 20 mmgy nameplate biodiesel refinery located in DeForest, Wisconsin, REG Madison, LLC, produces biodiesel from yellow grease, rendered animal fats, and inedible corn oil, in addition to refined vegetable oils using our patented technology currently in use at our Seneca, Illinois plant. The facility has both truck and rail capabilities.
During the respective three and nine months ended September 30, 2016, we sold 163 million and 411 million total gallons, including 27 and 55 million gallons of biomass-based diesel that we purchased from third parties and resold, 10 and 32 million international biomass-based diesel gallons from our majority owned investment in Petrotec and 11 and 33 million petroleum-based diesel gallons. During 2015, we sold a total of 375 million total gallons, including 40 million gallons of biomass-based diesel we purchased from third parties and resold, 40 million international biomass-based diesel gallons and 30 million petroleum-based diesel gallons.
We re-assess our reportable segments on an annual basis. Prior to 2015, our businesses were organized into two reportable segments - the Biomass-based Diesel segment and the Services segment. As a result of the increased activities surrounding our renewable chemicals business, we began reporting in 2015 a new segment - Renewable Chemicals, which was previously included in the Biomass-based Diesel segment.
Biomass-based Diesel Segment
Our Biomass-based Diesel segment, as reported herein, includes:
• | the operations of the following biomass-based diesel production facilities: |
• | a 12 mmgy nameplate biodiesel production facility located in Ralston, Iowa; |
• | a 35 mmgy nameplate biodiesel production facility located near Houston, Texas; |
• | a 45 mmgy nameplate biodiesel production facility located in Danville, Illinois; |
• | a 30 mmgy nameplate biodiesel production facility located in Newton, Iowa; |
• | a 60 mmgy nameplate biodiesel production facility located in Seneca, Illinois; |
• | a 30 mmgy nameplate biodiesel production facility located near Albert Lea, Minnesota; |
• | a 15 mmgy nameplate biodiesel production facility located in New Boston, Texas; |
• | a 30 mmgy nameplate biodiesel production facility located in Mason City, Iowa; |
• | a 75 mmgy nameplate renewable hydrocarbon diesel production facility located in Geismar, Louisiana; |
• | a 27 mmgy nameplate biodiesel production facility located in Emden, Germany; |
• | a 23 mmgy nameplate biodiesel production facility located in Oeding, Germany; |
• | a 100 mmgy nameplate biodiesel production facility located in Grays Harbor, Washington; and |
• | a 20 mmgy nameplate biodiesel production facility located in DeForest, Wisconsin, since its acquisition in March 2016. |
• | purchases and resales of biomass-based diesel, petroleum-based diesel, Renewable Identification Numbers ("RINs") and Low Carbon Fuel Standard credits, and raw material feedstocks acquired from third parties; |
• | sales of biomass-based diesel produced under toll manufacturing arrangements with third-party facilities using our feedstocks; and |
• | incentives received from federal and state programs for renewable fuels. |
We derive a small portion of our revenues from the sale of glycerin, free fatty acids and other co-products of the biomass-based diesel production process. In 2015 and for the nine months ended September 30, 2016, our revenues from the sale of co-products were less than five percent of our total Biomass-based Diesel segment revenues. For the nine months ended September 30, 2016, revenues from the sale of petroleum-based heating oil and diesel fuel acquired from third parties, along with the sale of these items further blended with biodiesel produced at wholly owned facilities or purchased from third parties, were less than five percent of our total revenues.
In accordance with EPA regulations, we generate 1.5 to 1.7 Renewable Identification Numbers, or RINs, for each gallon of biomass-based diesel we produce. RINs are used to track compliance with Renewable Fuel Standard 2, or RFS2, using the EPA moderated transaction system, or EMTS. RFS2 allows us to attach between zero and 2.5 RINs to any gallon of biomass-based diesel we sell. When we attach 1.5 to 2.5 RINs to a sale of biomass-based diesel gallons, a portion of our selling price for a gallon of biomass-based diesel is generally attributable to RFS2 compliance; however no cost is allocated to the RINs generated by our biomass-based diesel production as RINs are a form of government incentive and not a result of the physical
22
attributes of the biomass-based diesel production. In addition, RINs, once obtained through the production and sales of gallons of biomass-based diesel, may be separated by the acquirer and sold separately. From time to time, we may obtain these RINs from third parties for resale, and the value of these RINs is reflected in “Prepaid expenses and other assets” on our Condensed Consolidated Balance Sheets. At each balance sheet date, this RIN inventory is valued at the lower of cost or market and resulting adjustments are reflected in our cost of goods sold for the period. The cost of RINs obtained from third parties is determined using the average cost method. Because we do not allocate costs to RINs generated by our biomass-based diesel production, fluctuations in the value of our RIN inventory represent fluctuations in the value of RINs we have obtained from third parties.
Services Segment
Our Services segment includes:
• | biomass-based diesel facility management and operational services, whereby we provide day-to-day management and operational services to biomass-based diesel production facilities; and |
• | construction management services, whereby we act as the construction management and general contractor for the construction of biomass-based diesel production facilities. |
During recent years, we have utilized our construction management expertise internally to upgrade our facilities, such as our facilities located in Albert Lea, New Boston, Mason City and Newton. In October 2016, we completed a $34.5 million upgrade to our Danville facility. During 2015 and the first quarter of 2016, we spent over $42 million related to repairs and upgrade projects at our Geismar facility, most of which was due to damages from fires in April 2015 and September 2015. The Geismar facility came back on line in early March 2016. Demand for our construction management and facility management and operational services depends on capital spending by potential customers and existing customers, which is directly affected by trends in the biomass-based diesel industry. We have not provided services to outside parties for new facility construction services since 2009.
Renewable Chemicals Segment
Our Renewable Chemicals segment includes:
• | research and development activities focusing on microbial fermentation to develop and produce renewable chemicals, additional advanced biofuels and other products; |
• | collaborative research and development and other service activities to continue to build out the technology platform; and |
• | the operations of a demonstration scale fermentation facility located in Okeechobee, Florida since its acquisition in January 2014. |
In January 2016, ExxonMobil Research and Engineering Company, a global leader in advanced biofuels research, announced an agreement with our subsidiary, REG Life Sciences, LLC to study the production of biodiesel by fermenting renewable cellulosic sugars from sources such as agricultural waste. This collaboration is focused on our patented technology that uses microbes to convert sugars to biodiesel via fermentation.
Factors Influencing Our Results of Operations
The principal factors affecting our operations are the market prices for biomass-based diesel and the feedstocks used to produce biomass-based diesel, as well as governmental programs designed to create incentives or requirements for the production and use of biomass-based diesel.
Governmental programs favoring biomass-based diesel production and use
Biomass-based diesel has historically been more expensive than petroleum-based diesel, excluding biomass-based diesel incentives and credits. The biomass-based diesel industry’s growth has largely been the result of federal and state programs that require or incentivize biomass-based diesel, which allows biomass-based diesel to compete with petroleum-based diesel on price.
On July 1, 2010, RFS2 was implemented, stipulating volume requirements for the amount of biomass-based diesel and other advanced biofuels that must be utilized in the United States each year. Under RFS2, Obligated Parties, including petroleum refiners and fuel importers, must show compliance with these standards. Currently, biodiesel and renewable hydrocarbon diesel RINs meet three categories of an Obligated Party’s annual renewable fuel required volume obligation, or RVO—biomass-based diesel, undifferentiated advanced biofuel and undifferentiated renewable fuel. On November 30, 2015, the EPA issued the final 2014-2016 RVO targets for biomass-based diesel volumes as follows:
23
2014 | 2015 | 2016 | 2017 | |
Biomass-based diesel | 1.63 billion gallons | 1.73 billion gallons | 1.90 billion gallons | 2.00 billion gallons |
Volumes of biomass-based diesel domestically produced or imported into the United States, in general, increased each year from 2010 to 2014. Based upon the RVO targets established by the EPA, volumes for 2015 through 2017 are expected to continue to grow as illustrated by the EMTS data noted below:
2014 | 2015 | First 9 Months of 2016 | |
Biomass-based diesel produced or imported volume | 1.75 billion gallons | 1.81 billion gallons | 1.80 billion gallons |
The federal biodiesel mixture excise tax credit, or the BTC, provides a $1.00 refundable tax credit per gallon to the first blender of biomass-based diesel with petroleum-based diesel fuel. The BTC was established on January 1, 2005 and existed until it was allowed to lapse on January 1, 2010. Thereafter, the BTC was periodically reinstated by Congress both prospectively and retroactively, and then again allowed to lapse. For instance, Congress reinstated the BTC in December 2010, covering 2010 retroactively and 2011 prospectively, and allowed it to lapse at the end of 2011. On January 2, 2013, over a full year following its previous expiration, Congress again reinstated the BTC covering 2012 retroactively and 2013 prospectively. The credit lapsed a third time on January 1, 2014 and was reinstated almost one year later on December 19, 2014, covering only 2014 retroactively. Most recently, the credit was reinstated on December 18, 2015, covering 2015 retroactively and 2016 prospectively. As a result, we recognized the related BTC revenue for 2015 in the fourth quarter of that year. It is uncertain whether the BTC will be extended beyond the end of 2016. The lapsing or modification of the BTC or enactment of a different incentive program could adversely affect our future financial results.
Biomass-based diesel and feedstock price fluctuations
Our operating results generally reflect the relationship between the price of biomass-based diesel, including credits and incentives, and the price of feedstocks used to produce biomass-based diesel.
Biomass-based diesel is a low carbon intensity, renewable alternative to petroleum-based diesel fuel and is primarily sold to the end user after it has been blended with petroleum-based diesel fuel. Biomass-based diesel prices have historically been heavily influenced by petroleum-based diesel fuel prices. Accordingly, biomass-based diesel prices have generally been impacted by the same factors that affect petroleum prices, such as crude oil supply and demand balance, worldwide economic conditions, wars and other political events, OPEC production quotas, changes in refining capacity and natural disasters.
Regulatory and legislative factors also influence the price of biomass-based diesel. Biomass-based diesel RIN pricing, a value component that was introduced via RFS2 in July 2010, has had a significant impact on biomass-based diesel pricing. The following table shows the contributory value over the years of RINs, as reported by OPIS to the average B100 spot price of a gallon of biodiesel, as reported by The Jacobsen in terms of dollars per gallon and percentages.
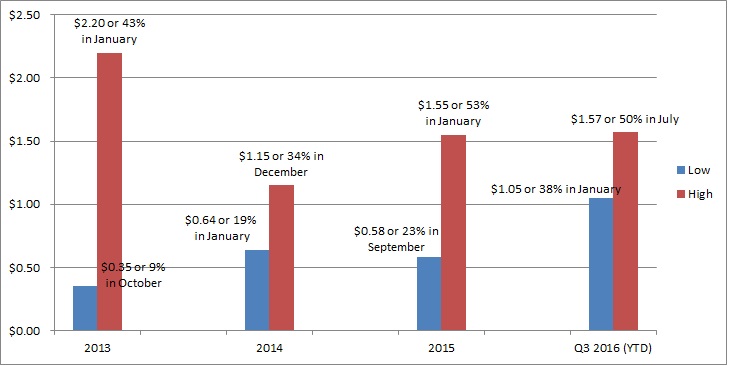
24
The changes in the value of RINs acquired from third parties and held in inventory at September 30, 2016 resulted in a $15.0 million write-down to lower of cost or net realizable value for the first nine months of 2016. See “Note 5 – Prepaid Expenses and Other Assets” to our Condensed Consolidated Financial Statements. We enter into forward contracts to sell RINs and we use risk management position limits to manage RIN exposure. Because of EPA rules limiting the amount of assigned RINs we can hold at any one time, the value of these assigned RINs held in inventory has not had a material effect on margins from period to period.
During 2015, feedstock expense accounted for 78% of our production cost, while methanol and chemical catalysts expense accounted for 5% and 4% of our costs of goods sold, respectively.
Feedstocks for biomass-based diesel production, such as inedible corn oil, used cooking oil, inedible animal fat, canola oil and soybean oil are commodities and market prices for them will be affected by a wide range of factors unrelated to the price of biomass-based diesel and petroleum-based diesel fuels. The following table outlines some of the factors influencing supply and price for each feedstock:
Feedstock | ||||||
Factors Influencing Supply and Price | Inedible Corn Oil | Used Cooking Oil | Inedible Animal Fat | Canola Oil | Soybean Oil | |
Demand for inedible corn oil from renewable fuel and other markets | þ | |||||
Ethanol production | þ | |||||
Export demand | þ | þ | þ | þ | þ | |
Extraction system yield | þ | |||||
Implementation of inedible corn oil separation systems into existing and new ethanol facilities | þ | |||||
Implementation of co-located biodiesel/renewable diesel plants with ethanol facilities | þ | |||||
Feed demand | þ | þ | þ | |||
New or expected biodiesel capacity | þ | |||||
Weather conditions | þ | þ | þ | |||
Biomass-based diesel demand | þ | þ | þ | |||
Population | þ | |||||
Number of restaurants in the vicinity of collection facilities and terminals which is dependent on population density | þ | |||||
Cooking methods and eating habits, which can be impacted by the economy | þ | |||||
Number of slaughter kills in the United States | þ | |||||
Demand for inedible animal fat from other markets | þ | |||||
Demand for canola oil for food use | þ | |||||
Canola crush margin | þ | |||||
Canola meal demand | þ | |||||
Crop disease | þ | þ | ||||
Palm oil supply | þ | |||||
Soybean meal demand | þ | |||||
South American crop production | þ | |||||
Farmer planting decisions | þ | |||||
Government policies and subsidies | þ | |||||
During 2015, 85% of our feedstocks were comprised of inedible corn oil, used cooking oil and inedible animal fats with the remainder coming from refined vegetable oil.
25
The graph below illustrates the spread between the cost of producing one gallon of biodiesel made from soybean oil to the cost of producing one gallon of biodiesel made from a lower cost feedstock from December 2011 to September 30, 2016. The results were derived using assumed conversion factors for the yield of each feedstock and subtracting the cost of producing one gallon of biodiesel made from each respective lower cost feedstock from the cost of producing one gallon of biodiesel made from soybean oil.
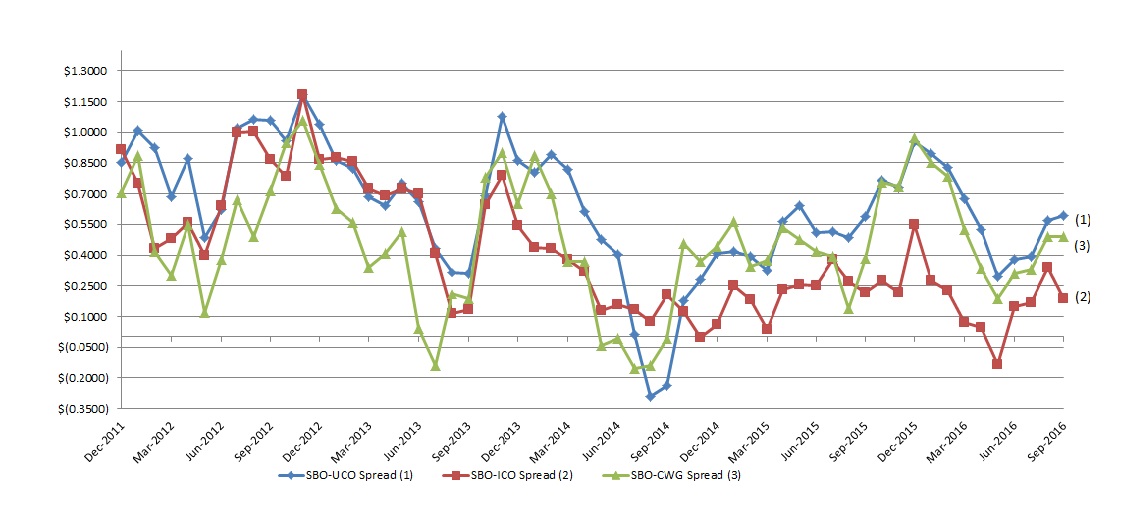
(1) | Used cooking oil prices are based on the monthly average of the daily low sales price of Missouri River yellow grease as reported by The Jacobsen (based on 8.5 pounds per gallon). |
(2) | Inedible corn oil prices are reported as the monthly average of the daily distillers’ corn oil market values delivered to Illinois as reported by The Jacobsen (based on 8.2 pounds per gallon). |
(3) | Choice white grease prices are based on the monthly average of the daily low prices of Missouri River choice white grease as reported by The Jacobsen (based on 8.0 pounds per gallon). |
(4) | Soybean oil (crude) prices are based on the monthly average of the daily closing sale price of the nearby soybean oil contract as reported by CBOT (based on 7.5 pounds per gallon). |
Historically, our results of operations generally benefit when the spread between biomass-based diesel prices and feedstock prices widens and will be harmed when this spread narrows. The following graph shows feedstock cost data for choice white grease and soybean oil on a per gallon basis compared to the per gallon sale price data for biodiesel, and the spread between biodiesel and each of soybean oil and choice white grease, from December 2011 to September 30, 2016.
26
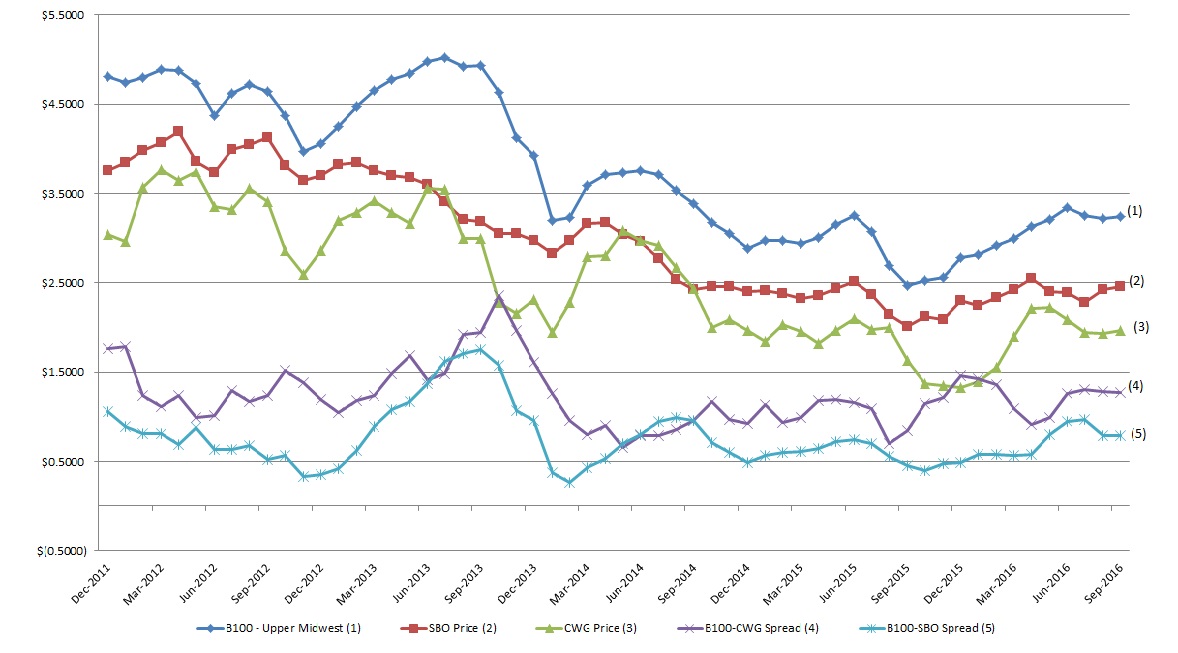
(1) | Biodiesel prices are based on the monthly average of the midpoint of the high and low prices of B100 (Upper Midwest) as reported by The Jacobsen. |
(2) | Soybean oil (crude) prices are based on the monthly average of the daily closing sale price of the nearby soybean oil contract as reported by CBOT (based on 7.5 pounds per gallon). |
(3) | Choice white grease prices are based on the monthly average of the daily low price of Missouri River choice white grease as reported by The Jacobsen (based on 8.0 pounds per gallon). |
(4) | Spread between biodiesel price and choice white grease price. |
(5) | Spread between biodiesel price and soybean oil (crude) price. |
In the first nine months of 2016, NY Harbor ULSD prices ranged from $1.13 per gallon in January to $1.58 per gallon in June with the nine-month average price of $1.30 per gallon. The US crude oil production has been increasing while crude inventories decreased due to US refineries operating at a high utilization rate during the first half of the year. During late September, OPEC made statements that the group is willing to cut production to help balance world crude supply and demand helped support energy prices in late September and into October. Feedstock prices trended higher in the first nine months of 2016, led by the tightness in the palm oil market and strong biodiesel demand for fats and inedible corn oil. The soybean crop yield is expected to be at record high in the fall of 2016. US cattle slaughter numbers in 2016 are higher than prior year numbers, as the cattle industry is in an expansion phase. Hog slaughter has remained consistent with the prior year numbers, staying at a historically high level.
Risk Management
The profitability of producing biomass-based diesel largely depends on the spread between prices for feedstocks and biomass-based diesel, including incentives, each of which is subject to fluctuations due to market factors and each of which is not significantly correlated. Adverse price movements for these commodities directly affect our operating results. We attempt to protect cash margins for our own production and our third-party trading activity by entering into risk management contracts that mitigate the impact on our margins from price volatility in feedstocks and biomass-based diesel. We create offsetting positions by using a combination of forward fixed-price physical purchases and sales contracts on feedstock and biomass-based diesel, including risk management futures contracts, swaps and options primarily on NY Harbor ULSD and CBOT Soybean Oil; however, the extent to which we engage in risk management activities varies substantially from time to time, and from feedstock to feedstock, depending on market conditions and other factors. In making risk management decisions, we utilize research conducted by outside firms to provide additional market information in addition to our internal research and reviews.
27
Inedible corn oil, used cooking oil, inedible animal fat, canola oil and soybean oil are the primary feedstocks we used to produce biomass-based diesel in 2015 and the first nine months of 2016. We utilize several varieties of inedible animal fat, such as beef tallow, choice white grease and poultry fat derived from livestock. There is no established futures market for these lower cost feedstocks. The purchase prices for lower cost feedstocks are generally set on a negotiated flat price basis or spread to a prevailing market price reported by the USDA price sheet or The Jacobsen. Our efforts to risk manage against changing prices for inedible corn oil, used cooking oil and inedible animal fat have involved entering into futures contracts, swaps or options on other commodity products, such as CBOT Soybean Oil and New York Mercantile Exchange NY Harbor ULSD. However, these products do not always experience the same price movements as lower cost feedstocks, making risk management for these feedstocks challenging. We manage feedstock supply risks related to biomass-based diesel production in a number of ways, including, where available, through long-term supply contracts. The purchase price for soybean oil under these contracts may be indexed to prevailing CBOT soybean oil market prices with a negotiated market basis. We utilize futures contracts, swaps and options to risk manage, or lock in, the cost of portions of our future feedstock requirements generally for varying periods up to one year.
Our ability to mitigate our risk of falling biomass-based diesel prices is limited. We have entered into forward contracts to supply biomass-based diesel. However, pricing under these forward sales contracts generally has been indexed to prevailing market prices, as fixed price contracts for long periods on acceptable terms have generally not been available. There is no established market for biomass-based diesel futures in the United States. Our efforts to hedge against falling biomass-based diesel prices generally involve entering into futures contracts, swaps and options on other commodity products, such as diesel fuel and New York Mercantile Exchange NY Harbor ULSD. However, price movements on these products are not highly correlated to price movements of biomass-based diesel.
We generate 1.5 to 1.7 biomass-based diesel RINs for each gallon of biomass-based diesel we produce and sell. We also obtain RINs from third party transactions which we hold for resale. There is no established futures market for RINs, which severely limits the ability to risk manage the price of RINs. We enter into forward contracts to sell RINs and we use risk management position limits to manage RIN exposure.
As a result of our strategy, we frequently have gains or losses on derivative financial instruments that are conversely offset by losses or gains on forward fixed-price physical contracts on feedstocks and biomass-based diesel or inventories. Gains and losses on derivative financial instruments are recognized each period in operating results while corresponding gains and losses on physical contracts are generally not recognized until quantities are delivered or title transfers. Our results of operations are impacted when there is a period mismatch of recognized gains or losses associated with the change in fair value of derivative instruments used for risk management purposes at the end of the reporting period but the purchase or sale of feedstocks or biomass-based diesel has not yet occurred resulting in the offsetting gain or loss that will be recognized in a later accounting period.
We recorded risk management gains of $5.9 million, but losses of $28.9 million from our derivative financial instrument activity for the three and nine months ended September 30, 2016, respectively, compared to gains of $23.3 million and $19.4 million for the three and nine months ended September 30, 2015. Changes in the value of these futures, swaps or options instruments are recognized in current income or loss.
Seasonality
Our operating results are influenced by seasonal fluctuations in the demand for biodiesel. Our biodiesel sales tend to decrease during the winter season due to blending concentrations being reduced to adjust for performance during colder weather. Colder seasonal temperatures can cause the higher cloud point biodiesel we make from inedible animal fats to become cloudy and eventually gel at a higher temperature than petroleum-based diesel or lower cloud point biodiesel made from soybean oil, canola oil or inedible corn oil. Such gelling can lead to plugged fuel filters and other fuel handling and performance problems for customers and suppliers. Reduced demand in the winter for our higher cloud point biodiesel can result in excess supply of such higher cloud point biodiesel and lower prices for such biodiesel. In addition, most of our production facilities are located in colder Midwestern states in proximity to feedstock origination and our costs of shipping increases as more biodiesel is transported to warmer climate states during winter.
RIN prices may also be subject to seasonal fluctuations. The RIN is dated for the calendar year in which it is generated, commonly referred to as the RIN vintage. Since 20% of an Obligated Party's annual RVO can be satisfied by prior year RINs, most RINs must come from biofuel produced or imported during the RVO year. As a result, RIN prices can be expected to decrease as the calendar year progresses if the RIN market is oversupplied compared to that year's RVO and increase if it is undersupplied. Similar to prior years, during 2013, biomass-based diesel RIN generation was 1.78 billion gallons when the RVO for biomass-based diesel was 1.28 billion gallons and RIN prices declined during the third and fourth quarters as production rates exceeded the RVO. For 2014, biomass-based diesel RIN generation was 1.75 billion gallons while the RVO was finalized at 1.63 billion for 2014. In 2015, biomass-based diesel RIN generation was 1.81 billion gallons versus a finalized RVO set at 1.73 billion.
28
Industry capacity, production and imports
Our operating results are influenced by our industry’s capacity and production, including in relation to RFS2 production requirements. Under RFS2, Obligated Parties are entitled to satisfy up to 20% of their annual requirement with prior year RINs. According to EMTS data, approximately 1.1 billion gallons of biomass-based diesel were produced and/or imported in the United States in 2011, primarily reflecting the recommencement of, or increase in, operations at underutilized facilities in response to RFS2 requirements. Such production was in excess of the 800 million gallon RFS2 requirement for 2011. During 2012, according to EMTS data, approximately 1.1 billion gallons of biomass-based diesel were produced and/or imported, which also was above RFS2 required volumes of 1 billion gallons of biomass-based diesel for 2012. Production and/or imports in 2011, 2012 and 2013 was in excess of continued expanding RFS2 volume requirements. As reported by EMTS, the biomass-based diesel RIN generation was 1.78 billion gallons in 2013 when the RVO for biomass-based diesel was 1.28 billion. Biomass-based diesel production and/or imports, as reported by EMTS was 1.81 billion gallons for 2015, 600 million gallons higher than 2014. In the first three quarters of 2016, according to EMTS data, 1.8 billion gallons of biomass-based diesel was produced and/or imported into the U.S., compared to the equivalent 1.34 billion gallons over the same period in 2015.
During 2014 and 2015, the amount of imported biodiesel gallons qualifying under RFS2 increased from 192.2 million gallons in 2014 to approximately 334.2 million gallons in 2015, based on the information from the EIA. Imported gallons will likely make up a growing percentage of the RVO, as the EPA has approved a plan to allow Argentinian biodiesel made from soybean oil to qualify for D4 biomass-based diesel RINs generation.
Critical Accounting Policies
Our discussion and analysis of our financial condition and results of operations is based upon our financial statements, which have been prepared in accordance with accounting principles generally accepted in the United States. The preparation of these financial statements requires us to make estimates and judgments that affect the reported amount of assets, liabilities, equities, revenues and expenses and related disclosure of contingent assets and liabilities. We evaluate our estimates on an ongoing basis. We base our estimates on historical experience and on various other assumptions that we believe to be reasonable under the circumstances, the results of which form the basis for judgments we make about the carrying values of assets and liabilities that are not readily apparent from other sources. Because these estimates can vary depending on the situation, actual results may differ from the estimates.
We have disclosed under the heading “Critical Accounting Policies” in our Annual Report on Form 10-K for the year ended December 31, 2015 the critical accounting policies which materially affect our financial statements. There have been no material changes from the critical accounting policies previously disclosed other than those noted below. You should carefully consider the critical accounting policies set forth in our Annual Report on Form 10-K along with information described below.
Valuation of certain assets and liabilities related to acquisition of the De Forest, Wisconsin facility.
The significant estimates related to our acquisition of the De Forest, Wisconsin facility from Sanimax Energy include the valuation of contingent consideration. We engaged an independent external valuation specialist to provide assistance in measuring the fair values of the liability related to the acquisition.
We may pay contingent consideration to the previous owners of our REG Madison, LLC facility over a seven year period after the acquisition if, and when, we achieve certain production volume. The fair value of the contingent consideration was estimated based on an income approach. Two production scenarios were considered in each period of the earnout period. The no-upgrade case of production was based on historical actual capacity while the base case factors in efficiency improvements following the acquisition. The base case was estimated to have a 75% probability, and the no-upgrade case was estimated to have 25% probability. The probability-weighted earnout payments were calculated based on the production levels in each period. These aggregate probability-weighted payments were then discounted to present value at the industry-adjusted cost of equity, calculated as the risk-free rate plus the equity risk premium multiplied by the selected beta. The industry-adjusted cost of equity was used as the earn-out payments were considered to be more risky than our cost of debt, but less risky than our cost of equity, given the application of probability-weighting to multiple scenarios. The fair value of the contingent consideration is estimated at the end of each reporting period with changes in fair value running through current period earnings.
Accounting for 2036 Convertible Notes
In June 2016, we issued $152.0 million aggregate principal amount of 4.00% Convertible Senior Notes due 2036 (the “2036 Convertible Notes”).
The convertible debt conversion liability is accounted for as a derivative that is adjusted for based on its fair value at reporting dates. The fair value of the convertible debt conversion liability is estimated using the Black-Scholes model incorporating the terms and conditions of the 2036 Convertible Notes and considering, for example, changes in the prices of our common stock, our stock price volatility, risk-free rates and changes in market rates.
The valuations are, among other things, subject to changes in our credit worthiness as well as changes in general market conditions. As such, the change in any given period may be material.
29
Goodwill impairment
Goodwill is tested for impairment annually on July 31 or when impairment indicators exist. Goodwill is allocated and
reviewed for impairment by reporting units. At September 30, 2016 and December 31, 2015, the Company had goodwill in the Services reporting unit. The analysis is based on a comparison of the carrying value of the reporting unit to its fair value, determined utilizing a discounted cash flow, or DCF, methodology and consideration of a market approach. Additionally, we review the carrying value of goodwill whenever events or changes in business circumstances indicate that the carrying value of the assets may not be recoverable. Changes in estimates of future cash flows caused by items such as unforeseen events or sustained unfavorable changes in market conditions could negatively affect the fair value of the reporting unit’s goodwill asset and result in an impairment charge.
We engage an independent external valuation specialist to provide assistance in measuring the fair value of our Services reporting units using an income approach. The income approach uses a discounted cash flow, or DCF, analysis based on cash flow estimates prepared by us in addition to comparing other selected public guideline company information. The selected DCF method is an invested capital method. In performing the Services reporting unit goodwill impairment analysis, cash flows generated from services provided to third parties and to the Biomass-based Diesel reporting unit were used to determine the reporting unit’s fair value.
The annual impairment test at July 31, 2016 determined that the fair value of the Services reporting unit exceeded its carrying value by approximately 16%. No impairment of goodwill was recorded for the nine months ended September 30, 2016 or during 2015 relating to the Services reporting unit.
Results of Operations
Three and nine months ended September 30, 2016 and 2015
Set forth below is a summary of certain financial information (dollars in thousands and gallons in millions except for per gallon data) for the periods indicated:
Three Months Ended September 30, | Nine Months Ended September 30, | ||||||||||||||
2016 | 2015 | 2016 | 2015 | ||||||||||||
Gallons sold | 163.1 | 120.0 | 411.2 | 275.9 | |||||||||||
Average B100 price per gallon | $ | 3.14 | $ | 2.57 | $ | 3.22 | $ | 2.88 | |||||||
Revenues | $ | 624,640 | $ | 394,856 | $ | 1,480,811 | $ | 999,536 | |||||||
Cost of goods sold | 577,292 | 390,451 | 1,391,215 | 994,652 | |||||||||||
Gross profit (loss) | 47,348 | 4,405 | 89,596 | 4,884 | |||||||||||
Selling, general and administrative expenses | 20,799 | 18,468 | 61,426 | 51,268 | |||||||||||
Research and development expense | 4,805 | 3,527 | 13,158 | 11,778 | |||||||||||
Gain on involuntary conversion | (3,470 | ) | — | (8,010 | ) | — | |||||||||
Income (loss) from operations | 25,214 | (17,590 | ) | 23,022 | (58,162 | ) | |||||||||
Other income (expenses), net | (2,912 | ) | 869 | 2,130 | (630 | ) | |||||||||
Income tax (expense) benefit | 1,203 | 1,050 | (821 | ) | 2,654 | ||||||||||
Net income (loss) | 23,505 | (15,671 | ) | 24,331 | (56,138 | ) | |||||||||
Less: Net income (loss) attributable to noncontrolling interest | 63 | 4 | 201 | (355 | ) | ||||||||||
Net income (loss) attributable to the Company | 23,442 | (15,675 | ) | 24,130 | (55,783 | ) | |||||||||
Effect of participating share-based awards | (513 | ) | — | (462 | ) | — | |||||||||
Net income (loss) attributable to the Company's common stockholders | $ | 22,929 | $ | (15,675 | ) | $ | 23,668 | $ | (55,783 | ) | |||||
Revenues. Our revenues increased $229.8 million and $481.3 million, or 58% and 48%, to $624.6 million and $1,480.8 million, respectively, for the three and nine months ended September 30, 2016 from $394.9 million and $999.5 million for the three and
30
nine months ended September 30, 2015, respectively. This increase was primarily due to the increase in government incentives revenue as the 2016 BTC was in effect since the beginning of 2016 while the 2015 BTC was not reinstated until December 2015. In addition, the increase in the gallons sold and improving average selling price during the third quarter also contributed to the growth in total revenues.
Biomass-based diesel revenues including government incentives increased $229.3 million and $479.8 million, or 58% and 48% to $624.1 million and $1,479.2 million for the three and nine months ended September 30, 2016, respectively, from $394.8 million and $999.4 million for the three and nine months ended September 30, 2015, respectively. The BTC was in effect since the beginning of 2016 and contributed $99.3 million and $237.8 million to the increase in biomass-based diesel revenue for the three and nine months ended September 30, 2016, respectively. Gallons sold increased by 43.1 million and 135.3 million, or 36% and 49%, to 163.1 million and 411.2 million gallons for the three and nine months ended September 30, 2016, respectively, compared to 120.0 million and 275.9 million gallons for the three and nine months ended September 30, 2015, respectively. Our average B100 sales price per gallon increased $0.57, or 22%, to $3.14 and $0.34, or 12%, to $3.22 for the three and nine months ended September 30, 2016, respectively, compared to $2.57 and $2.88 for the three and nine months ended September 30, 2015, respectively. The fluctuations in average sales price contributed to a $68.4 million increase in revenues for the three months ended September 30, 2016 and a $93.8 million decrease in revenues for the nine months ended September 30, 2016, respectively, when applied to the number of gallons sold during the same periods of 2015. The increase in gallons sold for the three and nine months ended September 30, 2016 accounted for a revenue increase of $135.3 million and $435.7 million for the three and nine months ended September 30, 2016, respectively, using pricing for the same periods of 2016. Sales of separated RIN inventory were $104.6 million and $191.2 million for the three and nine months ended September 30, 2016, respectively, as compared to $61.9 million and $142.5 million for the three and nine months ended September 30, 2015, respectively.
Costs of goods sold. Our costs of goods sold increased $186.8 million and $396.6 million, or 48% and 40%, to $577.3 million and $1,391.2 million for the three and nine months ended September 30, 2016, respectively, from $390.5 million and $994.7 million for the three and nine months ended September 30, 2015, respectively. Costs of goods sold as a percentage of revenues were 92% and 94% for the three and nine months ended September 30, 2016, respectively, and 99% and 100% for the three and nine months ended September 30, 2015, respectively. The decrease in cost of goods sold as a percentage of revenues during the three and nine months ended September 30, 2016 was primarily due to the increase in the revenues from having the BTC in place to start 2016, mitigated slightly from an increase in feedstock prices, which were influenced by an increase in palm oil prices and strong biodiesel demand.
Biomass-based diesel costs of goods sold increased in the three and nine months ended September 30, 2016 due to a 36% and 49% increase, respectively, in gallons sold. Average lower cost feedstocks prices were $0.29 and $0.28 per pound for the three and nine months ended September 30, 2016, respectively, as compared to $0.28 per pound for both three and nine months ended September 30, 2015. Soybean oil costs were $0.33 per pound for both three and nine months ended September 30, 2016, and $0.32 per pound for both three and nine months ended September 30, 2015. Results for the quarter were also affected by reduced operating days at the Company’s Geismar facility, related to local area flooding in August and pulled forward scheduled maintenance from October to September. We recorded risk management gains of $5.9 million, but losses of $28.9 million from our derivative financial instrument activity for the three and nine months ended September 30, 2016, respectively, compared to risk management gains of $23.3 million and $19.4 million for the three and nine months ended September 30, 2015, respectively. This fluctuation in risk management gains and losses for the three months ended September 30, 2016 is mainly attributable to the increase in energy prices in the last week of September resulting from an announcement by OPEC of a purported reduction in output. The losses in risk management year to date was mainly due to the changes in New York Mercantile Exchange NY Harbor ULSD index during the three months ended June 30, 2016 resulting from changes in market value of various hedging instruments used to protect cash margins in the current and future periods. Costs of goods sold for separated RIN inventory sales were $108.9 million and $196.6 million for the three and nine months ended September 30, 2016, respectively and $50.3 million and $137.3 million for the three and nine months ended September 30, 2015, respectively. Lower of cost or net realizable value writedown on RINs were $10.6 million and $15.0 million for the three and nine months ended September 30, 2016, respectively and $3.6 million and $7.1 million for the three and nine months ended September 30, 2015, respectively.
Selling, general and administrative expenses. Our selling, general and administrative, or SG&A, expenses were $20.8 million and $61.4 million, or 3% and 4% of total revenue, for the three and nine months ended September 30, 2016, respectively and $18.5 million and $51.3 million, or 5% and 5% of total revenue, for the three and nine months ended September 30, 2015, respectively. This represents an increase of $2.3 million and $10.2 million, or 13% and 20%, over the same respective periods of last year. The increase year over year was primarily due to $3.3 million increases in employee related expenses as headcount increased from prior year acquisitions supporting growth and $2.3 million increases in legal and professional expenses, largely associated with international expansion and to support our growth.
31
Research and development expense. Our research and development expenses were $4.8 million and $13.2 million for the three and nine months ended September 30, 2016, respectively, compared to $3.5 million and $11.8 million for the three and nine months ended September 30, 2015, respectively. The majority of the research and development expenses were related to activities of the Renewable Chemicals segment, which is seeking to bring industrial biotechnology products to market and drive growth.
Gain on involuntary conversion. This represented the amount of insurance proceeds in excess of the net book value of the property damage recorded by us related to the April 2015 fire at our Geismar facility. Our insurance policies cover replacement costs incurred to replace the property damaged by the fire. The proceeds received for property damage during the third quarter of 2016 were final and have been approved and paid by the insurance carriers.
Other income (expense), net. Other expense was $2.9 million and other income $2.1 million for the three and nine months ended September 30, 2016, respectively, compared to other income of $0.9 million and other expense of $0.6 million for the same periods in 2015, respectively. Other income (expense) is primarily comprised of change in value of contingent consideration, interest expense, interest income and the other non-operating items. Other income (expense), net for the three and nine months ended September 30, 2016 also included a gain on debt extinguishment of $0.2 million and $2.3 million related to the repurchase of $6.0 million and $69.9 million principal amount of the 2019 Convertible Notes for the three and nine months ended September 30, 2016, respectively and changes in fair value of convertible debt conversion liability of $3.0 million and $16.4 million for the three and nine months ended September 30, 2016, respectively, related to the newly issued 2036 Convertible Notes.
Income tax benefit (expense). We recognized an income tax benefit of $1.2 million and tax expense of $0.8 million for the three and nine months ended September 30, 2016, respectively, as compared to tax benefit of $1.1 million and $2.7 million for the same periods in 2015, respectively. Our tax provision for interim periods is determined using an estimate of our annual effective tax rate, adjusted for discrete items arising in that quarter. Our effective tax rate differs from the statutory tax rate primarily due to the fact that we have a valuation allowance on our domestic deferred tax assets and most of our foreign deferred tax assets.
Adjusted EBITDA
We use earnings before interest, taxes, depreciation and amortization, adjusted for certain additional items, identified in the table below, or Adjusted EBITDA, as a supplemental performance measure. We present Adjusted EBITDA because we believe it assists investors in analyzing our performance across reporting periods on a consistent basis by excluding items that we do not believe are indicative of our core operating performance. In addition, we use Adjusted EBITDA to evaluate, assess and benchmark our financial performance on a consistent and a comparable basis and as a factor in determining incentive compensation for our executives.
The following table provides our Adjusted EBITDA for the periods presented, as well as a reconciliation to net income:
(In thousands) | Three Months Ended September 30, 2016 | Three Months Ended September 30, 2015 | Nine Months Ended September 30, 2016 | Nine Months Ended September 30, 2015 | |||||||||||
Net income (loss) | $ | 23,505 | $ | (15,671 | ) | $ | 24,331 | $ | (56,138 | ) | |||||
Adjustments: | |||||||||||||||
Income tax expense (benefit) | (1,203 | ) | (1,050 | ) | 821 | (2,654 | ) | ||||||||
Interest expense | 4,487 | 2,921 | 11,536 | 8,592 | |||||||||||
Gain on involuntary conversion | (3,470 | ) | — | (8,010 | ) | — | |||||||||
Gain on bargain purchase | — | (5,358 | ) | — | (5,358 | ) | |||||||||
Other (income) expense, net | (2,699 | ) | 462 | (18,349 | ) | (1,882 | ) | ||||||||
Change in fair value of contingent liability | 1,124 | 1,106 | 4,680 | (722 | ) | ||||||||||
Straight-line lease expense | (73 | ) | (19 | ) | (247 | ) | (322 | ) | |||||||
Depreciation | 7,949 | 6,261 | 23,447 | 18,008 | |||||||||||
Amortization | (129 | ) | (199 | ) | (403 | ) | (624 | ) | |||||||
Other | — | (4 | ) | — | 355 | ||||||||||
Biodiesel tax credit (1) | — | 27,264 | — | 65,892 | |||||||||||
Non-cash stock compensation | 2,133 | 1,191 | 4,067 | 3,427 | |||||||||||
Adjusted EBITDA | $ | 31,624 | $ | 16,904 | $ | 41,873 | $ | 28,574 | |||||||
32
(1) | On December 18, 2015, the Protecting Americans from Tax Hikes Act of 2015 was signed into law, which reinstated and extended a set of tax provisions, including the retroactive reinstatement for 2015 and extension for 2016 of the federal biodiesel mixture excise tax credit. The retroactive credit for 2015 resulted in a net benefit to us that was recognized in the fourth quarter of 2015, however because this credit relates to the full year operating performance and results, we allocated a portion of the tax credit to the first three quarters of 2015 based upon gallons sold. |
Adjusted EBITDA is a supplemental performance measure that is not required by, or presented in accordance with, generally accepted accounting principles, or GAAP. Adjusted EBITDA should not be considered as an alternative to net income or any other performance measure derived in accordance with GAAP, or as alternatives to cash flows from operating activities or a measure of our liquidity or profitability. Adjusted EBITDA has limitations as an analytical tool, and should not be considered in isolation, or as a substitute for any of our results as reported under GAAP. Some of these limitations are:
• | Adjusted EBITDA does not reflect our cash expenditures for capital assets or the impact of certain cash clauses that we consider not to be an indication of our ongoing operations; |
• | Adjusted EBITDA does not reflect changes in, or cash requirements for, our working capital requirements; |
• | Adjusted EBITDA does not reflect the interest expense, or the cash requirements necessary to service interest or principal payments, on our indebtedness; |
• | although depreciation and amortization are non-cash charges, the assets being depreciated and amortized will often have to be replaced in the future, and Adjusted EBITDA does not reflect cash requirements for such replacements; |
• | stock-based compensation expense is an important element of our long term incentive compensation program, although we have excluded it as an expense when evaluating our operating performance; and |
• | other companies, including other companies in the industry, may calculate these measures differently than we do, limiting their usefulness as a comparative measure. |
Liquidity and Capital Resources
Sources of liquidity. At September 30, 2016, the total of our cash and cash equivalents was $86.5 million compared to $47.1 million at December 31, 2015. At September 30, 2016, we had total assets of $1,020.1 million compared to $1,223.6 million at December 31, 2015. At September 30, 2016, we had term debt before debt issuance costs of $218.7 million, compared to term debt of $256.6 million at December 31, 2015. There were $6.4 million in outstanding borrowings on our revolving lines of credit at September 30, 2016, compared to $23.1 million at December 31, 2015. Availability under the Wells Fargo / Fifth Third and Bankers Trust revolvers was $68.0 million as of September 30, 2016. We were in compliance with all restrictive financial covenants associated with the borrowings as of September 30, 2016.
Our term debt (in thousands) is as follows:
September 30, 2016 | December 31, 2015 | ||||||
4.00% Convertible Senior Notes, $152,000 face amount, due in June 2036 | $ | 112,755 | $ | — | |||
2.75% Convertible Senior Notes, $73,838 face amount, due in June 2019 | 66,619 | 126,053 | |||||
REG Geismar GOZone bonds, secured, variable interest rate of daily LIBOR, due in October 2033 | — | 100,000 | |||||
REG Danville term loan, secured, variable interest rate of LIBOR plus 4%, due in December 2017 | 8,800 | — | |||||
REG Newton term loan, secured, variable interest rate of LIBOR plus 4%, due in December 2018 | 13,789 | 16,800 | |||||
REG Mason City term loan, fixed interest rate of 5%, due in July 2019 | 2,898 | 3,675 | |||||
REG Ames term loans, secured, fixed interest rates of 3.5% and 4.25%, due in January 2018 and December 2019, respectively | 3,651 | 3,901 | |||||
REG Grays Harbor term loan, variable interest of minimum of 3.5% or Prime Rate plus 0.25%, due in May 2022 | 9,500 | 5,225 | |||||
Other | 709 | 908 | |||||
Total term debt before debt issuance costs | $ | 218,721 | $ | 256,562 | |||
A full description of our credit facilities and other agreements related to our outstanding indebtedness is included under the heading “Liquidity and Capital Resources” in our Annual Report on Form 10-K for the year ended December 31, 2015.
33
REG Danville, LLC
On October 31, 2015, REG Danville, LLC entered into an Second Amended and Restated Loan Agreement with Fifth Third Bank regarding the construction/term loan (the "Fifth Third Construction/Term Loan"). The renewed Fifth Third Construction/Term Loan increased the principal amount of the Construction/Term Loan to $12.0 million and had a three year term with the maturity of the loan being extended to December 19, 2017. The loan requires monthly principal payments of $0.2 million and interest to be charged using LIBOR plus 4% per annum. The loan agreement contains various loan covenants.
Bankers Trust Line of Credit
On March 16, 2016, REG Energy Services, LLC ("REG Energy Services") entered into an operating and revolving line of credit agreement (the "Agreement") with Bankers Trust Company (“Bankers Trust”). Pursuant to the Agreement, Bankers Trust agreed to provide an operating and revolving line of credit (the "Line of Credit") to REG Energy Services in the amount of $30.0 million. Amounts outstanding under the Agreement bear variable interest as stipulated in the Agreement. As of September 30, 2016, there was $1.9 million outstanding under the Line of Credit with Bankers Trust.
2036 Convertible Notes
In June 2016, we issued $152.0 million aggregate principal amount of 4.00% Convertible Senior Notes due 2036 (the “2036 Convertible Notes”) in a private offering to qualified institutional buyers. The 2036 Convertible Notes bear interest at a rate of 4.00% per year payable semi-annually in arrears on June 15 and December 15 of each year, beginning December 15, 2016. The notes will mature on June 15, 2036, unless repurchased, redeemed or converted in accordance with their terms prior to such date.
Prior to December 15, 2035, the 2036 Convertible Notes will be convertible only upon satisfaction of certain conditions and during certain periods as stipulated in the indenture. On or after December 15, 2035 until the close of business on the second scheduled trading day immediately preceding the maturity date, holders of the 2036 Convertible Notes may convert their notes at any time. Unless and until we obtain stockholder approval under applicable NASDAQ Stock Market rules, the 2036 Convertible Notes will be convertible, subject to certain conditions, into cash. If we obtain such stockholder approval, the 2036 Convertible Notes may be settled in cash, our common shares or a combination of cash and our common shares, at our election. We may not redeem the 2036 Convertible Notes prior to June 15, 2021. Holders of the 2036 Convertible Notes will have the right to require us to repurchase for cash all or some of their notes at 100% of their principal, plus any accrued and unpaid interest on each of June 15, 2021, June 15, 2026 and June 15, 2031. Holders of the 2036 Convertible Notes will have the right to require the Company to repurchase for cash all or some of their notes at 100% of their principal, plus any accrued and unpaid interest upon the occurrence of certain fundamental changes. The initial conversion rate is 92.8074 common shares per $1,000 principal amount of 2036 Convertible Notes (equivalent to an initial conversion price of approximately $10.78 per common share).
The net proceeds from the offering of the 2036 Convertible Notes were approximately $147.1 million, after deducting fees and offering expenses of $4.9 million, which was capitalized as debt issuance costs and is being amortized through June 2036. We evaluated the terms of the conversion features under the applicable accounting literature, including Derivatives and Hedging, ASC 815, and determined that the features required separate accounting as a derivative. This derivative was capitalized as a long-term liability, "Convertible Debt Conversion Liability" on the Condensed Consolidated Balance Sheets and will be adjusted to reflect fair value each reporting date. The fair value of the convertible debt conversion liability at issuance was $40.1 million.
REG Geismar
Our subsidiary, REG Geismar, LLC, or REG Geismar, was the obligor with respect to $100.0 million aggregate principal amount of Gulf Opportunity Zone tax-exempt bonds, or GOZone Bonds, originally due in October 2033, through a loan agreement with the Louisiana Public Facilities Authority. REG Geismar’s payment obligations on the GOZone Bonds were supported by a letter of credit issued by a financial institution. REG Geismar was party to an agreement to reimburse the financial institution for any draws on the letter of credit and that obligation was secured by a $101.3 million certificate of deposit by us and pledged in favor of the financial institution. On September 6, 2016, REG Geismar caused the Louisiana Public Facilities Authority to call for redemption all of the outstanding GOZone Bonds as of September 6, 2016. The redemption was funded by application of the funds generated by release of the certificate of deposit.
Wells Fargo and Fifth Third Revolver
On September 30, 2016, REG Services Group, LLC and REG Marketing & Logistics, LLC, our wholly-owned subsidiaries entered into a Joinder and Amendment No. 11 to Credit Agreement (the “Amendment”) to that certain Credit Agreement
34
originally dated as of December 23, 2011, by and among Borrowers, the lenders party thereto (“Lenders”) and Wells Fargo Capital Finance, LLC, as the agent, and Fifth Third Bank, as a new lender (as amended, the “Revolving Credit Agreement”). Pursuant to the Amendment, the maximum commitment of the Lenders under the Revolving Credit Agreement to make revolving loans was increased from $60.0 million to $150.0 million and an accordion feature was added to the Revolving Credit Agreement, which allows us to request commitments for additional revolving loans in aggregate amount not to exceed to $50.0 million subject to customary conditions, including the consent of Lenders providing such additional commitments. The Amendment extends the maturity date of the Revolving Credit Agreement to September 30, 2021.
Cash flows. The following table presents information regarding our cash flows and cash and cash equivalents for the nine months ended September 30, 2016 and 2015 (in thousands):
Nine Months Ended September 30, | |||||||
2016 | 2015 | ||||||
Net cash flows provided by operating activities | $ | 71,138 | $ | 99,057 | |||
Net cash flows used in investing activities | (48,783 | ) | (73,315 | ) | |||
Net cash flows provided by (used in) financing activities | 16,725 | (21,348 | ) | ||||
Net change in cash and cash equivalents | 39,080 | 4,394 | |||||
Cash and cash equivalents, end of period | $ | 86,531 | $ | 66,817 | |||
In the first nine months of 2016, we generated $71.1 million of cash in operations. We received approximately $243.7 million related to the 2015 reinstatement of the BTC, of which $148.7 million was paid to our vendors and customers. In addition, approximately $10.5 million and $13.7 million of operating cash was used to build up our raw materials, finished goods and RINs inventory. Our net cash flows provided by investing activity was impacted by the release of our restricted cash related to the early redemption of the GOZone Bonds, which was offset by the use of cash to acquire certain assets of Sanimax Energy, along with expenditures made for continued biorefinery capital improvements. Financing activities were impacted by the issuance of the 2036 Convertible Notes and the early redemption of the GOZone Bonds. Total proceeds from the issuance of the 2036 Convertible Notes after issuance costs were approximately $147.4 million, $60.9 million of which was used to extinguish a portion of the convertible notes issued in 2014 and $35.1 million of which was used to fund additional share repurchases, in addition to payments made under our share repurchase programs and the additional $6 million repurchase of the 2019 convertible notes in September 2016.
Capital expenditures. We have three partially constructed plants, one near New Orleans, Louisiana, one in Emporia, Kansas, one in Clovis, New Mexico and a non-operational plant near Atlanta, Georgia. We expect additional investments of approximately $165 million to $270 million in the aggregate based upon the capabilities we could choose to implement at each facility, excluding working capital requirements, would be required before these plants would be able to commence production. These facilities would add an expected 150 mmgy to our nameplate production capacity. Our Clovis plant is currently being operated as a terminal facility. We plan to make significant capital expenditures when debt or equity financing becomes available to complete construction of these four facilities.
During the nine month ended September 30, 2016, our capital expenditures were $42.8 million, including $13.9 million towards the $34.5 million upgrade to our Danville facility and $9.1 million in repairs and upgrades to bring our Geismar facility back on-line in March 2016. We began a $7.0 million upgrade project at our newly acquired Madison facility in the second quarter of 2016. Our budgeted capital expenditures for the remainder of 2016 are approximately $10 million to $20 million, including upgrades to Madison, Geismar and Grays Harbor facilities, amongst others. We may enter into additional tolling arrangements with third parties from time to time where third parties will produce biomass-based diesel on our behalf using our feedstocks. Such arrangements may require investments of additional working capital during the tolling periods.
We continue to be in discussions with lenders in an effort to enter into equity and debt financing arrangements to meet our projected financial needs for facilities under construction and capital improvement projects for our operating facilities. Since these discussions are ongoing, we are uncertain when or if financing will be available. The financing may consist of common or preferred stock, debt, project financing or a combination of these financing techniques. Additional debt would increase our leverage and interest costs and would likely be secured by certain of our assets. Additional equity or equity-linked financings would likely have a dilutive effect on our existing and future stockholders. It is likely that the terms of any project financing would include customary financial and other covenants on our project subsidiaries, including restrictions on the ability to make distributions, to guarantee indebtedness and to incur liens on the plants of such subsidiaries.
35
Off-Balance Sheet Arrangements
We have no off-balance sheet arrangements that have or are reasonably likely to have a current or future effect on our financial condition, changes in financial condition, revenues or expenses, results of operations, liquidity, capital expenditures or capital resources that is material to investors.
Recent Accounting Pronouncements
For a discussion of new accounting pronouncements affecting the Company, refer to “Note 2 – Summary of Significant Accounting Policies” to our condensed consolidated financial statements.
ITEM 3. QUANTITATIVE AND QUALITATIVE DISCLOSURES ABOUT MARKET RISK
The primary objectives of our investment activity are to preserve principal, provide liquidity and maximize income without significantly increasing risk. Some of the securities we invest in are subject to market risk. This means that a change in prevailing interest rates may cause the principal amount of the investment to fluctuate. To minimize this risk, we maintain a portfolio of cash equivalents in short-term investments in money market funds.
Commodity Price Risk
Over the period from January 2010 through September 30, 2016, average diesel prices based on Platts reported pricing for Group 3 (Midwest) have ranged from a high of approximately $3.64 per gallon reported in October 2012 to a low of approximately $0.85 per gallon in January 2016, with prices averaging $2.47 per gallon during this period. Over the period January 2010 to September 30, 2016, soybean oil prices (based on daily closing nearby futures prices on the Chicago Board of Trade for crude soybean oil) have ranged from a high of $0.5977 per pound, or $4.48 per gallon of biodiesel, in April 2011 to a low of $0.2605 per pound, or $1.95 per gallon, in September 2015 assuming 7.5 pounds of soybean oil yields one gallon of biodiesel with closing sales prices averaging $0.4249 per pound, or $3.19 per gallon. Over the period from January 2010 through September 30, 2016, animal fat prices (based on prices from The Jacobsen Missouri River, for choice white grease) have ranged from a high of $0.5450 per pound in June 2011 to a low of $0.1600 per pound in December 2015, with sales prices averaging $0.3475 per pound during this period. Over the period from July 2010 through September 30, 2016, RIN prices (based on prices from OPIS) have ranged from a high of $1.99 in September 2011 to a low of $0.24 in November 2013, with sales prices averaging $0.86 during this period.
Adverse fluctuations in feedstock prices as compared to biomass-based diesel prices result in lower profit margins and, therefore, represent unfavorable market conditions. The availability and price of feedstocks are subject to wide fluctuations due to unpredictable factors such as weather conditions during the growing season, rendering volumes, carry-over from the previous crop year and current crop year yield, governmental policies with respect to agriculture and supply and demand.
We have prepared a sensitivity analysis to estimate our exposure to market risk with respect to our sales contracts, lower cost feedstock requirements, soybean oil requirements and the related exchange-traded contracts for the first three quarters of 2016. Market risk is estimated as the potential loss in fair value, resulting from a hypothetical 10% adverse change in the fair value of our lower cost feedstock and soybean oil requirements and biomass-based diesel sales. The results of this analysis, which may differ from actual results, are as follows:
First nine months of 2016 Volume (in millions) | Units | Hypothetical Adverse Change in Price | Impact on Annual Gross Profit (in millions) | Percentage Change in Gross Profit | ||||||||||
Total Biodiesel | 413.4 | gallons | 10 | % | $ | (259.6 | ) | (277.34 | )% | |||||
Total Lower Cost Feedstocks | 1,591.4 | pounds | 10 | % | $ | (86.8 | ) | (92.77 | )% | |||||
Total Canola Oil | 404.6 | pounds | 10 | % | $ | (26.6 | ) | (28.4 | )% | |||||
Total Soy Oil | 221.9 | pounds | 10 | % | $ | (14.5 | ) | (15.5 | )% | |||||
We attempt to protect operating margins by entering into risk management contracts that reduce the risk of price volatility related to anticipated purchases of feedstocks, such as inedible animal fat and inedible corn oil and energy prices. We create offsetting positions by using a combination of forward physical purchases and sales contracts on feedstock and biomass-based diesel, including risk management futures contracts, swaps and options primarily on NYMEX NY Harbor ULSD and CBOT Soybean Oil; however, the extent to which we engage in risk management activities varies substantially from time to time, and from feedstock to feedstock, depending on market conditions and other factors. A 10% adverse change in the prices of NYMEX NY Harbor ULSD would have had a negative effect on the fair value of these instruments of $13.1 million. A 10% adverse
36
change in the price of CBOT Soybean Oil would have had a negative effect on the fair value of these instruments of $1.7 million.
Interest Rate Risk
Our weighted average interest rate on variable rate debt balances for the three months ended September 30, 2016 was 4.01% and a hypothetical increase in interest rate of 10% would not have a material effect on our annual interest expenses and consolidated financial statements.
Inflation
To date, inflation has not significantly affected our operating results, though costs for petroleum-based diesel fuel, feedstocks, construction, labor, taxes, repairs, maintenance and insurance are all subject to inflationary pressures. Inflationary pressure in the future could affect our ability to sell the biomass-based diesel we produce, maintain our production facilities adequately, build new biomass-based diesel production facilities and expand our existing facilities as well as the demand for our facility construction management and operations management services.
ITEM 4. CONTROLS AND PROCEDURES
Evaluation of Disclosure Controls and Procedures
Disclosure controls and procedures are designed to ensure that information required to be disclosed in the Company’s reports we file or submit under the Securities Exchange Act is recorded, processed, summarized and reported within the time periods specified in the Securities Exchange Commission’s rules and forms, and that such information is accumulated and communicated to management, including our Chief Executive Officer ("CEO") and the Chief Financial Officer ("CFO"), as appropriate, to allow timely decisions regarding required disclosure. In designing and evaluating the disclosure controls and procedures, management recognized that any controls and procedures, no matter how well designed and operated, can provide only reasonable assurance of achieving the desired control objectives.
In connection with the preparation of this Quarterly report, the Company, under the direction of our CEO and CFO, concluded that our disclosure controls and procedures were not effective as of March 31, 2016 due to the material weakness in internal control over financial reporting described below.
Material Weakness in Internal Control Over Financial Reporting
A material weakness is a deficiency, or combination of deficiencies, in internal control over financial reporting such that there is reasonable possibility that a material misstatement of the Company’s annual or interim financial statements will not be prevented or detected on a timely basis.
During the third quarter 2016 close process, the Company identified certain errors in its previously reported interim financial statements for the quarter ended March 31, 2016. The errors resulted from the Company’s sales contract review control related to recognition of biomass-based diesel sales not operating effectively - resulting in an overstatement of biomass-based diesel sales and a corresponding understatement of accounts payable, deferred income taxes and tax expense for the quarters ended March 31, 2016 and June 30, 2016. This material weakness has not been remediated as of September 30, 2016, and due to this, the Company concluded that its internal control over financial reporting was not effective as of June 30, 2016 and September 30, 2016.
The deficiencies noted above could result in a misstatement of revenue and related accounts and disclosures that could be material to our financial statements; therefore, they represent a material weakness in our internal control over financial reporting.
Remediation Plan for Material Weakness in Internal Control over Financial Reporting
We have made and will continue to make improvements to our internal control over financial reporting. Management, with oversight from our Audit Committee, has identified and has begun executing actions that we believe will remediate the material weakness described above once fully implemented and operating for a sufficient period of time and have begun to take the following actions:
• | The sales contract review control was further enhanced from a quarterly meeting to a periodic meeting noting, among other data, any sharing agreements regardless of having the biodiesel mixture excise tax credit in place or not, as well as expanding meeting members to include treasury and tax personnel as well as sales and accounting personnel; and |
37
• | Increase education, training, support and oversight of our employees tasked with the identification and evaluation of sales contract with nonstandard terms. |
Until the remediation steps set forth above are fully implemented and operating for a sufficient period of time, the material weakness will continue to exist. Notwithstanding the identified material weakness and the conclusion above that our disclosure controls and procedures were not effective as of March 31, 2016, June 30, 2016 and September 30, 2016, we have concluded that the interim condensed consolidated financial statements in this Form 10-Q for the quarter ended September 30, 2016 fairly present, in all material respects, our financial condition, results of operations and cash flows in accordance with US GAAP.
Changes in Internal Control over Financial Reporting
Except for the remediation measures described above, there have not been any changes in our internal control over financial reporting (as defined in Rules 13a-15(f) and 15d-15(f) under the Exchange Act) that occurred during the quarter ended September 30, 2016 that have materially affected, or are reasonably likely to materially affect, our internal control over financial reporting.
PART II. OTHER INFORMATION
ITEM 1. LEGAL PROCEEDINGS
We are not a party to any material pending legal proceeding, nor is any of our property the subject of any material pending legal proceeding, except ordinary routine litigation arising in the ordinary course of our business and incidental to our business, none of which is expected to have a material adverse impact upon our business, financial position or results of operations.
ITEM 1A. RISK FACTORS
Our business, financial condition, results of operations and liquidity are subject to various risks and uncertainties, including those described below, and as a result, the trading price of our common stock could decline.
RISKS RELATED TO FEDERAL AND STATE INCENTIVES
RFS2: Loss or reductions of federal governmental requirements for the use of biofuels could have a material adverse effect on our revenues and operating margins.
The biomass-based diesel industry relies substantially on federal requirements for use of biofuels. Since biomass-based diesel has been more expensive to produce than petroleum-based diesel fuel, the biomass-based diesel industry depends on governmental programs that support a market for biomass-based diesel that might not otherwise exist.
The most important of these government programs in the United States is RFS2, which requires annual consumption of specified volumes of biomass-based diesel fuel, including biodiesel and renewable hydrocarbon diesel. RFS2 became effective on July 1, 2010 and applies through 2022. Under RFS2, the EPA is required to determine the annual consumption volumes based on the EPA’s consideration of a variety of factors. The annual consumption volume requirements must be at least one billion gallons. The minimum volume requirement for 2013 was 1.28 billion gallons. On November 30, 2015, the EPA released final RFS targets for biomass based diesel of 1.63 billion gallons for 2014, 1.73 billion gallons for 2015, 1.90 billion gallons for 2016 and 2.00 billion gallons for 2017. We believe that much of the increase in demand for our biomass-based diesel since July 2010 is attributable to, and accelerated by, the existence and implementation of RFS2. In addition, we believe that biomass-based diesel prices since July 2010 have received significant support from RFS2. The United States Congress could repeal, curtail or otherwise change, and the EPA could curtail or otherwise change, the RFS2 program in a manner adverse to us. The petroleum industry is generally opposed to RFS2 and is expected to continue to press for changes that eliminate or reduce its impact. We believe that state requirements and incentives for the use of biofuels increase demand for our biomass-based diesel within such states, but do not increase overall demand for biofuels in excess of RFS2 requirements. Rather, state requirements and tax incentives influence where petroleum refiners and petroleum fuel importers choose to consume the volume requirements established by the EPA under RFS2. Any repeal or reduction in the RFS2 requirements or reinterpretation of RFS2 resulting in our biomass-based diesel failing to qualify as a required fuel would materially decrease the demand for and price of our biomass-based diesel, which would materially and adversely harm our revenues and cash flows.
Loss of or reductions in tax incentives for biomass-based diesel production or consumption may have a material adverse effect on industry revenues and operating margins.
Federal
The biomass-based diesel industry has historically been substantially aided by federal and state tax incentives. Prior to RFS2, the biomass-based diesel industry relied principally on tax incentives to make the price of biomass-based diesel more cost competitive with the price of petroleum-based diesel fuel to the end user. The most significant tax incentive program has been the federal biodiesel mixture excise tax credit, referred to as the Biodiesel Tax Credit or BTC. The BTC provides a $1.00 refundable tax credit for each gallon of pure biomass-based fuel, or B100, blended with petroleum-based diesel fuel. The entity to first blend the fuels receives the credit. The BTC was established on January 1, 2005 and existed until it was allowed to lapse on January 1, 2010. Thereafter, the BTC was periodically reinstated by Congress both prospectively and retroactively, and then again allowed to lapse. For instance, Congress reinstated the BTC in December 2010, covering 2010 retroactively and 2011 prospectively, and allowed it to lapse at the end of 2011. On January 2, 2013, over a full year following its previous expiration, Congress again reinstated the BTC covering 2012 retroactively and 2013 prospectively. The credit lapsed a third time on January 1, 2014 and was reinstated almost one year later on December 19, 2014, covering only 2014 retroactively. Most recently, the credit was reinstated on December 18, 2015, covering 2015 retroactively and 2016 prospectively. There is no assurance that the BTC will be extended or, if it is allowed to lapse, be reinstated. In response to the regular lapsing and reinstatement of the BTC, the biomass-based diesel industry and its customers have adopted arrangements for sharing revenue generated from selling gallons of biomass-based diesel that benefit from the BTC. Unlike RFS2, the BTC has a direct effect on federal government spending and could be changed or eliminated as a result of changes in the federal budget policy. It is
38
uncertain what action, if any, Congress may take with respect to allowing the BTC to lapse or reinstate or extend the BTC, or whether such action would apply retroactively or prospectively.
If Congress does not extend or reinstate the credit, demand for our biomass-based diesel and the price we are able to charge for our product may be significantly reduced, harming revenues and profitability. In addition, uncertainty regarding the extension or reinstatement of the BTC has caused fluctuations in our operating results. For example, we experienced a reduction in gallons sold in the first quarter of 2012 following an industry-wide acceleration of gallons produced and sold in the fourth quarter of 2011, when the BTC was scheduled to expire on December 31, 2011. We believe reduced demand in the first quarters of 2014 and 2015 also resulted from the lapsing of the BTC at the end of 2013 and 2014, respectively.
State
Several states have enacted tax incentives for the use of biodiesel and/or biomass-based diesel. For example, we derive a significant portion of our revenues from operations in the State of Illinois, which offers an exemption from the generally applicable 6.25% sales tax for biodiesel blends at 11% biodiesel, or B11. Like the BTC, the Illinois tax incentive program, and the tax incentive programs of other states, could be changed as a result of state budget considerations or otherwise. Reduction or elimination of such incentives could materially and adversely harm our revenues and profitability.
Increased industry-wide production of biomass-based diesel, including as a result of existing excess production capacity, could harm our financial results.
If the volume of excess biomass-based diesel RINs exceeds the volume mandated for use under RFS2, the demand for and price of our biomass-based diesel, and biomass-based diesel RINs may be reduced, which could harm revenues and cash flows.
According to the National Biodiesel Board, or NBB, as of September 12, 2012, 2.7 billion gallons per year of biodiesel production capacity in the United States was registered under the RFS2 program by NBB members. In addition to this amount, several hundred million more gallons of U.S. based biomass-based diesel production capacity was registered by non-NBB members and another 1.2 billion gallons of biomass-based diesel production was registered by foreign producers. Furthermore, plants under construction and expansion in the United States as of December 31 2011, if completed, could add an additional several hundred million gallons of annual biodiesel production capacity. The annual production capacity of existing plants and plants under construction far exceeds both historic consumption of biomass-based diesel in the United States and required consumption under RFS2. If this excess production capacity was fully utilized for the U.S. market, it would increase competition for our feedstocks, increase the volume of biomass-based diesel on the market and may reduce biomass-based diesel gross margins, harming our revenues and profitability.
Increased biomass-based diesel production may result in the generation of RINs in excess of the volume of RINs mandated for consumption under RFS2. RIN prices can be expected to decrease as the calendar year progresses if the RIN market is oversupplied compared to that year’s RVO. For example, in 2012, which had a RVO for biomass-based diesel of one billion gallons, biomass-based diesel RIN prices, as reported by OPIS, began to decrease in September when biomass-based diesel RIN generation neared the equivalent of 900 million gallons, as reported by EMTS. Similarly, in September of 2013 when biomass-based diesel RIN generation reached approximately 960 million gallons compared to a 2013 biomass-based diesel RVO of 1.28 billion gallons, biomass-based diesel RIN prices, as reported by OPIS, began to decline.
RISKS RELATED TO OUR BUSINESS OPERATIONS AND THE MARKETS IN WHICH WE OPERATE
Our gross margins are dependent on the spread between biomass-based diesel prices and feedstock costs, each of which are volatile and can cause our results of operations to fluctuate substantially.
Biomass-based diesel has traditionally been marketed primarily as an additive or alternative to petroleum-based diesel fuel, and, as a result, biomass-based diesel prices have been influenced by the price of petroleum-based diesel fuel, adjusted for government incentives supporting renewable fuels, rather than biomass-based diesel production costs. A lack of close correlation between production costs and biomass-based diesel prices means that we may be unable to pass increased production costs on to our customers in the form of higher prices. Any decrease in the spread between biomass-based diesel prices and feedstock costs, whether as a result of an increase in feedstock prices or a reduction in biomass-based diesel prices, along with a reduction in the value of RINs, would adversely affect our gross margins, cash flow and results of operations.
Energy prices, particularly the market price for crude oil, started to rebound in the first half of 2016. However, they significantly decreased throughout 2015. The price we sold our biomass-based diesel also significantly decreased from an average of $3.62 per gallon in 2014 to $2.97 per gallon in 2015. The average selling price of our biomass-based diesel was $3.22 per gallon in the first nine months of 2016. Petroleum prices are volatile due to global factors, such as the impact of
39
wars, political uprisings, new extraction technologies and techniques, OPEC production quotas, worldwide economic conditions, changes in refining capacity and natural disasters.
In addition, an element of the price of biomass-based diesel that we produce is the value of the associated RINs. While RINs prices, as reported by Oil Price Information Service, or OPIS were less volatile in the first three quarters of 2016 from a low of $0.70 in January to a high of $1.05 in July, there was a significant decline in RIN prices throughout 2015, with RIN prices starting the year at $0.92 per RIN, dipping below $0.40 per RIN in September 2015 and ending the year at $0.72 per RIN, as reported by OPIS. There was significant volatility in RIN prices during 2014, with a decline in the second and third quarters of 2014, and subsequent increase in the fourth quarter, finishing the year at its peak at $0.77 per RIN, as reported by OPIS. In 2013, RIN prices decreased sharply from $1.09 per RIN on July 1, 2013 to $0.35 per RIN on December 31, 2013. Reductions in RIN values, such as those experienced in 2015 and prior years, may have a material adverse effect on our revenues and profits as they directly reduce the price we are able to charge for our biomass-based diesel.
A decrease in the availability or an increase in the price, of feedstocks may have a material adverse effect on our financial condition and operating results. The price and availability of feedstocks and other raw materials may be influenced by general economic, market and regulatory factors. These factors include weather conditions, farming decisions, government policies and subsidies with respect to agriculture and international trade and global supply and demand. During periods when the BTC has lapsed, biomass-based diesel producers may elect to continue purchasing feedstock and producing biomass-based diesel at negative margins under the assumption the BTC will be retroactively reinstated, and consequently, the price of feedstock may not decrease to a level proportionate to current operating margins. The development of alternative fuels and renewable chemicals also puts pressure on feedstock supply and availability to the biomass-based diesel industry. If these emerging technologies compete with biomass-based diesel for feedstocks, are more profitable or have greater governmental support than biomass-based diesel does, then the biomass-based diesel industry may have difficulty in procuring feedstocks at economical prices.
At elevated feedstock price levels, certain feedstocks may be uneconomical to use, as we may be unable to pass feedstock cost increases on to our customers. In addition, we generally are unable to enter into forward contracts at fixed prices for some of our feedstocks, such as animal fat, because markets for these feedstocks are less developed.
Historically, the spread between biomass-based diesel prices and feedstock costs has varied significantly. Although actual yields vary depending on the feedstock quality, the average monthly spread between the price per gallon of 100% pure biodiesel, or B100, as reported by The Jacobsen Publishing Company, and the price per gallon for the amount of choice white grease, a common inedible animal fat used by us to make biomass-based diesel, was $1.26 in 2012, $1.61 in 2013, $0.92 in 2014, $1.09 in 2015 and $1.23 in the third quarter of 2016, assuming eight pounds of choice white grease yields one gallon of biomass-based diesel. The average monthly spread for the amount of crude soybean oil required to produce one gallon of biomass-based, based on the nearby futures contract as reported on the Chicago Board of Trade, was $0.65 in 2012, $1.19 in 2013, $0.65 in 2014, $0.58 in 2015 and $0.85 in the third quarter of 2016, assuming 7.5 pounds of soybean oil yields one gallon of biomass-based. From 2012-2015, approximately 85% of our annual total feedstock usage was inedible corn oil, used cooking oil or inedible animal fat, and approximately 15% was virgin vegetable oils.
Risk management transactions could significantly increase our operating costs and may not be effective.
In an attempt to partially offset the effects of volatile feedstock costs and biomass-based diesel fuel prices, we enter into contracts that establish market positions in feedstocks, such as inedible corn oil, used cooking oil, inedible animal fats and soybean oil, along with related commodities, such as heating oil and ultra-low sulfur diesel, or ULSD. The financial impact of such market positions depends on commodity prices at the time that we are required to perform our obligations under these contracts as well as the cumulative sum of the obligations we assume under these contracts.
Risk management activities can themselves result in losses when a position is purchased in a declining market or a position is sold in a rising market. Risk management arrangements expose us to the risk of financial loss in situations where the counterparty defaults on its contract or, in the case of exchange-traded or over-the-counter futures or options contracts, where there is a change in the expected differential between the underlying price in the contract and the actual prices paid or received by us. Changes in the value of these futures instruments are recognized in current income and may result in margin calls. We may also vary the amount of risk management strategies we undertake, or we may choose not to engage in risk management transactions at all. Our results of operation may be negatively impacted by our risk management transactions.
Our facilities and our customer’s facilities are subject to risks associated with fire, explosions and leaks, and other natural disasters which may disrupt our business and increase costs and liabilities.
Because biomass-based diesel and some of its inputs and outputs are combustible and/or flammable, a leak, fire or explosion may occur at a plant or customer’s facility which could result in damage to the plant and nearby properties, injury to
40
employees and others, and interruption of operations. For example, in April 2015 and again in September 2015, we experienced fires at our Geismar facility. In the April fire, two employees were injured; in the September fire, one employee and three contractors were injured. Our subsidiary has been named as defendant in lawsuits filed by contractors injured in the September fire and these suits allege that injuries resulted from, among other things, our negligence. We may be subject to additional litigation in connection with these incidents. In addition, on March 3, 2016 the Occupational Safety and Health Administration, or OSHA, issued a citation and notification of penalty regarding the September 2015 incident, citing three “willful” safety violations. We are currently working with OSHA to resolve or abate these citations.
As a result of the fires, our Geismar facility was shut down from April 2015 through early March 2016 while repairs and upgrades were completed. Our Geismar facility began start-up operations in early March 2016, although the plant did not achieve full capacity operation for a couple months due to variable sales opportunities and the start-up process. While we expect a significant portion of the costs associated with the Geismar fires will be covered by insurance, our insurance company may dispute coverage and we may be subject to costs and penalties that are not covered by insurance. Accordingly, as a result of these two incidents at the Geismar facility, we may incur significant additional costs, including potential liability for damages or injuries, legal expenses and loss of profit, which could seriously harm our results of operations and financial condition.
A majority of our facilities are also located in the Midwest, which is subject to tornado activity. Furthermore, REG Life Sciences' research and development center is in South San Francisco, California, which is subject to earthquakes. In addition, our Houston and Geismar facilities, due to their Gulf Coast location, are vulnerable to hurricanes and flooding, which may cause plant damage, injury to employees and others and interruption of operations. For example, in August 2016 we experienced reduced operating days at our Geismar facility as a result of local area flooding. Every one of our plants could incur damage from other natural disasters as well. If any of the foregoing events occur, we may incur significant additional costs including, among other things, loss of profits due to unplanned temporary or permanent shutdowns of our facilities, cleanup costs, liability for damages or injuries, legal expenses and reconstruction expenses, which would harm our results of operations and financial condition.
Our insurance may not protect us against our business and operating risks.
We maintain insurance for some, but not all, of the potential risks and liabilities associated with our business. For some risks, we may not obtain insurance if we believe the cost of available insurance is excessive relative to the risks presented. As a result of market conditions, premiums and deductibles for certain insurance policies can increase substantially and, in some instances, certain insurance policies may become unavailable or available only for reduced amounts of coverage. As a result, we may not be able to renew our existing insurance policies or procure other desirable insurance on commercially reasonable terms, if at all. Although we intend to maintain insurance at levels we believe are appropriate for our business and consistent with industry practice, we will not be fully insured against all risks. In addition, pollution, environmental risks and the risk of natural disasters generally are not fully insurable. Losses and liabilities from uninsured and underinsured events and delay in the payment of insurance proceeds could have a material adverse effect on our financial condition and results of operations.
One customer accounted for a meaningful percentage of revenues and a loss of this customer could have an adverse impact on our total revenues.
One customer, Pilot Travel Centers LLC, or Pilot, accounted for 8%, 18% and 16% of our revenues in 2015, 2014 and 2013, respectively. Our revenues from Pilot generally do not include the RINs associated with the gallons of biomass-based diesel sold to Pilot. The value of those RINs represented approximately an additional 13% of our total sales in 2015, based on the OPIS average RIN price for the year. In the event we lose Pilot as a customer or Pilot significantly reduces the volume of biomass-based diesel bought from us, it could be difficult to replace the lost revenues from biomass-based diesel and RINs, and our profitability and cash flow could be materially harmed. We do not have a long term contract with Pilot that ensures a continuing level of business from Pilot.
Our business is primarily dependent upon two similar products. As a consequence, we may not be able to adapt to changing market conditions or endure any decline in the biomass-based diesel industry.
Our revenues are currently generated almost entirely from the production and sale of biodiesel and renewable hydrocarbon diesel, collectively referred to as biomass-based diesel. Our reliance on biomass-based diesel means that we may not be able to adapt to changing market conditions or to withstand any significant decline in the size or profitability of the biomass-based diesel industry. In the beginning of 2015, we were required to periodically idle our plants due to insufficient demand at profitable price points. If we are required to idle our plants in the future or are unable to adapt to changing market conditions, our revenues and results of operations may be materially harmed.
41
Technological advances and changes in production methods in the biomass-based diesel industry and renewable chemical industry could render our plants obsolete and adversely affect our ability to compete.
It is expected that technological advances in biomass-based diesel production methods will continue to occur and new technologies for biomass-based diesel production may develop. Advances in the process of converting oils and fats into biodiesel and renewable hydrocarbon diesel could allow our competitors to produce biomass-based diesel faster and more efficiently and at a substantially lower cost. Additionally, we currently produce biomass-based diesel to conform to or exceed standards established by the American Society for Testing and Materials (ASTM). ASTM standards for biomass-based diesel and biomass-based diesel blends may be modified in response to new technologies from the industries involved with diesel fuel.
New standards or production technologies may require us to make additional capital investments in, or modify, plant operations to meet these standards. If we are unable to adapt or incorporate technological advances into our operations, our production facilities could become less competitive or obsolete. Further, it may be necessary for us to make significant expenditures to acquire any new technology and retrofit our plants in order to incorporate new technologies and remain competitive. In order to execute our strategy to expand into the production of renewable chemicals, additional advanced biofuels, next generation feedstocks and related renewable products, we may need to acquire licenses or other rights to technology from third parties. We can provide no assurance that we will be able to obtain such licenses or rights on favorable terms. If we are unable to obtain, implement or finance new technologies, our production facilities could be less efficient than our competitors, and our ability to sell biomass-based diesel may be harmed, negatively impacting our revenues and profitability.
Our intellectual property is integral to our business. If we are unable to protect our intellectual property, or others assert that our operations violate their intellectual property, our business could be adversely affected.
Our success depends in part upon our ability to protect and prevent others from using our intellectual property. Failure to obtain or maintain adequate intellectual property protection could adversely affect our competitive business position. We rely on a combination of intellectual property rights, including patents, copyrights, trademarks and trade secrets in the United States and in select foreign countries. Effective patent, copyright, trademark and trade secret protection may be unavailable, limited or not applied for in some countries.
We rely in part on trade secret protection to protect our confidential and proprietary information and processes. However, trade secrets are difficult to protect. We have taken measures to protect our trade secrets and proprietary information, but these measures may not be effective. For example, we require new employees and consultants to execute confidentiality agreements upon the commencement of their employment or consulting arrangement with us. These agreements generally require that all confidential information developed by the individual or made known to the individual by us during the course of the individual’s relationship with us be kept confidential and not disclosed to third parties. These agreements also generally provide that knowhow and inventions conceived by the individual in the course of rendering services to us are our exclusive property. Nevertheless, these agreements may be breached, or may not be enforceable, and our proprietary information may be disclosed. Despite the existence of these agreements, third parties may independently develop substantially equivalent proprietary information and techniques.
It may be difficult for us to protect and enforce our intellectual property. Costly and time-consuming litigation could be necessary to enforce and determine the scope of our proprietary rights. If we pursue litigation to assert our intellectual property rights, an adverse judicial decision in any legal action could limit our ability to assert our intellectual property rights, limit our ability to develop new products, limit the value of our technology or otherwise negatively impact our business, financial condition and results of operations.
A competitor could seek to enforce intellectual property claims against us. Defending intellectual property rights claims asserted against us, regardless of merit, could be time-consuming, expensive to litigate or settle, divert management resources and attention and force us to acquire intellectual property rights and licenses, which may involve substantial royalty payments. Further, a party making such a claim, if successful, could secure a judgment that requires us to pay substantial damages.
Increases in our transportation costs or disruptions in our transportation services could have a material adverse effect on our business.
Our business depends on transportation services to deliver raw materials to us and finished products to our customers. The costs of these transportation services are affected by the volatility in fuel prices or other factors. For example, in 2012, the market rates of leasing new rail cars nearly doubled as a result of increased demand to move domestically drilled crude oil from new supply fields in the upper Midwest to various refineries. We have not been able in the past, and may not be able in the future, to pass along part or all of any of these price increases to customers. If we continue to be unable to increase our prices as
42
a result of increased fuel costs charged to us by transportation providers, our gross margins may be materially adversely affected.
If any transportation providers fail to deliver raw materials to us in a timely manner, we may be unable to manufacture products on a timely basis. Shipments of products and raw materials may be delayed due to weather conditions, strikes or other events. Any failure of a third-party transportation provider to deliver raw materials or products in a timely manner could harm our reputation, negatively affect our customer relationships and have a material adverse effect on our business, financial condition and results of operations.
We are dependent upon our key management personnel and other personnel whereby the loss of any of these persons could adversely affect our results of operations.
Our success depends on the abilities, expertise, judgment, discretion, integrity and good faith of our management and employees to manage the business and respond to economic, market and other conditions. We are highly dependent upon key members of our relatively small management team and employee base that possess unique technical skills for the execution of our business plan. There can be no assurance that any individual will continue in his or her capacity for any particular period of time or that replacement personnel with comparable skills could be found. The inability to retain our management team and employee base or attract suitably qualified replacements and additional staff could adversely affect our business. The loss of employees could delay or prevent the achievement of our business objectives and have a material adverse effect upon our results of operations and financial position.
We have not generated any significant revenue from sales of renewable chemicals to date and we expect to incur additional costs and face significant challenges to develop this business.
In January 2014 we entered the market for renewable chemicals through our acquisition of a proprietary microbial fermentation technology and related assets. To date, we have incurred significant research and development costs and have not generated any significant revenues from this business which remains largely at a pre-commercial stage. In addition, in order to generate revenue from our renewable chemical products that we may develop, we must be able to produce sufficient quantities of those products. Accordingly, we would need to partner with a third party fermentation facility, or purchase or construct a production facility, which would involve a significant capital expenditure by us.
In entering this market, we intend to sell renewable chemicals as an alternative to chemicals currently in use, and in some cases the chemicals that we seek to replace have been used for many years. The potential customers for our renewable chemical products generally have well developed manufacturing processes and arrangements with suppliers of the chemical components of their products and may resist changing these processes and components. These potential customers frequently impose lengthy and complex product qualification procedures on their suppliers. Factors that these potential customers consider during the product qualification process include consumer preference, manufacturing considerations such as process changes and capital, other costs associated with transitioning to alternative components, supplier operating history, regulatory issues, product liability and other factors, many of which are unknown to, or not well understood by, us. Some of our products may also require regulatory registrations and approvals from governmental authorities. The requirements for obtaining regulatory registrations and approvals may change or may take longer than we anticipate. Satisfying these processes may take many months or years.
If we are unable to convince these potential customers that our products are comparable to the chemicals that they currently use, or that the use of our products produce benefits to them, we will not be successful in these markets and our business will be adversely affected. Additionally, in contrast to the tax incentives relating to biofuels, tax credits and subsidies are not currently available in the United States for consumer products or chemical companies who use renewable chemical products. We do not expect meaningful revenue from our sale of renewable chemicals in the near term.
We may encounter difficulties in effectively integrating the businesses we acquire, including our international businesses where we have limited operating history.
We may face significant challenges in effectively integrating entities and businesses that we acquire, including our acquisition of the majority interest in Petrotec, a German biodiesel producer, in December 2014 along with our acquisitions of substantially all the assets of Imperium in August 2015 and certain biomass-based diesel production assets of Sanimax Energy in March 2016. We may not realize the benefits anticipated from such acquisitions. Achieving the anticipated benefits of our acquired businesses will depend in part upon whether we can integrate our businesses in an efficient and effective manner. Our integration of acquired businesses involves a number of risks, including:
• | difficulty in integrating the operations and personnel of the acquired company; |
43
• | difficulty in effectively integrating the acquired technologies, products or services with our current technologies, products or services; |
• | demands on management related to the increase in our size after the acquisition; |
• | the diversion of management’s attention from daily operations to the integration of acquired businesses and personnel; |
• | failure to achieve expected synergies and costs savings; |
• | difficulties in the assimilation and retention of employees; |
• | difficulties in the assimilation of different cultures and practices, as well as in the assimilation of broad and geographically dispersed personnel and operations; |
• | difficulties in the integration of departments, systems, including accounting systems, technologies, books and records and procedures, as well as in maintaining uniform standards and controls, including internal control over financial reporting, and related procedures and policies; |
• | incurring acquisition-related costs or amortization costs for acquired intangible assets that could impact our operating results; |
• | the need to fund significant working capital requirements of any acquired production facilities; |
• | potential failure of the due diligence processes to identify significant problems, liabilities or other shortcomings or challenges of an acquired company or technology, including but not limited to, issues with the acquired company’s intellectual property, product quality, environmental liabilities, data back-up and security, revenue recognition or other accounting practices, employee, customer or partner issues or legal and financial contingencies; |
• | exposure to litigation or other claims in connection with, or inheritance of claims or litigation risk as a result of, an acquisition, including but not limited to, claims from terminated employees, customers, former stockholders or other third parties; |
• | incurring significant exit charges if products or services acquired in business combinations are unsuccessful; and |
• | if we are unable to complete the tender offer, our ability to control the operations of Petrotec may be limited. |
Our ability to recognize the benefit of our investment in Petrotec, or any other international operations we invest in, will require the attention of management and is subject to a number of risks. We have no experience operating a biorefinery outside of the United States. The biodiesel market in Europe benefits from regulations that encourage the use of biodiesel. These regulations are subject to political and public opinion and may be changed. In addition, expanding our operations internationally subjects us to the following risks:
• | recruiting and retaining talented and capable management and employees in foreign countries; |
• | challenges caused by distance, language and cultural differences; |
• | protecting and enforcing our intellectual property rights; |
• | difficulties in the assimilation and retention of employees; |
• | the inability to extend proprietary rights in our technology into new jurisdictions; |
• | currency exchange rate fluctuations; |
• | general economic and political conditions in foreign jurisdictions; |
• | foreign tax consequences; |
• | foreign exchange controls or U.S. tax restrictions that might restrict or prevent us from repatriating income earned in countries outside the United States; |
• | political, economic and social instability; |
• | higher costs associated with doing business internationally; and |
• | export or import regulations as well as trade and tariff restrictions. |
Our failure to successfully manage and integrate our acquisitions could have an adverse effect on our operating results, ability to recognize international revenue, and our overall financial condition.
We may not successfully identify acquisitions, investment opportunities and other strategic relationships on favorable terms or be able to secure capital to pursue such opportunities.
We regularly review investment opportunities, including domestic and international acquisitions of biofuel production facilities, opportunities to develop our renewable chemicals business, expand, complete or enhance our biomass-based operations or acquire complementary businesses and technologies. We have acquired most of our facilities from third parties. However, we may be unable to identify suitable acquisition candidates in the future. Even if we identify appropriate acquisition candidates, we may be unable to complete such acquisitions on favorable terms, if at all.
We have three partially constructed plants, one near New Orleans, Louisiana, one in Emporia, Kansas and one in Clovis, New Mexico. There is also one non-operational plant near Atlanta, Georgia. The biomass-based facility near Atlanta, Georgia,
44
which had been idled prior to our acquisition will remain so pending certain repairs and upgrades. Our Clovis plant is currently being operated as a terminal facility.
While we intend to finance certain upgrades to our existing facilities from our cash flow from operations, we will need to raise significant capital to pursue investment opportunities, complete construction of the three partially constructed or non-operational facilities and to fund related working capital requirements. Accordingly, we may need to engage in equity or debt financing to secure additional funds. Any debt financing could involve restrictive covenants, which may restrict our flexibility in operating our business, including restrictions on the ability to make distributions, to guarantee indebtedness and to incur liens on the plants of such subsidiaries, thereby, making it more difficult for us to obtain additional capital and to pursue business opportunities, including potential acquisitions. We may not be able to obtain additional financing on terms favorable to us, if at all. If we are unable to obtain adequate financing on terms satisfactory to us, when we require it, our ability to continue to support our business growth and to respond to business challenges could be significantly limited, and our business, operating results, financial condition and prospects could be adversely affected.
We incur significant expenses to maintain and upgrade our operating equipment and plants, and any interruption in the operation of our facilities may harm our operating performance.
We regularly incur significant expenses to maintain and upgrade our equipment and facilities. The machines and equipment that we use to produce our products are complex, have many parts and some are run on a continuous basis. We must perform routine maintenance on our equipment and will have to periodically replace a variety of parts such as motors, pumps, pipes and electrical parts. In addition, our facilities require periodic shutdowns to perform major maintenance and upgrades. These scheduled shutdowns of facilities result in decreased sales and increased costs in the periods in which a shutdown occurs and could result in unexpected operational issues in future periods as a result of changes to equipment and operational and mechanical processes made during the shutdown period.
Growth in the sale and distribution of biomass-based diesel is dependent on the expansion of related infrastructure which may not occur on a timely basis, if at all, and our operations could be adversely affected by infrastructure limitations or disruptions.
Growth in the biomass-based diesel industry depends on substantial development of infrastructure for the distribution of biodiesel. Substantial investment required for these infrastructure changes and expansions may not be made on a timely basis or at all. The scope and timing of any infrastructure expansion are generally beyond our control. Also, we compete with other biofuel companies for access to some of the key infrastructure components such as pipeline and terminal capacity. As a result, increased production of biomass-based diesel will increase the demand and competition for necessary infrastructure. Any delay or failure in expanding distribution infrastructure could hurt the demand for or prices of biomass-based diesel, impede delivery of our biomass-based diesel, and impose additional costs, each of which would have a material adverse effect on our results of operations and financial condition. Our business will be dependent on the continuing availability of infrastructure for the distribution of increasing volumes of biomass-based diesel and any infrastructure disruptions could materially harm our business.
We operate in a highly competitive industry and competition in our industry would increase if new participants enter the biomass-based diesel business.
We operate in a very competitive environment. The biomass-based diesel industry is primarily comprised of smaller entities that engage exclusively in biodiesel production, large integrated agribusiness companies that produce biodiesel along with their soybean crush businesses and increasingly, integrated petroleum companies. We face competition for capital, labor, feedstocks and other resources from these companies. In the United States, we compete with soybean processors and refiners, including Archer-Daniels-Midland Company, Cargill, and Louis Dreyfus Commodities. In addition, petroleum refiners are increasingly entering into biomass-based diesel production. Such petroleum refiners includes Neste Oil with approximately 720 million gallons of global renewable hydrocarbon diesel production capacity in Asia and Europe and Valero Energy Corporation through its Diamond Green joint venture that operates an approximate 160 million gallon renewable hydrocarbon diesel plant. These and other competitors that are divisions of larger enterprises may have greater financial resources than we do.
Petroleum companies and diesel retailers form the primary distribution networks for marketing biomass-based diesel through blended petroleum-based diesel. If these companies increase their direct or indirect biomass-based diesel production, there will be less need to purchase biomass-based diesel from independent biomass-based diesel producers like us. Such a shift in the market would materially harm our operations, cash flows and financial position.
A volatile regulatory environment, lack of debt or equity investments and volatile biofuel prices and feedstock costs have likely contributed to the necessity of bankruptcy filings by biofuel producers. We may encounter new competition from
45
buyers of distressed biodiesel properties that enter the industry at a lower cost than original plant investors or from competitors consolidating or otherwise growing. Our business has been, and in the future may be, negatively impacted by the industry conditions that influenced the bankruptcy proceedings of other biofuel producers. Our business and prospects may be significantly and adversely affected if we are unable to similarly increase our scale.
We face competition from imported biodiesel and renewable hydrocarbon diesel, which may reduce demand for biomass-based diesel produced by us and cause our revenues and profits to decline.
Biodiesel and renewable hydrocarbon diesel imports into the United States have increased significantly and compete with biodiesel produced in the United States. The imported fuels may benefit from production incentives or other financial incentives in foreign countries that offset some of their production costs and enable importers to profitably sell biodiesel or renewable hydrocarbon diesel in the United States at lower prices than United States-based biodiesel producers. Under RFS2, imported biodiesel and renewable hydrocarbon diesel is eligible and, therefore, competes to meet the volumetric requirements for biomass-based diesel and advanced biofuels. If imports continue to increase, this could make it more challenging for us to market or sell biomass-based diesel in the United States, which would have a material adverse effect on our revenues. In January 2015, the EPA announced the approval for Argentinian biodiesel made from soybean oil to generate RINs. Imported biomass-based diesel that does not qualify under RFS2, also competes in jurisdictions where there are biomass-based diesel blending requirements.
Our business is subject to seasonal fluctuations, which are likely to cause our revenues and operating results to fluctuate.
Our operating results are influenced by seasonal fluctuations in the price of and demand for biodiesel. Seasonal fluctuations may be based on both the weather and the status of both the BTC and RVO obligations. Demand may be higher in the quarters leading up to the expiration of the BTC as customers seek to purchase biodiesel when they can benefit from the agreed upon value sharing of the BTC with producers of biodiesel. Seasonal fluctuation also occurs in the colder months when historically there has been reduced demand for biodiesel in northern and eastern United States markets, which are the primary markets in which we currently operate.
Biodiesel typically has a higher cloud point than petroleum-based diesel. The cloud point is the temperature below which a fuel exhibits a noticeable cloudiness and eventually gels, leading to fuel handling and performance problems for customers and suppliers. Reduced demand in the winter for our higher cloud point biodiesel may result in excess supply of such higher cloud point biodiesel and lower prices for such higher cloud point biodiesel. Most of our production facilities are located in colder Midwestern states and our costs of shipping biodiesel to warmer climates generally increase in cold weather months.
The tendency of biodiesel to gel in colder weather may also result in long-term storage problems. In cold climates, fuel may need to be stored in a heated building or heated storage tanks, which result in higher storage costs. Higher cloud point biodiesel may have other performance problems, including the possibility of particulate formation above the cloud point which may result in increased expenses as we try to remedy these performance problems, including the costs of extra cold weather treatment additives. Remedying these performance problems may result in decreased yields, lower process throughput or both, as well as substantial capital costs. Any reduction in the demand for our biodiesel product, or the production capacity of our facilities will reduce our revenues and have an adverse effect on our cash flows and results of operations.
Failure to comply with governmental regulations, including EPA requirements relating to RFS2 and FDA requirements relating to the Food Safety Modernization Act, could result in the imposition of penalties, fines, remedial liabilities or restrictions on our operations.
The biomass-based diesel industry is subject to extensive federal, state and local laws and regulations. Under certain environmental laws and regulations, we could be held strictly liable for the removal or remediation of previously released materials or property contamination regardless of whether we were responsible for the release or contamination, and regardless of whether current or prior operations were conducted consistent with accepted standards of practice. Many of our assets and plants were acquired from third parties and we may incur costs to remediate property contamination caused by previous owners. Compliance with these laws, regulations and obligations could require substantial capital expenditures. Failure to comply could result in the imposition of penalties, fines or restrictions on operations and remedial liabilities.
Changes in environmental laws and regulations occur frequently, and any changes that result in more stringent or costly waste handling, storage, transport, disposal or cleanup requirements could require us to make significant expenditures to attain and maintain compliance and may otherwise have a material adverse effect on our business in general and on our results of operations, competitive position or financial condition. We are unable to predict the effect of additional environmental laws and regulations which may be adopted in the future, including whether any such laws or regulations would significantly increase our cost of doing business or affect our operations in any area.
46
We are subject to various laws and regulations related to RFS2, most significantly regulations related to the generation and dissemination of RINs. These regulations are highly complex and continuously evolving, requiring us to periodically update our compliance systems. Recently, the EPA implemented a quality assurance program and regulations related to the generation and sale of biomass-based diesel RINs. Compliance with these or any new regulations or Obligated Party verification procedures could require significant expenditures to attain and maintain compliance. Any violation of these regulations by us, could result in significant fines and harm our customers’ confidence in the RINs we issue, either of which could have a material adverse effect on our business.
In response to the Food Safety Modernization Act, we may change certain processes at some of our plants, which may add to our cost of production, and may restrict the markets where we have traditionally sold some of the co-products of our biodiesel production process.
The development of alternative fuels and energy sources may reduce the demand for biodiesel, resulting in a reduction in our revenues and profitability.
The development of alternative fuels, including a variety of energy alternatives to biodiesel has attracted significant attention and investment. Neste Oil operates four renewable hydrocarbon diesel plants: a 300 million gallon per year plant in Singapore, a 300 million gallon per year plant in Rotterdam, Netherlands, and two 60 million gallon per year plants in Porvoo, Finland. In the United States, Diamond Green Diesel, LLC operates a 160 million gallon per year renewable hydrocarbon diesel plant in Norco, Louisiana in 2013. Under RFS2, renewable hydrocarbon diesel made from biomass meets the definition of biomass-based diesel and thus is eligible, along with biodiesel, to satisfy the RFS2 biomass-based diesel requirements. Furthermore, under RFS2, renewable hydrocarbon diesel may receive up to 1.7 RINs per gallon, whereas biodiesel currently receives 1.5 RINs per gallon. As the value of RINs increases, this 0.2 RIN advantage may make renewable hydrocarbon diesel more cost-effective, both as a petroleum-based diesel substitute and for meeting RFS2 requirements. If renewable hydrocarbon diesel proves to be more cost-effective than biodiesel, revenues from our biodiesel plants and our results of operations would be adversely impacted.
In addition, the EPA may allow other fuels to satisfy the RFS2 requirements and allow RINs to be generated upon the production of these fuels. The EPA recently adopted regulations to amend the definition of “Home Heating Oil” under RFS2, which expands the scope of fuels eligible to generate RINs.
The biomass-based diesel industry will also face increased competition resulting from the advancement of technology by automotive, industrial and power generation manufacturers which are developing more efficient engines, hybrid engines and alternative clean power systems. Improved engines and alternative clean power systems offer a technological solution to address increasing worldwide energy costs, the long-term availability of petroleum reserves and environmental concerns. If and when these clean power systems are able to offer significant efficiency and environmental benefits and become widely available, the biomass-based diesel industry may not be able to compete effectively with these technologies and government requirements for the use of biofuels may be discontinued.
If automobile manufacturers and other industry groups express reservations regarding the use of biodiesel, our ability to sell biodiesel will be negatively impacted.
Because it is a relatively new product compared with petroleum diesel, research on biodiesel use in automobiles is ongoing. While most heavy duty automobile manufacturers have approved blends of up to 20% biodiesel, some industry groups have recommended that blends of no more than 5% biodiesel be used for automobile fuel due to concerns about fuel quality, engine performance problems and possible detrimental effects of biodiesel on rubber components and other engine parts. Although some manufacturers have encouraged use of biodiesel fuel in their vehicles, cautionary pronouncements by other manufacturers or industry groups may impact our ability to market our biodiesel.
Perception about “food vs. fuel” could impact public policy which could impair our ability to operate at a profit and substantially harm our revenues and operating margins.
Some people believe that biomass-based diesel may increase the cost of food, as some feedstocks such as soybean oil used to make biomass-based diesel can also be used for food products. This debate is often referred to as “food vs. fuel.” This is a concern to the biomass-based diesel industry because biomass-based diesel demand is heavily influenced by government policy and if public opinion were to erode, it is possible that these policies would lose political support. These views could also negatively impact public perception of biomass-based diesel. Such claims have led some, including members of Congress, to urge the modification of current government policies which affect the production and sale of biofuels in the United States.
Concerns regarding the environmental impact of biomass-based diesel production could affect public policy which could impair our ability to operate at a profit and substantially harm our revenues and operating margins.
47
Under the Energy Independence and Security Act of 2017, or EISA, the EPA is required to produce a study every three years of the environmental impacts associated with current and future biofuel production and use, including effects on air and water quality, soil quality and conservation, water availability, energy recovery from secondary materials, ecosystem health and biodiversity, invasive species and international impacts. The first such triennial report was released in February 2012. The 2012 report concludes that (1) the extent of negative impacts to date are limited in magnitude and are primarily associated with the intensification of corn production; (2) whether future impacts are positive or negative will be determined by the choice of feedstock, land use change, cultivation and conservation practices; and (3) realizing potential benefits will require implementation and monitoring of conservation and best management practices, improvements in production efficiency, and implementation of innovative technologies at commercial scales. Should future EPA triennial studies, or other analyses find that biofuel production and use has resulted in, or could in the future result in, adverse environmental impacts, such findings could also negatively impact public perception and acceptance of biofuel as an alternative fuel, which also could result in the loss of political support. To the extent that state or federal laws are modified or public perception turns against biomass-based diesel, use requirements such as RFS2 and state tax incentives may not continue, which could materially harm our ability to operate profitably.
Nitrogen oxide emissions from biodiesel may harm its appeal as a renewable fuel and increase costs.
In some instances, biodiesel may increase emissions of nitrogen oxide as compared to petroleum-based diesel fuel, which could harm air quality. Nitrogen oxide is a contributor to ozone and smog. New technology diesel engines eliminate any such increase. Emissions from older vehicles while the fleet turns over may decrease the appeal of biodiesel to environmental groups and agencies who have been historic supporters of the biodiesel industry, potentially harming our ability to market our biodiesel.
In addition, several states may act to regulate potential nitrogen oxide emissions from biodiesel. California recently adopted regulations that may limit the volume of biodiesel that can be used or require an additive to reduce potential emissions. In states where such an additive is required to sell biodiesel, the additional cost of the additive may make biodiesel less profitable or make biodiesel less cost competitive against petroleum-based diesel or renewable hydrocarbon diesel, which would negatively impact our ability to sell our products in such states and therefore have an adverse effect on our revenues and profitability.
RISKS RELATED TO OUR INDEBTEDNESS
We and certain subsidiaries have indebtedness, which subjects us to potential defaults, that could adversely affect our ability to raise additional capital to fund our operations and limits our ability to react to changes in the economy or the biomass-based diesel industry.
At September 30, 2016, our total term debt before debt issuance costs was $218.7 million. This includes $112.8 million aggregate carrying value on our recently issued $152.0 million face amount, 4.00% convertible senior notes due in June 2036, $66.6 million aggregate carrying value on our $73.8 million face value, 2.75% convertible senior notes due in June 2019 that we issued in June 2014, which we refer to as the 2019 Convertible Notes. We also have short-term debt obligations under revolving credit agreements provided by certain banks. At September 30, 2016 , there were $6.4 million of borrowings made under our revolving lines of credit, all of which we guarantee. See "Note 7 - Debt" to our Condensed Consolidated Financial Statements for a description of our indebtedness.
Our indebtedness could:
• | require us to dedicate a substantial portion of our cash flow from operations to payments of principal, interest on, and other fees related to such indebtedness, thereby reducing the availability of our cash flow to fund working capital and capital expenditures, and for other general corporate purposes; |
• | increase our vulnerability to general adverse economic and biomass-based diesel industry conditions; |
• | limit our flexibility in planning for, or reacting to, changes in our business and the biomass-based diesel industry, which may place us at a competitive disadvantage compared to our competitors that have less debt; and |
• | limit among other things, our ability to borrow additional funds. |
Our ability to make scheduled payments of the principal of, to pay interest on or to refinance our indebtedness, including the 2036 Convertible Notes and 2019 Convertible Notes, depends on our future financial performance, which is subject to several factors including economic, financial, competitive and other factors beyond our control. Our business may not generate cash flow from operations in the future sufficient to satisfy our obligations under our indebtedness or any future indebtedness we may incur as well as our ability to make necessary capital expenditures. If we are unable to generate such cash flow, we may be required to adopt one or more alternatives, such as reducing or delaying investments or capital expenditures, selling assets, refinancing or obtaining additional capital on terms that may be onerous or highly dilutive. Our ability to refinance the
48
2036 Convertible Notes, the 2019 Convertible Notes or our other existing indebtedness or future indebtedness will depend on the capital markets and our financial condition at such time. We may not be able to engage in any of these activities or engage in these activities on desirable terms, which could result in a default on our current or future indebtedness.
We are subject to counterparty risk with respect to the capped call transactions that we entered into in connection with the issuance of our 2019 Convertible Notes.
In connection with the issuance of our 2019 Convertible Notes, we entered into privately-negotiated capped call transactions with various counterparties. The counterparties to the capped call transactions are financial institutions, and we will be subject to the risk that they might default under the capped call transactions. Our exposure to the credit risk of the option counterparties will not be secured by any collateral. Recent global economic conditions have resulted in the actual or perceived failure or financial difficulties of many financial institutions. If any option counterparty becomes subject to insolvency proceedings, we will become an unsecured creditor in those proceedings, with a claim equal to our exposure at that time under our transactions with such option counterparty. Our exposure will depend on many factors, but generally, an increase in our exposure will be correlated to an increase in the market price and volatility of shares of our common stock. In addition, upon a default by any option counterparty, we may suffer more dilution than we currently anticipate with respect to our common stock. We can provide no assurances as to the financial stability or viability of the option counterparties.
We may not have the ability to raise the funds necessary to settle conversions of our 2019 or 2036 Convertible Notes in cash or to repurchase the 2019 or 2036 Convertible Notes for cash upon a fundamental change, and our future debt may contain limitations on our ability to repurchase the 2019 and 2036 Convertible Notes.
Holders of the 2019 or 2036 Convertible Notes have the right to require us to repurchase their 2019 or 2036 Convertible Notes upon the occurrence of a fundamental change at a repurchase price generally equal to 100% of their principal amount, plus accrued and unpaid interest, if any. In addition, upon conversion of the 2019 or 2036 Convertible Notes, unless we elect to deliver solely shares of our common stock to settle such conversion (other than paying cash in lieu of delivering any fractional share), we will be required to make cash payments in respect of the 2019 or 2036 Convertible Notes being converted. However, we may not have enough available cash or be able to obtain financing at the time we are required to make repurchases of the 2019 or 2036 Convertible Notes upon a fundamental change or to settle conversion of the 2019 or 2036 Convertible Notes in cash.
In addition, our ability to repurchase the 2019 or 2036 Convertible Notes may be limited by law, by regulatory authority or by agreements governing our future indebtedness. Our failure to repurchase 2019 or 2036 Convertible Notes at a time when the repurchase is required by the applicable indenture governing the notes would constitute a default under that indenture. A default under the applicable indenture or the fundamental change itself could also lead to a default under agreements governing our other indebtedness. If the repayment of the related indebtedness were to be accelerated after any applicable notice or grace periods, we may not have sufficient funds to repay the indebtedness and repurchase the 2019 or 2036 Convertible Notes.
Certain provisions in the indentures governing the 2019 or 2036 Convertible Notes could delay or prevent an otherwise beneficial takeover or takeover attempt of us.
Certain provisions in the 2019 or 2036 Convertible Notes and the indentures governing these notes could make it more difficult or more expensive for a third party to acquire us. For example, if a takeover would constitute a fundamental change, holders of the notes will have the right to require us to repurchase their notes in cash. In addition, if a takeover constitutes a make-whole fundamental change, we may be required to increase the conversion rate for holders who convert their notes in connection with such takeover. In either case, and in other cases, our obligations under the notes and the indentures could increase the cost of acquiring us or otherwise discourage a third party from acquiring us or removing incumbent management.
The accounting method for convertible debt securities that may be settled in cash could have a material effect on our reported financial results.
Because we are required to elect to settle note conversions solely in cash (or, subject to certain limitations, with a combination of cash and shares of our common stock) before we obtain the stockholder approval described in Note 2 and 7 of the Condensed Consolidated Financial Statements, we have to separately account for the conversion option associated with the 2036 Convertible Notes as an embedded derivative under Accounting Standards Codification, or ASC, Topic 815, Derivatives and Hedging. Under this treatment, the note conversion option will be measured at its fair value and accounted for separately as a liability that is marked-to-market at the end of each reporting period. The initial value allocated to the conversion option will be treated as a debt discount that will be amortized into interest expense over the term of the 2036 Convertible Notes. For each financial statement period after the issuance of the notes until we obtain the stockholder approval, a gain (or loss) will be reported in our statement of operations to the extent the valuation of the conversion option changes from the previous period.
49
As a result, we may experience related non-cash volatility to our net income (loss). In addition, as a result of the amortization of the debt discount, the interest expense associated with the notes will be greater than the coupon rate on the notes, which will result in lower reported net income. If we obtain the stockholder approval referred to above, then we expect that the conversion option will qualify for equity treatment and will no longer be marked to market at the end of each reporting period. However, we may never obtain this stockholder approval.
We are a holding company and there are limitations on our ability to receive dividends and distributions from our subsidiaries.
All of our principal assets, including our biomass-based diesel production facilities, are owned by subsidiaries and some of these subsidiaries are subject to loan covenants that generally restrict them from paying dividends, making distributions or making loans to us or to any other subsidiary. These limitations will restrict our ability to repay indebtedness, finance capital projects or pay dividends to stockholders from our subsidiaries’ cash flows from operations.
RISKS RELATED TO OUR COMMON STOCK
The market price for our common stock may be volatile.
Although there is currently an active and liquid trading market for our common stock, the market price for our common stock is likely to be highly volatile and subject to wide fluctuations in response to factors including the following:
• | actual or anticipated fluctuations in our financial condition and operating results; |
• | changes in the performance or market valuations of other companies engaged in our industry; |
• | issuance of new or updated research reports by securities or industry analysts; |
• | changes in financial estimates by us or of securities or industry analysts; |
• | investors’ general perception of us and the industry in which we operate; |
• | changes in the political climate in the industry in which we operate, existing laws, regulations and policies applicable to our business and products, including RFS2, and the continuation or adoption or failure to continue or adopt renewable energy requirements and incentives, including the BTC; |
• | other regulatory developments in our industry affecting us, our customers or our competitors; |
• | announcements of technological innovations by us or our competitors; |
• | announcement or expectation of additional financing efforts, including sales or expected sales of additional common stock; |
• | additions or departures of key management or other personnel; |
• | litigation; |
• | inadequate trading volume; |
• | general market conditions in our industry; and |
• | general economic and market conditions, including continued dislocations and downward pressure in the capital markets. |
In addition, stock markets experience significant price and volume fluctuations from time to time that are not related to the operating performance of particular companies. These market fluctuations may have material adverse effect on the market price of our common stock.
We may issue additional common stock as consideration for future investments or acquisitions.
We have issued in the past, and may issue in the future, our securities in connection with investments and acquisitions. Our stockholders could suffer significant dilution, from our issuances of equity or convertible debt securities. Any new equity securities we issue could have rights, preferences and privileges superior to those of holders of our common stock. The amount of our common stock or securities convertible into or exchangeable for our common stock issued in connection with an investment or acquisition could constitute a material portion of our then outstanding common stock.
If we fail to maintain effective internal control over financial reporting, we might not be able to report our financial results accurately or prevent fraud. In that case, our stockholders could lose confidence in our financial reporting, which would harm our business and could negatively impact the value of our stock.
Effective internal controls are necessary for us to provide reliable financial reports and prevent fraud. The process of maintaining our internal controls may be expensive and time consuming and may require significant attention from management. Because of its inherent limitations, internal control over financial reporting may not prevent or detect fraud or misstatements. Failure to implement required new or improved controls, or difficulties encountered in their implementation, could harm our results of operations or cause us to fail to meet our reporting obligations.
50
In connection with the preparation of our quarterly report for the third quarter of 2016, we identified a material weakness in internal control over financial reporting relating to our biomass-based diesel sales contract review process. Until the remediation steps we have undertaken to address this material weakness are fully implemented and operating for a sufficient period of time, the material weakness will continue to exist. If we or our independent registered public accounting firm discover material weaknesses, the disclosure of that fact could harm the value of our stock and our business.
We have never paid dividends on our common stock and we do not anticipate paying any cash dividends in the foreseeable future.
We have paid no cash dividends on our common stock to date, have contractual restrictions against paying cash dividends and currently intend to retain our future earnings to fund the development and growth of our business. As a result, stockholders must look solely to appreciation of our common stock to realize a gain on their investment. This appreciation may not occur. Investors seeking cash dividends should not invest in our common stock.
Delaware law and our amended and restated certificate of incorporation and bylaws contain anti-takeover provisions that could delay or discourage takeover attempts that stockholders may consider favorable.
Provisions in our amended and restated certificate of incorporation and bylaws may have the effect of delaying or preventing a change of control or changes in our management. These provisions include the following:
• | the right of the board of directors to elect a director to fill a vacancy created by the expansion of the board of directors; |
• | the requirement for advance notice for nominations for election to the board of directors or for proposing matters that can be acted upon at a stockholders’ meeting; |
• | the ability of the board of directors to alter our bylaws without obtaining stockholder approval; |
• | the ability of the board of directors to issue, without stockholder approval, up to 10,000,000 shares of preferred stock with rights set by the board of directors, which rights could be senior to those of common stock; |
• | a classified board; |
• | the required approval of holders of at least two-thirds of the shares entitled to vote at an election of directors to adopt, amend or repeal our bylaws or amend or repeal the provisions of our amended and restated certificate of incorporation regarding the classified board, the election and removal of directors and the ability of stockholders to take action by written consent; and |
• | the elimination of the right of stockholders to call a special meeting of stockholders and to take action by written consent. |
In addition, because we are incorporated in Delaware, we are governed by the provisions of Section 203 of the Delaware General Corporation Law, or DGCL. These provisions may prohibit or restrict large stockholders, in particular those owning 15% or more of our outstanding voting stock, from merging or combining with us. These provisions in our amended and restated certificate of incorporation and bylaws and under Delaware law could discourage potential takeover attempts and could reduce the price that investors might be willing to pay for shares of our common stock in the future and result in our market price being lower than it would without these provisions.
ITEM 2. UNREGISTERED SALES OF EQUITY SECURITIES AND USE OF PROCEEDS
On February 19, 2015, the Board of Directors approved a stock repurchase program authorizing up to $30.0 million in repurchases. The program was in effect through October 31, 2016. During the three months ended June 30, 2016, we used up the remaining $0.9 million to repurchase 90,654 shares of our Common Stock under this program.
In March 2016, the Company's board of directors approved a repurchase program of up to $50.0 million of the Company's shares of common stock and/or convertible notes, in effect through March 5, 2018. Under the program, which is in addition to the $30.0 million common stock repurchase program announced in February 2015, the Company may repurchase shares or bonds from time to time in open market transactions, privately negotiated transactions or by other means. During the three months ended September 30, 2016, the Company repurchased 627,522 shares of Common Stock. The repurchases of the three months ended September 30, 2016 were as follows:
51
Period | Total Number of Shares Purchased | Average Price per Share | Total Number of Shares Purchased as Part of Publicly Announced Plan | Approximate Dollar Value of Shares that May Yet Be Purchased | ||||||
March 2016 Share and Convertible Debt Repurchase Program: | ||||||||||
July 2016 (July 1, 2016 to July 31, 2016) | 500,000 | $ | 8.88 | 4,942,823 | $ | 7,100,000 | ||||
August 2016 (August 1, 2016 to August 31, 2016) | 57,561 | $ | 9.50 | 5,000,384 | $ | 6,600,000 | ||||
September 2016 (September 1, 2016 to September 30, 2016) | 69,991 | $ | 8.40 | 5,070,375 | $ | — | ||||
ITEM 3. DEFAULTS UPON SENIOR SECURITIES
None.
ITEM 4. MINE SAFETY DISCLOSURES
Not applicable.
ITEM 5. OTHER INFORMATION
Revision of Prior Period Financial Statements (in thousands)
During the third quarter 2016 close process, we identified errors in our previously reported interim financial statements pertaining to certain biomass-based diesel sales completed in the quarter ended March 31, 2016. The Company sold biomass-based diesel under contracts entered into before the reinstatement of the federal biodiesel mixture excise tax credit, or the BTC, on December 18, 2015, and some of the sales under such contracts were not completed until the first quarter of 2016. As previously reported in the Company's Quarterly Reports and Annual Reports, uncertainty over the reinstatement of the BTC led us and some other market participants to include a BTC sharing provision in some sales contracts to share the BTC when or if reinstated. Typically, contracts including a BTC sharing provision would be amended upon reinstatement of the BTC to be net of the buyer’s agreed share of the BTC and future deliveries would have been invoiced reflecting the amended contract. The BTC sharing provisions were interim provisions, intended to cover only sales made while it was uncertain whether the BTC would be reinstated; the BTC sharing provisions are typically not included in contracts entered into during periods when the BTC is in effect.
In some instances, sales contracts entered into but not completed before December 31, 2015 were not subsequently amended to delete the BTC sharing provision, and buyers were invoiced for the gross market price rather than the market price net of the buyer’s agreed share of the BTC. These errors resulted in an overstatement of biomass-based diesel revenue of $7,724 and a corresponding understatement of accounts payable, deferred income taxes, and income tax expense of $7,724, $850 and $850, respectively for the three months ended March 31, 2016 and the six months ended June 30, 2016.
The correction decreased biomass-based diesel sales by $7,724 for the three months ended March 31, 2016 (from previously reported $247,164 to $239,440) and decreased net income (loss) by $8,574 (from the previously reported net income of $1,686 to a net loss of $6,888). The correction also decreased biomass-based diesel sales by $7,724 for the six months ended June 30, 2016 (from previously reported $707,279 to $699,555) and decreased net income (loss) by $8,574 (from the previously reported net income of $ 8,810 to a net income of $236). This correction is reflected in the accompanying unaudited Condensed Consolidated Statements of Operations for the nine-month period ended September 30, 2016.
Based on an evaluation of all relevant facts, the Company assessed the materiality of these errors on the first and second quarter interim financial statements in accordance with SEC Staff Accounting Bulletin No. 99, codified in the Accounting Standards Classification (ASC) 250, Presentation of Financial Statements. The Company concluded under ASC 250 that the correction was immaterial to the Company’s results for the three months ended March 31, 2016 and six months ended June 30, 2016 and an amendment of previously filed reports was not required. In accordance with ASC 250, the Company elected to correct these errors by revising the consolidated financial statements and other financial information included in this Quarterly Report on Form 10-Q. This correction will be reflected in future 10-K and 10-Q filings.
52
ITEM 6. EXHIBITS
(A) Exhibits:
Exhibit No. | Description | |
10.1 | Form of Performance Restricted Stock Unit Award Agreement# | |
10.2 | Joinder and Amendment No. 11 to Credit Agreement, dated as of September 30, 2016, by and among the lenders identified on the signature pages thereto, Wells Fargo Capital Finance, LLC, Fifth Third Bank, REG Services Group, LLC and REG Marketing & Logistics Group, LLC (incorporated by reference to Exhibit 10.1 to the Company’s Current Report on Form 8-K filed on October 4, 2016). | |
31.1 | Certification of the Chief Executive Officer pursuant to Rule 13a-14(a)/15d-14(a). | |
31.2 | Certification of the Chief Financial Officer pursuant to Rule 13a-14(a)/15d-14(a). | |
32.1* | Certification of the Chief Executive Officer pursuant to 18 USC Section 1350, as adopted pursuant to Section 906 of the Sarbanes-Oxley Act of 2002 | |
32.2* | Certification of the Chief Financial Officer pursuant to 18 USC Section 1350, as adopted pursuant to Section 906 of the Sarbanes-Oxley Act of 2002 | |
101.INS | XBRL Instance Document | |
101.SCH | XBRL Taxonomy Extension Schema Document | |
101.CAL | XBRL Taxonomy Extension Calculation Linkbase Document | |
101.DEF | XBRL Taxonomy Extension Definition Linkbase Document | |
101.LAB | XBRL Taxonomy Extension Label Linkbase Document | |
101.PRE | XBRL Taxonomy Extension Presentation Linkbase Document | |
# Management contract or compensatory plan, contract or arrangement
* In accordance with Item 601(b)(32)(ii) of Regulation S-K and SEC Release No. 34-47986, the certifications furnished in Exhibit 32.1 and Exhibit 32.2 hereto are deemed to accompany this Form 10-Q and will not be deemed “filed” for purposes of Section 18 of the Exchange Act. Such certifications will not be deemed to be incorporated by reference into any filing under the Securities Act or the Exchange Act.
53
SIGNATURES
Pursuant to the requirements of Section 13 or 15(d) of the Securities Exchange Act of 1934, the registrant has duly caused this report to be signed on its behalf by the undersigned, thereunto duly authorized.
RENEWABLE ENERGY GROUP, INC. | |||
Dated: | November 4, 2016 | By: | /s/ Daniel J. Oh |
Daniel J. Oh | |||
Chief Executive Officer (Principal Executive Officer) | |||
Dated: | November 4, 2016 | By: | /s/ Chad Stone |
Chad Stone | |||
Chief Financial Officer (Principal Financial Officer) | |||
Dated: | November 4, 2016 | By: | /s/ Chad A. Baker |
Chad A. Baker | |||
Controller and Chief Accounting Officer (Principal Accounting Officer) | |||
54