Attached files
| file | filename |
|---|---|
| EX-32.2 - EXHIBIT 32.2 - FLOTEK INDUSTRIES INC/CN/ | exhibit322-10q09302016.htm |
| EX-32.1 - EXHIBIT 32.1 - FLOTEK INDUSTRIES INC/CN/ | exhibit321-10q09302016.htm |
| EX-31.2 - EXHIBIT 31.2 - FLOTEK INDUSTRIES INC/CN/ | exhibit312-10q09302016.htm |
| EX-31.1 - EXHIBIT 31.1 - FLOTEK INDUSTRIES INC/CN/ | exhibit311-10q09302016.htm |
UNITED STATES
SECURITIES AND EXCHANGE COMMISSION
Washington, D.C. 20549
FORM 10-Q |
x | QUARTERLY REPORT PURSUANT TO SECTION 13 OR 15(d) OF THE SECURITIES EXCHANGE ACT OF 1934 |
For the quarterly period ended September 30, 2016
or
¨ | TRANSITION REPORT PURSUANT TO SECTION 13 OR 15(d) OF THE SECURITIES EXCHANGE ACT OF 1934 |
For the transition period from to
Commission File Number 1-13270
FLOTEK INDUSTRIES, INC. (Exact name of registrant as specified in its charter) |
Delaware | 90-0023731 | |
(State or other jurisdiction of incorporation or organization) | (I.R.S. Employer Identification No.) | |
10603 W. Sam Houston Parkway N., Suite 300 Houston, TX | 77064 | |
(Address of principal executive offices) | (Zip Code) | |
(713) 849-9911
(Registrant’s telephone number, including area code)
Indicate by check mark whether the registrant (1) has filed all reports required to be filed by Section 13 or 15(d) of the Securities Exchange Act of 1934 during the preceding 12 months (or for such shorter period that the registrant was required to file such reports), and (2) has been subject to such filing requirements for the past 90 days. Yes x No ¨
Indicate by check mark whether the registrant has submitted electronically and posted on its corporate Website, if any, every Interactive Data File required to be submitted and posted pursuant to Rule 405 of Regulation S-T (§232.405 of this chapter) during the preceding 12 months (or for such shorter period that the registrant was required to submit and post such files). Yes x No ¨
Indicate by check mark whether the registrant is a large accelerated filer, an accelerated filer, a non-accelerated filer, or a smaller reporting company. See the definitions of “large accelerated filer,” “accelerated filer” and “smaller reporting company” in Rule 12b-2 of the Exchange Act.
Large accelerated filer | ¨ | Accelerated filer | x | |||
Non-accelerated filer | ¨ (Do not check if a smaller reporting company) | Smaller reporting company | ¨ | |||
Indicate by check mark whether the registrant is a shell company (as defined in Rule 12b-2 of the Exchange Act). Yes ¨ No x
As of October 28, 2016, there were 56,703,963 outstanding shares of Flotek Industries, Inc. common stock, $0.0001 par value.
TABLE OF CONTENTS
2
PART I — FINANCIAL INFORMATION
Item 1. Financial Statements
FLOTEK INDUSTRIES, INC.
UNAUDITED CONDENSED CONSOLIDATED BALANCE SHEETS
(in thousands, except share data)
September 30, 2016 | December 31, 2015 | ||||||
ASSETS | |||||||
Current assets: | |||||||
Cash and cash equivalents | $ | 3,474 | $ | 2,208 | |||
Accounts receivable, net of allowance for doubtful accounts of $1,003 and $1,189 at September 30, 2016 and December 31, 2015, respectively | 53,652 | 49,197 | |||||
Inventories | 73,986 | 85,492 | |||||
Income taxes receivable | 18,192 | 4,700 | |||||
Deferred tax assets, net | 2,352 | 2,649 | |||||
Other current assets | 9,099 | 7,496 | |||||
Total current assets | 160,755 | 151,742 | |||||
Property and equipment, net | 89,154 | 91,913 | |||||
Goodwill | 73,682 | 72,820 | |||||
Deferred tax assets, net | — | 17,229 | |||||
Other intangible assets, net | 58,949 | 69,386 | |||||
TOTAL ASSETS | $ | 382,540 | $ | 403,090 | |||
LIABILITIES AND EQUITY | |||||||
Current liabilities: | |||||||
Accounts payable | $ | 26,072 | $ | 19,444 | |||
Accrued liabilities | 11,826 | 12,894 | |||||
Income taxes payable | — | 2,263 | |||||
Interest payable | 156 | 111 | |||||
Current portion of long-term debt | 34,562 | 32,291 | |||||
Total current liabilities | 72,616 | 67,003 | |||||
Long-term debt, less current portion | 8,000 | 18,255 | |||||
Deferred tax liabilities, net | 1,205 | 23,823 | |||||
Total liabilities | 81,821 | 109,081 | |||||
Commitments and contingencies | |||||||
Equity: | |||||||
Cumulative convertible preferred stock, $0.0001 par value, 100,000 shares authorized; no shares issued and outstanding | — | — | |||||
Common stock, $0.0001 par value, 80,000,000 shares authorized; 59,604,669 shares issued and 56,698,874 shares outstanding at September 30, 2016; 56,220,214 shares issued and 53,536,101 shares outstanding at December 31, 2015 | 6 | 6 | |||||
Additional paid-in capital | 316,091 | 273,451 | |||||
Accumulated other comprehensive income (loss) | (981 | ) | (1,237 | ) | |||
Retained earnings | 4,089 | 39,300 | |||||
Treasury stock, at cost; 1,893,612 and 1,784,897 shares at September 30, 2016 and December 31, 2015, respectively | (18,844 | ) | (17,869 | ) | |||
Flotek Industries, Inc. stockholders’ equity | 300,361 | 293,651 | |||||
Noncontrolling interests | 358 | 358 | |||||
Total equity | 300,719 | 294,009 | |||||
TOTAL LIABILITIES AND EQUITY | $ | 382,540 | $ | 403,090 | |||
See accompanying Notes to Unaudited Condensed Consolidated Financial Statements.
3
FLOTEK INDUSTRIES, INC.
UNAUDITED CONDENSED CONSOLIDATED STATEMENTS OF OPERATIONS
(in thousands, except per share data)
Three months ended September 30, | Nine months ended September 30, | ||||||||||||||
2016 | 2015 | 2016 | 2015 | ||||||||||||
Revenue | $ | 73,679 | $ | 87,942 | $ | 218,287 | $ | 257,346 | |||||||
Cost of revenue | 48,313 | 56,715 | 144,071 | 170,340 | |||||||||||
Gross profit | 25,366 | 31,227 | 74,216 | 87,006 | |||||||||||
Expenses: | |||||||||||||||
Selling, general and administrative | 24,424 | 23,634 | 71,859 | 70,223 | |||||||||||
Depreciation and amortization | 2,706 | 2,785 | 7,896 | 8,258 | |||||||||||
Research and development | 2,531 | 2,031 | 7,059 | 5,273 | |||||||||||
Impairment of inventory and long-lived assets | — | — | 40,435 | 20,372 | |||||||||||
Total expenses | 29,661 | 28,450 | 127,249 | 104,126 | |||||||||||
(Loss) income from operations | (4,295 | ) | 2,777 | (53,033 | ) | (17,120 | ) | ||||||||
Other (expense) income: | |||||||||||||||
Interest expense | (611 | ) | (476 | ) | (1,811 | ) | (1,303 | ) | |||||||
Other (expense) income, net | (49 | ) | 74 | (207 | ) | (154 | ) | ||||||||
Total other expense | (660 | ) | (402 | ) | (2,018 | ) | (1,457 | ) | |||||||
(Loss) income before income taxes | (4,955 | ) | 2,375 | (55,051 | ) | (18,577 | ) | ||||||||
Income tax benefit (expense) | 2,209 | (400 | ) | 19,840 | 6,490 | ||||||||||
Net (loss) income | $ | (2,746 | ) | $ | 1,975 | $ | (35,211 | ) | $ | (12,087 | ) | ||||
(Loss) earnings per common share: | |||||||||||||||
Basic (loss) earnings per common share | $ | (0.05 | ) | $ | 0.04 | $ | (0.63 | ) | $ | (0.22 | ) | ||||
Diluted (loss) earnings per common share | $ | (0.05 | ) | $ | 0.04 | $ | (0.63 | ) | $ | (0.22 | ) | ||||
Weighted average common shares: | |||||||||||||||
Weighted average common shares used in computing basic (loss) earnings per common share | 56,899 | 54,578 | 55,523 | 54,430 | |||||||||||
Weighted average common shares used in computing diluted (loss) earnings per common share | 56,899 | 54,947 | 55,523 | 54,430 | |||||||||||
See accompanying Notes to Unaudited Condensed Consolidated Financial Statements.
4
FLOTEK INDUSTRIES, INC.
UNAUDITED CONDENSED CONSOLIDATED STATEMENTS OF COMPREHENSIVE INCOME
(in thousands)
Three months ended September 30, | Nine months ended September 30, | ||||||||||||||
2016 | 2015 | 2016 | 2015 | ||||||||||||
Net (loss) income | $ | (2,746 | ) | $ | 1,975 | $ | (35,211 | ) | $ | (12,087 | ) | ||||
Other comprehensive income (loss): | |||||||||||||||
Foreign currency translation adjustment | (68 | ) | (366 | ) | 256 | (531 | ) | ||||||||
Comprehensive (loss) income | $ | (2,814 | ) | $ | 1,609 | $ | (34,955 | ) | $ | (12,618 | ) | ||||
See accompanying Notes to Unaudited Condensed Consolidated Financial Statements.
5
FLOTEK INDUSTRIES, INC.
UNAUDITED CONDENSED CONSOLIDATED STATEMENTS OF CASH FLOWS
(in thousands)
Nine months ended September 30, | |||||||
2016 | 2015 | ||||||
Cash flows from operating activities: | |||||||
Net loss | $ | (35,211 | ) | $ | (12,087 | ) | |
Adjustments to reconcile net loss to net cash (used in) provided by operating activities: | |||||||
Impairment of inventory and long-lived assets | 40,435 | 20,372 | |||||
Depreciation and amortization | 11,069 | 13,613 | |||||
Amortization of deferred financing costs | 308 | 260 | |||||
Gain on sale of assets | (1,094 | ) | (3,010 | ) | |||
Stock compensation expense | 9,479 | 10,479 | |||||
Deferred income tax benefit | (6,309 | ) | (8,696 | ) | |||
Reduction in (excess) tax benefit related to share-based awards | 883 | (2,154 | ) | ||||
Changes in current assets and liabilities: | |||||||
Accounts receivable, net | (3,744 | ) | 26,276 | ||||
Inventories | (4,108 | ) | (16,456 | ) | |||
Income taxes receivable | (13,687 | ) | (3,104 | ) | |||
Other current assets | (1,076 | ) | 1,402 | ||||
Accounts payable | 6,417 | (11,080 | ) | ||||
Accrued liabilities | (2,515 | ) | (1,462 | ) | |||
Income taxes payable | (1,807 | ) | 2,943 | ||||
Interest payable | 45 | — | |||||
Net cash (used in) provided by operating activities | (915 | ) | 17,296 | ||||
Cash flows from investing activities: | |||||||
Capital expenditures | (11,621 | ) | (11,078 | ) | |||
Proceeds from sale of assets | 1,201 | 3,225 | |||||
Payments for acquisition, net of cash acquired | (7,863 | ) | (1,250 | ) | |||
Purchase of patents and other intangible assets | (396 | ) | (434 | ) | |||
Net cash used in investing activities | (18,679 | ) | (9,537 | ) | |||
Cash flows from financing activities: | |||||||
Repayments of indebtedness | (15,398 | ) | (8,357 | ) | |||
Borrowings on revolving credit facility | 256,738 | 291,916 | |||||
Repayments on revolving credit facility | (249,324 | ) | (279,832 | ) | |||
Debt issuance costs | (147 | ) | (10 | ) | |||
(Reduction in) excess tax benefit related to share-based awards | (883 | ) | 2,154 | ||||
Purchase of treasury stock related to share-based awards | (925 | ) | (5,376 | ) | |||
Proceeds from sale of common stock | 30,610 | 779 | |||||
Repurchase of common stock | — | (7,299 | ) | ||||
Proceeds from exercise of stock options | 134 | 22 | |||||
Proceeds from noncontrolling interest | — | 7 | |||||
Net cash provided by (used in) financing activities | 20,805 | (5,996 | ) | ||||
Effect of changes in exchange rates on cash and cash equivalents | 55 | (31 | ) | ||||
Net increase in cash and cash equivalents | 1,266 | 1,732 | |||||
Cash and cash equivalents at the beginning of period | 2,208 | 1,266 | |||||
Cash and cash equivalents at the end of period | $ | 3,474 | $ | 2,998 | |||
See accompanying Notes to Unaudited Condensed Consolidated Financial Statements.
6
FLOTEK INDUSTRIES, INC.
UNAUDITED CONDENSED CONSOLIDATED STATEMENT OF EQUITY
(in thousands)
Common Stock | Treasury Stock | Additional Paid-in Capital | Accumulated Other Comprehensive Income (Loss) | Retained Earnings | Non-controlling Interests | Total Equity | |||||||||||||||||||||||||||
Shares Issued | Par Value | Shares | Cost | ||||||||||||||||||||||||||||||
Balance, December 31, 2015 | 56,220 | $ | 6 | 1,785 | $ | (17,869 | ) | $ | 273,451 | $ | (1,237 | ) | $ | 39,300 | $ | 358 | $ | 294,009 | |||||||||||||||
Net loss | — | — | — | — | — | — | (35,211 | ) | — | (35,211 | ) | ||||||||||||||||||||||
Foreign currency translation adjustment | — | — | — | — | — | 256 | — | — | 256 | ||||||||||||||||||||||||
Sale of common stock, net of issuance cost | 2,450 | — | — | — | 29,940 | — | — | — | 29,940 | ||||||||||||||||||||||||
Stock issued under employee stock purchase plan | — | — | (73 | ) | — | 670 | — | — | — | 670 | |||||||||||||||||||||||
Stock options exercised | 114 | — | — | — | 184 | — | — | — | 184 | ||||||||||||||||||||||||
Stock surrendered for exercise of stock options | — | — | 3 | (50 | ) | — | — | — | — | (50 | ) | ||||||||||||||||||||||
Restricted stock granted | 573 | — | — | — | — | — | — | — | — | ||||||||||||||||||||||||
Restricted stock forfeited | — | — | 89 | — | — | — | — | — | — | ||||||||||||||||||||||||
Treasury stock purchased | — | — | 90 | (925 | ) | — | — | — | — | (925 | ) | ||||||||||||||||||||||
Stock compensation expense | — | — | — | — | 9,461 | — | — | — | 9,461 | ||||||||||||||||||||||||
Reduction in tax benefit related to share-based awards | — | — | — | — | (883 | ) | — | — | — | (883 | ) | ||||||||||||||||||||||
Stock issued in IPI acquisition | 248 | — | — | — | 3,268 | — | — | — | 3,268 | ||||||||||||||||||||||||
Balance, September 30, 2016 | 59,605 | $ | 6 | 1,894 | $ | (18,844 | ) | $ | 316,091 | $ | (981 | ) | $ | 4,089 | $ | 358 | $ | 300,719 | |||||||||||||||
See accompanying Notes to Unaudited Condensed Consolidated Financial Statements.
7
FLOTEK INDUSTRIES, INC.
NOTES TO UNAUDITED CONDENSED CONSOLIDATED FINANCIAL STATEMENTS
Note 1 — Organization and Significant Accounting Policies
Organization and Nature of Operations
Flotek Industries, Inc. (“Flotek” or the “Company”) is a global, diversified, technology-driven supplier of energy chemistries and consumer and industrial chemistries and is a global developer and supplier of drilling, completion, and production technologies and related services.
The Company’s strategic focus includes energy related chemistry technologies, drilling and production technologies, and consumer and industrial chemistry technologies. Within its energy related technologies, the Company provides oilfield specialty chemistries and logistics, downhole drilling tools, and production related tools used in the energy and mining industries. Flotek’s products and services enable customers to drill wells more efficiently, to realize increased production from both new and existing wells, and to decrease future well operating costs. Major customers include leading oilfield service providers, pressure-pumping service companies, onshore and offshore drilling contractors, major and independent oil and gas exploration and production companies, national and state-owned oil companies, and international supply chain management companies. Within consumer and industrial chemistry technologies, the Company provides products for the flavor and fragrance industry and the industrial chemical industry. Major customers include food and beverage companies, fragrance companies, and companies providing household and industrial cleaning products.
The Company is headquartered in Houston, Texas, with operating locations in Colorado, Florida, Georgia, Louisiana, New Mexico, North Dakota, Oklahoma, Pennsylvania, Texas, Utah, Wyoming, Canada, the Netherlands, and the Middle East. Flotek’s products are marketed both domestically and internationally, with international presence and/or representation in over 20 countries.
Flotek was initially incorporated under the laws of the Province of British Columbia on May 17, 1985. On October 23, 2001, Flotek changed its corporate domicile to the state of Delaware.
Basis of Presentation
The accompanying Unaudited Condensed Consolidated Financial Statements and accompanying footnotes (collectively the “Financial Statements”) reflect all adjustments, in the opinion of management, necessary for fair presentation of the financial condition and results of operations for the periods presented. All such adjustments are normal and recurring in nature. The Financial Statements, including selected notes, have been prepared in accordance with applicable rules and regulations of the Securities and Exchange Commission (“SEC”) regarding interim financial reporting and do not include all information and disclosures required by accounting principles generally accepted in the United States of America (“U.S. GAAP”) for comprehensive financial statement reporting. These interim Financial Statements should be read in conjunction with the audited consolidated financial statements and notes included in the Company’s Annual Report on Form 10-K for the fiscal year ended December 31, 2015 (“Annual Report”). A copy of the Annual Report is available on the SEC’s website, www.sec.gov, under the Company’s ticker symbol (“FTK”) or on Flotek’s website, www.flotekind.com. The results of operations for the three and nine months ended September 30, 2016, are not necessarily indicative of the results to be expected for the year ending December 31, 2016.
Use of Estimates
The preparation of financial statements in conformity with U.S. GAAP requires management to make estimates and assumptions that affect reported amounts of assets and liabilities, disclosure of contingent assets and liabilities, and reported amounts of revenue and expenses. Actual results could differ from these estimates.
Reclassifications
Certain prior period amounts have been reclassified to conform to the current period presentation. The reclassifications did not impact net income (loss).
8
FLOTEK INDUSTRIES, INC.
NOTES TO UNAUDITED CONDENSED CONSOLIDATED FINANCIAL STATEMENTS
Note 2 — Recent Accounting Pronouncements
Application of New Accounting Standards
Effective January 1, 2016, the Company adopted the accounting guidance in Accounting Standards Update (“ASU”) No. 2015-01, “Simplifying Income Statement Presentation by Eliminating the Concept of Extraordinary Items.” This ASU eliminates from U.S. GAAP the concept of extraordinary items and the need for an entity to separately classify, present, and disclose extraordinary events and transactions, while retaining certain presentation and disclosure guidance for items that are unusual in nature or occur infrequently. Implementation of this standard did not have a material effect on the consolidated financial statements and related disclosures.
Effective January 1, 2016, the Company adopted the accounting guidance in ASU No. 2015-02, “Amendments to the Consolidation Analysis.” The amendment eliminates the deferral of certain consolidation standards for entities considered to be investment companies and modifies the consolidation analysis performed on certain types of legal entities. Implementation of this standard did not have a material effect on the consolidated financial statements and related disclosures.
Effective January 1, 2016, the Company adopted the accounting guidance in ASU No. 2015-03, “Simplifying the Presentation of Debt Issuance Costs.” The accounting guidance requires that debt issuance costs related to a recognized debt liability be reported on the Consolidated Statements of Financial Condition as a direct deduction from the carrying amount of that debt liability. In addition, the Company adopted the accounting guidance in ASU No. 2015-15, which provides additional guidance related to the presentation or subsequent measurement of debt issuance costs related to line-of-credit arrangements. An entity may present debt issuance costs as an asset and subsequently amortize the deferred debt issuance costs ratably over the term of the line-of-credit arrangement, regardless of whether there are any outstanding borrowings. Implementation of these standards did not have a material effect on the consolidated financial statements and related disclosures.
Effective January 1, 2016, the Company adopted the accounting guidance in ASU No. 2015-16, “Simplifying the Accounting for Measurement-Period Adjustments.” This standard replaces the requirement that an acquirer in a business combination account for measurement period adjustments retrospectively with a requirement that an acquirer recognize adjustments to the provisional amounts that are identified during the measurement period in the reporting period in which the adjustment amounts are determined. The acquirer is required to record, in the same period’s financial statements, the effect on earnings of changes in depreciation, amortization, or other income effects, if any, as a result of the change to the provisional amounts, calculated as if the accounting had been completed at the acquisition date. The guidance is to be applied prospectively to adjustments to provisional amounts that occur after the effective date of the guidance. Implementation of this standard did not have a material effect on the consolidated financial statements and related disclosures.
New Accounting Requirements and Disclosures
In May 2014, the Financial Accounting Standards Board (“FASB”) issued ASU No. 2014-09, “Revenue from Contracts with Customers.” The ASU will supersede most of the existing revenue recognition requirements in U.S. GAAP and will require entities to recognize revenue at an amount that reflects the consideration to which the Company expects to be entitled in exchange for transferring goods or services to a customer. The new standard also requires significantly expanded disclosures regarding the qualitative and quantitative information of an entity’s nature, amount, timing, and uncertainty of revenue and cash flows arising from contracts with customers. In August 2015, the FASB issued ASU No. 2015-14, which deferred the effective date by one year to annual reporting periods beginning after December 15, 2017, including interim periods within that reporting period. Early adoption is permitted, but not before the original effective date of reporting periods beginning after December 15, 2016. In March 2016, the FASB issued ASU No. 2016-08, which improves the operability and understandability of the implementation guidance on principal versus agent considerations. In April 2016, the FASB issued ASU No. 2016-10, which clarifies identifying performance obligations and the licensing implementation guidance. In May 2016, the FASB issued ASU No. 2016-11, which rescinds certain SEC Staff Observer comments that are codified in Topic 605, Revenue Recognition, effective upon adoption of ASU 2014-09, and ASU No. 2016-12, which reduces the potential for diversity in practice at initial application and reduces the cost and complexity of applying Topic 606 both at transition and on an ongoing basis. The Company is currently evaluating the impact these pronouncements will have on the consolidated financial statements and related disclosures.
In July 2015, the FASB issued ASU No. 2015-11, “Simplifying the Measurement of Inventory.” This standard requires management to measure inventory at the lower of cost or net realizable value. Net realizable value is the estimated selling prices in the ordinary course of business, less reasonably predictable costs of completion, disposal, and transportation. The pronouncement is effective for annual reporting periods beginning after December 15, 2016, including interim periods within that reporting period and should be applied retrospectively, with early application permitted. The Company is currently evaluating the impact the pronouncement will have on the consolidated financial statements and related disclosures.
9
FLOTEK INDUSTRIES, INC.
NOTES TO UNAUDITED CONDENSED CONSOLIDATED FINANCIAL STATEMENTS
In November 2015, the FASB issued ASU 2015-17, “Balance Sheet Classification of Deferred Taxes.” This standard eliminates the current requirement for organizations to present deferred tax assets and liabilities as current and noncurrent in a classified balance sheet. Instead, organizations will be required to classify all deferred tax assets and liabilities as noncurrent. The pronouncement is effective for annual reporting periods beginning after December 15, 2016, including interim periods within that reporting period. The Company is currently evaluating the impact the pronouncement will have on the consolidated financial statements and related disclosures.
In February 2016, the FASB issued ASU No. 2016-02, “Leases.” This standard requires the recognition of lease assets and lease liabilities by lessees for those leases classified as operating leases under previous U.S. GAAP. The pronouncement is effective for annual reporting periods beginning after December 15, 2018, including interim periods within that reporting period and should be applied using a modified retrospective transition approach, with early application permitted. The Company is currently evaluating the impact the pronouncement will have on the consolidated financial statements and related disclosures.
In March 2016, the FASB issued ASU No. 2016-09, “Improvements to Employee Share-Based Payment Accounting.” This standard simplifies several aspects of the accounting for share-based payment transactions, including the income tax consequences, classification of awards as either equity or liabilities, and classification on the statement of cash flows. The pronouncement is effective for annual reporting periods beginning after December 15, 2016, including interim periods within those annual periods, with early adoption permitted. The Company is currently evaluating the impact the pronouncement will have on the consolidated financial statements and related disclosures.
In June 2016, the FASB issued ASU No. 2016-13, “Measurement of Credit Losses on Financial Instruments.” This standard replaces the incurred loss impairment methodology in current U.S. GAAP with a methodology that reflects expected credit losses and requires consideration of a broader range of reasonable and supportable information to inform credit loss estimates. The pronouncement is effective for fiscal years beginning after December 15, 2019, including interim periods within those fiscal years, with early adoption for the fiscal years beginning after December 15, 2018, including interim periods within those fiscal years. The Company is currently evaluating the impact the pronouncement will have on the consolidated financial statements and related disclosures.
In August 2016, the FASB issued ASU No 2016-15, “Classification of Certain Cash Receipts and Cash Payments.” This standard addresses eight specific cash flow issues with the objective of reducing the existing diversity in practice. The pronouncement is effective for fiscal years beginning after December 15, 2017, including interim periods within those fiscal years, with early adoption permitted. The Company is currently evaluating the impact the pronouncement will have on the consolidated financial statements and related disclosures.
Note 3 — Impairment of Inventory and Long-Lived Assets
During the three months ended March 31, 2016, as a result of changes in the oil and gas industry that occurred since the beginning of 2016 and the corresponding impact on the Company’s business outlook, the Company evaluated the direction of its business activities. Crude oil prices, which appeared to have stabilized during the fourth quarter of 2015, fell further during the first quarter of 2016, decreasing approximately 21% from average prices seen in the fourth quarter of 2015. The U.S. drilling rig count declined from 698 at December 31, 2015 to 450 at April 1, 2016, a decline of 35.5%.
Due to the decreased rig activity and its impact on management’s expectations for future market activity, the Company further refocused operations of its Drilling Technologies segment. The Company decided to exit the business of building and repairing motors in all domestic markets. In addition, changes in drilling technique, including further escalation of the move to a dominance of pad drilling, reduced the marketability of certain other inventory items. The focus of the Production Technologies segment is being shifted to its new technologies for electric submersible pumps for the oil and gas industry and for hydraulic pumping units. Inventory associated with older technologies for these items has been evaluated for impairment. As a result of these changes in focus and projected declines in asset utilization, the Company recorded a pre-tax impairment of inventories as noted below.
Changes in the business climate noted above and increasing operating losses experienced within the Drilling Technologies and Production Technologies segments during the three months ended March 31, 2016, caused the Company to test asset groups within these two segments for recoverability. Recoverability of the carrying value of the asset groups was based upon estimated future cash flows while taking into consideration various assumptions and estimates, including future use of the assets, remaining useful life of the assets, and eventual disposition of the assets. Undiscounted estimated cash flows of two asset groups associated with domestic operations in the Drilling Technologies segment did not exceed the carrying value of the respective asset groups. Therefore, the Company performed an analysis of discounted future cash flows to determine the fair value of each of these two asset groups. As a result of this testing, the Company recorded a pre-tax impairment of long-lived assets as noted below.
10
FLOTEK INDUSTRIES, INC.
NOTES TO UNAUDITED CONDENSED CONSOLIDATED FINANCIAL STATEMENTS
In addition, during the three months ended June 30, 2015, as a result of decreased rig activity and its impact on management’s expectations for future market activity, the Company refocused the Drilling Technologies segment to businesses and markets that have the best opportunity for profitable growth in the future. In addition, the Company shifted the focus of the Production Technologies segment to oil production markets and away from coal bed methane markets. As a result of these changes in focus and projected declines in asset utilization, the Company recorded pre-tax impairment charges as noted below.
The Company recorded impairment charges during the three months ended March 31, 2016 and June 30, 2015, as follows (in thousands):
Three months ended | |||||||
March 31, 2016 | June 30, 2015 | ||||||
Drilling Technologies: | |||||||
Inventories | $ | 12,653 | $ | 17,241 | |||
Long-lived assets: | |||||||
Property and equipment | 14,642 | 2,327 | |||||
Intangible assets other than goodwill | 9,227 | — | |||||
Production Technologies: | |||||||
Inventories | 3,913 | 804 | |||||
Total Impairment | $ | 40,435 | $ | 20,372 | |||
Based on the changes in the business climate discussed above and continuing operating losses experienced during the three months ended March 31, 2016, June 30, 2016, and September 30, 2016, goodwill within the Teledrift and Production Technologies reporting units was tested for impairment. However, no impairments of goodwill were recorded based upon this testing.
Note 4 — Acquisitions
On July 27, 2016, the Company acquired 100% of the stock and interests in International Polymerics, Inc. (“IPI”) and related entities for $7.9 million in cash consideration, net of cash acquired, and 247,764 shares of the Company’s common stock. IPI is a U.S. based manufacturer of high viscosity guar gum and guar slurry for the oil and gas industry with a wide selection of stimulation chemicals.
On January 27, 2015, the Company acquired 100% of the assets of International Artificial Lift, LLC (“IAL”) for $1.3 million in cash consideration and 60,024 shares of the Company’s common stock. IAL specializes in the design, manufacturing and service of next-generation hydraulic pumping units that serve to increase and maximize production for oil and natural gas wells.
Note 5 — Supplemental Cash Flow Information
Supplemental cash flow information is as follows (in thousands):
Nine months ended September 30, | |||||||
2016 | 2015 | ||||||
Supplemental non-cash investing and financing activities: | |||||||
Value of common stock issued in acquisitions | $ | 3,268 | $ | 1,014 | |||
Exercise of stock options by common stock surrender | 50 | 1,126 | |||||
Supplemental cash payment information: | |||||||
Interest paid | $ | 1,459 | $ | 1,043 | |||
Income taxes paid, net of refunds | 1,663 | 3,044 | |||||
11
FLOTEK INDUSTRIES, INC.
NOTES TO UNAUDITED CONDENSED CONSOLIDATED FINANCIAL STATEMENTS
Note 6 — Revenue
The Company differentiates revenue and cost of revenue based on whether the source of revenue is attributable to products, rentals, or services. Revenue and cost of revenue by source are as follows (in thousands):
Three months ended September 30, | Nine months ended September 30, | ||||||||||||||
2016 | 2015 | 2016 | 2015 | ||||||||||||
Revenue: | |||||||||||||||
Products | $ | 67,176 | $ | 76,555 | $ | 200,206 | $ | 217,237 | |||||||
Rentals | 4,168 | 7,574 | 11,366 | 28,146 | |||||||||||
Services | 2,335 | 3,813 | 6,715 | 11,963 | |||||||||||
$ | 73,679 | $ | 87,942 | $ | 218,287 | $ | 257,346 | ||||||||
Cost of revenue: | |||||||||||||||
Products | $ | 44,073 | $ | 49,520 | $ | 131,464 | $ | 145,387 | |||||||
Rentals | 1,379 | 3,387 | 3,704 | 13,315 | |||||||||||
Services | 2,018 | 2,160 | 5,730 | 6,283 | |||||||||||
Depreciation | 843 | 1,648 | 3,173 | 5,355 | |||||||||||
$ | 48,313 | $ | 56,715 | $ | 144,071 | $ | 170,340 | ||||||||
Note 7 — Inventories
Inventories are as follows (in thousands):
September 30, 2016 | December 31, 2015 | ||||||
Raw materials | $ | 33,724 | $ | 44,997 | |||
Work-in-process | 3,023 | 3,069 | |||||
Finished goods | 37,239 | 37,426 | |||||
Inventories | $ | 73,986 | $ | 85,492 | |||
During the three months ended March 31, 2016 and June 30, 2015, the Company recorded an inventory impairment of $16.6 million and $18.0 million, respectively (see Note 3).
Note 8 — Property and Equipment
Property and equipment are as follows (in thousands):
September 30, 2016 | December 31, 2015 | ||||||
Land | $ | 7,746 | $ | 7,145 | |||
Buildings and leasehold improvements | 51,495 | 34,351 | |||||
Machinery, equipment and rental tools | 65,798 | 85,611 | |||||
Equipment in progress | 4,113 | 12,304 | |||||
Furniture and fixtures | 2,736 | 2,749 | |||||
Transportation equipment | 7,554 | 7,462 | |||||
Computer equipment and software | 12,057 | 11,382 | |||||
Property and equipment | 151,499 | 161,004 | |||||
Less accumulated depreciation | (62,345 | ) | (69,091 | ) | |||
Property and equipment, net | $ | 89,154 | $ | 91,913 | |||
During the three months ended March 31, 2016 and June 30, 2015, the Company recorded a fixed asset impairment of $14.6 million and $2.3 million, respectively (see Note 3).
Depreciation expense, including expense recorded in cost of revenue, totaled $2.6 million and $3.2 million for the three months ended September 30, 2016 and 2015, respectively, and $8.0 million and $10.0 million for the nine months ended September 30, 2016 and 2015, respectively.
12
FLOTEK INDUSTRIES, INC.
NOTES TO UNAUDITED CONDENSED CONSOLIDATED FINANCIAL STATEMENTS
Note 9 — Goodwill
Changes in the carrying value of goodwill for each reporting unit are as follows (in thousands):
Energy Chemistry Technologies | Consumer and Industrial Chemistry Technologies | Teledrift | Production Technologies | Total | |||||||||||||||
Balance at December 31, 2015 | $ | 36,318 | $ | 19,480 | $ | 15,333 | $ | 1,689 | $ | 72,820 | |||||||||
Addition upon acquisition of IPI | 862 | — | — | — | 862 | ||||||||||||||
Balance at September 30, 2016 | $ | 37,180 | $ | 19,480 | $ | 15,333 | $ | 1,689 | $ | 73,682 | |||||||||
Goodwill within the Teledrift and Production Technologies reporting units was tested for impairment during the three months ended March 31, 2016, June 30, 2016, and September 30, 2016. No impairments of goodwill were recognized during the three and nine months ended September 30, 2016 and 2015 (see Note 3).
Note 10 — Other Intangible Assets
Other intangible assets are as follows (in thousands):
September 30, 2016 | December 31, 2015 | ||||||||||||||
Cost | Accumulated Amortization | Cost | Accumulated Amortization | ||||||||||||
Finite-lived intangible assets: | |||||||||||||||
Patents and technology | $ | 19,406 | $ | 5,707 | $ | 20,960 | $ | 5,809 | |||||||
Customer lists | 42,287 | 12,192 | 52,607 | 14,640 | |||||||||||
Trademarks and brand names | 4,190 | 2,286 | 7,191 | 3,360 | |||||||||||
Total finite-lived intangible assets acquired | 65,883 | 20,185 | 80,758 | 23,809 | |||||||||||
Deferred financing costs | 2,787 | 1,166 | 1,665 | 858 | |||||||||||
Total amortizable intangible assets | 68,670 | $ | 21,351 | 82,423 | $ | 24,667 | |||||||||
Indefinite-lived intangible assets: | |||||||||||||||
Trademarks and brand names | 11,630 | 11,630 | |||||||||||||
Total other intangible assets | $ | 80,300 | $ | 94,053 | |||||||||||
Carrying value: | |||||||||||||||
Other intangible assets, net | $ | 58,949 | $ | 69,386 | |||||||||||
Finite-lived intangible assets acquired are amortized on a straight-line basis over two to 20 years. Amortization of finite-lived intangible assets acquired totaled $0.9 million and $1.2 million for the three months ended September 30, 2016 and 2015, respectively, and $3.1 million and $3.6 million for the nine months ended September 30, 2016 and 2015, respectively.
During the three months ended March 31, 2016, the Company recorded an impairment of finite-lived intangible assets of $9.2 million (see Note 3).
Amortization of deferred financing costs was $0.1 million and $0.1 million for the three months ended September 30, 2016 and 2015, respectively, and $0.3 million and $0.3 million for the nine months ended September 30, 2016 and 2015, respectively.
13
FLOTEK INDUSTRIES, INC.
NOTES TO UNAUDITED CONDENSED CONSOLIDATED FINANCIAL STATEMENTS
Note 11 — Long-Term Debt and Credit Facility
Long-term debt is as follows (in thousands):
September 30, 2016 | December 31, 2015 | ||||||
Long-term debt: | |||||||
Borrowings under revolving credit facility | $ | 32,562 | $ | 25,148 | |||
Term loan | 10,000 | 25,398 | |||||
Total long-term debt | 42,562 | 50,546 | |||||
Less current portion of long-term debt | (34,562 | ) | (32,291 | ) | |||
Long-term debt, less current portion | $ | 8,000 | $ | 18,255 | |||
Credit Facility
On May 10, 2013, the Company and certain of its subsidiaries (the “Borrowers”) entered into an Amended and Restated Revolving Credit, Term Loan and Security Agreement (the “Credit Facility”) with PNC Bank, National Association (“PNC Bank”). The Company may borrow under the Credit Facility for working capital, permitted acquisitions, capital expenditures and other corporate purposes. Under terms of the Credit Facility, as amended, the Company has total borrowing availability of $65 million under a revolving credit facility and a term loan.
The Credit Facility is secured by substantially all of the Company’s domestic real and personal property, including accounts receivable, inventory, land, buildings, equipment and other intangible assets. The Credit Facility contains customary representations, warranties, and both affirmative and negative covenants. The Credit Facility restricts the payment of cash dividends on common stock and limits the amount that may be used to repurchase common stock and preferred stock. In the event of default, PNC Bank may accelerate the maturity date of any outstanding amounts borrowed under the Credit Facility.
Effective September 30, 2016, the Company entered into a Sixth Amendment to the Credit Facility which extended its term by two years through May 10, 2020 and set total borrowing capacity at $65 million. Initially, the Company (a) may borrow up to $55 million under a revolving credit facility and (b) has borrowed $10 million under a term loan. The revolving credit facility limit will increase by each term loan principal payment, therefore, total borrowing capacity will remain at $65 million throughout the term of the Credit Facility.
The Sixth Amendment to the Credit Facility contains financial covenants to maintain a fixed charge coverage ratio and a leverage ratio, as well as establishes an annual limit on capital expenditures. The fixed charge coverage ratio is the ratio of (a) adjusted earnings before interest, taxes, depreciation, and amortization (“EBITDA”) less cash taxes paid during the period to (b) all debt payments during such period. The fixed charge coverage ratio requirement begins for the quarter ending March 31, 2017 at 1.00 to 1.00 and increases to 1.10 to 1.00 for the year ending December 31, 2017 and thereafter. The leverage ratio (funded debt to adjusted EBITDA) requirement begins for the six months ending June 30, 2017 at not greater than 5.5 to 1.0 and reduces to not greater than 4.0 to 1.0 for the year ending March 31, 2018 and thereafter. The annual limit on capital expenditures is $20 million. Both the fixed charge coverage ratio and the annual limit on capital expenditures are affected if the undrawn availability of the revolving credit facility falls below $15 million.
The Credit Facility includes a provision, effective beginning in 2017, that 25% of EBITDA minus cash paid for taxes, dividends, debt payments, and unfunded capital expenditures, not to exceed $3.0 million for any year, be paid on the outstanding balance of the term loan within 60 days of the fiscal year end.
Each of the Company’s domestic and foreign subsidiaries is fully obligated for Credit Facility indebtedness as a Borrower or as a guarantor.
(a) Revolving Credit Facility
Under the revolving credit facility, the Company may initially borrow up to $55 million through May 10, 2020. This includes a sublimit of $10 million that may be used for letters of credit. The revolving credit facility limit will increase by each term principal payment. The revolving credit facility is secured by substantially all of the Company’s domestic and Canadian accounts receivable and inventory.
At September 30, 2016, eligible accounts receivable and inventory securing the revolving credit facility provided total borrowing capacity of $54.9 million under the revolving credit facility. Available borrowing capacity, net of outstanding borrowings, was $22.3 million at September 30, 2016.
14
FLOTEK INDUSTRIES, INC.
NOTES TO UNAUDITED CONDENSED CONSOLIDATED FINANCIAL STATEMENTS
The interest rate on advances under the revolving credit facility varies based on the fixed charge coverage ratio. Rates range (a) between PNC Bank’s base lending rate plus 1.5% to 2.0% or (b) between the London Interbank Offered Rate (LIBOR) plus 2.5% to 3.0%. PNC Bank’s base lending rate was 3.50% at September 30, 2016. The Company is required to pay a monthly facility fee of 0.25% per annum, on any unused amount under the commitment based on daily averages. At September 30, 2016, $32.6 million was outstanding under the revolving credit facility, with $2.6 million borrowed as base rate loans at an interest rate of 5.50% and $30.0 million borrowed as LIBOR loans at an interest rate of 3.78%.
Borrowing under the revolving credit agreement is classified as current debt as a result of the required lockbox arrangement and the subjective acceleration clause.
(b) Term Loan
The amount borrowed under the term loan was reset to $10 million effective as of September 30, 2016. Monthly principal payments of $0.2 million are required. The unpaid balance of the term loan is due May 10, 2020. Prepayments are permitted, and may be required in certain circumstances. Amounts repaid under the term loan will be added to the borrowing availability under the revolving credit facility. The term loan is secured by substantially all of the Company’s domestic land, buildings, equipment, and other intangible assets.
The interest rate on the term loan varies based on the fixed charge coverage ratio. Rates range (a) between PNC Bank’s base lending rate plus 2.25% to 2.75% or (b) between LIBOR plus 3.25% to 3.75%. At September 30, 2016, $10.0 million was outstanding under the term loan, with $1.0 million borrowed as base rate loans at an interest rate of 6.25% and $9.0 million borrowed as LIBOR loans at an interest rate of 4.28%.
Note 12 — (Loss) Earnings Per Share
Basic (loss) earnings per common share is calculated by dividing net (loss) income by the weighted average number of common shares outstanding for the period. Diluted (loss) earnings per common share is calculated by dividing net (loss) income by the weighted average number of common shares outstanding combined with dilutive common share equivalents outstanding, if the effect is dilutive.
Potentially dilutive securities were excluded from the calculation of diluted loss per share for the three months ended September 30, 2016 and the three and nine months ended September 30, 2016 and 2015, since including them would have an anti-dilutive effect on loss per share due to the net loss incurred during the period. Securities convertible into shares of common stock that were not considered in the diluted loss per share calculations were 0.7 million stock options and 0.8 million restricted stock units for the three and nine months ended September 30, 2016 and 0.8 million stock options and 0.4 million restricted stock units for the nine months ended September 30, 2015.
Basic and diluted (loss) earnings per common share are as follows (in thousands, except per share data):
Three months ended September 30, | Nine months ended September 30, | ||||||||||||||
2016 | 2015 | 2016 | 2015 | ||||||||||||
Net (loss) income - Basic and Diluted | $ | (2,746 | ) | $ | 1,975 | $ | (35,211 | ) | $ | (12,087 | ) | ||||
Weighted average common shares outstanding - Basic | 56,899 | 54,578 | 55,523 | 54,430 | |||||||||||
Assumed conversions: | |||||||||||||||
Incremental common shares from stock options | — | 345 | — | — | |||||||||||
Incremental common shares from restricted stock units | — | 24 | — | — | |||||||||||
Weighted average common shares outstanding - Diluted | 56,899 | 54,947 | 55,523 | 54,430 | |||||||||||
Basic (loss) earnings per common share | $ | (0.05 | ) | $ | 0.04 | $ | (0.63 | ) | $ | (0.22 | ) | ||||
Diluted (loss) earnings per common share | $ | (0.05 | ) | $ | 0.04 | $ | (0.63 | ) | $ | (0.22 | ) | ||||
15
FLOTEK INDUSTRIES, INC.
NOTES TO UNAUDITED CONDENSED CONSOLIDATED FINANCIAL STATEMENTS
Note 13 — Fair Value Measurements
Fair value is defined as the amount that would be received for selling an asset or paid to transfer a liability in an orderly transaction between market participants at the measurement date. The Company categorizes financial assets and liabilities into the three levels of the fair value hierarchy. The hierarchy prioritizes the inputs to valuation techniques used to measure fair value and bases categorization within the hierarchy on the lowest level of input that is available and significant to the fair value measurement.
• | Level 1 — Quoted prices in active markets for identical assets or liabilities; |
• | Level 2 — Observable inputs other than Level 1, such as quoted prices for similar assets or liabilities, quoted prices in markets that are not active, or other inputs that are observable or can be corroborated by observable market data for substantially the full term of the assets or liabilities; and |
• | Level 3 — Significant unobservable inputs that are supported by little or no market activity or that are based on the reporting entity’s assumptions about the inputs. |
Fair Value of Other Financial Instruments
The carrying amounts of certain financial instruments, including cash and cash equivalents, accounts receivable, accounts payable, and accrued expenses, approximate fair value due to the short-term nature of these accounts. The Company had no cash equivalents at September 30, 2016, or December 31, 2015.
The carrying value and estimated fair value of the Company’s long-term debt are as follows (in thousands):
September 30, 2016 | December 31, 2015 | ||||||||||||||
Carrying Value | Fair Value | Carrying Value | Fair Value | ||||||||||||
Term loan | $ | 10,000 | $ | 10,000 | $ | 25,398 | $ | 25,398 | |||||||
Borrowings under revolving credit facility | 32,562 | 32,562 | 25,148 | 25,148 | |||||||||||
The carrying value of the term loan and borrowings under the revolving credit facility approximate their fair value because the interest rates are variable.
Assets Measured at Fair Value on a Nonrecurring Basis
The Company’s non-financial assets, including property and equipment, goodwill, and other intangible assets are measured at fair value on a non-recurring basis and are subject to fair value adjustment in certain circumstances. During the three months ended March 31, 2016, the Company recorded an impairment of $14.6 million for property and equipment and $9.2 million for other intangible assets (see Note 3). During the three months ended June 30, 2015, the Company recorded an impairment of $2.3 million for property and equipment (see Note 3). Loss on impairment is reported in operating expenses. No impairments of property and equipment or other intangible assets were recognized during the three months ended September 30, 2016, and no impairments of other intangible assets were recognized during the three and nine months ended September 30, 2015. No impairments of goodwill were recognized during the three and nine months ended September 30, 2016 and 2015.
Note 14 — Income Taxes
During the year ended December 31, 2015, the Company restructured its legal entities such that there will be only one U.S. tax filing group filing a single U.S. consolidated federal income tax return beginning in 2016. Prior to 2016, the Company’s corporate organizational structure required the filing of two separate consolidated U.S. Federal income tax returns. Taxable income of one group could not be offset by tax attributes, including net operating losses, of the other group.
16
FLOTEK INDUSTRIES, INC.
NOTES TO UNAUDITED CONDENSED CONSOLIDATED FINANCIAL STATEMENTS
A reconciliation of the U.S. federal statutory tax rate to the Company’s effective income tax rate is as follows:
Three months ended September 30, | Nine months ended September 30, | ||||||||||
2016 | 2015 | 2016 | 2015 | ||||||||
U.S. federal statutory tax rate | (35.0 | )% | 35.0 | % | (35.0 | )% | (35.0 | )% | |||
State income taxes, net of federal benefit | 3.8 | 5.7 | (0.7 | ) | 1.8 | ||||||
Non-U.S. income taxed at different rates | (12.6 | ) | (29.1 | ) | (1.2 | ) | (4.2 | ) | |||
Non-deductible expenses | — | 0.2 | — | 2.4 | |||||||
Domestic production activities deduction | — | 3.6 | — | — | |||||||
Other | (0.8 | ) | 1.4 | 0.9 | 0.1 | ||||||
Effective income tax rate | (44.6 | )% | 16.8 | % | (36.0 | )% | (34.9 | )% | |||
Fluctuations in effective tax rates have historically been impacted by permanent tax differences with no associated income tax impact, changes in state apportionment factors, including the effect on state deferred tax assets and liabilities, and benefits of non-U.S. income taxed at lower rates. Changes in the effective tax rate during the three months ended September 30, 2015, included the Company no longer qualifying for the domestic production activities deduction due to its pretax loss position.
Deferred taxes are presented in the balance sheets as follows (in thousands):
September 30, 2016 | December 31, 2015 | ||||||
Current deferred tax assets | $ | 2,352 | $ | 2,649 | |||
Non-current deferred tax assets | — | 17,229 | |||||
Non-current deferred tax liabilities | (1,205 | ) | (23,823 | ) | |||
Net deferred tax assets (liabilities) | $ | 1,147 | $ | (3,945 | ) | ||
Note 15 — Common Stock
The Company’s Certificate of Incorporation, as amended November 9, 2009, authorizes the Company to issue up to 80 million shares of common stock, par value $0.0001 per share, and 100,000 shares of one or more series of preferred stock, par value $0.0001 per share.
A reconciliation of changes in shares of the Company’s common stock issued during the nine months ended September 30, 2016 is as follows:
Shares issued at December 31, 2015 | 56,220,214 | |
Issued in sale of common stock | 2,450,339 | |
Issued to purchase IPI | 247,764 | |
Issued as restricted stock award grants | 572,240 | |
Issued upon exercise of stock options | 114,112 | |
Shares issued at September 30, 2016 | 59,604,669 | |
Stock Repurchase Program
In November 2012, the Company’s Board of Directors authorized the repurchase of up to $25 million of the Company’s common stock. Repurchases may be made in the open market or through privately negotiated transactions. During the three and nine months ended September 30, 2016, the Company did not repurchase any shares of its outstanding common stock. During the three months ended September 30, 2015, the Company repurchased 2,404 shares of its outstanding common stock on the open market at an average price of $16.44 per share, inclusive of transaction costs. During the nine months ended September 30, 2015, the Company repurchased a total of 549,723 shares of its outstanding common stock on the open market at a cost of $7.3 million, inclusive of transaction costs, or an average price of $13.28 per share.
In June 2015, the Company’s Board of Directors authorized the repurchase of up to an additional $50 million of the Company’s common stock. Repurchases may be made in the open market or through privately negotiated transactions. Through September 30, 2016, the Company has not repurchased any of its common stock under this authorization.
17
FLOTEK INDUSTRIES, INC.
NOTES TO UNAUDITED CONDENSED CONSOLIDATED FINANCIAL STATEMENTS
As of September 30, 2016, the Company has $54.9 million remaining under its share repurchase programs. A covenant under the Company’s Credit Facility limits the amount that may be used to repurchase the Company’s common stock. As of September 30, 2016, this covenant limits additional share repurchases to $4.9 million.
Note 16 — Business Segment, Geographic and Major Customer Information
Segment Information
Operating segments are defined as components of an enterprise for which separate financial information is available that is regularly evaluated by chief operating decision-makers in deciding how to allocate resources and assess performance. The operations of the Company are categorized into four reportable segments: Energy Chemistry Technologies, Consumer and Industrial Chemistry Technologies, Drilling Technologies, and Production Technologies.
• | Energy Chemistry Technologies designs, develops, manufactures, packages, and markets specialty chemistries used in oil and natural gas well drilling, cementing, completion, and stimulation. In addition, the Company’s chemistries are used in specialized enhanced and improved oil recovery markets. Activities in this segment also include construction and management of automated material handling facilities and management of loading facilities and blending operations for oilfield services companies. |
• | Consumer and Industrial Chemistry Technologies designs, develops, and manufactures products that are sold to companies in the flavor and fragrance industries and the specialty chemical industry. These technologies are used by beverage and food companies, fragrance companies, and companies providing household and industrial cleaning products. |
• | Drilling Technologies rents, sells, inspects, manufactures, and markets downhole drilling equipment used in energy, mining, and industrial drilling activities. |
• | Production Technologies assembles and markets production-related equipment, including the Petrovalve® product line of rod pump components, hydraulic pumping units, electric submersible pumps, gas separators, valves, and services that support natural gas and oil production activities. |
The Company evaluates performance based upon a variety of criteria. The primary financial measure is segment operating income. Various functions, including certain sales and marketing activities and general and administrative activities, are provided centrally by the corporate office. Costs associated with corporate office functions, other corporate income and expense items, and income taxes are not allocated to reportable segments.
Summarized financial information of the reportable segments is as follows (in thousands):
As of and for the three months ended September 30, | Energy Chemistry Technologies | Consumer and Industrial Chemistry Technologies | Drilling Technologies | Production Technologies | Corporate and Other | Total | |||||||||||||||||
2016 | |||||||||||||||||||||||
Net revenue from external customers | $ | 45,030 | $ | 19,306 | $ | 7,198 | $ | 2,145 | $ | — | $ | 73,679 | |||||||||||
Gross profit | 18,180 | 4,174 | 2,908 | 104 | — | 25,366 | |||||||||||||||||
Income (loss) from operations | 6,196 | 2,433 | (924 | ) | (1,118 | ) | (10,882 | ) | (4,295 | ) | |||||||||||||
Depreciation and amortization | 1,582 | 567 | 599 | 220 | 581 | 3,549 | |||||||||||||||||
Total assets | 172,456 | 101,921 | 67,655 | 23,235 | 17,273 | 382,540 | |||||||||||||||||
Capital expenditures | 2,005 | 148 | 234 | 51 | 227 | 2,665 | |||||||||||||||||
2015 | |||||||||||||||||||||||
Net revenue from external customers | $ | 60,181 | $ | 13,867 | $ | 10,812 | $ | 3,082 | $ | — | $ | 87,942 | |||||||||||
Gross profit | 24,257 | 3,082 | 3,302 | 586 | — | 31,227 | |||||||||||||||||
Income (loss) from operations | 14,283 | 1,728 | (2,614 | ) | (823 | ) | (9,797 | ) | 2,777 | ||||||||||||||
Depreciation and amortization | 1,200 | 548 | 2,038 | 212 | 435 | 4,433 | |||||||||||||||||
Total assets | 152,430 | 90,948 | 110,872 | 26,564 | 20,131 | 400,945 | |||||||||||||||||
Capital expenditures | 1,467 | 18 | — | 107 | 523 | 2,115 | |||||||||||||||||
18
FLOTEK INDUSTRIES, INC.
NOTES TO UNAUDITED CONDENSED CONSOLIDATED FINANCIAL STATEMENTS
As of and for the nine months ended September 30, | Energy Chemistry Technologies | Consumer and Industrial Chemistry Technologies | Drilling Technologies | Production Technologies | Corporate and Other | Total | |||||||||||||||||
2016 | |||||||||||||||||||||||
Net revenue from external customers | $ | 133,094 | $ | 59,133 | $ | 20,026 | $ | 6,034 | $ | — | $ | 218,287 | |||||||||||
Gross profit | 54,609 | 13,256 | 6,150 | 201 | — | 74,216 | |||||||||||||||||
Income (loss) from operations | 21,793 | 8,508 | (43,493 | ) | (7,810 | ) | (32,031 | ) | (53,033 | ) | |||||||||||||
Depreciation and amortization | 4,063 | 1,685 | 3,027 | 660 | 1,634 | 11,069 | |||||||||||||||||
Total assets | 172,456 | 101,921 | 67,655 | 23,235 | 17,273 | 382,540 | |||||||||||||||||
Capital expenditures | 8,704 | 494 | 717 | 286 | 1,420 | 11,621 | |||||||||||||||||
2015 | |||||||||||||||||||||||
Net revenue from external customers | $ | 163,296 | $ | 42,808 | $ | 41,840 | $ | 9,402 | $ | — | $ | 257,346 | |||||||||||
Gross profit | 60,784 | 10,914 | 13,396 | 1,912 | — | 87,006 | |||||||||||||||||
Income (loss) from operations | 32,995 | 6,792 | (24,551 | ) | (2,958 | ) | (29,398 | ) | (17,120 | ) | |||||||||||||
Depreciation and amortization | 3,578 | 1,649 | 6,575 | 535 | 1,276 | 13,613 | |||||||||||||||||
Total assets | 152,430 | 90,948 | 110,872 | 26,564 | 20,131 | 400,945 | |||||||||||||||||
Capital expenditures | 5,910 | 46 | 2,744 | 883 | 1,495 | 11,078 | |||||||||||||||||
Geographic Information
Revenue by country is based on the location where services are provided and products are used. No individual country other than the United States (“U.S.”) accounted for more than 10% of revenue. Revenue by geographic location is as follows (in thousands):
Three months ended September 30, | Nine months ended September 30, | ||||||||||||||
2016 | 2015 | 2016 | 2015 | ||||||||||||
U.S. | $ | 58,183 | $ | 73,796 | $ | 169,991 | $ | 211,242 | |||||||
Other countries | 15,496 | 14,146 | 48,296 | 46,104 | |||||||||||
Total | $ | 73,679 | $ | 87,942 | $ | 218,287 | $ | 257,346 | |||||||
Long-lived assets held in countries other than the U.S. are not considered material to the consolidated financial statements.
Major Customers
Revenue from major customers, as a percentage of consolidated revenue, is as follows:
Three months ended September 30, | Nine months ended September 30, | ||||||||||
2016 | 2015 | 2016 | 2015 | ||||||||
Customer A | 12.9 | % | 12.8 | % | 11.9 | % | 11.7 | % | |||
Customer B | 10.9 | % | 11.3 | % | 15.8 | % | 14.3 | % | |||
Customer C | * | 11.6 | % | * | * | ||||||
Over 95% of the revenue from these customers was for sales in the Energy Chemistry Technologies segment.
Note 17 — Commitments and Contingencies
Class Action Litigation
In November 2015, four putative securities class action lawsuits were filed in the United States District Court for the Southern District of Texas against the Company and certain of its officers. The lawsuits have been consolidated into a single case, and an amended complaint has been filed. The amended complaint asserts that the Company made false and/or misleading statements, as well as failed to disclose material adverse facts about the Company’s business, operations, and prospects. The complaint seeks an award of damages in an unspecified amount on behalf of a putative class consisting of persons who purchased the Company’s common stock between October 23, 2014 and November 9, 2015, inclusive.
19
FLOTEK INDUSTRIES, INC.
NOTES TO UNAUDITED CONDENSED CONSOLIDATED FINANCIAL STATEMENTS
In January 2016, three derivative lawsuits were filed, two in the District Court of Harris County, Texas (which have since been consolidated into one case) and one in the United States District Court for the Southern District of Texas, on behalf of the Company against certain of its officers and its current directors. The lawsuits allege violations of law, breaches of fiduciary duty, and unjust enrichment against the defendants.
The Company believes the class action lawsuit and the derivative lawsuits are without merit, and it intends to vigorously defend against all claims asserted. Discovery has not yet commenced. At this time, the Company is unable to reasonably estimate the outcome of this litigation.
In addition, the U.S. Securities and Exchange Commission has opened an inquiry related to similar issues to those raised in the above-described litigation.
Other Litigation
The Company is subject to routine litigation and other claims that arise in the normal course of business. Management is not aware of any pending or threatened lawsuits or proceedings that are expected to have a material effect on the Company’s financial position, results of operations or liquidity.
Concentrations and Credit Risk
The majority of the Company’s revenue is derived from the oil and gas industry. Customers include major oilfield services companies, major integrated oil and natural gas companies, independent oil and natural gas companies, pressure pumping service companies, and state-owned national oil companies. This concentration of customers in one industry increases credit and business risks.
The Company is subject to concentrations of credit risk within trade accounts receivable, as the Company does not generally require collateral as support for trade receivables. In addition, the majority of the Company’s cash is maintained at a major financial institution and balances often exceed insurable amounts.
20
Item 2. Management’s Discussion and Analysis of Financial Condition and Results of Operations
Forward-Looking Statements
This Quarterly Report on Form 10-Q (“Quarterly Report”), and in particular, Part I, Item 2 — “Management’s Discussion and Analysis of Financial Condition and Results of Operations,” contains “forward-looking statements” within the meaning of the safe harbor provisions, 15 U.S.C. § 78u-5, of the Private Securities Litigation Reform Act of 1995 (“Reform Act”). Forward-looking statements are not historical facts, but instead represent Flotek Industries, Inc.’s (“Flotek” or “Company”) current assumptions and beliefs regarding future events, many of which, by their nature, are inherently uncertain and outside the Company’s control. Such statements include estimates, projections, and statements related to the Company’s business plan, objectives, expected operating results, and assumptions upon which those statements are based. The forward-looking statements contained in this Quarterly Report are based on information available as of the date of this Quarterly Report.
The forward-looking statements relate to future industry trends and economic conditions, forecast performance or results of current and future initiatives and the outcome of contingencies and other uncertainties that may have a significant impact on the Company’s business, future operating results and liquidity. These forward-looking statements generally are identified by words including, but not limited to, “anticipate,” “believe,” “estimate,” “continue,” “intend,” “expect,” “plan,” “forecast,” “project,” and similar expressions, or future-tense or conditional constructions such as “will,” “may,” “should,” “could,” etc. The Company cautions that these statements are merely predictions and are not to be considered guarantees of future performance. Forward-looking statements are based upon current expectations and assumptions that are subject to risks and uncertainties that can cause actual results to differ materially from those projected, anticipated, or implied.
A detailed discussion of potential risks and uncertainties that could cause actual results and events to differ materially from forward-looking statements is included in Part I, Item 1A — “Risk Factors” of the Annual Report on Form 10-K for the year ended December 31, 2015 (“Annual Report”) and periodically in subsequent reports filed with the Securities and Exchange Commission (“SEC”). The Company has no obligation to publicly update or revise any forward-looking statements, whether as a result of new information or future events, except as required by law.
Management’s Discussion and Analysis of Financial Condition and Results of Operations (“MD&A”) should be read in conjunction with the unaudited condensed consolidated financial statements and the related notes thereto of this Quarterly Report, as well as the Annual Report. Phrases such as “Company,” “we,” “our,” and “us” refer to Flotek Industries, Inc. and its subsidiaries.
Executive Summary
Flotek is a global diversified, technology-driven company that develops and supplies oilfield products, services, and equipment to the oil, gas, and mining industries, and high value compounds to companies that make cleaning products, cosmetics, food and beverages, and other products that are sold in the consumer and industrial markets.
The Company’s oilfield businesses include specialty chemistries and logistics, downhole drilling tools, and production-related tools. Flotek’s technologies enable customers to drill wells more efficiently, increase well production, and decrease well operating costs. The Company also provides automated bulk material handling, loading facilities, and blending capabilities. The Company sources citrus oil domestically and internationally and is one of the largest processors of citrus oil in the world. Products produced from processed citrus oil include (1) high value compounds used as additives by companies in the flavors and fragrances markets and (2) environmentally friendly chemistries for use in numerous industries around the world, including the oil and gas (“O&G”) industry.
Flotek operates in over 20 domestic and international markets, including the Gulf Coast, Southwest, West Coast, Rocky Mountains, Northeastern, and Mid-Continental regions of the United States (“U.S.”), Canada, Mexico, Central America, South America, Europe, Africa, Middle East, and Asia-Pacific. Customers include major integrated O&G companies, oilfield services companies, independent O&G companies, pressure-pumping service companies, national and state-owned oil companies, and international supply chain management companies. The Company also serves customers who purchase non-energy-related citrus oil and related products, including household and commercial cleaning product companies, fragrance and cosmetic companies, and food manufacturing companies.
21
The operations of the Company are categorized into four reportable segments: Energy Chemistry Technologies, Consumer and Industrial Chemistry Technologies, Drilling Technologies, and Production Technologies.
• | Energy Chemistry Technologies designs, develops, manufactures, packages, and markets specialty chemistries used in O&G well drilling, cementing, completion, and stimulation. In addition, the Company’s chemistries are used in specialized enhanced and improved oil recovery markets (“EOR” or “IOR”). Activities in this segment also include construction and management of automated material handling facilities and management of loading facilities and blending operations for oilfield services companies. |
• | Consumer and Industrial Chemistry Technologies designs, develops, and manufactures products that are sold to companies in the flavor and fragrance industries and specialty chemical industry. These technologies are used by beverage and food companies, fragrance companies, and companies providing household and industrial cleaning products. |
• | Drilling Technologies rents, sells, inspects, manufactures, and markets downhole drilling equipment used in energy, mining, and industrial drilling activities. |
• | Production Technologies assembles and markets production-related equipment, including the Petrovalve® product line of rod pump components, hydraulic pumping units (“HPU”), electric submersible pumps (“ESP”), gas separators, valves, and services that support natural gas and oil production activities. |
Market Conditions
The Company’s success is sensitive to a number of factors, which include, but are not limited to, drilling and well completion activity, customer demand for its advanced technology products, market prices for raw materials, and governmental actions.
Drilling and well completion activity levels are influenced by a number of factors, including the number of rigs in operation, the geographical areas of rig activity, and drill rig efficiency (rig days required per well). Additional factors that influence the level of drilling and well completion activity include:
• | Historical, current, and anticipated future O&G prices, |
• | Federal, state, and local governmental actions that may encourage or discourage drilling activity, |
• | Customers’ strategies relative to capital funds allocations, |
• | Weather conditions, and |
• | Technological changes to drilling methods and economics. |
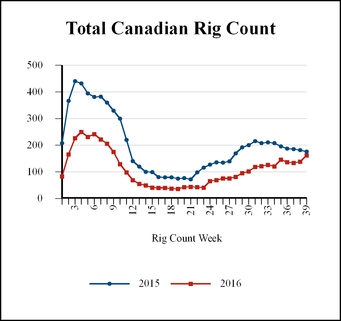
Historical North American drilling activity is reflected in “TABLE A” on the following page.
Customers’ demand for advanced technology products and services provided by the Company are dependent on their recognition of the value of:
• | Chemistries that improve the economics of their O&G operations, |
• | Drilling products that improve drilling operations and efficiencies, |
• | Chemistries that are economically viable, socially responsible, and ecologically sound, and |
• | Production technologies that improve production and production efficiencies in maturing wells. |
Market prices for commodities, including citrus oils and guar, can be influenced by:
• | Historical, current, and anticipated future production levels of the global citrus (primarily orange) and guar crops, |
• | Weather related risks, |
• | Health and condition of citrus trees and guar plants (e.g., disease and pests), and |
• | International competition and pricing pressures resulting from natural and artificial pricing influences. |
Governmental actions may restrict the future use of hazardous chemicals, including, but not limited to, the following industrial applications:
• | O&G drilling and completion operations, |
• | O&G production operations, and |
• | Non-O&G industrial solvents. |
22
TABLE A | Three months ended September 30, | Nine months ended September 30, | |||||||||||||||
2016 | 2015 | % Change | 2016 | 2015 | % Change | ||||||||||||
Average North American Active Drilling Rigs | |||||||||||||||||
U.S. | 479 | 866 | (44.7 | )% | 482 | 1,059 | (54.5 | )% | |||||||||
Canada | 121 | 190 | (36.3 | )% | 112 | 200 | (44.0 | )% | |||||||||
Total | 600 | 1,056 | (43.2 | )% | 594 | 1,259 | (52.8 | )% | |||||||||
Average U.S. Active Drilling Rigs by Type | |||||||||||||||||
Vertical | 62 | 123 | (49.6 | )% | 58 | 152 | (61.8 | )% | |||||||||
Horizontal | 372 | 659 | (43.6 | )% | 376 | 805 | (53.3 | )% | |||||||||
Directional | 45 | 84 | (46.4 | )% | 48 | 102 | (52.9 | )% | |||||||||
Total | 479 | 866 | (44.7 | )% | 482 | 1,059 | (54.5 | )% | |||||||||
Average North American Drilling Rigs by Product | |||||||||||||||||
Oil | 452 | 745 | (39.3 | )% | 440 | 906 | (51.4 | )% | |||||||||
Natural Gas | 148 | 311 | (52.4 | )% | 154 | 353 | (56.4 | )% | |||||||||
Total | 600 | 1,056 | (43.2 | )% | 594 | 1,259 | (52.8 | )% | |||||||||
Source: Rig counts are per Baker Hughes, Inc. (www.bakerhughes.com). Rig counts are the averages of the weekly rig count activity.
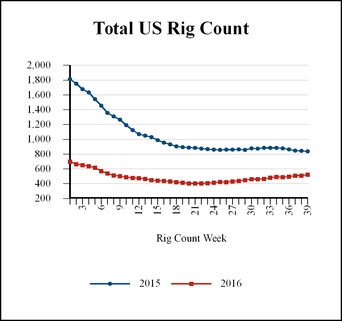
During the three and nine months ended September 30, 2016, total average North American active drilling rig count decreased 43.2% and 52.8%, respectively, when compared to the same periods of 2015. Average North American oil drilling rig activity decreased by 39.3% and 51.4% for the three and nine months ended September 30, 2016, respectively, when compared to the same periods of 2015. Average North American natural gas drilling rig count decreased by 52.4% and 56.4% for the three and nine months ended September 30, 2016, respectively, compared to the same periods of 2015. Sequentially, total average North American active drilling rig count increased by 27.7% when compared to the second quarter of 2016.
Average U.S. rig activity decreased by 44.7% and 54.5% for the three and nine months ended September 30, 2016, respectively, compared to the same periods of 2015, and sequentially, increased by 13.5% when compared to the second quarter of 2016. Average Canadian rig count decreased by 36.3% and 44.0% for the three and nine months ended September 30, 2016, respectively, compared to the same periods of 2015.
According to data collected by the U.S. Energy Information Administration (“EIA”), completions in the seven most prolific areas in the lower 48 states decreased 41.4% and 48.0% for the three and nine months ended September 30, 2016, respectively, when compared to the same periods of 2015. Sequentially, completions decreased 1.3% when compared to the second quarter of 2016.
23
Company Outlook
After a continuous decline in North American drilling rig activity beginning in mid-2014, the market began to gradually recover in the second quarter of 2016. Although a gradual recovery appears to be underway, the level of drilling and completion activity is still depressed compared to historical levels and the outlook for continued improvement in industry activity is uncertain. The Company expects North American oilfield activity to remain depressed throughout the remainder of 2016 and into the first half of 2017. Although the Company has seen demand for its oil and gas related products and services in North America impacted by these industry conditions, the Company continues to aggressively market its oil and gas based products and services including its Complex nano-Fluid® (“CnF®”) and other completion chemistries, Teledrift® product line, Stemulator® product line, and the growing line of production technologies, and the Company expects to see increased market acceptance of these product lines.
During the third quarter of 2016, the Company continued to successfully promote the efficacy of its CnF® chemistries resulting in a 14% decrease in CnF® sales volumes compared to the third quarter of 2015, despite a 43% year over year decline in North American general oilfield activity. Third quarter 2016 CnF® volumes remained flat compared to the second quarter of 2016, in line with well completion activity as measured by industry surveys. The Company expects to continue strong performance relative to market activity by continuing to demonstrate the efficacy of its CnF® chemistries through comparative analysis of wells with and without CnF® chemistries, field validation results conducted by E&P companies, and the continuation of its direct-to-operator sales program known as the Flotek Store™. Whether operators purchase directly from Flotek or continue to purchase from oilfield distribution and service companies, E&P operators are benefiting from increased price transparency and a more direct relationship with Flotek’s technical expertise and supply chain. In July 2016, the Company acquired 100% of the stock and interests in International Polymerics, Inc. (“IPI”) and related entities, a U.S. based manufacturer of high viscosity guar gum and guar slurry. The IPI business is being integrated into the Company’s Energy Chemistry Technologies segment as an important part of the Company’s expanding line of polymer based chemistries.
The Company’s success in promoting its patented and proprietary chemistries is supported through its industry leading research and innovation staff who provide customer responsive product innovation, as well as development of new products which are expected to expand the Company’s future product lines. During the third quarter of 2016, the Company completed its new Global Research & Innovation Center in Houston. This state-of-the-art facility allows for the development of next-generation innovative energy chemistries, as well as expanded collaboration between clients, leaders from academia, and Company scientists. These collaborative opportunities are an important and distinguishing capability within the industry.
As a result of the significant and continued reduction in drilling activity and the Company’s expectations for the future market for the Company’s drilling tools, during the first quarter of 2016, the Company refocused the Drilling Technologies segment by closing locations, reducing staff, and eliminating product lines. At current activity levels, the Company expects continued, intense competition for jobs and significant pressure on margins even as market conditions stabilize and begin to improve. Throughout 2015 and continuing in to 2016, some of the Company’s smaller competitors left the market, and the Company believes, based on its improved cost structure and market position, it is well positioned to benefit from improved pricing and market growth opportunities as the market recovers. The Company has seen improved profitability from this segment throughout 2016 and expects that trend to continue in future quarters.
During 2015, the Company strategically repositioned the focus of the Production Technologies segment towards oil production markets and away from the less opportunistic coal bed methane (“CBM”) markets. As part of this strategic repositioning, in January 2015, the Company acquired 100% of the assets from International Artificial Lift, LLC (“IAL”), a company that specializes in the design, manufacturing, and service of next-generation HPUs that serve to increase and maximize production for oil and natural gas wells. Additionally, the Company has developed a new line of ESPs. The Company continues to commercialize its new HPU and ESP product lines.
The outlook for the Company’s consumer and industrial chemistries will be driven by the availability and demand for citrus oils, industrial solvents, and flavor and fragrance ingredients. Although current inventory and crop expectations are sufficient to meet the Company’s needs to supply its flavor and fragrance business, as well as both internal and external industrial markets, the market supply of citrus terpenes has declined in recent years due to the reduction in citrus crops caused by the citrus greening disease. This reduced supply has resulted in higher citrus terpene prices and increased price volatility. The Company expects terpene prices to remain elevated for the foreseeable future. In addition, the Company expects its strong market position to enable it to maintain a stable supply of citrus terpenes for internal use and external sales.
In response to the current market environment, the Company has been proactive in reducing costs to reflect current market conditions while, at the same time, remaining focused on preserving appropriate functions and capacity, which allows the Company to be opportunistic as market conditions improve. The Company expects to continue to focus on supply chain optimizations and, when
24
needed, adjustments to staffing levels, facility consolidations, and other cost adjustments. The Company regularly evaluates its cost structure based on market conditions with a focus on continuous efficiency improvements.
Capital expenditures, exclusive of acquisitions, totaled $11.6 million and $11.1 million for the nine months ended September 30, 2016 and 2015, respectively. The Company expects capital spending to be between $14 million and $16 million in 2016, inclusive of $6.8 million for the completion of its Global Research & Innovation Center. The Company will remain nimble in its core capital expenditure plans, adjusting as market conditions warrant.
Changes to geopolitical, global economic, and industry trends could have an impact, either positive or negative, on the Company’s business. In the event of significant adverse changes to the demand for oil and gas production and/or the market price for oil and gas, the market conditions affecting the Company could change rapidly and materially. Should such adverse changes to market conditions occur, management believes the Company has access to adequate liquidity to withstand the impact of such changes while continuing to make strategic capital investments and acquisitions, if opportunities arise. In addition, management believes the Company is well-positioned to take advantage of significant increases in demand for its products should market conditions improve dramatically in the near term.
Consolidated Results of Operations (in thousands):
Three months ended September 30, | Nine months ended September 30, | ||||||||||||||
2016 | 2015 | 2016 | 2015 | ||||||||||||
Revenue | $ | 73,679 | $ | 87,942 | $ | 218,287 | $ | 257,346 | |||||||
Cost of revenue | 48,313 | 56,715 | 144,071 | 170,340 | |||||||||||
Gross profit | 25,366 | 31,227 | 74,216 | 87,006 | |||||||||||
Gross margin % | 34.4 | % | 35.5 | % | 34.0 | % | 33.8 | % | |||||||
Selling, general and administrative costs | 24,424 | 23,634 | 71,859 | 70,223 | |||||||||||
Selling, general and administrative costs % | 33.1 | % | 26.9 | % | 32.9 | % | 27.3 | % | |||||||
Depreciation and amortization | 2,706 | 2,785 | 7,896 | 8,258 | |||||||||||
Research and innovation costs | 2,531 | 2,031 | 7,059 | 5,273 | |||||||||||
Impairment of inventory and long-lived assets | — | — | 40,435 | 20,372 | |||||||||||
(Loss) income from operations | (4,295 | ) | 2,777 | (53,033 | ) | (17,120 | ) | ||||||||
Operating margin % | (5.8 | )% | 3.2 | % | (24.3 | )% | (6.7 | )% | |||||||
Interest and other expense, net | (660 | ) | (402 | ) | (2,018 | ) | (1,457 | ) | |||||||
(Loss) income before income taxes | (4,955 | ) | 2,375 | (55,051 | ) | (18,577 | ) | ||||||||
Income tax benefit (provision) | 2,209 | (400 | ) | 19,840 | 6,490 | ||||||||||
Net (loss) income | $ | (2,746 | ) | $ | 1,975 | $ | (35,211 | ) | $ | (12,087 | ) | ||||
Net (loss) income % | (3.7 | )% | 2.2 | % | (16.1 | )% | (4.7 | )% | |||||||
Consolidated Results of Operations: Three and Nine Months Ended September 30, 2016, Compared to the Three and Nine Months Ended September 30, 2015
Consolidated revenue for the three and nine months ended September 30, 2016, decreased $14.3 million, or 16.2%, and $39.1 million, or 15.2%, respectively, versus the same periods of 2015. The decrease in revenue for both periods was driven by the depressed level of oilfield activity throughout 2015 and 2016, as indicated by the 43.2% and 52.8% reduction in average North American rig count for the three and nine months ended September 30, 2016, versus the same periods of 2015. This resulted in significant reductions in customer demand and price concessions in the Drilling Technologies segment. The Energy Chemistry Technologies segment experienced a less significant decline in revenues due to continued demand for its patented and proprietary chemistries. Additionally, the Consumer and Industrial Chemistry Technologies segment saw a significant increase in revenues due to higher sales prices and volume increases in the Flavor and Fragrance and terpene product lines.
Consolidated gross profit for the three and nine months ended September 30, 2016, decreased $5.9 million, or 18.8%, and $12.8 million, or 14.7%, respectively, compared to the same periods of 2015. Gross margin decreased to 34.4% for the three months ended September 30, 2016, from 35.5% in the same period of 2015, primarily due to declining sales volumes and product pricing pressure in the Production Technologies segment, partially offset by higher margins in the Drilling Technologies segment due to
25
improved cost structures. Gross margin remained relatively unchanged for the nine months ended September 30, 2016, compared to the same period of 2015.
Selling, general and administrative (“SG&A”) expenses are not directly attributable to products sold or services provided. SG&A costs increased $0.8 million, or 3.3%, and $1.6 million, or 2.3%, for the three and nine months ended September 30, 2016, respectively, versus the same periods of 2015. These increases were primarily due to higher legal and professional fees. The Company regularly evaluates its SG&A cost structure as market conditions warrant.
Depreciation and amortization expense decreased $0.1 million, or 2.8%, and $0.4 million, or 4.4%, for the three and nine months ended September 30, 2016, respectively, versus the same periods of 2015, primarily due to the long-lived asset impairment in the first quarter of 2016, partially offset by increased depreciation expense for the recently completed Global Research & Innovation Center.
Research and Innovation (“R&I”) expense increased $0.5 million, or 24.6%, and $1.8 million, or 33.9%, for the three and nine months ended September 30, 2016, respectively, compared to the same periods of 2015. The increase in R&I is primarily attributable to new product development and Flotek’s commitment to remaining responsive to customer needs, increased demand, continued growth and refining of existing product lines, and the development of new chemistries which are expected to expand the Company’s intellectual property portfolio.
During the three months ended March 31, 2016, as a result of changes in the oil and gas industry and the corresponding impact on the Company’s business outlook, the Company determined that within its Drilling Technologies segment the carrying amount of certain long-lived assets exceeded their respective fair values and that some inventory was either not usable in future operations or the carrying value exceeded its market value. In addition, as a result of the introduction of newer and proprietary technology, as well as lower demand for older technologies, the Company also evaluated its Production Technologies inventory for impairment during the three months ended March 31, 2016. As a result of these evaluations, the Company recorded impairment charges of $40.4 million in the first quarter of 2016.
Interest and other expense increased $0.3 million, or 64.2%, and $0.6 million, or 38.5%, for the three and nine months ended September 30, 2016, versus the same periods of 2015, primarily due to the interest rate increase on the term loan and revolving credit facility effective March 31, 2016.
The Company recorded income tax benefits of $2.2 million and $19.8 million, yielding effective tax benefit rates of 44.6% and 36.0% for the three and nine months ended September 30, 2016, respectively, compared to an income tax provision of $0.4 million and a benefit of $6.5 million yielding effective tax rates of 16.8% and 34.9% for the comparable periods in 2015.
Results by Segment
Energy Chemistry Technologies (dollars in thousands) | |||||||||||||||
Three months ended September 30, | Nine months ended September 30, | ||||||||||||||
2016 | 2015 | 2016 | 2015 | ||||||||||||
Revenue | $ | 45,030 | $ | 60,181 | $ | 133,094 | $ | 163,296 | |||||||
Gross profit | 18,180 | 24,257 | 54,609 | 60,784 | |||||||||||
Gross margin % | 40.4 | % | 40.3 | % | 41.0 | % | 37.2 | % | |||||||
Income from operations | 6,196 | 14,283 | 21,793 | 32,995 | |||||||||||
Operating margin % | 13.8 | % | 23.7 | % | 16.4 | % | 20.2 | % | |||||||
Energy Chemistry Technologies Results of Operations: Three and Nine Months Ended September 30, 2016, Compared to the Three and Nine Months Ended September 30, 2015
Energy Chemistry Technologies revenue for the three and nine months ended September 30, 2016, decreased $15.2 million, or 25.2%, and $30.2 million, or 18.5%, respectively, versus the same periods of 2015, compared to a 43.2% and 52.8% decline in market activity as measured by average North American rig count. Flotek’s Energy Chemistry Technologies segment outperformed these market indicators by continuing to aggressively promote the benefits of its CnF® chemistries. CnF® sales volumes decreased 14.2% (revenues decreased 15.9%), compared to the three months ended September 30, 2015. The decreased sales of its CnF® chemistries during the third quarter of 2016 was due to decreased activity resulting from less well completion activity by customers. Energy Chemistry Technologies’ success is enabled by its continued ability to demonstrate the efficacy of its CnF® chemistries through comparative analysis of wells with and without CnF® chemistries and field validation results conducted by E&P companies,
26
as well as its direct-to-operator sales program known as the Flotek Store™. Non-CnF revenues declined approximately 42.7%, compared to the three months ended September 30, 2015, due to reduced customer demand as a result of oilfield market conditions.
Sequentially, revenues increased $1.6 million, or 3.8%, versus the second quarter of 2016, compared to a 27.7% increase in market activity as measured by average North American rig count. CnF® sales volumes remained flat (revenues increased 3.5%) on a sequential basis in line with industry well completion activity. Lower well completion activity by a major customer was partially offset by increased sales to other customers. Non-CnF revenues increased 3.3% due to increased activity with service companies.
Energy Chemistry Technologies gross profit decreased $6.1 million, or 25.1%, and $6.2 million, or 10.2%, for the three and nine months ended September 30, 2016, respectively, versus the same periods of 2015. Gross margin remained flat for the three months ended September 30, 2016, as compared to the same period of 2015, and increased to 41.0% for the nine months ended September 30, 2016, from 37.2% in the same period of 2015. The gross margin increase over the period was primarily due to product mix resulting from relatively higher sales of CnF® chemistries.
Income from operations for the Energy Chemistry Technologies segment decreased $8.1 million, or 56.6%, and $11.2 million, or 34.0%, for the three and nine months ended September 30, 2016, respectively, versus the same periods of 2015. These decreases are primarily attributable to the decrease in gross profit, increased costs associated with sales and marketing efforts in pursuit of growth opportunities, and increased costs associated with the Company’s continued commitment to its research and innovation efforts within Energy Chemistry Technologies.
Consumer and Industrial Chemistry Technologies (dollars in thousands) | |||||||||||||||
Three months ended September 30, | Nine months ended September 30, | ||||||||||||||
2016 | 2015 | 2016 | 2015 | ||||||||||||
Revenue | $ | 19,306 | $ | 13,867 | $ | 59,133 | $ | 42,808 | |||||||
Gross profit | 4,174 | 3,082 | 13,256 | 10,914 | |||||||||||
Gross margin % | 21.6 | % | 22.2 | % | 22.4 | % | 25.5 | % | |||||||
Income from operations | 2,433 | 1,728 | 8,508 | 6,792 | |||||||||||
Operating margin % | 12.6 | % | 12.5 | % | 14.4 | % | 15.9 | % | |||||||
CICT Results of Operations: Three and Nine Months Ended September 30, 2016, Compared to the Three and Nine Months Ended September 30, 2015
CICT revenue increased $5.4 million, or 39.2%, and $16.3 million, or 38.1%, for the three and nine months ended September 30, 2016, respectively, versus the same periods of 2015. These increases were due to higher prices and volume increases in the Flavor and Fragrance and terpene product lines. Sequentially, quarterly revenues decreased $1.4 million, or 6.7%, due to decreases in terpene volumes associated with seasonal demand.
CICT gross profit for the three and nine months ended September 30, 2016, increased $1.1 million, or 35.4%, and increased $2.3 million, or 21.5%, versus the same periods of 2015. Gross margin decreased to 21.6% and 22.4% for the three and nine months ended September 30, 2016, respectively, from 22.2% and 25.5% in the same periods of 2015, as a result of higher direct costs. Sequentially, gross profits increased by $0.1 million, and gross margins increased to 21.6% from 19.6% from the second quarter of 2016.
Income from operations for the CICT segment increased $0.7 million, or 40.8%, and $1.7 million, or 25.3%, for the three and nine months ended September 30, 2016, respectively, versus the same periods of 2015. Operating margin remained flat for the three months ended September 30, 2016, compared to the same period of 2015, and decreased to 14.4% for the nine months ended September 30, 2016, from 15.9% in the same period of 2015. Sequentially, quarterly operating profits decreased by $0.3 million.
27
Drilling Technologies (dollars in thousands) | |||||||||||||||
Three months ended September 30, | Nine months ended September 30, | ||||||||||||||
2016 | 2015 | 2016 | 2015 | ||||||||||||
Revenue | $ | 7,198 | $ | 10,812 | $ | 20,026 | $ | 41,840 | |||||||
Gross profit | 2,908 | 3,302 | 6,150 | 13,396 | |||||||||||
Gross margin % | 40.4 | % | 30.5 | % | 30.7 | % | 32.0 | % | |||||||
Loss from operations | (924 | ) | (2,614 | ) | (43,493 | ) | (24,551 | ) | |||||||
Loss from operations - excluding impairment | (924 | ) | (2,614 | ) | (6,971 | ) | (4,983 | ) | |||||||
Operating margin % - excluding impairment | (12.8 | )% | (24.2 | )% | (34.8 | )% | (11.9 | )% | |||||||
Drilling Technologies Results of Operations: Three and Nine Months Ended September 30, 2016, Compared to the Three and Nine Months Ended September 30, 2015
Drilling Technologies revenue decreased $3.6 million, or 33.4%, and $21.8 million, or 52.1%, for the three and nine months ended September 30, 2016, respectively, relative to the same periods of 2015. The decline in both comparison periods was primarily due to decreased actuated and other tool rentals and decreased Teledrift® domestic and international rental revenue. The revenue declines were primarily related to the decrease in drilling rig activity and significant pricing pressure for the three and nine months ended September 30, 2016. Sequentially, quarterly revenue increased $0.8 million, or 13.0%, primarily due to higher Teledrift® revenue internationally.
Drilling Technologies gross profit for the three and nine months ended September 30, 2016, decreased $0.4 million, or 11.9%, and $7.2 million, or 54.1%, respectively, versus the same periods of 2015. The decline in both comparison periods’ gross profit was primarily due to the lower sales volumes in 2016 and increased pricing pressure for product sales and rentals. Direct operating costs decreased by 52.6% and 40.6% for the three and nine months ended September 30, 2016, respectively, versus the same periods of 2015, due to decreased depreciation expense, lower employee related expenses, and freight costs. Sequentially, gross profit increased $0.7 million, or 31.2%, from the second quarter of 2016, primarily due to the increased revenue and lower employee related direct costs. Gross margins of 40.4% in the third quarter of 2016 increased by 5.6% sequentially and are at the highest level since the fourth quarter of 2014.
During the first quarter of 2016, as a result of the sequential decline in segment revenue and expectations for future drilling activity, the Company determined the carrying amount of certain long-lived assets exceeded their respective fair values and that some inventory was either not usable in future operations or the carrying value exceeded its market value. As a result, an impairment charge of $36.5 million was recorded to reflect the reduced value of inventory and long-lived assets in the Drilling Technologies segment.
Loss from operations for the three months ended September 30, 2016, improved by $1.7 million versus the same period of 2015, on a 33.4% revenue decrease, due to a 33% year over year headcount reduction, field location closures, and other operational cost improvements. Loss from operations for the nine months ended September 30, 2016, increased by $18.9 million versus the same period of 2015, primarily resulting from the second quarter 2015 and first quarter 2016 impairment charges. Loss from operations, excluding impairments, for the nine months ended September 30, 2016, increased by $2.0 million, versus the same period of 2015, primarily due to reductions in revenue and pricing pressure that resulted in customer price concessions, partially offset by cost reductions throughout the year. Sequentially, the quarterly loss from operations improved by $0.7 million, or 42.9%, due to the increase in international Teledrift® sales volume, continued decreases in employee related costs, and lower depreciation expense.
28
Production Technologies (dollars in thousands) | |||||||||||||||
Three months ended September 30, | Nine months ended September 30, | ||||||||||||||
2016 | 2015 | 2016 | 2015 | ||||||||||||
Revenue | $ | 2,145 | $ | 3,082 | $ | 6,034 | $ | 9,402 | |||||||
Gross profit (loss) | 104 | 586 | 201 | 1,912 | |||||||||||
Gross margin % | 4.8 | % | 19.0 | % | 3.3 | % | 20.3 | % | |||||||
Loss from operations | (1,118 | ) | (823 | ) | (7,810 | ) | (2,958 | ) | |||||||
Loss from operations - excluding impairment | (1,118 | ) | (823 | ) | (3,897 | ) | (2,154 | ) | |||||||
Operating margin % - excluding impairment | (52.1 | )% | (26.7 | )% | (64.6 | )% | (22.9 | )% | |||||||
Production Technologies Results of Operations: Three and Nine Months Ended September 30, 2016, Compared to the Three and Nine Months Ended September 30, 2015
Revenue for the Production Technologies segment for the three and nine months ended September 30, 2016, decreased by $0.9 million, or 30.4%, and $3.4 million, or 35.8%, respectively, versus the same periods of 2015. These decreases were primarily due to decreased sales of rod pump equipment and older technology ESP equipment. Sequentially, quarterly revenues increased $0.3 million, or 14.8%, due to higher rod pump sales, ESP cable sales, and continued deployment of the new HPU and ESP product technologies in the third quarter of 2016.
Production Technologies gross profit decreased by $0.5 million, and $1.7 million, for the three and nine months ended September 30, 2016, respectively, versus the same periods of 2015. Gross margin decreased to 4.8% and 3.3% for the three and nine months ended September 30, 2016, respectively, from 19.0% and 20.3% for the same periods in 2015. These decreases were due to declining sales volumes and product pricing pressure throughout 2016. Sequentially, gross margin increased 5.6%, compared to the second quarter of 2016.
As a result of the introduction of newer and proprietary technology, as well as lower demand for older technologies, the Company evaluated its Production Technologies inventory for impairment leading to the recording of an impairment charge of $3.9 million for inventory in the first quarter of 2016.
Loss from operations increased $0.3 million and $4.9 million for the three and nine months ended September 30, 2016, respectively, versus the same periods in 2015. Loss from operations, excluding impairments, increased by $1.7 million for the nine months ended September 30, 2016, versus the same period in 2015. These increased losses were due to lower revenue volume and increased costs as the segment continues to market and pursue new product strategies.
Off-Balance Sheet Arrangements
There have been no transactions that generate relationships with unconsolidated entities or financial partnerships, such as entities often referred to as “structured finance” or “special purpose entities” (“SPEs”), established for the purpose of facilitating off-balance sheet arrangements or other contractually narrow or limited purposes. As of September 30, 2016, the Company was not involved in any unconsolidated SPEs.
The Company has not made any guarantees to customers or vendors nor does the Company have any off-balance sheet arrangements or commitments that have, or are reasonably likely to have, a current or future effect on the Company’s financial condition, change in financial condition, revenue, expenses, results of operations, liquidity, capital expenditures, or capital resources that would be material to investors.
Critical Accounting Policies and Estimates
The Company’s Financial Statements have been prepared in accordance with accounting principles generally accepted in the United States of America (“U.S. GAAP”). Preparation of these statements requires management to make judgments, estimates, and assumptions that affect the amounts reported in the financial statements and accompanying footnotes. Part II, Item 8 — Financial Statements and Supplementary Data, Note 2 of “Notes to Consolidated Financial Statements” and Part II, Item 7 — Management’s Discussion and Analysis of Financial Conditions and Results of Operations, “Critical Accounting Policies and Estimates” of the Company’s Annual Report, and the “Notes to Unaudited Condensed Consolidated Financial Statements” of this Quarterly Report describe the significant accounting policies and critical accounting estimates used to prepare the consolidated financial statements. Critical accounting policies and estimates are defined as those that are both most important to the portrayal of the Company’s financial condition and results of operations and require management’s most subjective judgments. The Company regularly reviews
29
and challenges judgments, assumptions, and estimates related to critical accounting policies. The Company’s estimates and assumptions are based on historical experience and expected changes in the business environment; however, actual results may materially differ from the estimates.
There have been no significant changes in the Company’s critical accounting estimates during the nine months ended September 30, 2016, except as noted below.
Goodwill
Goodwill is not subject to amortization, but is tested for impairment annually during the fourth quarter, or more frequently if an event occurs or circumstances change that would indicate a potential impairment. These circumstances may include, but are not limited to, a significant adverse change in the business climate, unanticipated competition, or a change in projected operations or results of a reporting unit. Goodwill is tested for impairment at a reporting unit level. At June 30, 2016, four reporting units, Energy Chemistry Technologies, Consumer and Industrial Chemistry Technologies, Teledrift, and Production Technologies, have a goodwill balance.
During the annual testing, the Company assesses whether a goodwill impairment exists using both qualitative and quantitative assessments. The qualitative assessment involves determining whether events or circumstances exist that indicate it is more likely than not that the fair value of a reporting unit is less than its carrying amount, including goodwill. If, based on this qualitative assessment, it is determined that it is not more likely than not that the fair value of a reporting unit is less than its carrying amount, the Company does not perform a quantitative assessment.
If the qualitative assessment indicates that it is more likely than not that the fair value of a reporting unit is less than its carrying amount or if the Company elects not to perform a qualitative assessment, a quantitative assessment or two-step impairment test is performed to determine whether goodwill impairment exists at the reporting unit.
If quantitative impairment testing is performed, the Company uses a two-step process. The first step is to compare the estimated fair value of each reporting unit which has goodwill to its carrying amount, including goodwill. To determine fair value estimates, the Company uses the income approach based on discounted cash flow analyses, combined, when appropriate, with a market-based approach. The market-based approach considers valuation comparisons of recent public sale transactions of similar businesses and earnings multiples of publicly traded businesses operating in industries consistent with the reporting unit. If the fair value of a reporting unit is less than its carrying value, the second step of the impairment test is performed to determine the amount of impairment, if any. The second step compares the implied fair value of the reporting unit goodwill with the carrying amount of the goodwill. If the carrying amount of the reporting unit’s goodwill exceeds its implied value, an impairment loss is recognized in an amount equal to that excess.
The Company determines fair value using widely accepted valuation techniques, including discounted cash flows and market multiples analyses, and through use of independent fixed asset valuation firms, as appropriate. These types of analyses contain uncertainties, as they require management to make assumptions and to apply judgments regarding industry economic factors and the profitability of future business strategies. The Company’s policy is to conduct impairment testing based on current business strategies, taking into consideration current industry and economic conditions as well as the Company’s future expectations. Key assumptions used in the discounted cash flow valuation model include, among others, discount rates, growth rates, cash flow projections, and terminal value rates. Discount rates and cash flow projections are the most sensitive and susceptible to change as they require significant management judgment. Discount rates are determined using a weighted average cost of capital (“WACC”). The WACC considers market and industry data, as well as Company-specific risk factors for each reporting unit in determining the appropriate discount rate to be used. The discount rate utilized for each reporting unit is indicative of the return an investor would expect to receive for investing in a similar business. Management uses industry considerations and Company-specific historical and projected results to develop cash flow projections for each reporting unit. Additionally, if appropriate, as part of the market-based approach, the Company utilizes market data from publicly traded entities whose businesses operate in industries comparable to the Company’s reporting units, adjusted for certain factors that increase comparability.
As of the third quarter of 2016, the Company concluded it was not more likely than not that there was an impairment of goodwill for the Consumer and Industrial Chemistry Technologies reporting unit, the Energy Chemistry Technologies reporting unit, and the Teledrift reporting unit based on the assessment of qualitative factors. The Consumer and Industrial Chemistry Technologies reporting unit has seen increased revenues in 2016 compared to 2015 and has maintained margins in the range seen from 2014 through 2015. The Energy Chemistry Technologies reporting unit had an 11% decrease in revenue versus the 27% decline in market activity for the first quarter of 2016 compared to the fourth quarter of 2015, a 3% decrease in revenue versus the 35% decline in market activity for the second quarter of 2016 compared to the first quarter of 2016, and a 4% increase in revenue versus the 28% increase in market activity for the third quarter of 2016 compared to the second quarter of 2016, but continues to maintain gross margins. The Teledrift reporting unit, having passed the Step 1 impairment tests in the previous two quarters, had the highest
30
revenue quarter for 2016 and improved margins. Teledrift revenue for the third quarter of 2016 increased 37% versus the second quarter of 2016 and improved gross margins by 8.4%.
For the first quarter of 2016, the Company was not able to conclude that it was not more likely than not that the estimated fair value of the Production Technologies and Teledrift reporting units exceeded the carrying value of the respective reporting units. Therefore, the Company performed a Step 1 impairment test for each of these reporting units. The results of the Step 1 test indicated that the estimated fair values of the Production Technologies and the Teledrift reporting units exceeded the carrying value of their respective reporting units by approximately $34.9 million and $2.1 million, respectively, or an excess of 153% and 5%, respectively, over the carrying value. Therefore, no further testing was required for these two reporting units.
Again, for the second quarter of 2016, the Company was not able to conclude that it was not more likely than not that the estimated fair value of the Production Technologies and Teledrift reporting units exceeded the carrying value of the respective reporting units. Therefore, the Company performed a Step 1 impairment test for each of these reporting units. The results of the Step 1 test indicated that the estimated fair values of the Production Technologies and the Teledrift reporting units exceeded the carrying value of their respective reporting units by approximately $17.1 million and $2.2 million, respectively, or an excess of 77% and 6%, respectively, over the carrying value. Therefore, no further testing was required for these two reporting units.
Once again, for the third quarter of 2016, the Company was not able to conclude that it was not more likely than not that the estimated fair value of the Production Technologies reporting unit exceeded the carrying value of the reporting unit. Therefore, the Company performed a Step 1 impairment test for this reporting unit. The results of the Step 1 test indicated that the estimated fair value of the Production Technologies reporting unit exceeded the carrying value of the reporting unit by approximately $8.1 million, or an excess of 36.9% over the carrying value. Therefore, no further testing was required for this reporting unit.
Key assumptions and estimates were based on experience of the Company’s management, experience with past recessions within the oil and gas industry (specifically the 2008/2009 recession), and internal as well as published external perspectives of recovery timing. Key assumptions used in the discounted cash flow analysis included:
• | U.S. rig count bottoms during 2016 and begins to recover to average 500 rigs for the last two quarters of 2016. Average Rig count climbs to 580 in 2017, 780 in 2018, and 850 in 2019, and grows by 50 rigs annually for 2020 through 2023, and then grows 7% annually through 2026; |
• | International revenue grows 3% annually; |
• | Domestic rental revenue per rig and total domestic revenue per rig dip to lows seen during the 2008/2009 downturn through 2017 and then slowly return to the lower end of the ranges seen between 2012 and 2014; |
• | International indirect expenses remain 3.5% of total international revenue; |
• | Domestic indirect expense percentages slowly return to historical levels; |
• | Margins stay in the lower portion of historical ranges; |
• | Working capital ratios remain consistent; and |
• | Risk premium related to foreign country security and government stability. |
Some of the factors that affected the change in results of the Step 1 impairment test from the fourth quarter of 2015 to the third quarter of 2016 included:
• | Impairment testing of long-lived assets excluding goodwill resulted in a reduction to the balance sheet of $14.3 million for the Teledrift reporting unit in the first quarter of 2016. |
• | Impairment of inventory resulted in a reduction to the balance sheet of $1.3 million for the Teledrift reporting unit and $3.9 million for the Production Technologies reporting unit in the first quarter of 2016. |
• | Cost reduction initiatives during the first half of 2016 reduced direct and indirect expenses for the Drilling Technologies segment. |
• | Due to the surplus of rental tools and the low levels of drilling rig activity, capital expenditures for new rental tools will be minimal through 2019 in the Teledrift reporting unit. |
There are significant inherent uncertainties and judgments involved in estimating fair value. A further extension or deepening of the industry downturn could have a negative impact on the cash flow analysis.
The Company cannot predict the occurrence of events or circumstances that could adversely affect the fair value of goodwill. Such events may include, but are not limited to, deterioration of the economic environment, increases in the Company’s weighted average cost of capital, material negative changes in relationships with significant customers, reductions in valuations of other public
31
companies in the Company’s industry, or strategic decisions made in response to economic and competitive conditions. If actual results are not consistent with the Company’s current estimates and assumptions, impairment of goodwill could be required.
Based on the Company’s third quarter 2016 testing of goodwill for impairment at each reporting unit, no impairments were recorded.
Long-Lived Assets Other than Goodwill
Long-lived assets other than goodwill consist of property and equipment and intangible assets that have determinable and indefinite lives. The Company makes judgments and estimates regarding the carrying value of these assets, including amounts to be capitalized, depreciation and amortization methods to be applied, estimated useful lives, and possible impairments. Property and equipment and intangible assets with determinable lives are tested for impairment whenever events or changes in circumstances indicate the carrying value of the asset may not be recoverable.
For property and equipment, events or circumstances indicating possible impairment may include a significant decrease in market value or a significant change in the business climate. An impairment loss is recognized when the carrying amount of an asset (asset group) exceeds the estimated undiscounted future cash flows expected to result from the use of the asset (asset group) and its eventual disposition. The amount of the impairment loss is the excess of the asset’s (asset group’s) carrying value over its fair value. Fair value is generally determined using a discounted cash flow analysis.
For intangible assets with definite lives, events or circumstances indicating possible impairment may include an adverse change in the extent or manner in which the asset is being used or a change in the assessment of future operations. The Company assesses the recoverability of the carrying amount by preparing estimates of future revenue, margins, and cash flows. If the sum of expected future cash flows (undiscounted and without interest charges) is less than the carrying amount, an impairment loss is recognized. The impairment loss recognized is the amount by which the carrying amount exceeds the fair value. Fair value of these assets may be determined by a variety of methodologies, including discounted cash flows.
Intangible assets with indefinite lives are not subject to amortization, but are tested for impairment annually during the fourth quarter, or more frequently if an event occurs or circumstances change that would indicate a potential impairment. These circumstances may include, but are not limited to, a significant adverse change in the business climate, unanticipated competition, or a change in projected operations or results of a reporting unit.
The Company assesses whether an indefinite lived intangible impairment exists using both qualitative and quantitative assessments. The qualitative assessment involves determining whether events or circumstances exist that indicate it is more likely than not that the fair value of the indefinite lived intangible is less than its carrying amount. If, based on this qualitative assessment, it is determined that it is not more likely than not that the fair value of the indefinite lived intangible is less than its carrying amount, the Company does not perform a quantitative assessment.
If the qualitative assessment indicates that it is more likely than not that the indefinite-lived intangible asset is impaired or if the Company elects to not perform a qualitative assessment, the Company then performs the quantitative impairment test. The quantitative impairment test for an indefinite-lived intangible asset consists of a comparison of the fair value of the asset with its carrying amount. If the carrying amount of an intangible asset exceeds its fair value, an impairment loss is recognized in an amount equal to that excess. Fair value of these assets may be determined by a variety of methodologies, including discounted cash flows.
The development of future net undiscounted cash flow projections requires management projections of future sales and profitability trends and the estimation of remaining useful lives of assets. These projections are consistent with those projections the Company uses to internally manage operations. When potential impairment is identified, a discounted cash flow valuation model similar to that used to value goodwill at the reporting unit level, incorporating discount rates commensurate with risks associated with each asset, is used to determine the fair value of the asset in order to measure potential impairment. Discount rates are determined by using a weighted average cost of capital (“WACC”). Estimated revenue and WACC assumptions are the most sensitive and susceptible to change in the long-lived asset analysis as they require significant management judgment. The Company believes the assumptions used are reflective of what a market participant would have used in calculating fair value.
Valuation methodologies utilized to evaluate long-lived assets other than goodwill for impairment were consistent with prior periods. Specific assumptions discussed above are updated at each test date to consider current industry and Company-specific risk factors from the perspective of a market participant. The current business climate is subject to evolving market conditions and requires significant management judgment to interpret the potential impact to the Company’s assumptions. To the extent that changes in the current business climate result in adjustments to management projections, impairment losses may be recognized in future periods.
32
The domestic drilling industry has continued to deteriorate since the end of 2015 to levels not seen since April 1999. As the business of the Drilling Technologies segment is closely aligned with the drilling rig count and average U.S. drilling rig count declined 27% during the first quarter of 2016, the drop off in rig count led to a decline in revenue and gross profit of 37% and 69%, respectively, from the fourth quarter of 2015 for the Drilling Technologies segment. As a result of the continued drop in rig count and the significant decline in operations in the first quarter of 2016, the Company concluded these were events or circumstances that caused the Company to test its long-lived assets for impairment within the segment.
During the three months ended March 31, 2016, the Company completed testing for impairment of long-lived assets within the Drilling Technologies segment for four asset groups:
• | Downhole Tools - primarily used in the vertical drilling market; |
• | International Drill Pipe - primarily used in foreign mining operations; |
• | Teledrift Domestic - primarily associated with the Measurement While Drilling (“MWD”) market in the U.S.; and |
• | Teledrift International - primarily associated with the MWD market in international markets. |
Impairment indicators affected both asset groups that are tied directly to the domestic drilling market. While impairment indicators are not present for the International Drill Pipe or Teledrift International asset groups, the Company performed recoverability tests for all four asset groups.
The recoverability test indicated that the undiscounted estimated cash flows of the International Drill Pipe and Teledrift International asset groups exceeded the carrying value of their respective asset groups by approximately $2.6 million and $64.1 million, respectively, or an excess of 98% and 906%, respectively. However, the undiscounted estimated cash flows of the Downhole Tools and Teledrift Domestic asset groups did not exceed the carrying value of their respective asset groups, and therefore, the Company performed a discounted cash flow analysis on each asset group to determine the fair values.
Since the assets in the asset groups are not highly specialized, the Company assumed the current use of each asset would be a similar use as if the assets were sold. As such, the cash flow used in the recoverability test is the same cash flow used to create the discounted cash flow for fair value analysis. This testing indicated that the carrying value of the Downhole Tools and Teledrift Domestic asset groups exceeded the fair value by $9.6 million and $14.3 million, respectively, or an excess of 69% and 56%, respectively. As a result, a combined impairment loss for these two asset groups of $23.9 million was recognized during the three months ended March 31, 2016.
Additionally, the business of the Production Technologies segment incurred similar declines with revenue and gross profit, falling approximately 30% and 42%, respectively. Therefore, the Company completed testing for impairment of long-lived assets within the Production Technologies segment. The recoverability test indicated that the undiscounted estimated cash flows for the segment exceeded the carrying value of assets by $3.0 million, or an excess of 23%. As a result, no impairment of long-lived assets was recognized for the Production Technologies segment.
During the second quarter of 2016, the average U.S. drilling rig count fell 23% versus the first quarter of 2016. The Drilling Technologies segment held revenue relatively flat and improved margins when comparing the second and first quarters of 2016. As such, the Company determined that testing for impairment of long-lived assets was not warranted for the segment.
However, the Production Technologies segment results showed a decline in revenue of 8% and continuing negative margins when comparing the second and first quarters of 2016. Therefore, the Company completed testing for impairment of long-lived assets within the Production Technologies segment. The recoverability test indicated that the undiscounted estimated cash flows for the segment exceeded the carrying value of assets by $4.4 million, or an excess of 34%. As a result, no impairment of long-lived assets was recognized for the Production Technologies segment.
During the third quarter of 2016, the average U.S. drilling rig count rose 28% versus the second quarter of 2016. The Drilling Technologies segment revenue increased 13% and improved margins when comparing the third and second quarters of 2016, while the Production Technologies segment results showed an increase in revenue of 15% and improved margins when comparing the third and second quarters of 2016. As such, the Company determined that testing for impairment of long-lived assets was not warranted for either segment.
Key assumptions and estimates used in performing these recoverability tests were based on experience of the Company’s management, experience with past oil and gas industry downturns and recoveries, and internal, as well as published external, perspectives of recovery timing. Key assumptions used in the recoverability test included:
• | Rental tools are the primary cash generating assets for each group; |
• | Remaining estimated useful life for each group was determined to be 7 years; |
33
• | Carrying amount of the asset group is the net book value of the assets as of March 31, 2016, for first quarter testing and June 30, 2016, for second quarter testing; |
• | Estimates of future cash flows for the group assumed the sale of the group at the end of the remaining useful life of the primary asset; and |
• | Since the Downhole Tools asset group includes product sales in the cash flow analysis, a portion of the inventory was included in the carrying amount of the asset group. The remaining portion of the inventory is normally utilized to repair and fabricate rental tools and is included in cost of goods sold. |
There are significant inherent uncertainties and judgments involved in estimating fair value. A further extension or deepening of the industry downturn could have a negative impact on the cash flow analysis.
The Company cannot predict the occurrence of events or circumstances that could adversely affect the fair value of the asset (asset group). Such events may include, but are not limited to, deterioration of the economic environment, increases in the Company’s weighted average cost of capital, material negative changes in relationships with significant customers, reductions in valuations of other public companies in the Company’s industry, or strategic decisions made in response to economic and competitive conditions. If actual results are not consistent with the Company’s current estimates and assumptions, additional impairment of long-lived assets could be required.
Recent Accounting Pronouncements
Recent accounting pronouncements which may impact the Company are described in Note 2 — “Recent Accounting Pronouncements” in Part I, Item 1 — “Financial Statements” of this Quarterly Report.
Capital Resources and Liquidity
Overview
The Company’s ongoing capital requirements arise from the Company’s need to service debt, acquire and maintain equipment, fund working capital requirements, and when the opportunities arise, to make strategic acquisitions and repurchase Company stock. During the first nine months of 2016, the Company funded capital requirements primarily with operating cash flows, debt financing, and the issuance of company stock.
The Company’s primary source of debt financing is its Credit Facility with PNC Bank. This Credit Facility contains provisions for a revolving credit facility and a term loan secured by substantially all of the Company’s domestic and Canadian real and personal property, including accounts receivable, inventory, land, buildings, equipment, and other intangible assets. As of September 30, 2016, the Company had $32.6 million in outstanding borrowings under the revolving debt portion of the Credit Facility and $10.0 million outstanding under the term loan. Effective September 30, 2016, the Company entered into a Sixth Amendment to the Credit Facility which extends the facility term to May 10, 2020, modifies certain covenants and restrictions, and reestablishes a fixed charge coverage ratio for March 31, 2017 and leverage ratio for June 30, 2017. Significant terms of the Credit Facility are discussed in Note 11 — “Long-Term Debt and Credit Facility” in Part I, Item 1 — “Financial Statements” of this Quarterly Report.
The Company believes it has access to adequate liquidity to fund its ongoing operations, capital expenditures, and required payments on the term loan. As of September 30, 2016, the Company had available borrowing capacity under its revolving line of credit of $22.3 million and available cash of $3.5 million, resulting in total liquidity of $25.8 million. For the remainder of 2016, the Company plans to spend between $2.4 million and $4.4 million for committed and planned capital expenditures. The Company may pursue external financing to increase its liquidity position and/or fund acquisitions when strategic opportunities arise. During the third quarter of 2016, the Company received proceeds, net of issuance costs, of $29.9 million from the private placement of 2.5 million common shares, which was used to pay down outstanding borrowings under the revolving credit facility and to purchase IPI.
Any excess cash generated may be used to pay down the level of debt or retained for future use. The Company does not anticipate repurchasing any shares under its share repurchase programs in the near future.
34
Net Debt
Net debt represents total debt less cash and cash equivalents and combines the Company’s indebtedness and the cash and cash equivalents that could be used to repay that debt. Components of net debt are as follows (in thousands):
September 30, 2016 | September 30, 2015 | ||||||
Cash and cash equivalents | $ | 3,474 | $ | 2,998 | |||
Current portion of long-term debt | (34,562 | ) | (27,727 | ) | |||
Long-term debt, less current portion | (8,000 | ) | (20,041 | ) | |||
Net debt | $ | (39,088 | ) | $ | (44,770 | ) | |
Cash Flows
Consolidated cash flows by type of activity are noted below (in thousands):
Nine months ended September 30, | |||||||
2016 | 2015 | ||||||
Net cash (used in) provided by operating activities | $ | (915 | ) | $ | 17,296 | ||
Net cash used in investing activities | (18,679 | ) | (9,537 | ) | |||
Net cash provided by (used in) financing activities | 20,805 | (5,996 | ) | ||||
Effect of changes in exchange rates on cash and cash equivalents | 55 | (31 | ) | ||||
Net increase in cash and cash equivalents | $ | 1,266 | $ | 1,732 | |||
Operating Activities
Net cash used in operating activities was $0.9 million during the nine months ended September 30, 2016, while net cash provided by operating activities was $17.3 million during the nine months ended September 30, 2015. Consolidated net loss for the nine months ended September 30, 2016, totaled $35.2 million, compared to consolidated net loss of $12.1 million for the nine months ended September 30, 2015.
During the nine months ended September 30, 2016, net non-cash contributions to net income totaled $54.8 million. Contributory non-cash items consisted primarily of $40.4 million for the impairment of inventory and long-lived assets, $11.4 million for depreciation and amortization, and $9.5 million for stock-based compensation expense, partially offset by $6.3 million for changes to deferred income taxes and $1.1 million for net gain on sale of assets.
During the nine months ended September 30, 2015, net non-cash contributions to net income totaled $30.9 million. Contributory non-cash items consisted primarily of $20.4 million for the impairment of inventory and long-lived assets, $13.9 million for depreciation and amortization, and $10.5 million for stock compensation expense, partially offset by $8.7 million for changes to deferred income taxes, $2.2 million for recognized incremental tax benefits related to the Company’s share based awards, and $3.0 million for net gain on sale of assets.
During the nine months ended September 30, 2016, changes in working capital used $20.5 million in cash, primarily resulting from increasing accounts receivable, inventory, income taxes receivable, and other current assets by $22.6 million and decreasing accrued liabilities and income taxes payable by $4.3 million, partially offset by increasing accounts and interest payables by $6.5 million.
During the nine months ended September 30, 2015, changes in working capital used $1.5 million in cash, primarily resulting from increasing inventory and income taxes receivable by $19.6 million and decreasing accounts payable and accrued liabilities by $12.5 million, partially offset by decreasing accounts receivable and other current assets by $27.7 million and increasing income taxes payable by $2.9 million.
Investing Activities
Net cash used in investing activities was $18.7 million for the nine months ended September 30, 2016. Cash used in investing activities primarily included $11.6 million for capital expenditures and $8.3 million for the purchase of IPI and various patents, partially offset by $1.2 million of proceeds received from the sale of fixed assets.
35
Net cash used in investing activities was $9.5 million for the nine months ended September 30, 2015. Cash used in investing activities primarily included $11.1 million for capital expenditures and $1.7 million associated with the purchase of 100% of the assets of IAL and various patents, partially offset by $3.2 million of proceeds received from the sale of fixed assets.
Financing Activities
Net cash generated through financing activities was $20.8 million for the nine months ended September 30, 2016, primarily due to receiving $30.6 million in proceeds from the sale of common stock, inclusive of $29.9 million, net of issuance costs, from the private placement of 2.5 million common shares on July 27, 2016. Cash generated through financing activities was partially offset by using $8.0 million for repayments of debt, net of borrowings, reductions in tax benefit related to stock-based compensation of $0.9 million, and purchases of treasury stock for tax withholding purposes related to vesting of restricted stock awards of $0.9 million.
Net cash used in financing activities was $6.0 million for the nine months ended September 30, 2015. Cash used in financing activities was primarily due to $7.3 million for the repurchase of common stock and $5.4 million for purchases of treasury stock for tax withholding purposes related to vesting of restricted stock awards and the exercise of non-qualified stock options. Cash used in financing activities was partially offset by receiving $3.7 million from borrowings of debt, net of repayments, proceeds from the excess tax benefit related to stock-based compensation of $2.2 million, and proceeds from the sale of common stock of $0.8 million.
Although the Company has no immediate intention to access the capital markets, the Company intends to file a “universal” shelf registration with the Securities and Exchange Commission in the future. This shelf registration statement will register the issuance and sale from time to time of various securities by the Company, including but not limited to senior notes, subordinated notes, preferred stock, common stock, and warrants. Once this shelf registration statement is filed with the Securities and Exchange Commission and becomes effective, the Company will have the financial flexibility to access the capital markets quickly and efficiently from time to time as the need may arise.
Contractual Obligations
Cash flows from operations are dependent on a variety of factors, including fluctuations in operating results, accounts receivable collections, inventory management, and the timing of payments for goods and services. Correspondingly, the impact of contractual obligations on the Company’s liquidity and capital resources in future periods is analyzed in conjunction with such factors.
Material contractual obligations consist of repayment of amounts borrowed on the Company’s Credit Facility with PNC Bank and payment of operating lease obligations. Contractual obligations at September 30, 2016, are as follows (in thousands):
Payments Due by Period | |||||||||||||||||||
Total | Less than 1 year | 1 - 3 years | 3 - 5 years | More than 5 years | |||||||||||||||
Term loan | $ | 10,000 | $ | 2,000 | $ | 4,000 | $ | 4,000 | $ | — | |||||||||
Estimated interest expense on term loan (1) | 1,435 | 553 | 740 | 142 | — | ||||||||||||||
Borrowings under revolving credit facility (2) | 32,562 | 32,562 | — | — | — | ||||||||||||||
Operating lease obligations | 24,835 | 2,900 | 4,900 | 4,047 | 12,988 | ||||||||||||||
Total | $ | 68,832 | $ | 38,015 | $ | 9,640 | $ | 8,189 | $ | 12,988 | |||||||||
(1) Interest expense amounts assume interest rates on this variable rate obligation remain unchanged from September 30, 2016 rates. The weighted-average interest rate is 4.49% at September 30, 2016.
(2) The borrowing is classified as current debt. The weighted-average interest rate is 3.91% at September 30, 2016.
Item 3. Quantitative and Qualitative Disclosures About Market Risk
The Company is exposed to market risk from changes in interest rates, commodity prices, and foreign currency exchange rates. There have been no material changes to the quantitative or qualitative disclosures about market risk set forth in Part II, Item 7A of the Company’s Annual Report.
36
Item 4. Controls and Procedures
Evaluation of Disclosure Controls and Procedures
The Company’s disclosure controls and procedures are designed to ensure that information required to be disclosed by the Company in reports filed or submitted under the Securities Exchange Act of 1934, as amended (the “Exchange Act”), is recorded, processed, summarized and reported within the time periods specified in the SEC’s rules and forms. The Company’s disclosure controls and procedures are also designed to ensure such information is accumulated and communicated to management, including the principal executive and principal financial officers, as appropriate to allow timely decisions regarding required disclosures. There are inherent limitations to the effectiveness of any system of disclosure controls and procedures, including the possibility of human error and the circumvention or overriding of controls and procedures. Accordingly, even effective disclosure controls and procedures can only provide reasonable assurance that control objectives are attained. The Company’s disclosure controls and procedures are designed to provide such reasonable assurance.
The Company’s management, with the participation of the principal executive and principal financial officers, evaluated the effectiveness of the design and operation of the Company’s disclosure controls and procedures as of September 30, 2016, as required by Rule 13a-15(e) of the Exchange Act. Based upon that evaluation, the principal executive and principal financial officers have concluded that the Company’s disclosure controls and procedures were effective as of September 30, 2016.
Changes in Internal Control Over Financial Reporting
There have been no changes in the Company’s system of internal control over financial reporting during the three months ended September 30, 2016, that have materially affected, or are reasonably likely to materially affect, the Company’s internal control over financial reporting.
37
PART II - OTHER INFORMATION
Item 1. Legal Proceedings
Class Action Litigation
In November 2015, four putative securities class action lawsuits were filed in the United States District Court for the Southern District of Texas against the Company and certain of its officers. The lawsuits have been consolidated into a single case, and an amended complaint has been filed. The amended complaint asserts that the Company made false and/or misleading statements, as well as failed to disclose material adverse facts about the Company’s business, operations, and prospects. The complaint seeks an award of damages in an unspecified amount on behalf of a putative class consisting of persons who purchased the Company’s common stock between October 23, 2014 and November 9, 2015, inclusive.
In January 2016, three derivative lawsuits were filed, two in the District Court of Harris County, Texas (which have since been consolidated into one case) and one in the United States District Court for the Southern District of Texas, on behalf of the Company against certain of its officers and its current directors. The lawsuits allege violations of law, breaches of fiduciary duty, and unjust enrichment against the defendants.
The Company believes the class action lawsuit and the derivative lawsuits are without merit, and it intends to vigorously defend against all claims asserted. Discovery has not yet commenced. At this time, the Company is unable to reasonably estimate the outcome of this litigation.
In addition, the U.S. Securities and Exchange Commission has opened an inquiry related to similar issues to those raised in the above-described litigation.
Other Litigation
The Company is subject to routine litigation and other claims that arise in the normal course of business. Management is not aware of any pending or threatened lawsuits or proceedings that are expected to have a material effect on the Company’s financial position, results of operations or liquidity.
Item 1A. Risk Factors
There have been no material changes to the risk factors set forth in Part I, Item 1A of the Company’s Annual Report.
Item 2. Unregistered Sales of Equity Securities and Use of Proceeds
Issuer Purchases of Equity Securities
Repurchases of the Company’s equity securities during the three months ended September 30, 2016, are as follows:
Period | Total Number of Shares Purchased (1) | Average Price Paid per Share | Total Number of Shares Purchased as Part of Publicly Announced Plans or Programs | Maximum Dollar Value of Shares that May Yet be Purchased Under the Plans or Programs (2) (3) (4) | |||||||||
July 1, 2016 to July 31, 2016 | 1,288 | $ | 14.20 | — | $ | 54,907,862 | |||||||
August 1, 2016 to August 31, 2016 | 23,498 | $ | 14.96 | — | $ | 54,907,862 | |||||||
September 1, 2016 to September 30, 2016 | — | $ | — | — | $ | 54,907,862 | |||||||
Total | 24,786 | $ | 14.92 | — | |||||||||
(1) | The Company purchases shares of its common stock (a) to satisfy tax withholding requirements and payment remittance obligations related to period vesting of restricted shares and exercise of non-qualified stock options, (b) to satisfy payments required for common stock upon the exercise of stock options, and (c) as part of a publicly announced repurchase program on the open market. |
(2) | In November 2012, the Company’s Board of Directors authorized the repurchase of up to $25 million of the Company’s common stock. Repurchases may be made in open market or privately negotiated transactions. Through September 30, 2016, the Company has repurchased $20.1 million of its common stock and $4.9 million may yet be used to purchase shares. |
(3) | In June 2015, the Company’s Board of Directors authorized the repurchase of up to an additional $50 million of the Company’s common stock. Repurchases may be made in open market or privately negotiated transactions. Through September 30, 2016, the Company has not repurchased any of its common stock under this authorization and $50.0 million may yet be used to purchase shares. |
(4) | A covenant under the Company’s Credit Facility limits the amount that may be used to repurchase the Company’s common stock. As of September 30, 2016, this covenant limits additional share repurchases to $4.9 million. |
38
Item 3. Defaults Upon Senior Securities
None.
Item 4. Mine Safety Disclosures
Not applicable.
Item 5. Other Information
None.
Item 6. Exhibits
Exhibit Number | Description of Exhibit | |
3.1 | Amended and Restated Certificate of Incorporation (incorporated by reference to Exhibit 3.1 to the Company’s Form 10-Q for the quarter ended September 30, 2007). | |
3.2 | Certificate of Amendment to the Amended and Restated Certificate of Incorporation (incorporated by reference to Exhibit 3.1 to the Company’s Form 10-Q for the quarter ended September 30, 2009). | |
3.3 | Amended and Restated Bylaws, dated December 9, 2014 (incorporated by reference to Exhibit 3.1 to the Company’s Form 8-K filed on December 10, 2014). | |
4.1 | Form of Certificate of Common Stock (incorporated by reference to Appendix E to the Company’s Definitive Proxy Statement filed on September 27, 2001). | |
4.2 | Registration Rights Agreement, dated as of July 26, 2016, by and among the Company, Donald Bramblett, and Mark Kieper (incorporated by reference to Exhibit 4.6 to the Company’s Registration Statement on Form S-3 (File No. 333-212864) filed on August 3, 2016). | |
10.1 | Form of Subscription Agreement, dated as of July 26, 2016 (incorporated by reference to Exhibit 10.1 to the Company’s Form 8-K filed on August 1, 2016). | |
31.1 | * | Rule 13a-14(a) Certification of Principal Executive Officer. |
31.2 | * | Rule 13a-14(a) Certification of Principal Financial Officer. |
32.1 | ** | Section 1350 Certification of Principal Executive Officer. |
32.2 | ** | Section 1350 Certification of Principal Financial Officer. |
101.INS | + | XBRL Instance Document. |
101.SCH | + | XBRL Schema Document. |
101.CAL | + | XBRL Calculation Linkbase Document. |
101.LAB | + | XBRL Label Linkbase Document. |
101.PRE | + | XBRL Presentation Linkbase Document. |
101.DEF | + | XBRL Definition Linkbase Document. |
* | Filed herewith. | |
** | Furnished with this Form 10-Q, not filed. | |
+ | Filed electronically with this Form 10-Q. | |
39
SIGNATURES
Pursuant to the requirements of the Securities Exchange Act of 1934, the registrant has duly caused this report to be signed on its behalf by the undersigned, thereunto duly authorized.
FLOTEK INDUSTRIES, INC. | ||
By: | /s/ JOHN W. CHISHOLM | |
John W. Chisholm | ||
President, Chief Executive Officer and Chairman of the Board | ||
Date: November 2, 2016
FLOTEK INDUSTRIES, INC. | ||
By: | /s/ ROBERT M. SCHMITZ | |
Robert M. Schmitz | ||
Executive Vice President and Chief Financial Officer | ||
Date: November 2, 2016
40