Attached files
| file | filename |
|---|---|
| EX-99.1 - EXHIBIT 99.1 - Great Ajax Corp. | t1602601_ex99-1.htm |
| 8-K - FORM 8-K - Great Ajax Corp. | t1602601_8k.htm |
Exhibit 99.2

Third Quarter 2016 Investor Presentation November 1, 2016

Safe Harbor Disclosure 2 □ We make forward - looking statements in this presentation that are subject to risks and uncertainties. These forward - looking statements include information about possible or assumed future results of our business, financial condition, liquidity, resu lts of operations, cash flow and plans and objectives. When we use the words “believe,” “expect,” “anticipate,” “estimate,” “plan,” “continue,” “intend,” “should,” “may” or similar expressions, we intend to identify forward - looking statements. □ Statements regarding the following subjects, among others, may be forward - looking: market trends in our industry, interest rates, real estate values, the debt financing markets or the general economy or the demand for residential real estate loans; our business and investment strategy; our projected operating results; actions and initiatives of the U.S. government and changes to U.S. government policies and the execution and impact of these actions, initiatives and policies; the state of the U.S. economy generally or in specific geographic regions; economic trends and economic recoveries; our ability to obtain and maintain financing arrangements; changes in the value of our mortgage portfolio; changes to our portfolio of properties; impact of and changes in governmental regulations, tax law and rates, accounting guidance and similar matters; our ability to satisfy the REIT qualification requirements for U.S. federal income tax purposes; availability of qualified personnel; estima tes relating to our ability to make distributions to our stockholders in the future; general volatility of the capital markets an d t he market price of our shares of common stock; and degree and nature of our competition. □ The forward - looking statements are based on our beliefs, assumptions and expectations of our future performance, taking into account all information currently available to us. Forward - looking statements are not predictions of future events. These beliefs, assumptions and expectations can change as a result of many possible events or factors, not all of which are known t o us. If a change occurs, our business, financial condition, liquidity and results of operations may vary materially from those expressed in our forward - looking statements. Furthermore, forward - looking statements are subject to risks and uncertainties, including, among other things, those described under Item 1A of our Annual Report on Form 10 - K for the year ended December 31, 2015, which can be accessed through the link to our SEC filings on our website ( www.great - ajax.com ) or at the SEC's website ( www.sec.gov ). Other risks, uncertainties, and factors that could cause actual results to differ materially from those projected may be described from time to time in reports we file with the SEC, including reports on Forms 10 - Q, 10 - K and 8 - K. Any forward - looking statement speaks only as of the date on which it is made. New risks and uncertainties arise over time, and it is not possible for us to predict those events or how they may affect us. Except as required by law, we are not obligated to, and do not intend to, update or revise any forward - looking statements, whether as a result of new information, future events or otherwise. Unless stated otherwise, financial information included in this presentation is as of September 3 0, 2016.

Business Overview 3 □ Leverage long - standing relationships to acquire loans through privately negotiated transactions from a diverse group of customers – Over 90% of acquisitions by Great Ajax Corp. have been privately negotiated – Acquisitions made in 160 transactions since inception. 14 transactions in Q3 2016. □ Use our manager’s proprietary analytics to price each pool on an asset - by - asset basis □ Adjust individual loan bid price to accumulate clusters of loans in attractive demographic metropolitan areas – Typical acquisitions contain 25 – 100 loans with total market value between $5 – $20 million □ Our affiliated servicer services the loans asset - by - asset and borrower - by - borrower □ Objective is to maximize returns for each asset by utilizing full menu of loss mitigation and asset optimization techniques □ Use moderate non - mark - to - market leverage – Corporate leverage of 1.9x – Seven securitizations since inception totaling $825.8 million of loan UPB. Approximate leverage of 3.1x from the sale of senior bonds – On August 12, 2016, we completed our 7th securitization, Ajax Mortgage Loan Trust 2016 - B. An aggregate of $82.3 million of senior securities with respect to $129.2 million UPB of mortgage loans. Net proceeds from the sale of the senior securities provided leverage of approximately 4.6x the related equity.

Highlights – Quarter Ended September 30, 2016 4 □ Invested $216.2 million in re - performing loans with an aggregate unpaid principal balance (“UPB”) of $259.4 million to end the quarter with a $755.6 million investment in mortgage loans with an aggregate UPB of $948.8 million . □ Portfolio interest income of $18.7 million; net interest income of $11.8 million . □ Net income attributable to common stockholders of $7.6 million . □ Earnings per share (“EPS”) of $0.42 per diluted share. □ Taxable income per share of $0.18 per diluted share. □ Book value per share of $14.99 . □ Raised $ 81.0 million, net, in secured borrowings. □ Sold $78.1 million in re - performing loans with an aggregate unpaid principal balance of $100.3 million to Ajax E Master Trust, the joint venture we established in the first quarter of 2016, and used the proceeds to pay down a repurchase line of credit . □ $23.3 million of cash and cash equivalents at September 30, 2016.

Portfolio Overview – as of September 30, 2016 5 $948.8 MM RPL - $864.1 MM NPL - $84.7 MM $1,146.6MM RPL – $1,028.9 MM NPL – $89.9 MM REO – $27.8 MM 91% 9% Unpaid Principal Balance RPL NPL 89.7% 7.8% 2.4% Property Value RPL NPL REO

Portfolio Growth 6 Re - performing Loans $64 $567 $617 $864 $73 $643 $710 $1,029 $49 $435 $469 $669 0 200 400 600 800 1,000 1,200 Initial Assets (07/08/14) 9/30/2015 12/31/2015 9/30/2016 Millions UPB Property Value Price

Portfolio Growth 7 $113 $111 $85 $117 $117 $90 $64 $68 $53 0 20 40 60 80 100 120 140 Initial Assets (07/08/14) 9/30/2015 12/31/2015 9/30/2016 Millions UPB Property Value Price Non - performing Loans

Portfolio Concentrated in Attractive Markets 8 □ Clusters of loans in attractive, densely populated markets □ Stable liquidity and home prices □ Over 80% of the portfolio in our target markets Target States Target Markets Los Angeles San Diego Dallas Portland Phoenix Washington DC Metro Area Chicago Atlanta Orlando Tampa Miami, Ft. Lauderdale, W. Palm Beach New York / New Jersey Metro Area Las Vegas REIT, Servicer & Manager Headquarters Property Management Business Management

Building Net Asset Value 9 This illustration has not been prepared in accordance with GAAP and is not intended to constitute a non - GAAP financial measure, but rather an additional tool for investors to consider. In evaluating our financial results, management regularly considers the following analysis, which is intended to arrive at a “ne t asset value” equivalent. Based on the leverage from the seven securitizations, securitization investors value our loan portfolio at between $18.81 and $19.18 per share. As shown below, at September 30, 2016, if we were to lever our whole loan portfolio through a securitization, the face value of the equity tranche would be approximately $237.2MM under scenario 1 where the senior attachment point is 65% (similar to our most recen t securitization) and $246.7 MM under scenario 2 where the senior attachment point is 64% (similar to a previous securitization ). Given that our securitization investors currently value the equity tranche at between 30% - 50%, using the average 40%, the value of our equity t ranche would be $94.9MM under scenario 1, which is $78.3MM or $4.18 per share over the remaining basis of $16.6MM. Our current book value pe r share is $14.99. By contrast, our current NAV based on this securitization analysis would be the sum of $14.99 and $4.18, or $19.18 per share. Entire Portfolio 9/30/2016 UPB $948,838,173 Price $722,170,624 Book Value / Share $14.99 Leverage (Bond Face/UPB) Bond Face Value Bond Price Net Proceeds Equity Basis Implied value/Share Implied NAV Per Share Senior 65% $616,744,812.69 100.0% $616,744,813 B1 5% $47,441,908.67 97.3% $46,166,907 B2 5% $47,441,908.67 90% $42,697,718 Equity-Trust Certificate $237,209,543 40% $94,883,817 $16,561,186 $4.18 $19.18 Leverage (Bond Face/UPB) Bond Face Value Bond Price Net Proceeds Equity Basis Implied value/Share Implied NAV Per Share Senior 64% $607,256,430.96 99.8% $606,124,201 B1 5% $47,441,908.67 97.3% $46,166,907 B2 5% $47,441,908.67 90% $42,697,718 Equity-Trust Certificate $246,697,925 40% $98,679,170.03 $27,181,797 $3.82 $18.81
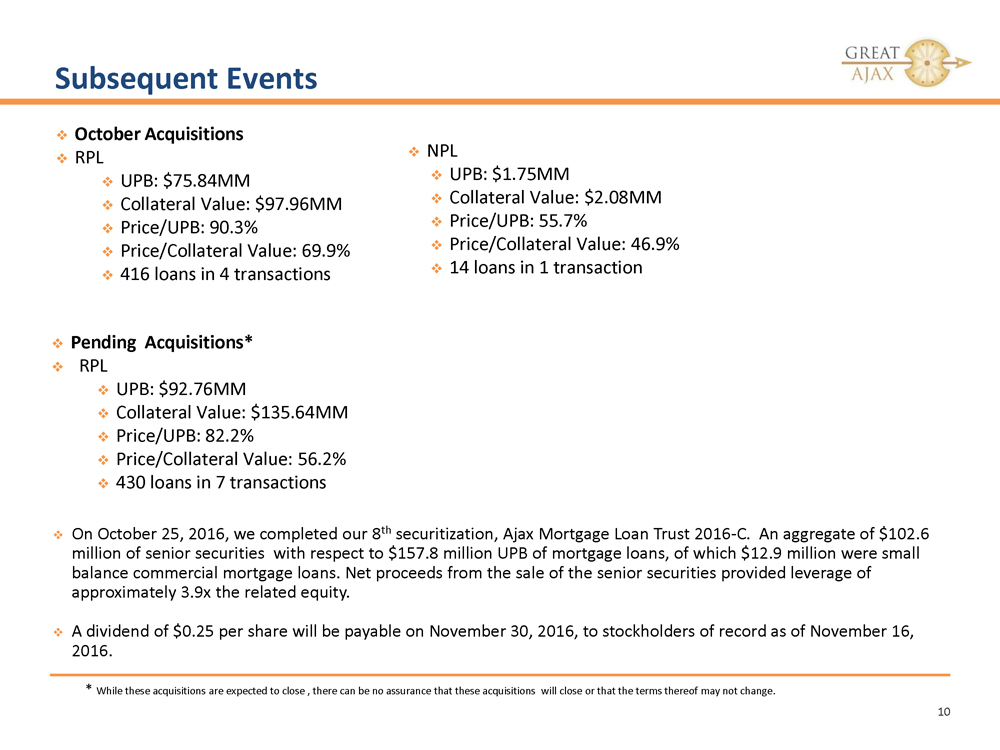
Subsequent Events 10 * While these acquisitions are expected to close , there can be no assurance that these acquisitions will close or that the terms thereof may not change. □ October Acquisitions □ RPL □ UPB: $75.84MM □ Collateral Value: $97.96MM □ Price/UPB: 90.3% □ Price/Collateral Value: 69.9% □ 416 loans in 4 transactions □ Pending Acquisitions* □ RPL □ UPB: $ 92.76 MM □ Collateral Value: $ 135.64 MM □ Price/UPB: 82.2 % □ Price/Collateral Value: 56.2% □ 430 loans in 7 transactions □ On October 25, 2016, we completed our 8 th securitization , Ajax Mortgage Loan Trust 2016 - C. An aggregate of $102.6 million of senior securities with respect to $157.8 million UPB of mortgage loans, of which $12.9 million were small balance commercial mortgage loans. Net proceeds from the sale of the senior securities provided leverage of approximately 3.9x the related equity. □ A dividend of $0.25 per share will be payable on November 30, 2016, to stockholders of record as of November 16, 2016. □ NPL □ UPB: $1.75MM □ Collateral Value: $2.08MM □ Price/UPB: 55.7% □ Price/Collateral Value: 46.9% □ 14 loans in 1 transaction

Consolidated Statements of Income 11 (Dollars in thousands except share and per share amounts) (Unaudited) Three months ended Nine months ended September 30, 2016 September 30, 2015 September 30, 2016 September 30, 2015 INCOME: Loan interest income 18,707$ 14,440$ 50,898$ 32,117$ Interest expense (6,941) (3,849) (17,990) (7,193) Net interest income 11,766 10,591 32,908 24,924 Income from investment in Manager 68 44 158 148 Other income (215) 301 652 707 Total income 11,619 10,936 33,718 25,779 EXPENSE: Related party expense - management fee 1,049 861 2,892 2,464 Related party expense - loan servicing fees 1,556 1,196 4,412 2,703 Loan transaction expense 100 310 887 1,299 Professional fees 315 278 1,137 1,019 Real estate operating expenses 157 128 431 192 Other expense 537 230 1,208 679 Total expense 3,714 3,003 10,967 8,356 Income before provision for income tax 7,905 7,933 22,751 17,423 Provision for income tax 18 8 41 24 Consolidated net income 7,887 7,925 22,710 17,399 264 311 832 709 7,623$ 7,614$ 21,878$ 16,690$ Basic earnings per common share 0.42$ 0.50$ 1.34$ 1.15$ Diluted earnings per common share 0.42$ 0.50$ 1.34$ 1.15$ Weighted average shares - basic 17,937,079 15,273,739 16,334,713 14,514,907 Weighted average shares - diluted 18,664,586 15,926,052 17,010,364 15,180,350 Less: consolidated net income attributable to the noncontrolling interest Consolidated net income attributable to common stockholders

Consolidated Balance Sheets 12 (1) Mortgage loans includes $595,279 and $398,696 of loans transferred to securitization trusts at September 30, 2016 and Decembe r 3 1, 2015, respectively, that are variable interest entities (“VIEs”) that can only be used to settle obligations of the VIEs. Secured borrowings consist of notes issued by VIE s t hat can only be settled with the assets and cash flows of the VIEs. The creditors do not have recourse to the primary beneficiary (Great Ajax Corp). (2) Property held for sale, net, includes a valuation allowance of $0.6 million at September 30, 2016. No valuation allowance wa s r ecorded as of December 31, 2015. (3) Net book value per diluted share was $14.99 and $14.92 at September 30, 2016 and December 31, 2015, respectively (Dollars in thousands except share and per share amounts) ASSETS September 30, 2016 December 31, 2015 Cash and cash equivalents 23,318$ 30,795$ Cash held in trust 35 39 Mortgage loans, net (1) 755,627 554,877 Property held-for-sale 19,505 10,333 Rental property, net 915 58 Receivable from servicer 9,147 5,444 Investment in affiliate 3,923 2,625 Prepaid expenses and other assets 6,762 5,634 Total Assets 819,232$ 609,805$ LIABILITIES AND EQUITY Liabilities: Secured borrowings (1) 416,079$ 265,006$ Borrowings under repurchase agreement 119,232 104,533 Management fee payable 750 667 Accrued expenses and other liabilities 2,164 1,786 Total liabilities 538,225 371,992 Commitments and contingencies (See Note 7) Equity: - - Common stock $.01 par value; 125,000,000 shares authorized, 18,098,311 and 15,301,946 shares issued and outstanding 181 152 Additional paid-in capital 244,641 211,729 Retained earnings 25,803 15,921 Equity attributable to common stockholders 270,625 227,802 Noncontrolling interests 10,382 10,011 Total equity 281,007 237,813 Total Liabilities and Equity 819,232$ 609,805$ Preferred stock $.01 par value; 25,000,000 shares authorized, none issued or outstanding