Attached files
| file | filename |
|---|---|
| EX-32.2 - EX-32.2 - AUTOZONE INC | d253831dex322.htm |
| EX-32.1 - EX-32.1 - AUTOZONE INC | d253831dex321.htm |
| EX-31.2 - EX-31.2 - AUTOZONE INC | d253831dex312.htm |
| EX-31.1 - EX-31.1 - AUTOZONE INC | d253831dex311.htm |
| EX-23.1 - EX-23.1 - AUTOZONE INC | d253831dex231.htm |
| EX-21.1 - EX-21.1 - AUTOZONE INC | d253831dex211.htm |
| EX-12.1 - EX-12.1 - AUTOZONE INC | d253831dex121.htm |
Table of Contents
UNITED STATES
SECURITIES AND EXCHANGE COMMISSION
Washington, D.C. 20549
FORM 10-K
| x | Annual Report pursuant to section 13 or 15(d) of the Securities Exchange Act of 1934 |
For the fiscal year ended August 27, 2016, or
| ¨ | Transition report pursuant to section 13 or 15(d) of the Securities Exchange Act of 1934 |
For the transition period from to .
Commission file number 1-10714

AUTOZONE, INC.
(Exact name of registrant as specified in its charter)
| Nevada | 62-1482048 | |
| (State or other jurisdiction of incorporation or organization) |
(I.R.S. Employer Identification No.) |
| 123 South Front Street, Memphis, Tennessee | 38103 | |
| (Address of principal executive offices) | (Zip Code) |
(901) 495-6500
(Registrant’s telephone number, including area code)
Securities registered pursuant to Section 12(b) of the Act:
| Title of each class |
Name of each exchange on which registered | |
| Common Stock ($.01 par value) |
New York Stock Exchange |
Securities registered pursuant to Section 12(g) of the Act:
None
Indicate by check mark if the Registrant is a well-known seasoned issuer, as defined in Rule 405 of the Securities Act. Yes x No ¨
Indicate by check mark if the Registrant is not required to file reports pursuant to Section 13 or Section 15(d) of the Act. Yes ¨ No x
Indicate by check mark whether the Registrant (1) has filed all reports required to be filed by Section 13 or 15(d) of the Securities Exchange Act of 1934 during the preceding 12 months (or for such shorter period that the registrant was required to file such reports), and (2) has been subject to such filing requirements for the past 90 days. Yes x No ¨
Table of Contents
Indicate by check mark whether the Registrant has submitted electronically and posted on its corporate Web site, if any, every Interactive Data File required to be submitted and posted pursuant to Rule 405 of Regulation S-T (§ 232.405 of this chapter) during the preceding 12 months (or for such shorter period that the Registrant was required to submit and post such files). Yes x No ¨
Indicate by check mark if disclosure of delinquent filers pursuant to Item 405 of Regulation S-K (§ 229.405 of this chapter) is not contained herein, and will not be contained, to the best of Registrant’s knowledge, in definitive proxy or information statements incorporated by reference in Part III of this Form 10-K or any amendment to this Form 10-K. x
Indicate by check mark whether the Registrant is a large accelerated filer, an accelerated filer, a non-accelerated filer, or a smaller reporting company. See the definitions of “large accelerated filer,” “accelerated filer” and “smaller reporting company” in Rule 12b-2 of the Exchange Act.
| Large accelerated filer | x | Accelerated filer | ¨ | |||
| Non-accelerated filer | ¨ | Smaller reporting company | ¨ | |||
Indicate by check mark whether the Registrant is a shell company (as defined in Rule 12b-2 of the Act). Yes ¨ No x
The aggregate market value of the voting and non-voting common equity held by non-affiliates computed by reference to the price at which the common equity was last sold, or the average bid and asked price of such common equity, as of the last business day of the registrant’s most recently completed second fiscal quarter was $21,836,021,743.
The number of shares of Common Stock outstanding as of October 17, 2016, was 28,861,394.
Documents Incorporated By Reference
Portions of the definitive Proxy Statement to be filed within 120 days of August 27, 2016, pursuant to Regulation 14A under the Securities Exchange Act of 1934 for the Annual Meeting of Stockholders to be held on December 14, 2016, are incorporated by reference into Part III.
2
Table of Contents
3
Table of Contents
Forward-Looking Statements
Certain statements contained in this annual report are forward-looking statements. Forward-looking statements typically use words such as “believe,” “anticipate,” “should,” “intend,” “plan,” “will,” “expect,” “estimate,” “project,” “positioned,” “strategy” and similar expressions. These are based on assumptions and assessments made by our management in light of experience and perception of historical trends, current conditions, expected future developments and other factors that we believe to be appropriate. These forward-looking statements are subject to a number of risks and uncertainties, including without limitation: product demand; energy prices; weather; competition; credit market conditions; access to available and feasible financing; the impact of recessionary conditions; consumer debt levels; changes in laws or regulations; war and the prospect of war, including terrorist activity; inflation; the ability to hire and retain qualified employees; construction delays; the compromising of the confidentiality, availability, or integrity of information, including cyber security attacks; and raw material costs of our suppliers. Certain of these risks are discussed in more detail in the “Risk Factors” section contained in Item 1A under Part 1 of this Annual Report on Form 10-K for the year ended August 27, 2016, and these Risk Factors should be read carefully. Forward-looking statements are not guarantees of future performance and actual results; developments and business decisions may differ from those contemplated by such forward-looking statements, and events described above and in the “Risk Factors” could materially and adversely affect our business. Forward-looking statements speak only as of the date made. Except as required by applicable law, we undertake no obligation to update publicly any forward-looking statements, whether as a result of new information, future events or otherwise. Actual results may materially differ from anticipated results.
4
Table of Contents
AutoZone, Inc. (“AutoZone,” the “Company,” “we,” “our” or “us”) is the nation’s leading retailer and a leading distributor of automotive replacement parts and accessories in the United States. We began operations in 1979 and at August 27, 2016, operated 5,297 AutoZone stores in the United States, including Puerto Rico; 483 stores in Mexico; eight stores in Brazil; and 26 Interamerican Motor Corporation (“IMC”) branches. Each AutoZone store carries an extensive product line for cars, sport utility vehicles, vans and light trucks, including new and remanufactured automotive hard parts, maintenance items, accessories and non-automotive products. At August 27, 2016, in 4,390 of our domestic AutoZone stores we also had a commercial sales program that provides commercial credit and prompt delivery of parts and other products to local, regional and national repair garages, dealers, service stations and public sector accounts. We also have commercial programs in AutoZone stores in Mexico and Brazil. IMC branches carry an extensive line of original equipment quality import replacement parts. We also sell the ALLDATA brand automotive diagnostic and repair software through www.alldata.com and www.alldatadiy.com. Additionally, we sell automotive hard parts, maintenance items, accessories and non-automotive products through www.autozone.com, and accessories, performance and replacement parts through www.autoanything.com, and our commercial customers can make purchases through www.autozonepro.com and www.imcparts.net. We do not derive revenue from automotive repair or installation services.
At August 27, 2016, our AutoZone stores and IMC branches were in the following locations:
| Location Count |
||||
| Alabama |
108 | |||
| Alaska |
8 | |||
| Arizona |
133 | |||
| Arkansas |
62 | |||
| California |
570 | |||
| Colorado |
81 | |||
| Connecticut |
46 | |||
| Delaware |
15 | |||
| Florida |
295 | |||
| Georgia |
194 | |||
| Hawaii |
3 | |||
| Idaho |
27 | |||
| Illinois |
235 | |||
| Indiana |
153 | |||
| Iowa |
27 | |||
| Kansas |
47 | |||
| Kentucky |
95 | |||
| Louisiana |
121 | |||
| Maine |
12 | |||
| Maryland |
66 | |||
| Massachusetts |
80 | |||
| Michigan |
185 | |||
| Minnesota |
52 | |||
| Mississippi |
89 | |||
| Missouri |
111 | |||
| Montana |
13 | |||
| Nebraska |
19 | |||
| Nevada |
63 | |||
| New Hampshire |
22 | |||
| New Jersey |
88 | |||
| New Mexico |
62 | |||
| New York |
179 | |||
| North Carolina |
210 | |||
5
Table of Contents
| North Dakota |
3 | |||
| Ohio |
256 | |||
| Oklahoma |
74 | |||
| Oregon |
42 | |||
| Pennsylvania |
169 | |||
| Puerto Rico |
40 | |||
| Rhode Island |
17 | |||
| South Carolina |
86 | |||
| South Dakota |
6 | |||
| Tennessee |
163 | |||
| Texas |
585 | |||
| Utah |
56 | |||
| Vermont |
2 | |||
| Virginia |
118 | |||
| Washington |
87 | |||
| Washington, DC |
5 | |||
| West Virginia |
43 | |||
| Wisconsin |
66 | |||
| Wyoming |
8 | |||
|
|
|
|||
| Total Domestic AutoZone stores |
5,297 | |||
| Mexico |
483 | |||
| Brazil |
8 | |||
|
|
|
|||
| Total AutoZone stores |
5,788 | |||
| IMC branches |
26 | |||
|
|
|
|||
| Total locations |
5,814 | |||
|
|
|
Marketing and Merchandising Strategy
We are dedicated to providing customers with superior service and trustworthy advice as well as quality automotive parts and products at a great value in conveniently located, well-designed stores. Key elements of this strategy are:
Customer Service
Customer service is the most important element in our marketing and merchandising strategy, which is based upon consumer marketing research. We emphasize that our AutoZoners (employees) should always put customers first by providing prompt, courteous service and trustworthy advice. Our electronic parts catalog assists in the selection of parts as well as identifying any associated warranties that are offered by us or our vendors. We sell automotive hard parts, maintenance items, accessories and non-automotive parts through www.autozone.com for pick-up in store or to be shipped directly to a customer’s home or business. Additionally, we offer smartphone apps that provide customers with store locations, driving directions, operating hours, ability to purchase products and product availability.
Our stores generally open at 7:30 or 8 a.m. and close between 8 and 10 p.m. Monday through Saturday and typically open at 9 a.m. and close between 6 and 9 p.m. on Sunday. However, some stores are open 24 hours, and some have extended hours of 6 or 7 a.m. until midnight seven days a week.
We also provide specialty tools through our Loan-A-Tool program. Customers can borrow a specialty tool, such as a steering wheel puller, for which a do-it-yourself (“DIY”) customer or a repair shop would have little or no use other than for a single job. AutoZoners also provide other free services, including check engine light readings where allowed by law, battery charging, the collection of used oil for recycling and the testing of starters, alternators and batteries.
6
Table of Contents
Merchandising
The following tables show some of the types of products that we sell by major category of items:
| Failure |
Maintenance |
Discretionary | ||
| A/C Compressors Batteries & Accessories Bearings Belts & Hoses Calipers Carburetors Chassis Clutches CV Axles Engines Fuel Pumps Fuses Ignition Lighting Mufflers Radiators Tire Repair Thermostats Starters & Alternators Water Pumps |
Antifreeze & Windshield Washer Fluid Brake Drums, Rotors, Shoes & Pads Chemicals, including Brake
& Power Oil & Transmission Fluid Oil, Air, Fuel & Transmission Filters Oxygen Sensors Paint & Accessories Refrigerant & Accessories Shock Absorbers & Struts Spark Plugs & Wires Windshield Wipers |
Air Fresheners Cell Phone Accessories Drinks & Snacks Floor Mats & Seat Covers Interior and Exterior Accessories Mirrors Performance Products Protectants & Cleaners Sealants & Adhesives Steering Wheel Covers Stereos & Radios Tools Wash & Wax |
We believe that the satisfaction of our customers is often impacted by our ability to provide specific automotive products as requested. Each store carries the same basic products, but we tailor our hard parts inventory to the makes and models of the vehicles in each store’s trade area, and our sales floor products are tailored to the local store’s demographics. Our hub stores (including mega hubs, which carry an even broader assortment) carry a larger assortment of products that are delivered to local satellite stores. We are constantly updating the products we offer to ensure that our inventory matches the products our customers need or desire.
Pricing
We want to be perceived by our customers as the value leader in our industry, by consistently providing quality merchandise at the right price, backed by a satisfactory warranty and outstanding customer service. For many of our products, we offer multiple value choices in a good/better/best assortment, with appropriate price and quality differences from the “good” products to the “better” and “best” products. A key differentiating component versus our competitors is our exclusive line of in-house brands, which includes the Valucraft, AutoZone, SureBilt, ProElite, Duralast, Duralast Max, Duralast Gold, Duralast Platinum and Duralast ProPower brands. We believe that our overall value compares favorably to that of our competitors.
Brand Marketing: Advertising and Promotions
We believe that targeted advertising and promotions play important roles in succeeding in today’s environment. We are constantly working to understand our customers’ wants and needs so that we can build long-lasting, loyal relationships. We utilize promotions, advertising and loyalty card programs primarily to advise customers about the overall importance of vehicle maintenance, our great value and the availability of high quality parts. Broadcast and internet media are our primary advertising methods of driving traffic to our stores. We utilize in-store signage, in-store circulars and creative product placement and promotions to help educate customers about products that they need.
Store Design and Visual Merchandising
We design and build stores for high visual impact. The typical AutoZone store utilizes colorful exterior and interior signage, exposed beams and ductwork and brightly lit interiors. Maintenance products, accessories and non-automotive items are attractively displayed for easy browsing by customers. In-store signage and special displays promote products on floor displays, end caps and shelves.
7
Table of Contents
Our commercial sales program operates in a highly fragmented market, and we are one of the leading distributors of automotive parts and other products to local, regional and national repair garages, dealers, service stations and public sector accounts in the United States, Puerto Rico and Mexico. As a part of the domestic store program, we offer credit and delivery to our customers, as well as online ordering through www.autozonepro.com and www.imcparts.net. Through our hub stores, we offer a greater range of parts and products desired by professional technicians. We have dedicated sales teams focused on independent repair shops as well as national, regional and public sector commercial accounts.
Store Formats
Substantially all AutoZone stores are based on standard store formats, resulting in generally consistent appearance, merchandising and product mix. Approximately 85% to 90% of each store’s square footage is selling space, of which approximately 40% to 45% is dedicated to hard parts inventory. The hard parts inventory area is generally fronted by counters or pods that run the depth or length of the store, dividing the hard parts area from the remainder of the store. The remaining selling space contains displays of maintenance, accessories and non-automotive items.
We believe that our stores are “destination stores,” generating their own traffic rather than relying on traffic created by adjacent stores. Therefore, we situate most stores on major thoroughfares with easy access and good parking.
Store Personnel and Training
Each store typically employs from 10 to 16 AutoZoners, including a manager and, in some cases, an assistant manager. We provide on-the-job training as well as formal training programs, including an annual national sales meeting, regular store meetings on specific sales and product topics, standardized training manuals and computer based modules and a specialist program that provides training to AutoZoners in several areas of technical expertise from the Company, our vendors and independent certification agencies. All domestic AutoZoners are encouraged to complete tests resulting in certifications by the National Institute for Automotive Service Excellence (“ASE”), which is broadly recognized for training certification in the automotive industry. Training is supplemented with frequent store visits by management.
Store managers, sales representatives, commercial sales managers and managers at various levels across the organization receive financial incentives through performance-based bonuses. In addition, our growth has provided opportunities for the promotion of qualified AutoZoners. We believe these opportunities are important to attract, motivate and retain high quality AutoZoners.
All store support functions are centralized in our store support centers located in Memphis, Tennessee; Monterrey, Mexico; Chihuahua, Mexico; Sao Paulo, Brazil and Canoga Park, California. We believe that this centralization enhances consistent execution of our merchandising and marketing strategies at the store level, while reducing expenses and cost of sales.
Store Automation
All of our AutoZone stores have Z-net, our proprietary electronic catalog that enables our AutoZoners to efficiently look up the parts that our customers need and to provide complete job solutions, advice and information for customer vehicles. Z-net provides parts information based on the year, make, model and engine type of a vehicle and also tracks inventory availability at the store, at other nearby stores and through special order. The Z-net display screens are placed on the hard parts counter or pods, where both the AutoZoner and customer can view the screen.
Our AutoZone stores utilize our computerized proprietary Store Management System, which includes bar code scanning and point-of-sale data collection terminals. The Store Management System provides administrative assistance and improved personnel scheduling at the store level, as well as enhanced merchandising information and improved inventory control. We believe the Store Management System also enhances customer service through faster processing of transactions and simplified warranty and product return procedures.
8
Table of Contents
The following table reflects our location development during the past five fiscal years:
| Fiscal Year | ||||||||||||||||||||
| 2016 | 2015 | 2014 | 2013 | 2012 | ||||||||||||||||
| Beginning locations |
5,609 | 5,391 | 5,201 | 5,006 | 4,813 | |||||||||||||||
| Acquired locations(1) |
— | 17 | — | — | — | |||||||||||||||
| New locations |
205 | 202 | 190 | 197 | 193 | |||||||||||||||
| Closed locations |
— | 1 | — | 2 | — | |||||||||||||||
|
|
|
|
|
|
|
|
|
|
|
|||||||||||
| Net new locations |
205 | 201 | 190 | 195 | 193 | |||||||||||||||
|
|
|
|
|
|
|
|
|
|
|
|||||||||||
| Relocated locations |
6 | 5 | 8 | 11 | 10 | |||||||||||||||
|
|
|
|
|
|
|
|
|
|
|
|||||||||||
| Ending locations |
5,814 | 5,609 | 5,391 | 5,201 | 5,006 | |||||||||||||||
|
|
|
|
|
|
|
|
|
|
|
|||||||||||
| (1) | Includes 17 IMC branches acquired on September 27, 2014. |
We believe that expansion opportunities exist in markets that we do not currently serve, as well as in markets where we can achieve a larger presence. We undertake substantial research prior to entering new markets. The most important criteria for opening a new AutoZone store or IMC branch are the projected future profitability and the ability to achieve our required investment hurdle rate. Key factors in selecting new site and market locations for AutoZone stores and IMC branches include population, demographics, vehicle profile, customer buying trends, commercial businesses, number and strength of competitors’ stores and the cost of real estate. In reviewing the vehicle profile, we also consider the number of vehicles that are seven years old and older, or “our kind of vehicles”; these vehicles are generally no longer under the original manufacturers’ warranties and require more maintenance and repair than newer vehicles. We seek to open new AutoZone stores in high visibility sites in high traffic locations within or contiguous to existing market areas and attempt to cluster development in markets in a relatively short period of time. When selecting future sites and market locations for our IMC branches, we look for locations close to major highways to support IMC’s delivery schedule and also consider the population of AutoZone stores in the market. In addition to continuing to lease or develop our own locations, we evaluate and may make strategic acquisitions.
Merchandise is selected and purchased for all AutoZone stores through our store support centers located in Memphis, Tennessee; Monterrey, Mexico and Sao Paulo, Brazil. Merchandise is selected and purchased for all IMC branches through our store support center located in Canoga Park, California. In fiscal 2016, one class of similar products accounted for approximately 11 percent of our total sales, and one vendor supplied approximately 10 percent of our purchases. No other class of similar products accounted for 10 percent or more of our total sales, and no other individual vendor provided more than 10 percent of our total purchases. We believe that alternative sources of supply exist, at similar costs, for most types of product sold. Most of our merchandise flows through our distribution centers to our AutoZone stores and IMC branches by our fleet of tractors and trailers or by third-party trucking firms.
We ended fiscal 2016 with 182 hub stores, which have a larger assortment of products as well as regular replenishment items that can be delivered to a store in its network within 24 hours. Hub stores are generally replenished from distribution centers multiple times per week. Hub stores have increased our ability to distribute products on a timely basis to many of our stores and to expand our product assortment.
During fiscal 2014 and 2015, we tested two new concepts of our supply chain strategy, increased delivery frequency to our stores utilizing our distribution centers and significantly expanded parts assortments in select stores we call mega hubs. Our tests were concluded during fiscal 2015, and both initiatives were expanded to additional locations in fiscal 2016.
Increased delivery frequency focuses on improving our in-stock position of our core store-stocked product by providing deliveries to certain stores multiple times per week. We ended fiscal 2016 with over 1,900 stores receiving deliveries multiple times per week, an increase of approximately 1,000 stores since fiscal 2015.
9
Table of Contents
A mega hub store carries inventory of 80,000 to 100,000 unique SKUs, approximately twice what a hub store carries. Mega hubs provide coverage to both surrounding stores and other hub stores multiple times a day or on an overnight basis. We ended fiscal 2016 with 11 mega hubs, an increase of six since fiscal 2015.
The sale of automotive parts, accessories and maintenance items is highly competitive in many areas, including name recognition, product availability, customer service, store location and price. AutoZone competes in the aftermarket auto parts industry, which includes both the retail DIY and commercial do-it-for-me (“DIFM”) auto parts and products markets.
Competitors include national, regional and local auto parts chains, independently owned parts stores, online parts stores, wholesale distributors, jobbers, repair shops, car washes and auto dealers, in addition to discount and mass merchandise stores, department stores, hardware stores, supermarkets, drugstores, convenience stores, home stores, and other online retailers that sell aftermarket vehicle parts and supplies, chemicals, accessories, tools and maintenance parts. AutoZone competes on the basis of customer service, including the trustworthy advice of our AutoZoners; merchandise quality, selection and availability; price; product warranty; store layouts, location and convenience; and the strength of our AutoZone brand name, trademarks and service marks.
We have registered several service marks and trademarks in the United States Patent and Trademark office as well as in certain other countries, including our service marks, “AutoZone” and “Get in the Zone,” and trademarks, “AutoZone,” “Duralast,” “Duralast Gold,” “Duralast Platinum,” “Duralast ProPower,” “Duralast ProPower Plus,” “Duralast ProPower Ultra,” “Duralast ProPower AGM,” “Valucraft,” “ProElite,” “SureBilt,” “ALLDATA,” “AutoAnything,” “IMC,” “Loan-A-Tool” and “Z-net.” We believe that these service marks and trademarks are important components of our marketing and merchandising strategies.
As of August 27, 2016, we employed over 84,000 persons, approximately 59 percent of whom were employed full-time. About 91 percent of our AutoZoners were employed in stores or in direct field supervision, approximately 5 percent in distribution centers and approximately 4 percent in store support and other functions. Included in the above numbers are approximately 7,500 persons employed in our Mexico and Brazil operations.
We have never experienced any material labor disruption and believe that relations with our AutoZoners are good.
AutoZone’s primary website is at http://www.autozone.com. We make available, free of charge, at our investor relations website, http://www.autozoneinc.com, our Annual Reports on Form 10-K, Quarterly Reports on Form 10-Q, Current Reports on Form 8-K, proxy statements, registration statements and amendments to those reports filed or furnished pursuant to Section 13(a) or 15(d) of the Securities and Exchange Act of 1934, as amended, as soon as reasonably feasible after we electronically file such material with, or furnish it to, the Securities and Exchange Commission.
Executive Officers of the Registrant
The following list describes our executive officers. The title of each executive officer includes the words “Customer Satisfaction” which reflects our commitment to customer service. Officers are elected by and serve at the discretion of the Board of Directors.
William C. Rhodes, III, 51 — Chairman, President and Chief Executive Officer, Customer Satisfaction
William C. Rhodes, III, was named Chairman of AutoZone during fiscal 2007 and has been President, Chief Executive Officer and a director since March 2005. Prior to his appointment as President and Chief Executive Officer, Mr. Rhodes was Executive Vice President – Store Operations and Commercial. Previously, he held several key management positions with the Company. Prior to 1994, Mr. Rhodes was a manager with Ernst & Young LLP. Mr. Rhodes is a member of the Board of Directors for Dollar General Corporation, a discount retailer offering a broad selection of merchandise, including consumables, seasonal, home products and apparel.
10
Table of Contents
William T. Giles, 57 — Chief Financial Officer and Executive Vice President – Finance, Information Technology and ALLDATA, Customer Satisfaction
William T. Giles was named Chief Financial Officer and Executive Vice President – Finance, Information Technology and ALLDATA during October 2012. Prior to that, he was Chief Financial Officer and Executive Vice President – Finance, Information Technology and Store Development from 2007 to 2012; Executive Vice President, Chief Financial Officer and Treasurer from June 2006 to December 2006; and Executive Vice President, Chief Financial Officer since May 2006. From 1991 to May 2006, he held several positions with Linens N’ Things, Inc., most recently as the Executive Vice President and Chief Financial Officer. Prior to 1991, he was with Melville, Inc. and PricewaterhouseCoopers. Mr. Giles is a member of the Board of Directors for Brinker International, which owns, operates and franchises the Chili’s Grill & Bar and Maggiano’s Little Italy restaurant concepts.
Mark A. Finestone, 55 — Executive Vice President – Merchandising, Supply Chain and Marketing, Customer Satisfaction
Mark A. Finestone was named Executive Vice President – Merchandising, Supply Chain and Marketing during October 2015. Previously, he was Senior Vice President – Merchandising and Store Development since 2014, Senior Vice President – Merchandising from 2008 to 2014, and Vice President – Merchandising from 2002 to 2008. Prior to joining AutoZone in 2002, Mr. Finestone worked for May Department Stores for 19 years where he held a variety of leadership roles which included Divisional Vice President, Merchandising.
William W. Graves, 56 — Executive Vice President – Mexico, Brazil, IMC and Store Development, Customer Satisfaction
William W. Graves was named Executive Vice President – Mexico, Brazil, IMC and Store Development during October 2015. Previously, he was Senior Vice President – Supply Chain and International since 2012. Prior thereto, he was Senior Vice President – Supply Chain from 2006 to 2012 and Vice President – Supply Chain from 2000 to 2006. From 1992 to 2000, Mr. Graves served in various capacities with the Company.
Thomas B. Newbern, 54 — Executive Vice President – Store Operations, Commercial and Loss Prevention, Customer Satisfaction
Thomas B. Newbern was named Executive Vice President – Store Operations, Commercial and Loss Prevention during October 2015. Prior to that, he was Senior Vice President – Store Operations and Loss Prevention since 2014 and Senior Vice President – Store Operations and Store Development since 2012. Previously, Mr. Newbern held the titles Senior Vice President – Store Operations from 2007 to 2012 and Vice President – Store Operations from 1998 to 2007. Prior thereto, he held several key management positions with the Company.
Philip B. Daniele, 47 — Senior Vice President – Commercial, Customer Satisfaction
Philip B. Daniele was elected Senior Vice President – Commercial during November 2015. Prior to that, he was Vice President – Commercial since 2013 and Vice President – Merchandising from 2008 to 2013. Previously, he was Vice President – Store Operations from 2005 to 2008. From 1993 until 2008, Mr. Daniele served in various capacities within the Company.
Ronald B. Griffin, 62 — Senior Vice President and Chief Information Officer, Customer Satisfaction
Ronald B. Griffin was elected Senior Vice President and Chief Information Officer during June 2012. Prior to that, he was Senior Vice President, Global Information Technology at Hewlett-Packard Company. During his tenure at Hewlett-Packard Company, he also served as the Chief Information Officer for the Enterprise Business Division. Prior to that, Mr. Griffin was Executive Vice President and Chief Information Officer for Fleming Companies, Inc. He also spent over 12 years with The Home Depot, Inc., with the last eight years in the role of Chief Information Officer. Mr. Griffin also served at Deloitte & Touche LLP and Delta Air Lines, Inc.
James C. Griffith, 51 — Senior Vice President – Store Operations, Customer Satisfaction
James C. Griffith was named Senior Vice President – Store Operations in November 2015. Prior to that, he was Vice President – Store Development since October 2010 and Vice President – Store Operations since 2007. Prior thereto, he held several key management positions within the Company.
11
Table of Contents
William R. Hackney, 51 — Senior Vice President – Merchandising, Customer Satisfaction
William R. Hackney was named Senior Vice President, Merchandising in October 2015. His career with AutoZone began in 1983, and he has held several key management roles within the Company, including Vice President – Store Operations Support and Vice President – Merchandising.
Rodney C. Halsell, 48 — Senior Vice President –Supply Chain, Customer Satisfaction
Rodney C. Halsell was named Senior Vice President – Supply Chain during October 2015. Prior to that, he was Vice President – Distribution since 2005. From 1985 to 2005, he held several key management positions and served in various capacities with the Company.
Charlie Pleas, III, 51 — Senior Vice President and Controller, Customer Satisfaction
Charlie Pleas, III, was elected Senior Vice President and Controller during 2007. Prior to that, he was Vice President and Controller since 2003. Previously, he was Vice President – Accounting since 2000, and Director of General Accounting since 1996. Prior to joining AutoZone, Mr. Pleas was a Division Controller with Fleming Companies, Inc. where he served in various capacities since 1988. Mr. Pleas is a member of the Board of Directors for Kirkland’s, Inc., a specialty retailer of home décor and gifts.
Albert Saltiel, 52 — Senior Vice President – Marketing and E-Commerce, Customer Satisfaction
Albert Saltiel was named Senior Vice President – Marketing and E-Commerce during October 2014. Previously, he was elected Senior Vice President – Marketing since 2013. Prior to that, he was Chief Marketing Officer and a key member of the leadership team at Navistar International Corporation. Mr. Saltiel has also been with Sony Electronics as General Manager, Marketing, and Ford Motor Company where he held multiple marketing roles.
Richard C. Smith, 52 — Senior Vice President – Human Resources, Customer Satisfaction
Richard C. Smith was elected Senior Vice President – Human Resources in December 2015. He has been an AutoZoner since 1985, previously holding the position of Vice President of Stores since 1997. Prior thereto, he served in various capacities with the Company.
Kristen C. Wright, 40 — Senior Vice President – General Counsel & Secretary, Customer Satisfaction
Kristen C. Wright was named Senior Vice President – General Counsel & Secretary effective January 2014. She previously held the title of Vice President – Assistant General Counsel & Assistant Secretary from January 2012 to January 2014. Before joining AutoZone, she was a partner with the law firm of Bass, Berry & Sims PLC.
Our business is subject to a variety of risks. Set forth below are certain of the important risks that we face, the occurrence of which could have a material adverse effect on our business. These risks are not the only ones we face. Our business could also be affected by additional factors that are presently unknown to us or that we currently believe to be immaterial to our business.
If demand for our products slows, then our business may be materially adversely affected.
Demand for the products we sell may be affected by a number of factors we cannot control, including:
| • | the number and age of vehicles in current service. More vehicles on the road lead to more maintenance and repairs, and vehicles seven years old or older are generally no longer under the original vehicle manufacturers’ warranties and tend to need more maintenance and repair than newer vehicles. |
| • | rising energy prices. Increases in energy prices may cause our customers to defer purchases of certain of our products as they use a higher percentage of their income to pay for gasoline and other energy costs and may drive their vehicles less, resulting in less wear and tear and lower demand for repairs and maintenance. |
12
Table of Contents
| • | the economy. In periods of declining economic conditions, both retail and commercial customers may defer vehicle maintenance or repairs. Additionally, such conditions may affect our customers’ ability to obtain credit. During periods of expansionary economic conditions, more of our DIY customers may pay others to repair and maintain their cars instead of working on their own vehicles, or they may purchase new vehicles. |
| • | the weather. Mild weather conditions may lower the failure rates of automotive parts, while wet conditions may cause our customers to defer maintenance and repair on their vehicles. Extremely hot or cold conditions may enhance demand for our products due to increased failure rates of our customers’ automotive parts. |
| • | technological advances. Advances in automotive technology and parts design can result in cars needing maintenance less frequently and parts lasting longer. |
For the long term, demand for our products may be affected by:
| • | the number of miles vehicles are driven annually. Higher vehicle mileage increases the need for maintenance and repair. Mileage levels may be affected by gas prices and other factors. |
| • | the quality of the vehicles manufactured by the original vehicle manufacturers and the length of the warranties or maintenance offered on new vehicles. |
| • | restrictions on access to telematics and diagnostic tools and repair information imposed by the original vehicle manufacturers or by governmental regulation, which may cause vehicle owners to rely on dealers to perform maintenance and repairs. |
All of these factors could result in immediate and longer term declines in the demand for our products, which could adversely affect our sales, cash flows and overall financial condition.
If we are unable to compete successfully against other businesses that sell the products that we sell, we could lose customers and our sales and profits may decline.
The sale of automotive parts, accessories and maintenance items is highly competitive, and sales volumes are dependent on many factors, including name recognition, product availability, customer service, store location and price. Competitors are opening locations near our existing locations. AutoZone competes as a provider in both the DIY and DIFM auto parts and accessories markets.
Our competitors include national, regional and local auto parts chains, independently owned parts stores, online parts stores, wholesale distributors, jobbers, repair shops, car washes and auto dealers, in addition to discount and mass merchandise stores, hardware stores, supermarkets, drugstores, convenience stores, home stores and other online retailers that sell aftermarket vehicle parts and supplies, chemicals, accessories, tools and maintenance parts. Although we believe we compete effectively on the basis of customer service, including the knowledge and expertise of our AutoZoners; merchandise quality, selection and availability; product warranty; store layout, location and convenience; price; and the strength of our AutoZone brand name, trademarks and service marks, some of our competitors may gain competitive advantages, such as greater financial and marketing resources allowing them to sell automotive products at lower prices, larger stores with more merchandise, longer operating histories, more frequent customer visits and more effective advertising. With the increasing use of digital tools and social media, and our competitors’ increased focus on optimizing customers’ online experience, our customers are quickly able to compare prices, product assortment and feedback from other customers before purchasing our products either online, in the physical stores, or through a combination of both offerings. If we are unable to continue to develop successful competitive strategies, or if our competitors develop more effective strategies, we could lose customers and our sales and profits may decline.
13
Table of Contents
We may not be able to sustain our historic rate of sales growth.
We have increased our location count in the past five fiscal years, growing from 4,813 locations at August 27, 2011, to 5,814 locations at August 27, 2016, an average location increase per year of 4%. Additionally, we have increased annual revenues in the past five fiscal years from $8.073 billion in fiscal 2011 to $10.636 billion in fiscal 2016, an average increase per year of 6%. Annual revenue growth is driven by the opening of new locations and commercial programs and increases in same store sales. We open new locations only after evaluating customer buying trends and market demand/needs, all of which could be adversely affected by persistent unemployment, wage cuts, small business failures and microeconomic conditions unique to the automotive industry. Same store sales are impacted both by customer demand levels and by the prices we are able to charge for our products, which can also be negatively impacted by the economic pressures mentioned above. We cannot provide any assurance that we will continue to open locations at historical rates or continue to achieve increases in same store sales.
Consolidation among our competitors may negatively impact our business.
Recently some of our competitors have merged. Consolidation among our competitors could enhance their market share and financial position, provide them with the ability to achieve better purchasing terms and provide more competitive prices to customers for whom we compete, and allow them to utilize merger synergies and cost savings to increase advertising and marketing budgets to more effectively compete for customers. Consolidation by our competitors could also increase their access to local market parts assortment. These consolidated competitors could take sales volume away from us in certain markets, could cause us to change our pricing with a negative impact on our margins or could cause us to spend more money to maintain customers or seek new customers, all of which could negatively impact our business.
If we cannot profitably increase our market share in the commercial auto parts business, our sales growth may be limited.
Although we are one of the largest sellers of auto parts in the commercial market, we must effectively compete against national and regional auto parts chains, independently owned parts stores, wholesalers and jobbers in order to increase our commercial market share. Although we believe we compete effectively in the commercial market on the basis of customer service, merchandise quality, selection and availability, price, product warranty, distribution locations and the strength of our AutoZone brand name, trademarks and service marks, some automotive aftermarket chains have been in business for substantially longer periods of time than we have, and as a result have developed long-term customer relationships and have large available inventories. If we are unable to profitably develop new commercial customers, our sales growth may be limited.
A downgrade in our credit ratings or a general disruption in the credit markets could make it more difficult for us to access funds, refinance our debt, obtain new funding or issue securities.
Our short-term and long-term debt is rated investment grade by the major rating agencies. These investment-grade credit ratings have historically allowed us to take advantage of lower interest rates and other favorable terms on our short-term credit lines, in our senior debt offerings and in the commercial paper markets. To maintain our investment-grade ratings, we are required to meet certain financial performance ratios. A change by the rating agencies in these ratios, an increase in our debt, and/or a decline in our earnings could result in downgrades in our credit ratings. A downgrade in our credit ratings could limit our access to public debt markets, limit the institutions willing to provide credit facilities to us, result in more restrictive financial and other covenants in our public and private debt and would likely significantly increase our overall borrowing costs and adversely affect our earnings.
Moreover, significant deterioration in the financial condition of large financial institutions in recent years resulted in a severe loss of liquidity and availability of credit in global credit markets and in more stringent borrowing terms. During brief time intervals in recent years, there was limited liquidity in the commercial paper markets, resulting in an absence of commercial paper buyers and extraordinarily high interest rates on commercial paper. We can provide no assurance that credit market events such as those that occurred in recent years will not occur again in the foreseeable future. Conditions and events in the global credit markets could have a material adverse effect on our access to short-term debt and the terms and cost of that debt.
14
Table of Contents
Significant changes in macroeconomic and geo-political factors could adversely affect our financial condition and results of operations.
Macroeconomic conditions impact both our customers and our suppliers. Job growth in the United States has remained relatively slow during the past five years; however, towards the end of fiscal 2015 and continuing through fiscal 2016, the unemployment rate has improved to pre-recession levels. Moreover, the United States government continues to operate under historically large deficits and debt burden. Continued distress in global credit markets, business failures, significant geo-political conflicts, continued volatility in energy prices and other factors continue to affect the global economy. Moreover, rising energy prices could impact our merchandise distribution, commercial delivery, utility and product costs. Over the short term, such factors could positively impact our business. Over a longer period of time, all of these macroeconomic and geo-political conditions could adversely affect our sales growth, margins and overhead, which could adversely affect our financial condition and operations.
Our business depends upon hiring and retaining qualified employees.
We believe that much of our brand value lies in the quality of the more than 84,000 AutoZoners employed in our stores, distribution centers, store support centers, ALLDATA, AutoAnything and IMC. Our workforce costs represent our largest operating expense, and our business is subject to employment laws and regulations, including requirements related to minimum wage. We cannot be assured that we can continue to hire and retain qualified employees at current wage rates. If we are unable to hire, properly train and/or retain qualified employees, we could experience higher employment costs, reduced sales, losses of customers and diminution of our brand, which could adversely affect our earnings. If we do not maintain competitive wages, our customer service could suffer due to a declining quality of our workforce or, alternatively, our earnings could decrease if we increase our wage rates. A violation or change in employment laws and/or regulations could have a material adverse effect on our results of operations, financial condition and cash flows.
Inability to acquire and provide quality merchandise at competitive prices could adversely affect our sales and results of operations.
We are dependent upon our domestic and international vendors continuing to supply us with quality merchandise at favorable prices and payment terms. If our merchandise offerings do not meet our customers’ expectations regarding quality and safety, we could experience lost sales, increased costs and exposure to legal and reputational risk. All of our vendors must comply with applicable product safety laws, and we are dependent on them to ensure that the products we buy comply with all safety and quality standards. Events that give rise to actual, potential or perceived product safety concerns could expose us to government enforcement action or private litigation and result in costly product recalls and other liabilities. To the extent our suppliers are subject to added government regulation of their product design and/or manufacturing processes, the cost of the merchandise we purchase may rise. In addition, negative customer perceptions regarding the safety or quality of the products we sell could cause our customers to seek alternative sources for their needs, resulting in lost sales. In those circumstances, it may be difficult and costly for us to rebuild our reputation and regain the confidence of our customers. Moreover, our vendors are impacted by global economic conditions. Credit market and other macroeconomic conditions could have a material adverse effect on the ability of our suppliers to finance and operate their businesses, resulting in increased product costs and difficulties in meeting our inventory demands. If any of our significant vendors experience financial difficulties or otherwise are unable to deliver merchandise to us on a timely basis, or at all, we could have product shortages in our stores that could adversely affect customers’ perceptions of us and cause us to lose customers and sales.
We directly imported approximately 10% of our purchases (measured at cost) in fiscal 2016, but many of our domestic vendors directly import their products or components of their products. Changes to the prices and flow of these goods for any reason, such as political unrest or acts of war, currency fluctuations, disruptions in maritime lanes, port labor disputes and economic conditions and instability in the countries in which foreign suppliers are located, the financial instability of suppliers, suppliers’ failure to meet our standards, issues with labor practices of our suppliers or labor problems they may experience (such as strikes, stoppages or slowdowns, which could also increase labor costs during and following the disruption), the availability and cost of raw materials to suppliers, increased import duties, merchandise quality or safety issues, transport availability and
15
Table of Contents
cost, increases in wage rates and taxes, transport security, inflation and other factors relating to the suppliers and the countries in which they are located or from which they import, are beyond our control and could adversely affect our operations and profitability. In addition, the United States’ foreign trade policies, tariffs and other impositions on imported goods, trade sanctions imposed on certain countries, the limitation on the importation of certain types of goods or of goods containing certain materials from other countries and other factors relating to foreign trade and port labor agreements are beyond our control. These and other factors affecting our suppliers and our access to products could adversely affect our business and financial performance. As we increase our imports of merchandise from foreign vendors, the risks associated with these imports also will increase.
Our ability to grow depends in part on new location openings, existing location remodels and expansions and effective utilization of our existing supply chain and hub network.
Our continued growth and success will depend in part on our ability to open and operate new locations and expand and remodel existing locations to meet customers’ needs on a timely and profitable basis. Accomplishing our new and existing location expansion goals will depend upon a number of factors, including the ability to partner with developers and landlords to obtain suitable sites for new and expanded locations at acceptable costs, the hiring and training of qualified personnel, particularly at the location management level, and the integration of new locations into existing operations. There can be no assurance we will be able to achieve our location expansion goals, manage our growth effectively, successfully integrate the planned new locations into our operations or operate our new, remodeled and expanded locations profitably.
In addition, we extensively utilize our hub network, our supply chain and logistics management techniques to efficiently stock our locations. We have made, and plan to continue to make, significant investments in our supply chain to improve our ability to provide the best parts at the right price. If we fail to effectively utilize our existing hubs and/or supply chains or if our investments in our supply chain and global sourcing initiative do not provide the anticipated benefits, we could experience sub-optimal inventory levels in our locations or increase our costs, which could adversely affect our sales volume and/or our margins.
Our failure to protect our reputation could have a material adverse effect on our brand name and profitability.
We believe our continued strong sales growth is driven in significant part by our brand name. The value in our brand name and its continued effectiveness in driving our sales growth are dependent to a significant degree on our ability to maintain our reputation for safety, high product quality, friendliness, service, trustworthy advice, integrity and business ethics. Any negative publicity about these areas could damage our reputation and may result in reduced demand for our merchandise. The increasing use of technology also poses a risk as customers are able to quickly compare products and prices and use social media to provide feedback in a manner that is rapidly and broadly dispersed. Our reputation could be impacted if a customer has a bad experience and shares it over social media.
Failure to comply with ethical, social, product, labor, environmental and anti-corruption standards could also jeopardize our reputation and potentially lead to various adverse actions by consumer or environmental groups, employees or regulatory bodies. Failure to comply with applicable laws and regulations, to maintain an effective system of internal controls or to provide accurate and timely financial statement information could also hurt our reputation. If we fail to comply with existing or future laws or regulations, we may be subject to governmental or judicial fines or sanctions, while incurring substantial legal fees and costs. In addition, our capital and operating expenses could increase due to implementation of and compliance with existing and future laws and regulations or remediation measures that may be required if we are found to be noncompliant with any existing or future laws or regulations. The inability to pass through any increased expenses through higher prices would have an adverse effect on our results of operations.
Damage to our reputation or loss of consumer confidence for any of these or other reasons could have a material adverse effect on our results of operations and financial condition, as well as require additional resources to rebuild our reputation.
16
Table of Contents
Our success in international operations is dependent on our ability to manage the unique challenges presented by international markets.
The various risks we face in our U.S. operations generally also exist when conducting operations in and sourcing products and materials from outside of the U.S., as well as unique costs and difficulties of managing international operations. Our expansion into international markets may be adversely affected by local laws and customs, U.S. laws applicable to foreign operations and political and economic conditions. Risks inherent in international operations also include potential adverse tax consequences, compliance with the Foreign Corrupt Practices Act and local anti-bribery law, greater difficulty in enforcing intellectual property rights, challenges to identify and gain access to local suppliers and possibly misjudging the response of consumers in foreign countries to our product assortment and marketing strategy.
In addition, our operations in international markets are conducted primarily in the local currency of those countries. Since our consolidated financial statements are denominated in U.S. dollars, amounts of assets, liabilities, net sales and other revenues and expenses denominated in local currencies must be translated into U.S. dollars using exchange rates for the current period. As a result, foreign currency exchange rates and fluctuations in those rates may adversely impact our financial performance.
Failure to protect the privacy and security of customers’, suppliers’, AutoZoners’ or Company information could damage our reputation, subject us to litigation and cause us to incur substantial costs.
Our business, like that of most retailers and distributors, involves the receipt, storage and transmission of personal information about our customers, suppliers and AutoZoners, some of which is entrusted to third-party service providers and vendors. Failure to protect the security of our customers’, suppliers’, employees’ and company information could subject us to costly regulatory enforcement actions, expose us to litigation and impair our reputation, which may have a negative impact on our sales. While we and our third-party service providers and vendors take significant steps to protect customer, supplier, employee and other confidential information, including maintaining compliance with payment card industry standards, these security measures may be breached in the future due to cyber-attack, employee error, fraud, trickery, hacking or other intentional or unintentional acts, and unauthorized parties may obtain access to this data. The methods used to obtain unauthorized access are constantly evolving, and may be difficult to anticipate or detect for long periods of time. As the regulatory environment related to information security, data collection and use and privacy becomes increasingly rigorous, compliance with these requirements could also result in additional costs.
We rely heavily on our information technology systems for our key business processes. Any failure or interruption in these systems could have a material adverse impact on our business.
We rely extensively on our information technology systems, some of which are managed or provided by third-party service providers, to manage inventory, process transactions and summarize results. Our systems and the third-party systems we rely on are subject to damage or interruption from power outages, telecommunications failures, computer viruses, security breaches, catastrophic events and design or usage errors by our AutoZoners, contractors or third-party service providers. Although we and our third-party service providers work diligently to maintain our respective systems, we may not be successful in doing so. If our systems are damaged or fail to function properly, we may incur substantial costs to repair or replace them, and may experience loss of critical data and interruptions or delays in our ability to manage inventories or process transactions, which could result in lost sales, inability to process purchase orders and/or a potential loss of customer loyalty, which could adversely affect our results of operations.
Business interruptions may negatively impact our location hours, operability of our computer and other systems, availability of merchandise and otherwise have a material negative effect on our sales and our business.
War or acts of terrorism, political unrest, hurricanes, windstorms, fires, earthquakes, floods and other natural or other disasters or the threat of any of them, may result in certain of our locations being closed for a period of time or permanently or have a negative impact on our ability to obtain merchandise available for sale in our locations. Some of our merchandise is imported from other countries. If imported goods become difficult or impossible to bring into the United States, and if we cannot obtain such merchandise from other sources at similar costs, our sales and profit margins may be negatively affected.
17
Table of Contents
In the event that commercial transportation is curtailed or substantially delayed, our business may be adversely impacted, as we may have difficulty shipping merchandise to our distribution centers and locations resulting in lost sales and/or a potential loss of customer loyalty. Transportation issues could also cause us to cancel purchase orders if we are unable to receive merchandise in our distribution centers.
Item 1B. Unresolved Staff Comments
None.
The following table reflects the square footage and number of leased and owned properties for our AutoZone stores as of August 27, 2016:
| No. of AZ Stores |
AZ Store Square Footage |
|||||||
| Leased |
2,989 | 19,303,087 | ||||||
| Owned |
2,799 | 18,895,143 | ||||||
|
|
|
|
|
|||||
| Total |
5,788 | 38,198,230 | ||||||
|
|
|
|
|
|||||
We have approximately 4.6 million square feet in distribution centers servicing our AutoZone stores, of which approximately 1.9 million square feet is leased and the remainder is owned. Our nine distribution centers are located in Arizona, California, Georgia, Illinois, Ohio, Pennsylvania, Tennessee, Texas and Mexico. We currently have a second distribution center in Mexico under construction that is expected to open in early fiscal 2017 and two additional domestic distribution centers under development. Of our 26 IMC branches, 25 branches, consisting of 854,228 square feet, are leased, and one branch, consisting of approximately 23 thousand square feet, is owned. Our primary store support center is located in Memphis, Tennessee, and consists of approximately 260,000 square feet. We also have three additional AutoZone store support centers located in Monterrey, Mexico; Chihuahua, Mexico and Sao Paulo, Brazil, and an IMC branch support center located in Canoga Park, California. The ALLDATA headquarters building in Elk Grove, California and the AutoAnything headquarters space in San Diego, California are leased, and we also own or lease other properties that are not material in the aggregate.
In 2004, we acquired a store site in Mount Ephraim, New Jersey that had previously been the site of a gasoline service station and contained evidence of groundwater contamination. Upon acquisition, we voluntarily reported the groundwater contamination issue to the New Jersey Department of Environmental Protection (“NJDEP”) and entered into a Voluntary Remediation Agreement providing for the remediation of the contamination associated with the property. We have conducted and paid for (at an immaterial cost to us) remediation of contamination on the property. We have also voluntarily investigated and addressed potential vapor intrusion impacts in downgradient residences and businesses. The NJDEP has asserted, in a Directive and Notice to Insurers dated February 19, 2013 and again in an Amended Directive and Notice to Insurers dated January 13, 2014 (collectively the “Directives”), that we are liable for the downgradient impacts under a joint and severable liability theory. By letter dated April 23, 2015, NJDEP has demanded payment from us, and other parties, in the amount of approximately $296 thousand for costs incurred by NJDEP in connection with contamination downgradient of the property. By letter dated January 29, 2016, we were informed that NJDEP has filed a lien against the property in connection with approximately $355 thousand in costs incurred by NJDEP in connection with contamination downgradient of the property. We have contested, and will continue to contest, any such assertions due to the existence of other entities/sources of contamination, some of which are named in the Directives and the April 23, 2015 Demand, in the area of the property. Pursuant to the Voluntary Remediation Agreement, upon completion of all remediation required by the agreement, we believe we should be eligible to be reimbursed up to 75 percent of qualified remediation costs by the State of New Jersey. We have asked the state for clarification that the agreement applies to off-site work, and the state is considering the request. Although the aggregate amount of additional costs that we may incur pursuant to the remediation cannot currently be ascertained, we do not currently believe that fulfillment of our obligations under the agreement or otherwise will result in costs that are material to our financial condition, results of operations or cash flow.
18
Table of Contents
In July 2014, we received a subpoena from the District Attorney of the County of Alameda, along with other environmental prosecutorial offices in the state of California, seeking documents and information related to the handling, storage and disposal of hazardous waste. We received notice that the District Attorney will seek injunctive and monetary relief. We are cooperating fully with the request and cannot predict the ultimate outcome of these efforts, although we have accrued all amounts we believe to be probable and reasonably estimable. We do not believe the ultimate resolution of this matter will have a material adverse effect on our consolidated financial position, results of operations or cash flows.
In April 2016, we received a letter from the California Air Resources Board seeking payment for alleged violations of the California Health and Safety Code related to the sale of certain aftermarket emission parts in the State of California. We do not believe that any resolution of the matter will have a material adverse effect on our consolidated financial position, results of operations or cash flows.
We are involved in various other legal proceedings incidental to the conduct of our business, including several lawsuits containing class-action allegations in which the plaintiffs are current and former hourly and salaried employees who allege various wage and hour violations and unlawful termination practices. We do not currently believe that, either individually or in the aggregate, these matters will result in liabilities material to our financial condition, results of operations or cash flows.
Item 4. Mine Safety Disclosures
Not applicable.
19
Table of Contents
Item 5. Market for Registrant’s Common Equity, Related Stockholder Matters and Issuer Purchases of Equity Securities
Our common stock is listed on the New York Stock Exchange under the symbol “AZO.” On October 17, 2016, there were 2,486 stockholders of record, which does not include the number of beneficial owners whose shares were represented by security position listings.
We currently do not pay a dividend on our common stock. Our ability to pay dividends is subject to limitations imposed by Nevada law. Any future payment of dividends would be dependent upon our financial condition, capital requirements, earnings and cash flow.
The following table sets forth the high and low sales prices per share of common stock, as reported by the New York Stock Exchange, for the periods indicated:
| Price Range of Common Stock |
||||||||
| Fiscal Year ended August 27, 2016: | High | Low | ||||||
| Fourth quarter |
$ | 815.98 | $ | 742.08 | ||||
| Third quarter |
$ | 805.40 | $ | 748.51 | ||||
| Second quarter |
$ | 796.09 | $ | 695.46 | ||||
| First quarter |
$ | 797.29 | $ | 714.37 | ||||
| Fiscal Year Ended August 29, 2015: |
||||||||
| Fourth quarter |
$ | 754.90 | $ | 662.70 | ||||
| Third quarter |
$ | 705.00 | $ | 612.68 | ||||
| Second quarter |
$ | 627.30 | $ | 566.08 | ||||
| First quarter |
$ | 576.00 | $ | 491.93 | ||||
During 1998, the Company announced a program permitting the Company to repurchase a portion of its outstanding shares not to exceed a dollar maximum established by the Company’s Board of Directors. The program was most recently amended on September 22, 2016, to increase the repurchase authorization by $750 million. This brings the total value of shares authorized to $17.9 billion.
Shares of common stock repurchased by the Company during the quarter ended August 27, 2016, were as follows:
| Period |
Total |
Average |
Total Number of |
Maximum Dollar |
||||||||||||
| May 8, 2016, to June 4, 2016 |
123,763 | $ | 767.61 | 123,763 | $ | 670,086,276 | ||||||||||
| June 5, 2016, to July 2, 2016 |
270,246 | 758.42 | 270,246 | 465,125,581 | ||||||||||||
| July 3, 2016, to July 30, 2016 |
— | — | — | 465,125,581 | ||||||||||||
| July 31, 2016, to August 27, 2016 |
88,200 | 791.09 | 88,200 | 395,351,207 | ||||||||||||
|
|
|
|
|
|
|
|
|
|||||||||
| Total |
482,209 | $ | 766.76 | 482,209 | $ | 395,351,207 | ||||||||||
|
|
|
|
|
|
|
|
|
|||||||||
The Company also repurchased, at market value, an additional 12,460 shares in fiscal 2016, 15,594 shares in fiscal 2015 and 16,013 shares in fiscal 2014 from employees electing to sell their stock under the Company’s Sixth Amended and Restated Employee Stock Purchase Plan (the “Employee Plan”), qualified under Section 423 of the Internal Revenue Code, under which all eligible employees may purchase AutoZone’s common stock at 85% of the lower of the market price of the common stock on the first day or last day of each calendar quarter through payroll deductions. Maximum permitted annual purchases are $15,000 per employee or 10 percent of compensation, whichever is less. Under the Employee Plan, 12,662 shares were sold to employees in fiscal 2016, 14,222 shares in fiscal 2015 and 15,355 shares were sold to employees in fiscal 2014. At August 27, 2016, 192,505 shares of common stock were reserved for future issuance under the Employee Plan.
20
Table of Contents
Once executives have reached the maximum purchases under the Employee Plan, the Fifth Amended and Restated Executive Stock Purchase Plan (the “Executive Plan”) permits all eligible executives to purchase AutoZone’s common stock up to 25 percent of his or her annual salary and bonus. Purchases by executives under the Executive Plan were 1,943 shares in fiscal 2016, 2,229 shares in fiscal 2015 and 3,028 shares in fiscal 2014. At August 27, 2016, 241,753 shares of common stock were reserved for future issuance under the Executive Plan.
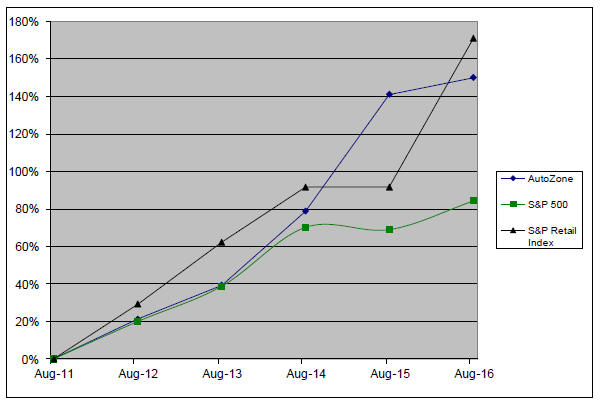
Stock Performance Graph
The graph below presents changes in the value of AutoZone’s stock as compared to Standard & Poor’s 500 Composite Index (“S&P 500”) and to Standard & Poor’s Retail Index (“S&P Retail Index”) for the five-year period beginning August 27, 2011 and ending August 27, 2016.
21
Table of Contents
Item 6. Selected Financial Data
| (in thousands, except per share data, same store sales and
selected |
Fiscal Year Ended August | |||||||||||||||||||
| 2016 | 2015 | 2014 | 2013(1) | 2012 | ||||||||||||||||
| Income Statement Data |
||||||||||||||||||||
| Net sales |
$ | 10,635,676 | $ | 10,187,340 | $ | 9,475,313 | $ | 9,147,530 | $ | 8,603,863 | ||||||||||
| Cost of sales, including warehouse and delivery expenses |
5,026,940 | 4,860,309 | 4,540,406 | 4,406,595 | 4,171,827 | |||||||||||||||
|
|
|
|
|
|
|
|
|
|
|
|||||||||||
| Gross profit |
5,608,736 | 5,327,031 | 4,934,907 | 4,740,935 | 4,432,036 | |||||||||||||||
| Operating, selling, general and administrative expenses |
3,548,341 | 3,373,980 | 3,104,684 | 2,967,837 | 2,803,145 | |||||||||||||||
|
|
|
|
|
|
|
|
|
|
|
|||||||||||
| Operating profit |
2,060,395 | 1,953,051 | 1,830,223 | 1,773,098 | 1,628,891 | |||||||||||||||
| Interest expense, net |
147,681 | 150,439 | 167,509 | 185,415 | 175,905 | |||||||||||||||
|
|
|
|
|
|
|
|
|
|
|
|||||||||||
| Income before income taxes |
1,912,714 | 1,802,612 | 1,662,714 | 1,587,683 | 1,452,986 | |||||||||||||||
| Income tax expense |
671,707 | 642,371 | 592,970 | 571,203 | 522,613 | |||||||||||||||
|
|
|
|
|
|
|
|
|
|
|
|||||||||||
| Net income |
$ | 1,241,007 | $ | 1,160,241 | $ | 1,069,744 | $ | 1,016,480 | $ | 930,373 | ||||||||||
|
|
|
|
|
|
|
|
|
|
|
|||||||||||
| Diluted earnings per share |
$ | 40.70 | $ | 36.03 | $ | 31.57 | $ | 27.79 | $ | 23.48 | ||||||||||
|
|
|
|
|
|
|
|
|
|
|
|||||||||||
| Adjusted weighted average shares for diluted earnings per share |
30,488 | 32,206 | 33,882 | 36,581 | 39,625 | |||||||||||||||
|
|
|
|
|
|
|
|
|
|
|
|||||||||||
| Same Store Sales |
||||||||||||||||||||
| Increase in domestic comparable store net sales(2) |
2.4 | % | 3.8 | % | 2.8 | % | 0.0 | % | 3.9 | % | ||||||||||
| Balance Sheet Data |
||||||||||||||||||||
| Current assets |
$ | 4,239,573 | $ | 3,970,294 | $ | 3,580,612 | $ | 3,278,013 | $ | 2,978,946 | ||||||||||
| Working capital (deficit) |
(450,747 | ) | (742,579 | ) | (960,482 | ) | (891,137 | ) | (676,646 | ) | ||||||||||
| Total assets |
8,599,787 | 8,102,349 | 7,497,163 | 6,869,167 | 6,248,934 | |||||||||||||||
| Current liabilities |
4,690,320 | 4,712,873 | 4,541,094 | 4,169,150 | 3,655,592 | |||||||||||||||
| Debt |
4,924,119 | 4,624,876 | 4,323,106 | 4,164,078 | 3,751,478 | |||||||||||||||
| Long-term capital leases |
102,451 | 87,639 | 83,098 | 73,925 | 72,414 | |||||||||||||||
| Stockholders’ (deficit) |
(1,787,538 | ) | (1,701,390 | ) | (1,621,857 | ) | (1,687,319 | ) | (1,548,025 | ) | ||||||||||
| Selected Operating Data |
||||||||||||||||||||
| Number of locations at beginning of year |
5,609 | 5,391 | 5,201 | 5,006 | 4,813 | |||||||||||||||
| Acquired locations(3) |
— | 17 | — | — | — | |||||||||||||||
| New locations |
205 | 202 | 190 | 197 | 193 | |||||||||||||||
| Closed locations |
— | 1 | — | 2 | — | |||||||||||||||
|
|
|
|
|
|
|
|
|
|
|
|||||||||||
| Net new locations |
205 | 201 | 190 | 195 | 193 | |||||||||||||||
|
|
|
|
|
|
|
|
|
|
|
|||||||||||
| Relocated locations |
6 | 5 | 8 | 11 | 10 | |||||||||||||||
|
|
|
|
|
|
|
|
|
|
|
|||||||||||
| Number of locations at end of year |
5,814 | 5,609 | 5,391 | 5,201 | 5,006 | |||||||||||||||
|
|
|
|
|
|
|
|
|
|
|
|||||||||||
| AutoZone domestic commercial programs |
4,390 | 4,141 | 3,845 | 3,421 | 3,053 | |||||||||||||||
| Inventory per location (in thousands) |
$ | 625 | $ | 610 | $ | 582 | $ | 550 | $ | 525 | ||||||||||
| Total AutoZone store square footage (in thousands) |
38,198 | 36,815 | 35,424 | 34,076 | 32,706 | |||||||||||||||
| Average square footage per AutoZone store |
6,600 | 6,587 | 6,571 | 6,552 | 6,533 | |||||||||||||||
| Increase in AutoZone store square footage |
3.8 | % | 3.9 | % | 4.0 | % | 4.2 | % | 4.4 | % | ||||||||||
| Average net sales per AutoZone store (in thousands) |
$ | 1,773 | $ | 1,761 | $ | 1,724 | $ | 1,736 | $ | 1,716 | ||||||||||
| Net sales per AutoZone store square foot |
$ | 269 | $ | 268 | $ | 263 | $ | 265 | $ | 263 | ||||||||||
| Total employees at end of year (in thousands) |
84 | 81 | 76 | 71 | 70 | |||||||||||||||
| Inventory turnover(4) |
1.4x | 1.4x | 1.5x | 1.6x | 1.6x | |||||||||||||||
| Accounts payable to inventory ratio |
112.8 | % | 112.9 | % | 114.9 | % | 115.6 | % | 111.4 | % | ||||||||||
| After-tax return on invested capital(5) |
31.3 | % | 31.2 | % | 32.1 | % | 32.9 | % | 33.1 | % | ||||||||||
| Adjusted debt to EBITDAR(6) |
2.5 | 2.5 | 2.5 | 2.5 | 2.5 | |||||||||||||||
| Net cash provided by operating activities (in thousands) |
$ | 1,577,329 | $ | 1,525,123 | $ | 1,341,234 | $ | 1,415,011 | $ | 1,223,981 | ||||||||||
| Cash flow before share repurchases and changes in debt (in thousands)(7) |
$ | 1,166,987 | $ | 1,018,440 | $ | 924,706 | $ | 1,007,761 | $ | 949,627 | ||||||||||
| Share repurchases (in thousands) |
$ | 1,452,462 | $ | 1,271,416 | $ | 1,099,212 | $ | 1,387,315 | $ | 1,362,869 | ||||||||||
| Number of shares repurchased (in thousands) |
1,903 | 2,010 | 2,232 | 3,511 | 3,795 | |||||||||||||||
| (1) | The fiscal year ended August 31, 2013 consisted of 53 weeks. |
| (2) | The domestic comparable sales increases are based on sales for all AutoZone domestic stores open at least one year. Relocated stores are included in the same store sales computation based on the year the original store was opened. Closed store sales are included in the same store sales computation up to the week it closes, and excluded from the computation for all periods subsequent to closing. In addition, beginning in fiscal 2013, it also includes all sales through our www.autozone.com website, including consumer direct ship-to-home sales. All prior period same store sales have been restated to be comparable. The effect of including sales from AutoZone branded websites was not material to any period. |
| (3) | Includes 17 IMC branches acquired on September 27, 2014. |
22
Table of Contents
| (4) | Inventory turnover is calculated as cost of sales divided by the average merchandise inventory balance over the trailing 5 quarters. |
| (5) | After-tax return on invested capital is defined as after-tax operating profit (excluding rent charges) divided by invested capital (which includes a factor to capitalize operating leases). See Reconciliation of Non-GAAP Financial Measures in Management’s Discussion and Analysis of Financial Condition and Results of Operations. |
| (6) | Adjusted debt to EBITDAR is defined as the sum of total debt, capital lease obligations and annual rents times six; divided by net income plus interest, taxes, depreciation, amortization, rent and share-based compensation expense. See Reconciliation of Non-GAAP Financial Measures in Management’s Discussion and Analysis of Financial Condition and Results of Operations. |
| (7) | Cash flow before share repurchases and changes in debt is defined as the change in cash and cash equivalents less the change in debt plus treasury stock purchases. See Reconciliation of Non-GAAP Financial Measures in Management’s Discussion and Analysis of Financial Condition and Results of Operations. |
Item 7. Management’s Discussion and Analysis of Financial Condition and Results of Operations
We are the nation’s leading retailer, and a leading distributor, of automotive replacement parts and accessories in the United States. We began operations in 1979 and at August 27, 2016, operated 5,297 AutoZone stores in the United States, including Puerto Rico; 483 stores in Mexico; eight stores in Brazil; and 26 IMC branches. Each AutoZone store carries an extensive product line for cars, sport utility vehicles, vans and light trucks, including new and remanufactured automotive hard parts, maintenance items, accessories and non-automotive products. At August 27, 2016, in 4,390 of our domestic AutoZone stores, we also had a commercial sales program that provides commercial credit and prompt delivery of parts and other products to local, regional and national repair garages, dealers, service stations and public sector accounts. We also have commercial programs in AutoZone stores in Mexico and Brazil. IMC branches carry an extensive line of original equipment quality import replacement parts. We also sell the ALLDATA brand automotive diagnostic and repair software through www.alldata.com and www.alldatadiy.com. Additionally, we sell automotive hard parts, maintenance items, accessories and non-automotive products through www.autozone.com, and accessories, performance and replacement parts through www.autoanything.com, and our commercial customers can make purchases through www.autozonepro.com and www.imcparts.net. We do not derive revenue from automotive repair or installation services.
Executive Summary
We achieved strong performance in fiscal 2016, delivering record net income of $1.241 billion, a 7.0% increase over the prior year, and sales growth of $448.3 million, a 4.4% increase over the prior year. Both our retail sales and commercial sales grew this past year, as we continue to build our internal sales force and refine our parts assortment.
Our business is impacted by various factors within the economy that affect both our consumer and our industry, including but not limited to fuel costs, unemployment rates and other economic conditions. Given the nature of these macroeconomic factors, we cannot predict whether or for how long certain trends will continue, nor can we predict to what degree these trends will impact us in the future.
One macroeconomic factor affecting our customers and our industry during fiscal 2016 was gas prices. During fiscal 2016, the average price per gallon of unleaded gasoline in the United States was $2.14 per gallon, compared to $2.69 per gallon during fiscal 2015. We believe reduced gas prices gave our customers additional disposable income. With approximately 11 billion gallons of unleaded gas consumption each month across the U.S., each $1 decrease at the pump contributes approximately $11 billion of additional spending capacity to consumers each month. Given the unpredictability of gas prices, we cannot predict whether gas prices will increase or decrease, nor can we predict how any future changes in gas prices will impact our sales in future periods.
During fiscal 2016, failure and maintenance related categories represented the largest portion of our sales mix, at approximately 84% of total sales, with failure related categories continuing to be our largest set of categories. While we have not experienced any fundamental shifts in our category sales mix as compared to previous years, in our domestic stores we did experience a slight increase in mix of sales of the failure and discretionary categories as compared to last year. We believe the improvement in these sales categories was driven by
23
Table of Contents
differences in regional weather patterns, improved merchandise assortments due to the products we have added over the last year and lower gas prices. Our sales mix can be impacted by severe or unusual weather over a short term period. Over the long term, we believe the impact of the weather on our sales mix is not significant.
Our primary response to fluctuations in the demand for the products we sell is to adjust our advertising message, store staffing and product assortment. In recent years, we initiated a variety of strategic tests focused on increasing inventory availability in our domestic stores. As part of those tests, we closely studied our hub distribution model, store inventory levels and product assortment, which led to strategic tests on increased frequency of delivery to our domestic stores and significantly expanding parts assortment in select domestic stores we call mega hubs. During fiscal 2015, we concluded our tests on these specific new concepts and continued to roll out these strategic initiatives in fiscal 2016. During fiscal 2016, we continued the implementation of more frequent deliveries from our distribution centers to additional domestic stores and the execution of our mega hub strategy. We expect to continue this effort in fiscal 2017 and beyond.
The two statistics we believe have the closest correlation to our market growth over the long-term are miles driven and the number of seven year old or older vehicles on the road.
Miles Driven
We believe that as the number of miles driven increases, consumers’ vehicles are more likely to need service and maintenance, resulting in an increase in the need for automotive hard parts and maintenance items. While over the long-term we have seen a close correlation between our net sales and the number of miles driven, we have also seen certain time frames of minimal correlation in sales performance and miles driven. During the periods of minimal correlation between net sales and miles driven, we believe net sales have been positively impacted by other factors, including the number of seven year old or older vehicles on the road. Since the beginning of the fiscal year and through June 2016 (latest publicly available information), miles driven increased compared to the same period last year.
Seven Year Old or Older Vehicles
Between 2008 and 2012, new vehicle sales were significantly lower than historical levels, which we believe contributed to an increasing number of seven year old or older vehicles on the road. We estimate vehicles are driven an average of approximately 12,500 miles each year. In seven years, the average miles driven equates to approximately 87,500 miles. Our experience is that at this point in a vehicle’s life, most vehicles are not covered by warranties and increased maintenance is needed to keep the vehicle operating. According to the latest data provided by the Auto Care Association, as of January 1, 2016, the average age of vehicles on the road is 11.6 years as compared to 11.5 years as of January 1, 2015. Although the average age of vehicles continues to increase, it is increasing at a decelerated rate primarily driven by the improvement in new car sales in recent years. However, in the near term, we expect the aging vehicle population to continue to increase as consumers keep their cars longer in an effort to save money during this uncertain economy. As the number of seven year old or older vehicles on the road increases, we expect an increase in demand for the products we sell.
Results of Operations
Fiscal 2016 Compared with Fiscal 2015
For the fiscal year ended August 27, 2016, we reported net sales of $10.636 billion compared with $10.187 billion for the year ended August 29, 2015, a 4.4% increase from fiscal 2015. This growth was driven primarily by domestic same store sales increase of 2.4% and net sales of $177.0 million from new domestic AutoZone stores. Domestic commercial sales for fiscal 2016 increased $129.8 million, or 7.1%, over domestic commercial sales for fiscal 2015.
At August 27, 2016, we operated 5,297 domestic AutoZone stores, 483 stores in Mexico, eight stores in Brazil and 26 IMC branches compared with 5,141 domestic AutoZone stores, 441 stores in Mexico, seven stores in Brazil and 20 IMC branches at August 29, 2015. We reported a total auto parts (domestic, Mexico, Brazil and IMC) sales increase of 4.4% for fiscal 2016.
Gross profit for fiscal 2016 was $5.609 billion, or 52.7% of net sales, compared with $5.327 billion, or 52.3% of net sales for fiscal 2015. The improvement in gross margin was attributable to lower acquisition costs, partially offset by higher supply chain costs associated with current year inventory initiatives (–18 basis points).
24
Table of Contents
Operating, selling, general and administrative expenses for fiscal 2016 increased to $3.548 billion, or 33.4% of net sales, from $3.374 billion, or 33.1% of net sales for fiscal 2015. The increase in operating expenses, as a percentage of sales, was primarily due to higher store payroll.
Interest expense, net for fiscal 2016 was $147.7 million compared with $150.4 million during fiscal 2015. This decrease was primarily due to a decline in borrowing rates, partially offset by higher borrowing levels over the comparable year period. Average borrowings for fiscal 2016 were $4.860 billion, compared with $4.520 billion for fiscal 2015 and weighted average borrowing rates were 2.7% for fiscal 2016, compared to 3.0% for fiscal 2015.
Our effective income tax rate was 35.1% of pre-tax income for fiscal 2016 compared to 35.6% for fiscal 2015. The decrease in the effective income tax rate was driven by a discrete tax item during fiscal 2016.
Net income for fiscal 2016 increased by 7.0% to $1.241 billion, and diluted earnings per share increased 13.0% to $40.70 from $36.03 in fiscal 2015. The impact of the fiscal 2016 stock repurchases on diluted earnings per share in fiscal 2016 was an increase of approximately $1.17.
Fiscal 2015 Compared with Fiscal 2014
For the fiscal year ended August 29, 2015, we reported net sales of $10.187 billion compared with $9.475 billion for the year ended August 30, 2014, a 7.5% increase from fiscal 2014. This growth was driven primarily by domestic same store sales increase of 3.8%, net sales of $185.1 million from new domestic AutoZone stores and the inclusion of IMC sales. Domestic commercial sales for fiscal 2015 increased $208.4 million, or 12.9%, over domestic commercial sales for fiscal 2014.
At August 29, 2015, we operated 5,141 domestic AutoZone stores, 441 stores in Mexico, seven stores in Brazil and 20 IMC branches compared with 4,984 domestic AutoZone stores, 402 stores in Mexico and five stores in Brazil at August 30, 2014. We reported a total auto parts (domestic, Mexico, Brazil and IMC) sales increase of 7.6% for fiscal 2015.
Gross profit for fiscal 2015 was $5.327 billion, or 52.3% of net sales, compared with $4.935 billion, or 52.1% of net sales for fiscal 2014. The improvement in gross margin was attributable to higher merchandise margins, partially offset by the impact of the IMC acquisition finalized during September 2014 (–25 basis points) and higher supply chain costs associated with current year inventory initiatives (–13 basis points).
Operating, selling, general and administrative expenses for fiscal 2015 increased to $3.374 billion, or 33.1% of net sales, from $3.105 billion, or 32.8% of net sales for fiscal 2014. The increase in operating expenses, as a percentage of sales, was primarily due to higher legal costs (–14 basis points) and the impact of IMC (–13 basis points).
Interest expense, net for fiscal 2015 was $150.4 million compared with $167.5 million during fiscal 2014. This decrease was primarily due to a decline in borrowing rates, partially offset by higher borrowing levels over the comparable year period. Average borrowings for fiscal 2015 were $4.520 billion, compared with $4.252 billion for fiscal 2014 and weighted average borrowing rates were 3.0% for fiscal 2015, compared to 3.6% for fiscal 2014.
Our effective income tax rate was 35.6% of pre-tax income for fiscal 2015 compared to 35.7% for fiscal 2014.
Net income for fiscal 2015 increased by 8.5% to $1.160 billion, and diluted earnings per share increased 14.1% to $36.03 from $31.57 in fiscal 2014. The impact of the fiscal 2015 stock repurchases on diluted earnings per share in fiscal 2015 was an increase of approximately $1.01.
25
Table of Contents
Seasonality and Quarterly Periods
Our business is somewhat seasonal in nature, with the highest sales typically occurring in the spring and summer months of February through September, in which average weekly per-store sales historically have been about 15% to 20% higher than in the slower months of December and January. During short periods of time, a store’s sales can be affected by weather conditions. Extremely hot or extremely cold weather may enhance sales by causing parts to fail; thereby increasing sales of seasonal products. Mild or rainy weather tends to soften sales, as parts failure rates are lower in mild weather, with elective maintenance deferred during periods of rainy weather. Over the longer term, the effects of weather balance out, as we have locations throughout the United States, Puerto Rico, Mexico and Brazil.
Each of the first three quarters of our fiscal year consists of 12 weeks, and the fourth quarter consisted of 16 weeks in 2016, 2015 and 2014. Because the fourth quarter contains seasonally high sales volume and consists of 16 weeks, compared with 12 weeks for each of the first three quarters, our fourth quarter represents a disproportionate share of the annual net sales and net income. The fourth quarter of fiscal year 2016 represented 32.0% of annual sales and 34.4% of net income; the fourth quarter of fiscal year 2015 represented 32.3% of annual sales and 34.6% of net income; and the fourth quarter of fiscal 2014 represented 32.2% of annual sales and 34.9% of net income.
Liquidity and Capital Resources
The primary source of our liquidity is our cash flows realized through the sale of automotive parts, products and accessories. Net cash provided by operating activities was $1.577 billion in 2016, $1.525 billion in 2015 and $1.341 billion in fiscal 2014. Cash flows from operations are favorable to last year primarily due to the growth in net income partially offset by an increase in pension contributions.
Our primary capital requirement has been the funding of our continued new-location development program. From the beginning of fiscal 2014 to August 27, 2016, we have opened 597 new locations. Net cash flows used in investing activities were $505.8 million, compared to $567.9 million in fiscal 2015 and $448.0 million in fiscal 2014. We invested $488.8 million in capital assets in fiscal 2016, compared to $480.6 million in fiscal 2015 and $438.1 million in fiscal 2014. The increase in capital expenditures during this time was primarily attributable to the number and types of locations opened and increased investment in our existing locations. We had new location openings of 205 for fiscal 2016, 202 for fiscal 2015 and 190 for fiscal 2014. Cash flows used in the acquisition of IMC were $75.7 million in fiscal 2015. Cash flows were also used in the purchase of other intangibles for $10 million in each of fiscal 2016 and fiscal 2015. In fiscal 2014 cash flows were used to purchase intangibles for $11.1 million. We invest a portion of our assets held by our wholly owned insurance captive in marketable securities. We purchased $130.2 million in marketable securities in fiscal 2016 and $49.7 million in each of fiscal 2015 and fiscal 2014. We had proceeds from the sale of marketable securities of $120.5 million in fiscal 2016, $46.4 million in fiscal 2015 and $46.8 million in fiscal 2014.
Net cash used in financing activities was $1.053 billion in 2016, $896.7 million in 2015 and $911.6 million in fiscal 2014. The net cash used in financing activities reflected purchases of treasury stock which totaled $1.452 billion for fiscal 2016, $1.271 billion for fiscal 2015 and $1.099 billion for fiscal 2014. The treasury stock purchases in fiscal 2016, 2015 and 2014 were primarily funded by cash flows from operations and by increases in debt levels. Proceeds from issuance of debt were $650 million for each of fiscal 2016 and 2015 and $400 million for fiscal 2014. In fiscal 2016, the proceeds from the issuance of debt were used for general corporate purposes, including for working capital requirements, capital expenditures, store openings and stock repurchases. In fiscal 2015, the proceeds from the issuance of debt were used for the repayment of a portion of our outstanding commercial borrowings, which were used to repay the $500 million 5.750% Senior Notes due January 2015 and for the acquisition of IMC. In fiscal 2014, the proceeds from the issuance of debt were used for the repayment of a portion of the $500 million Senior Notes due in January 2014. We used commercial paper borrowings to repay the $300 million Senior Notes due in November 2015, the $200 million Senior Notes due in June 2016 and the remainder of the $500 million Senior Notes due in January 2014. In 2016 we received net proceeds from the issuance of commercial paper and short-term borrowings in the amount of $149.9 million. Net proceeds from the issuance of commercial paper and short-term borrowings for fiscal 2015 and 2014 were $153.8 million and $256.8 million, respectively.
26
Table of Contents
During fiscal 2017, we expect to invest in our business at an increased rate as compared to fiscal 2016. Our investments are expected to be directed primarily to new locations, supply chain infrastructure, enhancements to existing locations and investments in technology. The amount of our investments in our new locations is impacted by different factors, including such factors as whether the building and land are purchased (requiring higher investment) or leased (generally lower investment), located in the United States, Mexico or Brazil, or located in urban or rural areas. During fiscal 2016, 2015 and 2014, our capital expenditures have increased by approximately 2%, 10% and 6%, respectively, as compared to the prior year.
In addition to the building and land costs, our new locations require working capital, predominantly for inventories. Historically, we have negotiated extended payment terms from suppliers, reducing the working capital required and resulting in a high accounts payable to inventory ratio. We plan to continue leveraging our inventory purchases; however, our ability to do so may be limited by our vendors’ capacity to factor their receivables from us. Certain vendors participate in financing arrangements with financial institutions whereby they factor their receivables from us, allowing them to receive payment on our invoices at a discounted rate. In recent years, we initiated a variety of strategic tests focused on increasing inventory availability, which increased our inventory per location. Many of our vendors have supported our initiative to update our product assortments by providing extended payment terms. These extended payment terms have allowed us to continue our high accounts payable to inventory ratio. We had an accounts payable to inventory ratio of 112.8% at August 27, 2016, 112.9% at August 29, 2015, and 114.9% at August 30, 2014. The decrease from fiscal 2014 to fiscal 2015 was driven by the inclusion of IMC in fiscal 2015.
Depending on the timing and magnitude of our future investments (either in the form of leased or purchased properties or acquisitions), we anticipate that we will rely primarily on internally generated funds and available borrowing capacity to support a majority of our capital expenditures, working capital requirements and stock repurchases. The balance may be funded through new borrowings. We anticipate that we will be able to obtain such financing in view of our credit ratings and favorable experiences in the debt markets in the past.
Our cash balances are held in various locations around the world. As of August 27, 2016 and August 29, 2015, cash and cash equivalents of $78.1 million and $64.9 million, respectively, were held outside of the U.S. and were generally utilized to support liquidity needs in our foreign operations. We intend to continue to permanently reinvest the cash held outside of the U.S. in our foreign operations.
For the fiscal year ended August 27, 2016, our after-tax return on invested capital (“ROIC”) was 31.3% as compared to 31.2% for the comparable prior year period. ROIC is calculated as after-tax operating profit (excluding rent charges) divided by invested capital (which includes a factor to capitalize operating leases). We use ROIC to evaluate whether we are effectively using our capital resources and believe it is an important indicator of our overall operating performance. Refer to the “Reconciliation of Non-GAAP Financial Measures” section for further details of our calculation.
Debt Facilities
On December 19, 2014, we amended and restated our existing revolving credit facility (the “Multi-Year Credit Agreement”) by increasing the amount of capital leases allowable to $225 million, extending the expiration date by two years and renegotiating other terms and conditions. This credit facility is available to primarily support commercial paper borrowings, letters of credit and other short-term unsecured bank loans. The capacity of the credit facility is $1.25 billion and may be increased to $1.5 billion prior to the maturity date at our election and subject to bank credit capacity and approval, may include up to $200 million in letters of credit and may include up to $225 million in capital leases each fiscal year. Under the revolving credit facility, we may borrow funds consisting of Eurodollar loans or base rate loans. Interest accrues on Eurodollar loans at a defined Eurodollar rate, defined as LIBOR plus the applicable percentage, as defined in the revolving credit facility, depending upon our senior, unsecured, (non-credit enhanced) long-term debt rating. Interest accrues on base rate loans as defined in the credit facility. We also have the option to borrow funds under the terms of a swingline loan subfacility. The revolving credit facility expires in December 2019.
On December 19, 2014, we entered into a new revolving credit facility (the “364-Day Credit Agreement”). The credit facility is available to primarily support commercial paper borrowings and other short-term unsecured bank loans. The 364-Day Credit Agreement provides for loans in the principal amount of up to $500 million. Under the credit facility, we may borrow funds consisting of Eurodollar loans, base rate loans or a combination of both.
27
Table of Contents
Interest accrues on Eurodollar loans at a defined Eurodollar rate, defined as LIBOR plus the applicable margin, as defined in the revolving credit facility, depending upon our senior, unsecured, (non-credit enhanced) long-term debt rating. Interest accrues on base rate loans as defined in the credit facility. The original expiration date of the credit facility was December 19, 2015, but in accordance with the credit agreement, in November 2015, we requested, and the banks approved, the extension of the termination date to December 16, 2016. In addition, at least 15 days prior to December 16, 2016, we have the right to convert the credit facility to a term loan, for up to one year from the termination date, subject to a 1% penalty.
As of August 27, 2016, we had no outstanding borrowings under either of the revolving credit facilities and $3.3 million of outstanding letters of credit under the Multi-Year Credit Agreement.
The revolving credit facility agreements require that our consolidated interest coverage ratio as of the last day of each quarter shall be no less than 2.5:1. This ratio is defined as the ratio of (i) consolidated earnings before interest, taxes and rents to (ii) consolidated interest expense plus consolidated rents. Our consolidated interest coverage ratio as of August 27, 2016 was 5.5:1.
As of August 27, 2016, $1.198 billion of commercial paper borrowings and the $400 million 1.300% Notes due January 2017 are classified as long-term in the Consolidated Balance Sheets as we have the ability and intent to refinance on a long-term basis through available capacity in our revolving credit facilities. As of August 27, 2016, we had $1.708 billion of availability under our $1.75 billion revolving credit facilities, which would allow us to replace these short-term obligations with long-term financing facilities.
We also maintain a letter of credit facility that allows us to request the participating bank to issue letters of credit on our behalf up to an aggregate amount of $100 million. The letter of credit facility is in addition to the letters of credit that may be issued under the Multi-Year Credit Agreement. In fiscal 2016, we amended our existing letter of credit facility to decrease the amount that can be requested in letters of credit from $100 million to $75 million effective June 2016. This amendment also extended the maturity date from June 2016 to June 2019. As of August 27, 2016 we had $74.9 million in letters of credit outstanding under the letter of credit facility.
In addition to the outstanding letters of credit issued under the committed facilities discussed above, we had $27.9 million in letters of credit outstanding as of August 27, 2016. These letters of credit have various maturity dates and were issued on an uncommitted basis.
On April 21, 2016, we issued $400 million in 3.125% Senior Notes due April 2026 and $250 million in 1.625% Senior Notes due April 2019 under our shelf registration statement filed with the SEC on April 15, 2015 (the “2015 Shelf Registration”). The 2015 Shelf Registration allows us to sell an indeterminate amount in debt securities to fund general corporate purposes, including repaying, redeeming or repurchasing outstanding debt and for working capital, capital expenditures, new location openings, stock repurchases and acquisitions. Proceeds from the debt issuances were used for general corporate purposes.
On April 29, 2015, we issued $400 million in 3.250% Senior Notes due April 2025 and $250 million in 2.500% Senior Notes due April 2021 under the 2015 Shelf Registration. Proceeds from the debt issuances were used to repay a portion of the outstanding commercial paper borrowings, which were used to repay the $500 million in 5.750% Senior Notes due in January 2015, and for general corporate purposes.
On January 14, 2014, we issued $400 million in 1.300% Senior Notes due January 2017 under our shelf registration statement filed with the SEC on April 17, 2012. Proceeds from the debt issuance on January 14, 2014, were used to repay a portion of the $500 million in 6.500% Senior Notes due January 2014. We used commercial paper borrowings to repay the remainder of the 6.500% Senior Notes.
28
Table of Contents
The 5.750% Senior Notes issued in July 2009 and the 7.125% Senior Notes issued during August 2008 (collectively, the “Notes”), are subject to an interest rate adjustment if the debt ratings assigned to the Notes are downgraded. Further, all senior notes contain a provision that repayment of the notes may be accelerated if we experience a change in control (as defined in the agreements). Our borrowings under our senior notes contain minimal covenants, primarily restrictions on liens. Under our revolving credit facilities, covenants include limitations on total indebtedness, restrictions on liens, a maximum debt to earnings ratio and a change of control provision that may require acceleration of the repayment obligations under certain circumstances. These covenants are in addition to the consolidated interest coverage ratio discussed above. All of the repayment obligations under our borrowing arrangements may be accelerated and come due prior to the scheduled payment date if covenants are breached or an event of default occurs.
As of August 27, 2016, we were in compliance with all covenants related to our borrowing arrangements and expect to remain in compliance with those covenants in the future.
For the fiscal year ended August 27, 2016, our adjusted debt to earnings before interest, taxes, depreciation, amortization, rent and share-based compensation expense (“EBITDAR”) ratio was 2.5:1 as compared to 2.5:1 as of the comparable prior year end. We calculate adjusted debt as the sum of total debt, capital lease obligations and rent times six; and we calculate EBITDAR by adding interest, taxes, depreciation, amortization, rent and share-based compensation expense to net income. We target our debt levels to a ratio of adjusted debt to EBITDAR in order to maintain our investment grade credit ratings. We believe this is important information for the management of our debt levels. Refer to the “Reconciliation of Non-GAAP Financial Measures” section for further details of our calculation.
Stock Repurchases
During 1998, we announced a program permitting us to repurchase a portion of our outstanding shares not to exceed a dollar maximum established by our Board of Directors (the “Board”). On March 22, 2016, the Board voted to increase the authorization by $750 million to raise the cumulative share repurchase authorization from $16.4 billion to $17.15 billion. From January 1998 to August 27, 2016, we have repurchased a total of 140.8 million shares at an aggregate cost of $16.755 billion. We repurchased 1.9 million shares of common stock at an aggregate cost of $1.452 billion during fiscal 2016, 2.0 million shares of common stock at an aggregate cost of $1.271 billion during fiscal 2015 and 2.2 million shares of common stock at an aggregate cost of $1.099 billion during fiscal 2014. Considering cumulative repurchases as of August 27, 2016, we had $395.4 million remaining under the Board’s authorization to repurchase our common stock.
On September 22, 2016, the Board voted to increase the authorization by $750 million. This brings the total value of shares authorized to $17.9 billion. Subsequent to August 27, 2016, we have repurchased 390,473 shares of common stock at an aggregate cost of $297.6 million. Considering the cumulative repurchases and the increase in authorization subsequent to August 27, 2016, we have $847.7 million remaining under the Board’s authorization to repurchase our common stock.
29
Table of Contents
Financial Commitments
The following table shows our significant contractual obligations as of August 27, 2016:
| (in thousands) |
Total Contractual Obligations |
Payment Due by Period | ||||||||||||||||||
| Less than 1 year |
Between 1-3 years |
Between 3-5 years |
Over 5 years |
|||||||||||||||||
| Debt(1) |
$ | 4,947,500 | $ | 1,597,500 | $ | 500,000 | $ | 750,000 | $ | 2,100,000 | ||||||||||
| Interest payments(2) |
692,131 | 118,975 | 214,938 | 181,031 | 177,187 | |||||||||||||||
| Operating leases(3) |
2,106,257 | 274,341 | 514,564 | 426,483 | 890,869 | |||||||||||||||
| Capital leases(4) |
151,951 | 44,834 | 77,338 | 29,779 | — | |||||||||||||||
| Self-insurance reserves(5) |
222,188 | 78,458 | 71,860 | 30,923 | 40,947 | |||||||||||||||
| Construction commitments |
106,619 | 106,619 | — | — | — | |||||||||||||||
|
|
|
|
|
|
|
|
|
|
|
|||||||||||
| $ | 8,226,646 | $ | 2,220,727 | $ | 1,378,700 | $ | 1,418,216 | $ | 3,209,003 | |||||||||||
|
|
|
|
|
|
|
|
|
|
|
|||||||||||
| (1) | Debt balances represent principal maturities, excluding interest, discounts and debt issuance costs. |
| (2) | Represents obligations for interest payments on long-term debt. |
| (3) | Operating lease obligations are inclusive of amounts accrued within deferred rent and closed store obligations reflected in our consolidated balance sheets. |
| (4) | Capital lease obligations include related interest. |
| (5) | Self-insurance reserves reflect estimates based on actuarial calculations. Although these obligations do not have scheduled maturities, the timing of future payments are predictable based upon historical patterns. Accordingly, we reflect the net present value of these obligations in our consolidated balance sheets. |
We have pension obligations reflected in our consolidated balance sheets that are not reflected in the table above due to the absence of scheduled maturities and the nature of the account. During fiscal 2016, we made contributions of $52.7 million to the pension plan. We expect to make contributions of approximately $17.8 million during fiscal 2017; however a change to the expected cash funding may be impacted by a change in interest rates or a change in the actual or expected return on plan assets.
As of August 27, 2016, our defined benefit obligation associated with our pension plans is $328.5 million and our pension assets are valued at $289.4 million, resulting in a net pension obligation of $39.1 million. Amounts recorded in Accumulated other comprehensive loss are $145.9 million at August 27, 2016. The balance in Accumulated other comprehensive loss will be amortized into pension expense in the future, unless the losses are recovered in future periods through actuarial gains.
Additionally, our tax liability for uncertain tax positions, including interest and penalties, was $25.8 million at August 27, 2016. Approximately $4.9 million is classified as current liabilities and $20.9 million is classified as long-term liabilities. We did not reflect these obligations in the table above as we are unable to make an estimate of the timing of payments of the long-term liabilities due to uncertainties in the timing and amounts of the settlement of these tax positions.
Off-Balance Sheet Arrangements
The following table reflects outstanding letters of credit and surety bonds as of August 27, 2016:
| (in thousands) |
Total Other Commitments |
|||
| Standby letters of credit |
$ | 106,104 | ||
| Surety bonds |
33,381 | |||
|
|
|
|||
| $ | 139,485 | |||
|
|
|
|||
A substantial portion of the outstanding standby letters of credit (which are primarily renewed on an annual basis) and surety bonds are used to cover reimbursement obligations to our workers’ compensation carriers. There are no additional contingent liabilities associated with these instruments as the underlying liabilities are already reflected in our consolidated balance sheets. The standby letters of credit and surety bond arrangements expire within one year, but have automatic renewal clauses.
30
Table of Contents
Reconciliation of Non-GAAP Financial Measures
“Selected Financial Data” and “Management’s Discussion and Analysis of Financial Condition and Results of Operations” include certain financial measures not derived in accordance with generally accepted accounting principles (“GAAP”). These non-GAAP financial measures provide additional information for determining our optimum capital structure and are used to assist management in evaluating performance and in making appropriate business decisions to maximize stockholders’ value.
Non-GAAP financial measures should not be used as a substitute for GAAP financial measures, or considered in isolation, for the purpose of analyzing our operating performance, financial position or cash flows. However, we have presented the non-GAAP financial measures, as we believe they provide additional information that is useful to investors as it indicates more clearly our comparative year-to-year operating results. Furthermore, our management and Compensation Committee of the Board use the above-mentioned non-GAAP financial measures to analyze and compare our underlying operating results and use select measurements to determine payments of performance-based compensation. We have included a reconciliation of this information to the most comparable GAAP measures in the following reconciliation tables.
Reconciliation of Non-GAAP Financial Measure: Cash Flow Before Share Repurchases and Changes in Debt
The following table reconciles net increase (decrease) in cash and cash equivalents to cash flow before share repurchases and changes in debt, which is presented in “Selected Financial Data”:
| Fiscal Year Ended August | ||||||||||||||||||||
| (in thousands) |
2016 | 2015 | 2014 | 2013 | 2012 | |||||||||||||||
| Net increase/(decrease) in cash and cash equivalents |
$ | 14,425 | $ | 50,824 | $ | (17,706 | ) | $ | 39,098 | $ | 5,487 | |||||||||
| Less: Increase in debt, excluding deferred financing costs |
299,900 | 303,800 | 156,800 | 418,652 | 418,729 | |||||||||||||||
| Plus: Share repurchases |
1,452,462 | 1,271,416 | 1,099,212 | 1,387,315 | 1,362,869 | |||||||||||||||
|
|
|
|
|
|
|
|
|
|
|
|||||||||||
| Cash flow before share repurchases and changes in debt |
$ | 1,166,987 | $ | 1,018,440 | $ | 924,706 | $ | 1,007,761 | $ | 949,627 | ||||||||||
|
|
|
|
|
|
|
|
|
|
|
|||||||||||
31
Table of Contents
Reconciliation of Non-GAAP Financial Measure: After-tax Return on Invested Capital (“ROIC”)
The following table calculates the percentage of ROIC. ROIC is calculated as after-tax operating profit (excluding rent) divided by invested capital (which includes a factor to capitalize operating leases). The ROIC percentages are presented in “Selected Financial Data” and “Management’s Discussion and Analysis of Financial Condition and Results of Operations”:
| Fiscal Year Ended August | ||||||||||||||||||||
| (in thousands, except percentages) |
2016 | 2015 | 2014 | 2013(1) | 2012 | |||||||||||||||
| Net income |
$ | 1,241,007 | $ | 1,160,241 | $ | 1,069,744 | $ | 1,016,480 | $ | 930,373 | ||||||||||
| Adjustments: |
||||||||||||||||||||
| Interest expense |
147,681 | 150,439 | 167,509 | 185,415 | 175,905 | |||||||||||||||
| Rent expense |
280,490 | 269,458 | 253,813 | 246,340 | 229,417 | |||||||||||||||
| Tax effect(2) |
(150,288 | ) | (149,483 | ) | (150,412 | ) | (155,432 | ) | (145,916 | ) | ||||||||||
|
|
|
|
|
|
|
|
|
|
|
|||||||||||
| After-tax return |
$ | 1,518,890 | $ | 1,430,655 | $ | 1,340,654 | $ | 1,292,803 | $ | 1,189,779 | ||||||||||
|
|
|
|
|
|
|
|
|
|
|
|||||||||||
| Average debt(3) |
$ | 4,820,402 | $ | 4,458,114 | $ | 4,258,796 | $ | 3,930,975 | $ | 3,492,672 | ||||||||||
| Average (deficit)(4) |
(1,774,329 | ) | (1,619,596 | ) | (1,709,778 | ) | (1,581,832 | ) | (1,372,342 | ) | ||||||||||
| Rent x 6(5) |
1,682,940 | 1,616,748 | 1,522,878 | 1,478,040 | 1,376,502 | |||||||||||||||
| Average capital lease obligations(6) |
131,008 | 126,096 | 108,475 | 102,729 | 96,027 | |||||||||||||||
|
|
|
|
|
|
|
|
|
|
|
|||||||||||
| Invested capital |
$ | 4,860,021 | $ | 4,581,362 | $ | 4,180,371 | $ | 3,929,912 | $ | 3,592,859 | ||||||||||
|
|
|
|
|
|
|
|
|
|
|
|||||||||||
| ROIC |
31.3 | % | 31.2 | % | 32.1 | % | 32.9 | % | 33.1 | % | ||||||||||
|
|
|
|
|
|
|
|
|
|
|
|||||||||||
| (1) | The fiscal year ended August 31, 2013 consisted of 53 weeks. |
| (2) | The effective tax rate during fiscal 2016, 2015, 2014, 2013 and 2012 was 35.1% 35.6% 35.7%, 36.0% and 36.0%, respectively. |
| (3) | Average debt is equal to the average of our debt measured as of the previous five quarters. |
| (4) | Average equity is equal to the average of our stockholders’ (deficit) measured as of the previous five quarters. |
| (5) | Rent is multiplied by a factor of six to capitalize operating leases in the determination of pre-tax invested capital. |
| (6) | Average capital lease obligations is computed as the average of our capital lease obligations over the previous five quarters. |
32
Table of Contents
Reconciliation of Non-GAAP Financial Measure: Adjusted Debt to EBITDAR
The following table calculates the ratio of adjusted debt to EBITDAR. Adjusted debt to EBITDAR is calculated as the sum of total debt, capital lease obligations and annual rents times six; divided by net income plus interest, taxes, depreciation, amortization, rent and share-based compensation expense. The adjusted debt to EBITDAR ratios are presented in “Selected Financial Data” and “Management’s Discussion and Analysis of Financial Condition and Results of Operations”:
| Fiscal Year Ended August | ||||||||||||||||||||
| (in thousands, except ratios) |
2016 | 2015 | 2014 | 2013(1) | 2012 | |||||||||||||||
| Net income |
$ | 1,241,007 | $ | 1,160,241 | $ | 1,069,744 | $ | 1,016,480 | $ | 930,373 | ||||||||||
| Add: Interest expense |
147,681 | 150,439 | 167,509 | 185,415 | 175,905 | |||||||||||||||
| Income tax expense |
671,707 | 642,371 | 592,970 | 571,203 | 522,613 | |||||||||||||||
|
|
|
|
|
|
|
|
|
|
|
|||||||||||
| EBIT |
2,060,395 | 1,953,051 | 1,830,223 | 1,773,098 | 1,628,891 | |||||||||||||||
| Add: Depreciation and amortization expense |
297,397 | 269,919 | 251,267 | 227,251 | 211,831 | |||||||||||||||
| Rent expense |
280,490 | 269,458 | 253,813 | 246,340 | 229,417 | |||||||||||||||
| Share-based expense |
39,825 | 40,995 | 39,390 | 37,307 | 33,363 | |||||||||||||||
|
|
|
|
|
|
|
|
|
|
|
|||||||||||
| EBITDAR |
$ | 2,678,107 | $ | 2,533,423 | $ | 2,374,693 | $ | 2,283,996 | $ | 2,103,502 | ||||||||||
|
|
|
|
|
|
|
|
|
|
|
|||||||||||
| Debt |
$ | 4,924,119 | $ | 4,624,876 | $ | 4,323,106 | $ | 4,164,078 | $ | 3,751,478 | ||||||||||
| Capital lease obligations |
147,285 | 128,167 | 119,603 | 106,171 | 102,256 | |||||||||||||||
| Rent x 6 |
1,682,940 | 1,616,748 | 1,522,878 | 1,478,040 | 1,376,502 | |||||||||||||||
|
|
|
|
|
|
|
|
|
|
|
|||||||||||
| Adjusted debt |
$ | 6,754,344 | $ | 6,369,791 | $ | 5,965,587 | $ | 5,748,289 | $ | 5,230,236 | ||||||||||
|
|
|
|
|
|
|
|
|
|
|
|||||||||||
| Adjusted debt to EBITDAR |
2.5 | 2.5 | 2.5 | 2.5 | 2.5 | |||||||||||||||
|
|
|
|
|
|
|
|
|
|
|
|||||||||||
| (1) | The fiscal year ended August 31, 2013 consisted of 53 weeks. |
Recent Accounting Pronouncements
See Note A of the Notes to Consolidated Financial Statements for a discussion on recent accounting pronouncements.
Critical Accounting Policies and Estimates
Preparation of our consolidated financial statements requires us to make estimates and assumptions affecting the reported amounts of assets and liabilities at the date of the financial statements, reported amounts of revenues and expenses during the reporting period and related disclosures of contingent liabilities. In the notes to our consolidated financial statements, we describe our significant accounting policies used in preparing the consolidated financial statements. Our policies are evaluated on an ongoing basis and are drawn from historical experience and other assumptions that we believe to be reasonable under the circumstances. Actual results could differ under different assumptions or conditions. Our senior management has identified the critical accounting policies for the areas that are materially impacted by estimates and assumptions and have discussed such policies with the Audit Committee of our Board. The following items in our consolidated financial statements represent our critical accounting policies that require significant estimation or judgment by management:
Inventory Reserves and Cost of Sales
LIFO
We state our inventories at the lower of cost or market. Inventory cost has been determined using the last-in, first-out (“LIFO”) method for domestic inventories and the weighted average cost method for Mexico and Brazil inventories. Due to price deflation on our merchandise purchases, we have exhausted our LIFO reserve balance. Our policy is not to write up inventory in excess of replacement cost, which is based on average cost. The difference between LIFO cost and replacement cost, which will be reduced upon experiencing price inflation on our merchandise purchases, was $364.1 million at August 27, 2016.
33
Table of Contents
Inventory Obsolescence and Shrinkage
Our inventory, primarily hard parts, maintenance items, accessories and non-automotive products, is used on vehicles that have rather long lives; and therefore, the risk of obsolescence is minimal and the majority of excess inventory has historically been returned to our vendors for credit. In the isolated instances where less than full credit will be received for such returns and where we anticipate that items will be sold at retail prices that are less than recorded costs, we record a charge (less than $3 million in each of the last three years) through cost of sales for the difference. These charges are based on management’s judgment, including estimates and assumptions regarding marketability of products and the market value of inventory to be sold in future periods.
Historically, we have not encountered material exposure to inventory obsolescence or excess inventory, nor have we experienced material changes to our estimates. However, we may be exposed to material losses should our vendors alter their policy with regard to accepting excess inventory returns.
Additionally, we reduce inventory for projected losses related to shrinkage, which is estimated based on historical losses and current inventory loss trends resulting from previous physical inventories. Shrinkage may occur due to theft, loss or inaccurate records for the receipt of goods, among other things. Throughout the year, we take physical inventory counts of our stores and distribution centers to verify these estimates. We make assumptions regarding upcoming physical inventory counts that may differ from actual results.
Each quarter, we evaluate the accrued shrinkage in light of the actual shrink results from physical inventory counts. To the extent our actual physical inventory count results differ from our estimates, we may experience material adjustments to our financial statements. Historically, we have not experienced material adjustments to our shrinkage estimates and do not believe there is a reasonable likelihood that there will be a material change in the future estimates or assumptions we use. Over the last three years, there has been less than a 50 basis point fluctuation in our shrinkage rate (shrink loss as a percent of sales).
A 10% difference in our inventory reserves as of August 27, 2016, would have affected net income by approximately $6.2 million in fiscal 2016.
Vendor Allowances
We receive various payments and allowances from our vendors through a variety of programs and arrangements, including allowances for warranties, advertising and general promotion of vendor products. Vendor allowances are treated as a reduction of inventory, unless they are provided as a reimbursement of specific, incremental, identifiable costs incurred by the Company in selling the vendor’s products. Approximately 87% of the vendor funds received are recorded as a reduction of the cost of inventories and recognized as a reduction to cost of sales as these inventories are sold.
Based on our vendor agreements, a significant portion of vendor funding we receive is earned as we purchase inventory. Therefore, we record receivables for funding earned but not yet received as we purchase inventory. During the year, we regularly review the receivables from vendors to ensure vendors are able to meet their obligations. We generally have not recorded a reserve against these receivables as we have not experienced significant losses and have legal right of offset with our vendors for payments owed them. Historically, we have had write-offs less than $150 thousand in each of the last three years.
Goodwill and Intangibles
We evaluate goodwill and indefinite-lived intangibles for impairment annually in the fourth quarter of each fiscal year or whenever events or changes in circumstances indicate the carrying values exceed the current fair values. We evaluate the likelihood of impairment by considering qualitative factors, such as macroeconomic, industry, market, or any other factors that could impact the reporting unit’s fair value. If these factors indicate impairment, we perform a quantitative assessment to determine if the carrying value exceeds the fair value. Goodwill is evaluated at the reporting unit level and involves valuation methods including forecasting future financial performance, estimates of discount rates and other factors. If the carrying value of the reporting unit’s goodwill exceeds the fair value, we recognize an impairment loss.
34
Table of Contents
Indefinite-lived intangibles are evaluated by comparing the carrying amount of the asset to the future discounted cash flows that the asset is expected to generate. If the carrying value of the indefinite-lived intangible asset exceeds the fair value based on the future discounted cash flows, we recognize an impairment loss. These impairment analyses require a significant amount of subjective judgment by management, and as a result these estimates are uncertain and our actual results may be different from our estimates.
The carrying value of goodwill at August 27, 2016 and August 29, 2015 was $391.9 million. No impairment charges were recognized in fiscal 2016, 2015 and 2014.
Self-Insurance Reserves
We retain a significant portion of the risks associated with workers’ compensation, employee health, general and products liability, property and vehicle liability; and we obtain third party insurance to limit the exposure related to certain of these risks. Our self-insurance reserve estimates totaled $214.4 million at August 27, 2016, and $205.3 million at August 29, 2015. This change is primarily reflective of our growing operations, including inflation, increases in health care costs, the number of vehicles and the number of hours worked, as well as our historical claims experience.
The assumptions made by management in estimating our self-insurance reserves include consideration of historical cost experience, judgments about the present and expected levels of cost per claim and retention levels. We utilize various methods, including analyses of historical trends and actuarial methods, to estimate the cost to settle reported claims and claims incurred but not yet reported. The actuarial methods develop estimates of the future ultimate claim costs based on the claims incurred as of the balance sheet date. When estimating these liabilities, we consider factors, such as the severity, duration and frequency of claims, legal costs associated with claims, healthcare trends and projected inflation of related factors. In recent history, our methods for determining our exposure have remained consistent, and our historical trends have been appropriately factored into our reserve estimates. As we obtain additional information and refine our methods regarding the assumptions and estimates we use to recognize liabilities incurred, we will adjust our reserves accordingly.
Management believes that the various assumptions developed and actuarial methods used to determine our self- insurance reserves are reasonable and provide meaningful data and information that management uses to make its best estimate of our exposure to these risks. Arriving at these estimates, however, requires a significant amount of subjective judgment by management, and as a result these estimates are uncertain and our actual exposure may be different from our estimates. For example, changes in our assumptions about health care costs, the severity of accidents and the incidence of illness, the average size of claims and other factors could cause actual claim costs to vary materially from our assumptions and estimates, causing our reserves to be overstated or understated. For instance, a 10% change in our self-insurance liability would have affected net income by approximately $13.9 million for fiscal 2016.
Our liabilities for workers’ compensation, certain general and product liability, property and vehicle claims do not have scheduled maturities; however, the timing of future payments is predictable based on historical patterns and is relied upon in determining the current portion of these liabilities. Accordingly, we reflect the net present value of the obligations we determine to be long-term using the risk-free interest rate as of the balance sheet date. If the discount rate used to calculate the present value of these reserves changed by 50 basis points, net income would have been affected by approximately $2.1 million for fiscal 2016. Our liability for health benefits is classified as current, as the historical average duration of claims is approximately six weeks.
Income Taxes
Our income tax returns are audited by state, federal and foreign tax authorities, and we are typically engaged in various tax examinations at any given time. Tax contingencies often arise due to uncertainty or differing interpretations of the application of tax rules throughout the various jurisdictions in which we operate. The contingencies are influenced by items such as tax audits, changes in tax laws, litigation, appeals and prior experience with similar tax positions. We regularly review our tax reserves for these items and assess the adequacy of the amount we have recorded. As of August 27, 2016, we had approximately $25.8 million reserved for uncertain tax positions.
We evaluate potential exposures associated with our various tax filings by estimating a liability for uncertain tax positions based on a two-step process. The first step is to evaluate the tax position for recognition by determining if the weight of available evidence indicates that it is more likely than not that the position will be sustained on audit, including resolution of related appeals or litigation processes, if any. The second step requires us to estimate and measure the tax benefit as the largest amount that is more than 50% likely to be realized upon ultimate settlement.
35
Table of Contents
We believe our estimates to be reasonable and have not experienced material adjustments to our reserves in the previous three years; however, actual results could differ from our estimates, and we may be exposed to gains or losses that could be material. Specifically, management has used judgment and made assumptions to estimate the likely outcome of uncertain tax positions. Additionally, to the extent we prevail in matters for which a liability has been established, or must pay in excess of recognized reserves, our effective tax rate in any particular period could be materially affected.
Pension Obligation
Prior to January 1, 2003, substantially all full-time employees were covered by a qualified defined benefit pension plan. The benefits under the plan were based on years of service and the employee’s highest consecutive five-year average compensation. On January 1, 2003, the plan was frozen. Accordingly, pension plan participants will earn no new benefits under the plan formula and no new participants will join the pension plan. On January 1, 2003, our supplemental, unqualified defined benefit pension plan for certain highly compensated employees was also frozen. Accordingly, plan participants will earn no new benefits under the plan formula and no new participants will join the pension plan. As the plan benefits are frozen, the annual pension expense and recorded liabilities are not impacted by increases in future compensation levels, but are impacted by the use of two key assumptions in the calculation of these balances:
Expected long-term rate of return on plan assets: For the fiscal year ended August 27, 2016, we have assumed a 7.0% long-term rate of return on our plan assets. This estimate is a judgmental matter in which management considers the composition of our asset portfolio, our historical long-term investment performance and current market conditions. We review the expected long-term rate of return on an annual basis, and revise it accordingly. Additionally, we monitor the mix of investments in our portfolio to ensure alignment with our long-term strategy to manage pension cost and reduce volatility in our assets. In August 2014, our Investment Committee approved a revised asset allocation target for the investments held by the pension plan. Based on the revised asset allocation target, the expected long-term rate of return on plan assets changed from 7.5% for the year ended August 30, 2014, to 7.0% for the years ending August 29, 2015 and August 27, 2016. At August 27, 2016, our plan assets totaled $289.4 million in our qualified plan. Our assets are generally valued using the net asset values, which are determined by valuing investments at the closing price or last trade reported on such date on the major market on which the individual securities are traded. We have no assets in our nonqualified plan. A 50 basis point change in our expected long term rate of return would impact annual pension expense by approximately $1.4 million for the qualified plan.
Discount rate used to determine benefit obligations: This rate is highly sensitive and is adjusted annually based on the interest rate for long-term, high-quality, corporate bonds as of the measurement date using yields for maturities that are in line with the duration of our pension liabilities. For fiscal 2016, we assumed a discount rate of 3.7%. A decrease in the discount rate increases our projected benefit obligation and pension expense. A 50 basis point change in the discount rate at August 27, 2016 would impact annual pension expense/income by approximately $1.8 million for the qualified plan and $24 thousand for the nonqualified plan.
36
Table of Contents
Item 7A. Quantitative and Qualitative Disclosures about Market Risk
We are exposed to market risk from, among other things, changes in interest rates, foreign exchange rates and fuel prices. From time to time, we use various derivative instruments to reduce interest rate and fuel price risks. To date, based upon our current level of foreign operations, no derivative instruments have been utilized to reduce foreign exchange rate risk. All of our hedging activities are governed by guidelines that are authorized by the Board. Further, we do not buy or sell derivative instruments for trading purposes.
Interest Rate Risk
Our financial market risk results primarily from changes in interest rates. At times, we reduce our exposure to changes in interest rates by entering into various interest rate hedge instruments such as interest rate swap contracts, treasury lock agreements and forward-starting interest rate swaps.
We have historically utilized interest rate swaps to convert variable rate debt to fixed rate debt and to lock in fixed rates on future debt issuances. We reflect the current fair value of all interest rate hedge instruments as a component of either other current assets or accrued expenses and other. Our interest rate hedge instruments are designated as cash flow hedges.
Unrealized gains and losses on interest rate hedges are deferred in stockholders’ deficit as a component of Accumulated other comprehensive loss. These deferred gains and losses are recognized in income as a decrease or increase to interest expense in the period in which the related cash flows being hedged are recognized in expense. However, to the extent that the change in value of an interest rate hedge instrument does not perfectly offset the change in the value of the cash flow being hedged, that ineffective portion is immediately recognized in earnings.
The fair value of our debt was estimated at $5.117 billion as of August 27, 2016, and $4.696 billion as of August 29, 2015, based on the quoted market prices for the same or similar debt issues or on the current rates available to us for debt having the same remaining maturities. Such fair value is greater than the carrying value of debt by $192.7 million and $70.7 million at August 27, 2016 and August 29, 2015, respectively. We had $1.198 billion of variable rate debt outstanding at August 27, 2016, and $1.048 million of variable rate debt outstanding at August 29, 2015. In fiscal 2016, at this borrowing level for variable rate debt, a one percentage point increase in interest rates would have had an unfavorable impact on our pre-tax earnings and cash flows of approximately $12.0 million. The primary interest rate exposure on variable rate debt is based on LIBOR. We had outstanding debt of $3.727 billion, net of unamortized debt issuance costs of $23.4 million, at August 27, 2016, and $3.577 billion, net of unamortized debt issuance costs of $22.7 million, at August 29, 2015. A one percentage point increase in interest rates would reduce the fair value of our fixed rate debt by approximately $178.9 million at August 27, 2016.
Fuel Price Risk
From time to time, we utilize fuel swap contracts in order to lower fuel cost volatility in our operating results. Historically, the instruments were executed to economically hedge a portion of our diesel and unleaded fuel exposure. However, we have not designated the fuel swap contracts as hedging instruments; and therefore, the contracts have not qualified for hedge accounting treatment. In fiscal 2015, we entered into a fuel swap to economically hedge the commodity cost associated with our unleaded fuel usage. The notional amount of the contract was 2.9 million gallons and terminated March 31, 2015. The swap had no significant impact on the results of operations. We did not enter into any fuel swap contracts during fiscal 2016 or 2014.
Foreign Currency Risk
Foreign currency exposures arising from transactions include firm commitments and anticipated transactions denominated in a currency other than our entities’ functional currencies. To minimize our risk, we generally enter into transactions denominated in the respective functional currencies. We are exposed to Brazilian reals, Canadian dollars, euros, Chinese yuan renminbi and British pounds, but our primary foreign currency exposure arises from Mexican peso-denominated revenues and profits and their translation into U.S. dollars. Foreign currency exposures arising from transactions denominated in currencies other than the functional currency are not material.
37
Table of Contents
We view our investments in Mexican subsidiaries as long-term. As a result, we generally do not hedge these net investments. The net asset exposure in the Mexican subsidiaries translated into U.S. dollars using the year-end exchange rates was $398.0 million at August 27, 2016 and $366.7 million at August 29, 2015. The year-end exchange rates with respect to the Mexican peso decreased by approximately 9% against the U.S. dollar during fiscal 2016 and decreased by approximately 29% during fiscal 2015. The potential loss in value of our net assets in the Mexican subsidiaries resulting from a hypothetical 10 percent adverse change in quoted foreign currency exchange rates at August 27, 2016 and August 29, 2015, would be approximately $36.2 million and approximately $33.3 million, respectively. Any changes in our net assets in the Mexican subsidiaries relating to foreign currency exchange rates would be reflected in the foreign currency translation component of Accumulated other comprehensive loss, unless the Mexican subsidiaries are sold or otherwise disposed.
A hypothetical 10 percent adverse change in average exchange rates would not have a material impact on our results of operations.
38
Table of Contents
Item 8. Financial Statements and Supplementary Data
| Management’s Report on Internal Control Over Financial Reporting |
40 | |||
| 40 | ||||
| 41 | ||||
| 43 | ||||
| 43 | ||||
| 44 | ||||
| 45 | ||||
| 46 | ||||
| 47 |
39
Table of Contents
Management’s Report on Internal Control Over Financial Reporting
Our management is responsible for establishing and maintaining adequate internal control over financial reporting (as defined in Rules 13a-15(f) and 15d-15(f) under the Securities Exchange Act of 1934, as amended). Our internal control over financial reporting includes, among other things, defined policies and procedures for conducting and governing our business, sophisticated information systems for processing transactions and properly trained staff. Mechanisms are in place to monitor the effectiveness of our internal control over financial reporting, including regular testing performed by the Company’s internal audit team. Actions are taken to correct deficiencies as they are identified. Our procedures for financial reporting include the active involvement of senior management, our Audit Committee and a staff of highly qualified financial and legal professionals.
Management, with the participation of our principal executive and financial officers, assessed our internal control over financial reporting as of August 27, 2016, the end of our fiscal year. Management based its assessment on criteria established in Internal Control – Integrated Framework issued by the Committee of Sponsoring Organizations of the Treadway Commission 2013 framework.
Based on this assessment, management has concluded that our internal control over financial reporting was effective as of August 27, 2016.
Our independent registered public accounting firm, Ernst & Young LLP, audited the effectiveness of our internal control over financial reporting. Ernst & Young LLP’s attestation report on the Company’s internal control over financial reporting as of August 27, 2016 is included in this Annual Report on Form 10-K.
| /s/ WILLIAM C. RHODES, III |
| William C. Rhodes, III Chairman, President and Chief Executive Officer (Principal Executive Officer) |
| /s/ WILLIAM T. GILES |
| William T. Giles Chief Financial Officer and Executive Vice President – Finance, Information Technology and ALLDATA (Principal Financial Officer) |
Compliance with NYSE Corporate Governance Listing Standards
On January 11, 2016, the Company submitted to the New York Stock Exchange the Annual CEO Certification required pursuant to Section 303A.12(a) of the New York Stock Exchange Listed Company Manual.
Rule 13a-14(a) Certifications of Principal Executive Officer and Principal Financial Officer
The Company has filed, as exhibits to its Annual Report on Form 10-K for the fiscal year ended August 27, 2016, the certifications of its Principal Executive Officer and Principal Financial Officer required pursuant to Section 302 of the Sarbanes-Oxley Act of 2002.
40
Table of Contents
Report of Independent Registered Public Accounting Firm
The Board of Directors and Stockholders of AutoZone, Inc.
We have audited AutoZone, Inc.’s internal control over financial reporting as of August 27, 2016, based on criteria established in Internal Control – Integrated Framework issued by the Committee of Sponsoring Organizations of the Treadway Commission 2013 framework (the “COSO criteria”). AutoZone, Inc.’s management is responsible for maintaining effective internal control over financial reporting, and for its assessment of the effectiveness of internal control over financial reporting included in the accompanying Management’s Report on Internal Control over Financial Reporting. Our responsibility is to express an opinion on AutoZone, Inc.’s internal control over financial reporting based on our audit.
We conducted our audit in accordance with the standards of the Public Company Accounting Oversight Board (United States). Those standards require that we plan and perform the audit to obtain reasonable assurance about whether effective internal control over financial reporting was maintained in all material respects. Our audit included obtaining an understanding of internal control over financial reporting, assessing the risk that a material weakness exists, testing and evaluating the design and operating effectiveness of internal control based on the assessed risk, and performing such other procedures as we considered necessary in the circumstances. We believe that our audit provides a reasonable basis for our opinion.
A company’s internal control over financial reporting is a process designed to provide reasonable assurance regarding the reliability of financial reporting and the preparation of financial statements for external purposes in accordance with generally accepted accounting principles. A company’s internal control over financial reporting includes those policies and procedures that (1) pertain to the maintenance of records that, in reasonable detail, accurately and fairly reflect the transactions and dispositions of the assets of the company; (2) provide reasonable assurance that transactions are recorded as necessary to permit preparation of financial statements in accordance with generally accepted accounting principles, and that receipts and expenditures of the company are being made only in accordance with authorizations of management and directors of the company; and (3) provide reasonable assurance regarding prevention or timely detection of unauthorized acquisition, use, or disposition of the company’s assets that could have a material effect on the financial statements.
Because of its inherent limitations, internal control over financial reporting may not prevent or detect misstatements. Also, projections of any evaluation of effectiveness to future periods are subject to the risk that controls may become inadequate because of changes in conditions, or that the degree of compliance with the policies or procedures may deteriorate.
In our opinion, AutoZone, Inc. maintained, in all material respects, effective internal control over financial reporting as of August 27, 2016, based on the COSO criteria.
We also have audited, in accordance with the standards of the Public Company Accounting Oversight Board (United States), the consolidated balance sheets of AutoZone, Inc. as of August 27, 2016 and August 29, 2015, and the related consolidated statements of income, comprehensive income, stockholders’ deficit, and cash flows for each of the three years in the period ended August 27, 2016 of AutoZone, Inc. and our report dated October 24, 2016 expressed an unqualified opinion thereon.
| /s/ Ernst & Young LLP |
Memphis, Tennessee
October 24, 2016
41
Table of Contents
Report of Independent Registered Public Accounting Firm
The Board of Directors and Stockholders of AutoZone, Inc.
We have audited the accompanying consolidated balance sheets of AutoZone, Inc. as of August 27, 2016 and August 29, 2015, and the related consolidated statements of income, comprehensive income, stockholders’ deficit, and cash flows for each of the three years in the period ended August 27, 2016. These financial statements are the responsibility of AutoZone, Inc.’s management. Our responsibility is to express an opinion on these financial statements based on our audits.
We conducted our audits in accordance with the standards of the Public Company Accounting Oversight Board (United States). Those standards require that we plan and perform the audit to obtain reasonable assurance about whether the financial statements are free of material misstatement. An audit includes examining, on a test basis, evidence supporting the amounts and disclosures in the financial statements. An audit also includes assessing the accounting principles used and significant estimates made by management, as well as evaluating the overall financial statement presentation. We believe that our audits provide a reasonable basis for our opinion.
In our opinion, the financial statements referred to above present fairly, in all material respects, the consolidated financial position of AutoZone, Inc. as of August 27, 2016 and August 29, 2015 and the consolidated results of its operations and its cash flows for each of the three years in the period ended August 27, 2016, in conformity with U.S. generally accepted accounting principles.
We also have audited, in accordance with the standards of the Public Company Accounting Oversight Board (United States), AutoZone, Inc.’s internal control over financial reporting as of August 27, 2016, based on criteria established in Internal Control—Integrated Framework issued by the Committee of Sponsoring Organizations of the Treadway Commission 2013 framework and our report dated October 24, 2016 expressed an unqualified opinion thereon.
| /s/ Ernst & Young LLP |
Memphis, Tennessee
October 24, 2016
42
Table of Contents
Consolidated Statements of Income
| Year Ended | ||||||||||||
| (in thousands, except per share data) |
August 27, 2016 (52 weeks) |
August 29, 2015 (52 weeks) |
August 30, 2014 (52 weeks) |
|||||||||
| Net sales |
$ | 10,635,676 | $ | 10,187,340 | $ | 9,475,313 | ||||||
| Cost of sales, including warehouse and delivery expenses |
5,026,940 | 4,860,309 | 4,540,406 | |||||||||
|
|
|
|
|
|
|
|||||||
| Gross profit |
5,608,736 | 5,327,031 | 4,934,907 | |||||||||
| Operating, selling, general and administrative expenses |
3,548,341 | 3,373,980 | 3,104,684 | |||||||||
|
|
|
|
|
|
|
|||||||
| Operating profit |
2,060,395 | 1,953,051 | 1,830,223 | |||||||||
| Interest expense, net |
147,681 | 150,439 | 167,509 | |||||||||
|
|
|
|
|
|
|
|||||||
| Income before income taxes |
1,912,714 | 1,802,612 | 1,662,714 | |||||||||
| Income tax expense |
671,707 | 642,371 | 592,970 | |||||||||
|
|
|
|
|
|
|
|||||||
| Net income |
$ | 1,241,007 | $ | 1,160,241 | $ | 1,069,744 | ||||||
|
|
|
|
|
|
|
|||||||
| Weighted average shares for basic earnings per share |
29,889 | 31,560 | 33,267 | |||||||||
| Effect of dilutive stock equivalents |
599 | 646 | 615 | |||||||||
|
|
|
|
|
|
|
|||||||
| Weighted average shares for diluted earnings per share |
30,488 | 32,206 | 33,882 | |||||||||
| Basic earnings per share |
$ | 41.52 | $ | 36.76 | $ | 32.16 | ||||||
|
|
|
|
|
|
|
|||||||
| Diluted earnings per share |
$ | 40.70 | $ | 36.03 | $ | 31.57 | ||||||
|
|
|
|
|
|
|
|||||||
See Notes to Consolidated Financial Statements.
Consolidated Statements of Comprehensive Income
| Year Ended | ||||||||||||
| (in thousands) |
August 27, 2016 (52 weeks) |
August 29, 2015 (52 weeks) |
August 30, 2014 (52 weeks) |
|||||||||
| Net income |
$ | 1,241,007 | $ | 1,160,241 | $ | 1,069,744 | ||||||
| Other comprehensive loss: |
||||||||||||
| Pension liability adjustments, net of taxes(1) |
(18,095 | ) | (6,975 | ) | (12,959 | ) | ||||||
| Foreign currency translation adjustments |
(39,524 | ) | (113,652 | ) | 4,647 | |||||||
| Unrealized gains (losses) on marketable securities, net of taxes(2) |
146 | (102 | ) | 101 | ||||||||
| Net derivative activity, net of taxes(3) |
(538 | ) | 114 | 96 | ||||||||
|
|
|
|
|
|
|
|||||||
| Total other comprehensive loss |
(58,011 | ) | (120,615 | ) | (8,115 | ) | ||||||
|
|
|
|
|
|
|
|||||||
| Comprehensive income |
$ | 1,182,996 | $ | 1,039,626 | $ | 1,061,629 | ||||||
|
|
|
|
|
|
|
|||||||
| (1) | Pension liability adjustments are presented net of taxes of $11,394 in 2016, $4,638 in 2015 and $8,287 in 2014. |
| (2) | Unrealized gains (losses) on marketable securities are presented net of taxes of $79 in 2016, $55 in 2015 and $54 in 2014. |
| (3) | Net derivative activities are presented net of taxes of $315 in 2016, $68 in 2015 and $87 in 2014. |
See Notes to Consolidated Financial Statements.
43
Table of Contents
| (in thousands) |
August 27, 2016 |
August 29, 2015 |
||||||
| Assets |
||||||||
| Current assets: |
||||||||
| Cash and cash equivalents |
$ | 189,734 | $ | 175,309 | ||||
| Accounts receivable |
287,680 | 247,872 | ||||||
| Merchandise inventories |
3,631,916 | 3,421,635 | ||||||
| Other current assets |
130,243 | 121,847 | ||||||
| Deferred income taxes |
— | 3,631 | ||||||
|
|
|
|
|
|||||
| Total current assets |
4,239,573 | 3,970,294 | ||||||
| Property and equipment: |
||||||||
| Land |
998,460 | 966,916 | ||||||
| Buildings and improvements |
3,169,575 | 2,989,399 | ||||||
| Equipment |
1,550,792 | 1,422,949 | ||||||
| Leasehold improvements |
434,615 | 395,714 | ||||||
| Construction in progress |
176,673 | 116,729 | ||||||
|
|
|
|
|
|||||
| 6,330,115 | 5,891,707 | |||||||
| Less: Accumulated depreciation and amortization |
2,596,861 | 2,386,075 | ||||||
|
|
|
|
|
|||||
| 3,733,254 | 3,505,632 | |||||||
| Goodwill |
391,887 | 391,887 | ||||||
| Deferred income taxes |
36,855 | 42,615 | ||||||
| Other long-term assets |
198,218 | 191,921 | ||||||
|
|
|
|
|
|||||
| 626,960 | 626,423 | |||||||
|
|
|
|
|
|||||
| $ | 8,599,787 | $ | 8,102,349 | |||||
|
|
|
|
|
|||||
| Liabilities and Stockholders’ Deficit |
||||||||
| Current liabilities: |
||||||||
| Accounts payable |
$ | 4,095,854 | $ | 3,864,168 | ||||
| Accrued expenses and other |
551,625 | 531,561 | ||||||
| Income taxes payable |
42,841 | 58,082 | ||||||
| Deferred income taxes |
— | 259,062 | ||||||
|
|
|
|
|
|||||
| Total current liabilities |
4,690,320 | 4,712,873 | ||||||
| Long-term debt |
4,924,119 | 4,624,876 | ||||||
| Deferred income taxes |
284,500 | — | ||||||
| Other long-term liabilities |
488,386 | 465,990 | ||||||
| Commitments and contingencies |
— | — | ||||||
| Stockholders’ deficit: |
||||||||
| Preferred stock, authorized 1,000 shares; no shares issued |
— | — | ||||||
| Common stock, par value $.01 per share, authorized 200,000 shares; 30,329 shares issued and 29,118 shares outstanding in 2016 and 32,098 shares issued and 30,659 shares outstanding in 2015 |
303 | 321 | ||||||
| Additional paid-in capital |
1,054,647 | 938,355 | ||||||
| Retained deficit |
(1,602,186 | ) | (1,418,738 | ) | ||||
| Accumulated other comprehensive loss |
(307,529 | ) | (249,518 | ) | ||||
| Treasury stock, at cost |
(932,773 | ) | (971,810 | ) | ||||
|
|
|
|
|
|||||
| Total stockholders’ deficit |
(1,787,538 | ) | (1,701,390 | ) | ||||
|
|
|
|
|
|||||
| $ | 8,599,787 | $ | 8,102,349 | |||||
|
|
|
|
|
|||||
See Notes to Consolidated Financial Statements.
44
Table of Contents
Consolidated Statements of Cash Flows
| Year Ended | ||||||||||||
| (in thousands) |
August 27, 2016 (52 weeks) |
August 29, 2015 (52 weeks) |
August 30, 2014 (52 weeks) |
|||||||||
| Cash flows from operating activities: |
||||||||||||
| Net income |
$ | 1,241,007 | $ | 1,160,241 | $ | 1,069,744 | ||||||
| Adjustments to reconcile net income to net cash provided by operating activities: |
||||||||||||
| Depreciation and amortization of property and equipment and intangibles |
297,397 | 269,919 | 251,267 | |||||||||
| Amortization of debt origination fees |
7,980 | 6,230 | 6,856 | |||||||||
| Income tax benefit from exercise of stock options |
(63,731 | ) | (47,895 | ) | (23,771 | ) | ||||||
| Deferred income taxes |
45,019 | 35,971 | (14,698 | ) | ||||||||
| Share-based compensation expense |
39,825 | 40,995 | 39,390 | |||||||||
| Pension plan contributions |
(52,721 | ) | (17,077 | ) | (16,910 | ) | ||||||
| Changes in operating assets and liabilities: |
||||||||||||
| Accounts receivable |
(41,447 | ) | (36,466 | ) | (27,963 | ) | ||||||
| Merchandise inventories |
(227,518 | ) | (266,776 | ) | (276,834 | ) | ||||||
| Accounts payable and accrued expenses |
271,198 | 291,736 | 285,269 | |||||||||
| Income taxes payable |
50,122 | 74,487 | 46,555 | |||||||||
| Other, net |
10,198 | 13,758 | 2,329 | |||||||||
|
|
|
|
|
|
|
|||||||
| Net cash provided by operating activities |
1,577,329 | 1,525,123 | 1,341,234 | |||||||||
| Cash flows from investing activities: |
||||||||||||
| Capital expenditures |
(488,791 | ) | (480,579 | ) | (438,116 | ) | ||||||
| Acquisition of business, net of cash |
— | (75,744 | ) | — | ||||||||
| Purchase of intangibles |
(10,000 | ) | (10,000 | ) | (11,112 | ) | ||||||
| Purchase of marketable securities |
(130,170 | ) | (49,740 | ) | (49,736 | ) | ||||||
| Proceeds from sale of marketable securities |
120,472 | 46,411 | 46,796 | |||||||||
| Proceeds from disposal of capital assets and other, net |
2,654 | 1,741 | 4,200 | |||||||||
|
|
|
|
|
|
|
|||||||
| Net cash used in investing activities |
(505,835 | ) | (567,911 | ) | (447,968 | ) | ||||||
| Cash flows from financing activities: |
||||||||||||
| Net proceeds of commercial paper |
149,900 | 153,800 | 256,800 | |||||||||
| Proceeds from issuance of debt |
650,000 | 650,000 | 400,000 | |||||||||
| Repayment of debt |
(500,000 | ) | (500,000 | ) | (500,000 | ) | ||||||
| Net proceeds from sale of common stock |
80,289 | 66,717 | 42,034 | |||||||||
| Purchase of treasury stock |
(1,452,462 | ) | (1,271,416 | ) | (1,099,212 | ) | ||||||
| Income tax benefit from exercise of stock options |
63,731 | 47,895 | 23,771 | |||||||||
| Payments of capital lease obligations |
(36,320 | ) | (34,986 | ) | (32,656 | ) | ||||||
| Other, net |
(7,935 | ) | (8,712 | ) | (2,294 | ) | ||||||
|
|
|
|
|
|
|
|||||||
| Net cash used in financing activities |
(1,052,797 | ) | (896,702 | ) | (911,557 | ) | ||||||
| Effect of exchange rate changes on cash |
(4,272 | ) | (9,686 | ) | 585 | |||||||
|
|
|
|
|
|
|
|||||||
| Net increase (decrease) in cash and cash equivalents |
14,425 | 50,824 | (17,706 | ) | ||||||||
| Cash and cash equivalents at beginning of year |
175,309 | 124,485 | 142,191 | |||||||||
|
|
|
|
|
|
|
|||||||
| Cash and cash equivalents at end of year |
$ | 189,734 | $ | 175,309 | $ | 124,485 | ||||||
|
|
|
|
|
|
|
|||||||
| Supplemental cash flow information: |
||||||||||||
| Interest paid, net of interest cost capitalized |
$ | 136,731 | $ | 137,630 | $ | 166,477 | ||||||
|
|
|
|
|
|
|
|||||||
| Income taxes paid |
$ | 582,384 | $ | 539,152 | $ | 556,974 | ||||||
|
|
|
|
|
|
|
|||||||
| Assets acquired through capital lease |
$ | 94,052 | $ | 71,047 | $ | 64,927 | ||||||
|
|
|
|
|
|
|
|||||||
See Notes to Consolidated Financial Statements.
45
Table of Contents
Consolidated Statements of Stockholders’ Deficit
| (in thousands) |
Common Shares Issued |
Common Stock |
Additional Paid-in Capital |
Retained Deficit |
Accumulated Other Comprehensive Loss |
Treasury Stock |
Total | |||||||||||||||||||||
| Balance at August 31, 2013 |
36,768 | $ | 368 | $ | 814,457 | $ | (1,378,936 | ) | $ | (120,788 | ) | $ | (1,002,420 | ) | $ | (1,687,319 | ) | |||||||||||
| Net income |
1,069,744 | 1,069,744 | ||||||||||||||||||||||||||
| Total other comprehensive income |
(8,115 | ) | (8,115 | ) | ||||||||||||||||||||||||
| Purchase of 2,232 shares of treasury stock |
(1,099,212 | ) | (1,099,212 | ) | ||||||||||||||||||||||||
| Retirement of treasury shares |
(3,153 | ) | (32 | ) | (73,995 | ) | (1,219,931 | ) | 1,293,958 | – | ||||||||||||||||||
| Issuance of common stock under stock options and stock purchase plans |
243 | 3 | 42,031 | 42,034 | ||||||||||||||||||||||||
| Share-based compensation expense |
37,240 | 37,240 | ||||||||||||||||||||||||||
| Income tax benefit from exercise of stock options |
23,771 | 23,771 | ||||||||||||||||||||||||||
|
|
|
|
|
|
|
|
|
|
|
|
|
|
|
|||||||||||||||
| Balance at August 30, 2014 |
33,858 | 339 | 843,504 | (1,529,123 | ) | (128,903 | ) | (807,674 | ) | (1,621,857 | ) | |||||||||||||||||
| Net income |
1,160,241 | 1,160,241 | ||||||||||||||||||||||||||
| Total other comprehensive loss |
(120,615 | ) | (120,615 | ) | ||||||||||||||||||||||||
| Purchase of 2,010 shares of treasury stock |
(1,271,416 | ) | (1,271,416 | ) | ||||||||||||||||||||||||
| Retirement of treasury shares |
(2,125 | ) | (21 | ) | (57,403 | ) | (1,049,856 | ) | 1,107,280 | – | ||||||||||||||||||
| Issuance of common stock under stock options and stock purchase plans |
365 | 3 | 66,714 | 66,717 | ||||||||||||||||||||||||
| Share-based compensation expense |
37,645 | 37,645 | ||||||||||||||||||||||||||
| Income tax benefit from exercise of stock options |
47,895 | 47,895 | ||||||||||||||||||||||||||
|
|
|
|
|
|
|
|
|
|
|
|
|
|
|
|||||||||||||||
| Balance at August 29, 2015 |
32,098 | 321 | 938,355 | (1,418,738 | ) | (249,518 | ) | (971,810 | ) | (1,701,390 | ) | |||||||||||||||||
| Net income |
1,241,007 | 1,241,007 | ||||||||||||||||||||||||||
| Total other comprehensive loss |
(58,011 | ) | (58,011 | ) | ||||||||||||||||||||||||
| Purchase of 1,903 shares of treasury stock |
(1,452,462 | ) | (1,452,462 | ) | ||||||||||||||||||||||||
| Retirement of treasury shares |
(2,132 | ) | (21 | ) | (67,023 | ) | (1,424,455 | ) | 1,491,499 | – | ||||||||||||||||||
| Issuance of common stock under stock options and stock purchase plans |
363 | 3 | 80,286 | 80,289 | ||||||||||||||||||||||||
| Share-based compensation expense |
39,298 | 39,298 | ||||||||||||||||||||||||||
| Income tax benefit from exercise of stock options |
63,731 | 63,731 | ||||||||||||||||||||||||||
|
|
|
|
|
|
|
|
|
|
|
|
|
|
|
|||||||||||||||
| Balance at August 27, 2016 |
30,329 | $ | 303 | $ | 1,054,647 | $ | (1,602,186 | ) | $ | (307,529 | ) | $ | (932,773 | ) | $ | (1,787,538 | ) | |||||||||||
|
|
|
|
|
|
|
|
|
|
|
|
|
|
|
|||||||||||||||
See Notes to Consolidated Financial Statements.
46
Table of Contents
Notes to Consolidated Financial Statements
Note A – Significant Accounting Policies
Business: AutoZone, Inc. and its wholly owned subsidiaries (“AutoZone” or the “Company”) are principally a retailer and distributor of automotive parts and accessories. At the end of fiscal 2016, the Company operated 5,297 AutoZone stores in the United States (“U.S.”), including Puerto Rico; 483 stores in Mexico; eight stores in Brazil and 26 IMC branches. Each AutoZone store carries an extensive product line for cars, sport utility vehicles, vans and light trucks, including new and remanufactured automotive hard parts, maintenance items, accessories and non-automotive products. At the end of fiscal 2016, 4,390 of the domestic AutoZone stores had a commercial sales program that provides commercial credit and prompt delivery of parts and other products to local, regional and national repair garages, dealers, service stations and public sector accounts. AutoZone stores in Mexico and Brazil also have commercial programs. IMC branches carry an extensive line of original equipment quality import replacement parts. The Company also sells the ALLDATA brand automotive diagnostic and repair software through www.alldata.com and www.alldatadiy.com. Additionally, the Company sells automotive hard parts, maintenance items, accessories and non-automotive products through www.autozone.com, and accessories, performance and replacement parts through www.autoanything.com, and its commercial customers can make purchases through www.autozonepro.com and www.imcparts.net. The Company does not derive revenue from automotive repair or installation services.
Fiscal Year: The Company’s fiscal year consists of 52 or 53 weeks ending on the last Saturday in August. Fiscal 2016, fiscal 2015 and fiscal 2014 each had 52 weeks.
Basis of Presentation: The consolidated financial statements include the accounts of AutoZone, Inc. and its wholly owned subsidiaries. All significant intercompany transactions and balances have been eliminated in consolidation. Certain reclassifications have been made to the prior years’ Consolidated Statements of Cash Flows to conform to the current year’s presentation due to significant pension plan contributions made in fiscal 2016.
Use of Estimates: Management of the Company has made a number of estimates and assumptions relating to the reporting of assets and liabilities and the disclosure of contingent liabilities to prepare these financial statements. Actual results could differ from those estimates.
Cash and Cash Equivalents: Cash equivalents consist of investments with original maturities of 90 days or less at the date of purchase. Cash equivalents include proceeds due from credit and debit card transactions with settlement terms of less than five days. Credit and debit card receivables included within cash and cash equivalents were $46.8 million at August 27, 2016 and $45.1 million at August 29, 2015.
Cash balances are held in various locations around the world. Cash and cash equivalents of $78.1 million and $64.9 million were held outside of the U.S. as of August 27, 2016, and August 29, 2015, respectively, and were generally utilized to support liquidity needs in foreign operations. The Company intends to continue to permanently reinvest the cash held outside of the U.S. in its foreign operations.
Accounts Receivable: Accounts receivable consists of receivables from commercial customers and vendors, and are presented net of an allowance for uncollectible accounts. AutoZone routinely grants credit to certain of its commercial customers. The risk of credit loss in its trade receivables is substantially mitigated by the Company’s credit evaluation process, short collection terms and sales to a large number of customers, as well as the low dollar value per transaction for most of its sales. Allowances for potential credit losses are determined based on historical experience and current evaluation of the composition of accounts receivable. Historically, credit losses have been within management’s expectations and the allowances for uncollectible accounts were $7.4 million at August 27, 2016, and $5.9 million at August 29, 2015.
Merchandise Inventories: Inventories are stated at the lower of cost or market. Merchandise inventories include related purchasing, storage and handling costs. Inventory cost has been determined using the last-in, first-out (“LIFO”) method for domestic inventories and the weighted average cost method for Mexico and Brazil inventories. Due to price deflation on the Company’s merchandise purchases, the Company has exhausted its LIFO reserve balance. The Company’s policy is not to write up inventory in excess of replacement cost, which is based on average cost. The difference between LIFO cost and replacement cost, which will be reduced upon experiencing price inflation on the Company’s merchandise purchases, was $364.1 million at August 27, 2016, and $332.6 million at August 29, 2015.
47
Table of Contents
Marketable Securities: The Company invests a portion of its assets held by the Company’s wholly owned insurance captive in marketable debt securities and classifies them as available-for-sale. The Company includes these securities within the Other current assets and Other long-term assets captions in the accompanying Consolidated Balance Sheets and records the amounts at fair market value, which is determined using quoted market prices at the end of the reporting period. A discussion of marketable securities is included in “Note E – Fair Value Measurements” and “Note F – Marketable Securities.”
Property and Equipment: Property and equipment is stated at cost. Depreciation and amortization are computed principally using the straight-line method over the following estimated useful lives: buildings, 40 to 50 years; building improvements, 5 to 15 years; equipment, 3 to 10 years; and leasehold improvements, over the shorter of the asset’s estimated useful life or the remaining lease term, which includes any reasonably assured renewal periods. Depreciation and amortization include amortization of assets under capital lease.
Impairment of Long-Lived Assets: The Company evaluates the recoverability of its long-lived assets whenever events or changes in circumstances indicate that the carrying value of an asset may not be recoverable. When such an event occurs, the Company compares the sum of the undiscounted expected future cash flows of the asset (asset group) with the carrying amounts of the asset. If the undiscounted expected future cash flows are less than the carrying value of the assets, the Company measures the amount of impairment loss as the amount by which the carrying amount of the assets exceeds the fair value of the assets. There were no material impairment losses recorded in the three years ended August 27, 2016.
Goodwill: The cost in excess of fair value of identifiable net assets of businesses acquired is recorded as goodwill. Goodwill has not been amortized since fiscal 2001, but an analysis is performed at least annually to compare the fair value of the reporting unit to the carrying amount to determine if any impairment exists. The Company performs its annual impairment assessment in the fourth quarter of each fiscal year, unless circumstances dictate more frequent assessments. Refer to “Note N – Goodwill and Intangibles” for additional disclosures regarding the Company’s goodwill and impairment assessment.
Intangible Assets: Intangible assets consist of assets from the acquisitions of IMC and AutoAnything and assets purchased relating to ALLDATA operations, and include technology, non-compete agreements, customer relationships and trade names. Amortizing intangible assets are amortized over periods ranging from 3 to 10 years. Trade names are non-amortizing intangibles as their lives are indefinite. These assets are reviewed at least annually for impairment by comparing the carrying amount to fair value. The Company performs its annual impairment assessment in the fourth quarter of each fiscal year, unless circumstances dictate more frequent assessments. Refer to “Note N – Goodwill and Intangibles” for additional disclosures regarding the Company’s intangible assets and impairment assessment.
Derivative Instruments and Hedging Activities: AutoZone is exposed to market risk from, among other things, changes in interest rates, foreign exchange rates and fuel prices. From time to time, the Company uses various derivative instruments to reduce such risks. To date, based upon the Company’s current level of foreign operations, no derivative instruments have been utilized to reduce foreign exchange rate risk. All of the Company’s hedging activities are governed by guidelines that are authorized by AutoZone’s Board of Directors (the “Board”). Further, the Company does not buy or sell derivative instruments for trading purposes.
AutoZone’s financial market risk results primarily from changes in interest rates. At times, AutoZone reduces its exposure to changes in interest rates by entering into various interest rate hedge instruments such as interest rate swap contracts, treasury lock agreements and forward-starting interest rate swaps. All of the Company’s interest rate hedge instruments are designated as cash flow hedges. Refer to “Note H – Derivative Financial Instruments” for additional disclosures regarding the Company’s derivative instruments and hedging activities. Cash flows related to these instruments designated as qualifying hedges are reflected in the accompanying Consolidated Statements of Cash Flows in the same categories as the cash flows from the items being hedged. Accordingly, cash flows relating to the settlement of interest rate derivatives hedging the forecasted issuance of debt have been reflected upon settlement as a component of financing cash flows. The resulting gain or loss from such settlement
48
Table of Contents
is deferred to Accumulated other comprehensive loss and reclassified to interest expense over the term of the underlying debt. This reclassification of the deferred gains and losses impacts the interest expense recognized on the underlying debt that was hedged and is therefore reflected as a component of operating cash flows in periods subsequent to settlement.
Foreign Currency: The Company accounts for its Mexican, Brazilian, Canadian, European, Chinese and British operations using the Mexican peso, Brazilian real, Canadian dollar, euro, Chinese yuan renminbi and British pound as the functional currencies, respectively, and converts its financial statements from these currencies to U.S. dollars. The cumulative loss on currency translation is recorded as a component of Accumulated other comprehensive loss (see “Note G – Accumulated Other Comprehensive Loss”).
Self-Insurance Reserves: The Company retains a significant portion of the risks associated with workers’ compensation, employee health, general, products liability, property and vehicle insurance. Through various methods, which include analyses of historical trends and utilization of actuaries, the Company estimates the costs of these risks. The costs are accrued based upon the aggregate of the liability for reported claims and an estimated liability for claims incurred but not reported. Estimates are based on calculations that consider historical lag and claim development factors. The long-term portions of these liabilities are recorded at the Company’s estimate of their net present value.
Deferred Rent: The Company recognizes rent expense on a straight-line basis over the course of the lease term, which includes any reasonably assured renewal periods, beginning on the date the Company takes physical possession of the property (see “Note O – Leases”). Differences between this calculated expense and cash payments are recorded as a liability within the Accrued expenses and other and Other long-term liabilities captions in the accompanying Consolidated Balance Sheets, based on the terms of the lease. Deferred rent approximated $121.7 million as of August 27, 2016, and $113.7 million as of August 29, 2015.
Financial Instruments: The Company has financial instruments, including cash and cash equivalents, accounts receivable, other current assets and accounts payable. The carrying amounts of these financial instruments approximate fair value because of their short maturities. A discussion of the carrying values and fair values of the Company’s debt is included in “Note I – Financing,” marketable securities is included in “Note F – Marketable Securities,” and derivatives is included in “Note H – Derivative Financial Instruments.”
Income Taxes: The Company accounts for income taxes under the liability method. Deferred tax assets and liabilities are determined based on differences between financial reporting and tax bases of assets and liabilities and are measured using the enacted tax rates and laws that will be in effect when the differences are expected to reverse. Our effective tax rate is based on income by tax jurisdiction, statutory rates and tax saving initiatives available to the Company in the various jurisdictions in which we operate.
The Company recognizes liabilities for uncertain income tax positions based on a two-step process. The first step is to evaluate the tax position for recognition by determining if the weight of available evidence indicates that it is more likely than not that the position will be sustained on audit, including resolution of related appeals or litigation processes, if any. The second step requires the Company to estimate and measure the tax benefit as the largest amount that is more than 50% likely to be realized upon ultimate settlement. It is inherently difficult and subjective to estimate such amounts, as the Company must determine the probability of various possible outcomes. The Company reevaluates these uncertain tax positions on a quarterly basis or when new information becomes available to management. These reevaluations are based on factors including, but not limited to, changes in facts or circumstances, changes in tax law, successfully settled issues under audit, expirations due to statutes and new audit activity. Such a change in recognition or measurement could result in the recognition of a tax benefit or an increase to the tax accrual.
The Company classifies interest related to income tax liabilities, and if applicable, penalties, as a component of Income tax expense. The income tax liabilities and accrued interest and penalties that are expected to be payable within one year of the balance sheet date are presented within the Accrued expenses and other caption in the accompanying Consolidated Balance Sheets. The remaining portion of the income tax liabilities and accrued interest and penalties are presented within the Other long-term liabilities caption in the accompanying Consolidated Balance Sheets because payment of cash is not anticipated within one year of the balance sheet date. Refer to “Note D – Income Taxes” for additional disclosures regarding the Company’s income taxes.
49
Table of Contents
Sales and Use Taxes: Governmental authorities assess sales and use taxes on the sale of goods and services. The Company excludes taxes collected from customers in its reported sales results; such amounts are included within the Accrued expenses and other caption until remitted to the taxing authorities.
Dividends: The Company currently does not pay a dividend on its common stock. The ability to pay dividends is subject to limitations imposed by Nevada law. Under Nevada law, any future payment of dividends would be dependent upon the Company’s financial condition, capital requirements, earnings and cash flow.
Revenue Recognition: The Company recognizes sales at the time the sale is made and the product is delivered to the customer. Revenue from sales are presented net of allowances for estimated sales returns, which are based on historical return rates.
A portion of the Company’s transactions include the sale of auto parts that contain a core component. The core component represents the recyclable portion of the auto part. Customers are not charged for the core component of the new part if a used core is returned at the point of sale of the new part; otherwise the Company charges customers a specified amount for the core component. The Company refunds that same amount upon the customer returning a used core to the store at a later date. The Company does not recognize sales or cost of sales for the core component of these transactions when a used part is returned or expected to be returned from the customer.
Vendor Allowances and Advertising Costs: The Company receives various payments and allowances from its vendors through a variety of programs and arrangements. Monies received from vendors include rebates, allowances and promotional funds. The amounts to be received are subject to the terms of the vendor agreements, which generally do not state an expiration date, but are subject to ongoing negotiations that may be impacted in the future based on changes in market conditions, vendor marketing strategies and changes in the profitability or sell-through of the related merchandise.
Rebates and other miscellaneous incentives are earned based on purchases or product sales and are accrued ratably over the purchase or sale of the related product. These monies are generally recorded as a reduction of merchandise inventories and are recognized as a reduction to cost of sales as the related inventories are sold.
For arrangements that provide for reimbursement of specific, incremental, identifiable costs incurred by the Company in selling the vendors’ products, the vendor funds are recorded as a reduction to Operating, selling, general and administrative expenses in the period in which the specific costs were incurred.
The Company expenses advertising costs as incurred. Advertising expense, net of vendor promotional funds, was $98.3 million in fiscal 2016, $98.0 million in fiscal 2015 and $84.7 million in fiscal 2014. Vendor promotional funds, which reduced advertising expense, amounted to $21.4 million in fiscal 2016, $22.0 million in fiscal 2015 and $28.4 million in fiscal 2014.
Cost of Sales and Operating, Selling, General and Administrative Expenses: The following illustrates the primary costs classified in each major expense category:
Cost of Sales
| • | Total cost of merchandise sold, including: |
| • | Freight expenses associated with moving merchandise inventories from the Company’s vendors to the distribution centers; |
| • | Vendor allowances that are not reimbursements for specific, incremental, identifiable costs |
| • | Costs associated with operating the Company’s supply chain, including payroll and benefit costs, warehouse occupancy costs, transportation costs and depreciation; and |
| • | Inventory shrinkage |
50
Table of Contents
Operating, Selling, General and Administrative Expenses
| • | Payroll and benefit costs for store and store support employees; |
| • | Occupancy costs of store and store support facilities; |
| • | Depreciation and amortization related to retail and store support assets; |
| • | Transportation costs associated with commercial and hub deliveries; |
| • | Advertising; |
| • | Self insurance costs; and |
| • | Other administrative costs, such as credit card transaction fees, legal costs, supplies and travel and lodging |
Warranty Costs: The Company or the vendors supplying its products provide the Company’s customers limited warranties on certain products that range from 30 days to lifetime. In most cases, the Company’s vendors are primarily responsible for warranty claims. Warranty costs relating to merchandise sold under warranty not covered by vendors are estimated and recorded as warranty obligations at the time of sale based on each product’s historical return rate. These obligations, which are often funded by vendor allowances, are recorded within the Accrued expenses and other caption in the Consolidated Balance Sheets. For vendor allowances that are in excess of the related estimated warranty expense for the vendor’s products, the excess is recorded as a reduction in inventory cost and recognized as a reduction to cost of sales as the related inventory is sold.
Shipping and Handling Costs: The Company does not generally charge customers separately for shipping and handling. Substantially all the costs the Company incurs to ship products to our stores are included in cost of sales.
Pre-opening Expenses: Pre-opening expenses, which consist primarily of payroll and occupancy costs, are expensed as incurred.
Earnings per Share: Basic earnings per share is based on the weighted average outstanding common shares. Diluted earnings per share is based on the weighted average outstanding common shares adjusted for the effect of common stock equivalents, which are primarily stock options. There were 19,880 stock options excluded from the diluted earnings per share calculation because they would have been anti-dilutive as of August 27, 2016. There were 1,640 stock options excluded for the year ended August 29, 2015, and 1,000 stock options excluded for the year ended August 30, 2014, because they would have been anti-dilutive.
Share-Based Payments: Share-based payments include stock option grants and certain other transactions under the Company’s stock plans. The Company recognizes compensation expense for its share-based payments over the requisite service period based on the fair value of the awards. See “Note B – Share-Based Payments” for further discussion.
Risk and Uncertainties: In fiscal 2016, one class of similar products accounted for approximately 11 percent of the Company’s total revenues, and one vendor supplied approximately 10 percent of the Company’s total purchases. No other class of similar products accounted for 10 percent or more of total revenues, and no other individual vendor provided more than 10 percent of total purchases.
Recently Adopted Accounting Pronouncements:
In November 2015, the Financial Accounting Standards Board (“FASB”) issued Accounting Standards Update (“ASU”) 2015-17, Income Taxes – Balance Sheet Classification of Deferred Taxes (Topic 740). ASU 2015-17 requires all deferred tax liabilities and assets to be presented in the balance sheet as noncurrent. The Company early adopted this standard prospectively during the year ended August 27, 2016. The adoption of this standard resulted in reclassifying current deferred income tax assets to noncurrent deferred income tax assets and current deferred income tax liabilities to noncurrent deferred income tax liabilities. No prior periods were retrospectively adjusted.
51
Table of Contents
Recently Issued Accounting Pronouncements: In May 2014, the FASB issued ASU 2014-09, Revenue from Contracts with Customers. Under ASU 2014-09, an entity will recognize revenue to depict the transfer of promised goods or services to customers at an amount that reflects what it expects in exchange for the goods or services. It also requires more detailed disclosures to enable users of financial statements to understand the nature, amount, timing and uncertainty of revenue and cash flows arising from contracts with customers. The Company is in the process of evaluating the impact of the provisions of ASU 2014-09 on its consolidated financial statements. This update will be effective for the Company at the beginning of its fiscal 2019 year.
In September 2015, the FASB issued ASU 2015-16, Business Combinations (Topic 805): Simplifying the Accounting for Measurement-Period Adjustments. ASU 2015-16 requires an acquirer to recognize adjustments to provisional amounts that are identified during the measurement period in the reporting period in which the adjustment amounts are determined, including the cumulative effect of the change in provisional amount, as if the accounting had been completed at the acquisition date. The Company does not expect the provisions of ASU 2015-16 to have a material impact on its consolidated financial statements. This update will be effective for the Company beginning with its fiscal 2017 first quarter.
In January 2016, the FASB issued ASU 2016-01, Financial Instruments – Overall (Subtopic 825-10): Recognition and Measurement of Financial Assets and Financial Liabilities. ASU 2016-01 requires that all financial assets and liabilities not accounted for under the equity method be measured at fair value with the changes in fair value recognized in net income. The amendments in this update also require an entity to present separately in other comprehensive income the portion of the total change in the fair value of a liability resulting from a change in the instrument-specific credit risk when the entity has elected to measure the liability at fair value in accordance with the fair value option for financial instruments. In addition, the amendments in this update supersede the requirement for public business entities to disclose the methods and significant assumptions used to estimate the fair value of financial instruments carried at amortized cost. The Company can early adopt the provision requiring it to recognize in other comprehensive income the fair value change from instrument-specific credit risk measured using the fair value option for financial instruments. Except for this early application guidance, early adoption is not permitted. The Company is still evaluating the effects of the provisions of ASU 2016-01 on its consolidated financial statements. This update will be effective for the Company beginning with its fiscal 2019 first quarter.
In February 2016, the FASB issued ASU 2016-02, Leases (Topic 842). ASU 2016-02 requires an entity to recognize a right-of-use asset and lease liability for all leases with terms of more than 12 months. Recognition, measurement and presentation of expenses will depend on classification as a finance or operating lease. The amendments also require certain quantitative and qualitative disclosures about leasing arrangements. Early adoption is permitted. The updated guidance requires a modified retrospective adoption. The Company is still evaluating the effects of the provisions of ASU 2016-02 on its consolidated financial statements. This update will be effective for the Company beginning with its fiscal 2020 first quarter.
In March 2016, the FASB issued ASU 2016-04, Liabilities – Extinguishments of Liabilities (Subtopic 405-20): Recognition of Breakage for Certain Prepaid Stored-Value Products. ASU 2016-04 requires that breakage of both financial and nonfinancial liabilities related to the sale of prepaid stored-value products be accounted for consistent with the revenue recognition guidance in Topic 606. This guidance requires an entity to derecognize the liability related to expected breakage in proportion to the pattern of rights expected to be exercised by the consumer only if it is probable that a significant reversal of the recognized breakage amount will not occur. Changes to an entity’s estimated breakage amount must be accounted for as a change in accounting estimate. Early adoption is permitted. The Company does not expect the provisions of ASU 2016-04 to have a material impact on its financial statements. This update will be effective for the Company beginning with its fiscal 2019 first quarter.
In March 2016, the FASB issued ASU 2016-09, Compensation – Stock Compensation (Topic 718): Improvement to Employee Share-based Payment Accounting. ASU 2016-09 simplifies several aspects of the accounting for share-based payment transactions, including the income tax consequences, classification of awards as either equity or liabilities and classification on the statement of cash flows. Early adoption is permitted. The Company expects to adopt the provisions of ASU 2016-09 beginning with its fiscal 2017 first quarter. The Company does not expect the provisions to have a material impact on its consolidated financial statements except for the income tax consequences, which will be dependent on the volume of future option exercise activity.
52
Table of Contents
In August 2016, the FASB issued ASU 2016-15, Statement of Cash Flows (Topic 230): Classification of Certain Cash Receipts and Cash Payments (A Consensus of the Emerging Issues Task Force). ASU 2016-15 provides guidance on the classification of certain cash receipts and payments in the statement of cash flows. The guidance must be applied retrospectively to all periods presented but may be applied prospectively if retrospective application would be impracticable. Early adoption is permitted. The Company is in the process of evaluating the impact of the provisions of ASU 2016-15 on its consolidated financial statements. This update will be effective for the Company at the beginning of its fiscal 2019 year.
The Company believes that no other new accounting guidance that was issued during fiscal 2016 will be relevant to the readers of its financial statements.
Note B – Share-Based Payments
Total share-based compensation expense (a component of Operating, selling, general and administrative expenses) was $39.8 million for fiscal 2016, $41.0 million for fiscal 2015 and $39.4 million for fiscal 2014. As of August 27, 2016, share-based compensation expense for unvested awards not yet recognized in earnings was $41.3 million and will be recognized over a weighted average period of 2.2 years. Tax deductions in excess of recognized compensation cost are classified as a financing cash inflow.
On December 15, 2010, the Company’s stockholders approved the 2011 Equity Incentive Award Plan (the “2011 Plan”), allowing the Company to provide equity-based compensation to non-employee directors and employees for their service to AutoZone or its subsidiaries or affiliates. Prior to the Company’s adoption of the 2011 Plan, equity-based compensation was provided to employees under the 2006 Stock Option Plan and to non-employee directors under the 2003 Director Compensation Plan (the “2003 Comp Plan”) and the 2003 Director Stock Option Plan (the “2003 Option Plan”).
During fiscal 2016, the Company’s stockholders approved the Amended and Restated AutoZone, Inc. 2011 Equity Incentive Award Plan (the “Amended 2011 Equity Plan”). The Amended 2011 Equity Plan imposes a maximum limit on the compensation, measured as the sum of any cash compensation and the aggregate grant date fair value of awards granted under the Amended 2011 Equity Plan, which may be paid to non-employee directors for such service during any calendar year. The Amended 2011 Equity Plan also applies a ten-year term on the Amended 2011 Equity Plan through December 16, 2025 and extends the Company’s ability to grant incentive stock options through October 7, 2025.
The Company grants options to purchase common stock to certain of its employees under its plan at prices equal to the market value of the stock on the date of grant. Options have a term of 10 years or 10 years and one day from grant date. Employee options generally vest in equal annual installments on the first, second, third and fourth anniversaries of the grant date and generally have 30 or 90 days after the service relationship ends, or one year after death, to exercise all vested options. The fair value of each option grant is separately estimated for each vesting date. The fair value of each option is amortized into compensation expense on a straight-line basis between the grant date for the award and each vesting date.
In addition to the 2011 Plan, on December 15, 2010, the Company adopted the 2011 Director Compensation Program (the “2011 Program”), which stated that non-employee directors would receive their compensation in awards of restricted stock units under the 2011 Plan. Under the 2011 Program, restricted stock units are granted the first day of each calendar quarter. The number of restricted stock units granted each quarter is determined by dividing one-fourth of the amount of the annual retainer by the fair market value of the shares of common stock as of the grant date. The restricted stock units are fully vested on the date they are issued and are paid in shares of the Company’s common stock subsequent to the non-employee director ceasing to be a member of the Board.
The 2011 Program replaced the 2003 Comp Plan and the 2003 Option Plan. Under the 2003 Comp Plan, non-employee directors could receive no more than one-half of their director fees immediately in cash, and the remainder of the fees was required to be taken in common stock or stock appreciation rights. The director had the option to elect to receive up to 100% of the fees in stock or defer all or part of the fees in units with value equivalent to the value of shares of common stock as of the grant date. At August 27, 2016, the Company had $13.6 million accrued related to 17,990 outstanding units issued under the 2003 Comp Plan and prior plans, and there was $13.1 million accrued related to 17,990 outstanding units issued as of August 29, 2015. No additional shares of stock or units will be issued in future years under the 2003 Comp Plan.
53
Table of Contents
Under the 2003 Option Plan, each non-employee director received an option grant on January 1 of each year, and each new non-employee director received an option to purchase 3,000 shares upon election to the Board, plus a portion of the annual directors’ option grant prorated for the portion of the year actually served. These stock option grants were made at the fair market value as of the grant date and generally vested three years from the grant date. There were 24,000 and 32,000 outstanding options under the 2003 Option Plan as of August 27, 2016 and August 29, 2015, respectively. No additional shares of stock will be issued in future years under the 2003 Option Plan.
During the second quarter of fiscal 2014, the Company adopted the 2014 Director Compensation Program (the “Program”), which states that non-employee directors will receive their compensation in awards of restricted stock units under the 2011 Plan, with an option for a certain portion of a director’s compensation to be paid in cash at the non-employee director’s election. The Program replaces the 2011 Program. Under the Program, restricted stock units are granted January 1 of each year (the “Grant Date”). The number of restricted stock units is determined by dividing the amount of the annual retainer by the fair market value of the shares of common stock as of the Grant Date. The restricted stock units are fully vested on January 1 of each year and are paid in shares of the Company’s common stock on the earlier to occur of the fifth anniversary of the Grant Date or the date the non-employee director ceases to be a member of the Board (“Separation from Service”). Non-employee directors may elect to defer receipt of the restricted stock units until their Separation from Service. The cash portion of the award, if elected, is paid ratably over the remaining calendar quarters.
The Company has estimated the fair value of all stock option awards as of the date of the grant by applying the Black-Scholes-Merton multiple-option pricing valuation model. The application of this valuation model involves assumptions that are judgmental and highly sensitive in the determination of compensation expense. The following table presents the weighted average for key assumptions used in determining the fair value of options granted and the related share-based compensation expense:
| Year Ended | ||||||||||||
| August 27, 2016 |
August 29, 2015 |
August 30, 2014 |
||||||||||
| Expected price volatility |
18 | % | 20 | % | 23 | % | ||||||
| Risk-free interest rates |
1.5 | % | 1.4 | % | 1.0 | % | ||||||
| Weighted average expected lives (in years) |
5.7 | 5.1 | 5.2 | |||||||||
| Forfeiture rate |
10 | % | 9 | % | 9 | % | ||||||
| Dividend yield |
0 | % | 0 | % | 0 | % | ||||||
The following methodologies were applied in developing the assumptions used in determining the fair value of options granted:
Expected price volatility – This is a measure of the amount by which a price has fluctuated or is expected to fluctuate. The Company uses actual historical changes in the market value of its stock to calculate the volatility assumption as it is management’s belief that this is the best indicator of future volatility. The Company calculates daily market value changes from the date of grant over a past period representative of the expected life of the options to determine volatility. An increase in the expected volatility will increase compensation expense.
Risk-free interest rate – This is the U.S. Treasury rate for the week of the grant having a term equal to the expected life of the option. An increase in the risk-free interest rate will increase compensation expense.
Expected lives – This is the period of time over which the options granted are expected to remain outstanding and is based on historical experience. Separate groups of employees that have similar historical exercise behavior are considered separately for valuation purposes. Options granted have a maximum term of ten years or ten years and one day. An increase in the expected life will increase compensation expense.
54
Table of Contents
Forfeiture rate – This is the estimated percentage of options granted that are expected to be forfeited or canceled before becoming fully vested. This estimate is based on historical experience at the time of valuation and reduces expense ratably over the vesting period. An increase in the forfeiture rate will decrease compensation expense. This estimate is evaluated periodically based on the extent to which actual forfeitures differ, or are expected to differ, from the previous estimate.
Dividend yield – The Company has not made any dividend payments nor does it have plans to pay dividends in the foreseeable future. An increase in the dividend yield will decrease compensation expense.
The weighted average grant date fair value per share of options granted was $156.20 during fiscal 2016, $106.27 during fiscal 2015 and $96.97 during fiscal 2014. The intrinsic value of options exercised was $178.0 million in fiscal 2016, $154.8 million in fiscal 2015 and $70.6 million in fiscal 2014. The total fair value of options vested was $32.2 million in fiscal 2016, $30.6 million in fiscal 2015 and $27.7 million in fiscal 2014.
The Company generally issues new shares when options are exercised. The following table summarizes information about stock option activity for the year ended August 27, 2016:
| Number of Shares |
Weighted- Average Exercise Price |
Weighted- Average Remaining Contractual Term (in years) |
Aggregate Intrinsic Value (in thousands) |
|||||||||||||
| Outstanding – August 29, 2015 |
1,769,429 | $ | 327.90 | |||||||||||||
| Granted |
378,415 | 745.81 | ||||||||||||||
| Exercised |
(334,799 | ) | 239.94 | |||||||||||||
| Cancelled |
(53,637 | ) | 518.17 | |||||||||||||
|
|
|
|||||||||||||||
| Outstanding – August 27, 2016 |
1,759,408 | 428.72 | 6.39 | $ | 572,011 | |||||||||||
|
|
|
|||||||||||||||
| Exercisable |
957,159 | 293.50 | 4.87 | 440,261 | ||||||||||||
|
|
|
|||||||||||||||
| Expected to vest |
722,024 | 590.04 | 8.20 | 117,997 | ||||||||||||
|
|
|
|||||||||||||||
| Available for future grants |
1,149,507 | |||||||||||||||
|
|
|
|||||||||||||||
The Company recognized $2.0 million in expense related to the discount on the selling of shares to employees and executives under various share purchase plans in fiscal 2016, $2.1 million in fiscal 2015 and $1.7 million in fiscal 2014. The Sixth Amended and Restated AutoZone, Inc. Employee Stock Purchase Plan (the “Employee Plan”), which is qualified under Section 423 of the Internal Revenue Code, permits all eligible employees to purchase AutoZone’s common stock at 85% of the lower of the market price of the common stock on the first day or last day of each calendar quarter through payroll deductions. Maximum permitted annual purchases are $15,000 per employee or 10 percent of compensation, whichever is less. Under the Employee Plan, 12,662 shares were sold to employees in fiscal 2016, 14,222 shares were sold to employees in fiscal 2015 and 15,355 shares were sold to employees in fiscal 2014. The Company repurchased 12,460 shares at market value in fiscal 2016, 15,594 shares at market value in fiscal 2015 and 16,013 shares at market value in fiscal 2014 from employees electing to sell their stock. Issuances of shares under the Employee Plan are netted against repurchases and such repurchases are not included in share repurchases disclosed in “Note K – Stock Repurchase Program.” At August 27, 2016, 192,505 shares of common stock were reserved for future issuance under the Employee Plan.
Once executives have reached the maximum purchases under the Employee Plan, the Fifth Amended and Restated Executive Stock Purchase Plan (the “Executive Plan”) permits all eligible executives to purchase AutoZone’s common stock in an amount up to 25 percent of his or her annual salary and bonus. Purchases under the Executive Plan were 1,943 shares in fiscal 2016, 2,229 shares in fiscal 2015 and 3,028 shares in fiscal 2014. At August 27, 2016, 241,753 shares of common stock were reserved for future issuance under the Executive Plan.
55
Table of Contents
Note C – Accrued Expenses and Other
Accrued expenses and other consisted of the following:
| (in thousands) |
August 27, 2016 |
August 29, 2015 |
||||||
| Accrued compensation, related payroll taxes and benefits |
$ | 180,012 | $ | 177,218 | ||||
| Property, sales and other taxes |
95,293 | 86,824 | ||||||
| Medical and casualty insurance claims (current portion) |
78,458 | 79,485 | ||||||
| Capital lease obligations |
44,834 | 40,528 | ||||||
| Accrued interest |
34,179 | 35,828 | ||||||
| Accrued gift cards |
24,129 | 22,358 | ||||||
| Accrued sales and warranty returns |
19,527 | 17,223 | ||||||
| Other |
75,193 | 72,097 | ||||||
|
|
|
|
|
|||||
| $ | 551,625 | $ | 531,561 | |||||
|
|
|
|
|
|||||
The Company retains a significant portion of the insurance risks associated with workers’ compensation, employee health, general, products liability, property and vehicle insurance. A portion of these self-insured losses is managed through a wholly owned insurance captive. The Company maintains certain levels for stop-loss coverage for each self-insured plan in order to limit its liability for large claims. The limits are per claim and are $1.5 million for workers’ compensation and property, $2.0 million for vehicles, $0.7 million for employee health and $1.0 million for general and products liability.
Note D – Income Taxes
The components of income from continuing operations before income taxes are as follows:
| Year Ended | ||||||||||||
| (in thousands) |
August 27, 2016 |
August 29, 2015 |
August 30, 2014 |
|||||||||
| Domestic |
$ | 1,737,727 | $ | 1,676,640 | $ | 1,550,203 | ||||||
| International |
174,987 | 125,972 | 112,511 | |||||||||
|
|
|
|
|
|
|
|||||||
| $ | 1,912,714 | $ | 1,802,612 | $ | 1,662,714 | |||||||
|
|
|
|
|
|
|
|||||||
The provision for income tax expense consisted of the following:
| Year Ended | ||||||||||||
| (in thousands) |
August 27, 2016 |
August 29, 2015 |
August 30, 2014 |
|||||||||
| Current: |
||||||||||||
| Federal |
$ | 534,621 | $ | 522,073 | $ | 516,983 | ||||||
| State |
39,223 | 41,921 | 54,481 | |||||||||
| International |
52,844 | 42,406 | 36,204 | |||||||||
|
|
|
|
|
|
|
|||||||
| 626,688 | 606,400 | 607,668 | ||||||||||
| Deferred: |
||||||||||||
| Federal |
48,509 | 38,299 | (762 | ) | ||||||||
| State |
9,453 | 941 | (7,752 | ) | ||||||||
| International |
(12,943 | ) | (3,269 | ) | (6,184 | ) | ||||||
|
|
|
|
|
|
|
|||||||
| 45,019 | 35,971 | (14,698 | ) | |||||||||
|
|
|
|
|
|
|
|||||||
| Income tax expense |
$ | 671,707 | $ | 642,371 | $ | 592,970 | ||||||
|
|
|
|
|
|
|
|||||||
56
Table of Contents
A reconciliation of the provision for income taxes to the amount computed by applying the federal statutory tax rate of 35% to income before income taxes is as follows:
| Year Ended | ||||||||||||
| (in thousands) |
August 27, 2016 |
August 29, 2015 |
August 30, 2014 |
|||||||||
| Federal tax at statutory U.S. income tax rate |
35.0 | % | 35.0 | % | 35.0 | % | ||||||
| State income taxes, net |
1.6 | % | 1.5 | % | 1.8 | % | ||||||
| Other |
(1.5 | %) | (0.9 | %) | (1.1 | %) | ||||||
|
|
|
|
|
|
|
|||||||
| Effective tax rate |
35.1 | % | 35.6 | % | 35.7 | % | ||||||
|
|
|
|
|
|
|
|||||||
Significant components of the Company’s deferred tax assets and liabilities were as follows:
| (in thousands) |
August 27, 2016 |
August 29, 2015 |
||||||
| Deferred tax assets: |
||||||||
| Net operating loss and credit carryforwards |
$ | 50,859 | $ | 49,088 | ||||
| Accrued benefits |
93,212 | 85,266 | ||||||
| Pension |
13,397 | 21,104 | ||||||
| Other |
55,203 | 56,125 | ||||||
|
|
|
|
|
|||||
| Total deferred tax assets |
212,671 | 211,583 | ||||||
| Less: Valuation allowances |
(13,338 | ) | (8,833 | ) | ||||
|
|
|
|
|
|||||
| Net deferred tax asset |
199,333 | 202,750 | ||||||
| Deferred tax liabilities: |
||||||||
| Property and equipment |
(93,943 | ) | (68,920 | ) | ||||
| Inventory |
(315,563 | ) | (294,242 | ) | ||||
| Prepaid Expenses |
(27,395 | ) | (27,134 | ) | ||||
| Other |
(10,077 | ) | (25,270 | ) | ||||
|
|
|
|
|
|||||
| Total deferred tax liabilities |
(446,978 | ) | (415,566 | ) | ||||
|
|
|
|
|
|||||
| Net deferred tax liability |
$ | (247,645 | ) | $ | (212,816 | ) | ||
|
|
|
|
|
|||||
Deferred taxes are not provided for temporary differences of $572.0 million at August 27, 2016, and $431.9 million at August 29, 2015, representing earnings of non-U.S. subsidiaries that are intended to be permanently reinvested. If a tax liability associated with these undistributed earnings had been recorded it would have been approximately $35.0 million and $12.0 million at August 27, 2016 and August 29, 2015, respectively.
At August 27, 2016 and August 29, 2015, the Company had deferred tax assets of $25.2 million and $19.5 million, respectively, from net operating loss (“NOL”) carryforwards available to reduce future taxable income totaling approximately $122.0 million and $113.6 million, respectively. Certain NOLs have no expiration date and others will expire, if not utilized, in various years from fiscal 2017 through 2035. At August 27, 2016 and August 29, 2015, the Company had deferred tax assets for income tax credit carryforwards of $25.7 million and $29.6 million, respectively. Certain income tax credit carryforwards have no expiration and others will expire, if not utilized, in various years from fiscal 2023 through 2026.
At August 27, 2016 and August 29, 2015, the Company had a valuation allowance of $13.3 million and $8.8 million, respectively, on deferred tax assets associated with NOL and tax credit carryforwards for which management has determined it is more likely than not that the deferred tax asset will not be realized. Management believes it is more likely than not that the remaining deferred tax assets will be fully realized.
57
Table of Contents
A reconciliation of the beginning and ending amount of unrecognized tax benefits is as follows:
| (in thousands) |
August 27, 2016 |
August 29, 2015 |
||||||
| Beginning balance |
$ | 28,434 | $ | 33,128 | ||||
| Additions based on tax positions related to the current year |
7,172 | 5,707 | ||||||
| Additions for tax positions of prior years |
95 | 625 | ||||||
| Reductions for tax positions of prior years |
(2,405 | ) | (1,268 | ) | ||||
| Reductions due to settlements |
(858 | ) | (5,312 | ) | ||||
| Reductions due to statute of limitations |
(4,712 | ) | (4,446 | ) | ||||
|
|
|
|
|
|||||
| Ending balance |
$ | 27,726 | $ | 28,434 | ||||
|
|
|
|
|
|||||
Included in the August 27, 2016 and the August 29, 2015 balances are $15.5 million and $16.8 million, respectively, of unrecognized tax benefits that, if recognized, would reduce the Company’s effective tax rate.
The Company accrues interest on unrecognized tax benefits as a component of income tax expense. Penalties, if incurred, would be recognized as a component of income tax expense. The Company had $2.8 million and $2.9 million accrued for the payment of interest and penalties associated with unrecognized tax benefits at August 27, 2016 and August 29, 2015, respectively.
The Company files U.S. federal, U.S. state and local and international income tax returns. With few exceptions, the Company is no longer subject to state and local or Non-U.S. examinations by tax authorities for fiscal year 2012 and prior. The Company is typically engaged in various tax examinations at any given time by U.S. federal, state and local and international taxing jurisdictions. As of August 27, 2016, the Company estimates that the amount of unrecognized tax benefits could be reduced by approximately $3.9 million over the next 12 months as a result of tax audit settlements. While the Company believes that it is adequately accrued for possible audit adjustments, the final resolution of these examinations cannot be determined at this time and could result in final settlements that differ from current estimates.
Note E – Fair Value Measurements
The Company has adopted ASC Topic 820, Fair Value Measurement, which defines fair value, establishes a framework for measuring fair value in GAAP and expands disclosure requirements about fair value measurements. This standard defines fair value as the price received to transfer an asset or paid to transfer a liability in an orderly transaction between market participants at the measurement date. ASC Topic 820 establishes a framework for measuring fair value by creating a hierarchy of valuation inputs used to measure fair value, and although it does not require additional fair value measurements, it applies to other accounting pronouncements that require or permit fair value measurements.
The hierarchy prioritizes the inputs into three broad levels:
Level 1 inputs — unadjusted quoted prices in active markets for identical assets or liabilities that the Company has the ability to access. An active market for the asset or liability is one in which transactions for the asset or liability occur with sufficient frequency and volume to provide ongoing pricing information.
Level 2 inputs — inputs other than quoted market prices included in Level 1 that are observable, either directly or indirectly, for the asset or liability. Level 2 inputs include, but are not limited to, quoted prices for similar assets or liabilities in an active market, quoted prices for identical or similar assets or liabilities in markets that are not active and inputs other than quoted market prices that are observable for the asset or liability, such as interest rate curves and yield curves observable at commonly quoted intervals, volatilities, credit risk and default rates.
Level 3 inputs — unobservable inputs for the asset or liability.
58
Table of Contents
Financial Assets & Liabilities Measured at Fair Value on a Recurring Basis
The Company’s assets and liabilities measured at fair value on a recurring basis were as follows:
| August 27, 2016 | ||||||||||||||||
| (in thousands) |
Level 1 | Level 2 | Level 3 | Fair Value | ||||||||||||
| Other current assets |
$ | 7,326 | $ | — | $ | — | $ | 7,326 | ||||||||
| Other long-term assets |
65,350 | 25,675 | — | 91,025 | ||||||||||||
|
|
|
|
|
|
|
|
|
|||||||||
| $ | 72,676 | $ | 25,675 | $ | — | $ | 98,351 | |||||||||
|
|
|
|
|
|
|
|
|
|||||||||
| August 29, 2015 | ||||||||||||||||
| (in thousands) |
Level 1 | Level 2 | Level 3 | Fair Value | ||||||||||||
| Other current assets |
$ | 8,790 | $ | — | $ | — | $ | 8,790 | ||||||||
| Other long-term assets |
63,342 | 16,295 | — | 79,637 | ||||||||||||
|
|
|
|
|
|
|
|
|
|||||||||
| $ | 72,132 | $ | 16,295 | $ | — | $ | 88,427 | |||||||||
|
|
|
|
|
|
|
|
|
|||||||||
At August 27, 2016, the fair value measurement amounts for assets and liabilities recorded in the accompanying Consolidated Balance Sheet consisted of short-term marketable securities of $7.3 million, which are included within Other current assets and long-term marketable securities of $91.0 million, which are included in Other long-term assets. The Company’s marketable securities are typically valued at the closing price in the principal active market as of the last business day of the quarter or through the use of other market inputs relating to the securities, including benchmark yields and reported trades.
A discussion on how the Company’s cash flow hedges are valued is included in “Note H – Derivative Financial Instruments,” while the fair value of the Company’s pension plan assets are disclosed in “Note L – Pension and Savings Plans.”
Non-Financial Assets Measured at Fair Value on a Non-Recurring Basis
Non-financial assets are required to be measured at fair value on a non-recurring basis in certain circumstances, including the event of impairment. The assets could include assets acquired in an acquisition as well as property, plant and equipment that are determined to be impaired. During fiscal 2016 and fiscal 2015, the Company did not have any significant non-financial assets measured at fair value on a non-recurring basis in periods subsequent to initial recognition.
Financial Instruments not Recognized at Fair Value
The Company has financial instruments, including cash and cash equivalents, accounts receivable, other current assets and accounts payable. The carrying amounts of these financial instruments approximate fair value because of their short maturities. The fair value of the Company’s debt is disclosed in “Note I – Financing.”
Note F – Marketable Securities
The Company’s basis for determining the cost of a security sold is the “Specific Identification Model.” Unrealized gains (losses) on marketable securities are recorded in Accumulated other comprehensive loss. The Company’s available-for-sale marketable securities consisted of the following:
| August 27, 2016 | ||||||||||||||||
| (in thousands) |
Amortized Cost Basis |
Gross Unrealized Gains |
Gross Unrealized Losses |
Fair Value | ||||||||||||
| Corporate securities |
$ | 37,789 | $ | 198 | $ | (6 | ) | $ | 37,981 | |||||||
| Government bonds |
33,497 | 24 | (35 | ) | 33,486 | |||||||||||
| Mortgage-backed securities |
6,865 | 18 | (29 | ) | 6,854 | |||||||||||
| Asset-backed securities and other |
20,015 | 26 | (11 | ) | 20,030 | |||||||||||
|
|
|
|
|
|
|
|
|
|||||||||
| $ | 98,166 | $ | 266 | $ | (81 | ) | $ | 98,351 | ||||||||
|
|
|
|
|
|
|
|
|
|||||||||
59
Table of Contents
| August 29, 2015 | ||||||||||||||||
| (in thousands) |
Amortized Cost Basis |
Gross Unrealized Gains |
Gross Unrealized Losses |
Fair Value |
||||||||||||
| Corporate securities |
$ | 34,859 | $ | 51 | $ | (40 | ) | $ | 34,870 | |||||||
| Government bonds |
33,098 | 31 | (7 | ) | 33,122 | |||||||||||
| Mortgage-backed securities |
9,287 | 17 | (99 | ) | 9,205 | |||||||||||
| Asset-backed securities and other |
11,223 | 9 | (2 | ) | 11,230 | |||||||||||
|
|
|
|
|
|
|
|
|
|||||||||
| $ | 88,467 | $ | 108 | $ | (148 | ) | $ | 88,427 | ||||||||
|
|
|
|
|
|
|
|
|
|||||||||
The debt securities held at August 27, 2016, had effective maturities ranging from less than one year to approximately three years. The Company did not realize any material gains or losses on its sale of marketable securities during fiscal 2016, fiscal 2015 or fiscal 2014.
The Company holds 49 securities that are in an unrealized loss position of approximately $81 thousand at August 27, 2016. The Company has the intent and ability to hold these investments until recovery of fair value or maturity, and does not deem the investments to be impaired on an other than temporary basis. In evaluating whether the securities are deemed to be impaired on an other than temporary basis, the Company considers factors such as the duration and severity of the loss position, the credit worthiness of the investee, the term to maturity and its intent and ability to hold the investments until maturity or until recovery of fair value.
Included above in total marketable securities are $61.8 million and $45.6 million of marketable securities transferred by the Company’s insurance captive to a trust account to secure its obligations to an insurance company related to future workers’ compensation and casualty losses as of August 27, 2016 and August 29, 2015, respectively.
Note G – Accumulated Other Comprehensive Loss
Accumulated other comprehensive loss includes certain adjustments to pension liabilities, foreign currency translation adjustments, certain activity for interest rate swaps and treasury rate locks that qualify as cash flow hedges and unrealized gains (losses) on available-for-sale securities. Changes in Accumulated other comprehensive loss consisted of the following:
| (in thousands) |
Pension Liability |
Foreign Currency(3) |
Net Unrealized Gain on Securities |
Derivatives | Total | |||||||||||||||
| Balance at August 30, 2014 |
$ | (63,820 | ) | $ | (57,836 | ) | $ | 76 | $ | (7,323 | ) | $ | (128,903 | ) | ||||||
| Other comprehensive (loss) before reclassifications |
(12,345 | ) | (113,652 | ) | (80 | ) | — | (126,077 | ) | |||||||||||
| Amounts reclassified from Accumulated other comprehensive loss(1) |
5,370 | (2) | — | (22 | )(4) | 114 | (5) | 5,462 | ||||||||||||
|
|
|
|
|
|
|
|
|
|
|
|||||||||||
| Balance at August 29, 2015 |
(70,795 | ) | (171,488 | ) | (26 | ) | (7,209 | ) | (249,518 | ) | ||||||||||
| Other comprehensive (loss) income before reclassifications |
(24,542 | ) | (39,524 | ) | 206 | (2,687 | ) | (66,547 | ) | |||||||||||
| Amounts reclassified from Accumulated other comprehensive loss(1) |
6,447 | (2) | — | (60 | )(4) | 2,149 | (5) | 8,536 | ||||||||||||
|
|
|
|
|
|
|
|
|
|
|
|||||||||||
| Balance at August 27, 2016 |
$ | (88,890 | ) | $ | (211,012 | ) | $ | 120 | $ | (7,747 | ) | $ | (307,529 | ) | ||||||
|
|
|
|
|
|
|
|
|
|
|
|||||||||||
| (1) | Amounts in parentheses indicate debits to Accumulated other comprehensive loss. |
| (2) | Represents amortization of pension liability adjustments, net of taxes of $4,059 in fiscal 2016 and $3,571 in fiscal 2015, which is recorded in Operating, selling, general and administrative expenses on the Consolidated Statements of Income. See “Note L – Pension and Savings Plans” for further discussion. |
| (3) | Foreign currency is not shown net of additional U.S. tax as earnings of non-U.S. subsidiaries are intended to be permanently reinvested. |
| (4) | Represents realized losses on marketable securities, net of taxes of $33 in fiscal 2016 and $12 in fiscal 2015, which is recorded in Operating, selling, general and administrative expenses on the Consolidated Statements of Income. See “Note F – Marketable Securities” for further discussion. |
| (5) | Represents gains and losses on derivatives, net of taxes of $315 in fiscal 2016 and $68 in fiscal 2015, which is recorded in Interest expense, net, on the Consolidated Statements of Income. See “Note H – Derivative Financial Instruments” for further discussion. |
60
Table of Contents
The 2016 pension actuarial loss of $24.5 million and the 2015 pension actuarial loss of $12.3 million include amounts not yet reflected in periodic pension costs primarily driven by changes in the discount rate.
Note H – Derivative Financial Instruments
The Company periodically uses derivatives to hedge exposures to interest rates. The Company does not hold or issue financial instruments for trading purposes. For transactions that meet the hedge accounting criteria, the Company formally designates and documents the instrument as a hedge at inception and quarterly thereafter assesses the hedges to ensure they are effective in offsetting changes in the cash flows of the underlying exposures. Derivatives are recorded in the Company’s Consolidated Balance Sheet at fair value, determined using available market information or other appropriate valuation methodologies. In accordance with ASC Topic 815, Derivatives and Hedging, the effective portion of a financial instrument’s change in fair value is recorded in Accumulated other comprehensive loss for derivatives that qualify as cash flow hedges and any ineffective portion of an instrument’s change in fair value is recognized in earnings.
At August 27, 2016, the Company had $12.3 million recorded in Accumulated other comprehensive loss related to net realized losses associated with terminated interest rate swap and treasury rate lock derivatives which were designated as hedging instruments. Net losses are amortized into Interest expense over the remaining life of the associated debt. During the fiscal year ended August 27, 2016, the Company reclassified $1.8 million of net losses from Accumulated other comprehensive loss to Interest expense. In the fiscal year ended August 29, 2015, the Company reclassified $182 thousand of net losses from Accumulated other comprehensive loss to Interest expense. The Company expects to reclassify $2.2 million of net losses from Accumulated other comprehensive loss to Interest expense over the next 12 months.
61
Table of Contents
Note I – Financing
The Company’s debt consisted of the following:
| (in thousands) |
August 27, 2016 |
August 29, 2015 |
||||||
| 5.500% Senior Notes due November 2015, effective interest rate of 4.86% |
$ | — | $ | 300,000 | ||||
| 6.950% Senior Notes due June 2016, effective interest rate of 7.09% |
— | 200,000 | ||||||
| 1.300% Senior Notes due January 2017, effective interest rate of 1.43% |
400,000 | 400,000 | ||||||
| 7.125% Senior Notes due August 2018, effective interest rate of 7.28% |
250,000 | 250,000 | ||||||
| 1.625% Senior Notes due April 2019, effective interest rate of 1.77% |
250,000 | — | ||||||
| 4.000% Senior Notes due November 2020, effective interest rate of 4.43% |
500,000 | 500,000 | ||||||
| 2.500% Senior Notes due April 2021, effective interest rate of 2.62% |
250,000 | 250,000 | ||||||
| 3.700% Senior Notes due April 2022, effective interest rate of 3.85% |
500,000 | 500,000 | ||||||
| 2.875% Senior Notes due January 2023, effective interest rate of 3.21% |
300,000 | 300,000 | ||||||
| 3.125% Senior Notes due July 2023, effective interest rate of 3.26% |
500,000 | 500,000 | ||||||
| 3.250% Senior Notes due April 2025, effective interest rate 3.36% |
400,000 | 400,000 | ||||||
| 3.125% Senior Notes due April 2026, effective interest rate of 3.28% |
400,000 | — | ||||||
| Commercial paper, weighted average interest rate of 0.72% and 0.45% at August 27, 2016 and August 29, 2015, respectively |
1,197,500 | 1,047,600 | ||||||
|
|
|
|
|
|||||
| Total debt before discounts and debt issuance costs |
4,947,500 | 4,647,600 | ||||||
| Less: Discounts and debt issuance costs |
23,381 | 22,724 | ||||||
|
|
|
|
|
|||||
| Long-term debt |
$ | 4,924,119 | $ | 4,624,876 | ||||
|
|
|
|
|
|||||
As of August 27, 2016, $1.198 billion of commercial paper borrowings and the $400 million 1.300% Senior Notes due January 2017 are classified as long-term in the accompanying Consolidated Balance Sheets as the Company has the ability and intent to refinance on a long-term basis through available capacity in its revolving credit facilities. As of August 27, 2016, the Company had $1.708 billion of availability under its $1.75 billion revolving credit facilities, which would allow it to replace these short-term obligations with long-term financing facilities.
On December 19, 2014, the Company amended and restated its existing revolving credit facility (the “Multi-Year Credit Agreement”) by increasing the amount of capital leases allowable to $225 million, extending the expiration date by two years and renegotiating other terms and conditions. This credit facility is available to primarily support commercial paper borrowings, letters of credit and other short-term unsecured bank loans. The capacity of the credit facility is $1.25 billion and may be increased to $1.5 billion prior to the maturity date at the Company’s election and subject to bank credit capacity and approval, may include up to $200 million in letters of credit and may include up to $225 million in capital leases each fiscal year. Under the revolving credit facility, the Company may borrow funds consisting of Eurodollar loans or base rate loans. Interest accrues on Eurodollar loans at a defined Eurodollar rate, defined as LIBOR plus the applicable percentage, as defined in the revolving credit facility, depending upon the Company’s senior, unsecured, (non-credit enhanced) long-term debt rating. Interest accrues on base rate loans as defined in the credit facility. The Company also has the option to borrow funds under the terms of a swingline loan subfacility. The revolving credit facility expires in December 2019.
On December 19, 2014, the Company entered into a new revolving credit facility (the “364-Day Credit Agreement”). The credit facility is available to primarily support commercial paper borrowings and other short-term unsecured bank loans. The 364-Day Credit Agreement provides for loans in the principal amount of up to $500 million. Under the credit facility, the Company may borrow funds consisting of Eurodollar loans, base rate loans or a combination of both. Interest accrues on Eurodollar loans at a defined Eurodollar rate, defined as LIBOR plus the applicable margin, as defined in the revolving credit facility, depending upon the Company’s senior, unsecured, (non-credit enhanced) long-term debt rating. Interest accrues on base rate loans as defined in the credit facility. The original expiration date of the credit facility was December 19, 2015, but in accordance with the credit agreement, in November 2015, the Company requested, and the banks approved, the extension of the termination date to December 16, 2016. In addition, at least 15 days prior to December 16, 2016, the Company has the right to convert the credit facility to a term loan for up to one year from the termination date, subject to a 1% penalty.
62
Table of Contents
The revolving credit facility agreements require that the Company’s consolidated interest coverage ratio as of the last day of each quarter shall be no less than 2.5:1. This ratio is defined as the ratio of (i) consolidated earnings before interest, taxes and rents to (ii) consolidated interest expense plus consolidated rents. The Company’s consolidated interest coverage ratio as of August 27, 2016 was 5.5:1.
As of August 27, 2016, the Company had no outstanding borrowings under either of the revolving credit facilities and $3.3 million of outstanding letters of credit under the Multi-Year Credit Agreement.
The Company also maintains a letter of credit facility that allows it to request the participating bank to issue letters of credit on its behalf up to an aggregate amount of $100 million. The letter of credit facility is in addition to the letters of credit that may be issued under the Multi-Year Credit Agreement. In fiscal 2016, the Company amended its existing letter of credit facility to decrease the amount that can be requested in letters of credit from $100 million to $75 million effective June 2016. This amendment also extended the maturity date from June 2016 to June 2019. As of August 27, 2016, the Company had $74.9 million in letters of credit outstanding under the letter of credit facility.
In addition to the outstanding letters of credit issued under the committed facilities discussed above, the Company had $27.9 million in letters of credit outstanding as of August 27, 2016. These letters of credit have various maturity dates and were issued on an uncommitted basis.
On April 21, 2016, the Company issued $400 million in 3.125% Senior Notes due April 2026 and $250 million in 1.625% Senior Notes due April 2019 under its shelf registration statement filed with the SEC on April 15, 2015 (the “2015 Shelf Registration”). The 2015 Shelf Registration allows the Company to sell an indeterminate amount in debt securities to fund general corporate purposes, including repaying, redeeming or repurchasing outstanding debt and for working capital, capital expenditures, new location openings, stock repurchases and acquisitions. Proceeds from the debt issuances were used for general corporate purposes.
On April 29, 2015, the Company issued $400 million in 3.250% Senior Notes due April 2025 and $250 million in 2.500% Senior Notes due April 2021 under its 2015 Shelf Registration. Proceeds from the debt issuances were used to repay a portion of the Company’s outstanding commercial paper borrowings, which were used to repay the $500 million in 5.750% Senior Notes due in January 2015, and for general corporate purposes.
On January 14, 2014, the Company issued $400 million in 1.300% Senior Notes due January 2017 under its shelf registration statement filed with the SEC on April 17, 2012. Proceeds from the debt issuance on January 14, 2014, were used to repay a portion of the Company’s $500 million in 6.500% Senior Notes due January 2014. The Company used commercial paper borrowings to repay the remainder of the 6.500% Senior Notes.
The 5.750% Senior Notes issued in July 2009 and 7.125% Senior Notes issued during August 2008 (collectively, the “Notes”) are subject to an interest rate adjustment if the debt ratings assigned to the Notes are downgraded. Further, all senior notes contain a provision that repayment of the notes may be accelerated if we experience a change in control (as defined in the agreements). Our borrowings under our senior notes contain minimal covenants, primarily restrictions on liens. Under our revolving credit facilities, covenants include limitations on total indebtedness, restrictions on liens, a minimum fixed charge coverage ratio and a change of control provision that may require acceleration of the repayment obligations under certain circumstances. All of the repayment obligations under our borrowing arrangements may be accelerated and come due prior to the scheduled payment date if covenants are breached or an event of default occurs.
63
Table of Contents
As of August 27, 2016, the Company was in compliance with all covenants related to its borrowing arrangements. All of the Company’s debt is unsecured. Scheduled maturities of debt are as follows:
| (in thousands) |
Scheduled Maturities |
|||
| 2017 |
$ | 1,597,500 | ||
| 2018 |
250,000 | |||
| 2019 |
250,000 | |||
| 2020 |
— | |||
| 2021 |
750,000 | |||
| Thereafter |
2,100,000 | |||
|
|
|
|||
| Subtotal |
4,947,500 | |||
| Discount and debt issuance costs |
23,381 | |||
|
|
|
|||
| Total Debt |
$ | 4,924,119 | ||
|
|
|
|||
The fair value of the Company’s debt was estimated at $5.117 billion as of August 27, 2016, and $4.696 billion as of August 29, 2015, based on the quoted market prices for the same or similar issues or on the current rates available to the Company for debt of the same terms (Level 2). Such fair value is greater than the carrying value of debt by $192.7 million at August 27, 2016 and $70.7 million at August 29, 2015, which reflect their face amount, adjusted for any unamortized debt issuance costs and discounts.
Note J – Interest Expense
Net interest expense consisted of the following:
| Year Ended | ||||||||||||
| (in thousands) |
August 27, 2016 |
August 29, 2015 |
August 30, 2014 |
|||||||||
| Interest expense |
$ | 150,961 | $ | 153,007 | $ | 170,400 | ||||||
| Interest income |
(2,371 | ) | (1,605 | ) | (1,850 | ) | ||||||
| Capitalized interest |
(909 | ) | (963 | ) | (1,041 | ) | ||||||
|
|
|
|
|
|
|
|||||||
| $ | 147,681 | $ | 150,439 | $ | 167,509 | |||||||
|
|
|
|
|
|
|
|||||||
Note K – Stock Repurchase Program
During 1998, the Company announced a program permitting the Company to repurchase a portion of its outstanding shares not to exceed a dollar maximum established by the Board. The program was amended on March 22, 2016 to increase the repurchase authorization to $17.15 billion from $16.4 billion. From January 1998 to August 27, 2016, the Company has repurchased a total of 140.8 million shares at an aggregate cost of $16.755 billion.
The Company’s share repurchase activity consisted of the following:
| Year Ended | ||||||||||||
| (in thousands) |
August 27, 2016 |
August 29, 2015 |
August 30, 2014 |
|||||||||
| Amount |
$ | 1,452,462 | $ | 1,271,416 | $ | 1,099,212 | ||||||
| Shares |
1,903 | 2,010 | 2,232 | |||||||||
During fiscal year 2016, the Company retired 2.1 million shares of treasury stock, which had previously been repurchased under the Company’s share repurchase program. The retirement increased Retained deficit by $1.424 billion and decreased Additional paid-in capital by $67.0 million. During the comparable prior year period, the Company retired 2.1 million shares of treasury stock, which increased Retained deficit by $1.050 billion and decreased Additional paid-in capital by $57.4 million.
64
Table of Contents
On September 22, 2016, the Board voted to increase the authorization by $750 million. This brings the total value of shares authorized to $17.9 billion. Subsequent to August 27, 2016, the Company has repurchased 390,473 shares of common stock at an aggregate cost of $297.6 million. Considering the cumulative repurchases and the increase in authorization subsequent to August 27, 2016, the Company has $847.7 million remaining under the Board’s authorization to repurchase its common stock.
Note L – Pension and Savings Plans
Prior to January 1, 2003, substantially all full-time employees were covered by a defined benefit pension plan. The benefits under the plan were based on years of service and the employee’s highest consecutive five-year average compensation. On January 1, 2003, the plan was frozen. Accordingly, pension plan participants will earn no new benefits under the plan formula and no new participants will join the pension plan.
On January 1, 2003, the Company’s supplemental defined benefit pension plan for certain highly compensated employees was also frozen. Accordingly, plan participants will earn no new benefits under the plan formula and no new participants will join the pension plan.
The Company has recognized the unfunded status of the defined pension plans in its Consolidated Balance Sheets, which represents the difference between the fair value of pension plan assets and the projected benefit obligations of its defined benefit pension plans. The net unrecognized actuarial losses and unrecognized prior service costs are recorded in Accumulated other comprehensive loss. These amounts will be subsequently recognized as net periodic benefit cost pursuant to the Company’s historical accounting policy for amortizing such amounts. Further, actuarial gains and losses that arise in subsequent periods and are not recognized as net periodic benefit cost in the same periods will be recognized as a component of other comprehensive income. Those amounts will be subsequently recognized as a component of net periodic benefit cost on the same basis as the amounts previously recognized in Accumulated other comprehensive loss.
The Company’s investment strategy for pension plan assets is to utilize a diversified mix of domestic and international equity and fixed income portfolios to earn a long-term investment return that meets the Company’s pension plan obligations. The pension plan assets are invested primarily in listed securities, and the pension plans hold only a minimal investment in AutoZone common stock that is entirely at the discretion of third-party pension fund investment managers. The Company’s largest holding classes, fixed income bonds and U.S. equities, are invested with a fund manager that holds diversified portfolios. Accordingly, the Company does not have any significant concentrations of risk in particular securities, issuers, sectors, industries or geographic regions. Alternative investment strategies were fully liquidated during fiscal 2016. The Company’s investment managers are prohibited from using derivatives for speculative purposes and are not permitted to use derivatives to leverage a portfolio.
The following is a description of the valuation methodologies used for the Company’s investments measured at fair value:
U.S., international, emerging and high yield equities –These investments are commingled funds and are valued using the net asset values, which are determined by valuing investments at the closing price or last trade reported on the major market on which the individual securities are traded. These investments are subject to annual audits.
Alternative investments –This category represents a hedge fund of funds made up of various investments in limited partnerships, limited liability companies and corporations. The fair value of the hedge fund of funds is determined using valuations provided by third party administrators for each of the underlying funds.
Fixed income securities –The fair values of corporate, U.S. government securities and other fixed income securities are estimated by using bid evaluation pricing models or quoted prices of securities with similar characteristics.
65
Table of Contents
Cash and cash equivalents –These investments include cash equivalents valued using exchange rates provided by an industry pricing vendor and commingled funds valued using the net asset value. These investments also include cash.
The fair values of investments by level and asset category and the weighted-average asset allocations of the Company’s pension plans at the measurement date are presented in the following table:
| August 27, 2016 | ||||||||||||||||||||||||
| Fair Value |
Asset Allocation | Fair Value Hierarchy | ||||||||||||||||||||||
| (in thousands) |
Actual | Target | Level 1 | Level 2 | Level 3 | |||||||||||||||||||
| U.S. equities |
$ | 66,008 | 22.9 | % | 26.0 | % | $ | — | $ | 66,008 | $ | — | ||||||||||||
| International equities |
42,023 | 14.5 | 17.0 | — | 42,023 | — | ||||||||||||||||||
| Emerging equities |
22,848 | 7.9 | 8.5 | — | 22,848 | — | ||||||||||||||||||
| High yield securities |
21,445 | 7.4 | 8.5 | — | 21,445 | — | ||||||||||||||||||
| Alternative investments |
— | — | — | — | — | — | ||||||||||||||||||
| Fixed income securities |
99,336 | 34.3 | 40.0 | — | 99,336 | — | ||||||||||||||||||
| Cash and cash equivalents |
37,726 | 13.0 | — | — | 37,726 | — | ||||||||||||||||||
|
|
|
|
|
|
|
|
|
|
|
|
|
|||||||||||||
| $ | 289,386 | 100.0 | % | 100.0 | % | $ | — | $ | 289,386 | $ | — | |||||||||||||
|
|
|
|
|
|
|
|
|
|
|
|
|
|||||||||||||
| August 29, 2015 | ||||||||||||||||||||||||
| Fair Value |
Asset Allocation | Fair Value Hierarchy | ||||||||||||||||||||||
| (in thousands) |
Actual | Target | Level 1 | Level 2 | Level 3 | |||||||||||||||||||
| U.S. equities |
$ | 60,286 | 25.3 | % | 25.8 | % | $ | — | $ | 60,286 | $ | — | ||||||||||||
| International equities |
38,725 | 16.2 | 17.2 | — | 38,725 | — | ||||||||||||||||||
| Emerging equities |
16,393 | 6.9 | 8.5 | — | 16,393 | — | ||||||||||||||||||
| High yield securities |
19,310 | 8.1 | 8.5 | — | 19,310 | — | ||||||||||||||||||
| Alternative investments |
307 | 0.1 | — | — | — | 307 | ||||||||||||||||||
| Fixed income securities |
93,362 | 39.1 | 40.0 | — | 93,362 | — | ||||||||||||||||||
| Cash and cash equivalents |
10,372 | 4.3 | — | — | 10,372 | — | ||||||||||||||||||
|
|
|
|
|
|
|
|
|
|
|
|
|
|||||||||||||
| $ | 238,755 | 100.0 | % | 100.0 | % | $ | — | $ | 238,448 | $ | 307 | |||||||||||||
|
|
|
|
|
|
|
|
|
|
|
|
|
|||||||||||||
The asset allocations in the charts above include $48.0 million and $11.5 million in cash contributions made in the last month prior to the balance sheet date of August 27, 2016, and August 29, 2015, respectively. Subsequent to August 27, 2016, and August 29, 2015, these cash contributions were allocated to the pension plan investments in accordance with the targeted asset allocation.
In August 2014, the Company’s Investment Committee approved a revised asset allocation target for the investments held by the pension plan. Based on the revised asset allocation target, the expected long-term rate of return on plan assets changed from 7.5% for the year ended August 30, 2014, to 7.0% for the years ending August 29, 2015 and August 27, 2016.
During fiscal 2016, the Company fully liquidated the Level 3 assets.
66
Table of Contents
The following table sets forth the plans’ funded status and amounts recognized in the Company’s Consolidated Balance Sheets:
| (in thousands) |
August 27, 2016 |
August 29, 2015 |
||||||
| Change in Projected Benefit Obligation: |
||||||||
| Projected benefit obligation at beginning of year |
$ | 296,123 | $ | 300,966 | ||||
| Interest cost |
11,272 | 12,338 | ||||||
| Actuarial (gains) losses |
39,842 | (1,056 | ) | |||||
| Benefits paid |
(18,726 | ) | (16,125 | ) | ||||
|
|
|
|
|
|||||
| Benefit obligations at end of year |
$ | 328,511 | $ | 296,123 | ||||
|
|
|
|
|
|||||
| Change in Plan Assets: |
||||||||
| Fair value of plan assets at beginning of year |
$ | 238,755 | $ | 243,407 | ||||
| Actual return on plan assets |
16,636 | (5,604 | ) | |||||
| Employer contributions |
52,721 | 17,077 | ||||||
| Benefits paid |
(18,726 | ) | (16,125 | ) | ||||
|
|
|
|
|
|||||
| Fair value of plan assets at end of year |
$ | 289,386 | $ | 238,755 | ||||
|
|
|
|
|
|||||
| Amount Recognized in the Statement of Financial Position: |
||||||||
| Current liabilities |
$ | (276 | ) | $ | (253 | ) | ||
| Long-term liabilities |
(38,849 | ) | (57,115 | ) | ||||
|
|
|
|
|
|||||
| Net amount recognized |
$ | (39,125 | ) | $ | (57,368 | ) | ||
|
|
|
|
|
|||||
| Amount Recognized in Accumulated Other Comprehensive Loss and not yet reflected in Net Periodic Benefit Cost: |
||||||||
| Net actuarial loss |
$ | (145,948 | ) | $ | (116,735 | ) | ||
|
|
|
|
|
|||||
| Accumulated other comprehensive loss |
$ | (145,948 | ) | $ | (116,735 | ) | ||
|
|
|
|
|
|||||
| Amount Recognized in Accumulated Other Comprehensive Loss and not yet reflected in Net Periodic Benefit Cost and expected to be amortized in next year’s Net Periodic Benefit Cost: |
||||||||
| Net actuarial loss |
$ | (13,874 | ) | $ | (10,506 | ) | ||
|
|
|
|
|
|||||
| Amount recognized |
$ | (13,874 | ) | $ | (10,506 | ) | ||
|
|
|
|
|
|||||
Net periodic benefit expense consisted of the following:
| Year Ended | ||||||||||||
| (in thousands) |
August 27, 2016 |
August 29, 2015 |
August 30, 2014 |
|||||||||
| Interest cost |
$ | 11,272 | $ | 12,338 | $ | 13,070 | ||||||
| Expected return on plan assets |
(16,512 | ) | (16,281 | ) | (15,386 | ) | ||||||
| Recognized net actuarial losses |
10,506 | 8,941 | 6,879 | |||||||||
|
|
|
|
|
|
|
|||||||
| Net periodic benefit expense |
$ | 5,266 | $ | 4,998 | $ | 4,563 | ||||||
|
|
|
|
|
|
|
|||||||
The blended actuarial assumptions used in determining the projected benefit obligation include the following:
| Year Ended | ||||||||||||
| August 27, 2016 |
August 29, 2015 |
August 30, 2014 |
||||||||||
| Discount rate to determine benefit obligation |
3.72 | % | 4.50 | % | 4.28 | % | ||||||
| Discount rate to determine net interest cost |
3.90 | % | 4.28 | % | 5.19 | % | ||||||
| Expected long-term rate of return on plan assets |
7.00 | % | 7.00 | % | 7.50 | % | ||||||
67
Table of Contents
As the plan benefits are frozen, increases in future compensation levels no longer impact the calculation and there is no service cost.
The discount rate to determine the projected benefit obligation is determined as of the measurement date and is based on the calculated yield of a portfolio of high-grade corporate bonds with cash flows that generally match the Company’s expected benefit payments in future years.
During fiscal 2016, the Company changed the method used to estimate the interest cost component of net periodic benefit cost. Previously, the Company estimated interest cost using a single weighted-average discount rate derived from the yield curve used to measure the benefit obligation. The Company elected to utilize a spot rate approach by applying specific spot rates along the yield curve to calculate interest costs instead of a single weighted-average discount rate. This calculation is believed to be more refined under the applicable accounting standard. The impact of this change to net periodic benefit cost is a reduction of $1.8 million in fiscal 2016. The Company accounted for this change as a change in accounting estimate and accounted for it prospectively.
The expected long-term rate of return on plan assets is based on the historical relationships between the investment classes and the capital markets, updated for current conditions.
The Company makes annual contributions in amounts at least equal to the minimum funding requirements of the Employee Retirement Income Security Act of 1974. The Company contributed $52.7 million to the plans in fiscal 2016, $17.1 million to the plans in fiscal 2015 and $16.9 million to the plans in fiscal 2014. The Company expects to contribute approximately $17.8 million to the plans in fiscal 2017; however, a change to the expected cash funding may be impacted by a change in interest rates, a change in the actual or expected return on plan assets or through other plans initiated by management.
Based on current assumptions about future events, benefit payments are expected to be paid as follows for each of the following fiscal years. Actual benefit payments may vary significantly from the following estimates:
| (in thousands) |
Benefit Payments |
|||
| 2017 |
$ | 12,066 | ||
| 2018 |
11,803 | |||
| 2019 |
12,546 | |||
| 2020 |
13,273 | |||
| 2021 |
13,889 | |||
| 2022 – 2026 |
76,204 | |||
The Company has a 401(k) plan that covers all domestic employees who meet the plan’s participation requirements. The plan features include Company matching contributions, immediate 100% vesting of Company contributions and a savings option up to 25% of qualified earnings. The Company makes matching contributions, per pay period, up to a specified percentage of employees’ contributions as approved by the Board. The Company made matching contributions to employee accounts in connection with the 401(k) plan of $19.7 million in fiscal 2016, $17.7 million in fiscal 2015 and $15.6 million in fiscal 2014.
Note M – Acquisition
Effective September 27, 2014, the Company acquired the outstanding stock of Interamerican Motor Corporation (“IMC”), the second largest distributor of quality import replacement parts in the United States, for $75.7 million, net of cash. IMC specializes in parts coverage for European and Asian cars. With this acquisition, the Company continues to grow its share in the aftermarket import car parts market. The results of operations from IMC have been included in the Company’s Auto Parts Locations business activities since the date of acquisition. Pro forma results of operations related to the acquisition of IMC are not presented as IMC’s results are not material to the Company’s consolidated statements of income. The purchase price allocation resulted in goodwill of $24.1 million and intangible assets totaling $3.6 million. Goodwill generated from the acquisition is primarily attributable to expected synergies and the assembled workforce.
68
Table of Contents
Note N – Goodwill and Intangibles
The changes in the carrying amount of goodwill are as follows:
| (in thousands) |
Auto Parts Locations |
Other | Total | |||||||||
| Net balance as of August 30, 2014 |
$ | 302,645 | $ | 65,184 | $ | 367,829 | ||||||
| Goodwill added through acquisition(1) |
24,058 | — | 24,058 | |||||||||
| Goodwill adjustments |
— | — | — | |||||||||
|
|
|
|
|
|
|
|||||||
| Net balance as of August 29, 2015 |
326,703 | 65,184 | 391,887 | |||||||||
| Goodwill added through acquisition |
— | — | — | |||||||||
| Goodwill adjustments |
— | — | — | |||||||||
|
|
|
|
|
|
|
|||||||
| Net balance as of August 27, 2016 |
$ | 326,703 | $ | 65,184 | $ | 391,887 | ||||||
|
|
|
|
|
|
|
|||||||
| (1) | See “Note M – Acquisition” for discussion of the acquisition completed during the first quarter of fiscal 2015. |
The Company performs its annual goodwill and intangibles impairment test in the fourth quarter of each fiscal year. In the fourth quarter of fiscal 2016 and fiscal 2015, the Company concluded that its goodwill was not impaired. Total accumulated goodwill impairment for both August 27, 2016 and August 29, 2015 is $18.3 million.
The carrying amounts of intangible assets are included in Other long-term assets as follows:
| August 27, 2016 | ||||||||||||||||
| (in thousands) |
Estimated Useful Life |
Gross Carrying Amount |
Accumulated Amortization |
Net Carrying Amount |
||||||||||||
| Amortizing intangible assets: |
||||||||||||||||
| Technology |
3-5 years | $ | 10,570 | $ | (7,988 | ) | $ | 2,582 | ||||||||
| Noncompete agreements |
5 years | 1,300 | (963 | ) | 337 | |||||||||||
| Customer relationships |
3-10 years | 49,676 | (18,514 | ) | 31,162 | |||||||||||
|
|
|
|
|
|
|
|||||||||||
| $ | 61,546 | $ | (27,465 | ) | 34,081 | |||||||||||
|
|
|
|
|
|||||||||||||
| Non-amortizing intangible asset: |
||||||||||||||||
| Trade names |
|
26,900 | ||||||||||||||
|
|
|
|||||||||||||||
| Total intangible assets other than goodwill |
|
$ | 60,981 | |||||||||||||
|
|
|
|||||||||||||||
| August 29, 2015 | ||||||||||||||||
| (in thousands) |
Estimated Useful Life |
Gross Carrying Amount |
Accumulated Amortization |
Net Carrying Amount |
||||||||||||
| Amortizing intangible assets: |
||||||||||||||||
| Technology |
3-5 years | $ | 10,570 | $ | (5,757 | ) | $ | 4,813 | ||||||||
| Noncompete agreements |
5 years | 1,300 | (703 | ) | 597 | |||||||||||
| Customer relationships |
3-10 years | 49,676 | (12,256 | ) | 37,420 | |||||||||||
|
|
|
|
|
|
|
|||||||||||
| $ | 61,546 | $ | (18,716 | ) | 42,830 | |||||||||||
|
|
|
|
|
|||||||||||||
| Non-amortizing intangible asset: |
||||||||||||||||
| Trade names |
|
26,900 | ||||||||||||||
|
|
|
|||||||||||||||
| Total intangible assets other than goodwill |
|
$ | 69,730 | |||||||||||||
|
|
|
|||||||||||||||
During fiscal 2015, the Company recorded an increase to intangible assets of $3.6 million related to the acquisition of IMC.
69
Table of Contents
During fiscal 2014, the Company purchased $30.2 million of intangible assets relating to the rights to certain customer relationships and technology assets relating to its ALLDATA operations. Additionally, during fiscal 2016 and 2015, the Company made an installment payment of $10 million in each year related to certain customer relationships purchased during 2014 relating to its ALLDATA operations.
As part of its annual impairment test, the Company evaluates the AutoAnything and IMC trade names for impairment in the fourth quarter of each fiscal year. In the fourth quarter of fiscal 2016 and 2015, the Company concluded that AutoAnything’s and IMC’s trade names were not impaired. Trade names at August 27, 2016 and August 29, 2015 reflect a total accumulated impairment of $4.1 million.
Amortization expense of intangible assets for each of the years ended August 27, 2016 and August 29, 2015 was $8.7 million.
Total future amortization expense for intangible assets that have finite lives, based on the existing intangible assets and their current estimated useful lives as of August 27, 2016, is estimated as follows:
| (in thousands) |
Total | |||
| 2017 |
$ | 8,482 | ||
| 2018 |
6,855 | |||
| 2019 |
6,203 | |||
| 2020 |
6,203 | |||
| 2021 |
3,474 | |||
| Thereafter |
2,864 | |||
|
|
|
|||
| $ | 34,081 | |||
|
|
|
|||
Note O – Leases
The Company leases some of its retail stores, distribution centers, facilities, land and equipment, including vehicles. Other than vehicle leases, most of the leases are operating leases, which include renewal options made at the Company’s election and provisions for percentage rent based on sales. Rental expense was $280.5 million in fiscal 2016, $269.5 million in fiscal 2015 and $253.8 million in fiscal 2014. Percentage rentals were insignificant.
The Company records rent for all operating leases on a straight-line basis over the lease term, including any reasonably assured renewal periods and the period of time prior to the lease term that the Company is in possession of the leased space for the purpose of installing leasehold improvements. Differences between recorded rent expense and cash payments are recorded as a liability in Accrued expenses and other and Other long-term liabilities in the accompanying Consolidated Balance Sheets, based on the terms of the lease. The deferred rent approximated $121.7 million on August 27, 2016, and $113.7 million on August 29, 2015.
The Company has a fleet of vehicles used for delivery to its commercial customers and stores and travel for members of field management. The majority of these vehicles are held under capital lease. At August 27, 2016, the Company had capital lease assets of $148.5 million, net of accumulated amortization of $59.5 million, and capital lease obligations of $147.3 million, of which $44.8 million is classified as Accrued expenses and other as it represents the current portion of these obligations. At August 29, 2015, the Company had capital lease assets of $132.3 million, net of accumulated amortization of $63.7 million, and capital lease obligations of $128.2 million, of which $40.5 million is classified as Accrued expenses and other as it represents the current portion of these obligations.
70
Table of Contents
Future minimum annual rental commitments under non-cancelable operating leases and capital leases were as follows at the end of fiscal 2016:
| (in thousands) |
Operating Leases |
Capital Leases |
||||||
| 2017 |
$ | 274,341 | $ | 44,834 | ||||
| 2018 |
266,301 | 42,978 | ||||||
| 2019 |
248,263 | 34,360 | ||||||
| 2020 |
225,276 | 21,333 | ||||||
| 2021 |
201,207 | 8,446 | ||||||
| Thereafter |
890,869 | — | ||||||
|
|
|
|
|
|||||
| Total minimum payments required |
$ | 2,106,257 | 151,951 | |||||
|
|
|
|||||||
| Less: Interest |
(4,666 | ) | ||||||
|
|
|
|||||||
| Present value of minimum capital lease payments |
$ | 147,285 | ||||||
|
|
|
|||||||
In connection with the Company’s December 2001 sale of the TruckPro business, the Company subleased some properties to the purchaser for an initial term of not less than 20 years. The Company’s remaining aggregate rental obligation at August 27, 2016 of $10.6 million is included in the above table, but the obligation is offset by the sublease rental agreement.
Note P – Commitments and Contingencies
Construction commitments, primarily for new distribution centers and stores, totaled approximately $106.6 million at August 27, 2016.
The Company had $106.1 million in outstanding standby letters of credit and $33.4 million in surety bonds as of August 27, 2016, which all have expiration periods of less than one year. A substantial portion of the outstanding standby letters of credit (which are primarily renewed on an annual basis) and surety bonds are used to cover reimbursement obligations to our workers’ compensation carriers. There are no additional contingent liabilities associated with these instruments as the underlying liabilities are already reflected in the consolidated balance sheet. The standby letters of credit and surety bonds arrangements have automatic renewal clauses.
Note Q – Litigation
In July 2014, the Company received a subpoena from the District Attorney of the County of Alameda, along with other environmental prosecutorial offices in the state of California, seeking documents and information related to the handling, storage and disposal of hazardous waste. The Company received notice that the District Attorney will seek injunctive and monetary relief. The Company is cooperating fully with the request and cannot predict the ultimate outcome of these efforts, although the Company has accrued all amounts it believes to be probable and reasonably estimable. The Company does not believe the ultimate resolution of this matter will have a material adverse effect on its consolidated financial position, results of operations or cash flows.
In April 2016, the Company received a letter from the California Air Resources Board seeking payment for alleged violations of the California Health and Safety Code related to the sale of certain aftermarket emission parts in the State of California. The Company does not believe that any resolution of the matter will have a material adverse effect on its consolidated financial position, results of operations or cash flows.
The Company is involved in various other legal proceedings incidental to the conduct of its business, including several lawsuits containing class-action allegations in which the plaintiffs are current and former hourly and salaried employees who allege various wage and hour violations and unlawful termination practices. The Company does not currently believe that, either individually or in the aggregate, these matters will result in liabilities material to its consolidated financial condition, results of operations or cash flows.
71
Table of Contents
Note R – Segment Reporting
Four of the Company’s operating segments (Domestic Auto Parts, Mexico, Brazil and IMC) are aggregated as one reportable segment: Auto Parts Locations. The criteria the Company used to identify the reportable segment are primarily the nature of the products the Company sells and the operating results that are regularly reviewed by the Company’s chief operating decision maker to make decisions about the resources to be allocated to the business units and to assess performance. The accounting policies of the Company’s reportable segment are the same as those described in Note A.
The Auto Parts Locations segment is a retailer and distributor of automotive parts and accessories through the Company’s 5,814 locations in the United States, Puerto Rico, Mexico and Brazil. Each location carries an extensive product line for cars, sport utility vehicles, vans and light trucks, including new and remanufactured automotive hard parts, maintenance items, accessories and non-automotive products.
The Other category reflects business activities of three operating segments that are not separately reportable due to the materiality of these operating segments. The operating segments include ALLDATA, which produces, sells and maintains diagnostic and repair information software used in the automotive repair industry; E-commerce, which includes direct sales to customers through www.autozone.com; and AutoAnything, which includes direct sales to customers through www.autoanything.com.
The Company evaluates its reportable segment primarily on the basis of net sales and segment profit, which is defined as gross profit. The following table shows segment results for the following fiscal years:
| Year Ended | ||||||||||||
| (in thousands) |
August 27, 2016 |
August 29, 2015 |
August 30, 2014 |
|||||||||
| Net Sales: |
||||||||||||
| Auto Parts Locations |
$ | 10,261,112 | $ | 9,824,876 | $ | 9,132,169 | ||||||
| Other |
374,564 | 362,464 | 343,144 | |||||||||
|
|
|
|
|
|
|
|||||||
| Total |
$ | 10,635,676 | $ | 10,187,340 | $ | 9,475,313 | ||||||
|
|
|
|
|
|
|
|||||||
| Segment Profit: |
||||||||||||
| Auto Parts Locations |
$ | 5,410,477 | $ | 5,132,624 | $ | 4,744,501 | ||||||
| Other |
198,259 | 194,407 | 190,406 | |||||||||
|
|
|
|
|
|
|
|||||||
| Gross profit |
5,608,736 | 5,327,031 | 4,934,907 | |||||||||
| Operating, selling, general and administrative expenses |
(3,548,341 | ) | (3,373,980 | ) | (3,104,684 | ) | ||||||
| Interest expense, net |
(147,681 | ) | (150,439 | ) | (167,509 | ) | ||||||
|
|
|
|
|
|
|
|||||||
| Income before income taxes |
$ | 1,912,714 | $ | 1,802,612 | $ | 1,662,714 | ||||||
|
|
|
|
|
|
|
|||||||
| Segment Assets: |
||||||||||||
| Auto Parts Locations |
$ | 8,351,883 | $ | 7,883,720 | $ | 7,279,665 | ||||||
| Other |
247,904 | 218,629 | 217,498 | |||||||||
|
|
|
|
|
|
|
|||||||
| Total |
$ | 8,599,787 | $ | 8,102,349 | $ | 7,497,163 | ||||||
|
|
|
|
|
|
|
|||||||
| Capital Expenditures: |
||||||||||||
| Auto Parts Locations |
$ | 470,631 | $ | 464,246 | $ | 423,951 | ||||||
| Other |
18,160 | 16,333 | 14,165 | |||||||||
|
|
|
|
|
|
|
|||||||
| Total |
$ | 488,791 | $ | 480,579 | $ | 438,116 | ||||||
|
|
|
|
|
|
|
|||||||
| Auto Parts Locations Sales by Product Grouping: |
||||||||||||
| Failure |
$ | 4,913,423 | $ | 4,650,271 | $ | 4,274,528 | ||||||
| Maintenance items |
3,721,240 | 3,618,779 | 3,362,969 | |||||||||
| Discretionary |
1,626,449 | 1,555,826 | 1,494,672 | |||||||||
|
|
|
|
|
|
|
|||||||
| Auto Parts Locations net sales |
$ | 10,261,112 | $ | 9,824,876 | $ | 9,132,169 | ||||||
|
|
|
|
|
|
|
|||||||
72
Table of Contents
Note S – Quarterly Summary (1)
(Unaudited)
| Twelve Weeks Ended | Sixteen Weeks Ended |
|||||||||||||||
| (in thousands, except per share data) |
November 21, 2015 |
February 13, 2016 |
May 7, 2016 |
August 27, 2016(2) |
||||||||||||
| Net sales |
$ | 2,386,043 | $ | 2,257,192 | $ | 2,593,672 | $ | 3,398,769 | ||||||||
| Gross profit |
1,252,934 | 1,190,596 | 1,370,458 | 1,794,748 | ||||||||||||
| Operating profit |
437,995 | 382,660 | 536,374 | 703,366 | ||||||||||||
| Income before income taxes |
402,985 | 349,828 | 502,323 | 657,577 | ||||||||||||
| Net income |
258,112 | 228,613 | 327,515 | 426,768 | ||||||||||||
| Basic earnings per share |
8.46 | 7.58 | 10.99 | 14.58 | ||||||||||||
| Diluted earnings per share |
8.29 | 7.43 | 10.77 | 14.30 | ||||||||||||
| Twelve Weeks Ended | Sixteen Weeks Ended |
|||||||||||||||
| (in thousands, except per share data) |
November 22, 2014 |
February 14, 2015 |
May 9, 2015 |
August 29, 2015(2) |
||||||||||||
| Net sales |
$ | 2,260,264 | $ | 2,143,651 | $ | 2,493,021 | $ | 3,290,404 | ||||||||
| Gross profit |
1,176,661 | 1,120,033 | 1,302,789 | 1,727,548 | ||||||||||||
| Operating profit |
408,562 | 361,269 | 513,949 | 669,272 | ||||||||||||
| Income before income taxes |
371,502 | 326,733 | 482,170 | 622,207 | ||||||||||||
| Net income |
238,310 | 211,723 | 309,071 | 401,137 | ||||||||||||
| Basic earnings per share |
7.42 | 6.64 | 9.77 | 13.02 | ||||||||||||
| Diluted earnings per share |
7.27 | 6.51 | 9.57 | 12.75 | ||||||||||||
| (1) | The sum of quarterly amounts may not equal the annual amounts reported due to rounding. In addition, the earnings per share amounts are computed independently for each quarter while the full year is based on the annual weighted average shares outstanding. |
| (2) | The fourth quarter for fiscal 2016 and fiscal 2015 are based on a 16-week period. All other quarters presented are based on a 12-week period. |
Item 9. Changes In and Disagreements with Accountants on Accounting and Financial Disclosure
Not applicable.
Item 9A. Controls and Procedures
As of August 27, 2016, an evaluation was performed under the supervision and with the participation of AutoZone’s management, including the Chief Executive Officer and the Chief Financial Officer, of the effectiveness of the design and operation of our disclosure controls and procedures, as defined in Rules 13a-15(e) and 15d-15(e) under the Exchange Act, as amended. Based on that evaluation, our management, including the Chief Executive Officer and the Chief Financial Officer, concluded that our disclosure controls and procedures were effective. During or subsequent to the quarter ended August 27, 2016, there were no changes in our internal controls that have materially affected, or are reasonably likely to materially affect, internal controls over financial reporting.
Not applicable.
73
Table of Contents
Item 10. Directors, Executive Officers and Corporate Governance
The information set forth in Part I of this document in the section entitled “Executive Officers of the Registrant,” is incorporated herein by reference in response to this item. Additionally, the information contained in AutoZone, Inc.’s Proxy Statement dated October 24, 2016, in the sections entitled “Proposal 1 – Election of Directors” and “Section 16(a) Beneficial Ownership Reporting Compliance,” is incorporated herein by reference in response to this item.
The Company has adopted a Code of Ethical Conduct for Financial Executives that applies to its chief executive officer, chief financial officer, chief accounting officer and other financial executives. The Company has filed a copy of this Code of Ethical Conduct as Exhibit 14.1 to this Form 10-K. The Company has also made the Code of Ethical Conduct available on its investor relations website at http://www.autozoneinc.com.
Item 11. Executive Compensation
The information contained in AutoZone, Inc.’s Proxy Statement dated October 24, 2016, in the section entitled “Executive Compensation,” is incorporated herein by reference in response to this item.
Item 12. Security Ownership of Certain Beneficial Owners and Management and Related Stockholder Matters
The information contained in AutoZone, Inc.’s Proxy Statement dated October 24, 2016, in the sections entitled “Security Ownership of Management and Board of Directors” and “Security Ownership of Certain Beneficial Owners,” is incorporated herein by reference in response to this item.
Item 13. Certain Relationships and Related Transactions, and Director Independence
Not applicable.
Item 14. Principal Accounting Fees and Services
The information contained in AutoZone, Inc.’s Proxy Statement dated October 24, 2016, in the section entitled “Proposal 2 – Ratification of Independent Registered Public Accounting Firm,” is incorporated herein by reference in response to this item.
74
Table of Contents
Item 15. Exhibits, Financial Statement Schedules
The following information required under this item is filed as part of this report:
| (a) | Financial Statements |
The following financial statements, related notes and reports of independent registered public accounting firm are filed with this Annual Report on Form 10-K in Part II, Item 8:
| Reports of Independent Registered Public Accounting Firm |
| Consolidated Statements of Income for the fiscal years ended August 27, 2016, August 29, 2015, and August 30, 2014 |
| Consolidated Statements of Comprehensive Income for the fiscal years ended August 27, 2016, August 29, 2015, and August 30, 2014 |
| Consolidated Balance Sheets as of August 27, 2016, and August 29, 2015 |
| Consolidated Statements of Cash Flows for the fiscal years ended August 27, 2016, August 29, 2015, and August 30, 2014 |
| Consolidated Statements of Stockholders’ Deficit for the fiscal years ended August 27, 2016, August 29, 2015, and August 30, 2014 |
| Notes to Consolidated Financial Statements |
| (b) | Exhibits |
The Exhibit Index following this document’s signature pages is incorporated herein by reference in response to this item.
| (c) | Financial Statement Schedules |
Schedules are omitted because the information is not required or because the information required is included in the financial statements or notes thereto.
75
Table of Contents
SIGNATURES
Pursuant to the requirements of Section 13 or 15(d) of the Securities Exchange Act of 1934, the Registrant has duly caused this report to be signed on its behalf by the undersigned, thereunto duly authorized.
| AUTOZONE, INC. | ||||||
| By: | /s/ WILLIAM C. RHODES, III | |||||
| William C. Rhodes, III | ||||||
| Chairman, President and | ||||||
| Chief Executive Officer | ||||||
| (Principal Executive Officer) | ||||||
Dated: October 24, 2016
76
Table of Contents
Pursuant to the requirements of the Securities Exchange Act of 1934, this report has been signed below by the following persons on behalf of the Registrant and in the capacities and on the dates indicated:
| SIGNATURE |
TITLE |
DATE | ||
| /s/ WILLIAM C. RHODES, III William C. Rhodes, III |
Chairman, President and Chief Executive Officer (Principal Executive Officer) |
October 24, 2016 | ||
| /s/ WILLIAM T. GILES William T. Giles |
Chief Financial Officer and Executive Vice President – Finance, Information Technology and ALLDATA (Principal Financial Officer) |
October 24, 2016 | ||
| /s/ CHARLIE PLEAS, III Charlie Pleas, III |
Senior Vice President and Controller (Principal Accounting Officer) |
October 24, 2016 | ||
| /s/ DOUGLAS H. BROOKS Douglas H. Brooks |
Director |
October 24, 2016 | ||
| /s/ LINDA A. GOODSPEED Linda A. Goodspeed |
Director |
October 24, 2016 | ||
| /s/ SUE E. GOVE Sue E. Gove |
Director |
October 24, 2016 | ||
| /s/ EARL G. GRAVES, JR. Earl G. Graves, Jr. |
Director |
October 24, 2016 | ||
| /s/ ENDERSON GUIMARAES Enderson Guimaraes |
Director |
October 24, 2016 | ||
| /s/ J.R. HYDE, III J.R. Hyde, III |
Director |
October 24, 2016 | ||
| /s/ D. BRYAN JORDAN D. Bryan Jordan |
Director |
October 24, 2016 | ||
| /s/ W. ANDREW MCKENNA W. Andrew McKenna |
Director |
October 24, 2016 | ||
| /s/ GEORGE R. MRKONIC, JR. George R. Mrkonic, Jr. |
Director |
October 24, 2016 | ||
| /s/ LUIS P. NIETO Luis P. Nieto |
Director |
October 24, 2016 | ||
77
Table of Contents
EXHIBIT INDEX
The following exhibits are filed as part of this Annual Report on Form 10-K:
| 3.1 | Restated Articles of Incorporation of AutoZone, Inc. Incorporated by reference to Exhibit 3.1 to the Quarterly Report on Form 10-Q for the quarter ended February 13, 1999. | |
| 3.2 | Sixth Amended and Restated By-laws of AutoZone, Inc. Incorporated by reference to Exhibit 3.1 to the Current Report on Form 8-K dated October 7, 2015. | |
| 4.1 | Indenture dated as of August 8, 2003, between AutoZone, Inc. and Bank One Trust Company, N.A. Incorporated by reference to Exhibit 4.1 to the Registration Statement on Form S-3 (No. 333-107828) filed August 11, 2003. | |
| 4.2 | Officers’ Certificate dated August 4, 2008, pursuant to Section 3.2 of the Indenture dated August 11, 2003, setting forth the terms of the 7.125% Senior Notes due 2018. Incorporated by reference to Exhibit 4.2 to the Current Report on Form 8-K dated August 4, 2008. | |
| 4.3 | Form of 7.125% Senior Note due 2018. Incorporated by reference from the Form 8-K dated August 4, 2008. | |
| 4.4 | Officers’ Certificate dated November 15, 2010, pursuant to Section 3.2 of the Indenture dated August 8, 2003, setting forth the terms of the 4.000% Notes due 2020. Incorporated by reference to 4.1 to the Current Report on Form 8-K dated November 15, 2010. | |
| 4.5 | Form of 4.000% Senior Note due 2020. Incorporated by reference from the Form 8-K dated November 15, 2010. | |
| 4.6 | Officers’ Certificate dated April 24, 2012, pursuant to section 3.2 of the indenture dated August 8, 2003, setting forth the terms of the 3.700% Senior Notes due 2022. Incorporated by reference to Exhibit 4.1 to the Current Report on Form 8-K dated April 24, 2012. | |
| 4.7 | Form of 3.700% Senior Notes due 2022. Incorporated by reference from the Form 8-K dated April 24, 2012. | |
| 4.8 | Officers’ Certificate dated November 13, 2012, pursuant to section 3.2 of the indenture dated August 8, 2003, setting forth the terms of the 2.875% Senior Notes due 2023. Incorporated by reference to Exhibit 4.1 to the Current Report on Form 8-K dated November 13, 2012. | |
| 4.9 | Form of 2.875% Senior Notes due 2023. Incorporated by reference from the Form 8-K dated November 13, 2012. | |
| 4.10 | Officers’ Certificate dated April 29, 2013, pursuant to section 3.2 of the indenture dated August 8, 2003, setting forth the terms of the 3.125% Senior Notes due 2023. Incorporated by reference to Exhibit 4.1 to the Current Report on Form 8-K dated April 29, 2013. | |
| 4.11 | Form of 3.125% Senior Notes due 2023. Incorporated by reference to Exhibit 4.1 to the Form 8-K dated April 29, 2013. | |
| 4.12 | Officer’s Certificate dated January 14, 2014, pursuant to Section 3.2 of the Indenture dated August 8, 2003, setting forth the terms of the 1.300% Senior Notes due 2017. Incorporated by reference to Exhibit 4.1 to the Current Report on Form 8-K dated January 14, 2014. | |
| 4.13 | Form of 1.300% Note due 2017. Incorporated by reference to Exhibit 4.2 to the Current Report on Form 8-K dated January 14, 2014. | |
| 4.14 | Officers’ Certificate dated April 29, 2015, pursuant to Section 3.2 of the Indenture dated August 8, 2003, setting forth the terms of the 2.500% Senior Notes due 2021. Incorporated by reference to Exhibit 4.1 to the Current Report on Form 8-K dated April 29, 2015. | |
78
Table of Contents
| 4.15 | Form of 2.500% Note due 2021. Incorporated by reference to Exhibit 4.3 to the Current Report on Form 8-K dated April 29, 2015. | |
| 4.16 | Officers’ Certificate dated April 29, 2015, pursuant to Section 3.2 of the Indenture dated August 8, 2003, setting forth the terms of the 3.250% Senior Notes due 2025. Incorporated by reference to Exhibit 4.2 to the Current Report on Form 8-K dated April 29, 2015. | |
| 4.17 | Form of 3.250% Note due 2025. Incorporated by reference to Exhibit 4.4 to the Current Report on Form 8-K dated April 29, 2015. | |
| 4.18 | Officers’ Certificate dated April 21, 2016, pursuant to Section 3.2 of the Indenture dated August 8, 2003, setting forth the terms of the 1.625% Senior Notes due 2019. Incorporated by reference to Exhibit 4.1 to the Current Report on Form 8-K dated April 21, 2016. | |
| 4.19 | Form of 1.625% Senior Notes due 2019. Incorporated by reference to Exhibit 4.3 to the Current Report on Form 8-K dated April 21, 2016. | |
| 4.20 | Officers’ Certificate dated April 21, 2016, pursuant to Section 3.2 of the Indenture dated August 8, 2003, setting forth the terms of the 3.125% Senior Notes due 2026. Incorporated by reference to Exhibit 4.2 to the Current Report on Form 8-K dated April 21, 2016. | |
| 4.21 | Form of 3.125% Senior Notes due 2026. Incorporated by reference to Exhibit 4.4 to the Current Report on Form 8-K dated April 21, 2016. | |
| *10.1 | Second Amended and Restated 1998 Director Compensation Plan. Incorporated by reference to Exhibit 10.2 to the Annual Report on Form 10-K for the fiscal year ended August 26, 2000. | |
| *10.2 | Third Amended and Restated 1996 Stock Option Plan. Incorporated by reference to Exhibit 10.3 to the Annual Report on Form 10-K for the fiscal year ended August 30, 2003. | |
| *10.3 | Form of Incentive Stock Option Agreement. Incorporated by reference to Exhibit 10.2 to the Quarterly Report on Form 10-Q for the quarter ended November 23, 2002. | |
| *10.4 | Form of Non-Qualified Stock Option Agreement. Incorporated by reference to Exhibit 10.1 to the Quarterly Report on Form 10-Q for the quarter ended November 23, 2002. | |
| *10.5 | AutoZone, Inc. 2003 Director Stock Option Plan. Incorporated by reference to Appendix C to the definitive proxy statement dated November 1, 2002, for the Annual Meeting of Stockholders held December 12, 2002. | |
| *10.6 | AutoZone, Inc. 2003 Director Compensation Plan. Incorporated by reference to Appendix D to the definitive proxy statement dated November 1, 2002, for the Annual Meeting of Stockholders held December 12, 2002. | |
| *10.7 | Third Amendment to the AutoZone, Inc. Executive Deferred Compensation Plan. Incorporated by reference to Exhibit 10.1 to the Form 8-K dated December 12, 2012. | |
| *10.8 | AutoZone, Inc. 2006 Stock Option Plan. Incorporated by reference to Appendix A to the definitive proxy statement dated October 25, 2006, for the Annual Meeting of Stockholders held December 13, 2006. | |
| *10.9 | Form of Stock Option Agreement. Incorporated by reference to Exhibit 10.26 to the Annual Report on Form 10-K for the fiscal year ended August 25, 2007. | |
| *10.10 | AutoZone, Inc. Fifth Amended and Restated Executive Stock Purchase Plan. Incorporated by reference to Exhibit 10.11 to the Annual Report on Form 10-K dated October 22, 2012. | |
| *10.11 | Amended and Restated AutoZone, Inc. 2003 Director Compensation Plan. Incorporated by reference to Exhibit 99.2 to the Current Report on Form 8-K dated January 4, 2008. | |
79
Table of Contents
| *10.12 | Amended and Restated AutoZone, Inc. 2003 Director Stock Option Plan. Incorporated by reference to Exhibit 99.3 to the Current Report on Form 8-K dated January 4, 2008. | |
| *10.13 | AutoZone, Inc. Enhanced Severance Pay Plan. Incorporated by reference to Exhibit 99.1 to the Current Report on Form 8-K dated February 15, 2008. | |
| *10.14 | Form of non-compete and non-solicitation agreement signed by each of the following current and former executive officers: Philip B. Daniele, III, Mark A. Finestone, William T. Giles, William W. Graves, Ronald B. Griffin, James C. Griffith, William R. Hackney, Rodney C. Halsell, Thomas B. Newbern, Charlie Pleas, III, Larry M. Roesel, Albert Saltiel, Richard C. Smith, Mike A. Womack and Kristen C. Wright; and by AutoZone, Inc. Incorporated by reference to Exhibit 99.2 to the Current Report on Form 8-K dated February 15, 2008. | |
| *10.15 | Form of non-compete and non-solicitation agreement approved by AutoZone’s Compensation Committee for execution by non-executive officers. Incorporated by reference to Exhibit 99.3 to the Current Report on Form 8-K dated February 15, 2008. | |
| *10.16 | Agreement dated February 14, 2008, between AutoZone, Inc. and William C. Rhodes, III. Incorporated by reference to Exhibit 99.4 to the Current Report on Form 8-K dated February 15, 2008. | |
| *10.17 | Form of non-compete and non-solicitation agreement signed by each of the following current and former officers: Jennie E. Anderson, Edward Beltran, Craig Blackwell, Brian L. Campbell, Cathy Culnane, Anthony J. Dudek, Robert A. Durkin, Bill Edwards, Joseph Espinosa, Duane Findley, Preston B. Frazer, Tim Goddard, Stephany L. Goodnight, Eric S. Gould, Troy Hitchcock, Chris Hunter, Joyce Johns, David Klein, Thomas A. Kliman, Maria M. Leggett, Dennis LeRiche, Mitchell Major, Grantland E. McGee, Jr., John M. Mosunic, J. Scott Murphy, Jeffrey H. Nix, Raymond A. Pohlman, Elizabeth Rabun, Joe L. Sellers, Jr., Brett Shanaman, Jamey Traywick, Kevin Williams, Doug Wines, Solomon Woldeslassie and Larry Yeske; and by AutoZone, Inc. Incorporated by reference to Exhibit 10.1 to the Quarterly Report on Form 10-Q for the quarter ended May 3, 2008. | |
| *10.18 | Second Amended and Restated Employment and Non-Compete Agreement between AutoZone, Inc. and Harry L. Goldsmith dated December 29, 2008. Incorporated by reference to Exhibit 10.1 to the Current Report on Form 8-K dated December 30, 2008. | |
| *10.19 | AutoZone, Inc. 2010 Executive Incentive Compensation Plan, incorporated by reference to Exhibit A to the definitive proxy statement dated October 26, 2009, for the Annual Meeting of Stockholders held December 16, 2009. | |
| *10.20 | AutoZone, Inc. 2011 Equity Incentive Award Plan, incorporated by reference to Exhibit A to the definitive proxy statement dated October 25, 2010, for the Annual Meeting of Stockholders held December 15, 2010. | |
| *10.21 | Form of Stock Option Agreement under the 2006 Stock Option Plan, effective September 2010. Incorporated by reference to Exhibit 10.2 to the Quarterly Report on Form 10-Q dated December 16, 2010. | |
| *10.22 | Form of Stock Option Agreement under the 2006 Stock Option Plan for certain executive officers, effective September 2010. Incorporated by reference to Exhibit 10.3 to the Quarterly Report on Form 10-Q dated December 16, 2010. | |
| *10.23 | Form of Letter Agreement dated as of December 14, 2010, amending certain Stock Option Agreements of executive officers. Incorporated by reference to Exhibit 10.4 to the Quarterly Report on Form 10-Q dated December 16, 2010. | |
| *10.24 | AutoZone, Inc. 2011 Director Compensation Program. Incorporated by reference to Exhibit 10.5 to the Quarterly Report on Form 10-Q dated December 16, 2010. | |
| *10.25 | Form of Stock Option Agreement under the 2011 Equity Incentive Award Plan. Incorporated by reference to Exhibit 10.2 to the Quarterly Report on Form 10-Q dated March 17, 2011. | |
80
Table of Contents
| *10.26 | Form of Stock Option Agreement under the 2011 Equity Incentive Award Plan for officers effective September 27, 2011. Incorporated by reference to Exhibit 10.37 to the Annual Report on Form 10-K for the fiscal year ended August 27, 2011. | |
| *10.27 | First Amended and Restated AutoZone, Inc. Enhanced Severance Pay Plan. Incorporated by reference to Exhibit 10.4 to the Quarterly Report on Form 10-Q dated March 17, 2011. | |
| 10.28 | Form of Stock Option Agreement under the 2011 Equity Incentive Award Plan for officers effective September 27, 2011. Incorporated by reference to Exhibit 10.37 to the Annual Report on Form 10-K for the fiscal year ended August 27, 2011. | |
| *10.29 | Form of Stock Option Agreement under the 2011 Equity Incentive Award Plan for certain executive officers effective September 27, 2011. Incorporated by reference to Exhibit 10.38 to the Annual Report on Form 10-K for the fiscal year ended August 27, 2011. | |
| *10.30 | Amended and Restated Credit Agreement dated as of September 13, 2011 among AutoZone, Inc. as Borrower, the several Lenders from time to time party thereto, and Bank of America, N.A. as Administrative Agent and Swingline Lender, JPMorgan Chase Bank, N.A. as Syndication Agent, arranged by Merrill Lynch, Pierce, Fenner & Smith Incorporated and J.P. Morgan Securities LLC as Joint Lead Arrangers and Merrill Lynch, Pierce, Fenner & Smith Incorporated, J.P. Morgan Securities LLC, SunTrust Robinson Humphrey, Inc., U.S. Bank National Association, Wells Fargo Securities, LLC and Barclays Capital as Joint Book Runners. Incorporated by reference to Exhibit 10.39 to the Annual Report on Form 10-K for the fiscal year ended August 27, 2011. | |
| *10.31 | Sixth Amended and Restated AutoZone, Inc. Employee Stock Purchase Plan. Incorporated by reference to Exhibit 10.40 to the Annual Report on Form 10-K for the fiscal year ended August 27, 2011. | |
| *10.32 | Second Amended AutoZone, Inc. Executive Deferred Compensation Plan. Incorporated by reference to Exhibit 10.1 to the Current Report on Form 8-K dated December 14, 2011. | |
| *10.33 | Offer letter dated May 23, 2012, to Mike A. Womack. Incorporated by reference to Exhibit 10.38 of Annual Report on Form 10-K dated October 22, 2012. | |
| *10.34 | Offer letter dated April 26, 2012, to Ronald B. Griffin. Incorporated by reference to Exhibit 10.39 of Annual Report on Form 10-K dated October 22, 2012. | |
| *10.35 | Amended Non-Compete Agreement between AutoZone, Inc. and Jon A. Bascom dated May 25, 2012. Incorporated by reference to Exhibit 10.40 of Annual Report on Form 10-K dated October 22, 2012. | |
| *10.36 | Offer letter dated February 7, 2013, to Albert Saltiel. Incorporated by reference to Exhibit 10.2 of the Quarterly Report on Form 10-Q dated June 12, 2013. | |
| *10.37 | Third Amendment to the AutoZone, Inc. Executive Deferred Compensation Plan incorporated by reference to Exhibit 10.1 to the Form 8-K dated December 12, 2012. | |
| 10.38 | Master Extension, New Commitment and Amendment Agreement dated as of December 4, 2013 among AutoZone, Inc. as Borrower; Bank of America, N.A. as Administrative Agent and Swingline Lender; JPMorgan Chase Bank, N.A. as Syndication Agent; Merrill Lynch, Pierce, Fenner & Smith Incorporated and J.P. Morgan Securities LLC as Joint Lead Arrangers; Merrill Lynch, Pierce, Fenner & Smith Incorporated, J.P. Morgan Securities LLC, SunTrust Robinson Humphrey, Inc., U.S. Bank National Association, Wells Fargo Securities, LLC and Barclay’s Capital as Joint Book Runners; SunTrust Bank, U.S. Bank National Association, Wells Fargo Bank, National Association and Barclay’s Bank PLC as Documentation Agents; and the several lenders party thereto. Incorporated by reference to Exhibit 10.1 of the Quarterly Report on Form 10-Q dated December 18, 2013. | |
| *10.39 | Amended and Restated AutoZone, Inc. AutoZone, Inc. Executive Deferred Compensation Plan dated December 17, 2013. Incorporated by reference to Exhibit 10.2 to the Quarterly Report on Form 10-Q dated March 25, 2014. | |
81
Table of Contents
| *10.40 | AutoZone, Inc. Director Compensation Program effective January 1, 2014. Incorporated by reference to Exhibit 10.3 to the Quarterly Report on Form 10-Q dated March 25, 2014. | |
| 10.41 | Second Amended and Restated Credit Agreement dated as of December 19, 2014, among AutoZone, Inc., as Borrower, the lenders party thereto and Bank of America, N.A. as Administrative Agent, incorporated by reference to Exhibit 10.1 of the Current Report on Form 8-K dated December 22, 2014. | |
| 10.42 | 364-Day Credit Agreement Dated as of December 19, 2014, among AutoZone, Inc. as Borrower, the lenders party thereto and Wells Fargo Bank National Association as Administrative Agent, incorporated by reference to Exhibit 10.2 of the Current Report on Form 8-K dated December 22, 2014. | |
| *10.43 | Amended and Restated AutoZone, Inc. 2011 Equity Incentive Award Plan dated December 16, 2015. Incorporated by reference to Exhibit A to the definitive proxy statement dated October 26, 2015, for the Annual Meeting of Stockholders held December 16, 2015. | |
| 12.1 | Computation of Ratio of Earnings to Fixed Charges. | |
| 14.1 | Code of Ethical Conduct. Incorporated by reference to Exhibit 14.1 of the Annual Report on Form 10-K for the fiscal year ended August 30, 2003. | |
| 21.1 | Subsidiaries of the Registrant. | |
| 23.1 | Consent of Ernst & Young LLP. | |
| 31.1 | Certification of Principal Executive Officer Pursuant to Rules 13a-14(a) and 15d-14(a) under the Securities Exchange Act of 1934, as Adopted Pursuant to Section 302 of the Sarbanes-Oxley Act of 2002. | |
| 31.2 | Certification of Principal Financial Officer Pursuant to Rules 13a-14(a) and 15d-14(a) under the Securities Exchange Act of 1934, as Adopted Pursuant to Section 302 of the Sarbanes-Oxley Act of 2002. | |
| 32.1 | Certification of Principal Executive Officer Pursuant to 18 U.S.C. Section 1350 as adopted Pursuant to Section 906 of the Sarbanes-Oxley Act of 2002. | |
| 32.2 | Certification of Principal Financial Officer Pursuant to 18 U.S.C. Section 1350 as adopted Pursuant to Section 906 of the Sarbanes-Oxley Act of 2002. | |
| 101.INS | XBRL Instance Document | |
| 101.SCH | XBRL Taxonomy Extension Schema Document | |
| 101.CAL | XBRL Taxonomy Extension Calculation Document | |
| 101.LAB | XBRL Taxonomy Extension Labels Document | |
| 101.PRE | XBRL Taxonomy Extension Presentation Document | |
| 101.DEF | XBRL Taxonomy Extension Definition Document | |
| * | Management contract or compensatory plan or arrangement. |
82