Attached files
| file | filename |
|---|---|
| 8-K - TAIWAN FUND INC | fp0022134_8k.htm |

Investment objective
The Fund’s investment objective is to seek long-term capital appreciation primarily through investments in equity securities listed in Taiwan.
|
Fund facts
|
(as at 09/30/16)
|
|
Net asset value per share
|
$20.18
|
|
Market price
|
$17.31
|
|
Premium/discount
|
-14.22%
|
|
Total net assets
|
$165.93 m
|
|
Market cap
|
$142.36 m
|
|
Fund statistics
|
|
|
Investment adviser (date of appointment)
|
JF International Management, Inc. (07/22/14)
|
|
Fund manager
|
Shumin Huang
|
|
Listed
|
NYSE
|
|
Launch date
|
12/23/86
|
|
Shares outstanding
|
8,224,330
|
|
Last dividend (Ex-dividend date)
|
$2.6332
(December 26, 2014)
|
|
Benchmark
|
TAIEX Total Return Index
|
|
Fund codes
|
|
|
Bloomberg
|
TWN
|
|
Sedol
|
286987895
|
|
CUSIP
|
874036106
|
|
ISIN
|
US8740361063
|
|
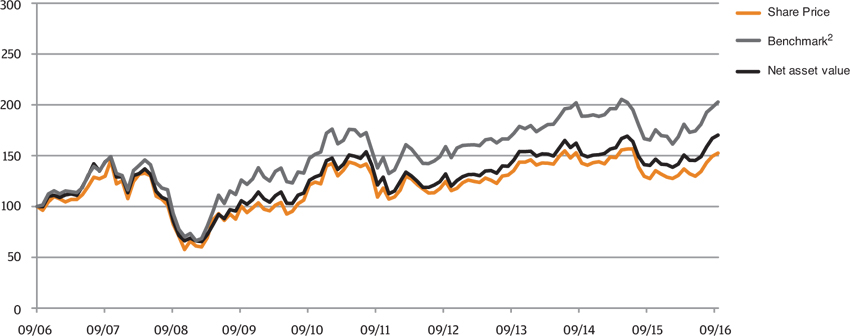
10 year performance data
|
(as at 09/30/16)
|
|
Cumulative Performance1
|
(as at 09/30/16)
|
||||||
|
%
|
1m
|
3m
|
YTD
|
1Y
|
3Y
|
5Y
|
10Y
|
|
The Taiwan Fund, Inc.
|
1.9
|
14.3
|
20.5
|
21.2
|
16.9
|
40.5
|
70.3
|
|
Market Price
|
2.1
|
13.5
|
18.3
|
19.6
|
12.7
|
39.6
|
52.6
|
|
TSE Index
|
2.3
|
8.9
|
15.2
|
17.7
|
5.8
|
23.3
|
40.6
|
|
TAIEX Total Return Index2
|
2.7
|
12.1
|
20.0
|
22.6
|
18.0
|
47.0
|
102.8
|
|
MSCI Taiwan Index
|
2.9
|
11.7
|
21.2
|
22.7
|
22.1
|
48.3
|
68.5
|
|
Rolling 12 month performance1
|
(as at 09/30/16)
|
||||
|
%
|
2016/2015
|
2015/2014
|
2014/2013
|
2013/2012
|
2012/2011
|
|
The Taiwan Fund, Inc.
|
21.2
|
-7.1
|
3.8
|
10.2
|
9.0
|
|
Market Price
|
19.6
|
-10.6
|
5.4
|
8.5
|
14.1
|
|
TSE Index
|
17.7
|
-15.7
|
6.6
|
5.0
|
11.0
|
|
TAIEX Total Return Index2
|
22.6
|
-12.4
|
9.9
|
8.1
|
15.2
|
|
MSCI Taiwan Index
|
22.7
|
-11.3
|
12.2
|
6.2
|
14.5
|
|
Top 10 holdings
|
(as at 09/30/16)
|
|
Holding
|
Fund %
|
|
Taiwan Semiconductor Manufacturing Co., Ltd.
|
9.9
|
|
Largan Precision Co., Ltd.
|
5.3
|
|
Hon Hai Precision Industry Co., Ltd.
|
4.5
|
|
Taiwan Paiho Ltd.
|
3.4
|
|
Cathay Financial Holding Co., Ltd.
|
3.3
|
|
Fubon Financial Holding Co., Ltd.
|
3.3
|
|
Ennoconn Corp.
|
3.2
|
|
Wistron NeWeb Corp.
|
3.3
|
|
Eclat Textile Co., Ltd.
|
3.1
|
|
Nien Made Enterprise Co., Ltd.
|
2.5
|
|
1
|
In US Dollar terms
|
|
2
|
TAIEX Total Return Index (prior to January 1, 2003, TAIEX Index)
|

|
Sector breakdown
|
(as at 09/30/16)
|
||
|
Sector Allocation
|
Fund %
|
Benchmark
|
Deviation
|
|
Automobile
|
0.0%
|
1.5%
|
-1.5%
|
|
Biotechnology & Medical Care
|
0.7%
|
0.9%
|
-0.2%
|
|
Building Material & Construction
|
0.0%
|
1.5%
|
-1.5%
|
|
Cement
|
0.8%
|
1.0%
|
-0.2%
|
|
Chemical
|
0.0%
|
1.0%
|
-1.0%
|
|
Communications & Internet
|
3.3%
|
6.8%
|
-3.5%
|
|
Computer & Peripheral Equipment
|
9.2%
|
6.3%
|
2.9%
|
|
Electric & Machinery
|
10.5%
|
2.0%
|
8.5%
|
|
Electrical & Cable
|
0.0%
|
0.3%
|
-0.3%
|
|
Electronic Parts & Components
|
6.2%
|
4.3%
|
1.9%
|
|
Electronic Products Distribution
|
0.0%
|
0.8%
|
-0.8%
|
|
Financial & Insurance
|
11.1%
|
12.7%
|
-1.6%
|
|
Foods
|
1.5%
|
2.1%
|
-0.6%
|
|
Glass & Ceramic
|
0.0%
|
0.2%
|
-0.2%
|
|
Information Service
|
0.0%
|
0.2%
|
-0.2%
|
|
Iron & Steel
|
0.0%
|
1.9%
|
-1.9%
|
|
Oil, Gas & Electricity
|
1.6%
|
3.6%
|
-2.0%
|
|
Optoelectronic
|
6.7%
|
4.2%
|
2.5%
|
|
Other
|
7.9%
|
3.7%
|
4.2%
|
|
Other Electronic
|
8.1%
|
7.2%
|
0.9%
|
|
Paper & Pulp
|
0.0%
|
0.2%
|
-0.2%
|
|
Plastics
|
0.9%
|
6.2%
|
-5.3%
|
|
Rubber
|
0.0%
|
1.3%
|
-1.3%
|
|
Semiconductor
|
21.7%
|
25.0%
|
-3.3%
|
|
Shipping & Transportation
|
0.3%
|
1.3%
|
-1.0%
|
|
Textiles
|
4.5%
|
1.7%
|
2.8%
|
|
Tourism
|
0.0%
|
0.5%
|
-0.5%
|
|
Trading & Consumers' Goods
|
2.7%
|
1.6%
|
1.1%
|
|
Cash
|
2.3%
|
0.0%
|
2.3%
|
|
OVERALL TOTAL
|
100.0%
|
100.0%
|
0.0%
|
Review
The TAIEX Total Return Index (TAIEX) closed up for the fifth consecutive month, adding 2.7% in September. Gains were supported by speculation that Apple would increase its orders from Taiwan suppliers following better than expected sales of the iPhone 7, and by Intel raising its third quarter guidance coupled with strong notebook shipments in August and good performance from insurance companies. Performance of the non-tech sectors was mixed, led by glass and autos, while textiles, cement and retail suffered from profit-taking. The Fund underperformed the TAIEX by 0.8% in September.
Positioning and Contributors
Stock that detracted from the Fund's performance included Realtek Semiconductor Corp., which lost some of its gains made in the previous month. Several other stocks also corrected on profit-taking, including textile manufacturers Eclat Textile Co., Ltd. and Toung Loong Textile Manufacturing, Inc. as well as Tung Thih Electronic Co., Ltd., a supplier of auto electronic components. In addition, Himax Technologies, Inc. was weak after Microsoft cut its shipment forecast on HoloLens for this year. Meanwhile, Taiwan Paiho Ltd., a sports apparel manufacturer, rebounded after improved results in August. ASPEED Technology, a semiconductor chip maker, also performed well as its third quarter 2016 outlook was stronger than expected despite a delay in the acquisition of Emulex. In addition, Airtac International Group, the supplier of pneumatic controls, rose as sales and margins continued to improve.
There was no change to the Fund's strategy with continuation of a preference for quality companies with strong growth profiles. These include consumer discretionary names with growth potential and sustainable franchises, including those in the sportswear and auto parts sectors. Given the weak overall demand for personal computers (PC), note books (NB), televisions (TV) and handsets, the Fund's tech positions were mainly in the cloud, internet of things (IOt), gaming and semi-conductor sectors. The Fund was neutral in financials and remained underweight in telecommunications and basic materials.
Outlook
Consensus earnings revisions for 2016 turned positive in September, the first upgrades since May 2015. The improvement could be sustainable if the better than expected strength in sales of the iPhone7 and notebooks continue. An end or pause in domestic interest rate reduction should also help earnings for the financial sector. However, after a five month rally, coupled with the potential for a strong New Taiwan Dollar (NTD) dragging third quarter 2016 results, some profit-taking could be in store.
|
Full portfolio holdings
|
(as at 09/30/16)
|
|
|
Holding
|
Market Value
USD
|
Fund
%
|
|
Semiconductor
|
35,934,655
|
21.7
|
|
Taiwan Semiconductor Manufacturing Co., Ltd.
|
16,465,202
|
9.9
|
|
ASPEED Technology, Inc.
|
3,476,537
|
2.1
|
|
Silergy Corp.
|
3,412,069
|
2.1
|
|
MediaTek, Inc.
|
3,018,057
|
1.8
|
|
Realtek Semiconductor Corp.
|
2,635,338
|
1.6
|
|
Advanced Semiconductor Engineering, Inc.
|
2,402,667
|
1.4
|
|
Silicon Motion Technology Corp.
|
1,977,239
|
1.2
|
|
Powertech Technology, Inc.
|
1,094,530
|
0.7
|
|
Chunghwa Precision Test Tech Co., Ltd.
|
749,709
|
0.5
|
|
Parade Technologies Ltd.
|
703,307
|
0.4
|
|
Financial & Insurance
|
18,475,926
|
11.1
|
|
Cathay Financial Holding Co., Ltd.
|
5,543,933
|
3.3
|
|
Fubon Financial Holding Co., Ltd.
|
5,434,200
|
3.3
|
|
China Life Insurance Co., Ltd.
|
3,502,474
|
2.1
|
|
Yuanta Financial Holding Co., Ltd.
|
2,643,365
|
1.6
|
|
E. Sun Financial Holding Co., Ltd.
|
1,351,954
|
0.8
|
|
Electric & Machinery
|
17,421,297
|
10.5
|
|
Hota Industrial Manufacturing Co., Ltd.
|
3,648,849
|
2.2
|
|
Iron Force Industrial Co., Ltd.
|
3,291,042
|
2.0
|
|
Airtac International Group
|
3,177,586
|
1.9
|
|
Basso Industry Corp.
|
2,517,219
|
1.5
|
|
Macauto Industrial Co., Ltd.
|
1,961,334
|
1.2
|
|
Yeong Guan Energy Technology Group Co., Ltd.
|
1,441,968
|
0.9
|
|
Hiwin Technologies Corp.
|
1,383,299
|
0.8
|
|
Computer & Peripheral Equipment
|
15,348,931
|
9.2
|
|
Ennoconn Corp.
|
5,414,119
|
3.2
|
|
Micro-Star International Co., Ltd.
|
2,607,855
|
1.6
|
|
Advantech Co., Ltd.
|
2,548,787
|
1.5
|
|
Primax Electronics Ltd.
|
2,197,414
|
1.3
|
|
Inventec Corp.
|
1,462,717
|
0.9
|
|
Mitac Holdings Corp.
|
1,118,039
|
0.7
|
|
Other Electronic
|
13,404,293
|
8.1
|
|
Hon Hai Precision Industry Co., Ltd.
|
7,392,686
|
4.5
|
|
Tung Thih Electronic Co., Ltd.
|
3,571,326
|
2.1
|
|
Voltronic Power Technology Corp.
|
1,482,217
|
0.9
|
|
Catcher Technology Co., Ltd.
|
958,064
|
0.6
|
|
Other
|
13,161,263
|
7.9
|
|
Taiwan Paiho Ltd.
|
5,745,514
|
3.4
|
|
Nien Made Enterprise Co., Ltd.
|
4,132,124
|
2.5
|
|
Nan Liu Enterprise Co., Ltd.
|
1,694,023
|
1.0
|
|
KMC Kuei Meng International, Inc.
|
941,640
|
0.6
|
|
Feng TAY Enterprise Co., Ltd.
|
647,962
|
0.4
|
|
Optoelectronic
|
11,095,973
|
6.7
|
|
Largan Precision Co., Ltd.
|
8,803,178
|
5.3
|
|
Epistar Corp.
|
1,013,916
|
0.6
|
|
Au Optronics Corp.
|
789,890
|
0.5
|
|
Innolux Corp.
|
488,989
|
0.3
|
|
Full portfolio holdings (cont'd)
|
||
|
Holding
|
Market Value
USD |
Fund
%
|
|
Electronic Parts & Components
|
10,312,967
|
6.2
|
|
Delta Electronics, Inc.
|
4,023,253
|
2.4
|
|
Himax Technologies, Inc.
|
2,534,050
|
1.5
|
|
King Slide Works Co., Ltd.
|
2,444,992
|
1.5
|
|
Sinbon Electronics Co., Ltd.
|
1,310,672
|
0.8
|
|
Textiles
|
7,487,127
|
4.5
|
|
Eclat Textile Co., Ltd.
|
5,099,014
|
3.1
|
|
Toung Loong Textile Manufacturing Co., Ltd.
|
2,388,113
|
1.4
|
|
Communications & Internet
|
5,408,225
|
3.3
|
|
Wistron NeWeb Corp.
|
5,408,225
|
3.3
|
|
Trading & Consumers’ Goods
|
4,538,181
|
2.7
|
|
Poya International Co., Ltd.
|
2,294,685
|
1.4
|
|
President Chain Store Corp.
|
1,938,269
|
1.1
|
|
Taiwan FamilyMart Co., Ltd.
|
305,227
|
0.2
|
|
Oil, Gas & Electricity
|
2,593,501
|
1.6
|
|
Formosa Petrochemical Corp.
|
2,593,501
|
1.6
|
|
Foods
|
2,453,625
|
1.5
|
|
Uni-President Enterprises Corp.
|
2,453,625
|
1.5
|
|
Plastics
|
1,419,677
|
0.9
|
|
Formosa Chemicals & Fibre Corp.
|
868,670
|
0.5
|
|
Formosa Plastics Corp.
|
551,007
|
0.4
|
|
Cement
|
1,412,557
|
0.8
|
|
Taiwan Cement Corp.
|
1,412,557
|
0.8
|
|
Biotechnology & Medical Care
|
1,086,599
|
0.7
|
|
Grape King Bio Ltd.
|
1,086,599
|
0.7
|
|
Shipping & Transportation
|
512,279
|
0.3
|
|
Aerospace Industrial Development Corp.
|
512,279
|
0.3
|
|
Cash
|
3,860,653
|
2.3
|
|
Cash
|
3,860,653
|
2.3
|
|
Grand Total
|
165,927,729
|
100.0
|
Source: MSCI. Neither MSCI nor any other party involved in or related to compiling, computing or creating the MSCI data makes any express of implied warranties or representations with respect to such data (or the results to be obtained by the use thereof), and all such parties hereby expressly disclaim all warranties of originality, accuracy, completeness, merchantability or fitness for a particular purpose with respect to any of such data. Without limiting any of the foregoing, in no event shall MSCI, any of its affiliates or any third party involved in or related to compiling computing or creating the data have any liability for any direct, indirect, special, punitive, consequential or any other damages (including lost profits) even if notified of the possibility of such damages.
No further distribution or dissemination of the MSCI data is permitted without MSCI's express written consent.
Important Information
This document is issued and approved by JF International Management, Inc. (“JFIMI”), as investment advisor of The Taiwan Fund, Inc. (the ‘'Fund''). JFIMI is an investment advisor registered with the US Securities and Exchange Commission. Certain information herein is believed to be reliable but has not been verified by JFIMI. JFIMI makes no representation or warranty and does not accept any responsibility in relation to such information or for opinion or conclusion which the reader may draw from this newsletter.
The Fund is classified as a diversified investment company under the US Investment Company Act of 1940 as amended. It meets the criteria of a closed end US fund and its shares are listed on the New York Stock Exchange. JFIMI has been appointed investment advisor to the Fund.
This newsletter does not constitute an offer of shares. Closed-end funds, unlike open-end funds, are not continuously offered. After the initial public offering, shares are bought and sold on the open market through a stock exchange. JFIMI, its ultimate and intermediate holding companies, subsidiaries, affiliates, clients, directors or staff may, at any time, have a position in the market referred to herein, and may buy or sell securities, currencies, or any other financial instruments in such markets. The information or opinion expressed in this newsletter should not be construed to be a recommendation to buy or sell any security, including the securities, commodities, currencies or financial instruments referred to herein.
Portfolio holdings are subject to change daily.
It should not be assumed that any of the securities transactions or holdings discussed here were or will prove to be profitable, or that the investment recommendations or decisions we make in the future will be profitable or will equal the investment performance of the securities discussed herein.
Investing in the Fund involves certain considerations in addition to the risks normally associated with making investments in securities. The value of the shares issued by the Fund, and the income from them, may go down as well as up and there can be no assurance that upon sale, or otherwise, investors will receive back the amount originally invested. There can be no assurance that you will receive comparable performance returns. Movements in foreign exchange rates may have a separate effect, unfavorable as well as favorable, on the gain or loss otherwise experienced on an investment. Past performance is not a guide to future returns. Accordingly, the Fund is only suitable for investment by investors who are able and willing to withstand the total loss of their investment. In particular, prospective investors should consider the following risks:
Discretionary investment is not risk-free. The past operating performance does not guarantee a minimum return for the discretionary investment fund. Apart from exercising the duty of care of a prudent adviser, JFIMI will not be responsible for the profit or loss of the discretionary investment fund, nor guarantee a minimum return.
| • |
I t should be noted that investment in the Fund is only suitable for sophisticated investors who are aware of the risk of investing in Taiwan and should be regarded as long term. Funds which invest in one country carry a higher degree of risk than those with portfolios diversified across a number of markets.
|
| • |
Investment in the securities of smaller and unquoted companies can involve greater risk than is customarily associated with investment in larger, more established, companies. In particular, smaller companies often have limited product lines, markets or financial resources and their management may be dependent on a smaller number of key individuals. In addition, the market for stock in smaller companies is often less liquid than that for stock in larger companies, bringing with it potential difficulties in acquiring, valuing and disposing of such stock. Proper information for determining their value, or the risks to which they are exposed, may not be available.
|
| • |
Investments within emerging markets such as Taiwan can be of higher risk. Many emerging markets, and the companies quoted on their stock exchanges, are exposed to the risks of political, social and religious instability, expropriation of assets or nationalization, rapid rates of inflation, high interest rates, currency depreciation and fluctuations and changes in taxation which may affect the Fund's income and the value of its investments.
|
| • |
The marketability of quoted shares may be limited due to foreign investment restrictions, wide dealing spreads, exchange controls, foreign ownership restrictions, the restricted opening of stock exchanges and a narrow range of investors. Trading volume may be lower than on more developed stock markets, and equities are less liquid. Volatility of prices can also be greater than in more developed stock markets. The infrastructure for clearing, settlement and registration on the primary and secondary markets may be undeveloped. Under certain circumstances, there may be delays in settling transactions in some of the markets.
|