Attached files
| file | filename |
|---|---|
| EX-99.3 - EX-99.3 - STONE ENERGY CORP | d248588dex993.htm |
| EX-99.1 - EX-99.1 - STONE ENERGY CORP | d248588dex991.htm |
| EX-10.2 - EX-10.2 - STONE ENERGY CORP | d248588dex102.htm |
| EX-10.1 - EX-10.1 - STONE ENERGY CORP | d248588dex101.htm |
| 8-K - 8-K - STONE ENERGY CORP | d248588d8k.htm |
| Exhibit 99.2
|
PRELIMINARY DRAFT SUBJECT TO REVISION SUBJECT TO FRE408 AND CONFIDENTIALITY AGREEMENT
2 2 S E P T E M B E R 2 0 1 6 E X H I B I T 9 9 . 3
D I S C U S S I O N M A T E R I A L S
Project Edison
|
|
PRELIMINARY DRAFT SUBJECT TO REVISION SUBJECT TO FRE408 AND CONFIDENTIALITY AGREEMENT
C O N F I D E N T I A L
P R O J E C T E D I S O N
Disclaimer
None of Stone Energy Corporation (“Stone” or the “Company”), Lazard and Alvarez & Marsal Holdings, LLC (“A&M”), and each of their subsidiaries, affiliates, officers, directors, shareholders, employees, consultants, advisors, agents and representatives of the foregoing (collectively, “Representatives”), make any representation or warranty, express or implied at law or in equity, in connection with any of the information made available either herein or subsequent to this document, including, but not limited to, the past, present, or future value of the anticipated cash flows, income, costs, expenses, liabilities and profits, if any, of the Company. Accordingly, any person, company or interested party will rely solely upon its own independent examination and assessment of the information in making any decision in connection with a proposed restructuring of the Company’s balance sheet (a “Transaction”) and in no event shall any recipient party make any claim against Stone, Lazard, A&M or any of their respective Representatives in respect of, or based upon, the information contained either herein or subsequent to this document.
None of Stone, Lazard or A&M, nor any of their respective Representatives, shall have any liability to any recipient party or its respective Representatives as a result of receiving and/or evaluating any information concerning the Transaction (including, but not limited to, this presentation (“Presentation”)). Information in this Presentation is dependent upon assumptions with respect to commodity prices, production, development capital, exploration capital, operating expenses, availability and cost of adequate capital and performance as set forth in this Presentation and in Current Reports on Form 8-K filed on June 3, 2016 and August 23, 2016.
The information herein has been prepared by Lazard based upon information supplied by Stone or publicly available information, and portions of the information herein may be based upon certain statements, estimates and forecasts provided by the Company with respect to the anticipated future performance of the Company. Lazard has relied upon the accuracy and completeness of the foregoing information, and has not assumed any responsibility for any independent verification of such information or any independent valuation or appraisal of any of theassets or liabilities of the Company, or any other entity, or concerning solvency or fair value of theCompany or any other entity. With respect to financial forecasts, Lazard has assumed that they have been reasonably prepared in good faith on bases reflecting the best currently available estimates and judgments of management of the Company as to the future financial performance of the Company. Lazard assumes no responsibility for and expresses no view as to such forecasts or the assumptions on which they are based. The information set forth herein is based upon economic, monetary, market and other conditions as in effect on, and the information made available to Lazard as of, the date hereof, unless indicated otherwise. These materials and the information contained herein are confidential and may not be disclosed publicly or made available to third parties without the prior written consent of Lazard and the Company; provided, however, that you may disclose to any and all persons the U.S. federal income tax treatment and tax structure of the transaction described herein and the portions of these materials that relate to such tax treatment or structure.
Certain statements in this Presentation are forward-looking and are based upon the Company’s current belief as to the outcome and timing of future events. All statements, other than statements of historical facts, that address activities that Stone plans, expects, believes, projects, estimates or anticipates will, should or may occur in the future, including anticipated cash flows, income, costs, liabilities, profits, future production of oil and gas, future capital expenditures and drilling of wells and future financial or operating results are forward-looking statements. All forward-looking numbers are approximate. Important factors that could cause actual results to differ materially from those in the forward-looking statements herein include the timing and extent of changes in commodity prices for oil and gas, operating risks, liquidity risks (including risks related to our bank credit facility, our outstanding notes and the restructuring thereof and our ability to continue as a going concern), any potential Chapter 11 bankruptcy proceeding, political and regulatory developments and legislation, including developments and legislation relating to our operations in the Gulf of Mexico and Appalachia, and other risk factors and known trends and uncertainties as described in Stone’s Annual Report on Form 10-K for the year ended December 31, 2015 (“2015 Form 10-K”) and Stone’s Quarterly Reports on Form 10-Q for the three months ended March 31, 2016 and June 30, 2016, and Stone’s Current Reports on Form 8-K, each as filed with the Securities and Exchange Commission (the “SEC”). Should one or more of these risks or uncertainties occur, or should underlying assumptions prove incorrect, Stone’s actual results and plans could differ materially from those expressed in the forward-looking statements. Estimates for Stone’s future production volumes and reserves are based on assumptions of capital expenditure levels and the assumption that market demand and prices for oil and gas will continue at levels that allow for economic production of these products. The production, transportation and marketing of oil and gas are subject to disruption due to transportation and processing availability, mechanical failure, human error, hurricanes and numerous other factors. Stone’s estimates are based on certain other assumptions, such as well performance, which may vary significantly from those assumed. The recipient hereby acknowledges that none of Stone, Lazard, A&M or any of their Representatives has an obligation to update any such projections or forecasts.
|
|
PRELIMINARY DRAFT SUBJECT TO REVISION SUBJECT TO FRE408 AND CONFIDENTIALITY AGREEMENT
P R O J E C T E D I S O N
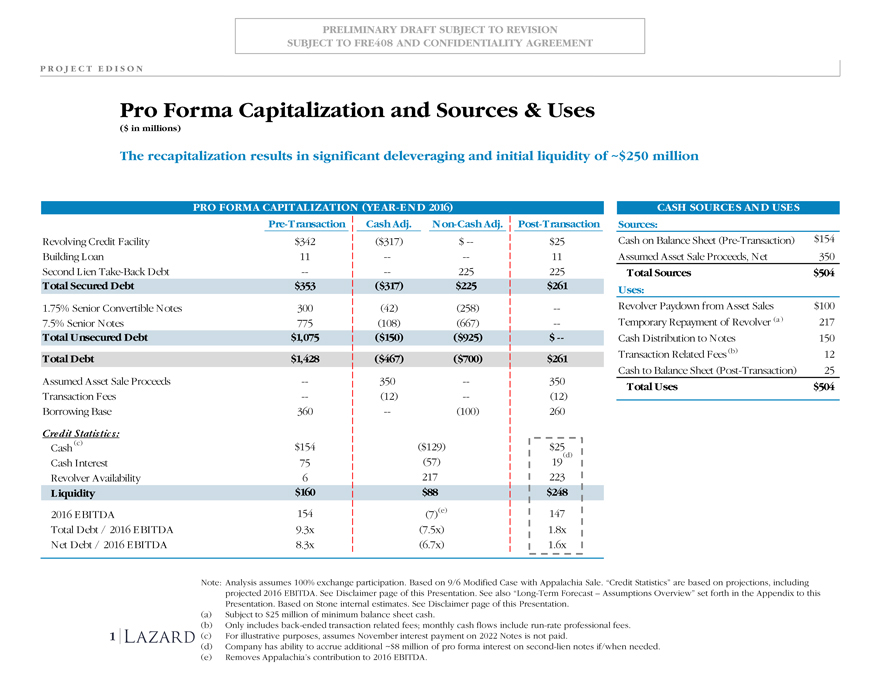
Pro Forma Capitalization and Sources & Uses
($ in millions)
The recapitalization results in significant deleveraging and initial liquidity of ~$250 million
PRO FORMA CAPITALIZATION (YEAR-END 2016) CASH SOURCES AND USES
Pre-Transaction Cash Adj. Non-Cash Adj. Post-Transaction Sources:
Revolving Credit Facility $342($317) $ — $25 Cash on Balance Sheet (Pre-Transaction) $154
Building Loan 11 — — 11 Assumed Asset Sale Proceeds, Net 350
Second Lien Take-Back Debt — — 225 225 Total Sources $504
Total Secured Debt $353($317) $225 $261 Uses:
1.75% Senior Convertible Notes 300(42)(258) — Revolver Paydown from Asset Sales $100
7.5% Senior Notes 775(108)(667) — Temporary Repayment of Revolver (a) 217
Total Unsecured Debt $1,075($150)($925) $ — Cash Distribution to Notes 150
Total Debt $1,428($467)($700) $261 Transaction Related Fees (b) 12
Cash to Balance Sheet (Post-Transaction) 25
Assumed Asset Sale Proceeds — 350 — 350 Total Uses $504
Transaction Fees —(12) —(12)
Borrowing Base 360 —(100) 260
Credit Statistic s:
Cash (c) $154($129) $25
Cash Interest 75(57) 19 (d)
Revolver Availability 6 217 223
Liquidity $160 $88 $248
2016 EBITDA 154(7) (e) 147
Total Debt / 2016 EBITDA 9.3x(7.5x) 1.8x
Net Debt / 2016 EBITDA 8.3x(6.7x) 1.6x
Note: Analysis assumes 100% exchange participation. Based on 9/6 Modified Case with Appalachia Sale. “Credit Statistics” are based on projections, including projected 2016 EBITDA. See Disclaimer page of this Presentation. See also “Long-Term Forecast – Assumptions Overview” set forth in the Appendix to this Presentation. Based on Stone internal estimates. See Disclaimer page of this Presentation.
(a) Subject to $25 million of minimum balance sheet cash.
(b) Only includes back-ended transaction related fees; monthly cash flows include run-rate professional fees.
1 (c) For illustrative purposes, assumes November interest payment on 2022 Notes is not paid.
(d) Company has ability to accrue additional ~$8 million of pro forma interest on second-lien notes if/when needed. (e) Removes Appalachia’s contribution to 2016 EBITDA.
|
|
PRELIMINARY DRAFT SUBJECT TO REVISION SUBJECT TO FRE408 AND CONFIDENTIALITY AGREEMENT
P R O J E C T E D I S O N
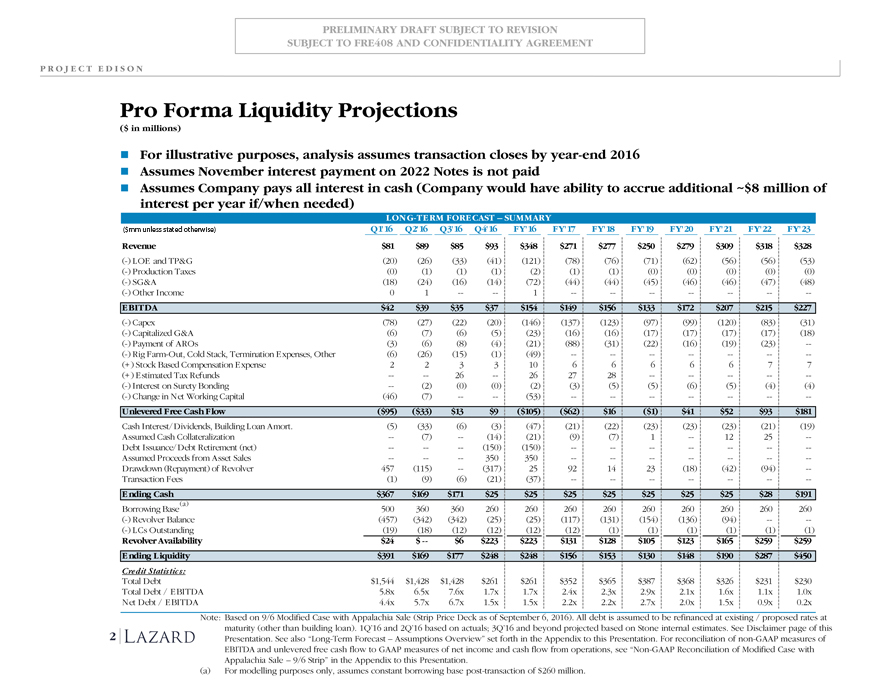
Pro Forma Liquidity Projections
($ in millions)
For illustrative purposes, analysis assumes transaction closes by year-end 2016
Assumes November interest payment on 2022 Notes is not paid
Assumes Company pays all interest in cash (Company would have ability to accrue additional ~$8 million of interest per
year if/when needed)
LONG-TERM FORECAST – SUMMARY
($mm, unless stated otherwise) Q1’16 Q2’16 Q3’16 Q4’16 FY’16 FY’17 FY’18 FY’19 FY’20 FY’21 FY’22 FY’23
Revenue $81 $89 $85 $93 $348 $271 $277 $250 $279 $309 $318 $328
(-) LOE and TP&G(20)(26)(33)(41)(121)(78)(76)(71)(62)(56)(56)(53)
(-) Production Taxes(0)(1)(1)(1)(2)(1)(1)(0)(0)(0)(0)(0)
(-) SG&A(18)(24)(16)(14)(72)(44)(44)(45)(46)(46)(47)(48)
(-) Other Income 0 1 1
EBITDA $42 $39 $35 $37 $154 $149 $156 $133 $172 $207 $215 $227
(-) Capex(78)(27)(22)(20)(146)(137)(123)(97)(99)(120)(83)(31)
(-) Capitalized G&A(6)(7)(6)(5)(23)(16)(16)(17)(17)(17)(17)(18)
(-) Payment of AROs(3)(6)(8)(4)(21)(88)(31)(22)(16)(19)(23)
(-) Rig Farm-Out, Cold Stack, Termination Expenses, Other(6)(26)(15)(1)(49)
(+) Stock Based Compensation Expense 2 2 3 3 10 6 6 6 6 6 7 7
(+) Estimated Tax Refunds 26 26 27 28
(-) Interest on Surety Bonding (2)(0)(0)(2)(3)(5)(5)(6)(5)(4)(4)
(-) Change in Net Working Capital(46)(7) (53)
Unlevered Free Cash Flow($95)($33) $13 $9($105)($62) $16($1) $41 $52 $93 $181
Cash Interest/Dividends, Building Loan Amort.(5)(33)(6)(3)(47)(21)(22)(23)(23)(23)(21)(19)
Assumed Cash Collateralization (7) (14)(21)(9)(7) 1 12 25
Debt Issuance/Debt Retirement (net) (150)(150)
Assumed Proceeds from Asset Sales 350 350
Drawdown (Repayment) of Revolver 457(115) (317) 25 92 14 23(18)(42)(94)
Transaction Fees(1)(9)(6)(21)(37)
Ending Cash $367 $169 $171 $25 $25 $25 $25 $25 $25 $25 $28 $191
Borrowing Base (a) 500 360 360 260 260 260 260 260 260 260 260 260
(-) Revolver Balance(457)(342)(342)(25)(25)(117)(131)(154)(136)(94)
(-) LCs Outstanding(19)(18)(12)(12)(12)(12)(1)(1)(1)(1)(1)(1)
Revolver Availability $24 $ $6 $223 $223 $131 $128 $105 $123 $165 $259 $259
Ending Liquidity $391 $169 $177 $248 $248 $156 $153 $130 $148 $190 $287 $450
Credit Statistic s:
Total Debt $1,544 $1,428 $1,428 $261 $261 $352 $365 $387 $368 $326 $231 $230
Total Debt / EBITDA 5.8x 6.5x 7.6x 1.7x 1.7x 2.4x 2.3x 2.9x 2.1x 1.6x 1.1x 1.0x
Net Debt / EBITDA 4.4x 5.7x 6.7x 1.5x 1.5x 2.2x 2.2x 2.7x 2.0x 1.5x 0.9x 0.2x
Note: Based on 9/6 Modified Case with Appalachia Sale (Strip Price Deck as of September 6, 2016). All debt is assumed to be refinanced at existing / proposed rates at maturity (other than
building loan). 1Q’16 and 2Q’16 based on actuals; 3Q’16 and beyond projected based on Stone internal estimates. See Disclaimer page of this Presentation. See also “Long-Term
2 Forecast – Assumptions Overview” set forth in the Appendix to this Presentation. For reconciliation of non-GAAP measures of EBITDA and unlevered free cash flow to GAAP
measures of net income and cash flow from operations, see “Non-GAAP Reconciliation of Modified Case with Appalachia Sale – 9/6 Strip” in the Appendix to this Presentation.
(a) For modelling purposes only, assumes constant borrowing base post-transaction of $260 million.
|
|
PRELIMINARY DRAFT SUBJECT TO REVISION SUBJECT TO FRE408 AND CONFIDENTIALITY AGREEMENT
P R O J E C T E D I S O N
Appendix
|
|
PRELIMINARY DRAFT SUBJECT TO REVISION SUBJECT TO FRE408 AND CONFIDENTIALITY AGREEMENT
P R O J E C T E D I S O N
APPENDIX
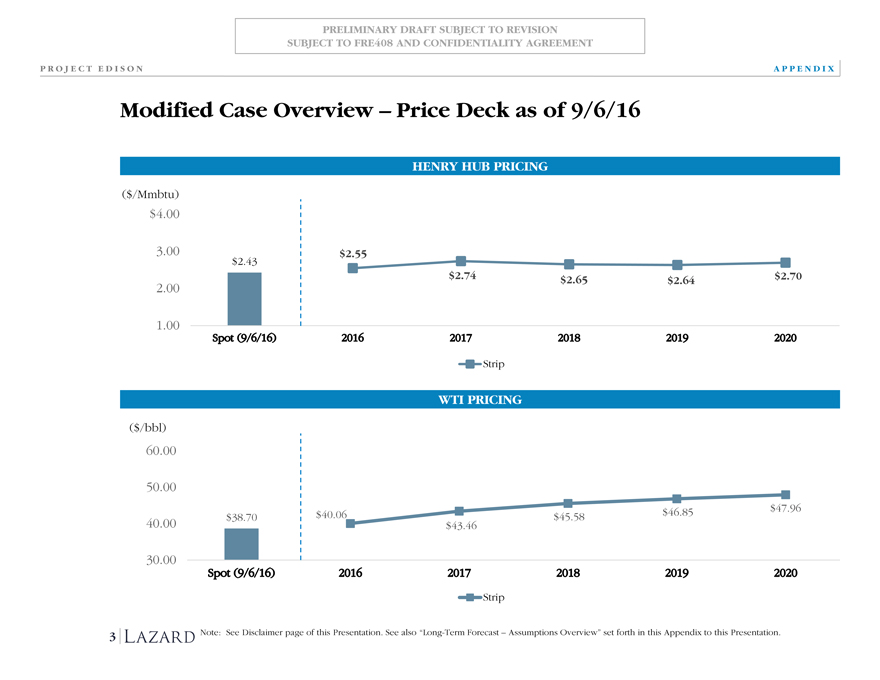
Modified Case Overview – Price Deck as of 9/6/16
HENRY HUB PRICING
($/Mmbtu)
$4.00
3.00 $2.55
$2.43
$2.74 $2.65 $2.64 $2.70
2.00
1.00
Strip
WTI PRICING
($/bbl)
60.00
50.00
$38.70 $40.06 $45.58 $46.85 $47.96
40.00 $43.46
30.00
Strip
3 Note: See Disclaimer page of this Presentation. See also “Long-Term Forecast – Assumptions Overview” set forth in this Appendix to this Presentation.
|
|
PRELIMINARY DRAFT SUBJECT TO REVISION SUBJECT TO FRE408 AND CONFIDENTIALITY AGREEMENT
P R O J E C T E D I S O N
APPENDIX
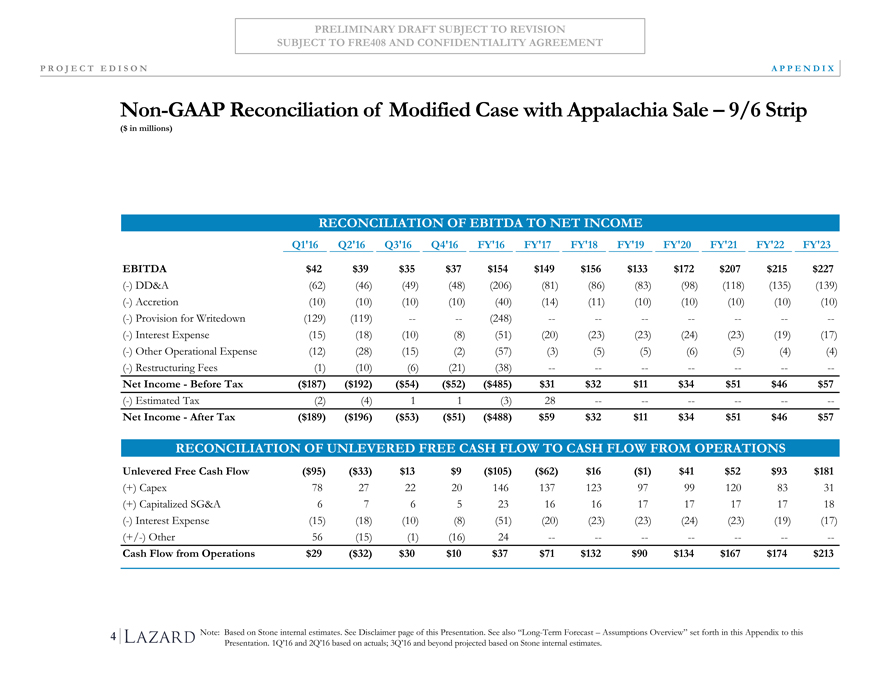
Non-GAAP Reconciliation of Modified Case with Appalachia Sale – 9/6 Strip
($ in millions)
RECONCILIATION OF EBITDA TO NET INCOME
Q1’16 Q2’16 Q3’16 Q4’16 FY’16 FY’17 FY’18 FY’19 FY’20 FY’21 FY’22 FY’23
EBITDA $42 $39 $35 $37 $154 $149 $156 $133 $172 $207 $215 $227
(-) DD&A(62)(46)(49)(48)(206)(81)(86)(83)(98)(118)(135)(139)
(-) Accretion(10)(10)(10)(10)(40)(14)(11)(10)(10)(10)(10)(10)
(-) Provision for Writedown(129)(119) — —(248) — — — — — — —
(-) Interest Expense(15)(18)(10)(8)(51)(20)(23)(23)(24)(23)(19)(17)
(-) Other Operational Expense(12)(28)(15)(2)(57)(3)(5)(5)(6)(5)(4)(4)
(-) Restructuring Fees(1)(10)(6)(21)(38) — — — — — — —
Net Income—Before Tax($187)($192)($54)($52)($485) $31 $32 $11 $34 $51 $46 $57
(-) Estimated Tax(2)(4) 1 1(3) 28 — — — — — —
Net Income—After Tax($189)($196)($53)($51)($488) $59 $32 $11 $34 $51 $46 $57
RECONCILIATION OF UNLEVERED FREE CASH FLOW TO CASH FLOW FROM OPERATIONS
Unlevered Free Cash Flow($95)($33) $13 $9($105)($62) $16($1) $41 $52 $93 $181
(+) Capex 78 27 22 20 146 137 123 97 99 120 83 31
(+) Capitalized SG&A 6 7 6 5 23 16 16 17 17 17 17 18
(-) Interest Expense(15)(18)(10)(8)(51)(20)(23)(23)(24)(23)(19)(17)
(+/-) Other 56(15)(1)(16) 24 — — — — — — —
Cash Flow from Operations $29($32) $30 $10 $37 $71 $132 $90 $134 $167 $174 $213
4 Note: Based on Stone internal estimates. See Disclaimer page of this Presentation. See also “Long-Term Forecast – Assumptions Overview” set forth in this Appendix to this Presentation. 1Q’16 and 2Q’16 based on actuals; 3Q’16 and beyond projected based on Stone internal estimates.
|
|
PRELIMINARY DRAFT SUBJECT TO REVISION SUBJECT TO FRE408 AND CONFIDENTIALITY AGREEMENT
P R O J E C T E D I S O N
APPENDIX
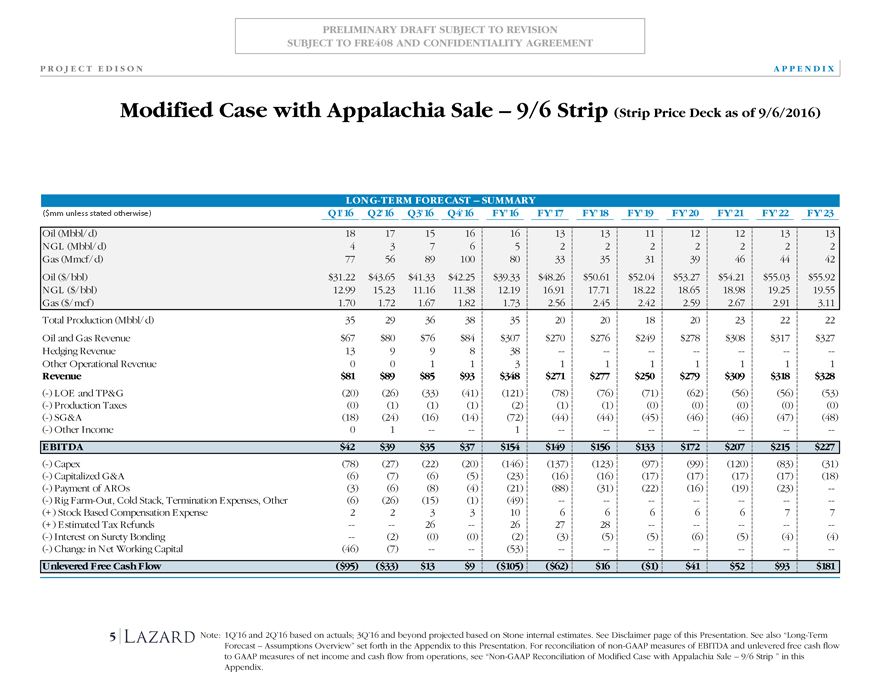
Modified Case with Appalachia Sale – 9/6 Strip (Strip Price Deck as of 9/6/2016)
LONG-TERM FORECAST – SUMMARY
($mm, unless stated otherwise) Q1’16 Q2’16 Q3’16 Q4’16 FY’16 FY’17 FY’18 FY’19 FY’20 FY’21 FY’22 FY’23
Oil (Mbbl/d) 18 17 15 16 16 13 13 11 12 12 13 13
NGL (Mbbl/d) 4 3 7 6 5 2 2 2 2 2 2 2
Gas (Mmcf/d) 77 56 89 100 80 33 35 31 39 46 44 42
Oil ($/bbl) $31.22 $43.65 $41.33 $42.25 $39.33 $48.26 $50.61 $52.04 $53.27 $54.21 $55.03 $55.92
NGL ($/bbl) 12.99 15.23 11.16 11.38 12.19 16.91 17.71 18.22 18.65 18.98 19.25 19.55
Gas ($/mcf) 1.70 1.72 1.67 1.82 1.73 2.56 2.45 2.42 2.59 2.67 2.91 3.11
Total Production (Mbbl/d) 35 29 36 38 35 20 20 18 20 23 22 22
Oil and Gas Revenue $67 $80 $76 $84 $307 $270 $276 $249 $278 $308 $317 $327
Hedging Revenue 13 9 9 8 38 -- -- -- -- -- -- --
Other Operational Revenue 0 0 1 1 3 1 1 1 1 1 1 1
Revenue $81 $89 $85 $93 $348 $271 $277 $250 $279 $309 $318 $328
(-) LOE and TP&G (20) (26) (33) (41) (121) (78) (76) (71) (62) (56) (56) (53)
(-) Production Taxes (0) (1) (1) (1) (2) (1) (1) (0) (0) (0) (0) (0)
(-) SG&A (18) (24) (16) (14) (72) (44) (44) (45) (46) (46) (47) (48)
(-) Other Income 0 1 -- -- 1 -- -- -- -- -- -- --
EBITDA $42 $39 $35 $37 $154 $149 $156 $133 $172 $207 $215 $227
(-) Capex (78) (27) (22) (20) (146) (137) (123) (97) (99) (120) (83) (31)
(-) Capitalized G&A (6) (7) (6) (5) (23) (16) (16) (17) (17) (17) (17) (18)
(-) Payment of AROs (3) (6) (8) (4) (21) (88) (31) (22) (16) (19) (23) --
(-) Rig Farm-Out, Cold Stack, Termination Expenses, Other (6) (26) (15) (1) (49) -- -- -- -- -- -- --
(+) Stock Based Compensation Expense 2 2 3 3 10 6 6 6 6 6 7 7
(+) Estimated Tax Refunds -- -- 26 -- 26 27 28 -- -- -- -- --
(-) Interest on Surety Bonding -- (2) (0) (0) (2) (3) (5) (5) (6) (5) (4) (4)
(-) Change in Net Working Capital (46) (7) -- -- (53) -- -- -- -- -- -- --
Unlevered Free Cash Flow ($95) ($33) $13 $9 ($105) ($62) $16 ($1) $41 $52 $93 $181
5 Note: 1Q’16 and 2Q’16 based on actuals; 3Q’16 and beyond projected based on Stone internal estimates. See Disclaimer page of this Presentation. See also “Long-Term Forecast –Assumptions Overview” set forth in the Appendix to this Presentation. For reconciliation of non-GAAP measures of EBITDA and unlevered free cash flow to GAAP measures of net income and cash flow from operations, see “Non-GAAP Reconciliation of Modified Case with Appalachia Sale – 9/6 Strip ” in this Appendix.
|
|
PRELIMINARY DRAFT SUBJECT TO REVISION SUBJECT TO FRE408 AND CONFIDENTIALITY AGREEMENT
P R O J E C T E D I S O N
APPENDIX
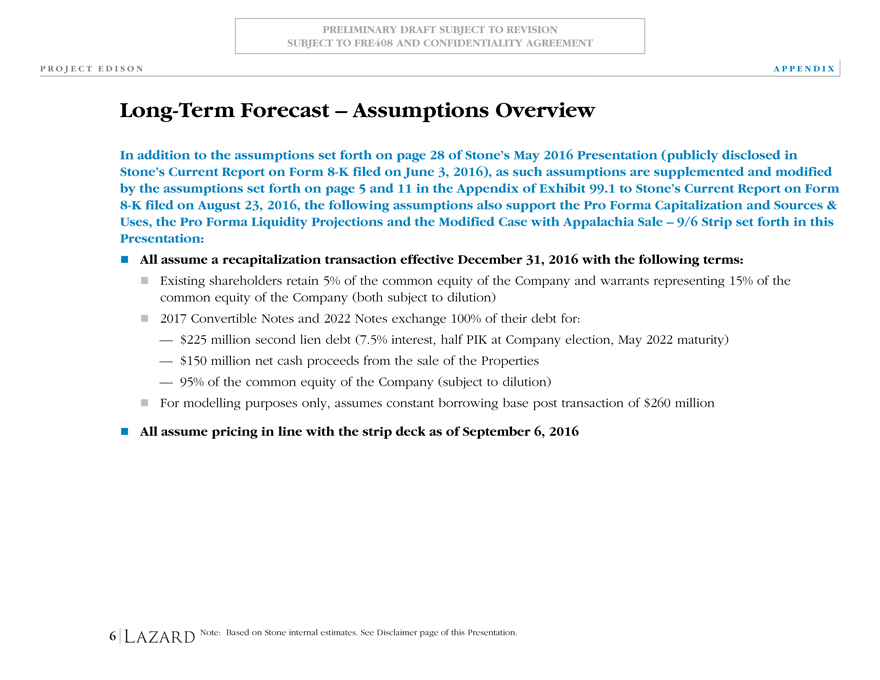
Long-Term Forecast – Assumptions Overview
In addition to the assumptions set forth on page 28 of Stone’s May 2016 Presentation (publicly disclosed in Stone’s Current Report on Form 8-K filed on June 3, 2016), as such assumptions are supplemented and modified by the assumptions set forth on page 5 and 11 in the Appendix of Exhibit 99.1 to Stone’s Current Report on Form 8-K filed on August 23, 2016, the following assumptions also support the Pro Forma Capitalization and Sources & Uses, the Pro Forma Liquidity Projections and the Modified Case with Appalachia Sale – 9/6 Strip set forth in this Presentation: All assume a recapitalization transaction effective December 31, 2016 with the following terms:
Existing shareholders retain 5% of the common equity of the Company and warrants representing 15% of the common equity of the Company (both subject to dilution) 2017 Convertible Notes and 2022 Notes exchange 100% of their debt for: $225 million second lien debt (7.5% interest, half PIK at Company election, May 2022 maturity) $150 million net cash proceeds from the sale of the Properties 95% of the common equity of the Company (subject to dilution) For modelling purposes only, assumes constant borrowing base post transaction of $260 million
All assume pricing in line with the strip deck as of September 6, 2016
| 6 |
|
Note: Based on Stone internal estimates. See Disclaimer page of this Presentation. |