Attached files
| file | filename |
|---|---|
| EX-99.3 - EX-99.3 - CITIZENS FINANCIAL GROUP INC/RI | d272290dex993.htm |
| EX-99.1 - EX-99.1 - CITIZENS FINANCIAL GROUP INC/RI | d272290dex991.htm |
| 8-K - 8-K - CITIZENS FINANCIAL GROUP INC/RI | d272290d8k.htm |
 October 21, 2016
Exhibit 99.2 3Q16 Financial Results |
 Forward-looking statements and use of key performance metrics and Non-GAAP
Financial Measures 2
This document contains forward-looking statements within the Private Securities Litigation Reform Act of 1995. Any statement that does not describe historical or current facts is a forward-looking statement. These statements often include the words “believes,” “expects,” “anticipates,” “estimates,” “intends,” “plans,” “goals,” “targets,” “initiatives,” “potentially,” “probably,” “projects,” “outlook” or similar expressions or future conditional verbs such as “may,” “will,” “should,” “would,” and “could.” Forward-looking statements are based upon the current beliefs and expectations of management, and on information currently available to management. Our statements speak as of the date hereof, and we do not assume any obligation to update these statements or to update the reasons why actual results could differ from those contained in such statements in light of new information or future events. We caution you, therefore, against relying on any of these forward-looking statements. They are neither statements of historical fact nor guarantees or assurances of future performance. While there is no assurance that any list of risks and uncertainties or risk factors is complete, important factors that could cause actual results to differ materially from those in the forward-looking statements include the following, without limitation: negative economic conditions that adversely affect the general economy, housing prices, the job market, consumer confidence and spending habits which may affect, among other things, the level of nonperforming assets, charge-offs and provision expense; the rate of growth in the economy and employment levels, as well as general business and economic conditions; our ability to implement our strategic plan, including the cost savings and efficiency components, and achieve our indicative performance targets; our ability to remedy regulatory deficiencies and meet supervisory requirements and expectations; liabilities and business restrictions resulting from litigation and regulatory investigations; our capital and liquidity requirements (including under regulatory capital standards, such as the Basel III capital standards) and our ability to generate capital internally or raise capital on favorable terms; the effect of the current low interest rate environment or changes in interest rates on our net interest income, net interest margin and our mortgage originations, mortgage servicing rights and mortgages held for sale; changes in interest rates and market liquidity, as well as the magnitude of such changes, which may reduce interest margins, impact funding sources and affect the ability to originate and distribute financial products in the primary and secondary markets; the effect of changes in the level of checking or savings account deposits on our funding costs and net interest margin; financial services reform and other current, pending or future legislation or regulation that could have a negative effect on our revenue and businesses, including the Dodd-Frank Act and other legislation and regulation relating to bank products and services; a failure in or breach of our operational or security systems or infrastructure, or those of our third party vendors or other service providers, including as a result of cyber attacks; and management’s ability to identify and manage these and other risks. In addition to the above factors, we also caution that the amount and timing of any future common stock dividends or share repurchases will depend on our financial condition, earnings, cash needs, regulatory constraints, capital requirements (including requirements of our subsidiaries), and any other factors that our board of directors deems relevant in making such a determination. Therefore, there can be no assurance that we will pay any dividends to holders of our common stock, or as to the amount of any such dividends. More information about factors that could cause actual results to differ materially from those described in the forward-looking statements can be found under “Risk Factors” in Part I, Item 1A in our Annual Report on Form 10-K for the year ended December 31, 2015, filed with the United States Securities and Exchange Commission on February 26, 2016. Key performance metrics and Non-GAAP Financial Measures Key performance metrics: Our management team uses certain key performance metrics (“KPMs”) to gauge our performance and progress over time in achieving our strategic and operational goals and also in comparing our performance against our peers. In connection with our path to becoming an independent public company, we established the following financial targets, in addition to others, as KPMs. These KPMs are utilized by our management in measuring our progress against financial goals and as a tool in helping assess performance for compensation purposes. These KPMs can largely be found in our Registration Statements on Form S-1 and our periodic reports, which are filed with the Securities and Exchange Commission, and are supplemented from time to time with additional information in connection with our quarterly earnings releases. Our key performance metrics include: Return on average tangible common equity (“ROTCE”); Return on average total tangible assets (“ROTA”); Efficiency ratio; Operating leverage; and Common equity tier 1 capital ratio (Basel III fully phased-in basis). In establishing goals for these KPMs, we determined that they would be measured on a management-reporting basis, or an operating basis, which we refer to externally as “Adjusted” results. We believe that these “Adjusted” results, which exclude restructuring charges, special items and and/or notable items, as applicable, provide the best representation of our underlying financial progress toward these goals as they exclude items that our management does not consider indicative of our on-going financial performance. We have consistently shown these metrics on this basis to investors since our initial public offering in September of 2014. Adjusted KPMs are considered Non-GAAP Financial Measures. Non-GAAP Financial Measures: This document contains Non-GAAP Financial Measures. The tables in the appendix present reconciliations of certain Non-GAAP Financial Measures. These reconciliations exclude restructuring charges, special items and/or notable items, which are included, where applicable, in the financial results presented in accordance with GAAP. Restructuring charges and special items include expenses related to our efforts to improve processes and enhance efficiencies, as well as rebranding, separation from RBS and regulatory expenses. Notable items include certain revenue or expense items that may occur in a reporting period, which management does not consider indicative of on-going financial performance. The Non-GAAP Financial Measures presented below include “noninterest income”, “total revenue”, “noninterest expense”, “pre-provision profit”, “income before income tax expense”, “income tax expense”, “net income”, “net income available to common stockholders”, “other income”, “salaries and employee benefits”, “outside services”, “occupancy”, “equipment expense”, “other operating expense”, “net income per average common share”, “return on average common equity” and “return on average total assets.” We believe these Non-GAAP Financial Measures provide useful information to investors because these are among the measures used by our management team to evaluate our operating performance and make day-to-day operating decisions. In addition, we believe restructuring charges, special items and/or notable items in any period do not reflect the operational performance of the business in that period and, accordingly, it is useful to consider these line items with and without restructuring charges, special items and/or notable items. We believe this presentation also increases comparability of period-to-period results. Other companies may use similarly titled Non-GAAP Financial Measures that are calculated differently from the way we calculate such measures. Accordingly, our Non-GAAP Financial Measures may not be comparable to similar measures used by other companies. We caution investors not to place undue reliance on such Non-GAAP Financial Measures, but instead to consider them with the most directly comparable GAAP measure. Non-GAAP Financial Measures have limitations as analytical tools and should not be considered in isolation, or as a substitute for our results as reported under GAAP. |
 Generated 7% YoY average loan growth, with strength in both commercial and
retail NII up 10% YoY and 2% QoQ
— NIM of 2.84% compared with 2.76% in 3Q15 and 2.84% in 2Q16 despite the impact of lower long-term rates
Consumer Banking initiatives – Solid deposit and loan growth, improvement in conforming mortgage volume, and strong sales force expansion, with a record 47 net mortgage loan officer hires during the quarter, as well as 11
financial consultants. CheckUp
has resulted in ~275,000 scheduled appointments YTD
Commercial Banking initiatives – Strong loan growth of 11% YoY; capital markets fees remain at near record levels with continued momentum in FX Notable items of $19 million after-tax, or $0.04 per share, largely reflecting the impact of the $72 million pre-tax TDR Transaction gain partially offset by certain other items associated with efficiency and balance sheet initiatives
3Q16 highlights 3 1) Please see important information on Key Performance Metrics and Non-GAAP Financial Measures at the end of this release for an
explanation of our use of these metrics and Non-GAAP
Financial Measures and their reconciliation to GAAP financial measures.
Adjusted results exclude restructuring charges, special items and/or notable items as applicable. 2) Current-period regulatory capital ratios are preliminary. Basel III ratios assume that certain definitions impacting qualifying Basel
III capital will phase in through 2019. Improving
profitability and
returns Strong capital, liquidity and funding Excellent credit quality and progress on risk management Continued progress on strategic growth, efficiency and balance sheet optimization initiatives Robust capital levels with a common equity tier 1 ratio of 11.3% (2) ; TBV per share of $26.20 up 2% from 2Q16 Repurchased $250 million of common shares during the quarter at an average price of $22.60 Repurchased $500 million of subordinated debt from RBS 3Q16 average deposits increased $5.7 billion, or 6% vs. 3Q15; average loan-to-deposit ratio of 98%
Provision expense of $86 million decreased $4 million from 2Q16
Overall credit quality remained broadly stable despite growth in commercial
charge-offs and NPLs largely tied to energy and
commodity-based credits Allowance to loans and leases of
1.18% vs. 1.20% in 2Q16 and 1.23% in 3Q15 reflects continued improvement in underlying credit quality Diluted EPS of $0.56 up 40% from 3Q15; Adjusted diluted EPS (1) of $0.52 up 30% from $0.40 in 3Q15 Revenue of $1.4 billion, up 14% YoY and 8% QoQ; Adjusted revenue (1) up 9% YoY and 3% QoQ Positive operating leverage YoY of 4.5% - Adjusted basis; efficiency ratio improved ~3 percentage points YoY to 63% (1) Continued progress against return target with ROTCE of 8.6% compared to 6.6% in 3Q15; Adjusted ROTCE of 8.0% (1) |
 3Q16 notable items
4 GAAP results include TDR Transaction gain partially offset by other costs associated with Asset Finance repositioning, TOP III efficiency initiatives and operational items. Gain on mortgage/home equity TDR Transaction – As part of our overall balance sheet optimization efforts, we sold $310 million of TDR assets on July 19 resulting in a pre-tax $72 million gain on sale through other income. Home equity operational items – Reflects costs related to legacy systems and operational processes in the home equity business that were identified as part of a broad review in conjunction with the TDR Transaction. Asset Finance repositioning – Represents a further initiative to optimize the efficiency of our balance sheet. A $1.2 billion lease portfolio tied to legacy RBS aircraft leasing borrowers has been placed in runoff following a review of the Asset Finance business. This portfolio of largely investment-grade client aircraft leases do not meet go-forward business model strategic and risk-adjusted return parameters, and we plan to exit these non-strategic relationships. Given recent deterioration in aircraft values, along with the impact of exiting these client relationships, we believe the underlying residual value has been impaired. These assets were designated as non-core and transferred to the Other segment. TOP III efficiency initiatives – Reflects severance and consulting costs associated with previously announced TOP III efficiency initiatives expected to provide 2017 pre-tax benefits of $90 to $110 million. 1) Pre-tax reflects $(5) million noninterest income impact and $11 million of other expense related to lease-residual impairment
tied to legacy RBS aircraft leasing borrowers moved to runoff in
non-core. 2)
Pre-tax expense reflects $11 million in salaries and benefits and $6
million in outside services associated with TOP III efficiency initiatives. $s in millions, except per share data 3Q16 notable items Pre-tax After-tax EPS impact Gain on mortgage/home equity TDR Transaction 72 $ 45 $ 0.09 $ Home equity operational items (8) $
(5) $
(0.01) $ TDR gain after impact of home equity operational items 64 $ 40 $ 0.08 $ Asset Finance repositioning (1) (16) $ (10) $ (0.02) $ TOP III efficiency initiatives (2) (17) $ (11) $ (0.02) $ Total 3Q16 notable items 31 $ 19 $ 0.04 $ |
 GAAP financial summary
5 1) Please see important information on Key Performance Metrics and Non-GAAP Financial Measures at the end of this release for an
explanation of our use of these metrics and Non- GAAP
Financial Measures and their reconciliation to GAAP financial measures. Adjusted results exclude restructuring charges, special items and/or notable items as applicable. 2) Includes held for sale. Loan-to-deposit ratio is period end. 3) Full-time equivalent employees. Linked quarter: Net income and diluted EPS both up 22%, including the impact of the TDR Transaction NII up $22 million, reflecting 1% average loan growth Noninterest income increased $80 million, driven by notable items in other income — Results reflect strength in mortgage banking fees, service charges and fees, other income and foreign exchange and letter of credit fees, partially offset by lower securities gains and a modest decrease in capital markets fees, which were in line with record second quarter levels Noninterest expense increased $40 million, driven by $36 million of notable items largely in salaries and benefits and outside services — Adjusted results (1) reflect lower salaries and benefits, more than offset by an increase in outside services and small increases across other expense categories Provision for credit losses decreased $4 million EPS of $0.56 up 22% TBV per share of $26.20 up 2% Prior-year quarter: Net income increased $77 million driven by strong business growth and the TDR Transaction; diluted EPS up 40% NII up $89 million reflecting 7% average loan growth, and an 8 bp improvement in NIM given higher loan yields Noninterest income up $82 million driven by TDR gain — Results reflect growth in mortgage banking fees, capital markets fees and service charges and fees partially offset by lower trust and investment services fees Noninterest expense up $69 million, driven by $36 million of 3Q16 notable items Provision for credit losses increased $10 million Highlights 9% 4% 18% 27% 271 bps YoY excluding 3Q16 notable items (1) 30% 142 bps 3Q16 change from $s in millions 3Q16 2Q16 3Q15 2Q16 3Q15 $ % $ % Net interest income 945 $ 923 $ 856 $ 22 $ 2 % 89 $ 10 % Noninterest income 435 355 353 80 23 82 23 Total revenue 1,380 1,278 1,209 102 8 171 14 Noninterest expense 867 827 798 40 5 69 9 Pre-provision profit 513 451 411 62 14 102 25 Provision for credit losses 86 90 76 (4) (4) 10 13 Income before income tax expense 427 361 335 66 18 92 27 Income tax expense 130 118 115 12 10 15 13 Net income 297 $ 243 $ 220 $ 54 $ 22 77 $ 35 Preferred dividends 7 $ — $ 7 $ 7 $ 100 — $ — Net income available to common stockholders 290 $ 243 $ 213 $ 47 $ 19 % 77 $ 36 % $s in billions Average interest-earning assets 131.7 $ 129.5 $ 123.0 $ 2.2 $ 2 % 8.7 $ 7 % Average deposits 106.6 $ 104.0 $ 101.0 $ 2.7 $ 3 % 5.7 $ 6 % Key performance metrics (1) Net interest margin 2.84 % 2.84 % 2.76 % — bps 8 bps Loan-to-deposit ratio (2) 97.9 98.3 96.1 (40) bps 179 bps ROACE 5.8 4.9 4.4 88 bps 142 bps ROTCE 8.6 7.3 6.6 128 bps 198 bps ROA 0.8 0.7 0.6 13 bps 17 bps ROTA 0.9 0.7 0.7 14 bps 18 bps Efficiency ratio 62.9 % 64.7 % 66.0 % (183) bps (314) bps FTEs (3) 17,625 17,828 17,817 (203) (1) % (192) (1) % Per common share Diluted earnings 0.56 $ 0.46 $ 0.40 $ 0.10 $ 22 % 0.16 $ 40 % Tangible book value (1) 26.20 $ 25.72 $ 24.52 $ 0.48 $ 2 % 1.68 $ 7 % Average diluted shares outstanding (in millions) 521.1 530.4 533.4 (9.2) (2) % (12.3) (2) % |
 6 1) Please see important information on Key Performance Metrics and Non-GAAP Financial Measures at the end of this release
for an explanation of our use of these metrics and Non-GAAP Financial
Measures and their reconciliation to GAAP financial measures.
Adjusted results exclude restructuring charges, special items and/or notable items as applicable. Highlights Linked quarter: Adjusted net income (1) increased $35 million, or 14% — Adjusted diluted EPS increased 13% (1) NII increased $22 million, or 2%, driven by loan growth, stable NIM and
an additional day in the quarter
Adjusted noninterest income
(1) increased $13 million, or 4% — Strength in mortgage banking fees, service charges and fees, other income and foreign exchange and letter of credit fees, partially offset
by lower securities gains and a modest decrease in capital markets
fees, which were in line with record second quarter levels
Adjusted noninterest expense
(1) remained relatively stable — Lower salaries and benefits modestly offset by an increase in outside services and small increases across other expense categories — Adjusted efficiency ratio improved ~140 bps (1) — FTEs down 203, reflecting the benefit of our TOP II and TOP III efficiency initiatives Provision for credit losses decreased $4 million Prior-year quarter: Adjusted net income (1) increased $58 million, or 26%, reflecting 4.5% positive operating leverage — Adjusted diluted EPS up 30% (1) NII increased $89 million, reflecting 7% average loan growth and an 8 bp improvement in NIM given higher loan yields and short-term rates Adjusted noninterest income (1) increased $15 million, or 4% — Strength in mortgage banking fees, capital markets fees and service charges and fees, partially offset by lower trust and investment services fees and other income Adjusted noninterest expense (1) up 4%, driven by a $17 million increase in salaries and employee benefits, largely reflecting merit increases and
higher incentive costs
— Adjusted efficiency ratio improved ~270 bps (1) — FTEs down 192, as our efficiency initiatives more than offset our strategic-hiring initiatives Provision for credit losses increased $10 million Adjusted financial summary (1) Adjusted 3Q16 (1) change from $s in millions 3Q16 Reported Notable Items 3Q16 Adjusted (1) Reported 2Q16 Reported 3Q15 Net interest income 945 $ - $ 945 $ 2 % 10 % Noninterest income 435 (67) 368 4 4 Total revenue 1,380 (67) 1,313 3 9 Noninterest expense 867 (36) 831 0 4 Net income available to common stockholders 290 $ (19) $ 271 $ 12 % 27 % Key performance metrics (1) ROTCE (1) 8.6 % (56) bps 8.0 % 72 bps 142 bps Efficiency ratio (1) 62.9 % 43 bps 63.3 % (140) bps (271) bps Diluted EPS 0.56 $ (0.04) $ 0.52 $ 13 % 30 % |
 Net
interest income 7
Highlights 1) Includes interest-bearing cash and due from banks and deposits in banks.
Linked quarter:
NII up $22 million, or 2%
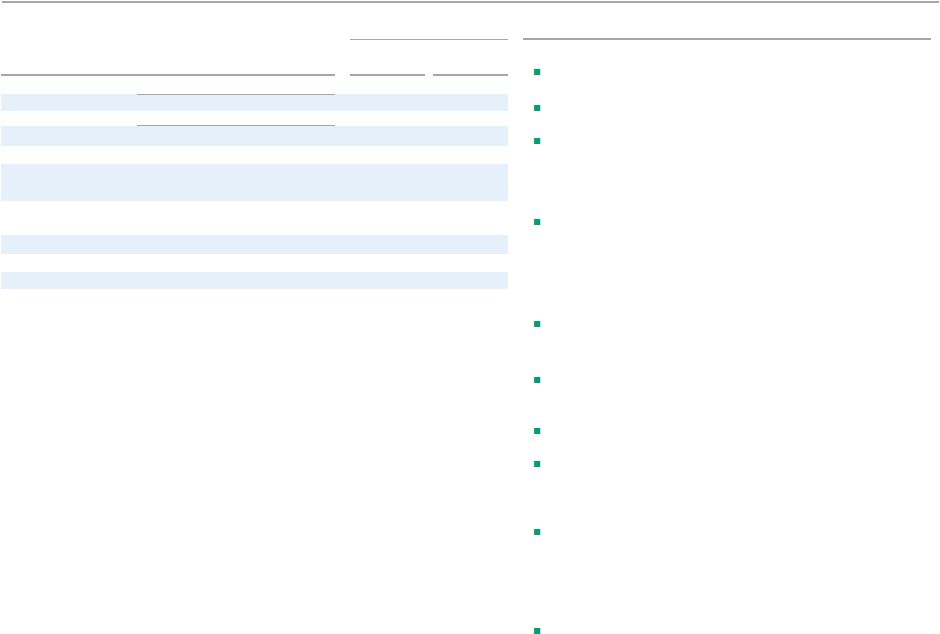
— Reflects 1% average loan growth driven by commercial, mortgage and student loans NIM of 2.84% remained stable with second quarter 2016 — Improved commercial and consumer loan yields, including the benefit of an increase in LIBOR, as well as continued improvement in portfolio mix towards higher- yielding categories — Offset by an increase in deposit costs and a reduction in investment portfolio yields Prior-year quarter: NII up $89 million, or 10%, with NIM up 8 bps — 7% average loan growth — Growth in NIM reflects the benefits of improved loan yields given continued pricing and portfolio optimization initiatives and higher short-term rates — NIM benefits were partially offset by a reduction in investment portfolio yields, which included a reduction in Federal Reserve Bank stock dividends, as well as increased borrowing costs Net interest income $s in millions, except earning assets Average interest-earning assets Average interest-earning assets Net interest income Net interest margin $s in billions 3Q15 4Q15 1Q16 2Q16 3Q16 Retail loans $51.6 $52.4 $53.2 $53.5 $54.3 Commercial loans 45.2 45.8 47.0 49.1 49.7 Investments and cash (1) 25.8 25.7 25.5 26.0 27.1 Loans held for sale 0.5 0.3 0.4 0.8 0.5 Total interest-earning assets $123.0 $124.2 $126.2 $129.5 $131.7 Loan yields 3.32% 3.34% 3.46% 3.48% 3.52% Total cost of funds 0.41% 0.41% 0.40% 0.42% 0.44% $123B $124B $126B $129B $132B $856 $870 $904 $923 $945 3Q15 4Q15 1Q16 2Q16 3Q16 2.76% 2.77% 2.86% 2.84% 2.84% |
 2.84% 2.84% 0.03% (0.01)% (0.02)% 0.00% 2Q16 NIM% Loan yields Investment portfolio yield Deposit costs Borrowing costs/other 3Q16 NIM% 2.76% 2.84% 0.16% (0.05)% (0.01)% (0.02)% 3Q15 NIM% Loan yields Investment portfolio yield Deposit costs Borrowing costs/other 3Q16 NIM% Net interest margin 8 NIM walk 3Q15 to 3Q16 NIM walk 2Q16 to 3Q16 |
 $368 $355 $353 3Q16 2Q16 3Q15 Service charges and fees Card fees Trust and inv services FX & LC fees Mortgage banking fees Capital markets fee income Securities gains (losses) Adjusted other income Noninterest income Linked quarter: Noninterest income increased $80 million, or 23%, driven by the $72 million TDR gain recorded in other income — Adjusted noninterest income (1) increased $13 million, or 4% Service charges and fees increased $2 million, driven by higher volume
and an additional day in the quarter
Card fees improved, reflecting the benefit of seasonality
Mortgage banking fees increased $8 million, largely reflecting
increased application and origination volumes and improved
secondary mix as well as higher loan sale gains and spreads
Capital markets fees were in line with record 2Q16 levels with
continued strong loan-syndications activity
FX & LC fees improved $2 million with continued momentum from
expanded capabilities
No securities gains, down $4 million
Prior-year quarter:
Noninterest income increased $82 million, or 23% driven by notable
items
— Adjusted noninterest income (1) increased $15 million, or 4% Service charges and fees increased $7 million, driven by Treasury Services’ pricing initiative and consumer household growth
Card fees were down $8 million from 3Q15 levels that exclude the
negative impact of the reclass of $8 million of card reward costs
Mortgage banking fees grew $15 million due to higher origination and
application volume and an increase in loan sale gains and
spreads Capital markets fees increased $13 million, reflecting
ongoing momentum as we continue to broaden our
capabilities Other income up $60 million from 3Q15 levels that
included an $8 million branch-sale gain, driven by the TDR
Transaction 9
Highlights 1) Please see important information on Key Performance Metrics and Non-GAAP Financial Measures at the end of this release for an
explanation of our use of these metrics and Non-GAAP
Financial Measures and their reconciliation to GAAP financial measures.
Adjusted results exclude restructuring charges, special items and/or notable items as applicable. $s in millions 3Q16 change from 3Q16 2Q16 3Q15 2Q16 3Q15 $ % $ % Service charges and fees 152 $ 150 $ 145 $ 2 $ 1 % 7 $ 5 % Card fees 52 51 60 1 2 (8) (13) Trust & investment services fees 37 38 41 (1) (3) (4) (10) Mortgage banking fees 33 25 18 8 32 15 83 Capital markets fees 34 35 21 (1) (3) 13 62 FX & LC fees 23 21 22 2 10 1 5 Securities gains, net
— 4 2 (4) (100) (2) (100) Other income 104 31 44 73 235 60 136 Reported noninterest income 435 $ 355 $ 353 $ 80 $ 23 % 82 $ 23 % Restructuring charges, special items and/or notable items (1) 67 — — 67 NM 67 NM Adjusted noninterest income (1) 368 $ 355 $ 353 $ 13 $ 4 % 15 $ 4 % Note: Other income includes bank-owned life insurance and other income. |
 Noninterest expense
10 Highlights 1) Please see important information on Key Performance Metrics and Non-GAAP Financial Measures at the end of this release for an
explanation of our use of these metrics and Non-GAAP Financial Measures and their reconciliation to GAAP financial measures. Adjusted results exclude restructuring charges, special items and/or notable
items as
applicable.
(1) (1) (1) (1) $s in millions Full-time equivalents (FTEs) 17,625 17,828 17,817 Linked quarter: Noninterest expense increased $40 million, or 5%, including $36 million of notable items — Adjusted noninterest expense (1) increased $4 million, or 0.5% Salaries and employee benefits expense was stable with 2Q16 levels and included $11 million of notable items; down 3% excluding these costs (1) — FTEs down 203 as benefits from our TOP II and TOP III efficiency initiatives continued to help fund growth in revenue-producing areas such as Mortgage, Wealth and Home Equity Outside services up $16 million from relatively low 2Q16 levels including $8 million of notable items, reflecting higher technology outsourcing expenses and costs related to consumer loan product growth Amortization of software increased $5 million, including $3 million of
notable items
Other expense increased $16 million, driven by $14 million of notable
items as well as higher FDIC insurance expense
Prior-year quarter:
Noninterest expense increased $69 million, or 9%,
driven by $36
million of notable items
— Up 4% excluding notable items (1) Salaries and employee benefits up $28 million, including $11 million of
notable items
— Adjusted salaries and benefits (1) up $17 million, largely related to growth initiatives — FTEs down 192, reflecting our efficiency initiatives, which more than offset sales force hiring Outside services increased $13 million, including $8 million of notable items — Underlying growth largely reflects higher volume related to consumer loan product growth and vendor outsourcing Amortization of software increased $11 million, including $3 million of
notable items, reflecting continued investments in applications and
infrastructure
Other expense increased $11 million, driven by $14 million of notable
items as well as higher FDIC insurance and fraud costs,
partially offset by the card reward accounting change
impact 3Q16 change from
3Q16 2Q16 3Q15 2Q16 3Q15 $ % $ % Salaries and benefits 432 $ 432 $ 404 $ — $ — % 28 $ 7 % Occupancy 78 76 75 2 3 3 4 Equipment expense 65 64 62 1 2 3 5 Outside services 102 86 89 16 19 13 15 Amortization of software 46 41 35 5 12 11 31 Other expense 144 128 133 16 13 11 8 Reported noninterest expense 867 $ 827 $ 798 $ 40 $ 5 % 69 $ 9 % Adjusted salaries and benefits (1) 421 $ 432 $ 404 $ (11) $ (3) % 17 $ 4 % Occupancy 78 76 75 2 3 3 4 Equipment expense 65 64 62 1 2 3 5 Adjusted outside services (1) 94 86 89 8 9 5 6 Adjusted amortization of software (1) 43 41 35 2 5 8 23 Adjusted other expense (1) 130 128 133 2 2 (3) (2) Adjusted noninterest expense (1) 831 $ 827 $ 798 $ 4 $ — % 33 $ 4 % $831 $827 $798 63% 65% 66% 3Q16 2Q16 3Q15 Adjusted all other Occupancy & equipment Adjusted salary and benefits Adjusted efficiency ratio |
 Consolidated average balance sheet
Linked quarter:
Total earning assets up $2.2 billion, or 2%, with loan
growth of $1.4 billion, or 1%
— Retail loans up $789 million, driven by growth in Home Mortgage and Education Finance — Commercial loans up $570 million, driven by strength in Commercial Real Estate, Mid-corporate and Industry Verticals and Franchise Finance Total deposits increased $2.7 billion on strength in Commercial money market and checking with interest deposits Borrowed funds decreased $659 million, as growth in deposits reduced reliance on short-term borrowings Prior-year quarter: Total earning assets up $8.7 billion, or 7% — Commercial loans up 10%, driven by strength in Mid-corporate and Industry Verticals, Commercial Real Estate and Franchise Finance — Retail loans up 5%, driven by strength in Education Finance and Home Mortgage, partially offset by lower Home Equity balances Total deposits up $5.7 billion, or 6%, reflecting strength in low-cost core deposits Borrowed funds increased $2.4 billion — Reflects growth in long-term senior debt and long-term FHLB borrowings, which replaced short-term borrowings, including short-term FHLB borrowings and repos, as we continue to strengthen our funding profile 11 Highlights Note: Loan portfolio trends reflect non-core portfolio impact not included in segment results on pages 12 and 13.
1) Low-cost core deposits include demand, checking with interest and regular savings.
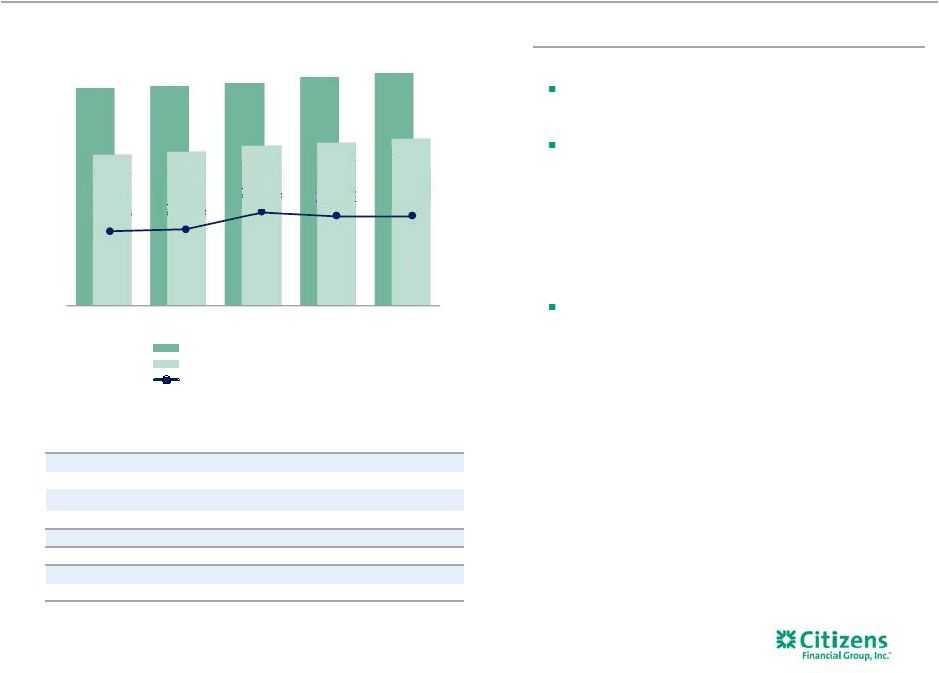
$131.7 billion Interest-earning assets $121.0 billion Deposits/borrowed funds Total Retail 41% Total Commercial 38% CRE Other Commercial Residential mortgage Total home equity Automobile Other Retail Investments and interest-bearing deposits Retail / Personal Commercial/ Municipal/ Wholesale Borrowed funds 3Q16 change from $s in billions 3Q16 2Q16 3Q15 2Q16 3Q15 $ % $ % Investments and interest bearing deposits 27.1 $ 26.0 $ 25.8 $ 1.1 $ 4 % 1.3 $ 5 % Total commercial loans 49.7 49.1 45.2 0.6 1 4.5 10 Total retail loans 54.3 53.5 51.6 0.8 1 2.7 5 Total loans and leases 104.0 102.7 96.8 1.4 1 7.2 7 Loans held for sale 0.5 0.8 0.5 (0.3) (33) 0.1 19 Total interest-earning assets 131.7 129.5 123.0 2.2 2 8.7 7 Total noninterest-earning assets 12.7 12.7 12.1 — — 0.6 5 Total assets 144.4 $ 142.2 $ 135.1 $ 2.2 $ 2 9.3 $ 7 Low-cost core deposits (1) 56.2 55.2 51.7 1.0 2 4.5 9 Money market deposits 37.6 36.2 36.5 1.4 4 1.1 3 Term deposits 12.8 12.6 12.7 0.2 2 0.1 1 Total deposits 106.6 $ 104.0 $ 101.0 $ 2.7 $ 3 5.7 $ 6 Total borrowed funds 14.4 15.0 12.0 (0.7) (4) 2.4 20 Total liabilities 124.3 $ 122.2 $ 115.6 $ 2.2 $ 2 8.7 $ 8 Total stockholders' equity 20.1 20.0 19.5 — — 0.5 3 Total liabilities and equity 144.4 $ 142.2 $ 135.1 $ 2.2 $ 2 % 9.3 $ 7 % 48% 40% 12% 8% 30% 11% 13% 11% 6% 21% |
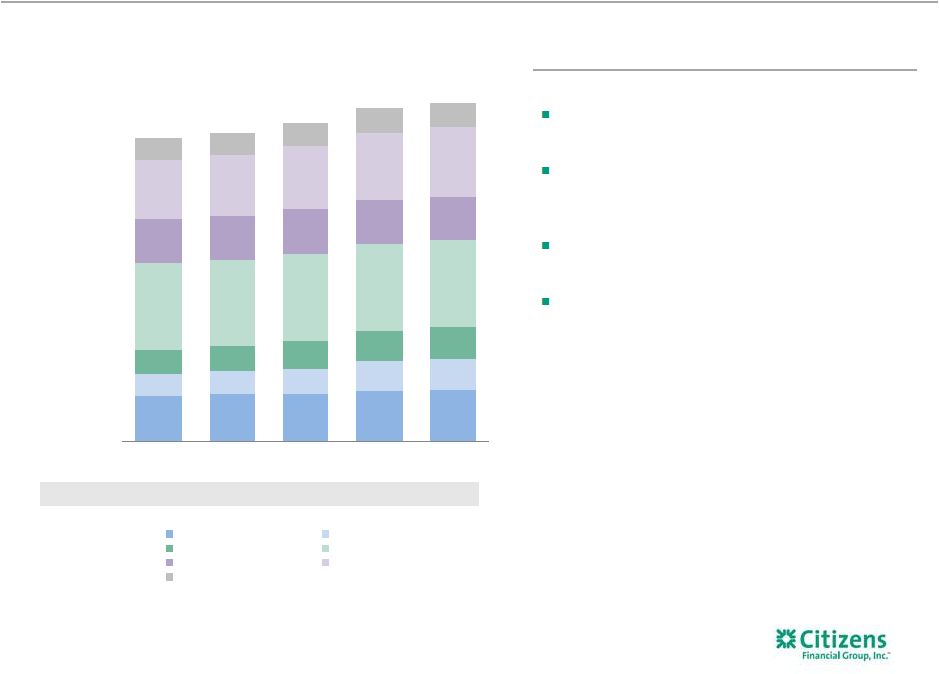
 $11.6 $12.2 $12.7 $12.9 $13.6 $17.6 $17.2 $17.0 $16.6 $16.3 $13.8 $13.8 $13.8 $14.0 $14.1 $3.2 $3.7 $4.5 $5.1 $5.5 $3.0 $3.0 $3.0 $2.9 $2.9 $2.4 $2.6 $2.5 $2.5 $2.6 $51.6B $52.5B $53.5B $54.0B $55.0B 3Q15 4Q15 1Q16 2Q16 3Q16 Mortgage Home Equity Auto Student Business Banking Other Consumer Banking average loans and leases 12 1) Other includes Credit Card, RV, Marine, Other. $s in billions Linked quarter: Average loans increased $916 million, or 2%, largely reflecting growth in higher yielding student and mortgage loans Consumer loan yields up 3 bps, reflecting the benefit of continued improvement in mix towards student and other retail Prior-year quarter: Average loans increased $3.4 billion, or 7%, driven by growth in student, mortgage, other unsecured retail and auto was partially offset by a decrease in home equity outstandings Consumer loan yields up 22 bps, reflecting initiatives to improve risk-adjusted returns, along with higher interest rates Highlights Average loans and leases (1) Yields 3.69% 3.73% 3.84% 3.88% 3.91% |
 Yields 2.57% 2.57% 2.75% 2.80% 2.82% $6.2 $6.5 $6.4 $6.9 $7.0 $3.0 $3.1 $3.5 $4.1 $4.2 $3.3 $3.5 $3.9 $4.2 $4.5 $12.0 $11.8 $11.9 $11.9 $12.0 $6.1 $6.1 $6.2 $6.1 $6.0 $8.2 $8.5 $8.7 $9.2 $9.5 $3.0 $3.0 $3.2 $3.5 $3.3 $41.8B $42.5B $43.8B $45.9B $46.5B 3Q15 4Q15 1Q16 2Q16 3Q16 Mid-corporate Industry Verticals Franchise Finance Middle Market Asset Finance Commercial Real Estate Other Commercial Banking average loans and leases Linked quarter: Average loans up $618 million, or 1%, with growth in Mid- corporate and Industry Verticals, Commercial Real Estate and Franchise Finance Loan yields improved 2 bps given higher short-term LIBOR rates Prior-year quarter: Average loans up $4.7 billion, or 11%, on strength in Mid- corporate and Industry Verticals, Franchise Finance and Commercial Real Estate Loan yields increased 25 bps, reflecting improved mix and higher rates 13 1) Other includes Business Capital, Govt, Corporate Finance, Treasury Solutions, Corporate and Commercial Banking Admin.
Highlights $s in billions Average loans and leases (1) |
 $44.6 $44.6 $44.6 $44.9 $46.4 $26.8 $27.5 $27.2 $27.5 $27.5 $16.9 $17.1 $18.0 $19.0 $20.0 $12.7 $12.2 $12.2 $12.6 $12.8 $2.9 $1.6 $0.9 $1.0 $0.9 $5.1 $5.0 $3.1 $3.7 $2.6 $4.1 $6.0 $9.9 $10.3 $10.9 $113.0B $114.0B $115.9B $119.0B $121.0B 3Q15 4Q15 1Q16 2Q16 3Q16 Money market & savings DDA Checking with interest Term deposits Total fed funds & repo Short-term borrowed funds Total long-term borrowings Deposit cost of funds 0.25% 0.24% 0.24% 0.24% 0.27% Total cost of funds 0.41% 0.41% 0.40% 0.42% 0.44% Average funding and cost of funds Linked quarter: Total average deposits up $2.7 billion Largely growth in Commercial money market and checking with interest Total deposit costs of 0.27% increased 3 bps, driven by higher incremental Commercial deposit growth and rising short-term interest rates Continued progress in repositioning liability structure to align better with peers Issued $350 million in five-year senior bank notes amid strong demand, reflecting broadening market access Prior-year quarter: Total average deposits increased $5.7 billion, or 6%, on strength across all deposit categories Total deposit costs increased 2 bps, driven by higher short-term rates, which was largely offset by continued pricing discipline Total borrowed funds cost increase reflects continued shift away from short-term funding 14 Highlights Average interest-bearing liabilities and DDA $s in billions |
 $1,201 $1,216 $1,224 $1,246 $1,240 116% 115% 113% 119% 112% 3Q15 4Q15 1Q16 2Q16 3Q16 Allowance for loan and lease losses NPL coverage ratio $5 ($3) $9 $2 $19 $66 $73 $67 $56 $59 $4 $7 $7 $7 $5 $75 $77 $83 $65 $83 0.31% 0.31% 0.33% 0.25% 0.32% 3Q15 4Q15 1Q16 2Q16 3Q16 Commercial Retail SBO Net c/o ratio $75 $77 $83 $65 $83 $76 $91 $91 $90 $86 $1.0B $1.1B $1.1B $1.0B $1.1B 3Q15 4Q15 1Q16 2Q16 3Q16 Net charge-offs Provision for credit losses 1.23% 1.23% 1.21% 1.20% 1.18% Allowance to loan coverage ratio Overall credit quality remained broadly stable despite growth in commercial charge-
offs and NPLs largely tied to energy and commodity-based credits
Net charge-offs of $83 million, or 0.32% of average loans
and leases, increased $18 million from 2Q16
Commercial net charge-offs of $19 million increased $17 million from 2Q16,
driven by a $16 million increase tied to the energy
sector Retail net charge-offs of $64 million remained
relatively stable despite a $9 million increase in auto largely
reflecting seasonality NPLs to total loans and leases of 1.05%
compared with 1.01% in 2Q16 and 1.06% in 3Q15 NPLs increased $63
million, driven by a $49 million increase in commercial related to
energy and commodity-
based credits. Retail NPLs were up $14 million, including a $9
million increase in auto tied to a refinement of our return-to-accrual
program methodology
Provision for credit losses of $86 million decreased $4 million, as continued
improvement in underlying credit quality offset reserves tied to
loan growth Allowance to total loans and leases of 1.18% compares
with 1.20% in 2Q16 and 1.23% in 3Q15
Strong credit-quality trends
continue 15
Highlights 1) Allowance for loan and lease losses to nonperforming loans and leases. $s in millions Net charge-offs (recoveries) NPLs to loans and leases NPLs (1) 1.06% 1.07% 1.07% 1.01% 1.05% Provision for credit losses, charge-offs, NPLs Allowance for loan and lease losses |
 as of $s in billions (period-end) 3Q15 4Q15 1Q16 2Q16 3Q16 Basel III transitional basis (1,2) Common equity tier 1 capital 13.2 $ 13.4 $ 13.6 $ 13.8 $ 13.8 $ Risk-weighted assets 112.3 $ 114.1 $ 116.6 $ 119.5 $ 121.6 $ Common equity tier 1 ratio 11.8 % 11.7 % 11.6 % 11.5 % 11.3 % Total capital ratio 15.4 % 15.3 % 15.1 % 14.9 % 14.2 % Basel III fully phased-in (1,3) Common equity tier 1 ratio 11.7% 11.7% 11.6% 11.5% 11.3% 15.4% 15.3% 15.1% 14.9% 14.2% 11.8% 11.7% 11.6% 11.5% 11.3% 3Q15 4Q15 1Q16 2Q16 3Q16 Total capital ratio Common equity tier 1 ratio 96% 97% 99% 98% 98% 3Q15 4Q15 1Q16 2Q16 3Q16 Capital and liquidity remain strong 16 Highlights 1) Current-reporting period regulatory capital ratios are preliminary. 2) Basel III ratios assume that certain definitions impacting qualifying Basel III capital will phase in through 2019. Ratios also reflect
the required U.S. Standardized methodology for calculating RWAs,
effective January 1, 2015. 3)
Please see important information on Key Performance Metrics and Non-GAAP
Financial Measures at the end of this release for an explanation of our use of these metrics and Non- GAAP Financial Measures and their reconciliation to GAAP financial measures.
4) Based on the September 2014 release of the U.S. version of the Liquidity Coverage Ratio (LCR). Note that as a modified LCR company,
CFG’s minimal LCR requirement of 90% began January
2016. 5)
Period end includes held for sale.
Capital levels remain above regional peers
3Q16 Basel III common equity tier 1 ratio (transitional
basis) down approximately 20 basis points from 2Q16
Net income: ~25 bps increase
RWA growth: ~19 bps decrease
Dividends, buybacks and other: ~26 bps decrease
LDR of 98% stable with 2Q16
Fully compliant with LCR requirement (4) Issued $350 million in senior unsecured holding company notes and repurchased $500 million subordinated notes from RBS 2016 CCAR plan reflects continued commitment towards prudent return of capital with $690 million in share repurchases Repurchased $250 million, or 11.1 million common shares, during the quarter at an average price of $22.60 Loan-to-deposit ratio (5) Capital ratio trend (1,2) (1,2) |
 Summary of progress on strategic initiatives
1) Thomson Reuters LPC, 2Q16 data as of 9/30/16 based on number of deals for
Overall Middle Market (defined as Borrower Revenues <$500MM
and Deal Size <$500MM). 1) Thomson Reuters LPC, 2Q16 data as
of 9/30/16 based on number of deals for Overall Middle Market (defined as Borrower Revenues <$500MM and Deal Size <$500MM). 17 Initiative 3Q16 Status Commentary Reenergize household growth Retail checking and primary HHs both up QoQ. Deposits up 2% vs. prior year quarter and services charges up 3%.
Continued expansion of Citizens Check-up to help deliver needs-based
solutions to our customers. Expand mortgage sales force
Application and origination volumes up 44% and 40% YoY. Operations continue to
improve. Conforming mix up QoQ.
Operational enhancements have strengthened our ability to grow LOs – up a record 47 QoQ to 495. Optimize Auto Selectively raising price to moderate origination volumes; origination spread up 46 bps YoY. Removed the lowest- performing ~10% of dealer network as we continue to optimize returns in the business.
Grow Student/Installment Credit
Sustained momentum in Student with total loan balances up 71% from 3Q15 driven
by continued steady growth with ERL and iPhone upgrade program
(iUp). Expand Business Banking
Increasing focus on deposits, cash management, and other fee income streams,
with deposits up 5% and deposit fees up 5% compared to 3Q15.
Re-aligned salesforce to capture additional market opportunity.
Expand Wealth sales force
Financial consultants up 14% YoY to 350. Total investment sales volume increased YoY and QoQ driven by increase in fee-based sales; however, revenue growth impacted by mix shift.
Build out Mid-Corp & verticals
Overall loan growth of over 20% YoY, driven by Healthcare and Technology
verticals. Mid-Corp & verticals fee income is up $5
million YoY as of Sep
YTD, driven by a 15% increase in cash management and a 12% increase in
loan fees.
Continue development of Capital
and Global Markets activities
Fee income up 44% YoY, with strong growth from debt syndications and bond transactions, up $10 million and $4 million, respectively, YoY. Middle Market bookrunner rank improved YoY from # 8 to #5 (1) . Build out Treasury Solutions Fees up 10% vs. 3Q15 led by strength in cash management, commercial card (traditional and ePayables), trade services and merchant services. Strategy is focused on enhancing our offering and value proposition. Grow Franchise Finance Franchise lending continues to exhibit strong growth with balances up 23% YoY and 8% QoQ. Particularly strong
quarterly growth in General Restaurant segment of 13%. Added 13 new
clients in 3Q. Expand Middle Market
Loan balances relatively flat QoQ, yet origination volumes up QoQ and YoY. Deposits up over $600 million, or 9%, and fee income up 25% versus prior year quarter driven by initiatives to deepen relationships with customers. Grow CRE Continue to deepen client penetration with top developers in core geographies, while moderating growth in a number of select areas. CRE loans up 16% YoY to $9.5 billion. Reposition Asset Finance Continue to re-position business as a product post RBS separation into core Commercial segments for enhanced
client acquisition, spread, and fee income opportunities. As part of re-positioning, transferred $1.2 billion in non- core large RBS aircraft exposures to runoff portfolio. Balance Sheet Optimization Continued strong execution of balance sheet strategies delivered stable NIM, as increased pricing and shift to higher returning portfolios were partially offset by slightly higher deposit costs.
Top II TOP II Program remains on target and is tracking to deliver $95-$100 million of P&L benefit in 2016.
Top III TOP III Program underway and on track to meet end of 2017 run-rate benefit of $90-$110 million.
|
 TOP II Program TOP II Program TOP III Program TOP III Program Revenue initiatives Target ~$50-$65 million Citizens Checkup: Launched with over 175k customer
appointments kept to-date; customer satisfaction has been
positive with 78% very to completely satisfied
Consumer Retention: Initiative underway and showing strength in deposit retention; successful platinum launch driving retention with the Mass Affluent customer segment Middle Market Share of Wallet: Opportunity pipeline remains
~2X larger than historical levels
(1) leading to stronger capital markets penetration Commercial Pricing: Re-priced 12,000 cash management
accounts; improved loan pricing discipline and increased lending
revenue by 12% and improved IRP spreads
(2) Revenue initiatives Target ~$50-$65 million Citizens Checkup: Launched with over 175k customer
appointments kept to-date; customer satisfaction has been
positive with 78% very to completely satisfied
Consumer Retention: Initiative underway and showing strength in deposit retention; successful platinum launch driving retention with the Mass Affluent customer segment Middle Market Share of Wallet: Opportunity pipeline remains
~2X larger than historical levels
(1) leading to stronger capital markets penetration Commercial Pricing: Re-priced 12,000 cash management
accounts; improved loan pricing discipline and increased lending
revenue by 12% and improved IRP spreads
(2) Expense initiatives Target ~$40-$50 million Operations Transformation: Streamlining of organization
complete; focused on next wave of opportunities
Supply Chain Services: 2016 run-rate savings achieved driven
by reduction in external resources and tightening of internal
travel and office supplies policies
Expense initiatives
Target ~$40-$50 million
Operations Transformation: Streamlining of
organization complete; focused on next wave of
opportunities Supply Chain
Services: 2016 run-rate savings achieved driven
by reduction in external resources and tightening of
internal travel and office supplies policies
Revenue initiatives
Target ~$22-$30 million
Commercial Attrition: Predicative tool in now in the hands of our RMs that identifies at risk clients and allows them to proactively develop retention plans for those clients Unsecured Lending: Initiative launched with good initial
customer responses; early read on performance is positive
Business Banking Share of
Wallet: Realignment of
sale force complete; executing on plans to deepen
relationships Revenue initiatives
Target ~$22-$30 million
Commercial Attrition: Predicative tool in now in the hands of our RMs that identifies at risk clients and allows them to proactively develop retention plans for those clients Unsecured Lending: Initiative launched with good initial
customer responses; early read on performance is positive
Business Banking Share of
Wallet: Realignment of
sale force complete; executing on plans to deepen
relationships Expense initiatives
Target ~$51-$60 million
Consumer Efficiencies: First phase of
streamlining non-revenue staff is complete; focus on branch optimization and efficiencies in the mortgage business Commercial Efficiencies: Streamlining end-to-end processing and portfolio management; actions are largely complete Functional Efficiencies: Good progress on reengineering
processes; streamlining forecasting and reporting in
finance and recruiting and training in HR
Fraud: Project underway; initial focus on improving algorithms and enhancing chargeback processes Expense initiatives Target ~$51-$60 million Consumer Efficiencies: First phase of streamlining
non-revenue staff is complete; focus on branch optimization and efficiencies in the mortgage business Commercial Efficiencies: Streamlining end-to-end processing and portfolio management; actions are largely complete Functional Efficiencies: Good progress on reengineering
processes; streamlining forecasting and reporting in
finance and recruiting and training in HR
Fraud: Project underway; initial focus on improving algorithms and enhancing chargeback processes Tax efficiencies Target ~$17-$20 million (3) Tax-Rate Optimization: Aligning tax rate to peer levels
beginning to see benefit in 3Q16; seeing strength in investment
and historic tax credits
Tax efficiencies
Target ~$17-$20 million
(3) Tax-Rate Optimization: Aligning tax rate to peer levels
beginning to see benefit in 3Q16; seeing strength in investment
and historic tax credits
Launched mid 2015 —
On track to deliver
$95-$100 million annual pre-tax benefit by end of 2016
Launched mid 2016 —
Targeted run-rate
benefit of $90-$110 million by end of 2017
18 Tapping Our Potential (TOP) programs remain on track Self funding necessary investments through our efficiency initiatives 1) Represents opportunities per product specialist as of April 2016 vs. March 2015.
2) Improved lending revenue and IRP (interest-rate product s) pricing on In-scope deals which exclude syndicated transactions
and select franchise finance customers. 3)
$17-$20 million pre-tax benefit; Noninterest income impact ($20) to
($25) million; tax expense benefit of $30 to $40 million. |
 4Q16 outlook (1) 19 Net interest income, net interest margin Noninterest expense Credit trends, tax rate ~1.5-2.0% loan growth Net interest margin relatively stable Modest increase Committed to YoY operating leverage goals Broad credit trends remain favorable Provision expense up modestly Tax rate of ~31.5% 4Q16 expectations vs. 3Q16 Adjusted (1) Capital, liquidity and funding Quarter-end Basel III common equity tier 1 ratio ~11.2% Loan-to-deposit ratio of ~99% Noninterest income Relatively stable 1) Please see important information on Key Performance Metrics and Non-GAAP Financial Measures at the end of this release for an
explanation of our use of these metrics and Non- GAAP
Financial Measures and their reconciliation to GAAP financial measures. Adjusted results exclude restructuring charges, special items and/or notable items as applicable. |
 Key messages 20 Citizens once again delivered strong results in 3Q16 Financial results continue to improve and meet expectations. Strong EPS growth, robust operating leverage,
improving efficiency ratio, active capital management
Adjusted ROTCE of 8% up from 4.3% three years ago in 3Q13. 3.7% improvement with no rate benefit (1) Delivering against strategic initiatives with strong growth in Capital Markets and improving results in
Mortgage Banking
Continued execution on balance sheet optimization strategies providing
underlying strength and momentum NIM performing well in
challenging environment Prudent loan growth, TDR sale completed,
RBS-linked aircraft leases to runoff Tangible book value per
share continues to grow; $26.20 at quarter end, up 2% from 2Q16
Will continue to stay focused on execution of turnaround plan
Well positioned as we enter 4Q16
Key to financial results is to grow the balance sheet smartly with continued
focus on building out fee businesses and delivering positive
operating leverage Capital and credit position remain
strong Peer leading CET1 ratio permits both strong loan growth
and returns to shareholders Commenced open market share
repurchase program; previous repurchases from RBS 1)
Please see important information on Key Performance Metrics and Non-GAAP
Financial Measures at the end of this release for an explanation of our use of these metrics and Non- GAAP Financial Measures and their reconciliation to GAAP financial measures. Adjusted results exclude restructuring charges, special
items and/or notable items as applicable. |
 Appendix 21 |
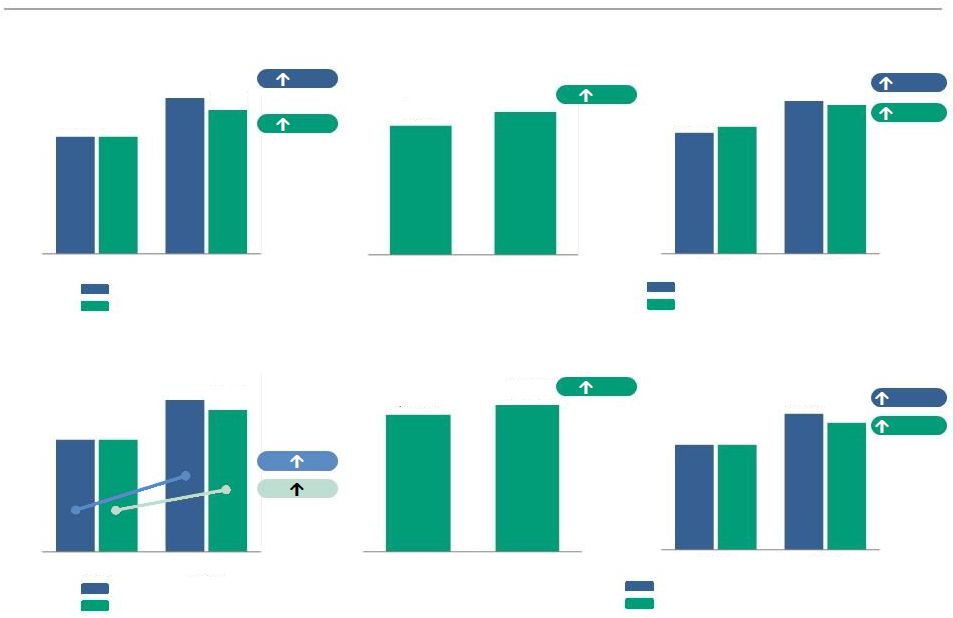
 Linked-quarter results
22 Period-end loans $s in billions (2) 2% 2% 14% 7% Net income and EPS $s in millions, except per share data Equity return metrics Period-end deposits $s in billions (1) GAAP results Adjusted results (1) Return on average total assets Adjusted return on average total tangible assets (1) Return on average tangible common equity Adjusted return on average tangible common equity EPS 22% EPS 13% 13 bps 8 bps 128 bps 72 bps Asset return metrics $0.46 $0.46 $0.56 1) Please see important information on Key Performance Metrics and Non-GAAP Financial Measures at the end of this release for an
explanation of our use of these metrics and Non-GAAP Financial Measures and their reconciliation to GAAP financial measures. Adjusted results exclude restructuring charges, special items and/or notable
items as
applicable. 2) Excludes loans held for sale. Pre-provision profit $s in millions (1) GAAP results Adjusted results (1) $451 $513 $451 $482 2Q16 3Q16 $103.6 $105.5 2Q16 3Q16 0.69% 0.82% 0.72% 0.80% 2Q16 3Q16 $106.3 $108.3 2Q16 3Q16 7.3% 8.6% 7.3% 8.0% 2Q16 3Q16 $243 $297 $243 $278 2Q16 3Q16 $0.52 |
 Quarter-over-quarter results
23 Pre-provision profit $s in millions Asset return metrics Net income and EPS $s in millions, except per share data Equity return metrics 25% Period-end loans $s in billions Period-end deposits $s in billions (2) (1) 8% 6% 17% GAAP results Adjusted results (1) GAAP results Adjusted results $0.40 $0.40 $0.56 $0.52 (1) Return on average total assets Adjusted return on average total tangible assets EPS 40% EPS 30% 17 bps 12 bps 198 bps 142 bps 1) Please see important information on Key Performance Metrics and Non-GAAP Financial Measures at the end of this release for an
explanation of our use of these metrics and Non-GAAP Financial Measures and their reconciliation to GAAP financial measures. Adjusted results exclude restructuring charges, special items and/or notable
items as
applicable. 2) Excludes loans held for sale. (1) Return on average tangible common equity Adjusted return on average tangible common equity (1) $411 $513 $411 $482 3Q15 3Q16 $97.4 $105.5 3Q15 3Q16 0.65% 0.82% 0.68% 0.80% 3Q15 3Q16 $220 $297 $220 $278 3Q15 3Q16 $101.9 $108.3 3Q15 3Q16 6.6% 8.6% 6.6% 8.0% 3Q15 3Q16 |
 Consumer Banking segment
24 1) Please see important information on Key Performance Metrics and Non-GAAP Financial Measures at the end of this release for an
explanation of our use of these metrics and Non-GAAP
Financial Measures and their reconciliation to GAAP financial measures. Adjusted results exclude restructuring charges, special items and/or notable items as applicable. 2) Includes held for sale. 3) Operating segments are allocated capital on a risk-adjusted basis considering economic and regulatory capital requirements. We
approximate that regulatory capital is equivalent to a
sustainable target level for tier 1 common equity and then allocate that approximation to the segments based on economic capital. Highlights Linked quarter: Net income up $2 million, or 2% Net interest income up $19 million, or 3%, led by higher mortgage and student balances and improved loan yields. Average loans up 2% with deposits largely stable Noninterest income increased $10 million, or 5%, driven by $8 million in higher mortgage banking fees and an increase in service charges and fees — Mortgage banking fees reflect the benefit of higher application and origination volumes with improved secondary mix and increased loan sales and spreads Noninterest expense increased $18 million, or 3%, as a decrease in salaries and benefits was more than offset by higher outside services expense and $7 million of home equity systems and operational costs as well as higher fraud losses and other operational costs Provision for credit losses up $8 million from lower 2Q16 levels Prior-year quarter: Net income up $24 million, or 35% Net interest income up $65 million, driven by an increase in student, mortgage, consumer unsecured and auto loans as well as improved loan and deposit spreads Average loans up $3.5 billion and average deposits up $1.6 billion Noninterest expense increased $27 million, or 4%, driven by continued investments to drive growth Provision for credit losses decreased $7 million, reflecting a reduction in net charge-offs in home equity 3Q16 change from $s in millions 3Q16 2Q16 3Q15 2Q16 3Q15 $ % $ % Net interest income 621 $ 602 $ 556 $ 19 $ 3 % 65 $ 12 % Noninterest income 229 219 235 10 5 (6) (3) Total revenue 850 821 791 29 4 59 7 Noninterest expense 650 632 623 18 3 27 4 Pre-provision profit 200 189 168 11 6 32 19 Provision for credit losses 57 49 64 8 16 (7) (11) Income before income tax expense 143 140 104 3 2 39 38 Income tax expense 51 50 36 1 2 15 42 Net income 92 $ 90 $ 68 $ 2 $
2 % 24 $ 35 % Average balances $s in billions Total loans and leases (2) 55.4 $ 54.4 $ 51.9 $ 1.0 $ 2 % 3.5 $ 7 % Total deposits 72.1 $ 71.9 $ 70.5 $ 0.3 $ — % 1.6 $ 2 % Mortgage Banking metrics Originations 2,187 $ 1,964 $ 1,561 $ 223 $ 11 % 626 $ 40 % Origination Pipeline 2,835 2,528 2,152 307 12 % 683 32 % Gain on sale of secondary originations 2.77% 2.42% 1.80% 35 bps 97 bps Key performance metrics ROTCE (1,3) 7.0% 7.1% 5.7% (5) bps 137 bps Efficiency ratio (1) 76% 77% 79% (52) bps (226) bps |
 Commercial Banking segment
25 1) Please see important information on Key Performance Metrics and Non-GAAP Financial Measures at the end of this release for an
explanation of our use of these metrics and Non-GAAP
Financial Measures and their reconciliation to GAAP financial measures. Adjusted results exclude restructuring charges, special items and/or notable items as applicable.
2) Includes held for sale. 3) Operating segments are allocated capital on a risk-adjusted basis considering economic and regulatory capital requirements. We
approximate that regulatory capital is equivalent to a
sustainable target level for tier 1 common equity and then allocate that approximation to the segments based on economic capital. Highlights Linked quarter: Commercial Banking net income remained relatively stable Total revenue increased 3% with solid improvement in net interest income largely related to loan and deposit growth and the benefit of an increase in LIBOR Average loans up $538 million; deposits up $2.7 billion — Loan growth driven by strength in Franchise Finance, Commercial Real Estate and Mid-corporate and Industry Verticals Noninterest income remained relatively stable, as modest growth in service charges and fees, interest-rate products and foreign exchange fees was offset by a slight decrease in capital markets fees from record second quarter levels and lower leasing income Noninterest expense decreased $5 million, reflecting seasonally lower salaries and benefits and the impact of efficiency initiatives and lower regulatory costs, partially offset by higher FDIC insurance expense Provision for credit losses increased $20 million, driven by higher net charge-offs in the energy portfolio Prior-year quarter: Net income increased $17 million, or 12% Net interest income was up $28 million, reflecting a $4.6 billion increase in average loans and leases, improved deposit spreads and a $3.2 billion increase in average deposits Noninterest income increased $23 million, reflecting strength in capital markets, service charges and fees, (including the benefit of Treasury Solutions’ pricing initiatives) and interest rate products
Noninterest expense increased $6 million, as increased salaries and
employee benefits, FDIC insurance expense and amortization of
software were partially offset by lower outside services
costs. Provision for credit losses increased $16 million on
losses in the energy portfolio
3Q16 change from
$s in millions 3Q16 2Q16 3Q15 2Q16 3Q15 $ % $ % Net interest income 327 $ 314 $ 299 $ 13 $ 4 % 28 $ 9 % Noninterest income 123 122 100 1 1 23 23 Total revenue 450 436 399 14 3 51 13 Noninterest expense 181 186 175 (5) (3) 6 3 Pre-provision profit 269 250 224 19 8 45 20 Provision for credit losses 19 (1) 3 20 NM 16 NM Income before income tax expense 250 251 221 (1) — 29 13 Income tax expense 88 87 76 1 1 12 16 Net income 162 $ 164 $ 145 $ (2) $ (1) % 17 $ 12 % Average balances $s in billions Total loans and leases (2) 46.6 $ 46.1 $ 42.0 $ 0.5 $ 1 % 4.6 $ 11 % Total deposits 27.8 $ 25.1 $ 24.6 $ 2.7 $ 11 % 3.2 $ 13 % Key performance metrics ROTCE (1,3) 12.5% 13.0% 12.2% (54) bps 26 bps Efficiency ratio (1) 40% 43% 44% (267) bps (354) bps |
 Other 26 Linked quarter: Other recorded net income of $43 million compared to a net loss of $11 million. The increase was largely driven by the net impact of notable items (1) of $15 million and a $32 million reduction in provision for credit losses Net interest income of negative $3 million decreased $10 million from second quarter 2016, largely reflecting higher borrowing costs related to term-debt issuance and lower residual funds transfer pricing Noninterest income of $83 million increased $69 million from second quarter 2016, largely reflecting the TDR Transaction gain Noninterest expense increased $27 million, driven by the impact of notable items (1) Provision for credit losses of $10 million decreased $32 million from second quarter 2016, which reflects a $3 million reserve build compared with a $25 million reserve build in second quarter 2016 — Provision expense also reflects continued reduction in non-core charge-offs Prior-year quarter: Other net income in third quarter 2016 increased $36 million from third quarter 2015, driven by the net impact of notable items (1) and income tax benefit Net interest income decreased $4 million Noninterest income increased $65 million Noninterest expense up $36 million from 3Q15, driven by the impact of notable items (1) Provision for credit losses up $1 million Highlights 1) Please see important information on Key Performance Metrics and Non-GAAP Financial Measures at the end of this release for an
explanation of our use of these metrics and Non-GAAP
Financial Measures and their reconciliation to GAAP financial measures. Adjusted results exclude restructuring charges, special items and/or notable items as applicable.
3Q16 change from
$s in millions 3Q16 2Q16 3Q15 2Q16 3Q15 $ % $ % Net interest income (3) $ 7 $ 1 $ (10) $ (143) % (4) $ NM % Noninterest income 83 14 18 69 NM 65 NM Total revenue 80 21 19 59 NM 61 NM Noninterest expense 36 9 — 27 NM 36 100 Pre-provision profit (loss) 44 12 19 32 NM 25 132 Provision for credit losses 10 42 9 (32) (76) 1 11 Income (loss) before income tax expense (benefit) 34 (30) 10 64 NM 24 NM Income tax expense (benefit) (9) (19) 3 10 53 (12) NM Net income (loss) 43 $ (11) $ 7 $ 54 $ NM % 36 $ NM % Average balances $s in billions Total loans and leases 2.6 $ 3.1 $ 3.4 $ (0.5) $ (15) % (0.8) $ (23) % Total deposits 6.7 $ 7.0 $ 5.9 $ (0.3) $ (5) % 0.8 $ 14 % |
 $s in millions
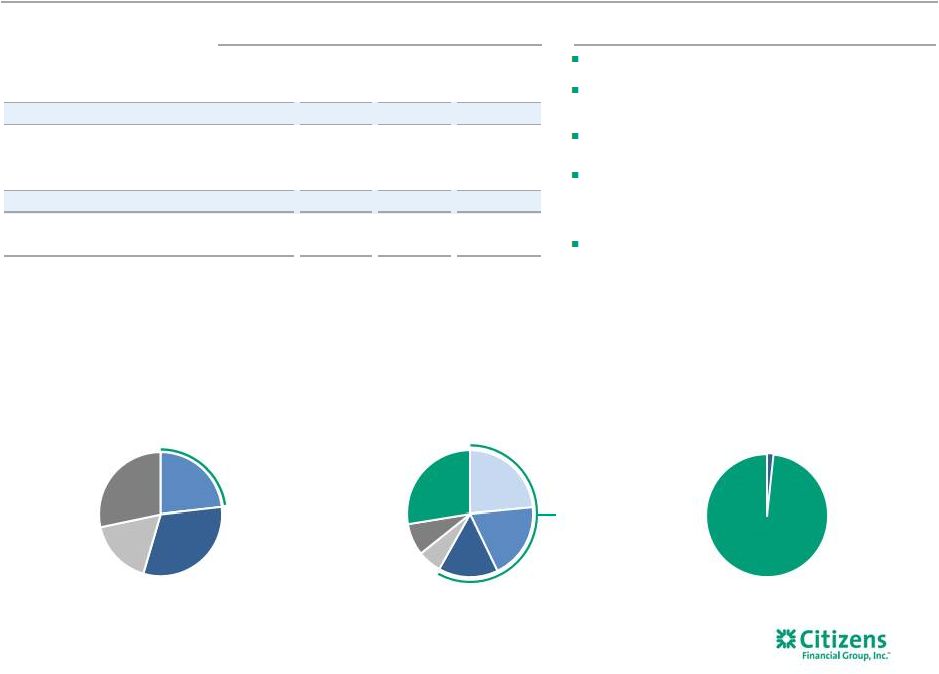
Total O/S Utilized % Criticized % Nonaccrual status Less price-sensitive total 743 $ 62% 2% - $ Upstream 272 72% Oilfield Services 336 74% Reserve-based lending (RBL) 410 64% More price-sensitive total 1,019 69% 57% 193 Total Oil & Gas 1,762 $ 66% 34% 193 $ Total Oil & Gas ex. Aircraft 1,432 $ 61% 42% 193 $ B- and lower Oil & Gas portfolio overview 27 Highlights Total loans outstanding Oil & Gas All other loans BBB+ to BBB- BB+ to BB- B+ to B 23% investment grade ~$1.0 billion more sensitive to declining oil prices Midstream Integrated Downstream Reserve-based lending (RBL) Upstream, Non-RBL Oil Field Services Oil & Gas portfolio by Sub-sector Oil & Gas portfolio by Investment grade-equivalent risk rating 3Q16 Oil & Gas outstandings (1) Well-diversified portfolio with ~100 clients Includes $330 million of corporate aircraft leases arising from Asset Finance Nonperforming loans down $3 million largely due to pay downs on RBL portfolio Existing RBL commitments declined by 2% due to 3Q16 borrowing base redeterminations and restructuring activity; a new credit extension of ~$50 million partially offset these reductions Oil and gas portfolio loan loss reserves of $63 million as of 9/30/16 — Reserves to total loans of more price-sensitive portfolios now at 7.1% (3) , up from 6.3% in 1Q16 1) Includes Downstream, Integrated and Midstream sub-categories. 2) Portfolio balances, risk rating and industry sector stratifications as of September 30, 2016.
3) Reserves/(More price-sensitive Oil & Gas portfolio outstandings -
leases secured by aircraft ($131 million)).
23% 31% 17% 28% 24% 19% 15% 6% 8% 28% 98.3% 1.7% (2) (2) (2) |
 Key performance metrics, Non-GAAP Financial Measures and reconciliations
28
(Adjusted excluding restructuring charges, special items and/or notable
items) $s in millions, except per share data
3Q16 2Q16 1Q16 4Q15 3Q15 2016 2015 $ % $ % $ % Noninterest income, adjusted: Noninterest income (GAAP) $435 $355 $330 $362 $353 $80 23 % $82 23 % $1,120 $1,060 $60 6 % Less: Special items — — — — — — — — — — — — — Less: Notable items 67 — — — — 67 100 67 100 67 — 67 100 Noninterest income, adjusted (non-GAAP) $368 $355 $330 $362 $353 $13 4 % $15 4 % $1,053 $1,060 ($7) (1%) Total revenue, adjusted: Total revenue (GAAP) A $1,380 $1,278 $1,234 $1,232 $1,209 $102 8 % $171 14 % $3,892 $3,592 $300 8 % Less: Special items — — — — — — — — — — — — — Less: Notable items 67 — — — — 67 100 67 100 67 — 67 100 Total revenue, adjusted (non-GAAP) B $1,313 $1,278 $1,234 $1,232 $1,209 $35 3 % $104 9 % $3,825 $3,592 $233 6 % Noninterest expense, adjusted: Noninterest expense (GAAP) C $867 $827 $811 $810 $798 $40 5 % $69 9 % $2,505 $2,449 $56 2 % Less: Restructuring charges and special items — — — — — — — — — — 50 (50) (100) Less: Notable items 36 — — — — 36 100 36 100 36 — 36 100 Noninterest expense, adjusted (non-GAAP) D $831 $827 $811 $810 $798 $4 —% $33 4 % $2,469 $2,399 $70 3 % Pre-provision profit, adjusted: Total revenue, adjusted (non-GAAP) $1,313 $1,278 $1,234 $1,232 $1,209 $35 3 % $104 9 % $3,825 $3,592 $233 6 % Less: Noninterest expense, adjusted (non-GAAP) 831 827 811 810 798 4 — 33 4 2,469 2,399 70 3 Pre-provision profit, adjusted (non-GAAP) $482 $451 $423 $422 $411 $31 7 % $71 17 % $1,356 $1,193 $163 14 % Income before income tax expense, adjusted: Income before income tax expense (GAAP) $427 $361 $332 $331 $335 $66 18 % $92 27 % $1,120 $932 $188 20 % Less: Income before income tax expense (benefit) related to restructuring
charges and special items
— — — — — — — — — — (50) 50 100 Less: Income before income tax expense (benefit) related to notable items
31 — — — — 31 100 31 100 31 — 31 100 Income before income tax expense, adjusted (non-GAAP) $396 $361 $332 $331 $335 $35 10 % $61 18 % $1,089 $982 $107 11 % Income tax expense, adjusted: Income tax expense (GAAP) $130 $118 $109 $110 $115 $12 10 % $15 13 % $357 $313 $44 14 % Less: Income tax expense (benefit) related to restructuring charges and special items — — — — — — — — — — (19) 19 100 Less: Income tax expense (benefit) related to notable items 12 — — — — 12 100 12 100 12 — 12 100 Income tax expense, adjusted (non-GAAP) $118 $118 $109 $110 $115 $— —% $3 3 % $345 $332 $13 4 % Net income, adjusted: Net income (GAAP) E $297 $243 $223 $221 $220 $54 22 % $77 35 % $763 $619 $144 23 % Add: Restructuring charges and special items, net of income tax expense (benefit) — — — — — — — — — — 31 (31) (100) Add: Notable items, net of income tax expense (benefit) (19) — — — — (19) 100 (19) 100 (19) — (19) 100 Net income, adjusted (non-GAAP) F $278 $243 $223 $221 $220 $35 14 % $58 26 % $744 $650 $94 14 % Net income available to common stockholders, adjusted: Net income available to common stockholders (GAAP) G $290 $243 $216 $221 $213 $47 19 % $77 36 % $749 $612 $137 22 % Add: Restructuring charges and special items, net of income tax expense (benefit) — — — — — — — — — — 31 (31) (100) Add: Notable items, net of income tax expense (benefit) (19) — — — — (19) 100 (19) 100 (19) — (19) 100 Net income available to common stockholders, adjusted (non-GAAP) H $271 $243 $216 $221 $213 $28 12 % $58 27 % $730 $643 $87 14 % QUARTERLY TRENDS FOR THE NINE MONTHS ENDED SEPT 30, 3Q16 Change 2016 Change 2Q16 3Q15 2015 |
 Key performance metrics, Non-GAAP Financial Measures and reconciliations
29
(Adjusted excluding restructuring charges, special items and/or notable
items) $s in millions, except per share data
3Q16 2Q16 1Q16 4Q15 3Q15 2016 2015 $/bps % $/bps % $/bps % Operating leverage: Total revenue (GAAP) A $1,380 $1,278 $1,234 $1,232 $1,209 $102 7.98 % $171 14.14 % $3,892 $3,592 $300 8.35 % Less: Noninterest expense (GAAP) C 867 827 811 810 798 40 4.84 69 8.65 2,505 2,449 56 2.29 Operating leverage 3.14 % 5.49 % 6.06 % Operating leverage, adjusted: Total revenue, adjusted (non-GAAP) B $1,313 $1,278 $1,234 $1,232 $1,209 $35 2.74 % $104 8.60 % $3,825 $3,592 $233 6.49 % Less: Noninterest expense, adjusted (non-GAAP) D 831 827 811 810 798 4 0.48 33 4.14 2,469 2,399 70 2.92 Operating leverage, adjusted (non-GAAP) 2.26 % 4.46 % 3.57 % Return on average common equity and return on average common equity, adjusted:
Average common equity (GAAP)
I $19,810 $19,768 $19,567 $19,359 $19,261 $42 —% $549 3 % $19,715 $19,352 $363 2 % Return on average common equity G/I 5.82 % 4.94 % 4.45 % 4.51 % 4.40 % 88 bps 142 bps 5.08 % 4.23 % 85 bps Return on average common equity, adjusted (non-GAAP) H/I 5.44 4.94 4.45 4.51 4.40 50 bps 104 bps 4.95 4.45 50 bps Return on average tangible common equity and return on average tangible common equity, adjusted: Average common equity (GAAP) I $19,810 $19,768 $19,567 $19,359 $19,261 $42 —% $549 3 % $19,715 $19,352 $363 2 % Less: Average goodwill (GAAP) 6,876 6,876 6,876 6,876 6,876 — — — — 6,876 6,876 — — Less: Average other intangibles (GAAP) 1 2 3 3 4 (1) (50) (3) (75) 2 5 (3) (60) Add: Average deferred tax liabilities related to goodwill (GAAP) 509 496 481 468 453 13 3 56 12 495 438 57 13 Average tangible common equity J $13,442 $13,386 $13,169 $12,948 $12,834 $56 —% $608 5 % $13,332 $12,909 $423 3 % Return on average tangible common equity G/J 8.58 % 7.30 % 6.61 % 6.75 % 6.60 % 128 bps 198 bps 7.51 % 6.34 % 117 bps Return on average tangible common equity, adjusted (non-GAAP) H/J 8.02 7.30 6.61 6.75 6.60 72 bps 142 bps 7.32 6.67 65 bps Return on average total assets and return on average total assets, adjusted:
Average total assets (GAAP)
K $144,399 $142,179 $138,780 $136,298 $135,103 $2,220 2 % $9,296 7 % $141,795 $134,655 $7,140 5 % Return on average total assets E/K 0.82 % 0.69 % 0.65 % 0.64 % 0.65 % 13 bps 17 bps 0.72 % 0.62 % 10 bps Return on average total assets, adjusted (non-GAAP) F/K 0.77 0.69 0.65 0.64 0.65 8 bps 12 bps 0.70 0.65 5 bps Return on average total tangible assets and return on average total tangible
assets, adjusted:
Average total assets (GAAP)
K $144,399 $142,179 $138,780 $136,298 $135,103 $2,220 2 % $9,296 7 % $141,795 $134,655 $7,140 5 % Less: Average goodwill (GAAP) 6,876 6,876 6,876 6,876 6,876 — — — — 6,876 6,876 — — Less: Average other intangibles (GAAP) 1 2 3 3 4 (1) (50) (3) (75) 2 5 (3) (60) Add: Average deferred tax liabilities related to goodwill (GAAP) 509 496 481 468 453 13 3 56 12 495 438 57 13 Average tangible assets L $138,031 $135,797 $132,382 $129,887 $128,676 $2,234 2 % $9,355 7 % $135,412 $128,212 $7,200 6 % Return on average total tangible assets E/L 0.86 % 0.72 % 0.68 % 0.67 % 0.68 % 14 bps 18 bps 0.75 % 0.65 % 10 bps Return on average total tangible assets, adjusted (non-GAAP) F/L 0.80 0.72 0.68 0.67 0.68 8 bps 12 bps 0.73 0.68 5 bps 2Q16 3Q15 2015 QUARTERLY TRENDS FOR THE NINE MONTHS ENDED SEPT 30, 3Q16 Change 2016 Change |
 Key performance metrics, Non-GAAP Financial Measures and reconciliations
30
1) Basel III ratios assume certain definitions impacting qualifying Basel III capital, which otherwise will phase in through 2019, are fully
phased-in. Ratios also reflect the required US Standardized
methodology for calculating RWAs, effective January 1, 2015.
(Adjusted excluding restructuring charges, special items and/or notable
items) $s in millions, except per share data
3Q16 2Q16 1Q16 4Q15 3Q15 2016 2015 $/bps % $/bps % $/bps % Efficiency ratio and efficiency ratio, adjusted: Efficiency ratio C/A 62.88 % 64.71 % 65.66 % 65.76 % 66.02 % (183) bps (314) bps 64.36 % 68.17 % (381) bps Efficiency ratio, adjusted (non-GAAP) D/B 63.31 64.71 65.66 65.76 66.02 (140) bps (271) bps 64.54 66.78 (224) bps Tangible book value per common share: Common shares - at end of period (GAAP) M 518,148,345 529,094,976 528,933,727 527,774,428 527,636,510 (10,946,631) (2%) (9,488,165) (2%) 518,148,345 527,636,510 (9,488,165) (2%) Common stockholders' equity (GAAP) $19,934 $19,979 $19,718 $19,399 $19,353 ($45) — $581 3 $19,934 $19,353 $581 3 Less: Goodwill (GAAP) 6,876 6,876 6,876 6,876 6,876 — — — — 6,876 6,876 — — Less: Other intangible assets (GAAP) 1 2 3 3 3 (1) (50) (2) (67) 1 3 (2) (67) Add: Deferred tax liabilities related to goodwill (GAAP) 519 507 494 480 465 12 2 54 12 519 465 54 12 Tangible common equity N $13,576 $13,608 $13,333 $13,000 $12,939 ($32) —% $637 5 % $13,576 $12,939 $637 5 % Tangible book value per common share N/M $26.20 $25.72 $25.21 $24.63 $24.52 $0.48 2 % $1.68 7 % $26.20 $24.52 $1.68 7 % Net income per average common share - basic and diluted, adjusted: Average common shares outstanding - basic (GAAP) O 519,458,976 528,968,330 528,070,648 527,648,630 530,985,255 (9,509,354) (2%) (11,526,279) (2%) 525,477,273 538,279,222 (12,801,949) (2%) Average common shares outstanding - diluted (GAAP) P 521,122,466 530,365,203 530,446,188 530,275,673 533,398,158 (9,242,737) (2) (12,275,692) (2) 527,261,384 540,926,361 (13,664,977) (3) Net income available to common stockholders (GAAP) G $290 $243 $216 $221 $213 $47 19 $77 36 $749 $612 $137 22 Net income per average common share - basic (GAAP) G/O 0.56 0.46 0.41 0.42 0.40 0.10 22 0.16 40 1.43 1.14 0.29 25 Net income per average common share - diluted (GAAP) G/P 0.56 0.46 0.41 0.42 0.40 0.10 22 0.16 40 1.42 1.13 0.29 26 Net income available to common stockholders, adjusted (non-GAAP) H 271 243 216 221 213 28 12 58 27 730 643 87 14 Net income per average common share - basic, adjusted (non-GAAP) H/O 0.52 0.46 0.41 0.42 0.40 0.06 13 0.12 30 1.39 1.20 0.19 16 Net income per average common share - diluted, adjusted (non-GAAP) H/P 0.52 0.46 0.41 0.42 0.40 0.06 13 0.12 30 1.39 1.19 0.20 17 1 : Common equity tier 1 (regulatory) $13,763 $13,768 $13,570 $13,389 $13,200 Less: Change in DTA and other threshold deductions (GAAP) — 1 1 2 2 Pro forma Basel III fully phased-in common equity tier 1 Q $13,763 $13,767 $13,569 $13,387 $13,198 Risk-weighted assets (regulatory general risk weight approach) $121,612 $119,492 $116,591 $114,084 $112,277 Add: Net change in credit and other risk-weighted assets (regulatory)
228 228 232 244 243 Pro forma Basel III standardized approach risk-weighted assets R $121,840 $119,720 $116,823 $114,328 $112,520 Pro forma Basel III fully phased-in common equity tier 1 capital ratio
1 Q/R 11.3 % 11.5 % 11.6 % 11.7 % 11.7 % QUARTERLY TRENDS FOR THE NINE MONTHS ENDED SEPT 30, 3Q16 Change 2016 Change 2Q16 3Q15 2015 Pro forma Basel III fully phased-in common equity tier 1 capital ratio |
 Key performance metrics, Non-GAAP Financial Measures and reconciliations
31
(Adjusted excluding restructuring charges, special items and/or notable
items) $s in millions, except per share data
3Q16 2Q16 1Q16 4Q15 3Q15 2016 2015 $ % $ % $ % Other income, adjusted Other income (GAAP) $90 $18 $16 $23 $30 $72 NM $60 200 % $124 $71 $53 75 % Less: Special items — — — — — — — — — — — — — Less: Notable items 67 — — — — 67 100 67 100 67 — 67 100 Other income, adjusted (non-GAAP) $23 $18 $16 $23 $30 $5 28 % ($7) (23%) $57 $71 ($14) (20%) Salaries and employee benefits, adjusted: Salaries and employee benefits (GAAP) $432 $432 $425 $402 $404 $— —% $28 7 % $1,289 $1,234 $55 4 % Less: Restructuring charges and special items — — — (2) — — — — — — 5 (5) (100) Less: Notable items 11 — — — — 11 100 11 100 11 — 11 100 Salaries and employee benefits, adjusted (non-GAAP) $421 $432 $425 $404 $404 ($11) (3%) $17 4 % $1,278 $1,229 $49 4 % Outside services, adjusted: Outside services (GAAP) $102 $86 $91 $104 $89 $16 19 % $13 15 % $279 $267 $12 4 % Less: Restructuring charges and special items — — — 2 — — — — — — 24 (24) (100) Less: Notable items 8 — — — — 8 100 8 100 8 — 8 100 Outside services, adjusted (non-GAAP) $94 $86 $91 $102 $89 $8 9 % $5 6 % $271 $243 $28 12 % Occupancy, adjusted: Occupancy (GAAP) $78 $76 $76 $74 $75 $2 3 % $3 4 % $230 $245 ($15) (6%) Less: Restructuring charges and special items — — — — — — — — — — 17 (17) (100) Less: Notable items — — — — — — — — — — — — — Occupancy, adjusted (non-GAAP) $78 $76 $76 $74 $75 $2 3 % $3 4 % $230 $228 $2 1 % Equipment expense, adjusted: Equipment expense (GAAP) $65 $64 $65 $67 $62 $1 2 % $3 5 % $194 $190 $4 2 % Less: Restructuring charges and special items — — — — — — — — — — 1 (1) (100) Less: Notable items — — — — — — — — — — — — — Equipment expense, adjusted (non-GAAP) $65 $64 $65 $67 $62 $1 2 % $3 5 % $194 $189 $5 3 % Amortization of software, adjusted: Amortization of software (GAAP) $46 $41 $39 $38 $35 $5 12 % $11 31 % $126 $108 $18 17 % Less: Restructuring charges and special items — — — — — — — — — — — — — Less: Notable items 3 — — — — 3 100 3 100 3 — 3 100 Amortization of software, adjusted (non-GAAP) $43 $41 $39 $38 $35 $2 5 % $8 23 % $123 $108 $15 14 % Other operating expense, adjusted: Other operating expense (GAAP) $144 $128 $115 $125 $133 $16 13 % $11 8 % $387 $405 ($18) (4%) Less: Restructuring charges and special items — — — — — — — — — — 3 (3) (100) Less: Notable items 14 — — — — 14 100 14 100 14 — 14 100 Other operating expense, adjusted (non-GAAP) $130 $128 $115 $125 $133 $2 2 % ($3) (2%) $373 $402 ($29) (7%) Restructuring charges, special expense items and notable expense items include:
Restructuring charges
$— $— $— $— $— $— —% $— —% $— $26 ($26) (100)% Special items — — — — — — — — — — 24 (24) (100) Notable items 36 — — — — 36 100 36 100 36 — 36 100 Restructuring charges, special expense items and notable expense items $36 $— $— $— $— $36 100% $36 100 % $36 $50 ($14) (28%) QUARTERLY TRENDS FOR THE NINE MONTHS ENDED SEPT 30, 3Q16 Change 2016 Change 2Q16 3Q15 2015 |
 Key performance metrics, Non-GAAP Financial Measures and reconciliations
32
$s in millions Consumer Banking Commercial Banking Other Consolidated Consumer Banking Commercial Banking Other Consolidated Consumer Banking Commercial Banking Other Consolidated Net income available to common stockholders: Net income (GAAP) A $92 $162 $43 $297 $90 $164 ($11) $243 $71 $133 $19 $223 Less: Preferred stock dividends — — 7 7 — — — — — — 7 7 Net income available to common stockholders B $92 $162 $36 $290 $90 $164 ($11) $243 $71 $133 $12 $216 Return on average tangible common equity: Average common equity (GAAP) $5,190 $5,172 $9,448 $19,810 $5,110 $5,040 $9,618 $19,768 $5,089 $4,790 $9,688 $19,567 Less: Average goodwill (GAAP) — — 6,876 6,876 — — 6,876 6,876 — — 6,876 6,876 Average other intangibles (GAAP) — — 1 1 — — 2 2 — — 3 3 Add: Average deferred tax liabilities related to goodwill (GAAP) — — 509 509 — — 496 496 — — 481 481 Average tangible common equity C $5,190 $5,172 $3,080 $13,442 $5,110 $5,040 $3,236 $13,386 $5,089 $4,790 $3,290 $13,169 Return on average tangible common equity B/C 7.04 % 12.50 % NM 8.58 % 7.09 % 13.04 % NM 7.30 % 5.59 % 11.19 % NM 6.61 % Return on average total tangible assets: Average total assets (GAAP) $56,689 $47,902 $39,808 $144,399 $55,660 $47,388 $39,131 $142,179 $55,116 $45,304 $38,360 $138,780 Less: Average goodwill (GAAP) — — 6,876 6,876 — — 6,876 6,876 — — 6,876 6,876 Average other intangibles (GAAP) — — 1 1 — — 2 2 — — 3 3 Add: Average deferred tax liabilities related to goodwill (GAAP) — — 509 509 — — 496 496 — — 481 481 Average tangible assets D $56,689 $47,902 $33,440 $138,031 $55,660 $47,388 $32,749 $135,797 $55,116 $45,304 $31,962 $132,382 Return on average total tangible assets A/D 0.64 % 1.35 % NM 0.86 % 0.65 % 1.39 % NM 0.72 % 0.52 % 1.18 % NM 0.68 % Efficiency ratio: Noninterest expense (GAAP) E $650 $181 $36 $867 $632 $186 $9 $827 $616 $187 $8 $811 Net interest income (GAAP) 621 327 (3) 945 602 314 7 923 581 300 23 904 Noninterest income (GAAP) 229 123 83 435 219 122 14 355 208 99 23 330 Total revenue (GAAP) F $850 $450 $80 $1,380 $821 $436 $21 $1,278 $789 $399 $46 $1,234 Efficiency ratio E/F 76.46 % 40.21 % NM 62.88 % 76.98 % 42.88 % NM 64.71 % 78.08 % 46.74 % NM 65.66 % Consumer Banking Commercial Banking Other Consolidated Consumer Banking Commercial Banking Other Consolidated Net income available to common stockholders: Net income (loss) (GAAP) A $67 $152 $2 $221 $68 $145 $7 $220 Less: Preferred stock dividends — — — — — — 7 7 Net income available to common stockholders B $67 $152 $2 $221 $68 $145 $— $213 Return on average tangible common equity: Average common equity (GAAP) $4,831 $4,787 $9,741 $19,359 $4,791 $4,722 $9,748 $19,261 Less: Average goodwill (GAAP) — — 6,876 6,876 — — 6,876 6,876 Average other intangibles (GAAP) — — 3 3 — — 4 4 Add: Average deferred tax liabilities related to goodwill (GAAP) — — 468 468 — — 453 453 Average tangible common equity C $4,831 $4,787 $3,330 $12,948 $4,791 $4,722 $3,321 $12,834 Return on average tangible common equity B/C 5.50 % 12.57 % NM 6.75 % 5.67 % 12.24 % NM 6.60 % Return on average total tangible assets: Average total assets (GAAP) $54,065 $43,835 $38,398 $136,298 $53,206 $43,113 $38,784 $135,103 Less: Average goodwill (GAAP) — — 6,876 6,876 — — 6,876 6,876 Average other intangibles (GAAP) — — 3 3 — — 4 4 Add: Average deferred tax liabilities related to goodwill (GAAP) — — 468 468 — — 453 453 Average tangible assets D $54,065 $43,835 $31,987 $129,887 $53,206 $43,113 $32,357 $128,676 Return on average total tangible assets A/D 0.49 % 1.37 % NM 0.67 % 0.51 % 1.34 % NM 0.68 % Efficiency ratio: Noninterest expense (GAAP) E $624 $180 $6 $810 $623 $175 $— $798 Net interest income (GAAP) 565 301 4 870 556 299 1 856 Noninterest income (GAAP) 226 107 29 362 235 100 18 353 Total revenue (GAAP) F $791 $408 $33 $1,232 $791 $399 $19 $1,209 Efficiency ratio E/F 78.85 % 44.02 % NM 65.76 % 78.72 % 43.75 % NM 66.02 % THREE MONTHS ENDED DEC 31, THREE MONTHS ENDED SEPT 30, 2015 2015 THREE MONTHS ENDED SEPT 30, THREE MONTHS ENDED JUNE 30, THREE MONTHS ENDED MAR 31, 2016 2016 2016 |
 Key performance metrics, Non-GAAP Financial Measures and reconciliations
33
Consumer Banking Commercial Banking Other Consolidated Consumer Banking Commercial Banking Other Consolidated Net income available to common stockholders: Net income (loss) (GAAP) A $253 $459 $51 $763 $195 $427 ($3) $619 Less: Preferred stock dividends — — 14 14 — — 7 7 Net income available to common stockholders B $253 $459 $37 $749 $195 $427 ($10) $612 Return on average tangible common equity: Average common equity (GAAP) $5,130 $5,001 $9,584 $19,715 $4,708 $4,625 $10,019 $19,352 Less: Average goodwill (GAAP) — — 6,876 6,876 — — 6,876 6,876 Average other intangibles (GAAP) — — 2 2 — — 5 5 Add: Average deferred tax liabilities related to goodwill (GAAP) — — 495 495 — — 438 438 Average tangible common equity C $5,130 $5,001 $3,201 $13,332 $4,708 $4,625 $3,576 $12,909 Return on average tangible common equity B/C 6.58 % 12.27 % NM 7.51 % 5.55 % 12.35 % NM 6.34 % Return on average total tangible assets: Average total assets (GAAP) $55,825 $46,869 $39,101 $141,795 $52,438 $42,451 $39,766 $134,655 Less: Average goodwill (GAAP) — — 6,876 6,876 — — 6,876 6,876 Average other intangibles (GAAP) — — 2 2 — — 5 5 Add: Average deferred tax liabilities related to goodwill (GAAP) — — 495 495 — — 438 438 Average tangible assets D $55,825 $46,869 $32,718 $135,412 $52,438 $42,451 $33,323 $128,212 Return on average total tangible assets A/D 0.60 % 1.31 % NM 0.75 % 0.50 % 1.35 % NM 0.65 % Efficiency ratio: Noninterest expense (GAAP) E $1,898 $554 $53 $2,505 $1,832 $529 $88 $2,449 Net interest income (GAAP) 1,804 941 27 2,772 1,633 861 38 2,532 Noninterest income (GAAP) 656 344 120 1,120 684 308 68 1,060 Total revenue (GAAP) F $2,460 $1,285 $147 $3,892 $2,317 $1,169 $106 $3,592 Efficiency ratio E/F 77.15 % 43.15 % NM 64.36 % 79.07 % 45.26 % NM 68.17 % FOR THE NINE MONTHS ENDED SEPT 30, 2016 2015 $s in millions |
 34 ****************** ****************** ****************** ****************** ****************** ****************** ****************** ****************** ****************** ****************** ****************** ***************** ****** ****** ****** ****** ****** ****** ****** ****** ****** ****** ****** ****** ****** ****** *** |