Attached files
| file | filename |
|---|---|
| EX-99.1 - EXHIBIT 99.1 - ADVANCED MICRO DEVICES INC | amdreportsthirdquarterearn.htm |
| 8-K - 8-K - ITEM 2.02, 7.01, 9.01 - ADVANCED MICRO DEVICES INC | a20161020q316earnings8-k.htm |

AMD Reports 2016 Third Quarter Results - CFO Commentary
October 20, 2016
Reconciliation for all non-GAAP financial measures discussed in this commentary to the most directly comparable GAAP financial measures is included below and in our financial tables that accompany our earnings press release available at quarterlyearnings.amd.com.
Q3 2016 Results
• | Revenue of $1,307 million, up 27% sequentially and 23% year-over-year. |
• | Gross margin of 5%, down 26 percentage points sequentially driven by a $340 million charge related to the 6th amendment to the Wafer Supply Agreement (WSA) with GLOBALFOUNDRIES (GF). Non-GAAP gross margin of 31%, flat sequentially. |
• | Operating loss of $293 million driven by a $340 million WSA charge, compared to an operating loss of $8 million in Q2 2016 and non-GAAP operating income of $70 million, compared to non-GAAP operating income of $3 million in Q2 2016. |
• | Net loss of $406 million, loss per share of $0.50, driven by a $340 million WSA charge and a $61 million loss on debt redemption compared to net income of $69 million, earnings per share of $0.08 in Q2 2016. Q2 2016 net income was driven by a $150 million pre-tax gain on the sale of 85% of our equity interest in ATMP facilities to Nantong Fujitsu Microelectronics Co., Ltd. (NFME). |
• | Non-GAAP net income of $27 million, earnings per share of $0.03, compared to non-GAAP net loss of $40 million, loss per share of $0.05 in Q2 2016. |
• | Q3 2016 special charges: |
◦ | Recorded a $340 million WSA charge. |
◦ | Recorded a $61 million loss related to debt redemption. |
• | Raised $690 million through an equity offering of common shares and issued $700 million of 2.125% Convertible Senior Notes due 2026 (Convertible Notes due 2026). The proceeds from these transactions, net of issuance costs, were used to retire approximately $796 million in principal of outstanding term debt and pay off $226 million of our outstanding ABL balance. Beginning in Q4 2016, annual cash interest expense will be lowered by approximately $55 million. |
AMD Q3-16 CFO Commentary | Page 1 | October 20, 2016 |
Q3 2016 Commentary
Based on a 13-week quarter, revenue was $1,307 million, up 27% sequentially. Computing and Graphics segment revenue was up 9% from Q2 2016, primarily due to increased GPU sales offset by lower sales of client desktop processors and chipsets. Enterprise, Embedded and Semi-Custom segment revenue was up 41% sequentially, primarily due to record semi-custom SoC sales.
Gross margin was 5%, down from 31% in the prior quarter due to a $340 million WSA charge. Non-GAAP gross margin was 31%, flat sequentially.
Operating expenses were $376 million and non-GAAP operating expenses were $353 million or 27% of revenue, up $11 million from the prior quarter’s non-GAAP operating expenses.
• | R&D expenses were $259 million, non-GAAP R&D was $244 million or 19% of revenue. |
• | SG&A expenses were $117 million, non-GAAP SG&A was $109 million or 8% of revenue. |
To derive non-GAAP operating expenses, we exclude the impact of stock-based compensation and restructuring and other special charges, net.
Operating expenses:
Q3-16 | Q2-16 | Q3-15 | |||
GAAP | $376M | $353M | $397M | ||
Non-GAAP | $353M | $342M | $336M | ||
Operating loss was $293 million, compared to an operating loss of $8 million in Q2 2016 due to a $340 million WSA charge. Non-GAAP operating income was $70 million, compared to a non-GAAP operating income of $3 million in Q2 2016.
To derive non-GAAP operating income, we exclude the impact of the $340 million WSA charge, stock-based compensation and restructuring and other special charges, net.
Net Loss was $406 million compared to net income of $69 million in Q2 2016, primarily due to a $340 million WSA charge and $61 million loss on debt redemption offset by increased revenue in Q3 2016. Q2
AMD Q3-16 CFO Commentary | Page 2 | October 20, 2016 |
2016 net income included a $150 million pre-tax gain on the sale of 85% of our ATMP facilities to NFME. Non-GAAP net income was $27 million compared to a non-GAAP net loss of $40 million in Q2 2016 primarily due to increased revenue.
To derive non-GAAP net income, we exclude the impact of the $340 million WSA charge, the loss on debt redemption, non-cash interest expense related to convertible debt, stock-based compensation, adjustment for a reduction in the gain on sale of 85% of our ATMP facilities to NFME and associated tax benefit, equity in loss of ATMP JV, and restructuring and other special charges, net.
Depreciation and amortization, excluding amortization of acquired intangible assets, was $33 million, flat from the prior quarter.
Net interest expense was $41 million, flat from the prior quarter. In Q3 2016 interest expense was largely not impacted by the capital markets transactions as these were completed late in the quarter.
Other expense, net was $63 million, mostly driven by a loss related to debt redemption of $61 million.
Non-GAAP net expense of interest, taxes and other was $43 million.
Recorded an ATMP JV equity loss related to our 15% ownership stake in the ATMP JV of $5 million, compared to $3 million in the prior quarter.
Taxes were $4 million, compared to $29 million in the prior quarter. Q2 2016 included $27 million of taxes related to the closure of the ATMP JV transaction. Q3 2016 taxes included a $1 million benefit due to the ATMP JV transaction.
Net loss per share was $0.50, calculated using 815 million basic shares of common stock. Non-GAAP net income per share was $0.03, calculated using 865 million diluted shares of common stock. Q3 2016 impact of the equity issuance was 12 million weighted average shares, included in basic and diluted share count. A total of 115 million new shares were issued at the end of Q3 2016 and were only outstanding for several days. Starting in Q4 2016, the full 115 million of shares issued in Q3 2016 will be included in basic and diluted share counts.
AMD Q3-16 CFO Commentary | Page 3 | October 20, 2016 |
Adjusted EBITDA was $103 million, compared to $36 million in the prior quarter.
Q3 2016 Segment Results
Computing and Graphics segment revenue was $472 million, up 9% sequentially and up 11% year-over-year primarily due to increased sales of GPU processors, offset by decreased sales of client desktop processors and chipsets.
• | Client mobile processor sales increased sequentially and year-over-year. |
• | Client average selling price (ASP) decreased sequentially driven by lower mobile and desktop processor ASP and was flat year-over-year. |
• | GPU ASP increased sequentially and year-over-year driven by higher channel and professional graphics ASPs. |
Computing and Graphics operating loss improved to $66 million, compared to an operating loss of $81 million in Q2 2016, primarily due to higher GPU revenue.
Enterprise, Embedded and Semi-Custom segment revenue was $835 million, up 41% compared to the prior quarter and 31% year-over-year, driven by higher sales of our semi-custom SoCs.
Enterprise, Embedded and Semi-Custom operating income was $136 million, up from $84 million in the prior quarter, primarily due to higher revenue.
GLOBALFOUNDRIES (GF) Wafer Supply Agreement (WSA)
In Q3 2016, AMD recorded a $340 million charge related to the 6th amendment to the WSA with GF. This charge comprises of a $100 million cash payment to GF and approximately a $240 million value of a warrant to a Mubadala-owned company to purchase up to 75 million shares of AMD common stock at a price of $5.98 per share by February 2020.
• | The 6th amendment is for a 5-year period. |
• | The $100 million one-time cash charge will be paid to GF in $25 million quarterly installments from Q4 2016 to Q3 2017. |
AMD Q3-16 CFO Commentary | Page 4 | October 20, 2016 |
• | The warrant is only exercisable to the extent Mubadala’s overall ownership of AMD stock does not exceed 19.99% after exercise. |
AMD expects 2016 total wafer purchases from GF to be approximately $650 million.
Capital Markets Transactions
During Q3 2016, we raised approximately $1.4 billion in cash, before issuance costs, as a result of issuing $690 million of Common Stock and $700 million of Convertible Notes due 2026. The $690 million includes $90 million from the underwriters’ option to purchase 15% or 15 million additional shares of common stock which was exercised in Q3 2016. The net proceeds from these capital markets transactions were used to retire approximately $796 million in principal of outstanding term debt and pay off the outstanding ABL balance of $226 million.
As of the end of Q3 2016, the debt balance of $1.63 billion included the $700 million principal Convertible Notes due 2026, bifurcated into liability and equity components as required by GAAP accounting regulations. The liability component of $427 million before allocated issuance costs represents the book value of debt and the equity component is $273 million before allocated issuance costs. This $273 million is the excess of the $700 million principal amount of debt over its book value of $427 million. The $273 million is reflected as a discount on the debt that will be accreted as non-cash interest expense over the 10-year period of the Convertible Notes. Because we believe this non-cash portion of interest expense is not representative of our on-going operations and does not provide meaningful information to investors, we will exclude it from our non-GAAP financial results.
In addition, early in Q4 2016, the underwriters’ option to purchase an additional 15% or $105 million of Convertible Notes due 2026 was exercised bringing the total Convertible Notes due 2026 to $805 million principal balance compared to $700 million principal balance outstanding at the end of Q3 2016. The same accounting guidance applies to the additional $105 million principal of the Convertible Notes due 2026 as described above. The value of the liability and equity components at the beginning of Q4 2016, before allocated issuance costs, were $491 million and $314 million, respectively.
Also, early in Q4 2016, we redeemed all of the remaining 7.75% Senior Notes due 2020 of approximately $208 million in aggregate principal amount which was our most expensive debt. After all these transactions, our net debt balance is approximately $1.5 billion as of early Q4 2016.
AMD Q3-16 CFO Commentary | Page 5 | October 20, 2016 |
Total Debt
(Millions) | Early Q4-16 | Q3-16 | Q2-16 | |||||||||
9.28.16 | 9.24.16 | 6.25.16 | ||||||||||
6.75% Senior Notes due 2019 | $ | 196 | $ | 196 | $ | 600 | ||||||
6.75% Senior Notes due 2019—Interest Rate Swap | 2 | 2 | 10 | |||||||||
7.75% Senior Notes due 2020 | — | 208 | 450 | |||||||||
7.50% Senior Notes due 2022 | 350 | 350 | 475 | |||||||||
7.00% Senior Notes due 2024 | 475 | 475 | 500 | |||||||||
2.125% Convertible Senior Notes due 2026 | 805 | 700 | — | |||||||||
Borrowings from secured revolving line of credit, net | — | — | 226 | |||||||||
Total Debt (principal amount) | 1,828 | 1,931 | 2,261 | |||||||||
Unamortized debt discount associated with 2.125% Convertible Senior Notes due 2026* | (314 | ) | (273 | ) | — | |||||||
Unamortized debt issuance costs | (26 | ) | (26 | ) | (23 | ) | ||||||
Total Debt (net) | $ | 1,488 | $ | 1,632 | $ | 2,238 | ||||||
* AMD separated the principal of the 2.125% convertible senior notes due 2026 into liability and equity components according to ASC 470-20.
Term Debt Structure1
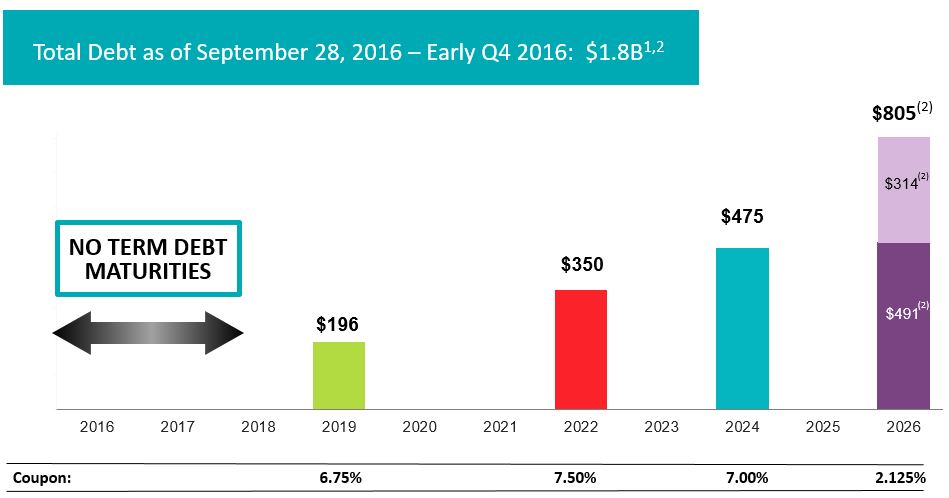
1. | Amounts represent principal balances outstanding. See footnotes for reconciliation to the net book value of debt presented on financials as the result of adoption of ASU 2015-03. |
2. | $805M convertible senior notes due 2026 represented by liability component of $491M and equity component of $314M according to ASC 470-20. |
Debt reduction and issuance of the Convertible Notes due 2026 that occurred in Q3 2016 and early in Q4 2016 will result in approximately $55 million of annualized cash interest savings beginning in Q4 2016.
AMD Q3-16 CFO Commentary | Page 6 | October 20, 2016 |
Balance Sheet
Cash and cash equivalents were $1,258 million at the end of Q3 2016, compared to $957 million at the end of the prior quarter. The quarter end cash balance includes approximately $274 million associated with the proceeds remaining from the capital markets transactions. Following the transactions that occurred in early Q4 2016, $162 million remains available for future debt redemption.
Cash and cash equivalents at the end of the following quarters were:
Q3-16 | Q2-16 | Q1-16 | Q4-15 | Q3-15 | ||||
$1,258M | $957M | $716M | $785M | $755M | ||||
Inventory was $772 million, compared to $743 million at the end of Q2 2016. This was higher than expected and primarily driven by stronger holiday season GPU and semi-custom sales expectations in the first part of Q4 2016.
Payable to GLOBALFOUNDRIES line item on the Balance Sheet of $284 million includes amounts due to GF for wafer purchases and the $100 million payment related to the 6th amendment to the WSA to be paid over four quarters at $25 million per quarter, starting in Q4 2016.
Payable to ATMP JV line item on the Balance Sheet of $144 million includes amounts due to the ATMP JV for ATMP related services.
Total debt at the end of the quarter was $1.63 billion, down from $2.24 billion in the prior quarter driven by debt reduction actions as a result of the Q3 2016 capital markets transactions. As of the end of the quarter, we paid off $226 million of our outstanding ABL balance using proceeds from the capital markets transactions.
Non-GAAP free cash flow was $20 million, compared to a negative $106 million in Q2 2016. Net cash provided by operating activities was $29 million and capital expenditures were $9 million.
AMD Q3-16 CFO Commentary | Page 7 | October 20, 2016 |
Outlook
The following statements concerning AMD are forward-looking and actual results could differ materially from current expectations. Investors are urged to review in detail the risks and uncertainties in AMD’s Securities and Exchange Commission filings, including but not limited to the “Risk Factors” section in AMD’s Quarterly Report on Form 10-Q for the quarter ended June 25, 2016.
For Q4 2016, a 14 week quarter, we expect:
• | Revenue to decrease 18% sequentially, +/- 3%, primarily driven by seasonally lower semi-custom sales. The midpoint of revenue guidance would be up 12% year-over-year. |
• | Non-GAAP gross margin to be approximately 32%, |
• | Non-GAAP operating expenses to be approximately $350 million, |
• | IP monetization licensing gain of approximately $25 million, |
• | Maintain non-GAAP operating profitability, |
• | Non-GAAP interest expense, taxes and other to be approximately $32 million, |
• | Cash and cash equivalents balances to be up, in-line with our guidance of ending the year free cash flow positive excluding cash from capital markets transactions and net proceeds from the ATMP JV, |
• | Inventory to decline to approximately $660 million, |
• | Basic share count to be approximately 930 million shares which includes 115 million shares related to the Q3 2016 equity issuance. |
• | We now expect full year 2016 revenue to be up approximately 6% from 2015 based on the midpoint of Q4 2016 revenue guidance. |
***********************************************
For more information, contact:
Investor Contact:
Ruth Cotter
408-749-3887
ruth.cotter@amd.com
Media Contact:
Drew Prairie
512-602-4425
drew.prairie@amd.com
***********************************************
AMD Q3-16 CFO Commentary | Page 8 | October 20, 2016 |
Non-GAAP Measures
To supplement the financial results of Advanced Micro Devices, Inc. (“AMD” or the “Company”) presented on a U.S. GAAP (“GAAP”) basis, this commentary contains non-GAAP financial measures, including non-GAAP gross margin, non-GAAP operating expenses, non-GAAP research and development and marketing, general and administrative expenses, non-GAAP operating income (loss), non-GAAP net income (loss), non-GAAP earnings (loss) per share, Adjusted EBITDA, non-GAAP free cash flow and non-GAAP interest expense, taxes and other. These non-GAAP financial measures reflect certain adjustments, and the Company has presented a reconciliation of GAAP to non-GAAP financial measures in the tables below.
The Company presents “Adjusted EBITDA” as a supplemental measure of its performance. Adjusted EBITDA for the Company is determined by adjusting operating income (loss) for depreciation and amortization, stock-based compensation expense and restructuring and other special charges, net. In addition, the Company excluded a one-time charge related to the sixth amendment to the WSA with GF for the three and nine months ended September 24, 2016, a technology node transition charge for the nine months ended September 24, 2015 and amortization of acquired intangible assets for the nine months ended September 24, 2016. The Company calculates and communicates Adjusted EBITDA because the Company’s management believes it is of importance to investors and lenders in relation to its overall capital structure and its ability to borrow additional funds. In addition, the Company presents Adjusted EBITDA because it believes this measure assists investors in comparing its performance across reporting periods on a consistent basis by excluding items that the Company does not believe are indicative of its core operating performance. The Company’s calculation of Adjusted EBITDA may or may not be consistent with the calculation of this measure by other companies in the same industry. Investors should not view Adjusted EBITDA as an alternative to the GAAP operating measure of operating income (loss) or GAAP liquidity measures of cash flows from operating, investing and financing activities. In addition, Adjusted EBITDA does not take into account changes in certain assets and liabilities as well as interest and income taxes that can affect cash flows.
The Company also presents non-GAAP free cash flow in this commentary as a supplemental measure of its performance. Non-GAAP free cash flow for the Company was determined by adjusting GAAP net cash provided by (used in) operating activities less capital expenditures. The Company calculates and communicates non-GAAP free cash flow because the Company’s management believes it is important to investors to understand the nature of this cash flow. The Company’s calculation of non-GAAP free cash flow may or may not be consistent with the calculation of this measure by other companies in the same industry. Investors should not view non-GAAP free cash flow as an alternative to GAAP liquidity measures of cash flows from operating activities. The Company has provided reconciliations of these non-GAAP financial measures to the most directly comparable GAAP financial measures. The Company is providing these financial measures because it believes this non-GAAP presentation makes it easier for investors to compare its operating results for current and historical periods and also because the Company believes it assists investors in comparing the Company’s performance across reporting periods on a consistent basis by excluding items that it does not believe are indicative of its core operating performance.
AMD Q3-16 CFO Commentary | Page 9 | October 20, 2016 |
Reconciliation of GAAP to Non-GAAP Gross Margin
(Millions except percentages) | Q3-16 | Q2-16 | Q3-15 | |||||||||
GAAP Gross Margin | $ | 59 | $ | 319 | $ | 239 | ||||||
GAAP Gross Margin % | 5 | % | 31 | % | 23 | % | ||||||
Charge related to the sixth amendment to the WSA with GF | 340 | — | — | |||||||||
Non-GAAP Gross Margin | $ | 399 | $ | 319 | $ | 239 | ||||||
Non-GAAP Gross Margin % | 31 | % | 31 | % | 23 | % | ||||||
Reconciliation of GAAP to Non-GAAP Operating Expenses
(Millions) | Q3-16 | Q2-16 | Q3-15 | |||||||||
GAAP operating expenses | $ | 376 | $ | 353 | $ | 397 | ||||||
Restructuring and other special charges, net | — | (7 | ) | 48 | ||||||||
Stock-based compensation | 23 | 18 | 13 | |||||||||
Non-GAAP operating expenses | $ | 353 | $ | 342 | $ | 336 | ||||||
Reconciliation of GAAP to Non-GAAP Research and Development (R&D) and Marketing, General and Administrative Expenses (SG&A)
(Millions) | Q3-16 | Q2-16 | Q3-15 | |||||||||||||||||||||||||||||||||
R&D | SG&A | Total | R&D | SG&A | Total | R&D | SG&A | Total | ||||||||||||||||||||||||||||
GAAP R&D & SG&A | $ | 259 | $ | 117 | $ | 376 | $ | 243 | $ | 117 | $ | 360 | $ | 241 | $ | 108 | $ | 349 | ||||||||||||||||||
Stock-based compensation | 15 | 8 | 23 | 10 | 8 | 18 | 7 | 6 | 13 | |||||||||||||||||||||||||||
Non-GAAP R&D & SG&A | $ | 244 | $ | 109 | $ | 353 | $ | 233 | $ | 109 | $ | 342 | $ | 234 | $ | 102 | $ | 336 | ||||||||||||||||||
Reconciliation of GAAP Operating Loss to Non-GAAP Operating Income (Loss)
(Millions) | Q3-16 | Q2-16 | Q3-15 | |||||||||
GAAP operating loss | $ | (293 | ) | $ | (8 | ) | $ | (158 | ) | |||
Charge related to the sixth amendment to the WSA with GF | 340 | — | — | |||||||||
Restructuring and other special charges, net | — | (7 | ) | 48 | ||||||||
Stock-based compensation | 23 | 18 | 13 | |||||||||
Non-GAAP operating income (loss) | $ | 70 | $ | 3 | $ | (97 | ) | |||||
AMD Q3-16 CFO Commentary | Page 10 | October 20, 2016 |
Reconciliation of GAAP to Non-GAAP Net Income (Loss)/Income (Loss) per Share
(Millions except per share amounts) | Q3-16 | Q2-16 | Q3-15 | |||||||||||||||||||||
GAAP net income (loss) /income (loss) per share | $ | (406 | ) | $ | (0.50 | ) | $ | 69 | $ | 0.08 | $ | (197 | ) | $ | (0.25 | ) | ||||||||
Charge related to the sixth amendment to the WSA with GF | 340 | 0.39 | — | — | — | — | ||||||||||||||||||
Loss on debt redemption | 61 | 0.07 | — | — | — | — | ||||||||||||||||||
Non-cash interest expense related to convertible debt | 1 | — | — | — | — | — | ||||||||||||||||||
Restructuring and other special charges, net | — | — | (7 | ) | (0.01 | ) | 48 | 0.06 | ||||||||||||||||
Stock-based compensation | 23 | 0.03 | 18 | 0.02 | 13 | 0.02 | ||||||||||||||||||
Gain on sale of 85% of ATMP JV | 4 | — | (150 | ) | (0.19 | ) | — | — | ||||||||||||||||
Equity in income (loss) of ATMP JV | 5 | 0.01 | 3 | — | — | — | ||||||||||||||||||
Tax provision (benefit) related to sale of 85% of ATMP JV | (1 | ) | — | 27 | 0.03 | — | — | |||||||||||||||||
Non-GAAP net income (loss)/ income (loss) per share | $ | 27 | $ | 0.03 | $ | (40 | ) | $ | (0.05 | ) | $ | (136 | ) | $ | (0.17 | ) | ||||||||
Q3 2016 GAAP net loss per share is calculated based on 815 million basic and diluted weighted-average shares of common stock. Non-GAAP net income per share is calculated based on 865 million diluted weighted-average shares of common stock.
Reconciliation of GAAP Operating Loss to Adjusted EBITDA
(Millions) | Q3-16 | Q2-16 | Q3-15 | |||||||||
GAAP operating loss | $ | (293 | ) | $ | (8 | ) | $ | (158 | ) | |||
Charge related to the sixth amendment to the WSA with GF | 340 | — | — | |||||||||
Technology node transition charge | — | — | — | |||||||||
Restructuring and other special charges, net | — | (7 | ) | 48 | ||||||||
Stock-based compensation | 23 | 18 | 13 | |||||||||
Amortization of acquired intangible assets | — | — | — | |||||||||
Depreciation and amortization | 33 | 33 | 42 | |||||||||
Adjusted EBITDA | $ | 103 | $ | 36 | $ | (55 | ) | |||||
Reconciliation of Non-GAAP Free Cash Flow
(Millions) | Q3-16 | Q2-16 | Q3-15 | |||||||||
GAAP net cash provided by (used in) operating activities | 29 | (85 | ) | (56 | ) | |||||||
Purchases of property, plant and equipment | (9 | ) | (21 | ) | (25 | ) | ||||||
Non-GAAP free cash flow | $ | 20 | $ | (106 | ) | $ | (81 | ) | ||||
Reconciliation of GAAP to Non-GAAP Interest Expense, Taxes and Other
(Millions) | Q3-16 |
Interest expense | $ (41) |
Other income (expense), net | (63) |
Provision for income taxes | (4) |
Total GAAP Interest Expense, Taxes and Other | $ (108) |
Loss on debt redemption | 61 |
Non-cash interest expense related to convertible debt | 1 |
Gain on sale of 85% of ATMP JV | 4 |
Tax provision (benefit) related to sale of 85% of ATMP JV | (1) |
Total Non-GAAP Interest Expense, Taxes and Other | $ (43) |
AMD Q3-16 CFO Commentary | Page 11 | October 20, 2016 |
Cautionary Statement
This commentary contains forward-looking statements concerning Advanced Micro Devices, Inc. (AMD), including AMD’s expected annualized cash interest savings; AMD's expected timing of its $100 million payment to GLOBALFOUNDRIES Inc. (GF); AMD’s expected 2016 total wafer purchases from GF; future debt redemptions; its financial outlook for the fourth quarter of 2016, including revenue and the midpoint of revenue, non-GAAP gross margin, non-GAAP operating expenses, the total of IP monetization licensing gain, the total of non-GAAP interest expense, taxes and other expense, its cash and cash equivalents balances, inventory and AMD’s ability to maintain non-GAAP operating profitability in the fourth quarter of 2016; AMD’s ability to generate positive free cash flow from operations in 2016, AMD’s expected basic share count of approximately 930 million common shares, and AMD's expected 2016 revenue, which are made pursuant to the Safe Harbor provisions of the Private Securities Litigation Reform Act of 1995. Forward-looking statements are commonly identified by words such as "would," "may," "expects," "believes," "plans," "intends," "projects" and other terms with similar meaning. Investors are cautioned that the forward-looking statements in this document are based on current beliefs, assumptions and expectations, speak only as of the date of this document and involve risks and uncertainties that could cause actual results to differ materially from current expectations. Such statements are subject to certain known and unknown risks and uncertainties, many of which are difficult to predict and generally beyond AMD's control, that could cause actual results and other future events to differ materially from those expressed in, or implied or projected by, the forward-looking information and statements. Material factors that could cause actual results to differ materially from current expectations include, without limitation, the following: Intel Corporation’s dominance of the microprocessor market and its aggressive business practices may limit AMD’s ability to compete effectively; AMD relies on GF to manufacture all of its microprocessor and accelerated processing unit (APU) products and a certain portion of its discrete graphics processing units (GPUs) products, with limited exceptions. If GF is not able to satisfy AMD’s manufacturing requirements, its business could be adversely impacted; AMD relies on third parties to manufacture its products, and if they are unable to do so on a timely basis in sufficient quantities and using competitive technologies, AMD’s business could be materially adversely affected; failure to achieve expected manufacturing yields for AMD’s products could negatively impact its financial results; the success of AMD’s business is dependent upon its ability to introduce products on a timely basis with features and performance levels that provide value to its customers while supporting and coinciding with significant industry transitions; if AMD cannot generate sufficient revenue and operating cash flow or obtain external financing, it may face a cash shortfall and be unable to make all of its planned investments in research and development or other strategic investments; the loss of a significant customer may have a material adverse effect on AMD; AMD’s receipt of revenue from its semi-custom SoC products is dependent upon its technology being designed into third-party products and the success of those products; global economic uncertainty may adversely impact AMD’s business and operating results; AMD may not be able to generate sufficient cash to service its debt obligations or meet its working capital requirements; AMD has a substantial amount of indebtedness which could adversely affect its financial position and prevent it from implementing its strategy or fulfilling its contractual obligations; the agreements governing AMD’s notes and the Secured Revolving Line of Credit impose restrictions on AMD that may adversely affect its ability to operate its business; the markets in which AMD’s products are sold are highly competitive; uncertainties involving the ordering and shipment of AMD’s products could materially adversely affect it; the demand for AMD’s products depends in part on the market conditions in the industries into which they are sold. Fluctuations in demand for AMD’s products or a market decline in any of these industries could have a material adverse effect on its results of operations; the completion and impact of the 2015 Restructuring Plan, its transformation initiatives and any future restructuring actions could adversely affect it; AMD’s ability to design and introduce new products in a timely manner is dependent upon third-party intellectual property; AMD depends on third-party companies for the design, manufacture and supply of motherboards, software and other computer platform components to support its business; if AMD loses Microsoft Corporation’s support for its products or other software vendors do not design and develop software to run on AMD’s products, its ability to sell its products could be materially adversely affected; AMD’s reliance on third-party distributors and AIB partners subjects it to certain risks; AMD’s inability to continue to attract and retain qualified personnel may hinder its product development programs; in the event of a change of control, AMD may not be able to repurchase its outstanding debt as required by the applicable indentures and its Secured Revolving Line of Credit, which would result in a default under the indentures and its Secured Revolving Line of Credit; the semiconductor industry is highly cyclical and has experienced severe downturns that have materially adversely affected, and may continue to materially adversely affect its business in the future; acquisitions, divestitures and/or joint ventures could disrupt its business, harm its financial condition and operating results or dilute, or adversely affect the price of, its common stock; AMD’s business is dependent upon the proper functioning of its internal business processes and information systems and modification or interruption of such systems may disrupt its business, processes and internal controls; data breaches and cyber-attacks could compromise AMD’s intellectual property or other sensitive information, be costly to remediate and cause significant damage to its business and reputation; AMD’s operating results are subject to quarterly and seasonal sales patterns; if essential equipment, materials or manufacturing processes are not available to manufacture its products, AMD could be materially adversely affected; if AMD’s products are not compatible with some or all industry-standard software and hardware, it could be materially adversely affected; costs related to defective products could have a material adverse effect on AMD; if AMD fails to maintain the efficiency of its supply chain as it responds
AMD Q3-16 CFO Commentary | Page 12 | October 20, 2016 |
to changes in customer demand for its products, its business could be materially adversely affected; AMD outsources to third parties certain supply-chain logistics functions, including portions of its product distribution, transportation management and information technology support services; AMD may incur future impairments of goodwill; AMD’s worldwide operations are subject to political, legal and economic risks and natural disasters, which could have a material adverse effect on it; worldwide political conditions may adversely affect demand for AMD’s products; unfavorable currency exchange rate fluctuations could adversely affect AMD; AMD’s inability to effectively control the sales of its products on the gray market could have a material adverse effect on it; if AMD cannot adequately protect its technology or other intellectual property in the United States and abroad, through patents, copyrights, trade secrets, trademarks and other measures, it may lose a competitive advantage and incur significant expenses; AMD is a party to litigation and may become a party to other claims or litigation that could cause it to incur substantial costs or pay substantial damages or prohibit it from selling its products; AMD’s business is subject to potential tax liabilities; and AMD is subject to environmental laws, conflict minerals-related provisions of the Dodd-Frank Wall Street Reform and Consumer Protection Act as well as a variety of other laws or regulations that could result in additional costs and liabilities. Investors are urged to review in detail the risks and uncertainties in AMD’s Securities and Exchange Commission filings, including but not limited to AMD’s Quarterly Report on Form 10-Q for the quarter ended June 25, 2016.
AMD Q3-16 CFO Commentary | Page 13 | October 20, 2016 |