Attached files
| file | filename |
|---|---|
| 8-K - FORM 8-K - YATRA USA CORP. | v450537_8k.htm |
Exhibit 99.1

PAGE 0 October 2016 Investor Presentation

PAGE 1 Neither Terrapin 3 Acquisition Corporation (“Terrapin”) nor Yatra Online, Inc. (“Yatra”) nor any of their respective affiliat es make any representation or warranty as to the accuracy or completeness of the information contained in this presentation. This presentation has been prepared to ass ist interested parties in making their own evaluation with respect to the proposed business combination of Terrapin and Yatra (the “Proposed Transaction”) and for n o o ther purpose. The data contained herein is derived from various internal and external sources and is not intended to be all - inclusive or to contain all of the information that a person may desire in considering the Proposed Transaction. It is not intended to form the basis of any investment decision or any other dec ision in respect of the Proposed Transaction. Neither Terrapin nor Yatra nor any of their respective affiliates assume any obligation to update the informatio n i n this presentation. This presentation is for informational purposes only and does not constitute an offer to sell, a solicitation of any offer to bu y, or a recommendation to purchase any securities of or any of its affiliates (as such term is defined under the U.S. federal securities laws). The presentation sha ll not constitute a solicitation of a proxy, consent or authorization with respect to any securities or in respect of the Proposed Transaction. This presentation shall al so not constitute an offer to sell or the solicitation of an offer to buy any securities, nor shall there be any sale of securities in any jurisdictions in which such off er, solicitation or sale would be unlawful prior to registration or qualification under the securities laws of any such jurisdiction. No offering of securities shall be ma de except by means of a prospectus meeting the requirements of Section 10 of the Securities Act of 1933, as amended. Forward - Looking Statements The statements in this presentation that are not historical facts are “forward - looking statements” within the meaning of the saf e harbor provisions of the United States Private Securities Litigation Reform Act of 1995. Forward - looking statements may be identified by the use of words such a s “anticipate”, “believe”, “expect”, “estimate”, “project”, “budget”, “forecast”, “intend”, “plan”, “may”, “will”, “could”, “should”, “predicts”, “potential”, “co nti nue”, and other similar expressions that predict or indicate future events or trends or that are not statements of historical matters. Such forward - looking statements are based on current expectations, estimates and projections about the industry and markets in which Yatra operates. Yatra’s beliefs and assumptions are made by its manag eme nt and are not predictions or guarantees of actual performance. Accordingly, actual results and performance may materially differ from results or performan ce expressed or implied by the forward - looking statements. No representation is made as to the reasonableness of the assumptions made within or the accuracy or completeness of any forward - looking statements or other information contained herein. Factors that could cause future results and performance to differ f rom the forward - looking statements include but are not limited to: (1) Yatra’s history of operating losses; (2) competition in the Indian travel industry; (3) d ecl ines or disruptions in the Indian economy; (4) the satisfaction of the conditions to the business combination and other risks related to the completion of the business com bination and actions related thereto; (5) the occurrence of any event, change or other circumstances that could give rise to the termination of the Business Combin ati on Agreement between Terrapin and Yatra, as amended (the “Business Combination Agreement”); (6) the outcome of any legal proceedings that may be instituted ag ainst Terrapin or Yatra following announcement of the Business Combination Agreement and transactions contemplated therein; (7) the ability of Terrap in and Yatra to complete the Proposed Transaction on anticipated terms and schedule, including the ability to obtain stockholder or regulatory approvals o f t he Proposed Transaction; (8) risks relating to any unforeseen liabilities of Terrapin or Yatra; (9) the amount of redemptions made by Terrapin stockholders; (10 ) f uture capital expenditures, expenses, revenues, earnings, synergies, economic performance, indebtedness, financial condition, losses and future prospects; business es and management strategies and the expansion and growth of the operations of Yatra; (11) delays obtaining, adverse conditions contained in, or the inability to obtain necessary regulatory approvals required to complete the Proposed Transaction; (12) the risk that the Proposed Transaction disrupts current plans a nd operations as a result of the announcement and consummation of the Proposed Transaction; (13) the ability to recognize the anticipated benefits of the comb ina tion of Terrapin and Yatra; (14) costs related to the Proposed Transaction; (15) the limited liquidity and trading of Terrapin’s securities; (16) changes in a ppl icable laws or regulations; (17) the possibility that Yatra may be adversely affected by other economic, business, and/or competitive factors; and (18) other risk s a nd uncertainties indicated from time to time in Yatra’s and/or Terrapin’s filings with the Securities and Exchange Commission (the “SEC”) including Terrapin’s Ann ual Report on Form 10 - K for the year ended December 31, 2015 and Yatra’s registration statement on Form F - 4 filed with the SEC on September 29, 2016, as may be amend ed from time to time. Disclosure

PAGE 2 Terrapin and Yatra caution that the foregoing list of factors is not exclusive. Additional information concerning these and o the r risk factors is contained in Terrapin’s and Yatra’s most recent filings with the SEC. All subsequent written and oral forward looking statements concerning Terrapin, Ya tra, the Proposed Transaction, related transactions, or other matters and attributable to Terrapin or any person acting on its behalf, are expressly qualifi ed in their entirety by the cautionary statements above. Terrapin and Yatra caution readers not to place undue reliance upon forward looking statements, which speak on ly as of the date made. Neither Terrapin nor Yatra undertakes any obligation to update or revise any forward - looking statements, whether as a result of new info rmation, future events or otherwise, except as required by law. Industry and Market Data Industry and market data used in this presentation have been obtained from industry publications and sources as well as from res earch reports prepared for other purposes. Neither Terrapin nor Yatra has independently verified the data obtained from these sources and cannot assure you of th e data’s accuracy or completeness. Additional Information This document may be deemed to be solicitation material in respect of the Proposed Transaction. In connection with the Propos ed Transaction, on September 29, 2016, Yatra filed with the SEC a Registration Statement on Form F - 4 that includes a preliminary proxy statement of Terrapin that also constitutes a prospectus of Yatra. Terrapin will mail the proxy statement/prospectus to its stockholders. Stockholders of Terrapin and other interested p ers ons are advised to read Terrapin’s preliminary proxy statement/prospectus and, when available, the definitive proxy statement/prospectus in connection with Terr api n’s solicitation of proxies for its special meeting of stockholders to vote on the Proposed Transaction because these documents contain or will contain important in formation regarding the Proposed Transaction and related matters. The definitive proxy statement/prospectus regarding the Proposed Transaction will b e m ailed to Terrapin’s stockholders as of a record date to be established for voting on the Proposed Transaction. Stockholders will also be able to obtain a copy of such documents, without charge, by directing a request to Terrapin 3 Acquisition Corporation, c/o Terrapin Partners, 1700 Broadway, 18th Floor, New York, New Yo rk 10019, Attn: Stephen Schifrin, Secretary. These documents can also be obtained, without charge, at the SEC’s website at http://www.sec.gov. Participants in the Business Combination Terrapin, Yatra and their respective directors and executive officers may be deemed to be participants in the solicitation of pr oxies from the stockholders of Terrapin in connection with the Proposed Transaction. Information regarding the officers and directors of Terrapin and Yatra and the i nte rests of such potential participants is available in the preliminary proxy statement/prospectus and will also be included in the definitive proxy statement/prospectu s a nd other relevant documents filed or to be filed by Yatra and Terrapin with the SEC regarding the Proposed Transaction. Other All years are calendar years unless otherwise noted as “fiscal year” or “FY”. Disclosure

PAGE 3 Yatra, India’s second largest online travel agent (“OTA”) 2 , is well - positioned to benefit from strong macroeconomic trends Yatra had approximately 4.4 million cumulative customers as of June 30, 2016 and Gross Bookings of $897 million in fiscal yea r 2016 3 Yatra’s multi - channel platform is a competitive advantage in the Indian market Yatra’s channels for customer acquisition are consumers (B2C), corporates (B2E), and travel agents (B2B2C) Yatra has hard - to - duplicate infrastructure including the largest Indian hotel network (61,000+) and more than 14,000 travel agen ts in over 1,100 cities and towns Yatra’s installed mobile base of more than 7 million downloads is positioned to grow up to 6x Reliance, Yatra’s strategic investor and partner, has agreed to pre - load the Yatra app on 35 million new Jio phones over the course of the next 36 months Yatra grew Revenue Less Service Cost by a CAGR of 25% from FY 2014 – FY 2016 3 Terrapin 3’s capital is expected to further accelerate growth Yatra projects positive Adjusted EBITDA in FYE March 2019 and expects to meet its current growth and profit goals without needing additional funding Terrapin 3 is merging with Yatra at an attractive valuation FY 2017E EV / Revenue Less Service Cost of 3.2x 4 versus 5.4x for comparable companies (a 41% discount) 5 Current investors will retain approximately 57% of Yatra Investment thesis India is the fastest growing major economy, travel spending is growing faster than the economy, and online travel booking is taking an increasing share of that market 1 1. Source: Phocuswright 2. Management estimates based on publicly available company filings 3. Refer to Appendix for definitions and reconciliations of non - IFRS measures; assumes 66.33 INR per USD; FY2014 Revenue Less Servi ce Cost amounts have been derived from unaudited financials of various subsidiaries prepared in accordance with local GAAPs i.e. Indian GAAP as well as Singapore Financial Reporting Standard and a ggr egated together. FY2014 amounts should not be interpreted as comparable to FY2015 and FY2016 as FY2014 has been prepared under a different basis of accounting. The Company adopted IFRS as issued by IA SB from FY2015 4. These estimates are based on management assumptions and projections and are not predictions or guarantees of actual performan ce; actual results and performance may materially differ from these estimates 5. Denotes the median 3/31/17 calendarized EV / projected revenue multiple of Ctrip, Expedia, MakeMyTrip, Priceline, Qunar, TripAdvisor, and Webjet per Bloomberg as of 10 /07/2016; refer to page 40 for additional details

PAGE 4 1. Cumulative as of June 30, 2016; does not include data for B2B2C businesses 2. Refer to Appendix for definitions and reconciliations of non - IFRS measures; assumes 66.33 INR per USD 3. Data for flagship brand Yatra.com only and excludes data from B2E and B2B2C businesses 4. Source: The Economic Times 5. Hotel yield refers to amount that the hotel receives per booking after deducting the commission payable to the OTA 6. As of Q4 FY16 Yatra is a leader in the fast - growing Indian travel market Strengths include: Largest hotel network (61,000+) in India Extensive on - the - ground travel agent network (14,000+) to facilitate off - line cash transactions Integrated technology platform across all channels enables cost - effective product management and deployment Strong track record of consistent growth, founded in 2006 with over $130 million invested in Yatra to date Strategic partnership with Reliance Jio Reliance has agreed to pre - load the Yatra app on 35 million new phones Being a part of the Reliance ecosystem is expected to drive down customer acquisition cost Only Indian OTA with strong presence across 3 channels: consumers (B2C), corporates (B2E), and travel agents (B2B2C) Maximizes reach in all facets of the Indian travel market Affinity program (e - cash) allows customers to transfer value with them across channels, and, we believe, drives down customer acquisition cost and builds customer loyalty Returning customers and alignment with vendor - partners Repeat customers spend more per trip and we believe help amortize customer acquisition costs Rolling out marketplace model which links vendors and customers directly via Yatra’s platform, which, we believe, helps improve hotel yields 5 and aligns vendors with Yatra Leading Indian OTA 2,212 employees serving 4.4 million customers 1 $897 million Gross Bookings in FY2016 2 Balanced business model Consumers Corporates Travel agents Strong brand and loyal customers 74% of transactions in FY2016 were from repeat customers 3 Ranked “Most Trusted” Indian travel brand in 2015 4 Large, growing mobile ecosystem 7 million+ app downloads 59% of customer traffic from mobile 6

PAGE 5 1. Management estimates based on publicly available company filings 2. Refer to Appendix for definitions and reconciliations of non - IFRS measures 3. Assumes 66.33 INR per USD 4. FY2014 Revenue Less Service Cost amounts have been derived from unaudited financials of various subsidiaries prepared in acco rda nce with local GAAPs i.e. Indian GAAP as well as Singapore Financial Reporting Standard and aggregated together. FY2014 amounts should not be interpreted as comparable to FY2015 and FY2016 as FY 201 4 has been prepared under a different basis of accounting. The Company adopted IFRS as issued by IASB from FY2015 5. Cumulative as of June 30, 2016; does not include data for B2B2C businesses 6. Data in FY 2016 for flagship brand Yatra.com only and excludes data from B2E and B2B2C businesses 7. As of March 31, 2016 8. In Q4 FY16 4.4m cumulative c ustomers 5 153m visits 6 61k+ hotels in 1,100+ cities 7 74% of transactions from repeat customers 6 59% of traffic from mobile 8 Yatra – India’s 2nd largest online travel platform 1 34.9 40.4 49.3 5.7 7.4 9.6 0.3 0.5 0.6 40.8 48.3 59.5 FY2014 FY2015 FY2016 Air Ticketing Hotels & Packages Others Gross Bookings (INR billion) Revenue Less Service Cost 2 (INR million) 1,891 2,331 2,877 616 852 1,017 171 243 284 2,678 3,426 4,178 FY2014 FY2015 FY2016 Air Ticketing Hotels & Packages Others / $897 million 3 / $63 million 3 4

Industry Overview

PAGE 7 The economy is driven by a young population where the median age is 27 1 Travel expenditures forecast to grow significantly faster than the economy 1. Source: UN State of the World’s Population (2014) 2. Source: World Bank 3. Source: Phocuswright 4. Source: Phocuswright, World Bank -6% -4% -2% 0% 2% 4% 6% 8% 10% 12% 2015E 2016E 2017E 2018E Russia US China Brazil India’s travel industry has significant room to grow India’s GDP growth tops other economies 2 (GDP Annual % change) India is the fastest growing global economy Travel expenditures forecast to grow significantly faster than the economy Indian GDP Indian travel market 3 7 39 India China 3 24 India China China 8x India China 5.5x India Hotel spending 4 2013, USD, per capita Airline spending 4 2013, USD, per capita
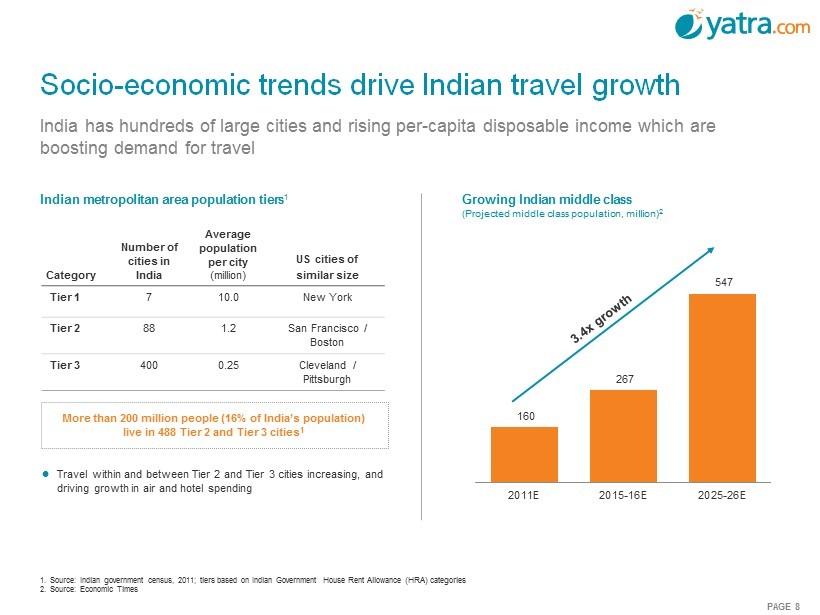
PAGE 8 160 267 547 2011E 2015-16E 2025-26E 1. Source: Indian government census, 2011; tiers based on Indian Government House Rent Allowance (HRA) categories 2. Source: Economic Times India has hundreds of large cities and rising per - capita disposable income which are boosting demand for travel Growing Indian middle class (Projected middle class population, million) 2 Indian metropolitan area population tiers 1 Socio - economic trends drive Indian travel growth Category Number of cities in India Average population per city (million) US cities of similar size Tier 1 7 10.0 New York Tier 2 88 1.2 San Francisco / Boston Tier 3 400 0.25 Cleveland / Pittsburgh Travel within and between Tier 2 and Tier 3 cities increasing, and driving growth in air and hotel spending More than 200 million people (16% of India’s population) live in 488 Tier 2 and Tier 3 cities 1

PAGE 9 5% 13% 16% 10% 15% 24% 7% 10% 20% 2013-14 2014-15 2015-16 Major Metro Airports Secondary Airports Smaller Regional Airports Demographics, government policy, and an improved investment environment are driving growth, especially in Tier 2 and Tier 3 cities 1 1. Tiers based on Indian Government House Rent Allowance (HRA) categories 2. Source: IATA, November 2014 3. Source: Airports Authority of India. “Major Metro Airports” represents airports with more than 10m air passengers in 2015 - 16; “S econdary Airports” represents airports with 5m – 10m air passengers in 2015 - 16; “Smaller Regional Airports” represents airports with 200k – 5m air passengers in 2015 - 16 Secondary and smaller regional airports are currently growing faster than Major Metro Airports in India (YoY growth – passengers handled 3 ) Global air travel rankings (Ranked by annual million passengers 2 ) Indian air travel forecast to be world’s 3rd largest market by 2032 1 2 3 4 5 6 7 8 9 10 2014 2016 2018 2020 2022 2024 2026 2028 2030 2032 2034 China US India UK

PAGE 10 8.7 9.7 10.8 12.0 13.5 15.2 17.1 3.7 4.3 4.9 5.6 6.4 7.3 8.4 2014 2015 2016E 2017E 2018E 2019E 2020E Total air travel Online leisure and unmanaged business air travel Indian air travel gross bookings 2 (USD billion, % penetration) 57.8 60.1 67.4 81.1 45.6 56.1 12.3 13.2 16.9 18.4 10.8 11.5 70.0 73.3 84.2 99.5 56.3 67.5 2012 2013 2014 2015 2015 July YTD 2016 July YTD Domestic International Indian air travel passengers on domestic airlines 1 (million) Indian air travel industry growing steadily 1. Source: Directorate General of Civil Aviation 2. Source: Phocuswright; assumes 67 INR per USD for all periods 14% 15% 15% 15% 15% 14% 11% 12% 12% 12% 12% 13% 4% 12% 20% 5% 15% 18% 23% 20% 43% 44% 45% 46% 47% 48% 49%

PAGE 11 Offline 59% Online 41% Offline 65% Online 35% Source: Phocuswright; online refers to online leisure / unmanaged business travel; assumes 67 INR per USD for all periods Indian online hotel and air gross bookings expected to grow nearly 2x to $11 billion by 2020E 18% Online CAGR 16% Online CAGR Offline 69% Online 31% 2014 2020E Total: $14.7 billion Online: $4.5 billion Total: $18.0 billion Online: $6.3 billion Total: $28.0 billion Online: $11.4 billion 2016E Indian hotel and air travel gross bookings

PAGE 12 17% 39% 41% 45% 58% 72% India Japan Brazil Russia China US 721 462 287 139 115 103 China India US Brazil Japan Russia Smartphone penetration rate 3 Internet users 1 (million) Technology adoption surging from a low base Web penetration: US: 89% China: 52% India: 37% Smartphone ownership 2 (million) 76 123 168 2013 2014E 2015E 1. Source: Internetworldstats.com, June 30, 2016 2. Source: eMarketer, Dec 2014. Represents individuals who own a smartphone and use it at least once per month 3. Source: Pew Research Centre, Smartphone ownership and Internet Usage Continues to Climb in Emerging Economies, Spring 2015 Gl oba l Attitudes survey. Represents % of adults who report owning a smartphone India’s internet market is larger than the US and growing rapidly. Although smartphone usage in India has risen rapidly, penetration rate still significantly lags other countries

PAGE 13 Low penetration rate for online bookings of hotels provides significant room for growth (Online percentage of gross bookings, 2015) 5 Lodging market expands with online sales growing 2x faster than offline sales 17% 49% 44% Hotel Rail Domestic air Indian lodging market continues to grow (2010 – 2020) (USD billion) 1, 2, 4 3.8 4.3 4.7 5.1 5.7 6.3 6.6 6.8 7.1 7.3 7.6 0.3 0.3 0.4 0.4 0.5 0.6 0.7 0.8 0.9 1.1 1.2 2010 2011 2012 2013 2014 2015 2016 2017 2018 2019 2020 Online sales Offline sales Online sales CAGR 3 more than 2x of offline sales CAGR 3 CAGR 3 (2010 - 20) 1. At 64.139 INR per 1 USD for 2010 - 2020 2. Current /nominal value for the India lodging value sales have been used for the historic period 2010 to 2015 data and constan t / real value have been used for the forecast period 2016 to 2020 data including the calculation of the compound annual growth rate 3. 2010 - 2020 compound annual growth rate for online lodging value sales (16.9%) is expected to be more than twice as high as offlin e lodging value sales (7.1%) in the same time period 4. Source: Euromonitor International Travel 2016 edition 5. Source: Phocuswright, India Online Travel Overview Ninth Edition, July 2016 Online lodging market is still in early stages of development Source: Euromonitor International Travel 2016 edition Source: Phocuswright 7.1% 3 16.9% 3

PAGE 14 Consumer spending: India is where China was Chinese online travel agents have benefited from economic development China 1 India 1 China 2015 GDP per capita (USD) 2004 $1,498 2014 $1,487 $7,920 2 Organized retail penetration 1999 ~10% 2014 9 - 10% 20% 3 Online shoppers 2006 43m 2014 38m 413m 4 Spend per online buyer (USD) 2007 $135 2014 $104 $1,762 4 Internet penetration 2008 23% 2014 20% 50% 2 Smartphone penetration 2010 13% 2014 14% 58% 5 0 2 4 6 8 10 2010 2011 2012 2013 2014 2015 0 100 200 300 400 500 600 Comparison of key economic and online commerce indicators between China and India 0 2 4 6 8 10 2002 2004 2006 2008 2010 2012 2014 0 300 600 900 1,200 1,500 1,800 1. Source: Credit Suisse Equity Research. India Internet Primer #2, August 2015 2. Source: World Bank; internet penetration refers to internet users per 100 people 3. Source: Business Standard, February 2015 4. Source: Statista, 2015 5. Source: Pew Research Centre. Represents % of adults who report owning a smartphone 6. Source: Bloomberg IPO IPO Revenues 6 GDP per capita 2 Revenues 6 GDP per capita 2 China GDP per capita (USD ‘000) Ctrip and Qunar revenues (USD million)
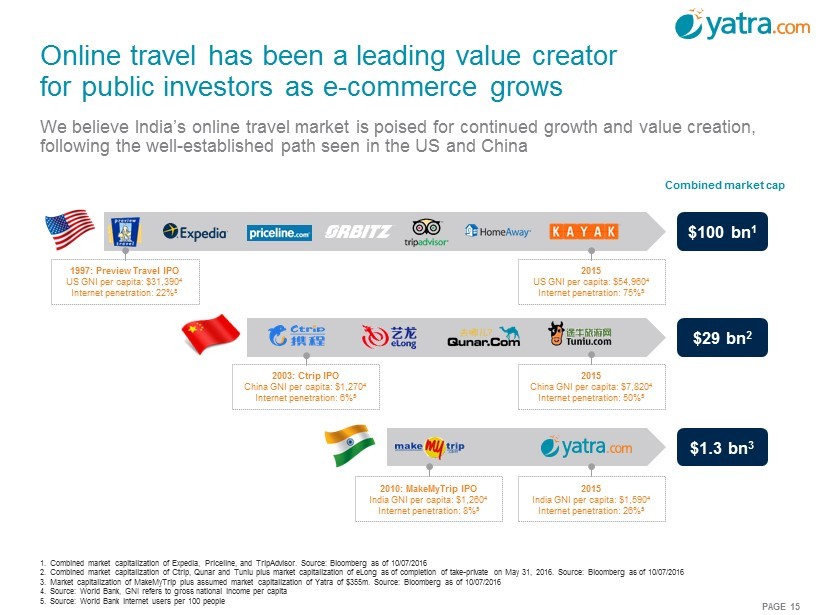
PAGE 15 Online travel has been a leading value creator for public investors as e - commerce grows We believe India’s online travel market is poised for continued growth and value creation, following the well - established path seen in the US and China 1. Combined market capitalization of Expedia, Priceline, and TripAdvisor. Source: Bloomberg as of 10/07/2016 2. Combined market capitalization of Ctrip, Qunar and Tuniu plus market capitalization of eLong as of completion of take - private on May 31, 2016. Source: Bloomberg as of 10/07/2016 3. Market capitalization of MakeMyTrip plus assumed market capitalization of Yatra of $355m. Source: Bloomberg as of 10/07/2016 4. Source: World Bank, GNI refers to gross national income per capita 5. Source: World Bank internet users per 100 people $100 bn 1 $29 bn 2 $1.3 bn 3 Combined market cap 2015 US GNI per capita: $54,960 4 Internet penetration: 75% 5 2003: Ctrip IPO China GNI per capita: $1,270 4 Internet penetration: 6% 5 2015 China GNI per capita: $7,820 4 Internet penetration: 50% 5 2010: MakeMyTrip IPO India GNI per capita: $1,260 4 Internet penetration: 8% 5 2015 India GNI per capita: $1,590 4 Internet penetration: 26% 5 1997: Preview Travel IPO US GNI per capita: $31,390 4 Internet penetration: 22% 5

Yatra Business Overview

PAGE 17 Yatra is well positioned to capitalize on industry growth Growth in Tier 2 and Tier 3 cities Largest Indian hotel inventory among OTAs 1 further supported by strategic alliance with Reliance Jio Favorable market dynamics in air travel for OTAs Leveraging strength of the air business to drive growth across entire platform Over - investment in hotels today by other OTAs Focus on building a loyal customer base and investing in growth efficiently (e.g. Reliance Jio alliance) Continued reliance on cash and off - line transactions B2B2C 14,000 - agent channel captures in - person, cash transactions Key trends we expect in the Indian travel market Yatra’s competitive positioning Fast - growing corporate travel market B2E channel provides a comprehensive corporate travel solution for Indian companies Yatra’s strategy is tailored to benefit from key trends in the Indian travel market and capture share in markets under - served by its competitors 1. Compared with MakeMyTrip, ClearTrip , GoIbibo

PAGE 18 Complete offerings Air 9 Domestic carriers 275+ International carriers Hotels & Lodging 61,000+ Indian properties plus growing homestays Holiday packages Rail, bus, activities, others Multi - channel customer access Direct - to - consumer “B2C” 153m visits 1 in FY 2016; 4.4m customers 2 Corporate travelers “B2E” Corporate customers have 1.4m+ employees Travel agents “B2B2C” 14,000+ registered agents across India 3 Yatra’s ecosystem links all channels and products Yatra is on a common platform. An affinity program (e - cash), which allows customers to transfer value with them across channels, builds cross - sales and loyalty 1. Data for flagship brand Yatra.com only and excludes data from B2E and B2B2C businesses 2. Cumulative as of June 30, 2016; does not include data for B2B2C businesses 3. As of March 31, 2016

PAGE 19 Maximize reach by supporting a common delivery platform across channels Build on most trusted brand in OTA market 1 to further strengthen loyalty 153 million visits 2 in FY 2016 and more than 4.4 million cumulative customers 3 Increase mobile growth and reduce cost of customer acquisition with Reliance Jio alliance and participating in the Reliance ecosystem Large market offering driving cross - selling and up - selling opportunities Corporate travel: B2E Corporate relationships are strategic, service driven, and less price - sensitive Specialized workforce of 350+ serving corporate travel departments Brings higher value customers to airline and hotel partners Helps drive down customer acquisition costs as customers migrate from B2E to B2C Travel agents: B2B2C 14,000 travel agents nationwide - difficult to replicate network across India Serve customers who prefer to pay with cash; India is still largely a cash - pay market Penetrate deeper into Tier 2 and Tier 3 cities and first - time travelers Expected to remain an important strategic strength Direct to consumer: B2C Unified technology platform and online marketplace linking customers and suppliers Multi - channel strategy 1. Source: Economic Times 2. Data for flagship brand Yatra.com only and excludes data from B2E and B2B2C businesses 3. As of June 30, 2016; does not include data for B2B2C businesses
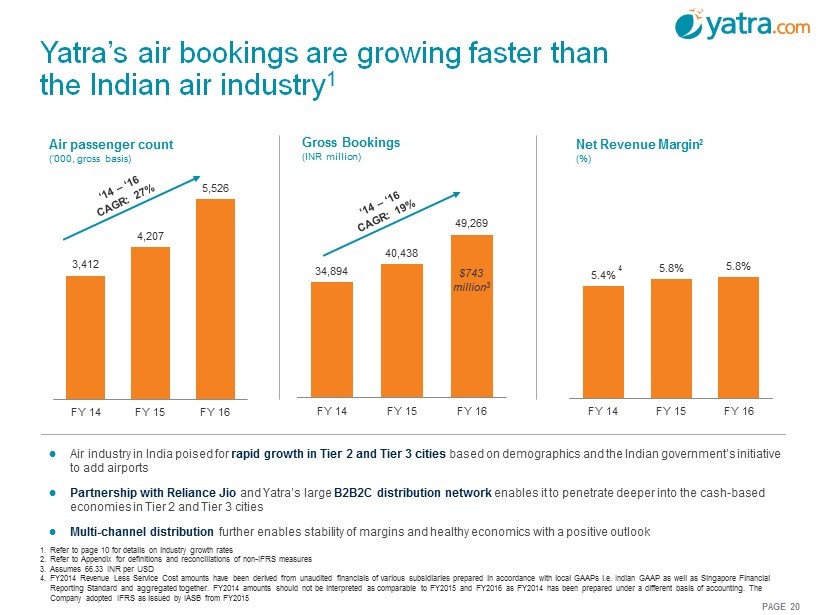
PAGE 20 3,412 4,207 5,526 FY 14 FY 15 FY 16 Air passenger count (‘000, gross basis) Air industry in India poised for rapid growth in Tier 2 and Tier 3 cities based on demographics and the Indian government’s initiative to add airports Partnership with Reliance Jio and Yatra’s large B2B2C distribution network enables it to penetrate deeper into the cash - based economies in Tier 2 and Tier 3 cities Multi - channel distribution further enables stability of margins and healthy economics with a positive outlook Yatra’s air bookings are growing faster than the Indian air industry 1 1. Refer to page 10 for details on industry growth rates 2. Refer to Appendix for definitions and reconciliations of non - IFRS measures 3. Assumes 66.33 INR per USD 4. FY2014 Revenue Less Service Cost amounts have been derived from unaudited financials of various subsidiaries prepared in acco rda nce with local GAAPs i.e. Indian GAAP as well as Singapore Financial Reporting Standard and aggregated together. FY2014 amounts should not be interpreted as comparable to FY2015 and FY2016 as FY 201 4 has been prepared under a different basis of accounting. The Company adopted IFRS as issued by IASB from FY2015 34,894 40,438 49,269 FY 14 FY 15 FY 16 5.4% 5.8% 5.8% FY 14 FY 15 FY 16 Gross Bookings (INR million) Net Revenue Margin 2 (%) $743 million 3 4

PAGE 21 116 117 19 118 40 422 90 144 9 42 538 207 163 127 11 6 4 3 Current fleet On Order Total 1. Source: Phocuswright 2. Source: Company reports and press articles 3. Source: Wall Street Journal Airline capacity expected to grow significantly Reported to be in talks with Boeing, Airbus, and others to order up to 250 aircraft 3 332 Indian airlines are adding capacity to meet projected demand, creating a favorable environment for Yatra Current airline fleet and orders 2 19% 0% 4% 6% 11% 2011 2012 2013 2014 2015 Airline supply YoY growth rates 1 Recovery from Kingfisher Airlines shutdown

PAGE 22 Yatra’s Hotels and Packages business continues to grow 761 944 1,139 FY 14 FY 15 FY 16 78 100 130 FY 14 FY 15 FY 16 Standalone hotel room nights 3 (‘000, gross basis) Largest hotel network in India with more than 61,000 hotels , giving customers the most extensive choice Focus on high - growth Tier 2 and Tier 3 cities and budget hotels Leverage multiple channels ( B2C / B2B2C / B2E ) to optimize growth and profitability Single technology platform serving all 3 channels as well as the marketplace and homestays businesses Developing custom solutions and growing marketplace platform to serve smaller hoteliers and holiday package sellers Focus on sustainable growth – not relying solely on promotions and discounts Holiday packages passengers travelled (‘000) Hotels & Packages Gross Bookings (INR million) 1. Assumes 66.33 INR per USD 2. Excludes room nights associated with holiday packages 5,670 7,368 9,614 FY 14 FY 15 FY 16 $145 million 2
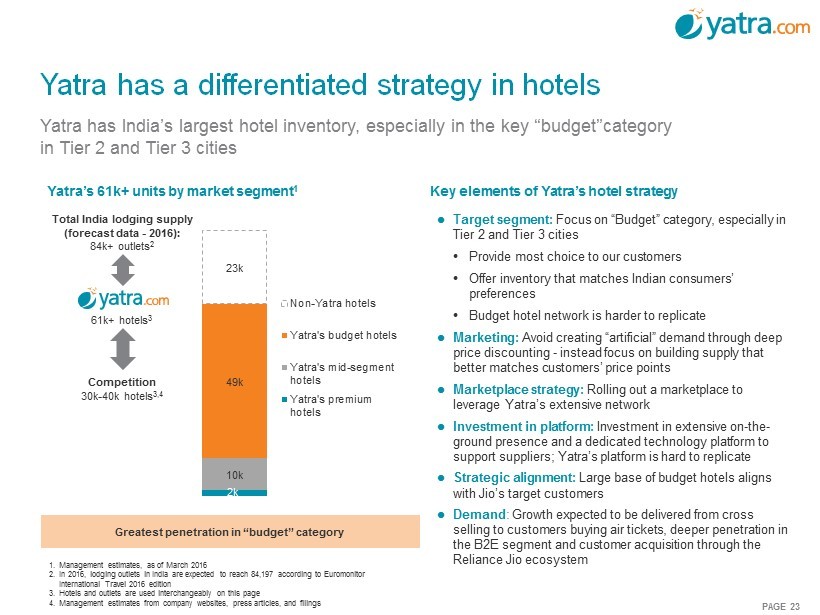
PAGE 23 Yatra has a differentiated strategy in hotels Yatra has India’s largest hotel inventory, especially in the key “ budget”category in Tier 2 and Tier 3 cities 1. Management estimates, as of March 2016 2. In 2016, lodging outlets in India are expected to reach 84,197 according to Euromonitor International Travel 2016 edition 3. Hotels and outlets are used interchangeably on this page 4. Management estimates from company websites, press articles, and filings Yatra’s 61k+ units by market segment 1 2k 10k 49k 23k Non-Yatra hotels Yatra's budget hotels Yatra's mid-segment hotels Yatra's premium hotels Competition 30k - 40k hotels 3,4 Total India lodging supply (forecast data - 2016): 84k+ outlets 2 Target segment: Focus on “Budget” category, especially in Tier 2 and Tier 3 cities • Provide most choice to our customers • Offer inventory that matches Indian consumers’ preferences • Budget hotel network is harder to replicate Marketing: Avoid creating “artificial” demand through deep price discounting - instead focus on building supply that better matches customers’ price points Marketplace strategy: Rolling out a marketplace to leverage Yatra’s extensive network Investment in platform: Investment in extensive on - the - ground presence and a dedicated technology platform to support suppliers; Yatra’s platform is hard to replicate Strategic alignment: Large base of budget hotels aligns with Jio’s target customers Demand : Growth expected to be delivered from cross selling to customers buying air tickets, deeper penetration in the B2E segment and customer acquisition through the Reliance Jio ecosystem Key elements of Yatra’s hotel strategy Greatest penetration in “budget” category 61k+ hotels 3

PAGE 24 Year Hotel market Gross Bookings (USD million) 2 Online % hotel market 2 OTA % online 2 OTA revenue pool 3 (USD million) 2016 $7,241 20% 75% $193 2017 $7,991 23% 77% $250 … 2020 $10,941 27% 78% $420 Online hotel bookings is still nascent We believe the online hotel industry in India does not warrant excessive spending Estimated hotel market opportunity in India for OTAs 1 1. Source: Phocuswright 2. Assumes 67 INR per USD for all periods 3. Management assumption of 18% projected OTA commissions as % of Gross Bookings According to Phocuswright, online penetration of hotels bookings is currently at 20% with ~75% of those transacted on OTA websites We do not believe deep discounting and subsidies create long - term customers When e - commerce companies in India have scaled back their discounting, we believe there has been a significant slow down in their growth rates Given the long - term value creation opportunity in hotels, we will continue to invest in building out supply and in technology that will enable budget hotels to manage their inventory and pricing on our marketplace platform, providing these hotels with superior distribution We believe current aggregate losses of key competitors are projected to be larger than the hotel revenue pool for the entire OTA market
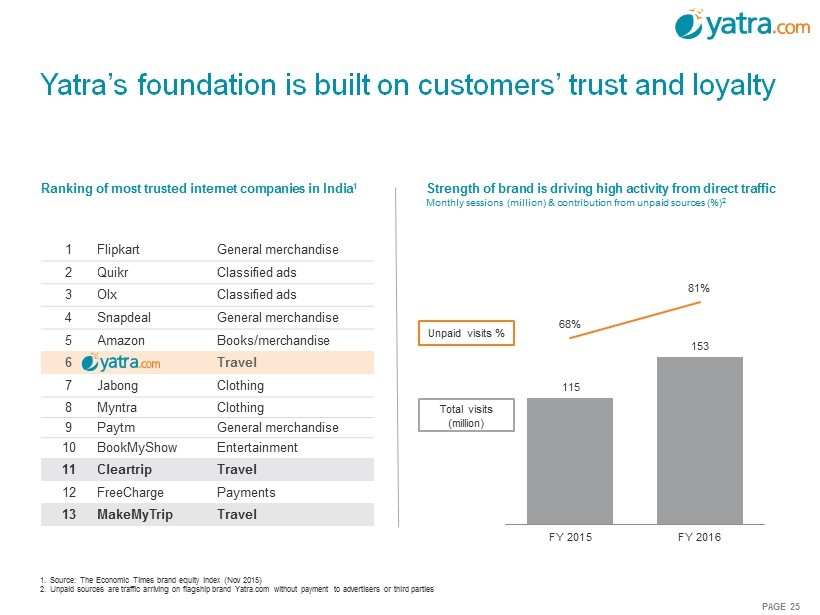
PAGE 25 Ranking of most trusted internet companies in India 1 1 Flipkart General merchandise 2 Quikr Classified ads 3 Olx Classified ads 4 Snapdeal General merchandise 5 Amazon Books/merchandise 6 Travel 7 Jabong Clothing 8 Myntra Clothing 9 Paytm General merchandise 10 BookMyShow Entertainment 11 Cleartrip Travel 12 FreeCharge Payments 13 MakeMy Trip Travel Yatra’s foundation is built on customers’ trust and loyalty Strength of brand is driving high activity from direct traffic Monthly sessions (million) & contribution from unpaid sources (%) 2 115 153 68% 81% FY 2015 FY 2016 1. Source: The Economic Times brand equity index (Nov 2015) 2. Unpaid sources are traffic arriving on flagship brand Yatra.com without payment to advertisers or third parties Unpaid visits % Total visits (million)

PAGE 26 Total customers transacting (‘000) 2 ( FY14 - 16, growth in %) Transactions per customer 2 ( FY14 - 16, growth in %) 398 283 534 342 682 417 Number of new customers Number of repeat customers 1.51 2.79 1.57 2.84 1.73 3.37 Number of transactions by new customers Number of transactions by repeat customers Consistently adding new customers 1 Rising average transaction value across all customers 1 (New and returning, INR ‘000) 12.5 26.7 2007 2010 2013 2015 Yatra’s improving customer metrics FY14 FY15 FY16 Reflects impact of eCash 1. Does not include data for B2B2C businesses 2. Data for flagship brand Yatra.com only and excludes data from B2E and B2B2C businesses FY14 FY15 FY16 FY14 FY15 FY16 FY14 FY15 FY16 2006 2007 2008 2009 2010 2011 2012 2013 2014 2015 2016 4.4m Customer additions in Jan - June 2016 401k
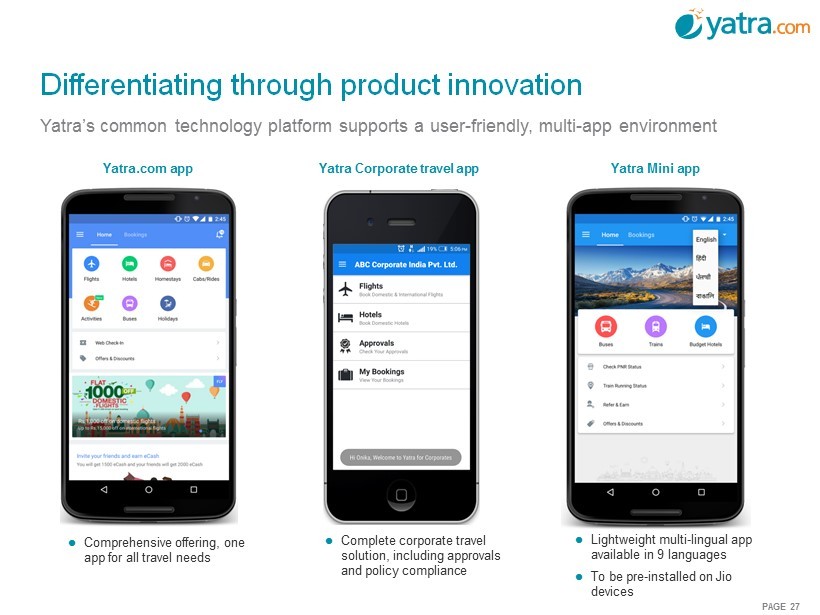
PAGE 27 Yatra Mini app Differentiating through product innovation Comprehensive offering, one app for all travel needs Complete corporate travel solution, including approvals and policy compliance Lightweight multi - lingual app available in 9 languages To be pre - installed on Jio devices Yatra Corporate travel app Yatra.com app Yatra’s common technology platform supports a user - friendly, multi - app environment

PAGE 28 Yatra’s mobile bookings now greater share of traffic 2 (% of bookings) 0% 20% 40% 60% 80% 100% Jan 14 Jul 14 Jan 15 Jul 15 Jan 16 Mobile Desktop Customers embracing mobile ecosystem Yatra’s mobile bookings increasing steadily in air and hotel 2 (% of bookings on mobile) Yatra’s investment in its mobile platform has led to a rapid increase in mobile bookings; 89% of mobile travel bookings in India were made through OTAs in 2015 1 1. Source: Phocuswright 2. Data for flagship brand Yatra.com only and excludes data from B2E and B2B2C businesses 0% 10% 20% 30% 40% 50% Q4 FY14 Q1 FY15 Q2 FY15 Q3 FY15 Q4 FY15 Q1 FY16 Q2 FY16 Q3 FY16 Q4 FY16 Air Hotels

PAGE 29 Source: Yatra company data, management estimates, Reliance Industries company reports. Reliance Jio alliance: a catalyst for growth Reliance Industries is launching one of India’s largest 4G networks under the “Jio” brand — Jio is seeking 100 million new customers and expects to serve 18,000 cities, towns and villages covering more than 90% of India’s population by March 2017 Reliance seeks to fundamentally disrupt India’s telecommunications market by offering free voice telephony, the world’s lowest - cost data plans, and ultra - affordable hardware Reportedly has enrolled 16 million new subscribers within one month of launch with capacity to enroll up to 1 million customers per day Yatra will issue equity to Reliance for preloading the Yatra app, further strengthening the strategic alliance with Reliance We believe this alliance will substantially lower Yatra’s customer acquisition costs and is expected to increase our mobile app install base by up to 6x Yatra’s mobile app to be pre - loaded on 35 million Reliance “LYF” branded phones, increasing installed base from over 7 million to more than 42 million smartphones
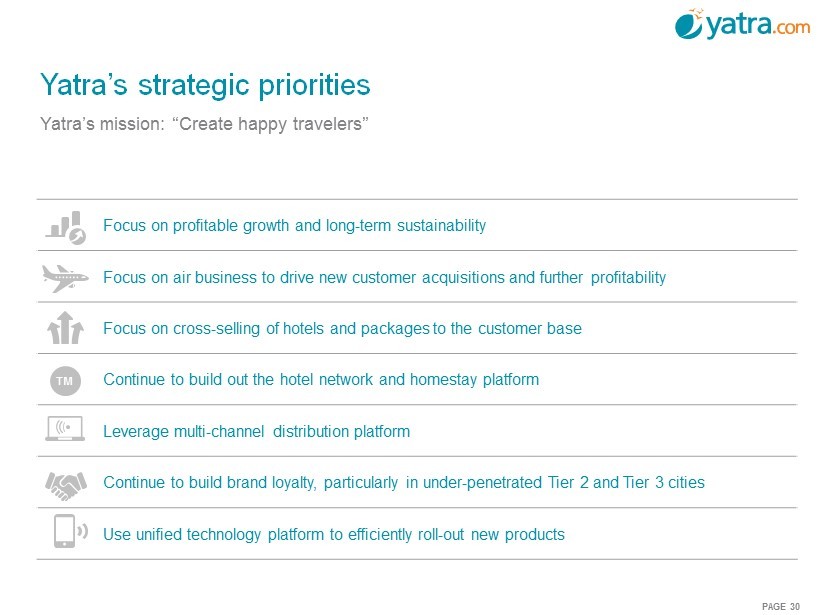
PAGE 30 Yatra’s mission: “Create happy travelers” Yatra’s strategic priorities Focus on profitable growth and long - term sustainability Focus on air business to drive new customer acquisitions and further profitability Focus on cross - selling of hotels and packages to the customer base Continue to build out the hotel network and homestay platform Leverage multi - channel distribution platform Continue to build brand loyalty, particularly in under - penetrated Tier 2 and Tier 3 cities Use unified technology platform to efficiently roll - out new products TM

PAGE 31 Name and title Background Years in travel industry Dhruv Shringi Co - Founder and CEO Experience: Ebookers.com, Ford Motors, Arthur Anderson Education: MBA - INSEAD, Chartered Accountant 13 Manish Amin Co - Founder and CIO Experience: Ebookers.com Education : Btech National and Business Management – South Thames College, London 24 Alok Vaish CFO Experience: HSIL Ltd., Deutsche Bank Education: MBA - Darden School of Business, Chartered Accountant 9 Himanshu Verma CTO Experience: Flipkart, Yahoo Education: EMP - IIM Bangalore, Univ. of Lucknow 2 Sharat Dhall COO – B2C Experience: Trip Advisor India, Hindustan Unilever Education: MBA - XLRI Jamshedpur, BITS Pilani 11 Akash Poddar COO – B2B Experience: Travel Boutique Online, Triburg Sportswear, Indorama Synthetics Education: MBA - Thunderbird School of Management 8 Sunny Sodhi COO – Corporate Experience: Carlson Wagonlit, HRG Sita Education: Bcom (Hons) Delhi University, Diploma in Hotel Management and Tourism 16 Shared Experience Travel Industry Online Product Internet Technologies Operational Discipline Public Company Experience Venture and strategic investors: Operational experience backed by strong partners Management and employees will own 9% of Yatra on a pro - forma basis 1 1. Includes 271,013 shares owned by Dhruv Shringi, 271,013 shares owned by Manish Amin, 2,193,811 RSUs, and dilutive effect of 873,724 options at a strike price of $3.81 (assuming treasury stock method)

Yatra Financial Overview
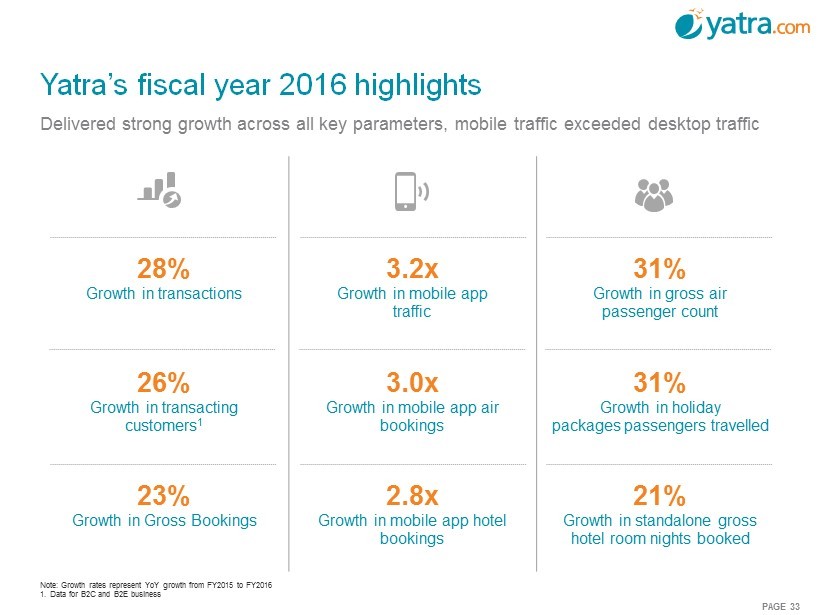
PAGE 33 28% Growth in transactions 3.2x Growth in mobile app traffic 31% Growth in gross air passenger count 26% Growth in transacting customers 1 3.0x Growth in mobile app air bookings 31% Growth in holiday packages passengers travelled 23% Growth in Gross Bookings 2.8x Growth in mobile app hotel bookings 21% Growth in standalone gross hotel room nights booked Note: Growth rates represent YoY growth from FY2015 to FY2016 1. Data for B2C and B2E business Yatra’s fiscal year 2016 highlights Delivered strong growth across all key parameters, mobile traffic exceeded desktop traffic

PAGE 34 Revenue Less Service Cost 1 grew by 22% in FY16 with Adjusted EBITDA 1 losses of only INR 952 million ($14 million) 2 Net Revenue Margin 1 has been stable at 7.1% in FY15 and 7.0% in FY16 Growth rates expected to increase due to: — Improved economic trends and air connectivity – particularly for Tier 2 and Tier 3 cities — Investment of Terrapin 3’s capital — Benefit from the incremental market reach of the Reliance Jio transaction Growth has been consistent and is expected to accelerate 1. Refer to Appendix for definitions and reconciliations of non - IFRS measures 2. Assumes 66.33 INR per USD 3. These estimates are based on management assumptions and projections and are not predictions or guarantees of actual performan ce; actual results and performance may materially differ from these estimates 4. Assumes 67 INR per USD 5. FY2014 Revenue Less Service Cost amounts have been derived from unaudited financials of various subsidiaries prepared in acco rda nce with local GAAPs i.e. Indian GAAP as well as Singapore Financial Reporting Standard and aggregated together. FY2014 amounts should not be interpreted as comparable to FY2015 and FY2016 as FY 201 4 has been prepared under a different basis of accounting. The Company adopted IFRS as issued by IASB from FY2015 Accelerating growth 2,678 3,426 4,178 5,511 7,923 10,456 13,425 FY14 FY15 FY16 FY17E FY18E FY19E FY20E 40.8 48.3 59.5 77.2 104.1 135.1 170.4 FY14 FY15 FY16 FY17E FY18E FY19E FY20E Gross Bookings 3 (INR billion) Revenue Less Service Cost 1,3 (INR million) $2.5 billion 4 $1.2 billion 4 $200 million 4 $82 million 4 5

PAGE 35 Operating leverage is expected to lead to significant margin improvement Scale anticipated to lead to profitability 1. Refer to Appendix for definitions and reconciliations of non - IFRS measures 2. Excludes share based payment expense 3. These estimates are based on management assumptions and projections and are not predictions or guarantees of actual performan ce; actual results and performance may materially differ from these estimates FYE March 31 2015 2016 2017E 3 2018E 3 2019E 3 2020E 3 Revenue Less Service Cost (INR million) 1 3,426 4,178 5,511 7,923 10,456 13,425 Personnel expenses 2 (% of Revenue Less Service Cost ) 33% 36% 33% – 36% 27% – 30% 25% – 28% 23% – 26% Marketing and sales promotion expenses (% of Revenue Less Service Cost) 43% 40% 42% – 45% 43% – 46% 42% – 45% 41% – 44% Other operating expenses (% of Revenue Less Service Cost ) 46% 47% 38% – 40% 32% – 34% 29% – 31% 26% – 28% Adjusted EBITDA 1 (% of Revenue Less Service Cost) (22%) (23%) (21%) – (13%) (11%) – (3%) (3%) – 5% 2% – 10% Adjusted EBITDA (% of Revenue Less Service Cost) 1,3 (22%) (23%) (13%) (3%) 5% 10% (21%) (11%) (3%) 2% (30%) (10%) 10% 30% FY2015 FY2016 FY2017E FY2018E FY2019E FY2020E
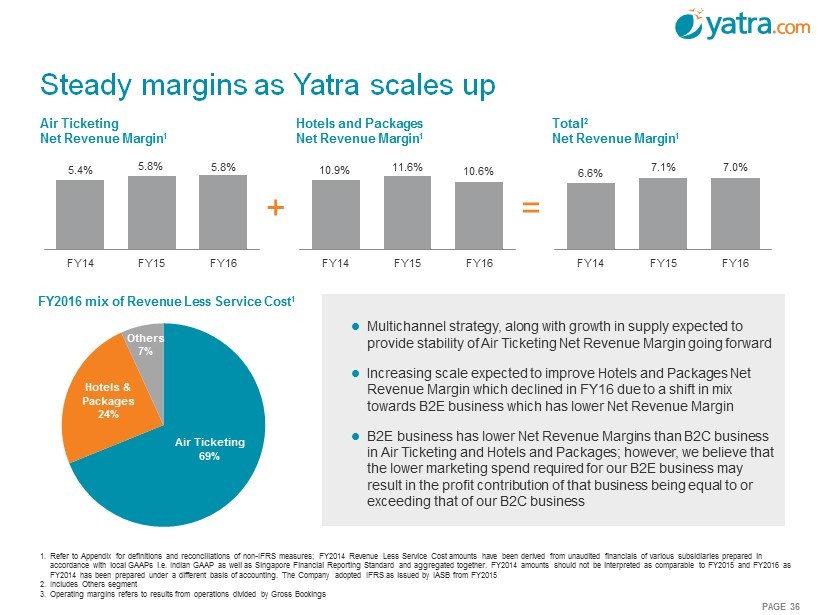
PAGE 36 Air Ticketing Net Revenue Margin 1 5.4% 5.8% 5.8% FY14 FY15 FY16 Hotels and Packages Net Revenue Margin 1 10.9% 11.6% 10.6% FY14 FY15 FY16 Steady margins as Yatra scales up + 6.6% 7.1% 7.0% FY14 FY15 FY16 Multichannel strategy, along with growth in supply expected to provide stability of Air Ticketing Net Revenue Margin going forward Increasing scale expected to improve Hotels and Packages Net Revenue Margin which declined in FY16 due to a shift in mix towards B2E business which has lower Net Revenue Margin B2E business has lower Net Revenue Margins than B2C business in Air Ticketing and Hotels and Packages; however, we believe that the lower marketing spend required for our B2E business may result in the profit contribution of that business being equal to or exceeding that of our B2C business Total 2 Net Revenue Margin 1 = Others 7% FY2016 mix of Revenue Less Service Cost 1 1. Refer to Appendix for definitions and reconciliations of non - IFRS measures; FY2014 Revenue Less Service Cost amounts have been d erived from unaudited financials of various subsidiaries prepared in accordance with local GAAPs i.e. Indian GAAP as well as Singapore Financial Reporting Standard and aggregated together. FY201 4 a mounts should not be interpreted as comparable to FY2015 and FY2016 as FY2014 has been prepared under a different basis of accounting. The Company adopted IFRS as issued by IASB from FY2015 2. Includes Others segment 3. Operating margins refers to results from operations divided by Gross Bookings Air Ticketing 69% Hotels & Packages 24%

PAGE 37 Yatra expects to achieve its goals without needing further capital Strategic investment priorities Brand Marketing Further strengthen brand marketing, especially in Tier 2 and Tier 3 cities to increase direct traffic Increase mobile app downloads Enhance B2E sales and distribution capabilities Technology Continuous investment in technology and consumer experience Focus on conversion to app environment for stickier revenue Enhance the marketplace platform for sellers Enhance local language capabilities to penetrate deeper into India Hotels Add more hotels to network to strengthen leading market position Working capital for select inventory investment Continue build - out of online marketplace model Innovations Refine existing holiday packages product – move toward online and away from call centers Enhance products such as homestays offering Product development and data science Proceeds from the transaction are expected to accelerate growth TM

Transaction Overview
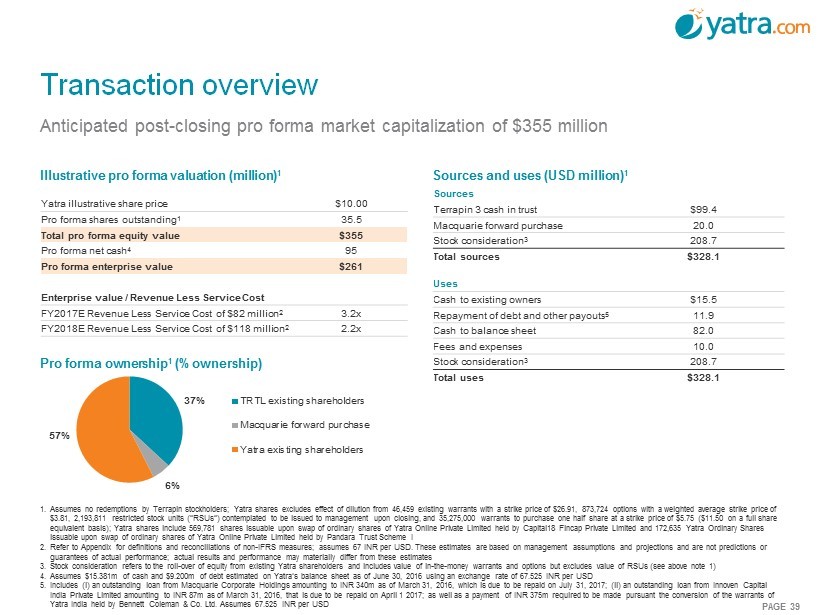
PAGE 39 Sources Terrapin 3 cash in trust $99.4 Macquarie forward purchase 20.0 Stock consideration 3 208.7 Total sources $328.1 Uses Cash to existing owners $15.5 Repayment of debt and other payouts 5 11.9 Cash to balance sheet 82.0 Fees and expenses 10.0 Stock consideration 3 208.7 Total uses $328.1 Anticipated post - closing pro forma market capitalization of $355 million 1. Assumes no redemptions by Terrapin stockholders; Yatra shares excludes effect of dilution from 46,459 existing warrants with a s trike price of $26.91, 873,724 options with a weighted average strike price of $3.81, 2,193,811 restricted stock units (“RSUs”) contemplated to be issued to management upon closing, and 35,275,000 warrant s t o purchase one half share at a strike price of $5.75 ($11.50 on a full share equivalent basis); Yatra shares include 569,781 shares issuable upon swap of ordinary shares of Yatra Online Private Limited hel d by Capital18 Fincap Private Limited and 172,635 Yatra Ordinary Shares issuable upon swap of ordinary shares of Yatra Online Private Limited held by Pandara Trust Scheme I 2. Refer to Appendix for definitions and reconciliations of non - IFRS measures; assumes 67 INR per USD. These estimates are based on management assumptions and projections and are not predictions or guarantees of actual performance; actual results and performance may materially differ from these estimates 3. Stock consideration refers to the roll - over of equity from existing Yatra shareholders and includes value of in - the - money warran ts and options but excludes value of RSUs (see above note 1) 4. Assumes $15.381m of cash and $9.200m of debt estimated on Yatra’s balance sheet as of June 30, 2016 using an exchange rate of 67 .525 INR per USD 5. Includes (i) an outstanding loan from Macquarie Corporate Holdings amounting to INR 340m as of March 31, 2016, which is due t o b e repaid on July 31, 2017; (ii) an outstanding loan from Innoven Capital India Private Limited amounting to INR 87m as of March 31, 2016, that is due to be repaid on April 1 2017; as well as a payme nt of INR 375m required to be made pursuant the conversion of the warrants of Yatra India held by Bennett Coleman & Co. Ltd. Assumes 67.525 INR per USD Sources and uses (USD million) 1 Pro forma ownership 1 (% ownership) Illustrative pro forma valuation (million) 1 Transaction overview Yatra illustrative share price $10.00 Pro forma shares outstanding 1 35.5 Total pro forma equity value $355 Pro forma net cash 4 95 Pro forma enterprise value $261 Enterprise value / Revenue Less Service Cost FY2017E Revenue Less Service Cost of $82 million 2 3.2x FY2018E Revenue Less Service Cost of $118 million 2 2.2x 37% 6% 57% TRTL existing shareholders Macquarie forward purchase Yatra existing shareholders

PAGE 40 Comparison ($m) Market Minority Net cash / EV / Revenue (3/31) Revenue growth (3/31) Price Shares cap Cash Debt interest EV market cap 2016 2017E 2018E 2019E 2017E 2018E 2019E Yatra transaction with TRTL $10.00 36 355 97 3 – 261 27% 4.1x 3.2x 2.2x 1.7x 31% 44% 32% MakeMyTrip $21.90 42 922 196 181 – 906 2% 5.4x 4.1x 3.3x 2.7x 31% 23% 23% Ctrip.com (calendarized) $47.08 498 23,429 2,338 4,668 542 26,301 (10%) 13.0x 8.4x 6.3x 5.0x 55% 33% 26% Expedia (calendarized) $117.77 150 17,652 2,335 3,197 1,048 19,562 (5%) 2.7x 2.2x 1.9x 1.7x 26% 13% 10% Priceline (calendarized) $1,479.82 49 73,143 4,371 7,255 – 76,027 (4%) 7.9x 6.9x 6.0x 5.2x 15% 16% 15% Qunar (calendarized) $28.96 145 4,193 499 97 – 3,790 10% 5.6x 4.8x 3.6x 2.7x 16% 35% 30% TripAdvisor (calendarized) $64.00 146 9,322 891 92 – 8,523 9% 5.7x 5.4x 4.7x 4.0x 5% 15% 17% Webjet (calendarized) $11.93 74 882 87 41 – 837 5% 7.7x 5.6x 4.7x 4.0x 36% 21% 18% OTA average 1% 6.9x 5.4x 4.4x 3.6x 26% 22% 20% OTA median 2% 5.7x 5.4x 4.7x 4.0x 26% 21% 18% Source: Bloomberg as of 10/07/2016 Note: Yatra shares excludes effect of dilution from 46,459 existing warrants with a strike price of $26.91, 873,724 options w ith a weighted average strike price of $3.81, 2,193,811 restricted stock units (“RSUs”) contemplated to be issued to management upon closing, and 35,275,000 warrants to purchase one half share at a strike price of $5 .75 ($11.50 on a full share equivalent basis) Note: Yatra revenue refers to Revenue Less Service Cost; Refer to Appendix for definitions and reconciliations of non - IFRS measu res; assumes 67 INR per USD. These estimates are based on management assumptions and projections and are not predictions or guarantees of actual performance; actual results and performance may m ate rially differ from these estimates Comparable public companies analysis

PAGE 41 1. Yatra revenue denotes Revenue Less Service Cost (Refer to Appendix for definitions and reconciliations of non - IFRS measures) and assumes 67 INR per USD; These estimates are based on management assumptions and projections and are not predictions or guarantees of actual performance; actual results and performance may m ate rially differ from these estimates; OTA median revenue denotes data from Bloomberg Note: Online travel agency (OTA) comparable companies include Ctrip, Expedia, MakeMyTrip, Priceline, Qunar, TripAdvisor, and Web jet Source: Bloomberg as of 10/07/2016 2018 projected revenue 1 growth Net cash / market capitalization EV / projected revenue 1 Combining with Terrapin at an attractive valuation 3.2x 2.2x 4.1x 3.3x 5.4x 4.7x 2017E Yatra transaction with TRTL 2018E Yatra transaction with TRTL 2017E MMYT 2018E MMYT 2017E OTA median 2018E OTA median 44% 23% 21% Yatra MMYT OTA median 27% 2% 2% Yatra MMYT OTA median

PAGE 42 Note: Online travel agency (OTA) comparable companies include Ctrip, Expedia, MakeMyTrip, Priceline, Qunar, TripAdvisor, and Web jet Note: Yatra stock price analysis includes effect of 35,275,000 warrants to purchase one half share at a strike price of $5.75 ($ 11.50 on a full share equivalent basis), includes impact of 46,459 existing warrants (strike price of $26.91) but excludes effect of 873,724 options (weighted average strike price of $3.81) and excludes effect of 2,193,811m RSUs; These estimates are based on management assumptions and projections and are not predictions or guarantees of actual performance; actual results and performance may materially differ fr om these estimates Source: Bloomberg as of 10/07/2016 Indicative Yatra trading price per share analysis $10.00 $11.95 $13.01 $13.93 $16.00 Yatra transaction with TRTL Yatra @ MMYT 2017 revenue multiple Yatra @ MMYT 2018 revenue multiple Yatra @ OTA median 2017 revenue multiple Yatra @ OTA median 2018 revenue multiple

PAGE 43 EV / revenue multiple vs. revenue CAGR Yatra: Higher growth at a lower multiple Note: Yatra revenue denotes Revenue Less Service Cost (Refer to Appendix for definitions and reconciliations of non - IFRS measure s); assumes EV of $261m and 67 INR per USD. These estimates are based on management assumptions and projections and are not predictions or guarantees of actual performance; actual results and per for mance may materially differ from these estimates Source: Bloomberg as of 10/07/2016; revenues calendarized to March 31 Yatra MakeMyTrip Priceline Expedia Webjet TripAdvisor Qunar 5% 10% 15% 20% 25% 30% 35% 40% 45% – 1.0x 2.0x 3.0x 4.0x 5.0x 6.0x 7.0x 8.0x Revenue CAGR 2016 - 2018E EV / 2017E revenue multiple

PAGE 44 Only 12 US - listed Indian firms versus more than 200 China - based firms Source: Bloomberg as of 10/07/2016 Company Industry Market capitalization (USD million) HDFC Banking $61,074 Infosys IT Services/ business consulting $35,832 Tata Motors Automotive manufacturing $27,150 Wipro IT Services $23,675 ICICI Bank Banking $21,813 Dr. Reddy’s Pharmaceuticals $7,495 Vedanta Natural resources $8,620 WNS Holdings Business process outsourcing $1,412 Videocon d2h In - home s atellite television $980 MakeMyTrip Online travel agency $925 Sify Tech IT and communications technology $195 Mahanagar Telecommunications services $158 Few US - listed opportunities to invest in India’s growth

PAGE 45 1. Refer to Appendix for definitions and reconciliations of non - IFRS measures; assumes 67 INR per USD. These estimates are based on management assumptions and projections and are not predictions or guarantees of actual performance; actual results and performance may materially differ from these estimates 2. Assumes $99.4m of cash available from trust and $20m investment from the forward purchase resulting in shares outstanding of 35, 549,233 which excludes dilutive impact of 46,459 existing warrants (strike price of $26.91), 873,724 options (weighted average strike price of $3.81), 2,193,811 RSUs, and 35,275,000 warrants to purchase one ha lf share at a strike price of $5.75 ($11.50 on a full share equivalent basis) 3. Assumes $15.381m of cash and $9.200m of debt estimated on Yatra’s balance sheet as of June 30, 2016 using an exchange rate of 67 .525 INR per USD Transaction highlights On July 13, 2016, Terrapin 3 Acquisition Corporation (“TRTL”) signed a definitive agreement to merge with Yatra at an enterprise value of $218m. The definitive agreement was amended on September 26, 2016 and a preliminary proxy statement/prospectus was filed with the SEC on September 29, 2016 − On a pro - forma basis, Yatra is expected to have an enterprise value of 3.2 x FY2017E Revenue Less Service Cost or 2.2x FY2018E Revenue Less Service Cost 1 Combined entity expected to be listed on NASDAQ post - business combination under the ticker “YTRA” Expected transaction closing in December 2016 Alignment of interest Current Yatra owners will retain approximately 57% 2 in the public company depending on the amount of cash available from TRTL The first $100m of cash received in the transaction will be allocated to repay outstanding debt and to pay transaction expenses with the remainder (~$82m) being allocated as cash to Yatra’s balance sheet Any amount received above $100m will be allocated as follows: A) 80% to current shareholders of Yatra, capped at $80m, and the B) Remaining amount will be allocated as cash to Yatra’s balance sheet Contingent Dividend of up to $35 million payable to Yatra's existing shareholders upon Company achieving certain financial thresholds over the next 18 months Minimum cash condition of $100m The TRTL founders have agreed to reduce their founder shares by 50% and Macquarie Capital has agreed to reduce its forward purchase by 50% to $20m Attractive valuation; strong capitalization to finance growth Pro - forma 3.2x FY2017E Revenue Less Service Cost 1 multiple and 2.2x FY2018E Revenue Less Service Cost 1 multiple are meaningful discounts to peers even while Yatra’s Revenue Less Service Cost growth prospects are strong and its balance sheet virtually debt free Post - transaction minimum cash on balance sheet of $97m 3 will finance growth initiatives as the company works towards profitability Strong management Yatra’s management will continue to run the business post - transaction TRTL will appoint 3 members to Yatra’s 8 person Board ; a majority of the members will consist of members deemed independent under SEC and applicable stock exchange rules Transaction detail

PAGE 46 Date Event September 29, 2016 Filed preliminary proxy materials with the SEC November 2016 Print and mail final proxy materials to shareholders December 2016 Hold shareholder vote and close transaction Anticipated transaction timeline

Appendix

PAGE 48 The historical financial information regarding Yatra included in this investor presentation reflects Yatra’s fiscal year end of March 31, and has been derived from audited financial statements of Yatra and its subsidiaries that were prepared in accordance with International Financial Repo rti ng Standards, or IFRS as issued by IASB, on a consolidated basis. This presentation presents the metrics Revenue Less Service Cost, Adjusted EBITDA Losses, and Net Revenue Margin, which are n on - IFRS measures. The presentation of these non - IFRS measures, which are defined below, is not meant to be considered in isolation or as a substitute for Yatra’s consolidated financial results prepared in accordance with IFRS as issued by the IASB and included in the proxy statement/prospectus. The non - IFRS fina ncial metrics may not be comparable to similarly titled measures reported by other companies due to potential differences in the method of calculation . A reconciliation of these non - IFRS measures to the most comparable IFRS metric is set forth in this Appendix. Description of Revenue Less Service Cost: As certain parts of Yatra’s revenue are recognized on a “net” basis and other parts of revenue are recognized on a “gross” basis, Yatra evaluates its financial performance based on Revenue Less Service Cost, which is a non - IFRS measure. Yatra believes that Revenue Less Service Cost provides investors with useful supplemental information about the financial performance of Yatra’s business and mor e accurately reflects the value addition of the travel services that Yatra provides to its customers. The presentation of this non - IFRS information is not meant to be considered in isolation or as a substitute for Yatra’s consolidated financial results prepared in accordance with IFRS as issued by the IASB. Yatra’s Revenue Le ss Service Cost may not be comparable to similarly titled measures reported by other companies due to potential differences in the method of calculation . T his Appendix reconciles Yatra’s revenue, which is an IFRS measure, to Revenue Less Service Cost, which is a non - IFRS measure. Description of Adjusted EBITDA: In addition to referring to Revenue Less Service Cost, we also refer to adjusted EBITDA (loss) which is a non - IFRS measure and most directly comparable to results from operations for the year. We use financial statements that exclude share - based payme nt expense, and depreciation and amortization for our internal management reporting, budgeting and decision making purposes, including comparing our opera tin g results to that of our competitors. Because of varying available valuation methodologies and subjective assumptions that companies can use when adop tin g IFRS 2 “Share based payment”, management believes that providing non - GAAP financial measures that exclude such expenses allows investors to make add itional comparisons between our operating results and those of other companies. Accordingly, we believe that adjusted EBITDA (loss) is useful in mea suring the results of our company and provide investors and analysts a more accurate representation of our operating results. However, the presentation of thes e n on - IFRS measures are not meant to be considered in isolation or as a substitute for our consolidated financial results prepared in accordance with IFRS as i ssu ed by the IASB. These non - IFRS measures may not be comparable to similarly titled measures reported by other companies due to potential differences in the m eth od of calculation. The IFRS measures most directly comparable to adjusted EBITDA (loss) is results from operations and loss for the year, respectively. A li mitation of using adjusted EBITDA (loss) calculated in accordance with IFRS is that this non - GAAP financial measure excludes a recurring cost, namely share - based payment expense. Management compensates for this limitation by providing specific information on the IFRS amounts excluded from adjusted operating loss a nd adjusted net loss. Description of Net Revenue Margin: Net Revenue Margin is defined as Revenue Less Service Cost as a percentage of Gross Bookings and represent the commissions, fees, incentive payments and other amounts earned in our business. We follow Net Revenue Margin trends closely a cro ss our various lines of business to gain insight into the performance of our various businesses. Description of Gross Bookings: This presentation also uses the operating metric “Gross Bookings” which represents the total amount paid by our customers for the travel services and products booked through us, including fees and other charges, and are net of cancellations and refund s. All years are calendar years unless otherwise noted as “fiscal year” or “FY”. Basis of financial presentation and use of non - IFRS measures

PAGE 49 Reconciliation of Revenue Less Service Cost and Net Revenue Margin Reconciliation of non - IFRS measures For years ended (Historical) For years ended (Projected) INR million 31 March 2014 31 March 2015 31 March 2016 31 March 2017 31 March 2018 31 March 2019 Gross Bookings 40,836 48,272 59,497 77,239 104,053 135,112 Revenue and other income 5,159 6,581 8,379 11,001 16,593 22,456 Service cost (2,481) (3,155) (4,201) (5,490) (12,000) (15,781) Revenue Less Service Cost 2,678 3,426 4,178 5,511 7,923 10,456 Net Revenue Margin 6.6% 7.1% 7.0% 7.1% 7.6% 7.7% Reconciliation of Segment Revenue Less Service Cost and Net Revenue Margin Air Ticketing Hotels and Packages Others (incl. other income) For years ended For years ended For years ended INR million 31 March 2014 31 March 2015 31 March 2016 31 March 2014 31 March 2015 31 March 2016 31 March 2014 31 March 2015 31 March 2016 Gross Bookings 34,894 40,438 49,269 5,670 7,368 9,614 272 465 614 Revenue and other income 1,891 2,331 2,877 3,097 4,007 5,218 171 243 284 Service cost – – – (2,481) (3,155) (4,201) – – – Revenue Less Service Cost 1,891 2,331 2,877 616 852 1,017 171 243 284 Net Revenue Margin 5.4% 5.8% 5.8% 10.9% 11.6% 10.6% 62.8% 52.2% 46.3% Note: FY2014 Revenue Less Service Cost amounts have been derived from unaudited financials of various subsidiaries prepared i n a ccordance with local GAAPs i.e. Indian GAAP as well as Singapore Financial Reporting Standard and aggregated together. FY2014 amounts should not be interpreted as comparable to FY2015 and FY2016 as FY 201 4 has been prepared under a different basis of accounting. The Company adopted IFRS as issued by IASB from FY2015

PAGE 50 Reconciliation of non - IFRS measures, cont’d For years ended (Historical) INR million 31 March 2015 31 March 2016 Results from operations as per IFRS (985) (1,205) Add: Depreciation and amortization 209 234 EBITDA (777) (971) Add: Share based payment expense 32 19 Adjusted EBITDA (Loss) (745) (952) Reconciliation of Adjusted EBITDA (Loss)