Attached files
| file | filename |
|---|---|
| EX-23.2 - EX-23.2 - ANALOGIC CORP | d220440dex232.htm |
| EX-32.2 - EX-32.2 - ANALOGIC CORP | d220440dex322.htm |
| EX-32.1 - EX-32.1 - ANALOGIC CORP | d220440dex321.htm |
| EX-31.2 - EX-31.2 - ANALOGIC CORP | d220440dex312.htm |
| EX-31.1 - EX-31.1 - ANALOGIC CORP | d220440dex311.htm |
| EX-23.1 - EX-23.1 - ANALOGIC CORP | d220440dex231.htm |
| EX-21 - EX-21 - ANALOGIC CORP | d220440dex21.htm |
Table of Contents
UNITED STATES
SECURITIES AND EXCHANGE COMMISSION
Washington, DC 20549
Form 10-K
| þ | ANNUAL REPORT PURSUANT TO SECTION 13 OR 15(d) OF THE SECURITIES EXCHANGE ACT OF 1934 |
For the fiscal year ended July 31, 2016
OR
| ¨ | TRANSITION REPORT PURSUANT TO SECTION 13 OR 15(d) OF THE SECURITIES EXCHANGE ACT OF 1934 |
For the transition period from to
Commission File Number 0-6715
Analogic Corporation
(Exact name of registrant as specified in its charter)
| Massachusetts | 04-2454372 | |
| (State or other jurisdiction of | (I.R.S. Employer | |
| incorporation or organization) | Identification No.) | |
| 8 Centennial Drive, Peabody, Massachusetts | 01960 | |
| (Address of principal executive offices) | (Zip Code) | |
(978) 326-4000
(Registrant’s telephone number, including area code)
Securities registered pursuant to Section 12(b) of the Act:
| Title of Each Class |
Name of Each Exchange on Which Registered | |
| Common Stock, $0.05 par value | NASDAQ Global Select Market |
Securities registered pursuant to Section 12(g) of the Act:
None
Indicate by check mark if the registrant is a well-known seasoned issuer, as defined in Rule 405 of the Securities Act. Yes þ No ¨
Indicate by check mark if the registrant is not required to file reports pursuant to Section 13 or Section 15(d) of the Act. Yes ¨ No þ
Indicate by check mark whether the registrant (1) has filed all reports required to be filed by Section 13 or 15(d) of the Securities Exchange Act of 1934 during the preceding 12 months (or for such shorter period that the registrant was required to file such reports), and (2) has been subject to such filing requirements for the past 90 days. Yes þ No ¨
Indicate by check mark whether the registrant has submitted electronically and posted on its corporate Web site, if any, every Interactive Data File required to be submitted and posted pursuant to Rule 405 of Regulation S-T during the preceding 12 months (or for such shorter period that the registrant was required to submit and post such files). Yes þ No ¨
Indicate by check mark if disclosure of delinquent filers pursuant to Item 405 of Regulation S-K is not contained herein, and will not be contained, to the best of registrant’s knowledge, in definitive proxy or information statements incorporated by reference in Part III of this Form 10-K or any amendment to this Form 10-K. þ
Indicate by check mark whether the registrant is a large accelerated filer, an accelerated filer, a non-accelerated filer, or a smaller reporting company. See the definitions of “large accelerated filer”, “accelerated filer”, and “smaller reporting company” in Rule 12b-2 of the Exchange Act.
| Large accelerated filer þ |
Accelerated filer ¨ | |
| Non-accelerated filer ¨ (Do not check if a smaller reporting company) |
Smaller reporting company ¨ |
Indicate by check mark whether the registrant is a shell company (as defined in Rule 12b-2 of the Exchange Act.) Yes ¨ No þ
The aggregate market value of the registrant’s common stock held by non-affiliates of the registrant at January 31, 2016 was approximately $895,480,000. As of September 20, 2016, there were 12,401,682 shares of common stock outstanding.
DOCUMENTS INCORPORATED BY REFERENCE:
Portions of the registrant’s definitive proxy statement, which will be issued in connection with the 2016 Annual Meeting of Stockholders, are incorporated by reference in Part III of this Annual Report on Form 10-K.
Table of Contents
1
Table of Contents
| Item 1. | Business |
Throughout this Annual Report on Form 10-K, unless the context states otherwise, the words “we,” “us,” “our” and “Analogic” refer to Analogic Corporation and all of its subsidiaries taken as a whole, and “our board of directors” refers to the board of directors of Analogic Corporation.
Description of Business
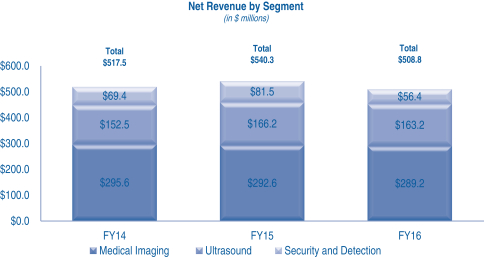
Analogic Corporation (NASDAQ:ALOG) designs, manufactures, and commercializes innovative real-time guidance, diagnostic imaging and threat detection technologies to advance the practice of medicine and save lives. We operate and report along three business segments: Medical Imaging, Ultrasound and Security and Detection. Our Medical Imaging segment provides critical enabling medical imaging systems and subsystems for computed tomography, or CT, magnetic resonance imaging, or MRI and high-resolution digital mammography. We sell our Medical Imaging products primarily through longstanding relationships with well-known multinational medical original equipment manufacturers, or OEMs, and new entrants in emerging markets. Our Ultrasound business provides real-time ultrasound procedure guidance systems for the urology, surgery and point of care markets. We sell our ultrasound products, under the BK Ultrasound brand, through our direct sales force in North America and Europe, as well as through a network of distributors to clinical practitioners throughout the world. Our Security and Detection segment designs and manufactures automated threat detection systems for aviation baggage inspection applications utilizing advanced medical CT technology and systems used for DNA analysis for law enforcement and government agencies. We sell our aviation threat detection and DNA systems through multinational partners. We were incorporated in the Commonwealth of Massachusetts in November 1967 and are headquartered in Peabody, Massachusetts.
Refer to Note 16 to the notes to Consolidated Financial Statements included in this Annual Report on Form 10-K as well as Item 7 Management’s Discussion and Analysis of Financial Condition and Results of Operations for financial information regarding our segments. The following chart shows net revenue by segment in millions for fiscal years 2016, 2015 and 2014, respectively:
Medical Imaging
Our Medical Imaging segment, which accounted for approximately 57% of our net revenue in fiscal year 2016, consists primarily of systems and sub-systems for medical imaging that are sold globally to OEM producers of CT, MRI, and digital mammography systems. Our products are designed and manufactured to achieve high reliability resulting in the lowest overall cost of ownership for our customers.
2
Table of Contents
Computed Tomography
Analogic has been at the forefront of developments in computed tomography equipment technology from the introduction of the first single slice CT systems in the early 1970s to today’s multi-slice volumetric scanners. We are an industry leader in the development and sale of CT detector systems, data acquisition systems, or DAS, data management systems, or DMS, and fully integrated CT systems that drive the image processing in OEM CT imaging scanners sold around the world.
Our CT product portfolio consists primarily of the following:
| 1) | Detector Subsystems – These subsystems convert the x-ray energy in a CT machine to analog signals for further processing in the DAS. The detectors use state-of-the-art scintillator materials and photodiodes coupled with advanced semiconductor technology to process these highly precise signals. These signals are then fed to a computer through a DAS for image reconstruction. |
| 2) | DAS – These subsystems are used to process the signals created by the detectors and feed them as a digital stream to a reconstruction computer to create high resolution images. The DAS is designed with many multi-channel circuit boards that process the analog signals from the detectors and convert them into digital signals through an array of analog to digital, or A/D converters. |
| 3) | DMS – This is the most critical sub-system of the CT system and consists of both the detector array and the DAS in one package. This system provides our OEM customers a higher level of integration that allows for lower cost and faster time to market. |
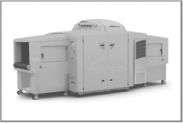
| 4) | Full Integrated CT Systems – The components of the CT system (detectors, DAS, x-ray tube and power supplies) are mounted on a rotating ring assembly called a gantry. The ring enables the components of the CT systems to rotate around the patient at speeds up to 300 revolutions per minute for high resolution imaging. We provide full integrated gantries with image and iterative reconstruction algorithms to our OEM customers as another level of integration to facilitate a smoother and faster time to market and improve manufacturing efficiency. Our Low Dose Imaging Software, or LISA, is available in our integrated CT systems to provide high quality imaging capability at up to 40% lower x-ray dose as compared with conventional image reconstruction. Low dose imaging in medical diagnostics is used to prevent damage to healthy tissue. Our designs also include non-contact power, data transfer and other innovative capabilities that provide high reliability, lower total cost of ownership and dose reduction/modulation. We have sold over 130 full CT gantries to a major Chinese OEM manufacturer for the local China market. |
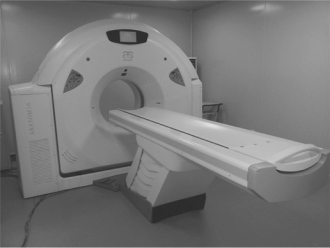
Full Integrated CT Gantry
3
Table of Contents
The detector, DAS and DMS products we sell are used in a wide range of CT systems, from dual slice count to the most advanced multi-slice (at least 256 slices) systems, enabling advanced diagnostics such as cardiac imaging. Our CT products are designed to allow our customers to remain at the forefront of this rapidly advancing field. By leveraging our experience in integrating CT components and technology, we have also developed higher-level integrated systems for the radiotherapy market primarily used for image guided radiation treatment of cancerous tumors.
Magnetic Resonance Imaging
For OEM producers of MRI equipment, we supply two key enabling sub-systems: gradient amplifiers and radio frequency, or RF amplifiers. We have developed a wide range of amplifier solutions for our customers ranging from low-magnetic-field systems (under 0.3 Tesla) to ultra-high-magnetic-field systems (> 7.0 Tesla). Our ability to provide very high power levels with fast response, low noise and industry-leading reliability enables our OEM customers to deliver innovative technologies such as new, wide-bore (i.e. larger opening) MRI scanners addressing growing requirements related to obesity and patient comfort.
Our MRI product portfolio consists primarily of the following:
| 1) | Gradient Amplifiers – These high power systems are used to drive a set of coils located inside the MRI system and around the patient. The coils energize the atomic structure of a patients’ anatomy in order to create tissue and structure images. Gradient amplifiers must be designed at specific power levels for different MRI field strengths ranging from under 0.3 Tesla to 7.0 Tesla and higher. |
| 2) | RF Amplifiers – These power systems are used to control another set of the coils within the MRI system that are used to read-back the signals from the anatomy generated by the gradient coils. These signals are then processed in a reconstruction computer to create images. The RF amplifiers must have a very high signal-to-noise ratio to produce the cleanest images. |
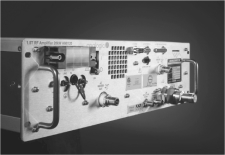
RF Amplifier
Digital Mammography
Our digital mammography products consist primarily of digital mammography selenium based detector plates, sold directly to OEM customers for breast cancer screening and diagnostic applications in mammography. These detector plates are used by OEMs in mammography systems to convert x-ray signals into high resolution 2-D and 3-D images of breast tissue to aid in the detection of breast cancer. Our detector plates for mammography applications are sold to medical OEMs for use in products worldwide. Our digital mammography product portfolio consists of the following:
| 1) | Large field of view (FOV) detector (AXS-2430 and AXS-ScreenPlus) – Our large field of view detector plate, based on selenium technology, is used primarily for European and U.S. markets. The plate and power supply is designed to be easily adapted to many types of mammography systems. This detector plate is also compatible with systems that can perform tomosynthesis, which creates 3-D images through a series of exposures to more accurately detect lesions in the breast. |
4
Table of Contents
| 2) | Small field of view (FOV) detector (AXS-1824) – Our small field of view detector plate uses the same selenium-based technology as the AXS-2430 detector and is manufactured primarily for the Asian markets. |

Other Products
Within our Medical Imaging segment, we also design and manufacture servo and stepper (motion control) devices, which we supply to OEM customers for use in computer-controlled automation systems primarily in the semiconductor and laboratory automation markets.
Competition
We are subject to competition based upon product design, performance, pricing, quality and service. We believe that our innovative engineering and product reliability have been important factors in our historical growth.
In our Medical Imaging segment, systems and subsystems are customized for the needs of our customers. In many cases, due to the limited number of companies with technology comparable to ours, we consider selection by our OEM customers for the design and manufacture of these products and our other medical products to be due more to the “make-or-buy” decision of the individual OEM customers than a function of other competitors in the field.
Marketing and Distribution
Our Medical Imaging segment directly sells to OEM customers, both domestically and abroad, primarily through our headquarters in the U.S. We also sell products through our subsidiaries in Canada, China, and the U.S.
Seasonal Aspect of Business
There are no material seasonal elements to our Medical Imaging segment, although holidays and plant closings in the summer, particularly in Europe, tend to decrease the procurement activities of certain customers during the first quarter of our fiscal year.
Ultrasound
Our Ultrasound segment designs and manufactures medical ultrasound systems, principally for applications in procedure guidance.
Our BK Ultrasound brand products are primarily sold to clinical end-users in urology, surgery, point-of-care and general imaging applications and accounted for approximately 32% of our net revenue in fiscal year 2016. Our ultrasound systems use acoustic waves to generate real-time images of the body’s internal anatomy that are
5
Table of Contents
used for interventional and medical diagnostic procedures, including guiding surgical procedures and guiding prostate cancer treatment employing procedures such as brachytherapy.
Our product portfolio under the BK Ultrasound brand name consists of four families: Flexfocus, BK, Sonix and Sonic Window ultrasound systems used primarily for guiding procedures in urology, surgery, regional anesthesia and point of care (POC).
In 2015 we introduced the high end bk3000 and the bk5000, which are based on our innovative TriCore technology, that expands the portfolio of existing Flexfocus systems with high-end entries. The TriCore technology allows for high definition imaging by processing three times more information compared with traditional systems. The bk3000 is primarily used for high-end urology and general imaging applications while the bk5000 is a premium system used for guiding surgical procedures.
In early 2016 we introduced the bk3500 as an advanced ultrasound solution for point of care (POC) applications such as for the emergency department and anesthesiology. The bk3500 combines high resolution imaging and workflow with a streamlined touchscreen interface, that was originally used in our Sonix product lines. The system has four probe connectors, an integrated bar code reader and a streamlined touchscreen that guides the user through the procedure.
In mid-2014, we signed an agreement with a new technology partner to expand into the radiology and OB/GYN market. As part of this agreement, we manufacture an advanced ultrasound platform using our partner’s brand and sell through their established sales channel. The growth into the general imaging market combined with our existing presence in the urology, surgery and POC markets increases our total market opportunity to over $4 billion.
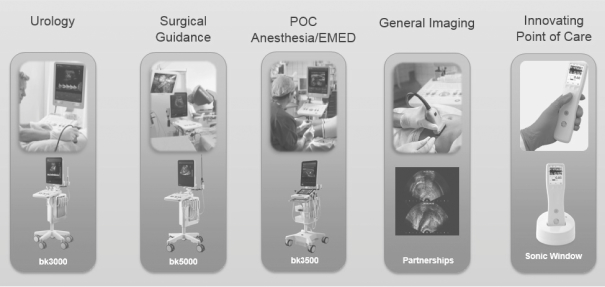
Ultrasound Product Portfolio
6
Table of Contents
Our Sonic Window® is a handheld ultrasound device for visualizing vasculature for kidney dialysis cannulation and fistula assessment, as well as guiding peripheral intravenous access, or PIV. This ultra-compact device provides direct visualization of structures beneath the skin. Unlike existing portable devices on the market today, the Sonic Window handheld is self-contained and does not require a cart or stand to operate. We began commercialization and received first orders for the dialysis market in the second quarter of 2016 from a domestic dialysis center.

Sonic Window® – Handheld Ultrasound System
In the middle of fiscal 2016, we entered the veterinary telemedicine market through the acquisition of Oncura Partners. Oncura provides for veterinary medicine BK ultrasound systems with the remote capabilities for (1) assisting the practitioner to deliver diagnostic scans, (2) trouble shooting operator or system performance and (3) delivering diagnoses by board certified radiologists. We see this technology as having benefits for our presence in the human telemedicine market.
We also design and manufacture advanced ultrasound transducers sold to OEM customers within our Ultrasound segment. Using our advanced acoustic design and manufacturing capability, we provide a variety of transducers to OEMs for both diagnostic and procedure driven applications such as cardiology, radiology, OB/GYN, surgery and interventional radiology.
Competition
We are subject to competition based upon product design, performance, pricing, quality and service. We believe that our innovative engineering and product reliability have been important factors in our historical growth. While we try to maintain competitive pricing on those products that are directly comparable to products manufactured by others, in many instances, our products conform to more precise specifications and carry a higher price than similar products manufactured by others.
The Ultrasound segment participates in markets primarily focused in urology, surgery, anesthesia and other point-of-care markets. We compete in these markets based on image quality, ease of use, mobility, reliability and flexibility with a robust portfolio of specialized ultrasound transducers. Our competitors are companies and business units of large medical device companies, such as General Electric Corporation, or GE and Koninklijke Philips Electronics N.V., or Philips, that primarily focus on the conventional ultrasound markets, as well as smaller business units of large multi-national companies, such as Hitachi Medical Corporation and Fujifilm that sell under brands such as Aloka and SonoSite in our target markets. We also compete against newer global market entrants such as Mindray Medical International Limited, or Mindray.
Marketing and Distribution
Our Ultrasound segment globally distributes its products to end users both through a direct sales force and through a network of independent sales representatives and distributors located around the world. Our direct sales force, located in the U.S., Canada, Germany, Belgium, United Kingdom, Italy, and Scandinavia, accounted for approximately 58% of our Ultrasound revenue in fiscal year 2016, generated from product sales, service and application support. Our remaining Ultrasound revenue was generated through a network of generally non-exclusive, independent distributors in more than 60 other countries and sales of transducers to OEM customers both domestically and abroad.
7
Table of Contents
Our global marketing department is responsible for defining future products, uncovering unmet needs and validating value propositions based on customer insights. Management of key opinion leaders and global reference sites is supervised by a team of clinical scientists and product applications specialists. Our global marketing communications team is responsible for protecting and expanding the BK Ultrasound brand on all relevant customer touchpoints.
Seasonal Aspect of Business
Customer purchases in our Ultrasound segment have historically been higher in the second and fourth quarters of our fiscal year due in part to the timing of customer budgeting cycles.
Security and Detection
Utilizing our advanced CT technology, the Security and Detection segment, which accounted for approximately 11% of our net revenue in fiscal year 2016, designs and manufactures airport baggage screening systems and subsystems. The airport screening systems generate 3-D images of objects contained within baggage and utilize highly sophisticated algorithms to provide threat analysis of materials contained within the bags. We also design and manufacture DNA analysis systems.
Our certified checked baggage screening systems and subsystems are sold through our OEM customers L-3 Communications Security and Detection Systems, or L-3 and Smiths Detection, or Smiths, to the Transportation Security Agency in the U.S. airports and to international airport authorities and foreign governments for installation at airports around the world.
We sell the following checked baggage systems through L-3.
|
1) eXaminer® XLB (High Speed) – The XLB was the first certified explosives detection system, or EDS specifically optimized for high speed screening of checked baggage. Capable of scanning up to 1,200 bags per hour, the XLB keeps bags continuously moving through a meter-wide tunnel. Combining high-resolution helical CT with dual-energy imaging, the XLB offers superior detection capabilities and advanced 3-D imaging. | |

|
2) eXaminer 3DX (Medium Speed) – Our CT technology is utilized in the 3DX, a medium speed EDS that scans up to 550 bags per hour in-line and up to 330 bags in standalone configuration. The enhanced speed 3DX-ES scans up to 750 bags per hour in the in-line configuration. Both systems are designed to provide high levels of reliability and low false-alarm rates. With over 1,200 systems installed since 2003, the 3DX is one of most widely used checked baggage systems in the U.S. | |
|
3) eXaminer SX (Reduced Size) – The SX is a lower-cost, reduced size EDS designed for small and medium-sized airports. Able to scan up to 360 bags per hour in-line and up to 300 bags per hour in standalone configuration, the SX offers customers a reduced footprint system with high resolution 3-D imaging and low false-alarm rates. | |
eXaminer ® is a registered trademark of L-3.
8
Table of Contents
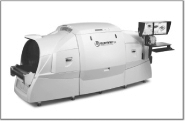
The Smiths Detection HI-SCAN 10080 XCT, which incorporates Analogic CT technology, is capable of screening up to 1,800 bags per hour in its approved configuration with a belt speed of 0.5 meters per second. The system offers a large one meter wide tunnel that meets the requirements of high speed in-line baggage handling systems and allows rapid, efficient scanning of larger items. The system is well positioned for international sales as the market converts to CT level detection for checked baggage.
Smiths Detection HI-SCAN 10080 XCT
Our COBRA checkpoint CT system is the first system to achieve European Civil Aviation Conference Type-D and D+ Standard-2 approval. The COBRA successfully met Standard-2 in Type-D operations, where liquids, aerosols and gels (LAGs) remain inside passenger carry-on bags, and Type D+ operations, where LAGs and complex electronics, such as laptops, remain inside passenger carry-on bags. The COBRA checkpoint CT system has also been approved by the United Kingdom’s Department for Transport as an Advanced Cabin Baggage X-ray system.
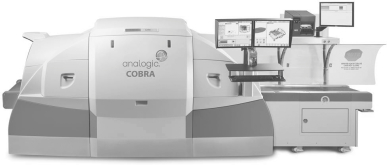
COBRA Check-Point CT System
9
Table of Contents
Other Products
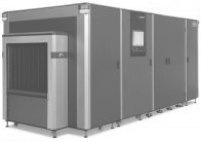
Within our Security and Detection segment, we also design and manufacture Rapid DNA Analysis systems. These systems, which we supply to our OEM customer, are designed to rapidly analyze multiple human DNA samples to provide “DNA fingerprints.” The analysis process yields results in less than ninety minutes, a significant improvement over conventional technologies. Unlike conventional techniques, which require highly trained personnel working in a laboratory setting, our systems are designed for non-technical users with minimal training in a variety of environments. These systems have potential application in fields that benefit from the rapid identification of individuals, including law enforcement, defense, and immigration.
Rapid DNA Analysis System
Competition
We are subject to competition based upon product design, performance, pricing, quality and service. We believe that our innovative engineering and product reliability have been important factors in our historical growth.
In our Security and Detection segment, competition in baggage scanning is limited due to the high barriers of entry resulting from the cost of developing the capability to design and manufacture CT technology. Due to the degree of customization required and the limited number of companies with technology comparable to ours, we consider selection by our OEM customers to be due more to the “make-or-buy” decision of our customers than a function of other competitors in the field.
Principal entrants in the aviation baggage scanning market include L-3, Smiths Detection, Morpho Detection (formerly GE’s security business) and Rapiscan (a division of OSI systems).
Marketing and Distribution
Our Security and Detection segment sells its checked baggage systems and subsystems and its DNA analysis system to our OEM customers. We offer our checkpoint solutions to customers in the U.S. and internationally. Our Security and Detection segment conducts its sales and marketing activities primarily through our headquarters in the U.S.
Seasonal Aspect of Business
There are no material seasonal elements to our Security and Detection segment, although holidays and plant closings in the summer, particularly in Europe, tend to decrease the procurement activities of certain customers during the first quarter of our fiscal year.
10
Table of Contents
Material Customers
We had three customers during fiscal year 2016 and four customers during fiscal years 2015 and 2014, as set forth in the table below, which accounted for 10% or more of our net revenue.
| For the Year ended July 31, | ||||||||||||
| 2016 | 2015 | 2014 | ||||||||||
| Koninklijke Philips Electronics N.V., or Philips |
13 | % | 14 | % | 16 | % | ||||||
| Siemens AG |
12 | % | 11 | % | 11 | % | ||||||
| Toshiba Corporation, or Toshiba |
11 | % | 11 | % | 12 | % | ||||||
| L-3 Communications Corporation, or L-3 |
* | 13 | % | 11 | % | |||||||
Note (*): Total net revenue was less than 10% in this fiscal year.
Philips’, Toshiba’s, and Siemens’ revenues were primarily in the Medical Imaging segment and L-3’s revenue was in the Security and Detection segment.
Our ten largest customers as a group accounted for 61%, 64% and 66% of our net revenue for fiscal years 2016, 2015 and 2014, respectively.
The following table summarizes the net accounts receivable due from our customers with net accounts receivable balances greater than or equal to 10% of our total net accounts receivable balance:
| As of | As of | |||||||
| July 31, | July 31, | |||||||
| 2016 | 2015 | |||||||
| L-3 |
17 | % | 17 | % | ||||
| Philips |
15 | % | 16 | % | ||||
Our OEM business involves large customers whose placement of large orders can vary based on timing. Our backlog, which consists of cancellable and non-cancellable orders primarily shippable within twelve months, was $148.7 million and $128.5 million as of July 31, 2016 and 2015, respectively. The increase in backlog was primarily due to timing of customer orders in our Security and Detection segment and our Medical Imaging segment, partially offset by decreased orders in OEM probes within our Ultrasound segment.
Government Contracts
We do a significant amount of business with agencies of the U.S. Federal Government through our Security and Detection segment, either directly or as a subcontractor. Our contracts with government agencies, and the government contracts of other parties under which we serve as a subcontractor, are subject to termination at the election of the government agency. While none of our government contracts or subcontracts provide for renegotiation of profits at the election of the government, it is possible that the government agency could request, and that we could under certain circumstances agree to, the renegotiation of the payments provided for under such contracts. However, we have not in the past renegotiated significant payment terms under our government contracts or subcontracts.
Sources of Raw Materials and Components
In general, our products are composed of internally-designed electronic and mechanical elements, including proprietary integrated circuits, printed circuit boards, detectors, power supplies, and displays manufactured by us and others in accordance with our specifications. We order raw materials and components to complete our customers’ orders, and some of these raw materials and components are ordered from sole-source suppliers. We believe that most items procured from third-party suppliers are available from more than one source. However, if
11
Table of Contents
a given component ceases to be available, it might become necessary for us to modify a product design to adapt to a substitute component, or to purchase new tooling to enable a new supplier to manufacture the component, either of which could result in additional expense and/or delay in product sales. Also, from time to time the availability of certain electronic components has been disrupted. Accordingly, we carry a safety stock of raw materials and components in an effort to ensure our ability to make timely delivery to our customers.
Intellectual Property
We rely on a combination of patent, trade secret, copyright and trademark laws, as well as contractual agreements, to safeguard our products, technologies, and processes. We hold patents of varying duration in the U.S. and in various foreign jurisdictions, which cover technologies that we have developed. We regularly file U.S. patent applications and, where appropriate, foreign patent applications. As of July 31, 2016, we hold approximately 348 patent families, including pending and issued patents, in various jurisdictions. In seeking to limit access to sensitive information, we routinely enter into confidentiality and assignment of invention agreements with each of our employees, and confidentiality agreements with our key customers and vendors.
We believe that, while the legal protections afforded by the intellectual property laws are an important factor in our ability to compete, our future prospects also depend on the continuing level of excellence and creativity of our engineers in developing products that satisfy customer needs, and the marketing skills and managerial competence of our personnel in selling those products. Moreover, we believe that market positioning and rapid market entry are important to the success of our products. Our management believes that the loss of any individual patent would not have a material effect on our competitive position.
Research and Development
Research and development, or R&D is a significant element of our business. We maintain a constant and comprehensive R&D program directed toward the creation of new products, the improvement and refinement of our present products, and the expansion of their applications. Certain R&D projects are funded by our customers, typically OEM customers, and such funding is generally treated as engineering revenue, with the associated costs classified as engineering cost of sales. The costs of internally-funded R&D efforts are included within operating expenses.
We evaluate developing technologies in areas where we have technological or marketing expertise for possible investment or acquisition. We intend to continue to invest in R&D and focus our internal and external investments in fields that we believe will offer the greatest potential for near and long-term growth. We are committed to investing in products that have a demonstrable clinical impact and value to the healthcare system and through which we can benefit from our core competencies and global infrastructure.
The cost of customer-funded R&D, which is classified as engineering cost of sales, amounted to:
| For the Year ended July 31, | ||||||||||||
| (in millions) | 2016 | 2015 | 2014 | |||||||||
| Customer-funded R&D |
$ | 5.2 | $ | 7.8 | $ | 6.9 | ||||||
The cost of internally-funded R&D included in operating expenses amounted to:
| For the Year ended July 31, | ||||||||||||
| (in millions) | 2016 | 2015 | 2014 | |||||||||
| Internally-funded R&D |
$ | 67.1 | $ | 68.5 | $ | 73.8 | ||||||
12
Table of Contents
Environment
Our manufacturing facilities are subject to numerous environmental laws and regulations, particularly with respect to industrial waste and emissions. Compliance with these laws and regulations have not had a material impact on our capital expenditures, earnings, or competitive position.
Employees
As of July 31, 2016, we employed 1,577 employees. A limited number of employees at our Denmark facility are covered by a works council. We consider our relations with our employees to be generally good.
Financial Information about Foreign and Domestic Operations and Export Revenue
Revenues are attributed to countries based on the location of our customers. For OEM sales, our customer’s location may differ from the location of where the ultimate completed systems are sold by the OEM into the market.
| For the Year ended July 31, | ||||||||||||||||||||||||
| (in millions) | 2016 | 2015 | 2014 | |||||||||||||||||||||
| Net Revenue |
||||||||||||||||||||||||
| Domestic |
$ | 192.3 | 38 | % | $ | 215.3 | 40 | % | $ | 183.8 | 36 | % | ||||||||||||
| Foreign |
316.5 | 62 | % | 325.0 | 60 | % | 333.7 | 64 | % | |||||||||||||||
|
|
|
|
|
|
|
|||||||||||||||||||
| Total net revenue |
$ | 508.8 | $ | 540.3 | $ | 517.5 | ||||||||||||||||||
|
|
|
|
|
|
|
|||||||||||||||||||
Refer to Note 16 to the notes to Consolidated Financial Statements included in this Annual Report on Form 10-K for financial information regarding our domestic and foreign revenue and long lived assets.
Available Information
Our website address is www.analogic.com. The information on our website is not incorporated by reference into this document and should not be considered to be a part of this document. Our website address is included in this document as an inactive textual reference only.
We make available free of charge through our website our Annual Report on Form 10-K, Quarterly Reports on Form 10-Q, Current Reports on Form 8-K, Annual Form SD and amendments to the reports as soon as reasonably practicable after we electronically file such material with, or furnish such material to, the Securities and Exchange Commission, or the SEC.
| Item 1A. | Risk Factors |
This Annual Report on Form 10-K contains statements, which, to the extent that they are not a recitation of historical facts, constitute “forward-looking statements” pursuant to the safe harbor provisions of the Private Securities Litigation Reform Act of 1995. In some cases these forward-looking statements can be identified by the use of words such as “may,” “could,” “should,” “would,” “expect,” “project,” “predict,” “potential” or the negative of these words or comparable words. Investors are cautioned that all forward-looking statements, including without limitation, statements about product development, market and industry trends, strategic initiatives, regulatory approvals, sales, profits, expenses, price trends, R&D expenses and trends, and capital expenditures, involve risk and uncertainties, and actual events and results may differ materially from those indicated in any forward-looking statement as a result of a number of important factors, including those discussed below and elsewhere in this Form 10-K.
13
Table of Contents
In addition, any forward-looking statements represent management’s views only as of the date of this Annual Report on Form 10-K was filed with the SEC and should not be relied upon as representing management’s views as of any subsequent date. While management may elect to update forward-looking statements at some point in the future, it specifically disclaims any obligation to do so, even if its views change, except as required by law.
You should carefully consider the risks described below before making an investment decision with respect to our common stock. Additional risks not presently known to us, or that we currently deem immaterial, may also impair our business. Any of these could have a material and negative effect on our business, financial condition, or results of operations.
Because a significant portion of our revenue currently comes from a small number of customers, any decrease in revenue from these customers could harm our operating results.
We depend on a small number of customers for a large portion of our business, and changes in our customers’ orders could have a significant impact on our operating results. If a major customer significantly reduces the amount of business it does with us, there would be an adverse impact on our operating results.
We had three customers during fiscal year 2016 and four customers during fiscal years 2015 and 2014, which accounted for 10% or more of our net revenue.
Our ten largest customers as a group accounted for 61%, 64%, and 66% of our net revenue for fiscal years 2016, 2015, and 2014, respectively.
Although we seek to broaden our customer base, we will continue to depend on sales to a relatively small number of major customers. Because it often takes significant time to replace lost business, it is likely that our operating results would be adversely affected if one or more of our major customers were to cancel, delay, or reduce significant orders in the future. Our customer agreements typically permit the customer to discontinue future purchases after timely notice.
In addition, we generate significant accounts receivable in connection with the products we sell and the services we provide to our major customers. Although our major customers are large corporations, if one or more of our customers were to become insolvent or otherwise be unable to pay for our products and services, our operating results and financial condition could be adversely affected.
Competition from existing or new companies in the Medical Imaging and Security and Detection industries could cause us to experience downward pressure on prices, fewer customer orders, reduced margins, loss of new business opportunities, and the loss of market share.
We operate in highly competitive industries. We are subject to competition based on product design, performance, pricing, quality, and service offerings, and we believe our innovative engineering and product reliability have been important factors in our historical growth. While we try to maintain competitive pricing on those products which are comparable to products manufactured by others, in many instances our products conform to more precise specifications and may carry a higher price than analogous products manufactured by others. In addition, the trend of consolidation in the medical device industry and among our customers could result in greater competition and pricing pressures.
Our competitors include divisions of larger, more diversified organizations as well as specialized companies. Some of them have greater resources and larger staffs than we have. A number of our existing and potential OEM customers have the ability to design and manufacture internally the products that we manufacture for them. We face competition from the R&D groups and manufacturing operations of our existing and potential customers, who continually compare the benefits of internal research, product development, and manufacturing with the costs and benefits of outsourcing.
14
Table of Contents
We depend on our suppliers, some of which are the sole-source for certain components, and our production could be substantially curtailed if these suppliers were not able to meet our demands and alternative sources were not available.
We order raw materials and components to complete our customers’ orders, and some of these raw materials and components are ordered from sole-source suppliers. Although we work with our customers and suppliers to minimize the impact of shortages in raw materials and components, we sometimes experience short-term adverse effects due to price fluctuations and delayed shipments. In the past, there have been industry-wide shortages of electronics components. If a significant shortage of raw materials or components were to occur, we might have to delay shipments or pay premium pricing, which could adversely affect our operating results. In some cases, supply shortages of particular components could substantially curtail our production of products using these components. We are not always able to pass on price increases to our customers. Accordingly, some raw material and component price increases could adversely affect our operating results. We also depend on a small number of suppliers to provide many of the other raw materials and components that we use in our business. Some of these suppliers are affiliated with customers or competitors, and others are small companies. If we were unable to continue to purchase these raw materials and components from our suppliers, our operating results could be adversely affected. Because many of our costs are fixed, our margins depend on the volume of output at our facilities, and a reduction in volume could adversely affect our margins.
We rely on successful performance by and relationships with suppliers. This reliance could have a material adverse effect on our results of operations and financial condition.
We have formed arrangements with suppliers for various services and components. We have formed these arrangements because it is commercially more efficient to outsource these services and purchase these components than it would be for us to perform these services or manufacture these components, which in some cases require, among other things, a high degree of technical skill and advanced equipment that is not practical or cost-effective for us to develop or acquire. As a result, if one of our suppliers were to experience quality problems, capacity constraints, decreased yields, or delivery delays, or were to raise prices significantly, we could face product liability claims, product shortages, decreased revenues or lost customers, which could adversely affect our operating results.
If we were to be left with excess inventory, our operating results could be adversely affected.
Because of long lead times and specialized product designs, in certain cases we purchase components and manufacture products in anticipation of customer orders based on customer forecasts. For a variety of reasons, such as decreased end-user demand for our products, inadequate or inaccurate forecasts, or other issues that might impact production planning, our customers might not purchase all the products that we have manufactured or for which we have purchased components. In any such event, we would attempt to recoup material and manufacturing costs by means such as returning components to our vendors, disposing of excess inventory through other channels, or requiring our OEM customers to purchase or otherwise compensate us for such excess inventory. Some of our significant customer agreements do not give us the ability to require our OEM customers to do this. To the extent that we were unsuccessful in recouping our material and manufacturing costs, our gross margin and operating results could be adversely affected. Moreover, carrying excess inventory would reduce the working capital we have available to continue to operate and grow our business.
Uncertainties and adverse trends affecting our industry or any of our major customers could adversely affect our operating results.
Our business operates primarily within three business segments: Medical Imaging, Ultrasound, and Security and Detection. The Medical and Security and Detection equipment markets in which our segments operate are subject to changes in technology, pricing, and profit margins and have been historically subject to cyclical downturns characterized by diminished product demand, rapid declines in average selling prices, and production
15
Table of Contents
over-capacity. In addition, changes in government policy and regulations relating to the purchase or use of medical and security-related capital equipment could also affect our sales. Our customers’ markets are also subject to economic cycles and are likely to experience periodic contractions. The economic conditions affecting our industry in general or any of our major customers in particular, might adversely affect our operating results.
In Security and Detection, our OEM customers’ purchasing dynamics are generally affected by the level of government funding, the expansion and/or upgrade of airport terminals, the timing of government tenders and fluctuations in airline passenger volume.
Our customers’ or our delay in obtaining or inability to obtain any necessary U.S. or foreign regulatory clearances or approvals for products could have a material adverse effect on our business.
Our products in the Medical Imaging and Ultrasound segments are finished medical devices or are components used by our customers in the production of finished medical devices that are subject to a high level of regulatory oversight. A delay in obtaining or inability to obtain any necessary U.S. or foreign regulatory clearances or approvals for products could have a material adverse effect on our business. The process of obtaining clearances and approvals can be costly and time-consuming. There is a further risk that any approvals or clearances, once obtained, might be withdrawn or modified. Medical devices cannot be marketed in the U.S. without clearance from the U.S. Food and Drug Administration, or FDA. Medical devices sold in the U.S. must also be manufactured in compliance with FDA rules and regulations, which regulate the design, manufacturing, packaging, storage, and installation of medical devices. Moreover, medical devices are required to comply with FDA regulations relating to investigational research and labeling. States may also regulate the manufacturing, sale, and use of medical devices. Medical devices are also subject to approval and regulation by foreign regulatory and safety agencies. Our products must also meet the requirements of these governments and agencies for approval and distribution. As with the U.S., foreign governments or agencies can withdraw or modify their approvals.
Our business strategy includes the pursuit of acquisitions or business combinations, which, if consummated, could be difficult to integrate, disrupt our business, dilute stockholder value, or divert management attention.
As part of our business strategy, we may seek attractive acquisitions and other business combinations. Acquisitions are typically accompanied by a number of risks, including the difficulty of integrating the operations and personnel of the acquired companies, the potential disruption of our ongoing business and distraction of management, expenses related to the acquisition, and potential unknown or underestimated liabilities associated with acquired businesses. If we do not successfully complete acquisitions, we could incur substantial expenses and devote significant management time and resources without generating any benefit to us. In addition, substantial portions of our available cash might be utilized as consideration for these acquisitions.
Our annual and quarterly operating results are subject to fluctuations, which could affect the market price of our common stock.
Our annual and quarterly results could vary significantly depending on various factors, many of which are beyond our control, and may not meet the expectations of securities analysts or investors. If this occurs, the price of our common stock could decline. These factors include:
| • | variations in the timing and volume of customer orders; |
| • | introduction and market acceptance of our customers’ or our own new products; |
| • | changes in demand for our customers’ or our own existing products; |
| • | the timing of our expenditures in anticipation of future orders; |
16
Table of Contents
| • | effectiveness in managing our manufacturing processes; |
| • | changes in competitive and economic conditions generally in our or our customers’ markets; |
| • | changes in the cost or availability of components or skilled labor; |
| • | changes in our effective tax rate; |
| • | fluctuations in manufacturing yields; |
| • | foreign currency and commodity price exposures; |
| • | investor and analyst perceptions of events affecting us, our competitors, and/or our industry; |
| • | changes in laws or regulatory requirements affecting the health care or aviation security industries or our products; and |
| • | changes in contingent consideration valuation. |
A delay in anticipated sales beyond the end of a particular quarter could have a significant effect on our operating results for that quarter. In addition, most of our operating expenses do not vary directly with net revenue and are difficult to adjust in the short term. As a result, if revenue for a particular quarter was below our expectations, we could not proportionately reduce operating expenses for that quarter. Hence, the revenue shortfall could have a disproportionate adverse effect on our operating results for that quarter.
Loss of key personnel could hurt our business because of their industry experience and their technological expertise.
We operate in a highly competitive industry and depend on the services of our key senior executives and our technological experts. The loss of the services of one or several of our key personnel or an inability to attract, train, and retain qualified and skilled personnel, specifically engineering and operations personnel, could result in the loss of customers or otherwise inhibit our ability to operate and grow our business successfully.
If we fail to effectively manage our growth or, alternatively, our spending during economic downturns, our business could be disrupted, which could harm our operating results.
Our ability to offer our products and implement our business plan in evolving markets successfully requires an effective planning and management process. We must effectively manage our spending and operations to ensure our competitive position during economic downturns, and must preserve our future opportunities when the economy improves. A failure to manage our spending and operations effectively could disrupt our business and harm our operating results. A growth in sales, combined with the challenges of managing geographically dispersed operations, can place a significant strain on our management systems and resources, and growth in future operations could continue to place such a strain. The failure to manage our growth effectively could disrupt our business and harm our operating results.
If we are unable to maintain our expertise in research and development, manufacturing processes, and marketing new products, we might not be able to compete successfully.
We believe that our future success depends upon our ability to provide research and development, provide manufacturing services that meet the changing needs of our customers, and market new products. Technological changes may adversely impact orders and sales of our existing products, or make them less desirable or even obsolete. This requires that we successfully anticipate and respond to technological changes in design and manufacturing processes in a cost-effective and timely manner. As a result, we continually evaluate the advantages and feasibility of new product designs and manufacturing processes. We may not be able to develop and introduce new and improved products in a timely or efficient manner. New and improved products, if developed, may not achieve price and profitability targets or market acceptance. Commercialization of new products may prove challenging, and we may be required to invest more time and money than expected to introduce these products into the market successfully.
17
Table of Contents
Major terrorist attacks and threats have increased financial expectations that may not materialize.
Major terrorist attacks and threats have created increased interest in our security and detection systems. However, the level of demand for our products is not predictable and may vary over time. We do not know what solutions will continue to be adopted by the U.S. Department of Homeland Security as a result of terrorism and whether our products will continue to be a part of the solutions. Additionally, should our products be considered as a part of future security solutions, it is unclear what the level of purchases may be and how quickly funding to purchase our products may be made available. These factors could adversely impact us and create unpredictability in our revenues and operating results.
We are exposed to risks associated with international operations and markets.
We source and manufacture certain components and systems outside the U.S., we market and sell products in international markets, and we have established offices and subsidiaries in Europe, Canada, and Asia. Our foreign revenue accounted for 62%, 60%, and 64% of our total net revenue for fiscal years 2016, 2015, and 2014, respectively. There are inherent risks in transacting business internationally, including:
| • | changes in applicable laws and regulatory requirements; |
| • | export and import restrictions; |
| • | export controls relating to technology; |
| • | trade agreements, tariffs, and other trade barriers; |
| • | intellectual property laws that offer less protection for our proprietary rights; |
| • | difficulties in staffing and managing foreign operations; |
| • | problems in collecting accounts receivable and longer payment cycles; |
| • | political instability and changes in the international political environment; |
| • | fluctuations in currency exchange rates; |
| • | difficulties in managing employee relations, including differences in employment practices and works councils; |
| • | difficulties in maintaining uniform standards, controls, procedures and policies across our global operations, including inventory management and financial consolidation; |
| • | expatriation controls; and |
| • | potential adverse tax consequences. |
There is significant uncertainty about the stability of global currency, credit and financial markets. These economic uncertainties affect businesses such as ours in a number of ways, making it difficult to accurately forecast and plan our future business activities. Various macroeconomic factors such as sudden adverse changes to foreign exchange rates, unemployment rates, availability of credit, strength or weakness of real estate markets and other such factors may cause our customers to cancel, decrease or delay their existing or future orders for our products. We are unable to predict the impact of this instability and if economic conditions worsen, our business and results of operations could be materially and adversely affected.
We must comply with the U.S. Foreign Corrupt Practices Act and antitrust, competition and similar laws in other jurisdictions and our failure to do so could lead to substantial liability. We could also face investigations by one or more government agencies that could be costly to respond to and divert the attention of key personnel from our business operations. An adverse outcome from any such investigation could subject us to fines or other penalties, which could adversely affect our business, financial condition and results of operations.
Any one or more of these factors may have a material adverse effect on our future international activities and, consequently, on our business and results of operations.
18
Table of Contents
There are risks associated with our operations in China.
We conduct certain manufacturing operations at, and are transitioning additional manufacturing operations to, our facility in Shanghai, China in order to reduce costs and streamline our manufacturing operations. There are administrative, legal, and governmental risks to operating in China that could result in increased operating expenses or could hamper us in the development of our operations in China. The risks from operating in China that could increase our operating expenses and adversely affect our operating results, financial condition and ability to deliver our products and grow our business include, without limitation:
| • | difficulties in staffing and managing foreign operations, particularly in attracting and retaining personnel qualified to design, sell, test and support our products; |
| • | difficulties in managing employee relations; |
| • | material changes in the value of the Chinese Yuan, or CNY; |
| • | difficulties in coordinating our operations in China with those in the U.S., Canada, and Europe; |
| • | difficulties in enforcing contracts in China; |
| • | difficulties in protecting intellectual property; |
| • | diversion of management attention; |
| • | imposition of burdensome governmental regulations; |
| • | difficulties in maintaining uniform standards, controls, procedures and policies across our global operations, including inventory management and financial consolidation; |
| • | regional political and economic instability, which could have an adverse impact on foreign exchange rates in Asia and impair our ability to conduct our business in China; and |
| • | inadequacy of the local infrastructure to support our operations. |
Our operations are vulnerable to interruption or loss due to natural disasters, epidemics, terrorist acts and other events beyond our control, which would adversely affect our business.
Although we perform manufacturing in multiple locations, we generally do not have redundant manufacturing capabilities in place for any particular product or component. As a result, we depend on our current facilities for the continued operation of our business. A natural disaster, pandemic, terrorist act, act of war, or other natural or manmade disaster affecting any of our facilities could significantly disrupt our operations, or delay or prevent product manufacturing and shipment for the time required to repair, rebuild, or replace our manufacturing facilities. This delay could be lengthy and we could incur significant expenses to repair or replace the facilities. Any similar natural or manmade disaster that affects a key supplier or customer could lead to a similar disruption in our business.
Our business could be harmed if we are unable to protect our intellectual property or if we become subject to intellectual property infringement claims.
We rely on a combination of trade secrets, patents, trademarks, copyrights and confidentiality procedures to protect our technology. Despite our efforts, the steps we have taken to protect our technology may be inadequate. Existing trade secret, patent, trademark and copyright laws offer only limited protection. Our patents could be invalidated or circumvented. In addition, others may develop substantially equivalent or superseding proprietary technology, or competitors may offer similar competing products, thereby substantially reducing the value of our proprietary rights. The laws of some foreign countries in which our products are or may be manufactured or sold may not protect our products or intellectual property rights to the same extent as do the laws of the U.S. The steps we have taken to protect our intellectual property may not be adequate to prevent misappropriation of our technology. Our inability to protect our intellectual property could have a negative impact on our operations and financial results.
19
Table of Contents
We may also become subject to claims that we infringe the intellectual property rights of others in the future. We cannot ensure that, if made, these claims will not be successful. Any claim of infringement could cause us to incur substantial costs defending against the claim even if the claim is invalid, and could distract management from other business. Any judgment against us could require substantial payment in damages and could also include an injunction or other court order that could prevent us from offering certain products.
We rely significantly on information technology and any failure, inadequacy, interruption or security lapse of that technology could harm our ability to operate our business effectively.
We rely extensively on information technology systems to interact with our employees and our customers and to run our business effectively. These interactions include ordering and managing materials from suppliers, converting materials to finished products, shipping product to customers, processing transactions, summarizing and reporting results of operations, complying with regulatory, legal and tax requirements, and other processes necessary to manage our business. Our systems could become damaged or cease to function properly due to any number of causes, including issues caused by ongoing projects to improve our information technology systems and the delivery of services, failures of third-party service providers, catastrophic events, power outages, and security breaches. Any failure or malfunctioning of our information technology systems, errors or misuse by system users, or inadequacy of the systems in addressing the needs of our operations, could disrupt our ability to timely and accurately manufacture and ship products, which could have a material adverse effect on our business, financial condition and results of operations. Any such failure, errors, misuse or inadequacy could also disrupt our ability to timely and accurately process, report and evaluate key operations metrics and key components of our results of operations, financial position and cash flows. Any such disruptions would likely divert our management and key employees’ attention away from other business matters. Any disruptions or difficulties that may occur in connection with our information technology systems could also adversely affect our ability to complete important business processes such as the evaluation of our internal control over financial reporting and attestation activities.
We face attempts by others to gain unauthorized access to our information technology systems and have been subject to information security breaches caused by illegal hacking, none of which, in the aggregate, have materially impacted our operations and financial condition to date. We may be subject to additional information security breaches caused by illegal hacking, computer viruses, or acts of vandalism or terrorism. We have implemented procedures to mitigate these risks. We monitor our data, information technology and personnel usage of our systems to reduce these risks and continue to do so on an ongoing basis for any current or potential threats; however, our security measures or those of our third-party service providers may not detect or prevent such breaches and, in some instances we, our customers, and the users of our products might be unaware of an incident or its magnitude and effect. These threats are constantly evolving, thereby increasing the difficulty of successfully defending against them or implementing adequate preventative measures. Any such compromise to our information security could result in an interruption in our operations, the unauthorized publication of our confidential business or proprietary information, the unauthorized release of customer, vendor, or employee data, the violation of privacy or other laws, and the exposure to litigation, any of which could harm our business and operating results.
If our security and detection systems fail to detect weapons, explosives or other devices that are used to commit a terrorist act, we could be exposed to product liability and related claims for which we may not have adequate insurance coverage.
Our business exposes us to potential product liability risks that are inherent in the development, manufacturing, sale and service of security and detection systems. Our customers use our security and inspection systems to help them detect items that could be used in performing terrorist acts or other crimes. The training, reliability and competence of the customers’ operators are crucial to the detection of suspicious items. In addition, our security and detection systems are not designed to work under all circumstances or may otherwise fail to detect a threat. We test the reliability of our security and detection systems during both their development
20
Table of Contents
and manufacturing phases. We also perform such tests if we are requested to perform installation, warranty or post-warranty servicing. However, our security and detection systems are advanced mechanical and electronic devices and therefore can malfunction.
As a result of the September 11, 2001, and 1993 World Trade Center terrorist attacks, and the potential for future attacks, product liability insurance coverage for such threats is extremely difficult and costly to obtain. It is possible, subject to the applicability of the Support Anti-terrorism by Fostering Effective Technologies Act of 2002, or SAFETY Act, that if we were found liable following a major act of terrorism, our insurance might not fully cover the claims for damages.
The SAFETY Act is a Federal law in the U.S. enacted to provide certain legal liability protections for providers of certain anti-terrorism technologies. If applicable to claims against Analogic, the SAFETY Act could mitigate some of this risk.
Our Security and Detection segment depends in part on purchases of products and services by the U.S. Federal Government and its agencies, which purchases may be only partially funded, and are subject to potential termination and reductions and delays in government spending.
As an indirect subcontractor or team member with prime contractors and in other cases directly to the U.S. Federal Government and its agencies, our security and detection systems are included in many different domestic programs. Over the lifetime of a program, the award of many different individual contracts and subcontracts could impact our products’ requirements. The funding of U.S. Federal Government programs are subject to Congressional appropriations. Although multiple-year contracts may be planned in connection with major procurements, Congress generally appropriates funds only on a single fiscal year basis. Consequently, programs are often only partially funded initially, and additional funds are committed only as Congress makes further appropriations and prime contracts receive such funding. The reduction or delay in funding or termination of a government program in which we are involved could result in a loss of or delay in receiving anticipated future revenues attributable to that program and contracts or orders received. The U.S. Federal Government could reduce or terminate a prime contract under which we are a subcontractor or team member irrespective of the quality of our products or services. The termination of a program or reduction in, or failure to commit additional funds to, a program in which we are involved could negatively impact our revenue and have a material adverse effect on our financial condition and results of operations.
Changes in laws affecting the health care industry could adversely affect our business, operations and financial condition.
In recent years, the healthcare industry has undergone significant changes driven by various efforts to reduce costs, including increased levels of managed care, cuts in Medicare, consolidation of healthcare distribution companies and collective purchasing arrangements by office-based healthcare practitioners. In addition, numerous governments have undertaken efforts to control healthcare costs through legislation and regulation. In the U.S. in March 2010, President Obama signed into law health care reform legislation in the form of the Patient Protection and Affordable Care Act, or PPACA. The PPACA could meaningfully change the way healthcare is developed, marketed and delivered, and may materially impact numerous aspects of our business, results of operations, and financial conditions. The implementation of health care reform and medical cost containment measures in the U.S. and in foreign countries in which we operate could:
| • | limit the use of our products and adversely affect the use of new therapies for which our products may be targeted; |
| • | reduce reimbursement available to our customers for using our products; and |
| • | decrease the price we might establish for our products and products that we may develop, which would result in lower product revenues to us. |
21
Table of Contents
In addition, because we operate in a highly regulated industry, other governmental actions may adversely affect our business, operations and financial condition, including:
| • | changes in FDA and foreign regulations that may require additional safety monitoring, labeling changes, restrictions on product distribution or use, or other measures after the introduction of our products to market, which could increase our costs of doing business, or otherwise adversely affect the market for our products; |
| • | new laws, regulations and judicial decisions affecting pricing or marketing practices; and |
| • | changes in the tax laws relating to our operations. |
Impact of transactions involving our Danish subsidiary BK Medical ApS (“BK Medical”) and certain of its distributors with respect to which we have raised questions as to compliance with law.
As initially disclosed in our Annual Report on Form 10-K for the fiscal year ended July 31, 2011, we identified certain transactions involving our Danish subsidiary BK Medical ApS, or BK Medical, and certain of its foreign distributors, with respect to which we raised questions concerning compliance with law, including Danish law and the U.S. Foreign Corrupt Practices Act, and our business policies. These have included transactions in which the distributors paid BK Medical amounts in excess of amounts owed and BK Medical transferred the excess amounts, at the direction of the distributors, to third parties identified by the distributors. We have terminated the employment of certain BK Medical employees and also terminated our relationships with the BK Medical distributors that were involved in the transactions. We have concluded that the identified transactions have been properly accounted for in our reported financial statements in all material respects. However, we were unable to ascertain with certainty the ultimate beneficiaries or the purpose of these transfers.
We voluntarily disclosed this matter to the Danish Government, the U.S. Department of Justice, or DOJ, and the SEC, and cooperated with inquiries by the Danish Government, the DOJ and the SEC to reach a resolution of this matter in the fiscal year ended July 31, 2016. On June 22, 2016, we issued a press release announcing that we had reached agreements with the SEC, the DOJ and the Danish Government to resolve the matters we had voluntarily disclosed. As a result of these resolutions, we paid a total of $14.9 million in disgorgement, interest and penalties. We do not expect any further inquiries related to this matter.
We incurred inquiry-related costs of approximately $0.4 million, $1.4 million, and $1.4 million in our fiscal years ended July 31, 2016, 2015, and 2014, respectively, in connection with this matter.
Compliance or the failure to comply with current and future environmental regulations could cause us significant expense.
We are subject to various environmental regulations. From time to time new regulations are enacted, and it is difficult to anticipate how such regulations will be implemented and enforced. We continue to evaluate the necessary steps for compliance with environmental regulations as they are enacted. These regulations include, for example, the Registration, Evaluation, Authorization and Restriction of Chemical substances, or REACH, the Restriction on the Use of Certain Hazardous Substances in Electrical and Electronic Equipment Directive, or RoHS and the Waste Electrical and Electronic Equipment Directive, or WEEE enacted in the European Union which regulate the use of certain hazardous substances in, and require the collection, reuse and recycling of waste from, certain products we manufacture. This and similar legislation that has been or is in the process of being enacted in Japan, China, Korea and various states of the U.S. may require us to redesign our products to ensure compliance with the applicable standards, for example by requiring the use of different types of materials. These redesigns or alternative materials may detrimentally impact the performance of our products, add greater testing lead-times for product introductions or have other similar effects. We believe we comply with all such legislation
22
Table of Contents
where our products are sold and we will continue to monitor these laws and the regulations being adopted under them to determine our responsibilities. In addition, we are monitoring legislation relating to the reduction of carbon emissions from industrial operations to determine whether we may be required to incur any material, additional material costs, or expenses associated with our operations. Our failure to comply with any of the foregoing regulatory requirements could result in our being directly or indirectly liable for costs, fines or penalties and third-party claims, and could jeopardize our ability to conduct business in the U.S. and foreign countries.
| Item 1B. | Unresolved Staff Comments |
None.
| Item 2. | Properties |
As of July 31, 2016, we owned or leased the primary facilities described below:
| Location |
Approximate Sq. Ft. | Principal Use(s) |
Principal Segment(s) | |||||||||
| Peabody, MA (1) |
Owned | 514,000 | Executive and administrative offices, manufacturing, R&D, customer service, and sales | All segments | ||||||||
| Shanghai, China (2) |
Owned | 145,000 | Administrative offices, manufacturing, customer service, and sales | Medical Imaging and Ultrasound | ||||||||
| Herlev, Denmark (3) |
Owned | 135,000 | Administrative offices, R&D, customer service, and sales | Ultrasound | ||||||||
| State College, PA |
Owned | 66,000 | Administrative offices, manufacturing, R&D, customer service, and sales | Ultrasound | ||||||||
| Montreal, Canada |
Leased | 54,000 | Administrative offices, manufacturing, R&D, customer service, and sales | Medical Imaging | ||||||||
| Canton, MA |
Leased | 33,000 | R&D, customer service, and sales | Medical Imaging | ||||||||
| Vancouver, Canada (4) |
Leased | 31,000 | Administrative offices, manufacturing, R&D, customer service, and sales | Ultrasound | ||||||||
| (1) | We own approximately 60 acres of land at this location, which can accommodate future expansion as required. |
| (2) | Our Shanghai, China facility, built on leased land, opened in April 2012. |
| (3) | We are not currently utilizing all the space of this facility. We have leased a portion of this facility and are currently in process of exploring various uses for the unused space. |
| (4) | This property was assumed as part of the acquisition of Ultrasonix Medical Corporation, which we refer to as Ultrasonix, acquired in March 2013. |
We lease a number of other smaller facilities in the U.S. and locations such as, the United Kingdom, Germany, Italy, Sweden and Belgium.
We believe that our existing facilities are generally adequate to meet our current needs, and that suitable additional or substitute space will be available on commercially reasonable terms when needed. Refer to Note 12 to the Consolidated Financial Statements included in this report for further information concerning certain leases.
| Item 3. | Legal Proceedings |
For a discussion of legal matters as of July 31, 2016, please read Note 11 to the notes to our Consolidated Financial Statements included in this Annual Report on Form 10-K, which is incorporated into this item by reference.
23
Table of Contents
| Item 4. | Mine Safety Disclosure |
None.
Executive Officers of the Registrant
Our current executive officers are:
| Name |
Age | Position |
Date Since Office Has Been Held |
|||||||
| James W. Green |
58 | President and Chief Executive Officer | 2007 | |||||||
| Mark Frost |
53 | Senior Vice President, Chief Financial Officer and Treasurer | 2015 | |||||||
| Shalabh Chandra |
51 | Senior Vice President and General Manager, Ultrasound Business | 2015 | |||||||
| John J. Fry |
54 | Senior Vice President, General Counsel, and Secretary | 2007 | |||||||
| Mervat Faltas |
64 | Senior Vice President and General Manager Medical Imaging Business | 2010 | |||||||
| James P. Ryan |
46 | Senior Vice President and General Manager, Security Systems, Medical Imaging Technologies and Global Operations | 2015 | |||||||
Our executive officers are elected annually by our board of directors and hold office until their successors are chosen and qualified, subject to earlier removal by the board of directors.
There are no arrangements or understandings between any of our executive officers and any other person(s) pursuant to which such executive officer was selected as an officer.
James W. Green is our President and Chief Executive Officer. Mr. Green joined us in 2007. From 2005 to 2007, Mr. Green was Regional Vice President, California Division, of Quest Diagnostics Incorporated, a leading provider of diagnostic testing, information, and services. Before joining Quest, Mr. Green served as Senior Vice President & General Manager of Computed Tomography for Philips Medical Systems, a global leader in the business of developing, manufacturing, marketing, and servicing medical computed tomography systems.
Mark Frost is our Senior Vice President, Chief Financial Officer and Treasurer. He joined us in 2015. From 2012 to 2015, Mr. Frost was executive vice president and chief financial officer for AngioDynamics, a leading provider of medical, surgical, and diagnostic devices used for vascular access and the treatment of peripheral vascular disease, and for use in oncology and surgical settings. Prior to that, he served as senior vice president of administration and chief financial officer of Albany Molecular Research Incorporated, a global provider of contract research and manufacturing services to biotech and pharmaceutical companies. Before joining AMRI in 2004, Mark held various financial roles at Smith+Nephew and General Electric, both domestically and internationally.
Shalabh Chandra is our Senior Vice President and General Manager Ultrasound, and has served in this capacity since August 2015. Mr. Chandra joined us in 2010 as Senior Vice President and General Manager, Analogic Asia. Prior to joining Analogic, Mr. Chandra held a number of key leadership roles over a 15-year career at Philips Healthcare, including general manager of Philips’ MR Patient Monitoring Group, Program Director for Value CT, and Director of CT Clinical Science.
John J. Fry is our Senior Vice President, General Counsel, and Secretary. He joined us in November 2007. From April 2005 until joining us, Mr. Fry was a principal of the law firm Driggs, Hogg, & Fry Co., L.P.A. (formerly Driggs, Lucas, Brubaker & Hogg Co., L.P.A.), where his practice focused primarily on technology and intellectual property law. From August 1995 to April 2005, he held various legal positions at Philips Medical Systems (formerly Marconi Medical Systems and Picker International), including Senior Corporate Counsel and Intellectual Property Manager and counsel to Philips’ computed tomography business.
24
Table of Contents
Mervat Faltas is our Senior Vice President and General Manager, Medical Imaging, and has served in this capacity since May 2010. She joined ANRAD Corporation, our Canadian subsidiary now known as Analogic Canada Corporation, in July 2005 as Vice President of Operations and was named President of ANRAD in January 2006. From May 2000 until June 2005, Mrs. Faltas served in various capacities at ITF Optical Technologies, a Montreal-based provider of fiber optic components for terrestrial and undersea communication networks, including President and CEO. From 1990 to 2000, Mrs. Faltas held various positions at PerkinElmer Corporation, including General Manager of PerkinElmer’s Montreal operation.
James P. Ryan is our Senior Vice President and General Manager, Security Systems, Medical Imaging Technologies and Global Operations and has served in this capacity since February 2016. From August 2015 until February 2016 Mr. Ryan served as our Senior Vice President and General Manager, Global Operations, and from 2008 until August 2015 served as our Senior Vice President, Global Operations. Mr. Ryan joined us in December 2008, as our Vice President of Global Operations. From 2000 until joining us, Mr. Ryan was a Principal in the Strategy Practice, focusing in the Healthcare and Consumer industries, for Booz & Company, a leading global management consulting firm. Prior to Booz & Co, he worked for Ingersoll-Rand in both advanced engineering and manufacturing capacities.
25
Table of Contents
| Item 5. | Market for the Registrant’s Common Equity, Related Stockholder Matters and Issuer Purchases of Equity Securities |
Our common stock trades on the NASDAQ Global Select Market under the symbol: ALOG. The following table sets forth the high and low sales prices per share of our common stock, as reported by the NASDAQ Global Select Market, for each quarterly period indicated in the table below:
| Fiscal Year |
High | Low | ||||||
| 2016 |
||||||||
| First Quarter |
$ | 88.52 | $ | 76.69 | ||||
| Second Quarter |
90.70 | 71.74 | ||||||
| Third Quarter |
81.29 | 68.71 | ||||||
| Fourth Quarter |
86.55 | 77.26 | ||||||
| 2015 |
||||||||
| First Quarter |
$ | 73.93 | $ | 63.28 | ||||
| Second Quarter |
88.94 | 70.88 | ||||||
| Third Quarter |
92.31 | 80.62 | ||||||
| Fourth Quarter |
88.01 | 75.47 | ||||||
As of August 31, 2016, there were approximately 558 holders of record of our common stock. Because many of the shares are held by brokers and other institutions on behalf of stockholders, we are unable to estimate the total number of individual stockholders represented by these holders of record. Our board of directors declared cash dividends of $0.10 per share for each of the quarters of fiscal years 2016 and 2015. We intend to pay a regular quarterly cash dividend subject to, among other things, our results of operations, cash balances, future cash requirements, financial condition, and other factors that our board of directors may deem relevant. Our policy is to retain sufficient earnings to provide funds for the operation and expansion of our business.
The following table contains information about our purchases of our equity securities during the three months ended July 31, 2016.
| Period |
Total Number of Shares Purchased (1) |
Average Price Paid per Share (1) |
Total Number of Shares Purchased as Part of Publicly Announced Plans or Programs (1)(2) |
Approximate Dollar Value of Shares that May Yet Be Purchased Under the Plans or Programs (000’s) |
||||||||||||
| 5/1/2016-5/31/2016 |
15,040 | $ | 80.11 | 15,040 | $ | 16,705 | ||||||||||
| 6/1/2016-6/30/2016 |
7,440 | $ | 83.57 | 7,440 | 16,083 | |||||||||||
| 7/1/2016-7/31/2016 |
976 | $ | 79.33 | 12,113 | 16,006 | |||||||||||
|
|
|
|
|
|||||||||||||
| Total |
23,456 | $ | 81.18 | 34,593 | ||||||||||||
|
|
|
|
|
|||||||||||||
| (1) | During the fourth quarter of fiscal year 2016, we repurchased 23,456 shares of our common stock in open-market transactions for $1.9 million at an average purchase price of $81.18 per share. These shares were purchased under the repurchase program for up to $30.0 million of our common stock authorized by our board of directors that was publicly announced on June 2, 2014. The repurchase program does not have a fixed expiration date. |
| (2) | Includes 11,137 shares of our common stock surrendered by employees in order to meet tax withholding obligations in connection with the vesting of restricted stock in July 2016. For purposes of determining the number of shares to be surrendered by employees to meet tax withholding obligations, the price per share deemed to be paid was the closing price of our common stock on the NASDAQ Global Select Market on the vesting date. |
26
Table of Contents
Comparison of Five-Year Cumulative Total Returns
The graph below compares the cumulative total stockholder return on our common stock with the cumulative total return of the Center for Research in Security Prices of the University of Chicago, or CRSP, Total Return Index for the NASDAQ Stock Market (US Companies), the Russell 2000 Index, and the CRSP Total Return Index for all NASDAQ stocks with SIC Codes related to our business in the areas of measuring instruments, photo goods, medical goods, optical goods, and timepieces. The graph assumes $100 invested on July 31, 2011, in our common stock and $100 invested at that time in each of the indexes. The comparison assumes that all dividends are reinvested.
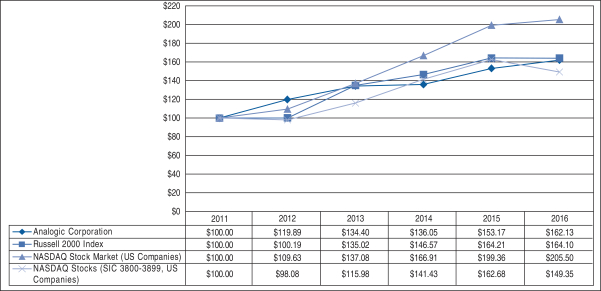
The stock price performance included in this graph is not necessarily indicative of future stock price performance.
27
Table of Contents
| Item 6. | Selected Consolidated Financial Data |
The following selected consolidated financial data are derived from our audited Consolidated Financial Statements and the notes thereto and should be read in connection with, and are qualified in their entirety by, our audited Consolidated Financial Statements and the notes thereto and other financial information included elsewhere in this Annual Report on Form 10-K.
| Years Ended July 31, | ||||||||||||||||||||
| (In millions, except share and per share data) | 2016 | 2015 | 2014 | 2013 | 2012 | |||||||||||||||
| Total net revenue |
$ | 508.8 | $ | 540.3 | $ | 517.5 | $ | 550.4 | $ | 516.6 | ||||||||||
| Total cost of sales |
280.7 | 310.8 | 297.8 | 333.7 | 323.4 | |||||||||||||||
| Gross profit |
228.1 | 229.5 | 219.7 | 216.7 | 193.2 | |||||||||||||||
| Income from operations (A) |
25.2 | 40.6 | 29.1 | 45.4 | 40.0 | |||||||||||||||
| Net income (B) |
$ | 12.1 | $ | 33.5 | $ | 34.5 | $ | 31.1 | $ | 43.1 | ||||||||||
| Basic net income per share |
$ | 0.98 | $ | 2.70 | $ | 2.78 | $ | 2.54 | $ | 3.51 | ||||||||||
| Diluted net income per share |
$ | 0.96 | $ | 2.66 | $ | 2.72 | $ | 2.48 | $ | 3.42 | ||||||||||
| Cash dividends declared per common share |
$ | 0.40 | $ | 0.40 | $ | 0.40 | $ | 0.40 | $ | 0.40 | ||||||||||
| Weighted average shares outstanding (000’s): |
||||||||||||||||||||
| Basic |
12,402 | 12,407 | 12,404 | 12,247 | 12,265 | |||||||||||||||
| Diluted |
12,615 | 12,606 | 12,667 | 12,569 | 12,576 | |||||||||||||||
| Cash, cash equivalents and marketable securities |
$ | 118.7 | $ | 123.8 | $ | 114.5 | $ | 113.0 | $ | 187.0 | ||||||||||
| Working Capital (C) |
310.3 | 316.8 | 280.0 | 262.7 | 300.1 | |||||||||||||||
| Total assets (C) |
632.9 | 624.6 | 611.6 | 587.8 | 558.0 | |||||||||||||||
| Long-term liabilities (C) |
23.3 | 13.4 | 14.5 | 10.5 | 11.7 | |||||||||||||||
| Stockholders’ equity |
531.2 | 531.4 | 512.6 | 486.4 | 446.3 | |||||||||||||||
| (A) | In fiscal year 2016, we recorded acquisition-related expenses of approximately $0.4 million associated with the acquisition of Oncura. There were restructuring charges in fiscal year 2016 of $9.6 million. During fiscal year 2016, we also recorded a $10.1 million charge in connection with the investigation related to our Danish Subsidiary BK Medical. |
In fiscal year 2015, we recorded acquisition-related expenses of approximately $0.1 million associated with the acquisition of Pathfinder. There were no restructuring charges in fiscal year 2015. During fiscal year 2015, we also recorded a $1.0 million charge in connection with the investigation related to our Danish Subsidiary BK Medical.
In fiscal year 2014, we recorded acquisition-related expenses of approximately $8.7 million associated with the acquisition of Ultrasonix, which includes $7.8 million of amortization of acquired intangibles. During fiscal year 2014, we also recorded pre-tax restructuring charges of $2.9 million under the fiscal year 2014 restructuring plan primarily for severance and personnel related costs for 48 involuntarily terminated employees and $0.6 million in relation to the fiscal year 2013 restructuring plan primarily for facility exit costs, all of which were recognized in our Consolidated Statement of Operations under restructuring.
In fiscal year 2013, we recorded $5.6 million of acquisition-related expenses associated with the acquisition of Ultrasonix which includes $3.9 million of amortization of acquired intangibles. During fiscal year 2013, we also recorded pre-tax restructuring charges of $3.5 million primarily for severance and personnel related costs for 115 involuntarily terminated employees and facility exit costs, all of which were recognized in our Consolidated Statement of Operations under restructuring.
In fiscal year 2012 there were no restructuring charges.
| (B) | In fiscal year 2016, we recorded certain discrete tax provisions totaling $1.2 million consisting primarily of a $1.5 million increase in uncertain tax benefits associated with an increase in uncertain tax positions primarily associated with the BK Medical matter, offset in part by a $0.4 million benefit associated with the |
28
Table of Contents
| extension of the federal R&D tax credit, and a $0.3 million reduction in uncertain tax positions primarily associated with the expiration of the statute of limitations, along with $0.3 million provision on other items. |
During fiscal year 2016, we also recorded a $3.2 million interest charge in connection with the investigation related to our Danish Subsidiary BK Medical.
In fiscal year 2015, we recorded certain discrete tax benefits totaling $2.9 million consisting primarily of a $3.4 million reduction in uncertain tax positions primarily associated with the expiration of the statute of limitations, a $0.8 million benefit associated with the extension of the federal R&D tax credit, a $0.3 million provision on reduction of domestic production deduction due to filing of NOL carryback claim, along with $1.0 million provision on other items. During fiscal year 2015, we also recorded a $0.6 million interest charge in connection with the investigation related to our Danish Subsidiary BK Medical.
In fiscal year 2014, we recorded certain discrete tax benefits totaling $8.8 million associated with a change in classification of our Canadian operations. Further discrete tax benefits recognized amounted to $3.8 million, of which $1.1 million related to reversal and remeasurement of reserves as a result of a favorable IRS tax audit and $2.7 million associated with a US tax benefit for historical currency losses incurred as a result of operating offshore in a non-functional currency. We also recorded a loss on investments in PocketSonics of $0.5 million resulting from the acquisition of PocketSonics on September 20, 2013.
In fiscal year 2012, we recorded a gain on the sale of other investments on a pre-tax basis of $2.5 million related to the sale of our remaining 25% equity interest in a China-based affiliate. In addition, during fiscal year 2012, we received a refund of $12.0 million as a result of the completion of an U.S. Internal Revenue Service, or IRS, audit of U.S. Federal income tax returns for the fiscal years ended July 31, 2003, 2005 and 2008. The refund was largely the result of Federal research and experimentation credits that carryover from the fiscal years 1991 through 2000 into the audited returns. We recorded a tax benefit for this refund, including the related interest, in the Consolidated Statement of Operations of $10.0 million in fiscal year 2012. Related to the refund and interest were contingent professional fees of $2.7 million that were recorded in general and administrative expenses in the Consolidated Statement of Operations in fiscal year 2012. In connection with the conclusion of the IRS audit, we recorded a benefit from the reversal and re-measurement of related tax reserves of $2.3 million in the Consolidated Statement of Operations in fiscal year 2012.
| (C) | In fiscal year 2016, we retrospectively adopted ASU No. 2015-17, “Income Taxes (Topic 740): Balance Sheet Classification of Deferred Taxes.” Please refer to Note 1, Recent Accounting Pronouncements, and Note 15, Income taxes for additional information. The effects of the accounting change on working capital, total assets, and long-term liabilities were revised to reflect the change on the Consolidated Balance Sheets as of July 31, 2015, 2014, 2013 and 2012, respectively. |
| Item 7. | Management’s Discussion and Analysis of Financial Condition and Results of Operations |
The following discussion provides an analysis of our financial condition and results of operations and should be read in conjunction with the audited Consolidated Financial Statements and notes thereto included elsewhere in this Annual Report on Form 10-K. The discussion contains statements, which, to the extent that they are not a recitation of historical facts, constitute “forward-looking statements” pursuant to the safe harbor provisions of the Private Securities Litigation Reform Act of 1995. All statements, other than statements of historical fact, including statements about product development, market and industry trends, strategic initiatives, regulatory approvals, sales, profits, expenses, price trends, R&D expenses and trends, and capital expenditures, we make in this document or in any document incorporated by reference are forward-looking. Without limiting the foregoing, the words “believes,” “anticipates,” “plans,” “expects,” “seeks,” “estimates,” and similar expressions are intended to identify forward looking statements. Such forward-looking statements involve known and unknown risks, uncertainties, and other factors, which may cause our actual results, performance, or achievements to differ from the projected results. Refer to “Risk Factors” in Item 1A for a discussion of the primary risks and uncertainties known to us at this time.
29
Table of Contents
In addition, any forward-looking statements represent management’s views only as of the date of this Annual Report on Form 10-K was filed with the SEC and should not be relied upon as representing management’s views as of any subsequent date. While management may elect to update forward-looking statements at some point in the future, it specifically disclaims any obligation to do so, even if its views change, except as required by law.
We report our financial condition and results of operations on a fiscal year basis ending July 31. The three months ended July 31, 2016 and 2015 represent the fourth quarters of fiscal years 2016 and 2015, respectively.
Our Management’s Discussion and Analysis is presented in seven sections as follows:
| • | Business Overview |
| • | Fiscal Year 2016 Financial Highlights |
| • | Results of Operations |
| • | Liquidity and Capital Resources |
| • | Impact of Investigation Regarding our Danish Subsidiary |
| • | Recent Accounting Pronouncements |
| • | Critical Accounting Policies |
Business Overview
Analogic Corporation designs, manufactures, and commercializes innovative real-time guidance, diagnostic imaging and threat detection technologies to advance the practice of medicine and save lives. We design, manufacture and sell advanced medical imaging, ultrasound and security systems and subsystems to original equipment manufacturers, or OEMs, and end users primarily for the healthcare and airport security markets.
Our business is strategically aligned into three segments: Medical Imaging, Ultrasound, and Security and Detection. Our business segments are described as follows:
| • | Medical Imaging primarily includes systems and subsystems for CT and MRI medical imaging equipment as well as state-of-the-art, selenium-based detectors for screening of breast cancer and other diagnostic applications in mammography. |
| • | Ultrasound includes ultrasound systems and transducers primarily used in the urology, surgery, and point-of-care markets. |
| • | Security and Detection includes advanced threat detection CT systems utilizing our expertise in advanced medical imaging technology, primarily used in the checked baggage screening at airports worldwide. |
The following table sets forth the percentage of total net revenue by reporting segment for fiscal years 2016, 2015 and 2014.
| For the Year ended July 31, | ||||||||||||
| 2016 | 2015 | 2014 | ||||||||||
| Medical Imaging |
57 | % | 54 | % | 57 | % | ||||||
| Ultrasound |
32 | % | 31 | % | 30 | % | ||||||
| Security and Detection |
11 | % | 15 | % | 13 | % | ||||||
| Total revenue |
100 | % | 100 | % | 100 | % | ||||||
30
Table of Contents
Fiscal Year 2016 Financial Highlights
The following table is a summary of our financial results for the fiscal years ended July 31, 2016 and 2015. This summary is not a substitute for the detail provided in the following pages or the audited Consolidated Financial Statements and notes that appear elsewhere in this document.
| For the Year ended July 31, | Percentage Change |
|||||||||||
| (in millions, except per share amounts and percentages) | 2016 | 2015 | ||||||||||
| Total net revenues |
$ | 508.8 | $ | 540.3 | -6 | % | ||||||
| Gross profit |
$ | 228.1 | $ | 229.5 | -1 | % | ||||||
| Gross margin |
44.8 | % | 42.5 | % | ||||||||
| Income from operations |
$ | 25.2 | $ | 40.6 | -38 | % | ||||||
| Operating margin |
5.0 | % | 7.5 | % | ||||||||
| Net income |
$ | 12.1 | $ | 33.5 | -64 | % | ||||||
| Diluted net income per share |
$ | 0.96 | $ | 2.66 | -64 | % | ||||||
During fiscal year 2016 our total net revenue decreased by 6% as compared to the prior year primarily due to decrease in sales in our Security and Detection segments driven by reductions in High Speed shipments, lower Medium Speed shipments, and reductions in sales of Rapid DNA Analysis Systems.
Gross profit decreased by 1% as a result of lower revenues, and gross margin increased by 2.3 points in fiscal year 2016 compared to the prior year due to favorable pricing, product mix and cost reductions in both the Medical Imaging and Security and Detection segments.
Income from operations decreased by 38% and operating margin decreased by 2.5 points in fiscal year 2016 from the prior year due primarily to lower revenues, an approximate $10.0 million increase in restructuring expenses and a $9.1 million increase in expenses related to the BK Medical matter (please refer to Note 11, Commitments, guarantees and contingencies).
Results of Operations
Fiscal Year 2016 Compared to Fiscal Year 2015
Net Revenue
Product Revenue
Product revenue for fiscal year 2016 as compared with fiscal year 2015 is summarized in the table below.
| For the Year ended July 31, | Percentage Change |
|||||||||||
| (in millions except percentages) | 2016 | 2015 | ||||||||||
| Medical Imaging |
$ | 285.8 | $ | 288.6 | -1 | % | ||||||
| Ultrasound |
160.8 | 163.6 | -2 | % | ||||||||
| Security and Detection |
56.1 | 79.0 | -29 | % | ||||||||
| Total product revenue |
$ | 502.7 | $ | 531.2 | -5 | % | ||||||
Medical Imaging
During fiscal year 2016, our Medical Imaging product revenue decreased by 1% versus the prior comparable period mainly due to lower CT and MR as a result of mix.
Ultrasound
During fiscal year 2016, our Ultrasound product revenue decreased by 2% versus the prior year comparable period, with a 7% increase in Ultrasound direct being offset by a 42% decrease in customer demand of OEM probes.
31
Table of Contents
Security and Detection
During fiscal year 2016, our Security and Detection product revenue decreased by 29% versus the prior year comparable period primarily driven by reductions in High Speed shipments, lower Medium Speed shipments, and reductions in sales of Rapid DNA Analysis Systems.
Engineering Revenue
Engineering revenue for fiscal year 2016 as compared with fiscal year 2015 is summarized in the table below.
| For the Year ended July 31, | Percentage Change |
|||||||||||
| (in millions except percentages) | 2016 | 2015 | ||||||||||
| Medical Imaging |
$ | 3.4 | $ | 4.0 | -15 | % | ||||||
| Ultrasound |
2.4 | 2.6 | -8 | % | ||||||||
| Security and Detection |
0.3 | 2.5 | -88 | % | ||||||||
| Total engineering revenue |
$ | 6.1 | $ | 9.1 | -33 | % | ||||||
Our business model includes customer-funded engineering projects that integrate our core technologies within our customer’s product portfolios. These projects vary substantially from period to period in terms of resource requirements, type, size, length of project, and profitability.
The change in engineering revenue for the fiscal year 2016 versus the prior year comparable period was primarily due to timing of work done on customer-funded engineering projects in all three of our reported segments.
Gross Margin
Product Gross Margin
Product gross margin for fiscal year 2016, as compared with fiscal year 2015, is summarized in the table below.
| For the Year ended July 31, | Percentage Change |
|||||||||||
| (in millions except percentages) | 2016 | 2015 | ||||||||||
| Product gross profit |
$ | 227.1 | $ | 228.2 | 0 | % | ||||||
| Product gross margin |
45.2 | % | 43.0 | % | ||||||||
Gross margin during fiscal year 2016 increased by 2.2 points in fiscal year 2016 compared to the prior year primarily as a result of favorable pricing and product mix in both our Medical Imaging and Security and Detection segments as well as due to ongoing cost control efforts.
Engineering Gross Margin
Engineering gross margin for fiscal year 2016, as compared with fiscal year 2015, is summarized in the table below.
| For the Year ended July 31, | Percentage Change |
|||||||||||
| (in millions except percentages) | 2016 | 2015 | ||||||||||
| Engineering gross profit |
$ | 0.9 | $ | 1.3 | -31 | % | ||||||
| Engineering gross margin |
15.5 | % | 14.2 | % | ||||||||
The decrease in the engineering gross profit and increase in the engineering gross margin in fiscal year 2016 versus the prior year comparable period was due to our lower engineering revenue, and due to the mix of engineering projects.
32
Table of Contents
Operating Expenses
Operating expenses are summarized as follows:
| For the Year ended July 31, | Percentage Change |
Percentage of Net Revenue | ||||||||||||||||||
| (in millions except percentages) | 2016 | 2015 | 2016 | 2015 | ||||||||||||||||
| Research and product development |
$ | 67.1 | $ | 68.5 | -2.0 | % | 13.2 | % | 12.7 | % | ||||||||||
| Selling and marketing |
65.3 | 63.5 | 2.8 | % | 12.8 | % | 11.8 | % | ||||||||||||
| General and administrative |
60.8 | 57.3 | 6.1 | % | 11.9 | % | 10.5 | % | ||||||||||||
| Restructuring |
9.6 | (0.4 | ) | -2500.0 | % | 1.9 | % | -0.1 | % | |||||||||||
| Total operating expenses |
$ | 202.8 | $ | 188.9 | 7.4 | % | 39.8 | % | 35.0 | % | ||||||||||
Operating expenses for the fiscal year 2016 increased by 7.4% versus the prior year comparable period.
Research and product development expenses decreased by 2.0% during fiscal year 2016 versus the prior year comparable period primarily due to lower compensation-related costs.
Selling and marketing expenses increased by 2.8% during fiscal year 2016 versus the prior year comparable period due primarily to additional costs -related to the acquisition of Oncura.
General and administrative expenses increased by 6.1% during fiscal year 2016 versus the prior year comparable period primarily due to a $10.1 million charge in fiscal year 2016 related to the BK Medical matter (please refer to Note 11, Commitments, guarantees and contingencies) , partially offset by lower compensation-related costs.
Restructuring expenses increased by approximately $10 million during fiscal year 2016 versus the prior years comparable period due to the execution of Fiscal Year 2016 Restructuring Plan (please refer to Note 4, Restructuring charges).
Other (Expense) Income, Net
| For the Year ended July 31, | ||||||||
| (in millions) | 2016 | 2015 | ||||||
| Interest income, net |
$ | 0.2 | $ | 0.1 | ||||
| Other, net |
(5.1 | ) | 0.3 | |||||
| Total other (expense) income, net |
$ | (4.9 | ) | $ | 0.4 | |||
Total other expenses increased by $5.3 million in fiscal year 2016 versus the prior year comparable period primarily due to an increase of $2.6 million interest charge in connection with the BK Medical matter (See “Impact of Investigation Regarding our Danish Subsidiary” section below), and foreign currency translation losses increased by $2.3 million.
Provision for Income Taxes
The following table presents the provision for income taxes and our effective tax rate for the fiscal years ended July 31, 2016 and 2015:
| For the Year ended July 31, | ||||||||
| (in millions except percentages) | 2016 | 2015 | ||||||
| Provision for income taxes |
$ | 8.2 | $ | 7.6 | ||||
| Effective tax rate |
40 | % | 18 | % | ||||
33
Table of Contents
Our effective income tax rate is based upon the composition of the income in different countries, and adjustments, if any, in the applicable quarterly periods for tax consequences, benefits, resolutions of tax audits, other tax contingencies or other discrete items.
Our effective tax rate for fiscal year 2016 is higher than the statutory rate of 35%, primarily due to certain discrete tax provisions totaling $1.2 million. The discrete tax provision for fiscal year 2016 consists primarily of a $1.5 million increase in uncertain tax positions primarily associated with the BK Medical matter, offset by a $0.4 million benefit associated with the extension of the federal R&D tax credit, a $0.3 million reduction in uncertain tax positions primarily associated with the expiration of statute of limitations, along with $0.3 million provision on other items.
Our effective tax rate for fiscal year 2015 is lower than the statutory rate of 35%, primarily due to lower foreign tax rates and tax credits in the U.S. and Canada. The tax provision for fiscal year 2015 includes certain discrete tax benefits totaling $2.9 million. The discrete tax benefit for fiscal year 2015 consists primarily of a $3.4 million reduction in uncertain tax positions primarily associated with the expiration of statute of limitations, a $0.8 million benefit associated with the extension of the federal R&D tax credit, a $0.3 million provision on reduction of domestic production deduction due to filing of NOL carryback claim, along with $1.0 million provision on other items.
Net Income and Diluted Net Income Per Share
Net income and diluted net income per share from operations for fiscal years 2016 and 2015 were as follows:
| For the Year ended July 31, | ||||||||
| (in millions except percentages) | 2016 | 2015 | ||||||
| Net income |
$ | 12.1 | $ | 33.5 | ||||
| % of net revenue |
2.4 | % | 6.2 | % | ||||
| Diluted net income per share from operations |
$ | 0.96 | $ | 2.66 | ||||
Fiscal Year 2015 Compared to Fiscal Year 2014
Net Revenue
Product Revenue
Product revenue for fiscal year 2015 as compared with fiscal year 2014 is summarized in the table below.
| Years Ended July 31 | Percentage Change |
|||||||||||
| (in millions except percentages) | 2015 | 2014 | ||||||||||
| Product Revenue: |
||||||||||||
| Medical Imaging |
$ | 288.6 | $ | 291.3 | -1 | % | ||||||
| Ultrasound |
163.6 | 152.3 | 7 | % | ||||||||
| Security and Detection |
79.0 | 65.9 | 20 | % | ||||||||
|
|
||||||||||||
| Total product revenue |
$ | 531.2 | $ | 509.5 | 4 | % | ||||||
|
|
||||||||||||
Medical Imaging
During fiscal year 2015, our Medical Imaging product revenue decreased $2.7 million versus the prior comparable period due to a reduction in MRI revenues being partially offset by higher CT revenues.
34
Table of Contents
Ultrasound
During fiscal year 2015, our Ultrasound product revenue increased $11.3 million versus the prior year comparable period due to continued growth in direct sales in North America. Additionally, we have successfully introduced and shipped early production units of TriCore™ based flagship bk3000™ systems.
Security and Detection
During fiscal year 2015, our Security and Detection product revenue increased $13 million versus the prior year comparable period primarily driven by sales growth of high-speed threat detection systems.
Engineering revenue for fiscal year 2015 as compared with fiscal year 2014 is summarized in the table below.
| Years Ended July 31 | Percentage Change |
|||||||||||
| (in millions except percentages) | 2015 | 2014 | ||||||||||
| Engineering Revenue: |
||||||||||||
| Medical Imaging |
$ | 4.0 | $ | 4.3 | -7 | % | ||||||
| Ultrasound |
2.6 | 0.2 | 1200 | % | ||||||||
| Security and Detection |
2.5 | 3.5 | -29 | % | ||||||||
|
|
||||||||||||
| Total engineering revenue |
$ | 9.1 | $ | 8.0 | 14 | % | ||||||
|
|
||||||||||||
Our business model includes customer-funded engineering projects that integrate our core technologies within our customer’s product portfolios. These projects vary substantially from period to period in terms of resource requirements, type, size, length of project, and profitability.
Medical Imaging
The $0.3 million decrease in engineering revenue for fiscal year 2015 versus the prior year comparable periods was due primarily to the timing of customer-funded engineering projects.
Ultrasound
The $2.4 million increase in engineering revenue for fiscal year 2015 versus the prior comparable periods was driven by private label development that is expected to begin shipments in fiscal 2016.
Security and Detection
The $1.0 million decrease in engineering revenue for the fiscal year 2015 versus the prior year comparable periods was due primarily to the timing of customer-funded engineering projects.
Gross Margin
Product Gross Margin
Product gross margin for fiscal year 2015, as compared with fiscal year 2014, is summarized in the table below.
| Years Ended July 31 | Percentage Change |
|||||||||||
| (in millions except percentages) | 2015 | 2014 | ||||||||||
| Product gross profit |
$ | 228.2 | $ | 218.6 | 4 | % | ||||||
| Product gross margin |
43.0 | % | 42.9 | % | ||||||||
35
Table of Contents
Gross margin during fiscal year 2015 was flat versus prior year comparable period, reflective of changes in product mix, and more efficient manufacturing operations, partially offset by impact of unfavorable foreign currency.
Engineering Gross Margin
Engineering gross margin for fiscal year 2015, as compared with fiscal year 2014, is summarized in the table below.
| Years Ended July 31 | Percentage Change |
|||||||||||
| (in millions except percentages) | 2015 | 2014 | ||||||||||
| Engineering gross profit |
$ | 1.3 | $ | 1.1 | 18 | % | ||||||
| Engineering gross margin |
14.2 | % | 13.8 | % | ||||||||
Engineering gross profit was relatively flat in fiscal year 2015 versus the prior year comparable period.
Operating Expenses
Operating expenses are summarized as follows:
| Years Ended July 31 | Percentage Change |
Percentage of Net revenue | ||||||||||||||||||
| (in millions except percentages) | 2015 | 2014 | 2015 | 2014 | ||||||||||||||||
| Operating Expenses: |
||||||||||||||||||||
| Research and product development |
$ | 68.5 | $ | 73.8 | -7.2 | % | 12.7 | % | 14.3 | % | ||||||||||
| Selling and marketing |
63.5 | 59.2 | 7.3 | % | 11.8 | % | 11.4 | % | ||||||||||||
| General and administrative |
57.3 | 54.1 | 5.9 | % | 10.5 | % | 10.4 | % | ||||||||||||
| Restructuring |
(0.4 | ) | 3.5 | -111.4 | % | -0.1 | % | 0.7 | % | |||||||||||
| Total operating expenses |
$ | 188.9 | $ | 190.6 | -0.9 | % | 35.0 | % | 36.8 | % | ||||||||||
Operating expenses for the fiscal year 2015 decreased $1.7 million, or 0.9% versus the prior year comparable period.
Research and product development expenses decreased $5.4 million during fiscal year 2015 versus the prior year comparable period due to cost reduction actions and specifically a reduction in headcount, which resulted in a decrease of $5.3 million in expenses.
Selling and marketing expenses increased $4.3 million during fiscal year 2015 versus the prior year comparable period due primarily to increased incentive compensation of $3.4 million, an increase in costs associated with the introduction of new products of $1.5 million offset by staffing changes.
General and administrative expenses increased by $3.1 million during fiscal year 2015 versus the prior year comparable period which is driven by higher incentive compensation costs accrued based on our fiscal year 2015 performance as well as a $1.0 million charge for a settlement proposal with the SEC, related to our Danish Subsidiary BK Medical.
Fiscal Year 2014 Restructuring Plan – During the fourth quarter of fiscal year 2014, we incurred pre-tax charges of $2.9 million, primarily relating to severance and personnel related costs for 48 involuntarily terminated employees associated with restructuring activities, including optimization of our operations in Peabody, Massachusetts, which are recognized in our Consolidated Statement of Operations under restructuring. The $2.9 million charge was recorded in the operating results of our Medical Imaging, Ultrasound, and Security and Detection segments, with charges of $1.9 million, $0.5 million and $0.5 million, respectively. During fiscal year 2015, we had adjustments of $(0.4) million to restructuring with respect to the fiscal year 2014 restructuring. Of the total adjustments of $(0.4) million, $(0.2) million, $(0.1) million, and $(0.1) million was included in the operating results of our Medical Imaging, Ultrasound and Security and Detection segments, respectively.
36
Table of Contents
Fiscal Year 2013 Restructuring Plan – During fiscal year 2014, we incurred an additional $0.6 million restructuring and related charges with respect to the fiscal year 2013 restructuring plan related to facility exit costs. Of the total pre-tax charges of $0.6 million, we incurred $(0.2) million, $0.9 million, and $(0.1) million included in the operating results of our Medical Imaging, Ultrasound and Security and Detection segments, respectively. During fiscal year 2015, we adjusted restructuring by $(0.1) which was included in operating results.
Restructuring and related charges, including actions associated with acquisitions, by segment are as follows:
| For the Year ended July 31, | ||||||||
| (in millions) | 2015 | 2014 | ||||||
| Medical Imaging |
$ | (0.2 | ) | $ | 1.7 | |||
| Ultrasound |
(0.1 | ) | 1.4 | |||||
| Security and Detection |
(0.1 | ) | 0.4 | |||||
| Restructuring and related charges |
$ | (0.4 | ) | $ | 3.5 | |||
Other (Expense) Income, Net
| Years Ended July 31 | ||||||||
| (in millions) | 2015 | 2014 | ||||||
| Interest income, net |
$ | 0.1 | $ | 0.3 | ||||
| (Loss) on Sale of Investments |
— | (0.5 | ) | |||||
| Net Other |
0.3 | 0.1 | ||||||
| Total other income (expense), net |
$ | 0.4 | $ | (0.1 | ) | |||
Total other expenses, net during fiscal year 2015 was primarily comprised of interest income, net, of $0.1 million, and a $0.6 million interest charge for a settlement proposal with the SEC, related to our Danish Subsidiary BK Medical (See “Impact of Investigation Regarding our Danish Subsidiary” section below), netted by foreign translation gains of $0.7 million.
Total other expenses, net during fiscal year 2014 predominantly comprised of interest income, net of $0.3 million and the recognition of a $0.5 million loss related to our 10% pre-acquisition equity interest in PocketSonics recognized upon the completion of the acquisition of the remaining equity in PocketSonics in September 2013. Please refer to Note 3. Business Combinations to our Consolidated Financial Statements included in this report for further information about this acquisition.
Provision for Income Taxes
The following table presents the provision for income taxes and our effective tax rate for the fiscal years ended July 31, 2015 and 2014:
| Years Ended July 31 | ||||||||
| (in millions except percentages) | 2015 | 2014 | ||||||
| Provision for (benefit from) income taxes |
$ | 7.6 | $ | (5.4 | ) | |||
| Effective tax rate |
18 | % | -19 | % | ||||
Our effective income tax rate is based upon the composition of the income in different countries, and adjustments, if any, in the applicable quarterly periods for tax consequences, benefits, resolutions of tax audits, other tax contingencies or other discrete items.
37
Table of Contents
Our effective tax rate before discrete items for fiscal year 2015 is lower than the statutory rate of 35%, primarily due to lower foreign tax rates and tax credits in the U.S. and Canada. The tax provision for fiscal year 2015 includes certain discrete tax benefits totaling $2.9 million. The discrete tax benefit for fiscal year 2015 consists primarily of a $3.4 million reduction in uncertain tax positions primarily associated with the expiration of statute of limitations, a $0.8 million benefit associated with the extension of the federal R&D tax credit, a $0.3 million provision on reduction of domestic production deduction due to filing of NOL carryback claim, along with $1.0 million provision on other items.
Our effective tax rate before discrete items for fiscal year 2014 is lower than the statutory rate of 35%, primarily due to lower foreign tax rates and tax credits in the U.S. and Canada. The tax provision for fiscal year 2014 includes certain discrete tax benefits totaling $12.9 million. The discrete tax benefit for fiscal year 2014 consists primarily of a reduction in a net deferred tax liability of $8.8 million associated with a change in classification of our Canadian operations, a $2.7 million benefit associated with a U.S. deduction for historical currency losses incurred as a result of operating offshore in a non-functional currency, and a $1 million reduction in uncertain tax positions primarily associated with federal tax credits for research and development, or R&D credits, following the conclusion of an Internal Revenue Service, or IRS, review for fiscal year 2009, along with $0.4 million of other items.
Net Income and Diluted Net Income Per Share
Net income and diluted net income per share from operations for fiscal years 2015 and 2014 were as follows:
| Years Ended July 31 | ||||||||
| (in millions except percentages) | 2015 | 2014 | ||||||
| Net Income |
$ | 33.5 | $ | 34.5 | ||||
| % of net revenue |
6.2 | % | 6.7 | % | ||||
| Diluted net income per share from operations |
$ | 2.66 | $ | 2.72 | ||||
The decrease in net income for fiscal year 2015 versus the prior year was due to net tax benefits from certain discrete tax items recorded in fiscal year 2014 totaling $12.9 million, partially offset by $2.9 million in discrete tax benefits taken in fiscal year 2015.
Liquidity and Capital Resources
Key liquidity and capital resources information is summarized in the table below.
| (in millions) | As of July 31, 2016 | As of July 31, 2015 | Percentage Change |
|||||||||
| Cash and cash equivalents (A) |
$ | 118.7 | $ | 123.8 | -4 | % | ||||||
| Working capital |
$ | 310.3 | $ | 316.8 | -2 | % | ||||||
| (A) | Includes approximately $45.3 million and $37.8 million of cash and cash equivalents held outside the U.S. as of July 31, 2016 and 2015, respectively. |
As of July 31, 2016, we had cash and cash equivalents of $118.7 million, a $5.1 million decrease from July 31, 2015, as we generated $33 million in cash from operations and $4.7 million from the issuance of stock. This was offset by $13.7 million paid for the repurchase of common stock, $13.1 million paid for additions to property and equipment, $8.4 million net cash paid for the purchase of Oncura, $5.0 million cash payment to shareholders for dividends, and $2.7 million for the shares repurchased for taxes for vested employee restricted stock grants.
38
Table of Contents
The decrease in working capital from July 31, 2015 to July 31, 2016 was primarily attributable to a decrease in income tax receivable of $9.6 million, a decrease in accounts receivable of $6.9 million, a decrease in cash of $5.1 million, an increase in accrued restructuring charges of $4.7 million, and an increase in contingent consideration of $4.5 million, partially offset by an increase in inventory of $12.8 million, a decrease in accrued employee compensation and benefits by $4.7 million, a decrease in accrued income tax of $2.5 million, a decrease in accounts payable of $1.9 million, an increase in other current assets of $1.0 million, and a decrease in other current liabilities of $0.8 million.
Cash and cash equivalents at July 31, 2016 and July 31, 2015 primarily consisted of demand deposits at highly rated banks and financial institutions. We periodically review our investment portfolio to determine if any investments are impaired due to changes in credit risk or other potential valuation concerns. We believe that our cash equivalents were appropriately valued at July 31, 2016 and July 31, 2015 and we are not aware of any market events that would impact their valuation. This could change in the future should new developments arise in the credit markets.
The carrying amounts reflected in the Consolidated Balance Sheets of cash and cash equivalents, trade receivables, and trade payables approximate fair value at July 31, 2016, due to the short-term maturities of these instruments.
We have revolving credit facilities of up to $101 million available for direct borrowings. We did not have any borrowings outstanding under these credit facilities as of July 31, 2016 and 2015. For further details surrounding the revolving credit facilities, please refer to the Commitments, Contractual Obligations and Off-Balance Sheet Arrangements section.
Cash Flows
The following table summarizes our sources and uses of cash over the periods indicated:
| For the Year ended July 31, | Percentage Change |
|||||||||||||||
| (in millions, except percentages) | 2016 | 2015 | 2014 | |||||||||||||
| Net cash provided by operating activities |
$ | 33.0 | $ | 38.7 | $ | 47.9 | -15 | % | ||||||||
| Net cash used in investing activities |
(21.4 | ) | (11.0 | ) | (28.5 | ) | 95 | % | ||||||||
| Net cash used in financing activities |
(16.8 | ) | (12.8 | ) | (18.2 | ) | 31 | % | ||||||||
| Effect of exchange rate changes on cash |
0.1 | (5.7 | ) | 0.3 | -102 | % | ||||||||||
| Net (decrease) increase in cash and cash equivalents |
$ | (5.1 | ) | $ | 9.2 | $ | 1.5 | -155 | % | |||||||
Operating activities
Net cash provided by operating activities decreased by $5.7 million for the year ended July 31, 2016 versus the prior year comparable period, primarily due to a decrease from cash generated from earnings, partially offset by the collection of accounts receivable. The cash flows provided by operating activities during the year ended July 31, 2016 reflects our net income of $12.1 million, $23.0 million related to depreciation and amortization, $8.9 million related to share-based compensation, and $6.6 million related to the accrued income taxes and income taxes receivable. This was partially offset by a net increase of $17.4 million in inventory related to non-cash write down of demo equipment to net realizable value, non-cash provision for excess and obsolescence inventory and a net change in operating inventory, primarily related to the transition of products from our Peabody, Massachusetts location to our existing facility in Shanghai, China.
The cash flows provided by operating activities during fiscal year 2015 primarily reflects our net income of $33.5 million, $23.3 million related to depreciation and amortization, and $10.9 million related to share-based compensation expense. This was partially offset by an increase in accounts receivable of $16.1 million which is consistent with increased revenues, and an increase in inventory of $14.7 million related to new product development.
39
Table of Contents
The cash flows provided by operating activities during fiscal year 2014 primarily reflects our net income of $34.5 million, $22.1 million related to depreciation and amortization, and $6.6 million related to decrease in accounts receivable. This was partially offset by an increase in inventory of $12.3 million as we consolidate our manufacturing operations following the acquisition of Ultrasonix and support new product launches.
Investing activities
The net cash used in investing activities during the year ended July 31, 2016 was driven by purchase of property, plant and equipment of $13.1 million as well as the acquisition of Oncura for an $8.4 million net cash payment. Our capital expenditures are primarily related to infrastructure and manufacturing equipment investments.
The net cash used for investing activities during the year ended July 31, 2015 was primarily driven by purchases of property, plant and equipment of $10.0 million as well as the acquisition of Pathfinder, net of cash acquired, of $1.6 million. Our capital expenditures are primarily related to infrastructure and test equipment investments.
The net cash used for investing activities during the year ended July 31, 2014 was primarily driven by the acquisition of PocketSonics, net of cash acquired, of $10.6 million as well as purchases of property, plant and equipment of $17.5 million. Our capital expenditures are primarily related to infrastructure and test equipment investments to support our growth, but were lower as compared to the previous fiscal year due to the completion of infrastructure investments associated with our facilities in State College, Pennsylvania.
Financing activities
The net cash used in financing activities during the year ended July 31, 2016 primarily reflected $13.7 million used to repurchase common stock, $5.0 million of dividends paid to stockholders and $2.7 million used for shares surrendered for taxes paid related to vested employee restricted stock. This was partially offset by proceeds from the issuance of common stock amounting to $4.7 million, associated with stock option exercises.
The net cash used in financing activities during the year ended July 31, 2015 primarily reflected $13.9 million used to repurchase common stock, $5.1 million of dividends paid to stockholders and $2.8 million used for shares surrendered for taxes paid related to vested employee restricted stock. This was partially offset by proceeds from the issuance of common stock amounting to $7.9 million associated with share-based compensation.
The net cash used in financing activities during the year ended July 31, 2014 primarily reflected $15.0 million used to repurchase common stock, $7.7 million used for shares surrendered for taxes paid related to vested employee restricted stock and $5.0 million of dividends paid to stockholders. This was partially offset by proceeds from the issuance of common stock amounting to $5.4 million associated with share-based compensation.
We believe that our balances of cash and cash equivalents and cash flows expected to be generated by future operating activities will be sufficient to meet our cash requirements for at least the next 12 months.
Commitments, Contractual Obligations and Off-Balance Sheet Arrangements
Our contractual obligations at July 31, 2016, and the effect such obligations are expected to have on liquidity and cash flows in future periods are as follows:
| (in millions) | Total | 2017 | 2018 | 2019 | 2020 | 2021 | Thereafter | |||||||||||||||||||||
| Operating leases |
$ | 6.5 | $ | 2.4 | $ | 1.8 | $ | 1.2 | $ | 0.9 | $ | 0.1 | $ | 0.1 | ||||||||||||||
| Purchase obligations |
23.9 | 23.9 | — | — | — | — | — | |||||||||||||||||||||
| Pension |
4.4 | 0.3 | 0.4 | 0.4 | 0.4 | 0.4 | 2.5 | |||||||||||||||||||||
| Contingent consideration |
12.2 | 4.5 | 3.0 | 2.4 | 2.3 | |||||||||||||||||||||||
| Total contractual obligations |
$ | 47.0 | $ | 31.1 | $ | 5.2 | $ | 4.0 | $ | 3.6 | $ | 0.5 | $ | 2.6 | ||||||||||||||
40
Table of Contents
Restructuring
During fiscal year 2016, fiscal year 2014 and fiscal year 2013, we announced restricting plans and incurred restructuring charges for improving our operational effectiveness to better leverage core competencies across the business. For a more detailed description of our restructuring efforts, including our plan to consolidate facilities, please refer to Note 4 to the Consolidated Financial Statements included in this report.
Financing arrangements
On November 23, 2015, we entered into a five-year revolving credit agreement, or Credit Agreement, with the financial institutions identified therein as lenders, which included JPMorgan Chase Bank, N.A., TD Bank, N.A., Wells Fargo Bank, N.A., HSBC Bank, N.A., and People’s United Bank, N.A. The Credit Agreement provides $100.0 million in available credit and expires on November 23, 2020, when all outstanding borrowings must be paid in full. The credit facility does not require amortization of principal and may be reduced before maturity in whole or in part at our option without penalty. Upon entry into the Credit Agreement, we terminated without penalty a $100.0 million five-year, revolving credit agreement entered into on October 11, 2011 and previously paid in full in accordance with its terms.
Borrowings under the Credit Agreement may be used for general corporate purposes, including permitted acquisitions. The amount of available credit can be increased under specified circumstances up to $200.0 million in aggregate. We are the sole borrower under the Credit Agreement. The obligations under the credit facility are required to be guaranteed by our material domestic subsidiaries as designated by us from time to time or as required under the Credit Agreement. There are no pledges of the capital stock or assets of our international subsidiaries.
Interest rates on borrowings outstanding under the credit facility range from 1.25% to 1.75% above the LIBOR rate, or, at our option range from 0.00% to 1.00% above a defined base rate, the amount in each case varying based upon our leverage ratio. A quarterly commitment fee ranging from 0.20% to 0.35% per annum is applicable on the undrawn portion of the credit facility, based upon our leverage ratio.
The Credit Agreement limits our and our subsidiaries’ ability to, among other things: incur additional indebtedness; incur liens or guarantee obligations; pay dividends or make other distributions; make investments; dispose of assets; and engage in transactions with affiliates except on an arms-length basis. In addition, the Credit Agreement requires us to maintain the following financial ratios:
| • | A leverage ratio, defined as consolidated funded indebtedness to consolidated trailing four quarters earnings before interest, taxes, depreciation and amortization, or EBITDA, with the adjustments as stipulated in the Credit Agreement, of no greater than 2.75:1.00 (with a temporary step-up in the event of certain acquisitions); and |
| • | An interest coverage ratio, defined as the ratio of consolidated trailing four quarters adjusted EBITDA to consolidated interest charges of no less than 3.00:1.00 at any time. |
As of July 31, 2016, our leverage ratio was 0.004:1.00 and our interest coverage ratio was not applicable as we had no attributable interest expense. As of July 31, 2016, we were in full compliance with all financial and operating covenants contained in the Credit Agreement.
Any failure to comply with the financial or operating covenants of the credit facility would prevent us from being able to borrow and would also constitute a default, permitting the lenders to, among other things, accelerate repayment of outstanding borrowings, including all accrued interest and fees, and to terminate the credit facility. A change in control, as defined in the Credit Agreement, would also constitute an event of default, permitting the lenders to accelerate repayment and terminate the Credit Agreement.
In connection with entering into the Credit Agreement, we incurred approximately $0.5 million of transaction costs, which are being amortized over the five-year life of the credit facility.
41
Table of Contents
As of July 31, 2016 and 2015, we had approximately $1.2 in other revolving credit facilities with banks available for direct borrowings.
We did not have any borrowing outstanding under any of our credit facilities at July 31, 2016 and 2015, respectively.
Contingent Consideration
In connection with the acquisition of Oncura, as of July 31, 2016, we recorded a contingent consideration obligation of $10.2 million. This obligation is payable upon the achievement of certain revenue and gross margin targets over a four year period starting on May 1, 2016. There is no limit on the earnout that can be paid out. In connection with the acquisition of PocketSonics, as of July 31, 2016, we recorded a contingent consideration obligation of $2.0 million. The contingent earn-out payments to the sellers of PocketSonics would be payable upon commercial launch and achievement of volume sales target as defined in the asset purchase agreement. Please refer to Note 3. Business Combinations for more information.
Tax related obligations
We have $6.2 million of unrecognized tax benefits for uncertain tax positions and $0.4 million of related accrued interest and penalties. We are unable to reasonably estimate the amount and period in which these liabilities might be paid. As such, the liability is excluded from the commitments and contingencies table. Note 15 to our Consolidated Financial Statements included in this Annual Report on Form 10-K provides additional information regarding matters relating to income taxes, including unrecognized tax benefits.
Asset retirement obligations
The ultimate cost of restoring our leased facilities is difficult to predict given uncertainties regarding the extent of the required restoration and the interpretation of applicable laws and regulations. Based upon our experience, current information and applicable laws, we believe that it is probable that we will incur costs, including asset retirement obligations, of approximately $1.1 million as of July 31, 2016, which is included in “Other liabilities” in our Consolidated Balance Sheet. All accruals have been recorded without giving effect to any possible future insurance proceeds.
Legal claims
We are subject to litigation, claims, investigations and audits arising from time to time in the ordinary course of our business. Although legal proceedings are inherently unpredictable, we believe that we have valid defenses with respect to those matters currently pending against us and intend to defend ourselves vigorously. The outcome of these matters, individually and in the aggregate, is not expected to have a material impact on our cash flows, results of operations, or financial position. We record losses when estimable and probable in accordance with U.S. GAAP.
Impact of Investigation Regarding our Danish Subsidiary
As initially disclosed in our Annual Report on Form 10-K for the fiscal year ended July 31, 2011, we identified certain transactions involving our Danish subsidiary BK Medical ApS, or BK Medical, and certain of its foreign distributors, with respect to which we raised questions concerning compliance with law, including Danish law and the U.S. Foreign Corrupt Practices Act, and our business policies. These have included transactions in which the distributors paid BK Medical amounts in excess of amounts owed and BK Medical transferred the excess amounts, at the direction of the distributors, to third parties identified by the distributors. We have terminated the employment of certain BK Medical employees and also terminated our relationships with the BK Medical distributors that were involved in the transactions. We have concluded that the identified
42
Table of Contents
transactions have been properly accounted for in our reported financial statements in all material respects. However, we were unable to ascertain with certainty the ultimate beneficiaries or the purpose of these transfers.
We voluntarily disclosed this matter to the Danish Government, the U.S. Department of Justice, or DOJ, and the SEC, and cooperated with inquiries by the Danish Government, the DOJ and the SEC to reach a resolution of this matter in the fiscal year ended July 31, 2016. On June 22, 2016, we issued a press release announcing that we had reached agreements with the SEC, the DOJ and the Danish Government to resolve the matters we had voluntarily disclosed. As a result of these resolutions, we paid a total of $14.9 million in disgorgement, interest and penalties. We do not expect any further inquiries related to this matter. In the second quarter of fiscal 2016, we accrued a charge of $13.3 million, of which $10.1 million was classified as general and administrative expense and $3.2 million was classified as other expense, net in our Consolidated Statements of Operations, in connection with these matters. This is in addition to a $1.6 million charge that we accrued in the fourth quarter of fiscal 2015, of which $1.0 million was classified as general and administrative expense and $0.6 million was classified as other expense, net in our Consolidated Statements of Operations. We incurred inquiry-related costs of approximately $0.4 million, $1.4 million, and $1.4 million in our fiscal years ended July 31, 2016, 2015, and 2014 respectively, in connection with this matter.
Recent Accounting Pronouncements
Recently adopted
Classification of deferred taxes
In November 2015, the Financial Accounting Standards Board, or FASB, issued Accounting Standards Update, or ASU, No. 2015-17, “Income Taxes (Topic 740): Balance Sheet Classification of Deferred Taxes.” The standard requires that deferred tax assets and liabilities be classified as noncurrent on the balance sheet rather than being separated into current and noncurrent. ASU 2015-17 is effective for fiscal years, and interim periods within those years, beginning after December 15, 2016. Early adoption is permitted and the standard may be applied either retrospectively or on a prospective basis to all deferred tax assets and liabilities. We elected early adoption of ASU 2015-17 during our second quarter of fiscal year 2016 on a retrospective basis. Accordingly, we reclassified the current deferred taxes to noncurrent on our July 31, 2015 Consolidated Balance Sheets, which decreased refundable and deferred income taxes by $8.0 million, increased noncurrent deferred tax assets by $4.6 million and decreased noncurrent deferred tax liabilities by $3.4 million.
Consolidation
In February 2015, the Financial Accounting Standards Board, or FASB, issued Accounting Standards Update, or ASU, No. 2015-02, “Consolidation (Topic 810): Amendments to the Consolidation Analysis.” ASU 2015-02 amended the process that a reporting entity must perform to determine whether it should consolidate certain types of legal entities. ASU 2015-02 is effective for annual and interim periods beginning after December 15, 2015. Early adoption is permitted. The update would be effective for us beginning on August 1, 2016. We elected early adoption of ASU 2015-02 during our first quarter of fiscal year ending July 31, 2016. The adoption of this update did not have a material impact on our consolidated financial statements.
Not yet effective
Improvements to employee share-based payment accounting
In March 2016, the Financial Accounting Standards Board, or FASB, issued Accounting Standards Update, or ASU, No. 2016-09, “Improvements to Employee Share-Based Payment Accounting,” which amends ASC 718, “Stock Based Compensation.” The amendments require that all excess tax benefits be recorded as an income tax benefit or expense in the income statement and be classified as an operating activity in the statement of cash flows. Entities may also elect to estimate the amount of forfeitures or recognize them as they occur. The amendments are effective for fiscal years, and interim periods within those years, beginning after December 15,
43
Table of Contents
2016. The standard will be effective for us in the first quarter of our fiscal year ending July 31, 2018 and early adoption is permitted. We are currently evaluating the impact of the adoption of this update on our consolidated financial statements.
Leases
In February 2016, the Financial Accounting Standards Board, or FASB, issued Accounting Standards Update, or ASU, No. 2016-02, “Leases (Topic 842)”. The standard requires lessees to recognize assets and liabilities for most leases on the balance sheet. For income statement purposes, the standard requires leases to be classified as either operating or finance. The standard is effective for annual and interim periods beginning after December 15, 2018. Early adoption is permitted. The standard will be effective for us in the first quarter of our fiscal year ending July 31, 2020. Adoption requires application of the new guidance for all periods presented. We are currently evaluating the impact of the adoption of this standard on our consolidated financial statements.
Cloud computing arrangements
In April 2015, the Financial Accounting Standards Board, or FASB, issued Accounting Standards Update, or ASU, No. 2015-05, “Intangibles - Goodwill and Other—Internal-Use Software (Subtopic 350-40).” The amendments provide guidance as to whether a cloud computing arrangement (e.g., software as a service, platform as a service, infrastructure as a service, and other similar hosting arrangements) includes a software license and, based on that determination, how to account for such arrangements. The amendments are effective for fiscal years, and interim periods within those years, beginning after December 15, 2015 and may be applied on either a prospective or retrospective basis. The provisions will be effective for us in the first quarter of our fiscal year ending July 31, 2017. Early adoption is not permitted. We do not expect the adoption of these provisions to have a material impact on our consolidated financial statements.
Disclosure of uncertainties about an entity’s ability to continue as a going concern
In August 2014, the Financial Accounting Standards Board, or FASB, issued Accounting Standards Update, or ASU, No. 2014-15, “Presentation of Financial Statements — Going Concern (Subtopic 205-40) Disclosure of Uncertainties about an Entity’s Ability to Continue as a Going Concern”. The standard requires management to evaluate an entity’s ability to continue as a going concern within one year of the date of issuance of the entity’s financial statements. The amendments are effective for the annual period ending after December 15, 2016, and for annual periods and interim periods thereafter and should be applied on a prospective basis. Early adoption is permitted. The provisions will be effective for us in the first quarter of our fiscal year ending July 31, 2017. We do not expect the adoption of these provisions to have a material impact on our consolidated financial statements.
Revenue from contracts with customers
In May 2014, the Financial Accounting Standards Board, or FASB issued an update which provides guidance for revenue recognition. This update affects any entity that either enters into contracts with customers to transfer goods or services or enters into contracts for the transfer of nonfinancial assets. This update will supersede existing revenue recognition requirements and most industry-specific guidance. This update also supersedes some cost guidance, including revenue recognition guidance for construction-type and production-type contracts. The update’s core principle is that a company will recognize revenue when it transfers promised goods or services to customers in an amount that reflects the consideration to which the company expects to be entitled in exchange for those goods or services. In doing so, companies will need to use more judgment and make more estimates than under today’s guidance. These may include identifying performance obligations in the contract, estimating the amount of variable consideration to include in the transaction price and allocating the transaction price to each separate performance obligation. This update should be applied either on a retrospective or modified retrospective basis. This update will be effective for us in the first quarter of our fiscal year ending July 31, 2018. In April 2015, the FASB issued a proposal to defer the effective date of the new revenue standard
44
Table of Contents
for public entities by one year. Therefore, this update would be effective for us in the first quarter of our fiscal year ending July 31, 2019. The proposal would also permit entities to early adopt, but only as of the original effective date (i.e. one year earlier). We are currently evaluating the impact of the adoption of this update on our consolidated financial statements.
Critical Accounting Policies
Management’s discussion and analysis of our financial condition and results of operations are based on our Consolidated Financial Statements, which have been prepared in accordance with accounting principles generally accepted in the United States of America. Our most critical accounting policies, and the estimates involved in their application, have a significant impact on the preparation of these Consolidated Financial Statements. These policies involve significant estimates and judgments that affect the reported amounts of assets, liabilities, revenues and expense, and related disclosures of contingent assets and liabilities. We continue to evaluate our estimates and judgments on an on-going basis. By their nature, the policies discussed below require management to make its most difficult and subjective estimates and judgments, often on matters that are inherently uncertain. Our estimates and judgments are based on our historical experience, terms of existing contracts, our observance of trends in the industry, information provided by our customers, and information available from other outside sources, as appropriate.
For a complete discussion of our significant accounting policies, refer to Note 1, Summary of business operations and significant accounting policies, to Consolidated Financial Statements, included in Item 15, Exhibits and Financial Statements Schedule, of this Annual Report on Form 10-K. We believe the following accounting policies require management to make the most difficult estimates and judgments in the preparation of our Consolidated Financial Statements and accordingly are critical to an understanding of our financial statements.
Revenue Recognition
We provide engineering services to some of our customers on a contractual basis and recognize revenue using the percentage of completion method. We estimate the progress towards completion on contracts with a fixed-fee arrangement on a monthly basis utilizing costs incurred to date as a percentage of total estimated costs at completion of the project or on a milestone basis based on contractual terms, as appropriate. When total cost estimates exceed revenues, we accrue for the estimated losses immediately.
Our revenue recognition accounting methodology for engineering services with a fixed fee arrangement involves uncertainties because it requires management to make estimates of our total estimated costs at completion of projects. The timing of when revenue, profits, and loss reserves are recognized may fluctuate if changes to the estimates of costs at completion of projects are needed.
Allocation of Consideration in Multiple Element Revenue Arrangements
We allocate arrangement consideration to each deliverable in an arrangement based on its relative selling price. We determine selling price using vendor specific objective evidence, or VSOE, if it exists, and otherwise third party evidence, or TPE. If neither VSOE nor TPE of selling price exists for a unit of accounting, we use our best estimated selling price, or BESP. We generally expect that we will not be able to establish TPE due to the nature of the markets in which we compete, and, as such, we typically will determine selling price using VSOE or if not available, BESP. If we are unable to establish selling price using VSOE or TPE, and the order was received or materially modified after July 31, 2009, we use BESP in the allocation of arrangement consideration. The objective of BESP is to determine the price at which we would transact if the product or service were sold by us on a standalone basis.
Our determination of BESP involves a weighting of several factors based on the specific facts and circumstances of the arrangement. Specifically, we will consider the cost to produce the deliverable, the anticipated margin on that deliverable, the selling price and profit margin for similar parts, our ongoing
45
Table of Contents
pricing strategy and policies (as evident in the price list as established and updated on a regular basis), the value of any enhancements that have been built into the deliverable and the characteristics of the varying markets in which the deliverable is sold.
Inventory
We value our inventory at the lower of the cost of the inventory or market in a manner that approximates the first-in first-out method. Management assesses the recoverability of inventory based on types and levels of inventory held, product life cycles, and changes in technology. A variety of methodologies are used to determine the amount of inventory write-downs necessary to adjust excess and obsolete inventory. Write-downs are based on the age of the inventory, lower of cost or market, along with significant management judgments concerning future demands for the inventory and technological obsolescence. If actual demand for our products is less than our estimates, or we experience a higher incidence of inventory obsolescence because of rapidly changing technology and customer requirements, additional write-downs for existing inventories might be recorded in future periods. Once recorded, inventory adjustments are not subsequently reversed until the inventory is used or disposed of.
Product is held by the sales force in the field both for sales and demonstration purposes. We classify and value such product based on the manner in which it is used by the sales force. Prior to fiscal 2016, demonstration inventory was amortized on a straight line basis over a four year period to approximate net realizable value. Beginning in fiscal 2016, based on our ability and intent to sell such inventory at a normal profit margin, the Company no longer amortized demonstration inventory during the first year it was placed in the field. The Company implemented this policy prospectively in fiscal 2016 based on changes in how the demonstration inventory is being utilized in the field. To the extent that demonstration inventory is unsold after a period of a year, it is reclassified to fixed assets and amortized over its estimated remaining useful life of 36 months. Amortization of demonstration inventory is recorded in sales and marketing expense.
Our inventory write-downs involve uncertainties because the calculation requires management to make assumptions and to apply judgment regarding inventory aging, forecasted customer demand, and technological obsolescence.
Share-based compensation
We have share-based compensation plans, which include stock options, restricted stock awards, and an employee stock purchase plan. We estimate the fair value of stock options using the Black-Scholes valuation model and the fair value of our restricted stock awards, which include shares of restricted stock and restricted stock units, based on the quoted market price of our common stock or the use of a Monte-Carlo Simulation Model.
We recognize the associated share-based compensation expense for time-based awards on a straight-line basis over the vesting periods of the awards, net of estimated forfeitures. Forfeiture rates are estimated based on historical pre-vesting forfeitures and are updated on the vesting dates to reflect actual forfeitures. The amount of share-based compensation expense for performance-based unvested restricted stock awards that is recognized on a straight-line basis over the performance period is based upon the number of shares that management ultimately expects to vest.
For performance-based awards with an earnings per share related target, management evaluates the probability of meeting the performance criteria at each balance sheet date and related compensation cost is amortized over the performance period on a straight-line basis because such awards vest only at the end of the measurement period. Changes to the probability assessment and the estimate of shares expected to vest will result in adjustments to the related share-based compensation expense that will be recorded in the period of the change. If the performance is not achieved, no compensation cost is recognized and any previously recognized compensation cost is reversed. For performance-based awards with a market condition related target, related compensation cost is amortized over the performance period on a straight-line basis, net of estimated forfeitures, regardless of whether the awards are ultimately earned.
46
Table of Contents
Option-pricing models and generally accepted valuation techniques to value restricted stock awards with market conditions require management to make assumptions and to apply judgment to determine the fair value of our awards. These assumptions and judgments include estimating the future volatility of our stock price, expected dividend yield, future employee turnover rates and future employee stock option exercise behaviors. Performance-based non-vested restricted stock awards require management to make assumptions regarding the likelihood of achieving future company financial targets or personal performance goals. Changes in these assumptions can materially affect the fair value estimate and the amount of compensation expense we recognize.
Warranty Reserves
We estimate the costs of product warranties based on specific warranty claims, historical data, and engineering estimates, where applicable. Our warranty reserve involves uncertainties because the calculation requires management to make assumptions based on specific warranty claims, historical data, and engineering estimates, where applicable.
Business Combinations
We account for acquired businesses using the acquisition method of accounting, which requires that assets acquired and liabilities assumed be recognized at their estimated fair values as of the acquisition date. Transaction costs related to the acquisition are expensed as incurred. Any excess of the consideration transferred over the fair values of the identifiable net assets acquired is recorded as goodwill. Any excess of the fair value of assets acquired over the purchase price is recorded as a bargain purchase gain in Other income (expense), net in the Consolidated Statements of Operations. This methodology involves uncertainties because it requires management to make assumptions and to apply judgment to estimate the fair value of acquired assets, including intangible assets, and liabilities. Management estimates the fair value of assets and liabilities based upon widely accepted valuation techniques, including discounted cash flows and market multiple analyses. Furthermore, the fair value of contingent consideration recorded as part of an acquisition is determined through a valuation model that incorporates probability adjusted assumptions related to achieving the related milestones and the likelihood of us making the contingent payments. Unanticipated events or circumstances may occur which could affect the accuracy of our fair value estimates, including assumptions regarding industry economic factors and business strategies.
Impairment of Goodwill and Indefinite-lived Intangible Assets
We evaluate goodwill and indefinite-lived intangible assets for impairment annually and whenever events or changes in circumstances indicate the carrying value of the goodwill or other intangible assets may not be recoverable. We conduct our impairment evaluation by performing valuation analyses, which consider both the market approach and income approach for goodwill and the relief from royalty approach for the indefinite-lived intangible assets. Under the market approach, the fair value of the reporting unit is based on trading and acquisition multiples. Under the income approach, the fair value of the reporting unit is based on the present value of estimated future cash flows. Under the relief from royalty approach, the fair value of the indefinite-lived intangible asset is based on after tax royalty rate and discount rate applied to future forecasted sales. In the second quarter of fiscal year 2016, we completed our annual impairment testing of goodwill and indefinite-lived intangible assets using the methodologies described herein, and determined there was no impairment.
The valuation analyses described above involve uncertainties because they require management to make assumptions and to apply judgment to estimate industry economic factors and the profitability of future business strategies. It is our policy to conduct impairment testing based on our current business strategy in light of present industry and economic conditions, as well as our future expectations.
47
Table of Contents
Income Tax Contingencies
We file income tax returns in all jurisdictions in which we operate. We record a liability for any position when we cannot establish conclusively that the benefits related to these positions are more likely than not to be realized. We change this position when more information is available, e.g., as a result of audits or other conclusive resolution of the issue with the relevant taxing authority. Our income tax returns, like those of most companies, are periodically audited by domestic and foreign tax authorities. These audits include questions regarding our tax filing positions, including the timing and amount of deductions and the allocation of income among various tax jurisdictions. At any one time, multiple tax years are subject to audit by the various tax authorities. In evaluating the exposures associated with our various tax filing positions, we record a liability for exposures subject to a minimum threshold of more likely than not before any benefit is recognized. A number of years may elapse before a particular matter, for which we have established a liability, is audited and fully resolved or clarified. We adjust our liability for unrecognized tax benefits and income tax provision in the period in which an uncertain tax position is effectively settled, the statute of limitations expires for the relevant taxing authority to examine the tax position or when more information becomes available.
Our liability for unrecognized tax benefits involves uncertainties because management is required to make assumptions and to apply judgment to estimate the exposures associated with our various filing positions.
Deferred Tax Valuation Allowances
We are required to estimate our income taxes in each of the jurisdictions within which we operate. This process involves assessing temporary differences resulting from different treatment of items for tax and accounting purposes. These differences result in deferred tax assets and liabilities, which are included within the balance sheet. We must then assess the likelihood that the deferred tax assets will be recovered from future taxable income and, to the extent it is more likely than not that some portion or all of the deferred tax assets will not be realized, a valuation allowance must be established.
Our effective income tax rate is affected by changes in tax law, the tax jurisdiction of new business ventures, the level of earnings and where they came from, and the results of tax audits. Our deferred tax valuation allowances involve uncertainties because the calculations require management to make assumptions based on historical data, future book income, and tax-planning strategies.
| Item 7A. | Quantitative and Qualitative Disclosures About Market Risk |
Certain of our foreign operations enter into transactions in currencies other than their functional currency, primarily the U.S. dollar and the Euro. We also have foreign currency exposure arising from the translation of our net equity investment in our foreign operations to U.S. dollars. We generally view our investments in foreign operations with functional currencies other than the U.S. dollar as long-term. The currencies to which we are exposed are the British pound, Canadian dollar, Chinese yuan, Danish kroner, Euro, and Japanese yen. A 10% depreciation in the July 31, 2016 functional currencies, relative to the U.S. dollar, would result in an increase in stockholders’ equity of approximately $0.1 million. A 10% depreciation in the July 31, 2015 functional currencies, relative to the U.S. dollar, would result in a reduction of stockholders’ equity of approximately $0.1 million.
We enter into forward contracts to hedge our foreign currency exposure in the Canadian dollar. These contracts have been designated as cash flow hedges, and the unrealized loss, net of tax, on these contracts is reported in within accumulated other comprehensive income (loss). Liability and asset derivatives designated as hedging instruments are presented in other assets and other liabilities, respectively, on our consolidated balance sheet. Realized (gains) losses on the cash flow hedges are recognized in income in the period when the payment of expenses is recognized. During fiscal years 2016 and 2015, we recorded approximately $0.7 million of and
48
Table of Contents
$0.5 million of realized losses included in cost of revenues and operating expenses in our Consolidated Statements of Operations. As of July 31, 2016, we have forward contracts outstanding with notional amounts totaling $23.9 million in Canadian dollars. As of July 31, 2015, we had forward contracts outstanding with notional amounts totaling $12.6 million in Canadian dollar.
We place our cash and cash equivalents in high quality financial instruments and, by policy, limit the amount of credit exposure to any one financial institution. Our cash includes cash equivalents, which we consider to be investments purchased with original maturities of three months or less. Total net interest income for fiscal years 2016 and 2015 was $0.2 million and $0.1 million, respectively. A 10% change in interest income or interest rate would not have a material impact on the fair value of our portfolio or on future earnings.
| Item 8. | Consolidated Financial Statements and Supplementary Data |
The financial statements and supplementary data are listed under Part IV, Item 15 in this Annual Report on Form 10-K and are included at the end of this Annual Report on Form 10-K.
| Item 9. | Changes in and Disagreements with Accountants on Accounting and Financial Disclosure |
None.
| Item 9A. | Controls and Procedures |
Disclosure Controls and Procedures
Our management, with the participation of our chief executive officer and chief financial officer, evaluated the effectiveness of our disclosure controls and procedures as of July 31, 2016. The term “disclosure controls and procedures”, as defined in Rules 13a-15(e) and 15d-15(e) under the Securities Exchange Act of 1934, as amended, or Exchange Act, means controls and other procedures of a company that are designed to ensure that information required to be disclosed by it in the reports that it files or submits under the Exchange Act is recorded, processed, summarized, and reported, within the time periods specified in the SEC’s rules and forms. Disclosure controls and procedures include, without limitation, controls and procedures designed to ensure that information required to be disclosed by a company in the reports that it files or submits under the Exchange Act is accumulated and communicated to its management, including its principal executive officer and principal financial officer, as appropriate, to allow timely decisions to be made regarding required disclosure. It should be noted that any system of controls and procedures, however well designed and operated, can provide only reasonable, and not absolute, assurance that the objectives of the system are met and that management necessarily applies its judgment in evaluating the cost-benefit relationship of possible controls and procedures. Based on the evaluation of our disclosure controls and procedures as of July 31, 2016, our chief executive officer and chief financial officer concluded that, as of such date, our disclosure controls and procedures were effective at the reasonable assurance level.
Management’s Annual Report on Internal Control over Financial Reporting
Our management is responsible for establishing and maintaining adequate internal control over financial reporting (as defined in Rules 13a-15(f) and 15d-15(f) under the Exchange Act). A company’s internal control over financial reporting is a process designed to provide reasonable assurance regarding the reliability of financial reporting and the preparation of financial statements for external purposes in accordance with generally accepted accounting principles. Internal control over financial reporting includes those policies and procedures that (i) pertain to the maintenance of records that, in reasonable detail, accurately and fairly reflect the transactions and dispositions of the assets of the Company; (ii) provide reasonable assurance that transactions are recorded as necessary to permit preparation of financial statements in accordance with generally accepted accounting principles, and that receipts and expenditures of the company are being made only in accordance with
49
Table of Contents
authorizations of management and directors of the company; and (iii) provide reasonable assurance regarding prevention or timely detection of unauthorized acquisition, use, or disposition of the company’s assets that could have a material effect on the interim or annual Consolidated Financial Statements. Because of its inherent limitations, internal control over financial reporting may not prevent or detect misstatements. Also, projections of any evaluation of effectiveness to future periods are subject to the risk that controls may become inadequate because of changes in conditions, or that the degree of compliance with the policies or procedures may deteriorate.
Our management, with the participation of our chief executive officer and chief financial officer, conducted an evaluation of the effectiveness of our internal control over financial reporting as of July 31, 2016, based on the framework in Internal Control—Integrated Framework issued by the Committee of Sponsoring Organizations of the Treadway Commission, or COSO, in 2013. The Company’s assessment did not include an assessment of the internal controls over financial reporting of Oncura Partners Diagnostics, LLC, or Oncura, acquired on January 8, 2016, which is included in our fiscal 2016 consolidated financial statements and which constituted $5.5 million of revenues for this period from acquisition to July 31, 2016. Based on this assessment, our management concluded that, as of July 31, 2016, our internal control over financial reporting was effective based on those criteria.
The effectiveness of our internal control over financial reporting as of July 31, 2016 has been audited by Ernst & Young LLP, an independent registered public accounting firm, as stated in their report which appears herein.
Changes in Internal Control Over Financial Reporting
We acquired Oncura on January 8, 2016. We are in the process of integrating the acquired operations into our overall internal control over financial reporting process and have extended our oversight and monitoring processes that support our internal control over financial reporting to include the acquired operations.
There were no changes to our internal control over financial reporting during the fourth quarter ended July 31, 2016 that have materially affected, or are reasonably likely to materially affect, our internal control over financial reporting.
| Item 9B. | Other Information |
None.
50
Table of Contents
| Item 10. | Directors, Executive Officers and Corporate Governance |
We will file with the SEC a definitive proxy statement for our 2017 Annual Meeting of Stockholders not later than 120 days after the close of fiscal year 2016, or Proxy Statement. Certain information required by this item is incorporated herein by reference to the Proxy Statement under the captions “Proposal 1 – Election of Directors”, “Corporate Governance” and “Section 16(a) Beneficial Ownership Reporting Compliance”. Also refer to “Executive Officers of the Registrant” in Part I of this Annual Report on Form 10-K.
We have a code of ethics that applies to all of our employees and directors. This code (available on our website) satisfies the requirements set forth in Item 406 of Regulation S-K and applies to all relevant persons set forth therein. We intend to disclose on our website at www.analogic.com amendments to, and, if applicable, waivers of, our code of ethics.
| Item 11. | Executive Compensation |
The information required by this item is incorporated herein by reference to the Proxy Statement under the captions “Executive Compensation”, “Director Compensation”, “Compensation Committee Interlocks and Insider Participation” and “Compensation Committee Report”.
| Item 12. | Security Ownership of Certain Beneficial Owners and Management and Related Stockholder Matters |
The information required by this item is incorporated herein by reference to the Proxy Statement under the captions “Security Ownership of Certain Beneficial Owners, Directors, and Management” and “Securities Authorized for Issuance Under Equity Compensation Plans”.
| Item 13. | Certain Relationships and Related Transactions, and Director Independence |
The information required by this item is incorporated herein by reference to the Proxy Statement under the captions “Corporate Governance” and “Certain Relationships and Related Transactions”.
| Item 14. | Principal Accountant Fees and Services |
The information required by this item is incorporated herein by reference to the Proxy Statement under the caption “Independent Registered Public Accounting Firm’s Fees”.
51
Table of Contents
| Item 15. | Exhibits and Financial Statement Schedules |
| Page Number |
||||||||||
| (a) |
||||||||||
| 1. | Consolidated Financial Statements | |||||||||
| Report of Independent Registered Public Accounting Firms | 54 | |||||||||
| Consolidated Balance Sheets at July 31, 2016 and 2015 | 57 | |||||||||
| Consolidated Statements of Operations for the years ended July 31, 2016, 2015 and 2014 | 58 | |||||||||
| Consolidated Statements of Comprehensive Income for the years ended July 31, 2016, 2015 and 2014 |
59 | |||||||||
| 60 | ||||||||||
| Consolidated Statements of Cash Flows for the years ended July 31, 2016, 2015 and 2014 | 61 | |||||||||
| Notes to Consolidated Financial Statements | 62 | |||||||||
| 2. | Financial Statement Schedule II – Valuation and Qualifying Accounts | 104 | ||||||||
| Other schedules have been omitted because they are not required, not applicable, or the required information is furnished in the Consolidated Statements or notes hereto | ||||||||||
(b) The Index to Exhibits immediately following our Financial Statements and Financial Statement Schedule II is incorporated herein by reference.
52
Table of Contents
Pursuant to the requirements of Section 13 or 15(d) of the Securities Exchange Act of 1934, the registrant has duly caused this report to be signed on its behalf by the undersigned, thereunto duly authorized.
| ANALOGIC CORPORATION | ||||||
| By | /S/ JAMES W. GREEN | |||||
| Date: September 27, 2016 | James W. Green President and Chief Executive Officer | |||||
Pursuant to the requirements of the Securities Exchange Act of 1934, this report has been signed below by the following persons on behalf of the registrant and in the capacities and on the dates indicated.
| Name |
Title |
Date | ||
| /S/ JAMES W. GREEN James W. Green |
President and Chief Executive Officer (Principal Executive Officer) and Director |
September 27, 2016 | ||
| /S/ MARK T. FROST Mark T. Frost |
Senior Vice President, Chief Financial Officer, and Treasurer (Principal Financial Officer) |
September 27, 2016 | ||
| /S/ BERNARD C. BAILEY Bernard C. Bailey |
Chairman of the Board |
September 27, 2016 | ||
| /S/ JEFFREY P. BLACK Jeffrey P. Black |
Director |
September 27, 2016 | ||
| /S/ JAMES J. JUDGE James J. Judge |
Director |
September 27, 2016 | ||
| /S/ MICHAEL T. MODIC Michael T. Modic |
Director |
September 27, 2016 | ||
| /S/ STEPHEN A. ODLAND Stephen A. Odland |
Director |
September 27, 2016 | ||
| /S/ FRED B. PARKS Fred B. Parks |
Director |
September 27, 2016 | ||
53
Table of Contents
Report of Independent Registered Public Accounting Firm
The Board of Directors and Shareholders of Analogic Corporation
We have audited the accompanying consolidated balance sheets of Analogic Corporation as of July 31, 2016 and 2015, and the related consolidated statements of operations, comprehensive income, changes in stockholders’ equity and cash flows for each of the two years in the period ended July 31, 2016. Our audit also included the financial statement schedules listed in the Index at Item 15(a). These financial statements and schedules are the responsibility of the Company’s management. Our responsibility is to express an opinion on these financial statements and schedules based on our audits.
We conducted our audits in accordance with the standards of the Public Company Accounting Oversight Board (United States). Those standards require that we plan and perform the audit to obtain reasonable assurance about whether the financial statements are free of material misstatement. An audit includes examining, on a test basis, evidence supporting the amounts and disclosures in the financial statements. An audit also includes assessing the accounting principles used and significant estimates made by management, as well as evaluating the overall financial statement presentation. We believe that our audits provide a reasonable basis for our opinion.
In our opinion, the financial statements referred to above present fairly, in all material respects, the consolidated financial position of Analogic Corporation at July 31, 2016 and 2015, and the consolidated results of its operations and its cash flows for each of the two years in the period ended July 31, 2016, in conformity with U.S. generally accepted accounting principles. Also, in our opinion, the related financial statement schedules, when considered in relation to the basic financial statements taken as a whole, present fairly in all material respects the information set forth therein.
We also have audited, in accordance with the standards of the Public Company Accounting Oversight Board (United States), Analogic Corporation’s internal control over financial reporting as of July 31, 2016, based on criteria established in Internal Control-Integrated Framework issued by the Committee of Sponsoring Organizations of the Treadway Commission (2013 framework) and our report dated September 27, 2016 expressed an unqualified opinion thereon.
/s/ Ernst & Young LLP
Boston, Massachusetts
September 27, 2016
54
Table of Contents
REPORT OF INDEPENDENT REGISTERED PUBLIC ACCOUNTING FIRM
The Board of Directors and Shareholders of Analogic Corporation
We have audited Analogic Corporation’s internal control over financial reporting as of July 31, 2016, based on criteria established in Internal Control—Integrated Framework issued by the Committee of Sponsoring Organizations of the Treadway Commission (2013 framework) (the COSO criteria). Analogic Corporation’s management is responsible for maintaining effective internal control over financial reporting, and for its assessment of the effectiveness of internal control over financial reporting included in the accompanying Management’s Report on Internal Control over Financial Reporting. Our responsibility is to express an opinion on Analogic Corporation’s internal control over financial reporting based on our audit.
We conducted our audit in accordance with the standards of the Public Company Accounting Oversight Board (United States). Those standards require that we plan and perform the audit to obtain reasonable assurance about whether effective internal control over financial reporting was maintained in all material respects. Our audit included obtaining an understanding of internal control over financial reporting, assessing the risk that a material weakness exists, testing and evaluating the design and operating effectiveness of internal control based on the assessed risk, and performing such other procedures as we considered necessary in the circumstances. We believe that our audit provides a reasonable basis for our opinion.
A company’s internal control over financial reporting is a process designed to provide reasonable assurance regarding the reliability of financial reporting and the preparation of financial statements for external purposes in accordance with generally accepted accounting principles. A company’s internal control over financial reporting includes those policies and procedures that (1) pertain to the maintenance of records that, in reasonable detail, accurately and fairly reflect the transactions and dispositions of the assets of the company; (2) provide reasonable assurance that transactions are recorded as necessary to permit preparation of financial statements in accordance with generally accepted accounting principles, and that receipts and expenditures of the company are being made only in accordance with authorizations of management and directors of the company; and (3) provide reasonable assurance regarding prevention or timely detection of unauthorized acquisition, use, or disposition of the company’s assets that could have a material effect on the financial statements.
Because of its inherent limitations, internal control over financial reporting may not prevent or detect misstatements. Also, projections of any evaluation of effectiveness to future periods are subject to the risk that controls may become inadequate because of changes in conditions, or that the degree of compliance with the policies or procedures may deteriorate.
As indicated in the accompanying Management’s Annual Report on Internal Control Over Financial Reporting, management’s assessment of and conclusion on the effectiveness of internal control over financial reporting did not include the internal controls of Oncura Partners Diagnostics, LLC, which is included in the 2016 consolidated financial statements of Analogic Corporation and constituted 4% and 1% of total and net assets, respectively, as of July 31, 2016 and 1% and 1% of revenues and net income, respectively, for the year then ended. Our audit of internal control over financial reporting of Analogic Corporation also did not include an evaluation of the internal control over financial reporting of Oncura Partners Diagnostics, LLC.
In our opinion, Analogic Corporation maintained, in all material respects, effective internal control over financial reporting as of July 31, 2016, based on the COSO criteria.
We also have audited, in accordance with the standards of the Public Company Accounting Oversight Board (United States), the consolidated balance sheets of Analogic Corporation as of July 31, 2016 and 2015, and the related consolidated statements of operations, comprehensive income, changes in stockholders’ equity and cash flows for each of the two years in the period ended July 31, 2016 of Analogic Corporation and our report dated September 27, 2016 expressed unqualified opinion thereon.
/s/ Ernst & Young LLP
Boston, Massachusetts
September 27, 2016
55
Table of Contents
REPORT OF INDEPENDENT REGISTERED PUBLIC ACCOUNTING FIRM
To the Board of Directors and Stockholders of Analogic Corporation
In our opinion, the accompanying consolidated statements of operations, of comprehensive income, of changes in stockholders’ equity and of cash flows for the year ended July 31, 2014 present fairly, in all material respects, the results of operations and cash flows of Analogic Corporation and its subsidiaries for the year ended July 31, 2014, in conformity with accounting principles generally accepted in the United States of America. In addition, in our opinion, the financial statement schedule for the year ended July 31, 2014 presents fairly, in all material respects, the information set forth therein when read in conjunction with the related consolidated financial statements. These financial statements and financial statement schedule are the responsibility of the Company’s management. Our responsibility is to express an opinion on these financial statements and financial statement schedule based on our audit. We conducted our audit of these statements in accordance with the standards of the Public Company Accounting Oversight Board (United States). Those standards require that we plan and perform the audit to obtain reasonable assurance about whether the financial statements are free of material misstatement. An audit includes examining, on a test basis, evidence supporting the amounts and disclosures in the financial statements, assessing the accounting principles used and significant estimates made by management, and evaluating the overall financial statement presentation. We believe that our audit provides a reasonable basis for our opinion.
/s/ PricewaterhouseCoopers LLP
Boston, Massachusetts
September 26, 2014
56
Table of Contents
CONSOLIDATED BALANCE SHEETS
(In thousands, except share and per share data)
| July 31, 2016 |
July 31, 2015 |
|||||||
| Assets | ||||||||
| Current assets: |
||||||||
| Cash and cash equivalents |
$ | 118,697 | $ | 123,800 | ||||
| Accounts receivable, net of allowance for doubtful accounts of $1,070 and $1,220 as of July 31, 2016 and July 31, 2015, respectively |
112,412 | 119,301 | ||||||
| Inventory |
145,513 | 132,712 | ||||||
| Income tax receivable |
3,004 | 12,634 | ||||||
| Prepaid expenses and other current assets |
9,178 | 8,131 | ||||||
| Total current assets |
388,804 | 396,578 | ||||||
| Property, plant, and equipment, net |
107,790 | 106,299 | ||||||
| Intangible assets, net |
45,194 | 49,499 | ||||||
| Goodwill |
73,915 | 57,450 | ||||||
| Deferred income taxes |
10,671 | 9,904 | ||||||
| Other assets |
6,523 | 4,849 | ||||||
| Total assets |
$ | 632,897 | $ | 624,579 | ||||
| Liabilities and Stockholders’ Equity | ||||||||
| Current liabilities: |
||||||||
| Accounts payable |
$ | 28,575 | $ | 30,493 | ||||
| Accrued employee compensation and benefits |
18,108 | 22,830 | ||||||
| Accrued income tax |
1,610 | 4,100 | ||||||
| Accrued warranty |
6,296 | 6,571 | ||||||
| Accrued restructuring charges |
5,248 | 580 | ||||||
| Deferred revenue |
5,359 | 5,200 | ||||||
| Customer deposits |
3,476 | 3,991 | ||||||
| Contingent consideration |
4,534 | — | ||||||
| Other current liabilities |
5,261 | 6,029 | ||||||
| Total current liabilities |
78,467 | 79,794 | ||||||
| Long-term liabilities: |
||||||||
| Accrued income taxes, net of current portion |
2,174 | 2,531 | ||||||
| Contingent consideration, net of current portion |
7,705 | 2,000 | ||||||
| Other long-term liabilities |
13,374 | 8,844 | ||||||
| Total long-term liabilities |
23,253 | 13,375 | ||||||
| Guarantees, commitments and contingencies (Notes 11 and 12) |
||||||||
| Stockholders’ equity: |
||||||||
| Common stock, $0.05 par value; 30,000,000 shares authorized and 12,396,765 shares issued and outstanding as of July 31, 2016; 30,000,000 shares authorized and 12,434,017 shares issued and outstanding as of July 31, 2015 |
619 | 621 | ||||||
| Capital in excess of par value |
149,005 | 140,538 | ||||||
| Retained earnings |
390,013 | 394,757 | ||||||
| Accumulated other comprehensive loss |
(8,460 | ) | (4,506 | ) | ||||
| Total stockholders’ equity |
531,177 | 531,410 | ||||||
| Total liabilities and stockholders’ equity |
$ | 632,897 | $ | 624,579 | ||||
The accompanying notes are an integral part of these consolidated financial statements.
57
Table of Contents
CONSOLIDATED STATEMENTS OF OPERATIONS
(In thousands, except per share data)
| For the Year ended July 31, | ||||||||||||
| 2016 | 2015 | 2014 | ||||||||||
| Net revenue: |
||||||||||||
| Product |
$ | 502,752 | $ | 531,161 | $ | 509,527 | ||||||
| Engineering |
6,096 | 9,130 | 8,021 | |||||||||
| Total net revenue |
508,848 | 540,291 | 517,548 | |||||||||
| Cost of sales: |
||||||||||||
| Product |
275,632 | 302,974 | 290,951 | |||||||||
| Engineering |
5,151 | 7,830 | 6,894 | |||||||||
| Total cost of sales |
280,783 | 310,804 | 297,845 | |||||||||
| Gross profit |
228,065 | 229,487 | 219,703 | |||||||||
| Operating expenses: |
||||||||||||
| Research and product development |
67,119 | 68,462 | 73,828 | |||||||||
| Selling and marketing |
65,266 | 63,489 | 59,157 | |||||||||
| General and administrative |
60,826 | 57,291 | 54,147 | |||||||||
| Restructuring |
9,641 | (354 | ) | 3,483 | ||||||||
| Total operating expenses |
202,852 | 188,888 | 190,615 | |||||||||
| Income from operations |
25,213 | 40,599 | 29,088 | |||||||||
| Other income (expense): |
||||||||||||
| Interest income, net |
208 | 73 | 253 | |||||||||
| (Loss) on sale of other investments |
— | — | (484 | ) | ||||||||
| Other (expense) income, net |
(5,105 | ) | 361 | 181 | ||||||||
| Total other (expense) income, net |
(4,897 | ) | 434 | (50 | ) | |||||||
| Income before income taxes |
20,316 | 41,033 | 29,038 | |||||||||
| Provision for (benefit from) income taxes |
8,189 | 7,552 | (5,442 | ) | ||||||||
| Net income |
$ | 12,127 | $ | 33,481 | $ | 34,480 | ||||||
| Net income per common share: |
||||||||||||
| Basic |
$ | 0.98 | $ | 2.70 | $ | 2.78 | ||||||
| Diluted |
$ | 0.96 | $ | 2.66 | $ | 2.72 | ||||||
| Weighted average shares outstanding: |
||||||||||||
| Basic |
12,402 | 12,407 | 12,404 | |||||||||
| Diluted |
12,615 | 12,606 | 12,667 | |||||||||
| Dividends declared and paid per share |
$ | 0.40 | $ | 0.40 | $ | 0.40 | ||||||
The accompanying notes are an integral part of these consolidated financial statements.
58
Table of Contents
CONSOLIDATED STATEMENTS OF COMPREHENSIVE INCOME
(In thousands)
| For the Year ended July 31, | ||||||||||||
| 2016 | 2015 | 2014 | ||||||||||
| Net income |
$ | 12,127 | $ | 33,481 | $ | 34,480 | ||||||
| Other comprehensive income (loss), net of tax: |
||||||||||||
| Foreign currency translation adjustment, net of tax |
(2,293 | ) | (12,564 | ) | (114 | ) | ||||||
| Unrecognized (loss) gain on pension benefits, net of tax |
(1,848 | ) | 630 | (1,332 | ) | |||||||
| Unrealized gain (loss) on foreign currency forward contracts, net of tax |
187 | (377 | ) | 103 | ||||||||
| Total other comprehensive loss, net of tax |
(3,954 | ) | (12,311 | ) | (1,343 | ) | ||||||
| Total comprehensive income |
$ | 8,173 | $ | 21,170 | $ | 33,137 | ||||||
The accompanying notes are an integral part of these consolidated financial statements.
59
Table of Contents
CONSOLIDATED STATEMENTS OF CHANGES IN STOCKHOLDERS’ EQUITY
Years Ended July 31, 2016, 2015, and 2014
(In thousands, except share data)
| Common Stock | Capital in
Excess of Par Value |
Retained Earnings |
Accumulated Other Comprehensive Income |
Total Stockholders’ Equity |
||||||||||||||||||||
| Shares | Amount | |||||||||||||||||||||||
| Balance, July 31, 2013 |
12,235,416 | $ | 612 | $ | 114,381 | $ | 362,255 | $ | 9,148 | $ | 486,396 | |||||||||||||
| Shares issued for: |
||||||||||||||||||||||||
| Stock options exercised |
81,538 | 4 | 4,881 | — | — | 4,885 | ||||||||||||||||||
| Stock grants and vesting of restricted stock units, net of shares retained for taxes |
233,799 | 12 | (7,634 | ) | — | — | (7,622 | ) | ||||||||||||||||
| Stock purchase plan |
7,283 | — | 491 | — | — | 491 | ||||||||||||||||||
| Share-based compensation expense |
— | — | 11,457 | — | — | 11,457 | ||||||||||||||||||
| Tax benefit from share-based compensation |
— | — | 3,824 | — | — | 3,824 | ||||||||||||||||||
| Repurchase of common stock |
(185,044 | ) | (9 | ) | (1,721 | ) | (13,229 | ) | — | (14,959 | ) | |||||||||||||
| Dividends declared ($0.40 per share) |
— | — | — | (5,029 | ) | — | (5,029 | ) | ||||||||||||||||
| Net income for the year |
— | — | — | 34,480 | — | 34,480 | ||||||||||||||||||
| Other comprehensive income, net of tax |
— | — | — | — | (1,343 | ) | (1,343 | ) | ||||||||||||||||
| Balance, July 31, 2014 |
12,372,992 | 619 | 125,679 | 378,477 | 7,805 | 512,580 | ||||||||||||||||||
| Shares issued for: |
||||||||||||||||||||||||
| Stock options exercised |
135,444 | 7 | 7,267 | — | — | 7,274 | ||||||||||||||||||
| Stock grants and vesting of restricted stock units, net of shares retained for taxes |
92,743 | 5 | (2,835 | ) | — | — | (2,830 | ) | ||||||||||||||||
| Stock purchase plan |
9,449 | (1 | ) | 618 | — | — | 617 | |||||||||||||||||
| Share-based compensation expense |
— | — | 10,836 | — | — | 10,836 | ||||||||||||||||||
| Tax benefit from share-based compensation |
— | — | 764 | — | — | 764 | ||||||||||||||||||
| Repurchase of common stock |
(176,611 | ) | (9 | ) | (1,791 | ) | (12,072 | ) | — | (13,872 | ) | |||||||||||||
| Dividends declared ($0.40 per share) |
— | — | — | (5,129 | ) | — | (5,129 | ) | ||||||||||||||||
| Net income for the year |
— | — | — | 33,481 | — | 33,481 | ||||||||||||||||||
| Other comprehensive income, net of tax |
— | — | — | — | (12,311 | ) | (12,311 | ) | ||||||||||||||||
| Balance, July 31, 2015 |
12,434,017 | 621 | 140,538 | 394,757 | (4,506 | ) | 531,410 | |||||||||||||||||
| Shares issued for: |
||||||||||||||||||||||||
| Stock options exercised |
61,384 | 3 | 4,171 | — | — | 4,174 | ||||||||||||||||||
| Stock grants and vesting of restricted stock units, net of shares retained for taxes |
65,087 | 3 | (2,727 | ) | — | — | (2,724 | ) | ||||||||||||||||
| Stock purchase plan |
8,176 | 1 | 549 | — | — | 550 | ||||||||||||||||||
| Share-based compensation expense |
— | — | 8,739 | — | — | 8,739 | ||||||||||||||||||
| Tax deficiency from share-based compensation |
— | — | (324 | ) | — | — | (324 | ) | ||||||||||||||||
| Repurchase of common stock |
(171,899 | ) | (9 | ) | (1,941 | ) | (11,748 | ) | — | (13,698 | ) | |||||||||||||
| Dividends declared ($0.40 per share) |
— | — | — | (5,123 | ) | — | (5,123 | ) | ||||||||||||||||
| Net income for the year |
— | — | — | 12,127 | — | 12,127 | ||||||||||||||||||
| Other comprehensive income, net of tax |
— | — | — | — | (3,954 | ) | (3,954 | ) | ||||||||||||||||
| Balance, July 31, 2016 |
12,396,765 | $ | 619 | $ | 149,005 | $ | 390,013 | $ | (8,460 | ) | $ | 531,177 | ||||||||||||
The accompanying notes are an integral part of these consolidated financial statements.
60
Table of Contents
CONSOLIDATED STATEMENTS OF CASH FLOWS
(In thousands)
| For the Year ended July 31, | ||||||||||||
| 2016 | 2015 | 2014 | ||||||||||
| CASH FLOWS FROM OPERATING ACTIVITIES: |
||||||||||||
| Net income |
$ | 12,127 | $ | 33,481 | $ | 34,480 | ||||||
| Adjustments to reconcile net income to net cash provided by operating activities: |
||||||||||||
| (Benefit from) provision for deferred income taxes |
(457 | ) | 4,404 | (5,412 | ) | |||||||
| Depreciation and amortization |
22,952 | 23,307 | 22,057 | |||||||||
| Share-based compensation expense |
8,864 | 10,938 | 11,512 | |||||||||
| Write down of demo equipment to net realizable value |
2,914 | 2,646 | 2,357 | |||||||||
| Provision for excess and obsolescence inventory |
1,354 | 2,391 | 1,561 | |||||||||
| Excess tax benefit from share-based compensation |
(395 | ) | (1,134 | ) | (3,982 | ) | ||||||
| Change in fair value of contingent consideration |
141 | (62 | ) | 125 | ||||||||
| Provision for doubtful accounts, net of recovery |
(151 | ) | 420 | 203 | ||||||||
| Loss on sale of other investments |
— | — | 484 | |||||||||
| Loss (gain) on sale of property, plant and equipment |
110 | (115 | ) | 17 | ||||||||
| Net changes in operating assets and liabilities, exclusive of acquisition-related assets and liabilities: |
||||||||||||
| Accounts receivable |
6,073 | (16,050 | ) | 6,633 | ||||||||
| Inventory |
(21,624 | ) | (14,714 | ) | (12,347 | ) | ||||||
| Prepaid expenses and other assets |
(2,275 | ) | (387 | ) | 2,525 | |||||||
| Accounts payable |
(2,233 | ) | (7,281 | ) | 3,222 | |||||||
| Accrued liabilities |
(1,367 | ) | 4,755 | (9,100 | ) | |||||||
| Deferred revenue |
(126 | ) | (5,433 | ) | 1,533 | |||||||
| Customer deposits |
(516 | ) | 965 | (213 | ) | |||||||
| Accrued income taxes and income taxes receivable |
6,832 | (1,895 | ) | (8,769 | ) | |||||||
| Other liabilities |
764 | 2,474 | 1,045 | |||||||||
| NET CASH PROVIDED BY OPERATING ACTIVITIES |
32,987 | 38,710 | 47,931 | |||||||||
| CASH FLOWS FROM INVESTING ACTIVITIES: |
||||||||||||
| Additions to property, plant, and equipment |
(13,121 | ) | (9,954 | ) | (17,517 | ) | ||||||
| Acquisition of businesses, net of cash acquired |
(8,424 | ) | (1,600 | ) | (10,561 | ) | ||||||
| Purchases of marketable securities in Rabbi Trust under the Non-qualified Deferred Compensation Plan |
— | — | (715 | ) | ||||||||
| Proceeds from the sale of property, plant, and equipment |
106 | 559 | 260 | |||||||||
| NET CASH USED IN INVESTING ACTIVITIES |
(21,439 | ) | (10,995 | ) | (28,533 | ) | ||||||
| CASH FLOWS FROM FINANCING ACTIVITIES: |
||||||||||||
| Issuance of stock pursuant to exercise of stock options, employee stock purchase plan, restricted stock plans, and non-employee director stock plan |
4,724 | 7,893 | 5,379 | |||||||||
| Repurchase of common stock |
(13,698 | ) | (13,872 | ) | (14,959 | ) | ||||||
| Shares repurchased for taxes for vested employee restricted stock grants |
(2,724 | ) | (2,832 | ) | (7,680 | ) | ||||||
| Excess tax benefit from share-based compensation |
395 | 1,134 | 3,982 | |||||||||
| Dividends paid to shareholders |
(4,964 | ) | (5,111 | ) | (4,962 | ) | ||||||
| Cash paid for financing cost |
(500 | ) | — | — | ||||||||
| NET CASH USED IN FINANCING ACTIVITIES |
(16,767 | ) | (12,788 | ) | (18,240 | ) | ||||||
| EFFECT OF EXCHANGE RATE CHANGES ON CASH |
116 | (5,667 | ) | 349 | ||||||||
| NET DECREASE INCREASE IN CASH AND CASH EQUIVALENTS |
(5,103 | ) | 9,260 | 1,507 | ||||||||
| CASH AND CASH EQUIVALENTS, BEGINNING OF PERIOD |
123,800 | 114,540 | 113,033 | |||||||||
| CASH AND CASH EQUIVALENTS, END OF PERIOD |
$ | 118,697 | $ | 123,800 | $ | 114,540 | ||||||
| Supplemental disclosures of cash flow information: |
||||||||||||
| Income taxes paid, net of refunds |
$ | (1,494 | ) | $ | 4,996 | $ | 8,024 | |||||
| Fixed asset additions in accounts payable and accrued liabilities |
$ | 790 | $ | 596 | $ | 705 | ||||||
The accompanying notes are an integral part of these consolidated financial statements.
61
Table of Contents
NOTES TO CONSOLIDATED FINANCIAL STATEMENTS
(in millions, except share and per share data)
1. Summary of business operations and significant accounting policies
Throughout this Annual Report on Form 10-K, unless the context states otherwise, the words “we,” “us,” “our” and “Analogic” refer to Analogic Corporation and all of its subsidiaries taken as a whole, and “our board of directors” refers to the board of directors of Analogic Corporation.
Description of Business
Analogic Corporation (NASDAQ:ALOG) designs, manufactures, and commercializes innovative real-time guidance, diagnostic imaging and threat detection technologies to advance the practice of medicine and save lives. We operate and report along three business segments: Medical Imaging, Ultrasound, and Security and Detection. Our Ultrasound segment provides ultrasound guidance systems for the urology and surgery markets and is expanding into point of care areas such as anesthesia and emergency medicine. We sell our ultrasound products through our direct sales force in North America and Europe, as well as through a network of distributors to clinical practitioners throughout the world. Our Medical Imaging segment provides critical enabling medical imaging systems and subsystems for computed tomography, or CT, magnetic resonance imaging, or MRI and high-resolution digital mammography systems. We sell our Medical Imaging products primarily through longstanding relationships with well-known multinational medical OEMs and new entrants in emerging markets. Our Security and Detection segment designs and manufactures automated threat detection systems for aviation baggage inspection applications utilizing advanced CT technology. We sell our security products primarily through multinational OEM partners.
We were incorporated in the Commonwealth of Massachusetts in November 1967 and our headquarters is based in Peabody, Massachusetts.
On September 20, 2013, we acquired PocketSonics, Inc. (PocketSonics). On October 28, 2014, we acquired certain assets and assumed certain liabilities related to the surgical planning and guidance business of Pathfinder. On January 8, 2016, we wholly acquired Oncura Partners Diagnostics, LLC, a privately held provider of remote, real-time ultrasound imaging and teleconsulting services currently focused on the veterinary medicines market. These acquisitions are more fully discussed in Note 3. The financial position, results of operations and cash flows of PocketSonics, Pathfinder and Oncura are included in our Consolidated Financial Statements from the date of acquisition.
Significant accounting policies
(a) Consolidation
Our consolidated financial statements include the accounts of us and our subsidiaries, all of which are wholly owned. All intercompany accounts and transactions have been eliminated in consolidation.
In determining whether we are the primary beneficiary of an entity and therefore required to consolidate, we apply a qualitative approach that determines whether we have both (1) the power to direct the economically significant activities of the entity and (2) the obligation to absorb losses of, or the right to receive benefits from, the entity that could potentially be significant to that entity. We have not been required to consolidate the activity of any entity due to these considerations.
(b) Cash and cash equivalents
We consider all highly liquid investments with an original maturity of three months or less at acquisition date to be cash equivalents.
62
Table of Contents
ANALOGIC CORPORATION
NOTES TO CONSOLIDATED FINANCIAL STATEMENTS – (Continued)
(in millions, except share and per share data)
(c) Revenue recognition and accounts receivable
We recognize revenue related to product sales upon shipment provided that title and risk of loss have passed to the customer, there is persuasive evidence of an arrangement, the sales price is fixed or determinable, collection of the related receivable is reasonably assured and customer acceptance criteria, if any, have been successfully demonstrated.
For persuasive evidence of an arrangement, the Company uses contracts or customer purchase orders to determine the existence of an arrangement.
For delivery, the Company’s sales contracts generally provide for the customer to accept title and risk of loss when the product leaves our facilities. When shipping terms or local laws do not allow for passage of title and risk of loss at the shipping point, we defer recognizing revenue until title and risk of loss transfer to the customer. For product sales with acceptance criteria that are not successfully demonstrated upon shipment, revenue is recognized upon customer acceptance, provided all other revenue recognition criteria have been met.
The Company assesses whether the sales price is fixed or determinable at the time of the transaction. Sales prices are documented in the executed sales contract or purchase orders received prior to shipment. The Company’s standard terms do not allow for trial or evaluation periods, rights of return or refund, payments contingent upon the customer obtaining financing or other terms that could impact the customer’s obligation.
The Company assesses whether collection is reasonably assured based on a number of factors, including the customer’s past transaction history and credit worthiness. We grant credit to domestic and foreign original equipment manufacturers, distributors, and end users, and perform ongoing credit evaluations of our customers’ financial condition. We continuously monitor collections and payments from our customers and maintain a provision for estimated credit losses based upon specific customer collection issues that have been identified.
We classify shipping and handling invoiced to customers as revenue and the related costs in cost of sales. Sales and other taxes collected from customers and subsequently remitted to government authorities are recorded as accounts receivable with a corresponding offset recorded to sales taxes payable. These balances are removed from the consolidated balance sheet when the cash is remitted to the tax authority. We include service revenue, related primarily to extended warranty contracts and repairs, in the product revenue line item of our Consolidated Statement of Operations, as it is deemed immaterial for separate classification.
On a limited basis, the Company enters into transactions which involve multiple elements (i.e., products and services such as installation or training). Typically, all products sold to a customer are delivered at the same time. If a partial delivery occurs as authorized by the customer, the Company allocates revenue to the various products based on their vendor-specific objective evidence of fair value, or VSOE, if VSOE exists according to ASC 605-25 as the basis of determining the relative selling price of each element. If VSOE does not exist, the Company may use third party evidence of fair value, or TPE, to determine the relative selling price of each element. If neither VSOE nor TPE exists, the Company may use management’s best estimate of the sales price, or BESP, of each element to determine the relative selling price. The relative selling prices for installations, trainings, and extended warranties are based on established price lists and separate, stand-alone sales of these elements. The Company establishes best estimates within a range of selling prices considering multiple factors including, but not limited to, factors such as size of transaction, pricing strategies and market conditions. The Company believes the use of the BESP allows revenue recognition in a manner consistent with the underlying economics of the transaction. Additionally, from time to time there may be undelivered elements in a multiple element arrangement, such elements generally being training or extended warranty. The Company defers revenue on undelivered elements of an arrangement and recognizes it once all revenue recognition criteria have been met.
63
Table of Contents
ANALOGIC CORPORATION
NOTES TO CONSOLIDATED FINANCIAL STATEMENTS – (Continued)
(in millions, except share and per share data)
Maintenance or service revenues are recognized ratably over the term of the contract.
We provide engineering services to some of our customers on a contractual basis and recognize revenue using the percentage of completion method or the completed contract method. We estimate the progress towards completion on contracts with a fixed-fee arrangement on a monthly basis utilizing costs incurred to date as a percentage of total estimated costs at completion of the project or on a milestone basis based on contractual terms, as appropriate. Short-term unbilled receivables are included in accounts receivable in the Consolidated Balance Sheets. Total unbilled receivables at July 31, 2016 and 2015 were $4.0 million and $5.2 million, respectively. There were no long-term unbilled receivables at either July 31, 2016 or 2015. When total cost estimates exceed revenues, we accrue for the estimated losses immediately.
Deferred revenue is primarily comprised of maintenance and other service revenues for which payment has been received and for which services have not yet been performed. In situations where collection of the receivable is not reasonably assured, the inventory is expensed upon shipment and the revenue is recognized as the cash is received. Total deferred revenue at July 31, 2016 and 2015 was $7.2 million and $6.1 million, respectively. At July 31, 2016 and 2015, the long-term portion of deferred revenue of $1.8 million and $0.9 million, respectively, was included in other long-term liabilities.
(d) Use of estimates
The preparation of our consolidated financial statements in conformity with accounting principles generally accepted in the United States of America requires us to make estimates and assumptions that may affect the reported amounts of assets, liabilities, equity, revenue and expenses, and related disclosures of contingent assets and liabilities. On an on-going basis, we evaluate our estimates and judgments and methodologies. We base our estimates on historical experience and on various other assumptions that are believed to be reasonable, the results of which forms the basis for making judgments about the carrying value of assets and liabilities. Actual results may differ from those estimates under different assumptions or conditions. Significant estimates for which changes in the near term are considered reasonably possible and that may have a material impact on the financial statements are disclosed in these Notes to the Consolidated Financial Statements.
(e) Inventories
We value our inventory at the lower of the cost of the inventory or market in a manner that approximates the first-in first-out method. Management assesses the recoverability of inventory based on types and levels of inventory held, product life cycles, and changes in technology. A variety of methodologies are used to determine the amount of inventory write-downs necessary to adjust excess and obsolete inventory. Write-downs are based on the age of the inventory, lower of cost or market, along with significant management judgments concerning future demands for the inventory and technological obsolescence. If actual demand for our products is less than our estimates, or we experience a higher incidence of inventory obsolescence because of rapidly changing technology and customer requirements, additional write-downs for existing inventories might be recorded in future periods. Once recorded, inventory adjustments are not subsequently reversed until the inventory is used or disposed of.
Product is held by the sales force in the field both for sales and demonstration purposes. We classify and value such product based on the manner in which it is used by the sales force. Prior to fiscal 2016, demonstration inventory was amortized on a straight line basis over a four year period to approximate its net realizable value. Beginning in fiscal 2016, based on our ability and intent to sell such inventory at a normal profit margin, the
64
Table of Contents
ANALOGIC CORPORATION
NOTES TO CONSOLIDATED FINANCIAL STATEMENTS – (Continued)
(in millions, except share and per share data)
Company no longer amortized demonstration inventory during the first year it was placed in the field. The Company implemented this policy prospectively in fiscal 2016 based on changes in how the demonstration inventory is being utilized in the field. To the extent that demonstration inventory is unsold after a period of a year, it is reclassified to fixed assets and amortized over its estimated remaining useful life of 36 months. Amortization of demonstration inventory is recorded in sales and marketing expense.
Our inventory write-downs involve uncertainties because the calculation requires management to make assumptions and to apply judgment regarding inventory aging, forecasted customer demand, and technological obsolescence.
(f) Income taxes
We account for income taxes under the asset and liability method, which requires recognition of deferred tax assets, subject to valuation allowances, and liabilities for the expected future tax consequences of events that have been included in the financial statements or tax returns. Deferred income taxes reflect the net tax effects of temporary differences between the carrying amounts of asset and liabilities for financial reporting and income tax purposes. A valuation allowance is established if it is more likely than not that all or a portion of the net deferred tax assets will not be realized. We do not provide for U.S. Federal income taxes on undistributed earnings of all consolidated foreign subsidiaries as such earnings are considered to be indefinitely reinvested in those operations. For disclosure purposes, calculations of the potential deferred income tax liability on these undistributed earnings is not practicable because such liability, if any, is dependent on circumstances existing if and when remittance occurs.
(g) Concentration of credit risk
Financial instruments that potentially subject us to concentrations of credit risk consist principally of cash and cash equivalents, derivative instruments and accounts receivable. Cash and cash equivalents not required for working capital purposes are placed primarily in short-term bank deposits, money market funds, or demand notes of financial institutions or banks that meet stringent credit rating requirements or are collateralized by securities issued by the U.S. government or government agencies. We grant credit to domestic and foreign original equipment manufacturers, distributors, and end users, and perform ongoing credit evaluations on our customers’ financial condition. We do not require collateral or other security to be furnished by the counterparties to our derivative instruments.
(h) Property, plant, and equipment
Property, plant, and equipment is recorded at cost and depreciated using the straight-line method over their estimated useful lives. Leasehold improvements are amortized over the shorter of their estimated useful lives or the term of the respective leases. Upon retirement or disposal, the cost of the asset disposed of and the related accumulated depreciation are removed from the accounts and any gain or loss is reflected in our Consolidated Statement of Operations. Expenditures for maintenance and repairs are charged to expense when incurred while the costs of significant improvements, which extend the life of the underlying asset, are capitalized.
65
Table of Contents
ANALOGIC CORPORATION
NOTES TO CONSOLIDATED FINANCIAL STATEMENTS – (Continued)
(in millions, except share and per share data)
Property, plant, and equipment consisted of the following:
| Estimated Useful
Lives (Years) |
July 31, | |||||||||||
| 2016 | 2015 | |||||||||||
| (in millions) |
||||||||||||
| Property, plant, and equipment: |
||||||||||||
| Land and improvements |
15 years for land improvements | 7.0 | 6.9 | |||||||||
| Building and improvements |
10 to 35 | 85.0 | 83.0 | |||||||||
| Leasehold improvements |
lesser of useful life or the lease term | 10.1 | 10.0 | |||||||||
| Equipment and software |
3 to 7 | 142.7 | 133.7 | |||||||||
| Furniture and fixtures |
5 | 7.6 | 7.1 | |||||||||
| Demonstration Inventory |
3 | 3.9 | — | |||||||||
| $ | 256.3 | $ | 240.7 | |||||||||
|
|
|
|
|
|||||||||
| Less accumulated depreciation and amortization |
(148.5 | ) | (134.4 | ) | ||||||||
| Total property, plant and equipment |
$ | 107.8 | $ | 106.3 | ||||||||
Land is not depreciated. Total depreciation and amortization of property, plant, and equipment was $15.0 million, $14.1 million, and $14.3 million for fiscal years 2016, 2015, and 2014, respectively. We did not capitalize any interest in fiscal years 2016, 2015 or 2014.
(i) Intangible assets and goodwill
Intangible assets consist of intellectual property, licenses, and certain identifiable intangible assets resulting from business combinations, including trade names, customer relationships, backlog, and developed technology. Intangible assets that have finite lives are amortized using either the straight-line method, or if reliably determinable, based on the pattern in which the economic benefit of the asset is expected to be utilized. Finite-lived intangible assets are reviewed for impairment whenever events or changes in circumstances indicate that the carrying value of assets may not be recoverable. Recoverability of these assets is measured by comparison of their carrying value to the future undiscounted cash flows the assets are expected to generate over their remaining economic life. If such assets are considered to be impaired, the impairment to be recognized in earnings equals the amount by which the carrying value of the assets exceeds their fair value determined by either a quoted market price, if any, or a value determined by utilizing a discounted cash flow technique. Evaluation of impairment of long-lived assets requires estimates of future operating results that are used in the preparation of the expected future undiscounted cash flows. Actual future operating results and the remaining economic lives of long-lived assets could differ from the estimates used in assessing the recoverability of these assets. These differences could result in impairment charges, which could have a material adverse impact on our results of operations.
An indefinite-lived intangible asset, such as an in-process research and development, or IPR&D, or trade names acquired in business combinations, is tested for impairment annually or more frequently if indicators of impairment are present. We perform our annual review in our second quarter of each fiscal year. An indefinite-lived intangible asset may be considered impaired if we determine that the carrying value exceeds the assets’ fair value. We may first perform a qualitative assessment to determine whether it is necessary to perform the quantitative impairment test or bypass the qualitative assessment and proceed directly to performing the quantitative impairment test. The quantitative impairment test is based on discounted estimated future cash flows. Assessing the impairment of an indefinite-lived intangible asset requires us to make assumptions and judgments regarding the fair value of the asset using the relief from royalty valuation technique, which include management’s estimates of future growth rates and discount rates.
66
Table of Contents
ANALOGIC CORPORATION
NOTES TO CONSOLIDATED FINANCIAL STATEMENTS – (Continued)
(in millions, except share and per share data)
Goodwill is not amortized but is reviewed for impairment annually or more frequently whenever events or changes in circumstances indicate that the carrying value of the reporting unit may exceed its fair value. A reporting unit, for the purpose of the impairment test, is at or below the operating segment level, and constitutes a business for which discrete financial information is available and regularly reviewed by segment management. We perform our annual reviews in our second quarter of each fiscal year. We may first assess qualitative factors to determine whether it is more likely than not that the fair value of a reporting unit is less than its carrying value and as a basis for determining whether it is necessary to perform the two-step goodwill impairment test. We may also elect to proceed directly to the two-step impairment test. If an initial qualitative assessment indicates that it is more likely than not that the carrying value of a reporting unit exceeds its estimated fair value, an additional quantitative evaluation is performed under the two-step impairment test. If based on the quantitative evaluation the fair value of the reporting unit is less than its carrying amount, we perform an analysis of the fair value of all assets and liabilities of the reporting unit. If the implied fair value of the reporting unit’s goodwill is determined to be less that its carrying amount, impairment is recognized for the difference.
Assessing the impairment of goodwill requires us to make assumptions and judgments regarding the fair value of our reporting units. We estimate the fair value of our reporting units using a combination of valuation techniques, including discounted cash flows and cash earnings multiples, and compare the values to our estimated overall market capitalization.
(j) Fair value of financial instruments
Our financial instruments consist primarily of cash and cash equivalents, accounts receivable, accounts payable and accrued liabilities, and derivative instruments. The carrying amounts of our financial instruments approximate fair value due to their short-term nature. The fair values of marketable securities and investments in pension and deferred compensation plans, if any, are estimated based on quoted market price for these securities. We did not have any marketable securities at July 31, 2016 and 2015.
(k) Asset retirement obligations
We establish asset retirement obligations (“AROs”) for the present value of estimated future costs to return certain of our facilities to their original condition. The recorded liabilities are accreted to the future value of the estimated restoration costs. The accretion of the liability and the depreciation of the capitalized cost are recognized over the estimated useful lives of the facilities.
(l) Impairment of long-lived assets
We evaluate our long-lived assets whenever events or changes in business circumstances indicate that the carrying amount of the assets may not be fully recoverable or that the useful lives of these assets are no longer appropriate. If indicators of impairment are present with respect to long-lived assets and undiscounted cash flows attributable to such assets are not expected to be sufficient to recover the assets’ carrying amount, additional analysis is performed as appropriate and the carrying value of the long-lived assets is written down to its estimated fair value based on a discounted cash flow analysis or the market value.
(m) Warranty costs
We provide for the estimated cost of standard product warranties at the time products are shipped. Although we engage in extensive product-quality programs and processes, our warranty obligations are affected by product failure rates and service delivery costs incurred to correct product failures. Should actual product failure rates or service delivery costs differ from our estimates (which are based on specific warranty claims, historical data, and
67
Table of Contents
ANALOGIC CORPORATION
NOTES TO CONSOLIDATED FINANCIAL STATEMENTS – (Continued)
(in millions, except share and per share data)
engineering estimates, where applicable), revisions to the estimated warranty liability would be required. Such revisions could adversely affect our operating results. Generally, we warrant that our products will perform in all material respects in accordance with our standard published specifications in effect at the time of delivery of the products to our customer for a period ranging from 12 to 60 months from the date of delivery.
(n) Research and development and capitalized software development costs
Research and development costs are expensed as incurred and include primarily engineering salaries, incentive compensation, including share-based compensation, overhead and materials used in connection with research and product development activities. Research and development costs related to non-recurring engineering projects funded by customers are included within engineering cost of sales if the project is accounted for under the percentage of completion method or under the completed contract method.
Software development costs incurred subsequent to establishing technological feasibility are capitalized. Technological feasibility is demonstrated by the completion of a detailed program design. Capitalized costs are amortized at the higher of (a) straight-line basis over the economic life of the software ranging from 3 to 5 years or (b) the ratio of the product’s current gross revenues to the total of current and expected gross revenues. Unamortized capitalized software costs are $0.5 million and $0.7 million as of July 31, 2016 and 2015, respectively. Amortization expense of capitalized software development costs was $0.2 million, $0.2 million, and $0.0 million in fiscal years 2016, 2015, and 2014, respectively, and is included in product cost of sales.
(o) Derivative instruments and hedging activities
We recognize all derivative instruments as either assets or liabilities at fair value in our consolidated balance sheets. Changes in the fair value of derivatives are recorded each period in current earnings or accumulated other comprehensive income (loss), depending on whether a derivative is designated as part of a hedge transaction. We classify the cash flows from these instruments in the same category as the cash flows from the hedged items. We do not enter into derivative transactions for trading or speculative purposes.
We assess, both at inception and on an ongoing basis, whether the derivatives that are used in hedging transactions are highly effective in offsetting the changes in cash flows or fair values of the hedged items. We also assess hedge ineffectiveness on a quarterly basis and record the gain or loss related to the ineffective portion to current earnings. If we determine that a forecasted transaction is no longer probable of occurring, we discontinue hedge accounting for the affected portion of the hedge instrument, and any related unrealized gain or loss on the contract is recognized in current earnings.
(p) Translation of foreign currencies
The assets and liabilities of our foreign subsidiaries, whose cash flows are primarily in their local currency, have been translated into U.S. dollars using the current exchange rates at each balance sheet date. The operating results of these foreign subsidiaries have been translated at average exchange rates that prevailed during each reporting period. Adjustments resulting from translation of foreign currency financial statements are reflected as a component of accumulated other comprehensive income in the consolidated balance sheet. We had foreign currency translation adjustments of $(2.3) million, $(12.6) million, and $(0.1) million, respectively, included within the Consolidated Statement of Comprehensive Income in fiscal years 2016, 2015 and 2014, respectively.
Exchange gains and losses resulting from foreign currency transactions (transactions denominated in a currency other than that of the entity’s functional currency), excluding intercompany transactions considered to be of a long-term investment nature, are included in the results of operations in the period in which they occur
68
Table of Contents
ANALOGIC CORPORATION
NOTES TO CONSOLIDATED FINANCIAL STATEMENTS – (Continued)
(in millions, except share and per share data)
and are reflected under the caption “Other, net”. We had foreign exchange gains (losses) included within the Consolidated Statement of Operations totaling $(2.7) million, $(0.4) million, and $(0.2) million in fiscal years 2016, 2015 and 2014, respectively.
(q) Advertising
Advertising costs are expensed when incurred, are included in selling and marketing expenses and totaled $0.3 million, $0.4 million and $0.2 million in fiscal years 2016, 2015 and 2014, respectively.
(r) Share-based compensation
We recognize share-based compensation expense for equity instruments exchanged for employee and director services. Share-based compensation cost is measured at the grant date, based on the fair value of the award, and is recognized as an expense over the employee’s requisite service period (generally the vesting period of the equity grant), net of estimated forfeitures.
We estimate the fair value of stock options using the Black-Scholes valuation model and the fair value of our restricted stock awards, which include shares of restricted stock and restricted stock units, based on the quoted market price of our common stock or the use of a Monte-Carlo simulation model. For time or service-based awards, we recognize the associated share-based compensation expense on a straight-line basis over the vesting periods of the awards, net of estimated forfeitures. Forfeiture rates are estimated based on historical pre-vesting forfeitures and are updated on the vesting dates to reflect actual forfeitures.
For performance-based awards with an earnings per share related target, we evaluate the probability of meeting the performance criteria at each balance sheet date and if probable, related compensation cost is amortized over the performance period on a straight-line basis because such awards vest only at the end of the measurement period. Changes to the probability assessment and the estimate of shares expected to vest will result in adjustments to the related share-based compensation expense that will be recorded in the period of the change. If the earnings per share related target performance is not achieved, no compensation cost is recognized and any previously recognized compensation cost is reversed. For market-based awards, the compensation cost is amortized over the performance period on a straight-line basis because the awards vest only at the end of the measurement period. The probability of actual shares expected to be earned is considered in the grant date valuation, therefore the expense is not adjusted to reflect the actual units earned.
(s) Business combinations
In accordance with the acquisition method of accounting, the fair values of assets acquired and liabilities assumed are determined and recorded as of the date of the acquisition. Transaction costs related to the acquisition are expensed as incurred. Any excess of the purchase price over the estimated fair value of the net assets acquired is recorded as goodwill. Any excess of the fair value of assets acquired over the purchase price is recorded as a bargain purchase gain in Other income (expense), net in the Consolidated Statements of Operations. This methodology involves uncertainties because it requires management to make assumptions and to apply judgment to estimate the fair value of acquired assets, including intangible assets, and liabilities. Management estimates the fair value of assets and liabilities based upon widely accepted valuation techniques, including discounted cash flows and market multiple analyses. Furthermore, the fair value of contingent consideration recorded as part of an acquisition is determined through a valuation model that incorporates probability adjusted assumptions related to achieving the related milestones and the likelihood of us making the contingent payments. Unanticipated events or circumstances may occur which could affect the accuracy of our fair value estimates, including assumptions regarding industry economic factors and business strategies.
69
Table of Contents
ANALOGIC CORPORATION
NOTES TO CONSOLIDATED FINANCIAL STATEMENTS – (Continued)
(in millions, except share and per share data)
(t) Net income per share
Basic net income per share is computed using the weighted average number of common shares outstanding during the period. Diluted net income per share is computed using the weighted average number of common and dilutive common equivalent shares outstanding during the period. Dilutive common equivalent shares consist of stock options and restricted stock units.
(u) Segment information
We identify a business as an operating segment if: i) it engages in business activities from which it may earn revenues and incur expenses; ii) its operating results are regularly reviewed by our chief operating decision maker who is our chief executive officer, and iii) it has available discrete financial information. We aggregate our operating segments into a reportable segment if the operating segments are determined to have similar economic characteristics and are similar in the nature of products and services, nature of production processes, type or class of customer for their products and services, product or service distribution method and, if applicable, nature of the regulatory environment. We have three reportable segments: Medical Imaging, Ultrasound, and Security and Detection.
(v) Recent accounting pronouncements
Recently adopted
Classification of deferred taxes
In November 2015, the Financial Accounting Standards Board, or FASB, issued Accounting Standards Update, or ASU, No. 2015-17, “Income Taxes (Topic 740): Balance Sheet Classification of Deferred Taxes.” The standard requires that deferred tax assets and liabilities be classified as noncurrent on the balance sheet rather than being separated into current and noncurrent. ASU 2015-17 is effective for fiscal years, and interim periods within those years, beginning after December 15, 2016. Early adoption is permitted and the standard may be applied either retrospectively or on a prospective basis to all deferred tax assets and liabilities. We elected early adoption of ASU 2015-17 during our second quarter of fiscal year 2016 on a retrospective basis. Accordingly, we reclassified the current deferred taxes to noncurrent on our July 31, 2015 Consolidated Balance Sheets, which decreased refundable and deferred income taxes by $8.0 million, increased noncurrent deferred tax assets by $4.6 million and decreased noncurrent deferred tax liabilities by $3.4 million.
Consolidation
In February 2015, the Financial Accounting Standards Board, or FASB, issued Accounting Standards Update, or ASU, No. 2015-02, “Consolidation (Topic 810): Amendments to the Consolidation Analysis.” ASU 2015-02 amended the process that a reporting entity must perform to determine whether it should consolidate certain types of legal entities. ASU 2015-02 is effective for annual and interim periods beginning after December 15, 2015. Early adoption is permitted. The update would be effective for us beginning on August 1, 2016. We elected early adoption of ASU 2015-02 during our first quarter of fiscal year ending July 31, 2016. The adoption of this update did not have a material impact on our consolidated financial statements.
Not yet effective
Improvements to employee share-based payment accounting
In March 2016, the Financial Accounting Standards Board, or FASB, issued Accounting Standards Update, or ASU, No. 2016-09, “Improvements to Employee Share-Based Payment Accounting,” which amends ASC 718, “Stock Based Compensation.” The amendments require that all excess tax benefits be recorded as an income tax
70
Table of Contents
ANALOGIC CORPORATION
NOTES TO CONSOLIDATED FINANCIAL STATEMENTS – (Continued)
(in millions, except share and per share data)
benefit or expense in the income statement and be classified as an operating activity in the statement of cash flows. Entities may also elect to estimate the amount of forfeitures or recognize them as they occur. The amendments are effective for fiscal years, and interim periods within those years, beginning after December 15, 2016. The standard will be effective for us in the first quarter of our fiscal year ending July 31, 2018 and early adoption is permitted. We are currently evaluating the impact of the adoption of this update on our consolidated financial statements.
Leases
In February 2016, the Financial Accounting Standards Board, or FASB, issued Accounting Standards Update, or ASU, No. 2016-02, “Leases (Topic 842)”. The standard requires lessees to recognize assets and liabilities for most leases on the balance sheet. For income statement purposes, the standard requires leases to be classified as either operating or finance. The standard is effective for annual and interim periods beginning after December 15, 2018. Early adoption is permitted. The standard will be effective for us in the first quarter of our fiscal year ending July 31, 2020. Adoption requires application of the new guidance for all periods presented. We are currently evaluating the impact of the adoption of this standard on our consolidated financial statements.
Cloud computing arrangements
In April 2015, the Financial Accounting Standards Board, or FASB, issued Accounting Standards Update, or ASU, No. 2015-05, “Intangibles - Goodwill and Other–Internal-Use Software (Subtopic 350-40).” The amendments provide guidance as to whether a cloud computing arrangement (e.g., software as a service, platform as a service, infrastructure as a service, and other similar hosting arrangements) includes a software license and, based on that determination, how to account for such arrangements. The amendments are effective for fiscal years, and interim periods within those years, beginning after December 15, 2015 and may be applied on either a prospective or retrospective basis. The provisions will be effective for us in the first quarter of our fiscal year ending July 31, 2017. Early adoption is not permitted. We do not expect the adoption of these provisions to have a material impact on our consolidated financial statements.
Disclosure of uncertainties about an entity’s ability to continue as a going concern
In August 2014, the FASB issued ASU No. 2014-15, “Presentation of Financial Statements — Going Concern (Subtopic 205-40) Disclosure of Uncertainties about an Entity’s Ability to Continue as a Going Concern”. The standard requires management to evaluate an entity’s ability to continue as a going concern within one year of the date of issuance of the entity’s financial statements. The amendments are effective for the annual period ending after December 15, 2016, and for annual periods and interim periods thereafter and should be applied on a prospective basis. Early adoption is permitted. The provisions will be effective for us in the first quarter of our fiscal year ending July 31, 2017. We do not expect the adoption of these provisions to have a material impact on our consolidated financial statements.
Revenue from contracts with customers
In May 2014, the FASB issued an update which provides guidance for revenue recognition. This update affects any entity that either enters into contracts with customers to transfer goods or services or enters into contracts for the transfer of nonfinancial assets. This update will supersede existing revenue recognition requirements and most industry-specific guidance. This update also supersedes some cost guidance, including revenue recognition guidance for construction-type and production-type contracts. The update’s core principle is that a company will recognize revenue when it transfers promised goods or services to customers in an amount that reflects the consideration to which the company expects to be entitled in exchange for those goods or services. In doing so, companies will need to use more judgment and make more estimates than under today’s
71
Table of Contents
ANALOGIC CORPORATION
NOTES TO CONSOLIDATED FINANCIAL STATEMENTS – (Continued)
(in millions, except share and per share data)
guidance. These may include identifying performance obligations in the contract, estimating the amount of variable consideration to include in the transaction price and allocating the transaction price to each separate performance obligation. This update should be applied either on a retrospective or modified retrospective basis. This update will be effective for us in the first quarter of our fiscal year ending July 31, 2018. Early adoption is not permitted. In April 2015, the FASB issued a proposal to defer the effective date of the new revenue standard for public entities by one year. Therefore, this update would be effective for us in the first quarter of our fiscal year ending July 31, 2019. The proposal would also permit entities to early adopt, but only as of the original effective date (i.e. one year earlier). We are currently evaluating the impact of the adoption of this update on our consolidated financial statements.
(w) Reclassifications and revisions to prior period financial statements
Certain financial statement items have been reclassified to conform to the current period presentation. We reclassified current deferred taxes to noncurrent due to the effect of adopting ASU 2015-17 and we separately presented current and noncurrent contingent consideration liabilities on our July 31, 2015 Consolidated Balance Sheet to conform to the current period presentation. There was no impact on our Consolidated Statements of Operations as a result of these reclassifications.
2. Share-based compensation expense
On January 29, 2010, our stockholders approved the “2009 Stock Incentive Plan”, or 2009 Plan, which provided for the issuance of up to 1,600,000 shares of common stock. Stockholders approved amendments to the 2009 Plan on January 23, 2012 and January 21, 2014 which increased the number of shares available for issuance under the 2009 Plan to 2,200,000 and 4,453,518, respectively. As of July 31, 2016 the remaining number of shares available for issuance under the 2009 Plan is 2,828,781.
The 2009 Plan includes a number of different types of awards. Non-GAAP EPS performance-based (non-GAAP EPS) awards are performance based restricted stock unit (RSU) awards issued to executive officers and other high level management employees of Analogic. Non-GAAP EPS awards align compensation with the performance of our non-GAAP earnings per share. Total shareholder return performance-based (TSR) awards are performance based RSU awards issued to executive officers and other high level management employees of Analogic. TSR awards align compensation with the performance of Analogic’s stock as compared to the stock performance of its peer group. Time based RSU awards are stock awards issued to Analogic employees and Board Members. Time based RSU’s are not aligned with performance measures and generally vest over a 3 year period of time. Stock options have been granted to executive officers and employees of Analogic to give them the right to purchase stock at a set price when vested.
72
Table of Contents
ANALOGIC CORPORATION
NOTES TO CONSOLIDATED FINANCIAL STATEMENTS – (Continued)
(in millions, except share and per share data)
Share-based compensation cost is measured at the grant date, based on the fair value of the award, and is recognized as an expense over the employee’s requisite service period, net of forfeitures. The following table sets forth the stock option and RSU transactions for fiscal year 2016:
| (Amounts in thousands, except share and per share data) |
Stock Options Outstanding | Time-Based Unvested Restricted RSUs |
Performance-Based Unvested Contingent Restricted RSUs |
|||||||||||||||||||||||||||||
| Number of Shares |
Weighted Average Exercise Price |
Weighted Average Remaining Contractual Term (years) |
Aggregate Intrinsic Value |
Number of Shares/ Units |
Weighted Average Grant Date Fair Value |
Number of Shares/ Units (1) |
Weighted Average Grant Date Fair Value |
|||||||||||||||||||||||||
| Outstanding at July 31, 2015 |
286,298 | $ | 68.93 | 5.01 | $ | 3,332 | 128,062 | $ | 74.06 | 158,947 | $ | 85.98 | ||||||||||||||||||||
| Granted |
— | — | 100,341 | 82.63 | 57,265 | 98.81 | ||||||||||||||||||||||||||
| Exercised |
(61,384 | ) | 68.00 | — | — | — | — | |||||||||||||||||||||||||
| Vesting of restricted stock |
— | — | (80,393 | ) | 75.97 | (18,984 | ) | 95.89 | ||||||||||||||||||||||||
| Cancelled (forfeited and expired) |
(7,009 | ) | 73.11 | (14,450 | ) | 77.43 | (30,114 | ) | 80.00 | |||||||||||||||||||||||
|
|
|
|
|
|
|
|||||||||||||||||||||||||||
| Outstanding at July 31, 2016 |
217,905 | $ | 69.06 | 4.15 | $ | 3,265 | 133,560 | $ | 78.98 | 167,114 | $ | 90.33 | ||||||||||||||||||||
| Options vested or expected to vest at July 31, 2016 (2) |
215,696 | 69.03 | 4.15 | $ | 3,237 | |||||||||||||||||||||||||||
| Options exercisable at July 31, 2016 |
148,022 | $ | 67.03 | 3.87 | $ | 2,517 | ||||||||||||||||||||||||||
| (1) | The performance-based unvested RSU’s are shown in this table at target, except for the number of shares vested, which reflect the shares earned. As of July 31, 2016, the maximum number of performance-based unvested RSU’s available to be earned is 334,228. |
| (2) | In addition to the vested options, we expect a portion of the unvested options to vest at some point in the future. Stock options expected to vest are calculated by applying an estimated forfeiture rate to the unvested options. |
The following table presents share-based compensation expense included in our Consolidated Statements of Operations:
| For the Year ended July 31, | ||||||||||||
| (in millions) | 2016 | 2015 | 2014 | |||||||||
| Cost of product sales |
$ | 0.5 | $ | 0.7 | $ | 0.7 | ||||||
| Cost of engineering sales |
0.1 | 0.2 | 0.4 | |||||||||
| Research and product development |
2.3 | 2.7 | 2.8 | |||||||||
| Selling and marketing |
1.6 | 1.4 | 1.2 | |||||||||
| General and administrative |
4.3 | 5.9 | 6.4 | |||||||||
| Total share-based compensation expense before tax |
8.8 | 10.9 | 11.5 | |||||||||
| Income tax effect |
(3.0 | ) | (3.2 | ) | (3.5 | ) | ||||||
| Share-based compensation expense included in net income |
$ | 5.8 | $ | 7.7 | $ | 8.0 | ||||||
As of July 31, 2016, the unrecognized compensation cost, net of estimated forfeitures, related to unvested stock options, time based RSU’s and performance based RSU’s was $9.1 million. This cost will be recognized over an estimated weighted average amortization period of 1.0 years and assumes target performance for the non-GAAP EPS RSU’s.
73
Table of Contents
ANALOGIC CORPORATION
NOTES TO CONSOLIDATED FINANCIAL STATEMENTS – (Continued)
(in millions, except share and per share data)
Stock options
We estimate the fair value of stock options using the Black-Scholes valuation model. Key input assumptions used to estimate the grant date fair values of stock options include the exercise price of the award, the expected option term, the expected volatility of our stock over the option’s expected term, the risk-free interest rate over the option’s expected term, and our expected annual dividend yield. Estimates of fair value are not intended to predict actual future events or the value ultimately realized by persons who receive equity awards. No stock options were granted for FY 2016. The fair values of option grants were estimated on the grant date using the following assumptions for fiscal years 2015 and 2014:
| For the Year ended July 31, | ||||||||
| 2015 | 2014 | |||||||
| Expected option term in years (1) |
5.31 | 5.37 | ||||||
| Expected volatility (2) |
29.3 | % | 38.6 | % | ||||
| Risk-free interest rate (3) |
1.82 | % | 1.77 | % | ||||
| Expected annual dividend yield (4) |
0.56 | % | 0.52 | % | ||||
| Weighted average grant date fair value |
$ | 19.95 | $ | 27.55 | ||||
| (1) | The expected option term was estimated using historical data. |
| (2) | The expected volatility for each grant is determined based on the review of the average of historical daily price changes of our common stock over the expected option term. |
| (3) | The risk-free interest rate is determined based on the yield of zero-coupon U.S. Treasury securities for a period that is commensurate with the expected term assumption. |
| (4) | The expected annual dividend yield is calculated by dividing the expected annual dividends by the stock price on the date of grant. |
The total intrinsic value stock options exercised during fiscal years 2016, 2015, and 2014, was $0.9 million, $4.3 million, and $1.9 million, respectively, with intrinsic value defined as the difference between the market price on the date of exercise and the grant date exercise price. The total amount of cash received from the exercise of these stock options was $4.2 million, $7.3 million, and $4.9 million, respectively.
The actual tax benefit realized for the tax deductions from option exercises was less than $0.1 million for fiscal years 2016, 2015 and 2014.
Restricted stock and restricted stock units
We estimate the fair value of RSU’s that vest based on service conditions using the quoted closing price of our common stock on the date of grant. Share-based compensation expense is amortized over each award’s vesting period on a straight-line basis for all awards with service and performance conditions that vest at the end of the performance cycle, while the accelerated method applies to other awards with both service and performance conditions.
For our non-GAAP EPS, awards, the compensation cost is amortized over the performance period on a straight-line basis, net of forfeitures, because such awards vest only at the end of the performance period. The compensation cost is based on the number of shares that are deemed probable of vesting at the end of the three-year performance cycle. This probability assessment is done each quarter and changes in estimates can result in significant expense fluctuations due to the cumulative catch-up adjustment. We estimate the fair value of the non-GAAP EPS awards using the quoted closing price of our common stock on the date of grant.
74
Table of Contents
ANALOGIC CORPORATION
NOTES TO CONSOLIDATED FINANCIAL STATEMENTS – (Continued)
(in millions, except share and per share data)
For our TSR, awards, the compensation cost is amortized over the performance period on a straight-line basis net of forfeitures, because the awards vest only at the end of the measurement period and the probability of actual shares expected to be earned is considered in the grant date valuation. As a result, the expense is not adjusted to reflect the actual shares earned. We estimate the fair value of the TSR awards using the Monte-Carlo simulation model.
We granted 24,821, 28,455, and 27,450 TSR awards and 32,444, 36,641, and 35,686 non-GAAP EPS awards during fiscal years 2016, 2015, and 2014, respectively. The fair value of our TSR awards at the date of grant was estimated using the Monte-Carlo simulation model with the following assumptions:
| For the Year ended July 31, | ||||||||||||
| 2016 | 2015 | 2014 | ||||||||||
| Stock price (1) |
$ | 84.06 | $ | 71.33 | $ | 77.14 | ||||||
| Expected volatility (2) |
26.4 | % | 29.3 | % | 27.6 | % | ||||||
| Risk-free interest rate (3) |
1.04 | % | 1.00 | % | 0.82 | % | ||||||
| Expected annual dividend yield (4) |
0.00 | % | 0.00 | % | 0.00 | % | ||||||
| Weighted average grant date fair value of time-based restricted stock awards |
$ | 82.63 | $ | 73.23 | $ | 82.46 | ||||||
| Weighted average grant date fair value of performance based restricted stock awards |
$ | 98.81 | $ | 78.62 | $ | 93.85 | ||||||
| (1) | The stock price is the closing price of our common stock on the date of grant. |
| (2) | The expected volatility for each grant is determined based on the historical volatility for the peer group companies and our common stock over a period equal to the remaining term of the performance period from the date of grant for all awards. |
| (3) | The risk-free interest rate is determined based on the yield of zero-coupon U.S. Treasury securities for a period that is commensurate with the performance period. |
| (4) | Dividends are considered reinvested when calculating TSR. The dividend yield is therefore considered to be 0%. |
The total fair value of RSU’s that vested during fiscal years 2016, 2015, and 2014 was $8.2 million, $9.8 million and $24.9 million, respectively.
Employee Stock Purchase Plan
On November 4, 1985, our stockholders approved the Employee Stock Purchase Plan, or ESPP, authorizing the issuances of up to 700,000 shares of our common stock. The ESPP allows qualified participants to purchase our common stock at 85% of its market price on the first business day of the purchase period or the last business day of the six-month purchase period. Stockholders approved amendments to the ESPP on January 22, 1986, January 23, 1998, and January 17, 2003. On January 21, 2014, our stockholders approved amendments to the ESPP which removed the income limitation on participation in the plan and increased the maximum value of stock that each employee can purchase in each of the two payment periods per year.
We estimate the fair value of ESPP shares using the Black-Scholes valuation model. For the fiscal years 2016, 2015 and 2014, the compensation expense from ESPP shares was immaterial.
3. Business combination
Oncura Partners Diagnostics, LLC, or Oncura
On January 8, 2016, the Company wholly acquired Oncura Partners Diagnostics, LLC, a privately held provider of remote, real-time ultrasound imaging and teleconsulting services currently focused on the veterinary medicine market. Oncura is included within the Ultrasound reportable segment; see Note 16 Segment Information
75
Table of Contents
ANALOGIC CORPORATION
NOTES TO CONSOLIDATED FINANCIAL STATEMENTS – (Continued)
(in millions, except share and per share data)
for further details. The preliminary purchase price was $20.2 million, comprised of an upfront cash payment of $8.4 million, post-closing adjustments $0.4 million, the relief of debt owed to Analogic of $1.3 million, and the fair value of contingent consideration of $10.1 million. The acquisition has been accounted for as an acquisition of a business.
The following table summarizes the purchase price allocation based on preliminary estimates of the fair values of the separately identifiable assets acquired and liabilities assumed as of the acquisition date. The fair value measurements of intangibles, property, plant and equipment, deferred revenue, and contingent consideration were based upon significant inputs not observable in the market and therefore represent fair value measurements based on Level 3 inputs, as defined in Note 8, Fair Value Measurements. These are preliminary balances as we continue to obtain information to complete our valuation of these accounts:
| (in millions) | ||||||||
| Cash |
$ | 0.4 | ||||||
| Accounts receivable |
0.3 | |||||||
| Inventory |
0.2 | |||||||
| Other assets |
0.4 | |||||||
| Property, plant, and equipment |
0.4 | |||||||
| Goodwill |
16.4 | |||||||
| Intangible assets: |
||||||||
| Tradename (estimated useful life of 5 years) |
$ | 1.0 | ||||||
| Customer relationships (estimated useful life of 6 years) |
3.1 | |||||||
|
|
|
|||||||
| Total intangible assets |
4.1 | |||||||
|
|
|
|||||||
| Total assets acquired |
22.2 | |||||||
| Accounts payable and accrued expenses |
(0.9 | ) | ||||||
| Deferred revenue |
(1.1 | ) | ||||||
|
|
|
|||||||
| Total liabilities assumed |
(2.0 | ) | ||||||
|
|
|
|||||||
| Total purchase price |
$ | 20.2 | ||||||
|
|
|
|||||||
We estimated the fair value of identifiable acquisition-related intangible assets primarily based on discounted cash flow projections that will arise from these assets. We use significant judgment with regard to assumptions used in the determination of fair value such as discount rates, projected cash flows, and the determination of the estimated useful lives of the intangible assets. There could be material changes as we continue to obtain information to complete our valuation of these accounts.
In connection with this acquisition, we recorded an acquisition date fair value contingent consideration obligation of $10.1 million within long-term contingent consideration, in the Consolidated Balance Sheets. This obligation is payable upon the achievement of certain revenue and gross margin targets over a four year period starting on May 1, 2016. There is no limit on the earnout that can be paid out. The $10.1 million fair value was estimated through a Monte Carlo valuation model that incorporates probability adjusted assumptions relating to the achievement of these targets and the likelihood of us making payments. There could be material changes as we continue to obtain information to complete our valuation of these accounts. During the initial post-close period, any changes in the acquisition date fair value will be recorded against goodwill. This fair value measurement is based upon significant inputs not observable in the market and therefore represents a Level 3 input measurement. Subsequent changes in the fair value of this obligation will be recognized as adjustments to the contingent consideration liability and reflected within our Consolidated Statement of Operations within general and administrative operating expenses. For additional information related to the fair value of this obligation, please refer to Note 8 Fair Value Measurements.
76
Table of Contents
ANALOGIC CORPORATION
NOTES TO CONSOLIDATED FINANCIAL STATEMENTS – (Continued)
(in millions, except share and per share data)
Goodwill associated with the acquisition was primarily attributable to the opportunities of expanding Analogic’s service offerings through the launch of an ultrasound-based telehealth initiative. The goodwill from this acquisition will be deductible for tax purposes over the statutory 15 year period.
During fiscal year 2016, we incurred acquisition costs of $0.4 million, which consisted primarily of legal and due diligence expenses that are included in our general and administrative expenses in our Consolidated Statements of Operations.
The pro forma financial information for fiscal year 2016, including revenue and net income, is immaterial, and has not been separately presented.
Pathfinder Therapeutics, Inc., or Pathfinder
On October 28, 2014, we acquired certain assets and assumed certain liabilities related to the surgical planning and guidance business of Pathfinder for $1.6 million, which was paid in cash at the acquisition date. The acquisition has been accounted for as an acquisition of a business.
The following table summarizes the purchase price allocation based on the fair values of the separately identifiable assets acquired and liabilities assumed as of the acquisition date:
| (in millions) | ||||||||
| Inventory and receivables |
$ | 0.2 | ||||||
| Goodwill |
0.4 | |||||||
| Intangible assets: |
||||||||
| Developed technology (estimated useful life of 10 years) |
$ | 0.7 | ||||||
| Customer relationships (estimated useful life of 2 years) |
0.3 | |||||||
| Trade names (estimated useful life of 5 years) |
0.1 | |||||||
|
|
|
|||||||
| Total intangible assets |
1.1 | |||||||
|
|
|
|||||||
| Total assets acquired |
1.7 | |||||||
| Accrued liabilities |
(0.1 | ) | ||||||
|
|
|
|||||||
| Total liabilities assumed |
(0.1 | ) | ||||||
|
|
|
|||||||
| Total purchase price |
$ | 1.6 | ||||||
|
|
|
|||||||
We estimated the fair value of identifiable acquisition-related intangible assets primarily based on discounted cash flows projections that will arise from these assets. We use significant judgment with regard to assumptions used in the determination of fair value such as discount rates and the determination of the estimated useful lives of the intangible assets.
The total weighted average amortization period for the intangible assets is approximately 7.6 years. Goodwill associated with the acquisition was primarily attributable to the opportunities from the addition of Pathfinder’s product portfolio and technology which complement our suite of products. The goodwill from this acquisition will be deductible for tax purposes over the statutory 15 year period.
During fiscal year 2015, we incurred acquisition costs of approximately $0.1 million which consisted primarily of legal and due diligence expenses that are included in our general and administrative expenses in our Consolidated Statements of Operations.
The pro forma financial information for the year ended July 31, 2015, including revenue and net income, is immaterial, and has not been separately presented.
77
Table of Contents
ANALOGIC CORPORATION
NOTES TO CONSOLIDATED FINANCIAL STATEMENTS – (Continued)
(in millions, except share and per share data)
PocketSonics, Inc.
In April 2010, we entered into an agreement with PocketSonics, Inc., or PocketSonics, a privately held ultrasound technology company based in Charlottesville, Virginia, which granted us an exclusive license to certain ultrasound technology owned or controlled by PocketSonics and a ten percent (10%) equity interest in PocketSonics. The equity investment was recorded as in-process research and development, or IPR&D, of $1.9 million. Since that time, we have collaborated with PocketSonics to develop patented ultrasound technology to enable the acceleration of high acuity guided procedures to lower cost point-of-care settings and other technical applications. On September 20, 2013, we acquired all of the remaining stock of PocketSonics. The purchase price includes base consideration of $11.1 million paid in cash at closing, fair value of contingent consideration of $1.9 million, and revaluation of our initial equity investment. We undertook this acquisition to further strengthen our competitive position in procedure guidance for point-of-care and other advanced guidance applications. The acquisition was funded from our existing cash on hand and has been accounted for as an acquisition of a business.
We finalized the purchase accounting for the PocketSonics acquisition during fiscal year 2014. The following table summarizes the fair values of the separately identifiable assets acquired and liabilities assumed as of September 20, 2013:
| (in millions) | ||||||||
| Cash |
$ | 0.5 | ||||||
| Goodwill |
6.9 | |||||||
| IPR&D |
11.5 | |||||||
|
|
|
|||||||
| Total assets acquired |
18.9 | |||||||
| Accounts payable and accrued expenses |
$ | (0.3 | ) | |||||
| Deferred taxes |
(4.1 | ) | ||||||
|
|
|
|||||||
| Total liabilities assumed |
(4.4 | ) | ||||||
|
|
|
|||||||
| Total purchase price |
$ | 14.5 | ||||||
|
|
|
|||||||
In determining the fair value, we considered, among other factors, market participants’ intentions to use the acquired assets and the historical and estimated future demand for PocketSonics products and services. We recognized an IPR&D asset of $11.5 million. The fair value of the asset was determined by a probability adjusted cash flow analysis. In May 2014, we determined that the IPR&D was completed and performed a qualitative assessment and determined that there was no impairment. Accordingly, the carrying amount of the IPR&D asset was reclassified as developed technology and will be amortized over its estimated useful life of 10 years.
In connection with this acquisition, we recorded a fair value contingent consideration obligation of $1.9 million, with potential exposure of up to $3.0 million payable upon the achievement of certain milestones relating to the PocketSonics technology. The contingent earn-out payments to the sellers of PocketSonics would be payable upon commercial launch and achievement of volume sales target as defined in the asset purchase agreement. The $2.0 million fair value was estimated through a valuation model that incorporates probability adjusted assumptions relating to the achievement of these milestones and the likelihood of us making payments. This fair value measurement is based upon significant inputs not observable in the market and therefore represents a Level 3 input measurement. Subsequent changes in the fair value of this obligation will be recognized as adjustments to the contingent consideration liability and reflected within our Consolidated Statements of Operations within selling and marketing expenses. During fiscal year 2015, the estimated fair value of our contingent consideration obligation decreased by $0.1 million. The total fair value of our contingent consideration obligation was $2.0 million as of July 31, 2015 and 2016. For additional information related to the fair value of this obligation, please refer to Note 8. Fair Value Measurements.
78
Table of Contents
ANALOGIC CORPORATION
NOTES TO CONSOLIDATED FINANCIAL STATEMENTS – (Continued)
(in millions, except share and per share data)
We recorded goodwill of $6.9 million related to the PocketSonics acquisition, representing the value of the opportunity of further strengthening our competitive position in procedure guidance for point-of-care and other advanced guidance applications. This goodwill will not be deductible for tax purposes.
Upon the acquisition of PocketSonics, we recognized a loss of $0.5 million related to our 10% pre-acquisition equity interest, which is reflected as a component of other expense, net within our Consolidated Statement of Operations for fiscal year 2014.
During fiscal year 2014, we incurred acquisition costs of $0.1 million consisting primarily of legal and due diligence expenses that are included in our general and administrative expenses in our Consolidated Statement of Operations.
4. Restructuring charges
Fiscal Year 2016 Restructuring Plan
On September 16, 2015, we announced our fiscal year 2016 restructuring plan. This plan includes the transition of certain manufacturing activities from our Peabody, Massachusetts location to our existing facility in Shanghai, China, and a reduction in force in order to align our research and development investment with expected customer funding. We incurred pre-tax charges of $9.6 million during the fiscal year 2016, primarily relating to severance and personnel related costs for 117 terminated employees, with other costs attributable to the relocation of existing equipment and project management costs, which are recognized in our Consolidated Statement of Operations under restructuring. The $9.6 million charge was recorded in the operating results of our Medical Imaging, Ultrasound, and Security and Detection segments, with charges of $6.0 million, $1.9 million, and $1.7 million, respectively. We expect that the restructuring plan will be substantially completed during fiscal year 2017.
Fiscal Year 2014 Restructuring Plan
During the fourth quarter of fiscal year 2014, we implemented our fiscal year 2014 restructuring plan to improve our operational effectiveness in Peabody, Massachusetts and leverage core competencies better across the business. We incurred pre-tax charges of $2.9 million during the fiscal year 2014, primarily relating to severance and personnel related costs for 48 involuntarily terminated employees associated with restructuring activities, including improving our operational effectiveness in Peabody Massachusetts to better leverage core competencies across the business, which are recognized in our Consolidated Statement of Operations under restructuring. The $2.9 million charge was recorded in the operating results of our Medical Imaging, Ultrasound, and Security and Detection segments, with charges of $1.9 million, $0.5 million and $0.5 million, respectively. The restructuring plan was completed in the fourth quarter of fiscal year 2016.
Fiscal Year 2013 Restructuring Plan
In May 2013, we announced a restructuring plan and incurred pre-tax charges of $4.1 million, primarily relating to severance and personnel related costs of 115 terminated employees, as well as for facility exit costs closure of the Ultrasonix sales subsidiary in Paris, France as well as the closure of our ultrasound transducer operation in Englewood, Colorado as we consolidate our transducer operations in State College, Pennsylvania. This plan also include activities to consolidate manufacturing and certain support functions currently conducted in our Ultrasonix facility in Vancouver, Canada with our other facilities, as well as optimization of our operations in Montreal, Canada and Peabody Massachusetts. Our pre-tax charges were included in our operating results of our Medical Imaging segment, Ultrasound segment and Security and Detection segment. The lease on the Englewood, Colorado facility was settled in January 2016 and the restructuring plan was completed in the third quarter of fiscal year 2016.
79
Table of Contents
ANALOGIC CORPORATION
NOTES TO CONSOLIDATED FINANCIAL STATEMENTS – (Continued)
(in millions, except share and per share data)
The following table summarizes accrued restructuring costs activity from July 31, 2014 through July 31, 2016:
| (in millions) | Employee Severance and Benefits (A) |
Facility Exit Costs (B) |
Acquisition Related Charges (A) |
Other Restructuring Cost |
Total (C) (D) | |||||||||||||||
| Balance at July 31, 2014 |
$ | 2.9 | $ | 0.8 | $ | 0.1 | $ | — | $ | 3.8 | ||||||||||
| Restructuring Charge |
(0.3 | ) | (0.1 | ) | — | — | (0.4 | ) | ||||||||||||
| Cash payments |
(2.4 | ) | (0.3 | ) | (0.1 | ) | — | (2.8 | ) | |||||||||||
| Balance at July 31, 2015 |
$ | 0.2 | $ | 0.4 | $ | — | $ | — | $ | 0.6 | ||||||||||
| Restructuring Charge |
9.4 | — | — | 0.2 | 9.6 | |||||||||||||||
| Cash payments |
(4.4 | ) | (0.4 | ) | — | (0.2 | ) | (5.0 | ) | |||||||||||
| Balance at July 31, 2016 |
$ | 5.2 | $ | (0.0 | ) | $ | — | $ | — | $ | 5.2 | |||||||||
| (A) | Restructuring charges in fiscal year 2016, include $9.6 million with respect to the Fiscal Year 2016 Restructuring Plan. |
| (B) | Cash payments in fiscal year 2015 & 2016 pertain only to the closure of the Englewood Colorado facility. |
| (C) | Activity in fiscal year 2015 pertains to both the Fiscal Year 2014 Restructuring Plan and the 2013 Restructuring Plan. In fiscal year 2015, the restructuring adjustments of ($0.3) million and cash payments of ($2.4) million relate to the Fiscal Year 2014 Restructuring Plan, while restructuring adjustments of ($0.1) million and cash payments of ($0.5) million relate to the Fiscal Year 2013 Restructuring Plan. |
| (D) | Activity in fiscal year 2016 pertains to the Fiscal Year 2016 Restructuring Plan, the Fiscal Year 2014 Restructuring Plan and the 2013 Restructuring Plan. In fiscal year 2016, there were restructuring charges of $9.6 million and cash payments of ($4.4) million related to the Fiscal Year 2016 Restructuring Plan, while there were cash payments of ($0.2) million and ($0.4) million related to the Fiscal Year 2014 Restructuring Plan and Fiscal Year 2013 Restructuring Plan, respectively. |
Restructuring charges are comprised on the Balance Sheet within accrued restructuring charges. The cash expenditures remaining to be paid as of July 31, 2016 will be paid within the next twelve months.
Restructuring costs, including actions associated with acquisitions, by segment for fiscal years 2016, 2015 and 2014 are as follows:
| For the Year ended July 31, | ||||||||||||
| (in millions) | 2016 | 2015 | 2014 | |||||||||
| Medical Imaging |
$ | 6.0 | $ | (0.2 | ) | $ | 1.7 | |||||
| Ultrasound |
1.9 | (0.1 | ) | 1.4 | ||||||||
| Security and Detection |
1.7 | (0.1 | ) | 0.4 | ||||||||
| Total restructuring and related charges |
$ | 9.6 | $ | (0.4 | ) | $ | 3.5 | |||||
Net restructuring and related charges are comprised of the following:
| For the Year ended July 31, | ||||||||||||
| (in millions) | 2016 | 2015 | 2014 | |||||||||
| Fiscal Year 2016 Restructuring Plan |
$ | 9.6 | $ | — | $ | — | ||||||
| Fiscal Year 2014 Restructuring Plan |
— | (0.3 | ) | 2.9 | ||||||||
| Fiscal Year 2013 Acquisition Related Charges |
— | — | 0.8 | |||||||||
| Fiscal Year 2013 Restructuring Plan |
— | (0.1 | ) | (0.2 | ) | |||||||
| Restructuring and related charges |
$ | 9.6 | $ | (0.4 | ) | $ | 3.5 | |||||
80
Table of Contents
ANALOGIC CORPORATION
NOTES TO CONSOLIDATED FINANCIAL STATEMENTS – (Continued)
(in millions, except share and per share data)
5. Net income per share
Basic net income per share is computed using the weighted average number of common shares outstanding during the period. Diluted net income per share is computed using the sum of the weighted average number of common shares outstanding during the period and, if dilutive, the weighted average number of potential shares of common stock, including unvested restricted stock and the assumed exercise of stock options using the treasury stock method. Options to purchase common shares with exercise prices that exceeded the market value of the underlying common stock are excluded from the computation of diluted earnings per share.
The following table sets forth the computation of basic and diluted net income per share for fiscal years 2016, 2015 and 2014:
| For the Year ended July 31, | ||||||||||||
| (in millions, except per share data and share data in thousands) | 2016 | 2015 | 2014 | |||||||||
| Net income |
$ | 12.1 | $ | 33.5 | $ | 34.5 | ||||||
| Weighted average number of common shares outstanding-basic |
12,402 | 12,407 | 12,404 | |||||||||
| Effect of dilutive securities: |
||||||||||||
| Stock options and restricted stock units |
213 | 199 | 263 | |||||||||
| Weighted average number of common shares outstanding-diluted |
12,615 | 12,606 | 12,667 | |||||||||
| Basic net income per share |
$ | 0.98 | $ | 2.70 | $ | 2.78 | ||||||
| Diluted net income per share |
$ | 0.96 | $ | 2.66 | $ | 2.72 | ||||||
| Anti-dilutive shares related to outstanding stock options and unvested restricted stock (A) |
5 | 176 | 118 | |||||||||
| (A) | These shares related to outstanding stock options and unvested restricted stock were not included in our calculations of diluted earnings per share, as the effect of including them would be anti-dilutive. |
6. Accounts receivable, net
Customers
Our accounts receivable arise primarily from products sold and services provided in the U.S., Europe and Asia. The balance in accounts receivable represents the amount due from our domestic and foreign OEM customers, distributors and end users. The majority of our accounts receivable have standard payment terms that require payment within 30 days. We perform ongoing credit evaluations of our customers’ financial condition and continuously monitor collections and payments from our customers and maintain a provision for estimated credit losses based upon specific customer collection issues that have been identified. Amounts determined to be uncollectible are charged or written off against the reserve. To date, our historical write-offs of accounts receivable have been minimal.
Our ten largest customers as a group accounted for 61%, 64%, and 66% of our net product and engineering revenue for fiscal years 2016, 2015, and 2014, respectively. Set forth in the table below, are customers which individually accounted for 10% or more of our net revenue.
| For the Year ended July 31, | ||||||||||||
| 2016 | 2015 | 2014 | ||||||||||
| Koninklijke Philips Electronics N.V., or Philips |
13 | % | 14 | % | 16 | % | ||||||
| Siemens AG |
12 | % | 11 | % | 11 | % | ||||||
| Toshiba Corporation, or Toshiba |
11 | % | 11 | % | 12 | % | ||||||
| L-3 Communications Corporation, or L-3 |
* | 13 | % | 11 | % | |||||||
| Note(*): | Total net revenue was less than 10% in this fiscal year. |
81
Table of Contents
ANALOGIC CORPORATION
NOTES TO CONSOLIDATED FINANCIAL STATEMENTS – (Continued)
(in millions, except share and per share data)
Philips’, Toshiba’s, and Siemens’ revenues were primarily in the Medical Imaging segment and L-3’s revenue was in the Security and Detection segment.
The following table summarizes the net accounts receivable due from our customers with net accounts receivable balances greater than or equal to 10% of our total net accounts receivable balance:
| As of July 31, 2016 |
As of July 31, 2015 |
|||||||
| L-3 |
17 | % | 17 | % | ||||
| Philips |
15 | % | 16 | % | ||||
7. Derivative instruments
Certain of our foreign operations have revenues and expenses transacted in currencies other than its functional currency. In order to mitigate foreign currency exchange risk, we use forward contracts to lock in exchange rates associated with a portion of our forecasted international expenses.
As of July 31, 2016, we have forward contracts outstanding with notional amounts totaling $18.6 million. These contracts are designated as cash flow hedges, and the unrealized loss of $0.2 million, net of tax, on these contracts are reported in Accumulated other comprehensive income as of July 31, 2016. Assets and liability derivatives designated as hedging instruments are presented in other assets and other liabilities, respectively, on our Consolidated Balance Sheets. At July 31, 2016 we had a derivative liability of $0.3 million included in other liabilities on our Consolidated Balance Sheet. As of July 31, 2015, we have forward contracts outstanding with notional amounts totaling $10.1 million. These contracts are designated as cash flow hedges, and the unrealized loss of $0.4 million, net of tax, on these contracts are reported in Accumulated other comprehensive income as of July 31, 2015. At July 31, 2015 we had a derivative liability of $0.5 million included in other liabilities on our Consolidated Balance Sheet.
Realized gains and (losses) on the cash flow hedges are recognized in income in the period when the payment of expenses is recognized. During fiscal years 2016, 2015 and 2014, we recorded approximately $(0.7) million, $(0.5) million of realized loss, and $0.2 million of realized gain, respectively, included in in our Consolidated Statements of Operations.
8. Fair value
Fair value is defined as the exchange price that would be received for an asset or paid to transfer a liability (an exit price) in the principal or most advantageous market for the asset transaction between market participants on the measurement date. Valuation techniques used to measure fair value must maximize the use of observable inputs and minimize the use of unobservable inputs. We use a fair value hierarchy based on three levels of inputs, of which the first two are considered observable and the last unobservable, that may be used to measure fair value:
Level 1 – Quoted prices in active markets for identical assets or liabilities.
Level 2 – Inputs other than Level 1 that are observable, either directly or indirectly, such as quoted prices for similar assets or liabilities; quoted prices in markets that are not active; or other inputs that are observable or can be corroborated by observable market data for substantially the full term of the assets or liabilities.
Level 3 – Unobservable inputs that are supported by little or no market activity and that are significant to the fair value of the assets or liabilities.
82
Table of Contents
ANALOGIC CORPORATION
NOTES TO CONSOLIDATED FINANCIAL STATEMENTS – (Continued)
(in millions, except share and per share data)
The following table provides the assets and liabilities carried at fair value measured on a recurring basis at July 31, 2016 and 2015:
| Fair Value Measurements at July 31, 2016 | ||||||||||||||||
| (in millions) | Total | Quoted Prices in Active Markets for Identical Assets (Level 1) |
Significant Other Observable Inputs (Level 2) |
Significant Unobservable Inputs (Level 3) |
||||||||||||
| Assets |
||||||||||||||||
| Cash and cash equivalents |
$ | 118.7 | $ | 118.7 | $ | — | $ | — | ||||||||
| Plan assets for deferred compensation |
5.9 | 5.9 | — | — | ||||||||||||
| Total assets at fair value |
$ | 124.6 | $ | 124.6 | $ | — | $ | — | ||||||||
| Liabilities |
||||||||||||||||
| Contingent consideration |
$ | 12.2 | $ | — | $ | — | $ | 12.2 | ||||||||
| Foreign currency forward contracts |
0.3 | — | 0.3 | — | ||||||||||||
| Total liabilities at fair value |
$ | 12.5 | $ | — | $ | 0.3 | $ | 12.2 | ||||||||
| Fair Value Measurements at July 31, 2015 | ||||||||||||||||
| (in millions) | Total | Quoted Prices in Active Markets for Identical Assets (Level 1) |
Significant Other Observable Inputs (Level 2) |
Significant Unobservable Inputs (Level 3) |
||||||||||||
| Assets |
||||||||||||||||
| Cash and cash equivalents |
$ | 123.8 | $ | 123.8 | $ | — | $ | — | ||||||||
| Plan assets for deferred compensation |
4.3 | 4.3 | — | — | ||||||||||||
| Total assets at fair value |
$ | 128.1 | $ | 128.1 | $ | — | $ | — | ||||||||
| Liabilities |
||||||||||||||||
| Contingent consideration |
$ | 2.0 | $ | — | $ | — | $ | 2.0 | ||||||||
| Foreign currency forward contracts |
$ | 0.5 | $ | — | $ | 0.5 | $ | — | ||||||||
| Total liabilities at fair value |
$ | 2.5 | $ | — | $ | 0.5 | $ | 2.0 | ||||||||
Assets held in the deferred compensation plans will be used to pay benefits under our non-qualified deferred compensation plans. The investments primarily consist of mutual funds which are publicly traded on stock exchanges. Accordingly, the fair value of these assets is categorized as Level 1 within the fair value hierarchy.
The fair value of the liabilities arising from our foreign currency forward contracts is determined by valuation models based on market observable inputs, including forward and spot prices for currencies. Accordingly, the fair value of these liabilities is categorized as Level 2 within the fair value hierarchy.
The fair value of our contingent consideration obligation is based on significant unobservable inputs, including management estimates and assumptions, and is measured based on the probability-weighted present value of the payments expected to be made. Accordingly, the fair value of this liability is categorized as Level 3 within the fair value hierarchy.
83
Table of Contents
ANALOGIC CORPORATION
NOTES TO CONSOLIDATED FINANCIAL STATEMENTS – (Continued)
(in millions, except share and per share data)
The fair value of the contingent payments associated with the acquisition of PocketSonics was calculated utilizing 100% probability for the earn out associated with the Section 510(k) clearance obtained from the Food and Drug Administration, or FDA, on April 9, 2014 and the first commercial shipment as defined in the purchase agreement, in the fiscal year ending July 31, 2016, or fiscal year 2016. Each quarter we revalue the contingent consideration obligations associated with the acquisition of PocketSonics to its then current fair value and record changes in the fair value to the Consolidated Statements of Operations. Changes in contingent consideration result from changes in the assumptions regarding probabilities of the estimated timing of launch, volume sales target, payments and the discount rate used to estimate the fair value of the liability. The assumptions used in estimating fair value require significant judgment. The use of different assumptions and judgments could result in a materially different estimate of fair value. There were adjustments of $0.0 million and ($0.1) million in the fair value of our contingent consideration obligation during the years ended July 31, 2016 and 2015, respectively. As of July 31, 2016 and 2015 the fair value of the contingent consideration obligation was reported in Other long-term liabilities and Other current liabilities as $2.0 million and $2.0 million, respectively, in the Consolidated Balance Sheets.
The fair value of the contingent payment obligation associated with the acquisition of Oncura was valued using a Monte Carlo simulation. The fair value of the contingent payment obligation of Oncura will be revalued each quarter to its then fair value and we will record changes in the fair value as contingent consideration expense within the our Consolidated Statement of Operations within general and administrative operating expenses. Changes in contingent consideration expense result from changes in the assumptions regarding probabilities of the estimated future volume sales and gross margin targets and the discount rate used to estimate the fair value of the liability. The assumptions used in estimating the fair value require significant judgment. The use of different assumptions and judgments could result in a different estimate of fair value. There was a $0.1 million increase in the fair value of our contingent consideration obligation during the year ended July 31, 2016. As of July 31, 2016, the fair value of the contingent consideration obligation associated with the Oncura acquisition was $2.5 million within short-term contingent consideration and $7.7 million within long-term contingent consideration, in the Consolidated Balance Sheets. Please refer to Note 3. Business Combinations for more information on the acquisition of Oncura.
The following are reconciliations of the changes in the fair value of contingent consideration in fiscal years 2016 and 2015:
| For the Year ended July 31, | ||||||||
| (in millions) | 2016 | 2015 | ||||||
| Beginning Balance |
$ | 2.0 | $ | 2.1 | ||||
| Acquisition-Oncura |
10.1 | — | ||||||
| Change in fair value |
0.1 | (0.1 | ) | |||||
| Payments |
— | — | ||||||
| Ending Balance |
$ | 12.2 | $ | 2.0 | ||||
9. Inventory
The components of inventory, net of allowance for obsolete, unmarketable or slow-moving inventories, are summarized as follows:
| (in millions) | As of July 31, 2016 | As of July 31, 2015 | ||||||
| Raw materials |
$ | 68.6 | $ | 64.5 | ||||
| Work in process |
45.6 | 46.0 | ||||||
| Finished goods |
31.3 | 22.2 | ||||||
| Total inventory |
$ | 145.5 | $ | 132.7 | ||||
84
Table of Contents
ANALOGIC CORPORATION
NOTES TO CONSOLIDATED FINANCIAL STATEMENTS – (Continued)
(in millions, except share and per share data)
10. Goodwill and intangible assets
Goodwill
The gross and carrying value of our goodwill at July 31, 2016 and 2015 was $73.9 million and $57.5 million, respectively. The difference between the two periods relates to goodwill associated with the acquisition of Oncura of $16.4 million. Please refer to Note 3. Business Combinations for more information on the acquisition of Oncura. We determined that our goodwill was not impaired in 2016, 2015 or 2014.
The total amount of goodwill that is deductible for tax purposes was $10.5 million for fiscal year 2016 and $4.0 million for fiscal year 2015.
Intangible assets
Intangible assets include the value assigned to intellectual property and other technology, patents, customer contracts and relationships, trade names, and in-process research and development. The estimated useful lives for our finite-lived intangible assets are between 1 to 14 years. Indefinite-lived intangibles consist of trade names acquired in business combinations. The carrying values of our indefinite-lived intangible assets relating to trade names were $7.6 million at both July 31, 2016 and 2015.
Finite-lived intangible assets at July 31, 2016 and 2015 consisted of the following:
| As of July 31, 2016 | As of July 31, 2015 | |||||||||||||||||||||||||||
| (in millions) | Weighted Average Amortization Period |
Cost | Accumulated Amortization |
Net | Cost | Accumulated Amortization |
Net | |||||||||||||||||||||
| Developed technologies |
10 years | $ | 29.9 | $ | 15.1 | $ | 14.8 | $ | 30.2 | $ | 12.3 | $ | 17.9 | |||||||||||||||
| Customer relationships |
13 years | 47.1 | 25.2 | 21.9 | 44.2 | 20.3 | 23.9 | |||||||||||||||||||||
| Trade names |
3 years | 1.9 | 1.0 | 0.9 | 1.0 | 0.9 | 0.1 | |||||||||||||||||||||
| Total finite-lived intangible assets |
$ | 78.9 | $ | 41.3 | $ | 37.6 | $ | 75.4 | $ | 33.5 | $ | 41.9 | ||||||||||||||||
Amortization expense related to finite-lived intangible assets was $8.4 million, $8.9 million, and $7.8 million for fiscal years 2016, 2015 and 2014, respectively. Amortization expense related to customer relationships and trade names is recognized in operating expenses in and amortization expense related to developed technologies is recognized in cost of sales in our Consolidated Statement of Operations.
The estimated future amortization expenses related to intangible assets for succeeding fiscal years is expected to be as follows:
| (in millions) | Estimated Future Amortization Expense |
|||
| 2017 |
$ | 7.9 | ||
| 2018 |
6.9 | |||
| 2019 |
5.7 | |||
| 2020 |
5.3 | |||
| 2021 |
4.8 | |||
| Thereafter |
7.0 | |||
| $ | 37.6 | |||
85
Table of Contents
ANALOGIC CORPORATION
NOTES TO CONSOLIDATED FINANCIAL STATEMENTS – (Continued)
(in millions, except share and per share data)
We performed the annual impairment test for our goodwill and other intangible assets with indefinite lives as of December 31, 2015. We first assess qualitative factors to determine whether it is more likely than not that the fair value of a reporting unit is less than its carrying value and as a basis for determining whether it is necessary to perform the quantitative impairment test. Alternatively, we may elect to bypass the qualitative assessment and proceed to the two-step quantitative impairment test. Our quantitative impairment assessment considered both the market approach and income approach to calculate the fair value of a reporting unit, with different weighting assigned to each. Under the market approach, the fair value of the reporting unit is based on trading multiples of a peer group of companies, which was determined based on an analysis of the selected guideline public companies’ business enterprise value (“BEV”) plus a control premium, which was determined based on an analysis of control premiums for recent relevant acquisitions. Under the income approach, the fair value of the reporting unit is based on the present value of estimated future cash flows, which are determined based upon the Company’s most recent strategic operating plan and considering market participant assumptions. The income approach is dependent on a number of significant management assumptions including estimates of future revenues, costs and expenses, and a number of significant valuation inputs including discount rates, working capital rates and tax rates. We completed our assessment of goodwill as of December 31, 2015 and determined that there was no impairment of goodwill. Please refer to Note 16. Segment and Geographic Information for more information on the carrying amount of goodwill by reportable segment for the years ended July 31, 2016 and 2015.
We compared the fair value of a tradename that has an indefinite life using the relief from royalty approach to its carrying value as of December 31, 2015. The relief from royalty approach utilized an after-tax royalty rate and a discount rate. The after-tax royalty rate was determined based on royalty research and margin analysis, while the discount rate was determined after consideration of market rates of return on debt and equity capital, the weighted average return on invested capital, and the risk associated with achieving forecasted sales for the tradename. We determined that the fair value of the tradename was in excess of its carrying value.
The current economic environment and the uncertainties regarding its impact on our business and our estimates for forecasted revenue and spending levels, made for purposes of our goodwill and trade name impairment testing during the second quarter of fiscal year 2016 may not be accurate predictions of the future. If our assumptions regarding forecasted revenue or margin growth rates of the reporting unit and trade name are not achieved, we may be required to record an impairment charge for the goodwill and trade name in future periods, whether in connection with our next annual impairment testing in the second quarter of the fiscal year ending July 31, 2017, or prior to that if any such change constitutes a triggering event outside of the quarter from when the annual goodwill and trade name impairment test is performed. As of July 31, 2016, we estimated that the fair value of each reporting unit significantly exceeded its corresponding carrying value. Changes in our forecasts, or decreases in the value of our common stock could cause book values of certain operations to exceed their fair values which may result in goodwill impairment charges in future periods. It is not possible at this time to determine if any such future impairment charge would result or, if it does, whether such charge would be material.
11. Commitments, guarantees and contingencies
Guarantees and indemnification obligations
Our standard OEM and supply agreements entered in the ordinary course of business typically contain an indemnification provision pursuant to which we indemnify, hold harmless, and agree to reimburse the indemnified party for losses suffered or incurred by the indemnified party in connection with any U.S. patent or
86
Table of Contents
ANALOGIC CORPORATION
NOTES TO CONSOLIDATED FINANCIAL STATEMENTS – (Continued)
(in millions, except share and per share data)
any copyright or other intellectual property infringement claim by any third party with respect to our products. Such provisions generally survive termination or expiration of the agreements. The potential amount of future payments we could be required to make under these indemnification provisions is, in some instances, unlimited. Our costs to defend lawsuits or settle claims related to these indemnification agreements have been insignificant to date, and we are not currently party to any significant indemnification claims. As a result, we believe that our estimated exposure on these agreements is currently minimal. Accordingly, we have no liabilities recorded for these agreements as of July 31, 2016.
Generally, we warrant that our products will perform in all material respects in accordance with our standard published specifications in effect at the time of delivery of the products to the customer for a period ranging from 12 to 60 months from the date of delivery. We provide for the estimated cost of product and service warranties based on specific warranty claims, claim history, and engineering estimates, where applicable.
The following table presents our accrued warranty liability for fiscal years 2016 and 2015:
| (in millions) | As of July 31, 2016 |
As of July 31, 2015 |
||||||
| Beginning balance |
$ | 6.6 | $ | 6.0 | ||||
| Provision |
1.1 | 4.4 | ||||||
| Settlements made in cash or in kind during the period |
(1.4 | ) | (3.8 | ) | ||||
| Ending balance |
$ | 6.3 | $ | 6.6 | ||||
At July 31, 2016 and 2015, we had deferred revenue for extended product warranty contracts of $0.2 million and $0.5 million, respectively.
Revolving credit agreements
On November 23, 2015, we entered into a five-year revolving credit agreement, or Credit Agreement, with the financial institutions identified therein as lenders, which included JPMorgan Chase Bank, N.A., TD Bank, N.A., Wells Fargo Bank, N.A., HSBC Bank, N.A., and People’s United Bank, N.A. The Credit Agreement provides $100.0 million in available credit and expires on November 23, 2020, when all outstanding borrowings must be paid in full. The credit facility does not require amortization of principal and may be reduced before maturity in whole or in part at our option without penalty. Upon entry into the Credit Agreement, we terminated without penalty a $100.0 million five-year, revolving credit agreement entered into on October 11, 2011 and previously paid in full in accordance with its terms. Borrowings under the Credit Agreement may be used for general corporate purposes, including permitted acquisitions. The amount of available credit can be increased under specified circumstances up to $200.0 million in aggregate. We are the sole borrower under the Credit Agreement. The obligations under the credit facility are guaranteed as required to be by our material domestic subsidiaries as designated by us from time to time or as required under the Credit Agreement. There are no pledges of the capital stock or assets of our international subsidiaries.
Interest rates on borrowings outstanding under the credit facility range from 1.25% to 1.75% above the LIBOR rate, or, at our option range from 0.00% to 1.00% above a defined base rate, the amount in each case varying based upon our leverage ratio. A quarterly commitment fee ranging from 0.20% to 0.35% per annum is applicable on the undrawn portion of the credit facility, based upon our leverage ratio.
87
Table of Contents
ANALOGIC CORPORATION
NOTES TO CONSOLIDATED FINANCIAL STATEMENTS – (Continued)
(in millions, except share and per share data)
The Credit Agreement limits our and our subsidiaries’ ability to, among other things: incur additional indebtedness; incur liens or guarantee obligations; pay dividends or make other distributions; make investments; dispose of assets; and engage in transactions with affiliates except on an arms-length basis. In addition, the Credit Agreement requires us to maintain the following financial ratios:
| • | A leverage ratio, defined as consolidated funded indebtedness to consolidated trailing four quarters earnings before interest, taxes, depreciation and amortization, or EBITDA, with the adjustments as stipulated in the Credit Agreement, of no greater than 2.75:1.00 (with a temporary step-up in the event of certain acquisitions); and |
| • | An interest coverage ratio, defined as the ratio of consolidated trailing four quarters adjusted EBITDA to consolidated interest charges of no less than 3.00:1.00 at any time. |
As of July 31, 2016, our leverage ratio was 0.004:1.00 and our interest coverage ratio was not applicable as we had no attributable interest expense. As of July 31, 2016, we were in full compliance with all financial and operating covenants contained in the Credit Agreement.
Any failure to comply with the financial or operating covenants of the credit facility would prevent us from being able to borrow and would also constitute a default, permitting the lenders to, among other things, accelerate repayment of outstanding borrowings, including all accrued interest and fees, and to terminate the credit facility. A change in control, as defined in the Credit Agreement, would also constitute an event of default, permitting the lenders to accelerate repayment and terminate the Credit Agreement.
In connection with entering into the Credit Agreement, we incurred approximately $0.5 million of transactions costs, which are being amortized over the five-year life of the credit facility.
As of July 31, 2016 and July 31, 2015, we had approximately $1.2 million and $1.2 million, respectively, in other revolving credit facilities with banks available for direct borrowings.
We did not have any borrowing outstanding under any of our credit facilities at July 31, 2016 and 2015, respectively.
Asset retirement obligations, or ARO
As of July 31, 2016 and 2015, we had an ARO for the estimated future costs associated with restoring our leased facilities with a carrying value of $1.1 million, included in other liabilities in our Consolidated Balance Sheet. During fiscal years 2016 and 2015, we recorded an insignificant amount of accretion and foreign currency translation related to the ARO.
Legal claims
We are subject to litigation, claims, investigations and audits arising from time to time in the ordinary course of our business. Although legal proceedings are inherently unpredictable, we believe that we have valid defenses with respect to those matters currently pending against us and intend to defend ourselves vigorously. The outcome of these matters, individually and in the aggregate, is not expected to have a material impact on our cash flows, results of operations, or financial position. We record losses when estimable and probable in accordance with U.S. GAAP.
88
Table of Contents
ANALOGIC CORPORATION
NOTES TO CONSOLIDATED FINANCIAL STATEMENTS – (Continued)
(in millions, except share and per share data)
Investigation Regarding our Danish Subsidiary
As initially disclosed in our Annual Report on Form 10-K for the fiscal year ended July 31, 2011, we identified certain transactions involving our Danish subsidiary BK Medical ApS, or BK Medical, and certain of its foreign distributors, with respect to which we raised questions concerning compliance with law, including Danish law and the U.S. Foreign Corrupt Practices Act, and our business policies. These have included transactions in which the distributors paid BK Medical amounts in excess of amounts owed and BK Medical transferred the excess amounts, at the direction of the distributors, to third parties identified by the distributors. We have terminated the employment of certain BK Medical employees and also terminated our relationships with the BK Medical distributors that were involved in the transactions. We have concluded that the identified transactions have been properly accounted for in our reported financial statements in all material respects. However, we were unable to ascertain with certainty the ultimate beneficiaries or the purpose of these transfers. We voluntarily disclosed this matter to the Danish Government, the U.S. Department of Justice, or DOJ, and the SEC, and cooperated with inquiries by the Danish Government, the DOJ and the SEC to reach a resolution of this matter in the fiscal year ended July 31, 2016. On June 22, 2016, we issued a press release announcing that we had reached agreements with the SEC, the DOJ and the Danish Government to resolve the matters we had voluntarily disclosed. As a result of these resolutions, we paid a total of $14.9 million in disgorgement, interest and penalties. We do not expect any further inquiries related to this matter. In the second quarter of fiscal 2016, we accrued a charge of $13.3 million, of which $10.1 million was classified as general and administrative expense and $3.2 million was classified as other expense, net in our Consolidated Statements of Operations, in connection with these matters. This is in addition to a $1.6 million charge that we accrued in the fourth quarter of fiscal 2015, of which $1.0 million was classified as general and administrative expense and $0.6 million was classified as other expense, net in our Consolidated Statements of Operations. We incurred inquiry-related costs of approximately $0.4 million, $1.4 million, and $1.4 million in our fiscal years ended July 31, 2016, 2015, and 2014 respectively, in connection with this matter.
12. Leases and other commitments
Certain of our subsidiaries lease manufacturing and office space under non-cancelable operating leases. These leases contain renewal options. We lease certain other real property and equipment under operating leases which, in the aggregate, are not significant.
Rent expense associated with our operating leases was approximately $1.9 million, $2.3 million, and $2.1 million in fiscal years 2016, 2015 and 2014, respectively.
The following is a schedule by year of future minimum lease payments at July 31, 2016:
| (in millions) | ||||
| Fiscal Year |
||||
| 2017 |
$ | 2.4 | ||
| 2018 |
1.8 | |||
| 2019 |
1.2 | |||
| 2020 |
0.9 | |||
| 2021 |
0.1 | |||
| Thereafter |
0.1 | |||
| $ | 6.5 | |||
At July 31, 2016, we had outstanding non-cancelable purchase orders aggregating to $23.9 million. The purchase orders are for manufacturing and non-manufacturing related goods and services.
89
Table of Contents
ANALOGIC CORPORATION
NOTES TO CONSOLIDATED FINANCIAL STATEMENTS – (Continued)
(in millions, except share and per share data)
13. Other income (expense)
Other income (expense) consists primarily of interest income on cash equivalents, gains on sale of other investments, and foreign exchange gains (losses).
In fiscal year 2016, we recorded a $3.2 million interest charge in connection with the investigation related to our Danish Subsidiary BK Medical.
In fiscal year 2015, we recorded a $0.6 million interest charge in connection with the investigation related to our Danish Subsidiary BK Medical.
In fiscal year 2014, we recognized a loss of $(0.5) million during the first quarter of fiscal year 2014, related to the acquisitions of Pocketsonics, please refer to Note 3. Business Combinations for more information on the acquisition of PocketSonics.
We had foreign exchange losses totaling $(2.7) million, $(0.4) million, and $(0.2) million during the fiscal years 2016, 2015, and 2014, respectively.
14. Retirement plans
401(k) Plan
We have a qualified retirement plan called the Analogic 401(k) Plan (the “Plan”) to provide retirement income for eligible employees through employee contributions and contributions from us. Employer contributions are discretionary and may be in the form of a direct profit sharing contribution or a discretionary matching contribution as determined and approved by the board of directors. Our contribution each year shall in no event exceed the maximum allowable under applicable provisions of the Internal Revenue Code. All contributions vest immediately.
The Plan, as allowed under Section 401(k) of the Internal Revenue Code, permits tax-deferred salary and wage deductions for eligible employees. Employees may contribute from 1% to 80% of their eligible compensation to the Plan, limited to a maximum annual amount as determined by the IRS. We matched employee contributions up to 4% of eligible compensation.
In addition to the 401(k) Plan provided to U.S. employees, we also provide benefits under defined contribution plans to our employees in Denmark and China. Contributions to all of our defined contribution plans totaled $5.2 million, $5.1 million, and $5.2 million, in fiscal years 2016, 2015 and 2014, respectively.
Defined Benefit Retirement Plan
Our Canadian subsidiary, Analogic Canada Corporation, formerly known as ANRAD Corporation, sponsors a defined benefit retirement plan called the Analogic Canada Corporation Retirement Plan (the “Analogic Canada Plan”). The Analogic Canada Plan was frozen to new accruals during fiscal year 2015. The Analogic Canada Plan provides benefits to employees based on a formula recognizing length of service and final average earnings. The measurement date used for the plan is July 31. We recognize the periodic pension expense in our Consolidated Statements of Operations and the associated assets or liabilities on our Consolidated Balance Sheet.
90
Table of Contents
ANALOGIC CORPORATION
NOTES TO CONSOLIDATED FINANCIAL STATEMENTS – (Continued)
(in millions, except share and per share data)
The following tables provide information about benefit obligations, plan assets and funded status as of July 31, 2016 and 2015:
Change in Benefit Obligation
| For the Year ended July 31, | ||||||||
| 2016 | 2015 | |||||||
| (in millions) | ||||||||
| Balance at beginning of year |
$ | 17.0 | $ | 18.1 | ||||
| Current service cost |
0.6 | 1.3 | ||||||
| Foreign currency exchange loss (gain) |
0.1 | (3.2 | ) | |||||
| Interest cost |
0.7 | 0.7 | ||||||
| Net actuarial loss |
2.1 | 0.3 | ||||||
| Plan participant contributions |
0.1 | 0.2 | ||||||
| Benefit payments |
(1.5 | ) | (0.4 | ) | ||||
| Transfer from other plans |
0.2 | — | ||||||
| Balance at end of year |
$ | 19.3 | $ | 17.0 | ||||
Change in Plan Assets
| 2016 | 2015 | |||||||
| (in millions) | ||||||||
| Fair value at beginning of year |
$ | 15.0 | $ | 15.7 | ||||
| Actual return on plan assets |
0.4 | 1.5 | ||||||
| Employer contributions |
1.0 | 0.8 | ||||||
| Plan participant contributions |
0.1 | 0.2 | ||||||
| Benefits paid |
(1.5 | ) | (0.4 | ) | ||||
| Foreign currency exchange gain (loss) |
0.1 | (2.8 | ) | |||||
| Transfer from other plans |
0.2 | — | ||||||
| Fair value at end of year |
$ | 15.3 | $ | 15.0 | ||||
| Funded status |
$ | (4.0 | ) | $ | (2.0 | ) | ||
| Recognized Long-term liability |
$ | (4.0 | ) | $ | (2.0 | ) | ||
Accumulated Benefit Obligation (ABO)
ABO balances for the Analogic Canada Plan were $14.1 million and $12.3 million at July 31, 2016 and 2015, respectively.
Net Periodic Benefit Cost
The components of our net periodic benefit cost are as follows:
| For the Year ended July 31, | ||||||||||||
| 2016 | 2015 | 2014 | ||||||||||
| (in millions) | ||||||||||||
| Service cost |
$ | 0.6 | $ | 1.3 | $ | 1.1 | ||||||
| Interest cost |
0.7 | 0.7 | 0.6 | |||||||||
| Expected return on plan assets |
(0.9 | ) | (0.9 | ) | (0.8 | ) | ||||||
| Amortization of net actuarial loss recognized |
0.1 | 0.2 | 0.1 | |||||||||
| Total net periodic benefit cost |
$ | 0.5 | $ | 1.3 | $ | 1.0 | ||||||
91
Table of Contents
ANALOGIC CORPORATION
NOTES TO CONSOLIDATED FINANCIAL STATEMENTS – (Continued)
(in millions, except share and per share data)
Amounts Recognized in Accumulated Other Comprehensive Income, Pretax
| For the Year ended July 31, | ||||||||
| 2016 | 2015 | |||||||
| (in millions) | ||||||||
| Net loss |
$ | 6.4 | $ | 3.9 | ||||
| Accumulated other comprehensive loss |
$ | 6.4 | $ | 3.9 | ||||
The estimated net actuarial loss for the Analogic Canada Plan that is expected to be amortized from stockholders’ equity into net pension cost in fiscal year 2017 is $0.3 million.
Actuarial Assumptions
Actuarial assumptions for the Analogic Canada Plan are described below. The discount rates at July 31 were used to measure the fiscal year end benefit obligations and the earnings effects for the subsequent year. The discount rate is based on high quality corporate bond spot rates with cash flows that match the timing and amount of expected benefit payments.
| For the Year ended July 31, | ||||||||||||
| 2016 | 2015 | 2014 | ||||||||||
| Discount rate |
4.0 | % | 4.2 | % | 4.8 | % | ||||||
| Expected return on assets |
6.0 | % | 6.0 | % | 6.0 | % | ||||||
To determine the expected long-term rate of return on the Analogic Canada Plan assets, we considered the current and expected asset allocations, as well as historical and expected returns on various categories of plan assets. We amortize realized gains and losses, as well as the effects of changes in actuarial assumptions and plan provisions over a period no longer than the average future service of employees.
Funding Policy
The funding policy for the Analogic Canada Plan is to contribute amounts sufficient to meet minimum funding requirements as set forth in employee benefit and tax laws, plus such additional amounts as we may determine to be appropriate. During fiscal years 2016, 2015 and 2014, we made contributions to the Analogic Canada Plan of $1.0 million, $0.8 million, and $1.6 million, respectively, and made payments for benefits of $1.5 million, $0.4 million, and $0.9 million, respectively. In fiscal year 2017, we expect to make contributions and payments for benefits of 0.0 million and $0.4 million, respectively.
Plan Assets
The Analogic Canada Plan assets are held in trust, as follows:
| July 31, 2016 | July 31, 2015 | |||||||||||
| (in millions) | Target Allocation |
Actual Allocation |
Actual Allocation |
|||||||||
| Equity securities |
60.0 | % | 61.1 | % | 59.9 | % | ||||||
| Debt securities |
40.0 | % | 38.9 | % | 40.1 | % | ||||||
| Total |
100.0 | % | 100.0 | % | 100.0 | % | ||||||
92
Table of Contents
ANALOGIC CORPORATION
NOTES TO CONSOLIDATED FINANCIAL STATEMENTS – (Continued)
(in millions, except share and per share data)
The Pension Committee of the Analogic Canada Plan sets investment policies and strategies for the Analogic Canada Plan. Long-term strategic investment objectives include preserving the funded status of the Analogic Canada Plan and balancing risk and return. The Pension Committee oversees the investment allocation process, which includes selecting investment managers, commissioning periodic asset-liability studies, setting long-term strategic targets and monitoring asset allocations.
Target allocation ranges are guidelines, not limitations, and occasionally the Pension Committee will approve allocations above or below a target range. The fair value of the Analogic Canada Plan pension assets by asset category at July 31, 2016 and 2015 are as follows:
| (in millions) | Fair Value Measurements at July 31, 2016 | |||||||||||||||
| Total | Quoted Prices in Active Markets for Identical Assets (Level 1) |
Significant Other Observable Inputs (Level 2) |
Significant Unobservable Inputs (Level 3) |
|||||||||||||
| Assets |
||||||||||||||||
| Mutual funds (a) |
$ | 15.3 | $ | — | $ | — | $ | 15.3 | ||||||||
| Total assets at fair value |
$ | 15.3 | $ | — | $ | — | $ | 15.3 | ||||||||
| (in millions) | Fair Value Measurements at July 31, 2015 | |||||||||||||||
| Total | Quoted Prices in Active Markets for Identical Assets (Level 1) |
Significant Other Observable Inputs (Level 2) |
Significant Unobservable Inputs (Level 3) |
|||||||||||||
| Assets |
||||||||||||||||
| Mutual funds (a) |
$ | 15.0 | $ | — | $ | — | $ | 15.0 | ||||||||
| Total assets at fair value |
$ | 15.0 | $ | — | $ | — | $ | 15.0 | ||||||||
| (a) | This comprises units of segregated pooled funds with an insurance company. These funds have underlying values primarily derived from mutual funds that have debt and equity securities, which are traded on an active market based on the closing price of each trading day. |
| Fair Value Measurements Using Significant Unobservable Inputs (Level 3) |
||||||||
| (in millions) | July 31, 2016 |
July 31, 2015 |
||||||
| Balance at beginning of fiscal year |
$ | 15.0 | $ | 15.7 | ||||
| Actual return on plan assets |
||||||||
| Relating to assets still held at end of fiscal year |
0.4 | 1.5 | ||||||
| Purchases, sales and settlements |
(0.2 | ) | 0.6 | |||||
| Foreign currency exchange losses |
0.1 | (2.8 | ) | |||||
| Balance at end of fiscal year |
$ | 15.3 | $ | 15.0 | ||||
93
Table of Contents
ANALOGIC CORPORATION
NOTES TO CONSOLIDATED FINANCIAL STATEMENTS – (Continued)
(in millions, except share and per share data)
Estimated Future Benefit Payments
Estimated future benefit payments under the Analogic Canada Plan are as follows:
| (in millions) | ||||
| 2017 |
$ | 0.3 | ||
| 2018 |
0.4 | |||
| 2019 |
0.4 | |||
| 2020 |
0.4 | |||
| 2021 |
0.4 | |||
| 2022-2026 |
2.5 | |||
15. Income taxes
The following table presents the provision for income taxes and our effective tax rate for the fiscal years ended July 31, 2016, 2015 and 2014:
| For the Year ended July 31, | ||||||||||||
| (in millions except percentages) | 2016 | 2015 | 2014 | |||||||||
| Provision for (benefit from) income taxes |
$ | 8.2 | $ | 7.6 | $ | (5.4 | ) | |||||
| Effective tax rate |
40 | % | 18 | % | -19 | % | ||||||
The effective income tax rate is based on the actual income for the year, the composition of the income in different countries, and adjustments, if any, in the applicable quarterly periods for the potential tax consequences, benefits, resolution of tax audits, tax contingencies or other discrete items.
A reconciliation of income taxes at the U.S. statutory rate to the effective tax rate follows:
| For the Year ended July 31, | ||||||||||||
| (in %) | 2016 | 2015 | 2014 | |||||||||
| U.S. Federal statutory tax rate (%) |
35 | 35 | 35 | |||||||||
| State income taxes, net of federal tax benefit |
(2 | ) | (1 | ) | (3 | ) | ||||||
| Domestic production benefit |
— | 1 | (2 | ) | ||||||||
| General business credit (U.S. R&D) |
(5 | ) | (2 | ) | (3 | ) | ||||||
| Valuation allowance |
2 | — | — | |||||||||
| Change in classification of Canadian entity |
— | — | (40 | ) | ||||||||
| Effect of international operations |
(3 | ) | (11 | ) | (9 | ) | ||||||
| Increase (decrease) in tax reserves |
8 | (6 | ) | (2 | ) | |||||||
| Non-deductible royalty |
2 | — | — | |||||||||
| Other items, net |
3 | 2 | 5 | |||||||||
| Effective tax rate (%) |
40 | 18 | (19 | ) | ||||||||
Our effective tax rate for fiscal year 2016 is higher than the statutory rate of 35%, primarily due to certain discrete tax provisions totaling $1.2 million. The discrete tax provision for fiscal year 2016 consists primarily of a $1.5 million increase in uncertain tax positions primarily associated with the BK Medical matter, offset by a $0.4 million benefit associated with the extension of the federal R&D tax credit, a $0.3 million reduction in uncertain tax positions primarily associated with the expiration of statute of limitations, along with $0.3 million provision on other items.
94
Table of Contents
ANALOGIC CORPORATION
NOTES TO CONSOLIDATED FINANCIAL STATEMENTS – (Continued)
(in millions, except share and per share data)
Our effective tax rate before discrete items for fiscal year 2015 is lower than the statutory rate of 35%, primarily due to lower foreign tax rates and tax credits in the U.S. and Canada. The tax provision for fiscal year 2015 includes certain discrete tax benefits totaling $2.9 million. The discrete tax benefit for fiscal year 2015 consists primarily of a $3.4 million reduction in uncertain tax positions primarily associated with the expiration of statute of limitations, a $0.8 million benefit associated with the extension of the federal R&D tax credit, offset by a $0.3 million provision on reduction of domestic production deduction due to filing of NOL carryback claim, along with $1.0 million provision on other items.
The components of the provision (benefit from) for income taxes are as follows:
| For the Year ended July 31, | ||||||||||||
| (in millions) | 2016 | 2015 | 2014 | |||||||||
| Current income taxes provision (benefit): |
||||||||||||
| U.S.: |
||||||||||||
| Federal |
$ | 2.5 | $ | (2.8 | ) | $ | (5.2 | ) | ||||
| State |
(0.2 | ) | — | 0.3 | ||||||||
| Non-U.S. |
6.4 | 6.0 | 4.9 | |||||||||
| Current income tax provision |
$ | 8.7 | $ | 3.2 | $ | — | ||||||
| Deferred income taxes (benefit) provision: |
||||||||||||
| U.S.: |
||||||||||||
| Federal |
$ | (2.9 | ) | $ | 1.9 | $ | (2.9 | ) | ||||
| State |
(0.1 | ) | 0.2 | (0.4 | ) | |||||||
| Non-U.S. |
2.5 | 2.3 | (2.1 | ) | ||||||||
| Deferred income taxes (benefit) provision |
$ | (0.5 | ) | $ | 4.4 | $ | (5.4 | ) | ||||
| Provision (benefit from) for income taxes |
$ | 8.2 | $ | 7.6 | $ | (5.4 | ) | |||||
Income before income taxes from domestic and foreign operations is as follows:
| For the Year ended July 31, | ||||||||||||
| (in millions) | 2016 | 2015 | 2014 | |||||||||
| Domestic |
$ | 7.9 | $ | 7.5 | $ | 0.9 | ||||||
| Foreign |
12.4 | 33.5 | 28.1 | |||||||||
| Income before income taxes |
$ | 20.3 | $ | 41.0 | $ | 29.0 | ||||||
95
Table of Contents
ANALOGIC CORPORATION
NOTES TO CONSOLIDATED FINANCIAL STATEMENTS – (Continued)
(in millions, except share and per share data)
Net deferred taxes, detailed below, recognize the impact of temporary differences between the amounts of assets and liabilities recorded for financial statement purposes and such amounts measured in accordance with tax laws:
| As of July 31, 2016 |
As of July 31, 2015 |
|||||||
| (in millions) | ||||||||
| Assets |
||||||||
| Compensation |
$ | 10.0 | $ | 8.4 | ||||
| Accruals and reserves |
5.5 | 5.7 | ||||||
| Comprehensive income |
2.0 | 1.4 | ||||||
| Net operating losses and credit carryforwards |
17.0 | 19.6 | ||||||
| Other |
0.9 | 0.6 | ||||||
| Deferred tax assets |
$ | 35.4 | $ | 35.7 | ||||
| Valuation allowance |
(11.4 | ) | (10.6 | ) | ||||
| Total deferred tax assets |
$ | 24.0 | $ | 25.1 | ||||
| Liabilities |
||||||||
| Depreciation related |
$ | (8.0 | ) | $ | (8.7 | ) | ||
| Goodwill and intangibles |
(5.3 | ) | (6.5 | ) | ||||
| Total deferred tax liabilities |
$ | (13.3 | ) | $ | (15.2 | ) | ||
| Net deferred tax assets |
$ | 10.7 | $ | 9.9 | ||||
As of July 31, 2016, we had net operating loss carryforwards in Belgium of approximately $2.9 million which have no expiration date, losses of approximately $8.6 million in Denmark which have no expiration date, and losses of $6.0 million in Canada that will expire in 2024. As of July 31, 2016, we also had state tax credit carryforwards of $14.9 million that will begin to expire in 2021 and credit carryforwards of $3.0 million in Canada that will begin to expire in 2025. We also have operating loss carryforwards in Luxembourg of approximately $14.9 million. We believe that the possibility of utilizing the Luxembourg loss carryforwards in the foreseeable future is remote, and therefore have provided a full valuation allowance against them.
We do not provide for U.S. Federal income taxes on undistributed earnings of consolidated foreign subsidiaries of approximately $85.9 million, as such earnings are intended to be indefinitely reinvested in those operations. Determination of the potential deferred income tax liability on these undistributed earnings is not practicable because such liability, if any, is dependent on circumstances that exist if and when remittance occurs. The circumstances that would affect the calculations would be the source location and amount of the distribution, the underlying tax rate already paid on the earnings, foreign withholding taxes and the opportunity to use foreign tax credits.
We have determined that it is more likely than not that we will not recognize the benefit of certain foreign losses, state losses, and tax credits and, as a result, valuation allowances have been established at July 31, 2016 and 2015. The change in the valuation allowance in fiscal year 2016 is primarily the result of the addition of current year operating loss carryforwards in Luxembourg where use is not more likely than not.
We perform a two-step evaluation of all tax positions, ensuring that these tax return positions meet the “more likely than not” recognition threshold and can be measured with sufficient precision to determine the benefit recognized in the financial statements. These evaluations provide us with a comprehensive model for how we should recognize, measure, present, and disclose in our financial statements certain tax positions that we have taken or expect to take on our income tax returns.
96
Table of Contents
ANALOGIC CORPORATION
NOTES TO CONSOLIDATED FINANCIAL STATEMENTS – (Continued)
(in millions, except share and per share data)
The following table summarizes the changes in our unrecognized income tax benefits for fiscal years 2016 and 2015:
| July 31, | ||||||||
| (in millions) | 2016 | 2015 | ||||||
| Beginning balance |
$ | 6.0 | $ | 8.1 | ||||
| Increases based on tax positions related to current year |
1.8 | 0.7 | ||||||
| Increases for tax positions of prior years |
0.2 | 0.1 | ||||||
| Decreases for tax positions of prior years |
— | (0.3 | ) | |||||
| Decreases due to settlements with taxing authorities |
— | — | ||||||
| Decreases due to lapse of applicable statute of limitations |
(0.4 | ) | (2.6 | ) | ||||
| Adjustments due to foreign exchange rate |
— | — | ||||||
| Ending balance |
$ | 7.6 | $ | 6.0 | ||||
| Net interest as of end of fiscal year |
$ | 0.4 | $ | 0.3 | ||||
The unrecognized tax benefits increased to $7.6 million at July 31, 2016. If recognized in a future period, the timing of which is not estimable, we expect that approximately $2.2 million would reduce our effective tax rate, net of potential valuation allowances.
We are subject to U.S. Federal income tax as well as the income tax of multiple state and foreign jurisdictions. We have concluded all U.S. Federal income tax matters through the year ended July 31, 2012. In the next four quarters, the statute of limitations for our fiscal year ended July 31, 2013 may expire for U.S. Federal and state income taxes and for foreign subsidiaries and it is reasonably expected that net unrecognized benefits, including interest, of approximately $0.7 million may be recognized. During the fiscal year 2016, we reduced our uncertain tax benefits and accrued interest by $0.3 million as a result of the closing of statutes of limitation for the fiscal year 2012 for domestic entities and the remeasurement of uncertain tax benefits in open years.
We accrue interest and, if applicable, penalties for any uncertain tax positions. This interest and penalty expense is treated as a component of income tax expense. At July 31, 2016 and 2015, we had approximately $0.4 million and $0.3 million, respectively, accrued for interest and penalties on unrecognized tax benefits.
Refundable income taxes at July 31, 2016 consisted of refundable income tax assets of $3.0 million. Refundable income taxes at July 31, 2015 consisted of refundable income tax assets of $10.4 million. The refundable income tax assets include expected Federal, state, and foreign refunds that are expected to be received within the next twelve months.
In fiscal year 2016, we corrected the presentation of the table summarizing the changes in our unrecognized income tax benefits for fiscal year 2015. We determined that these corrections, which had no impact on our balance sheet, statement of operations or cash flows from operating, investing and financing activities, were not material to our Consolidated Financial Statements for fiscal year 2015. These corrections resulted in the following:
For the fiscal year ended 2015 – Beginning balance is $8.1, from the previously disclosed amount of $6.9; and
97
Table of Contents
ANALOGIC CORPORATION
NOTES TO CONSOLIDATED FINANCIAL STATEMENTS – (Continued)
(in millions, except share and per share data)
For the fiscal year ended 2015 – Increase based on tax positions related to current year is $0.7, from the previously disclosed amount of $0.6.
For the fiscal year ended 2015 – Ending balance is $6.0, from the previously disclosed amount of $4.7.
As discussed in Note 1, Recent Accounting Pronouncements, during the second quarter of fiscal year 2016 ended January 31, 2016, we retrospectively adopted ASU No. 2015-17, “Income Taxes (Topic 740): Balance Sheet Classification of Deferred Taxes.” The effects of the accounting change on the July 31, 2015 Consolidated Balance Sheets were as follows:
| (in thousands) | July 31, 2015 | |||||||
| Revised | Previously Reported |
|||||||
| Current deferred tax asset |
$ | — | $ | 7,987 | ||||
| Non-current deferred tax asset |
9,904 | 5,308 | ||||||
| Non-current deferred tax liability |
— | (3,391 | ) | |||||
| Net deferred tax assets |
$ | 9,904 | $ | 9,904 | ||||
16. Segment and geographic information
Our business is strategically aligned into three reportable segments: Medical Imaging, Ultrasound, and Security and Detection. Our business segments are described as follows:
| • | Medical Imaging primarily includes systems and subsystems for CT and MRI medical imaging equipment as well as state-of-the-art, selenium-based detectors for screening of breast cancer and other diagnostic applications in mammography. |
| • | Ultrasound includes ultrasound systems and transducers primarily in the urology, surgery, and point-of-care markets. |
| • | Security and Detection includes advanced threat detecting CT systems utilizing our expertise in advanced imaging technology, primarily used in the checked baggage screening at airports worldwide. |
98
Table of Contents
ANALOGIC CORPORATION
NOTES TO CONSOLIDATED FINANCIAL STATEMENTS – (Continued)
(in millions, except share and per share data)
The table below presents information about our reportable segments:
| For the Year ended July 31, | ||||||||||||
| (in millions) | 2016 | 2015 | 2014 | |||||||||
| Product revenue: |
||||||||||||
| Medical Imaging |
$ | 285.8 | $ | 288.6 | $ | 291.3 | ||||||
| Ultrasound |
160.8 | 163.6 | 152.3 | |||||||||
| Security and Detection |
56.1 | 79.0 | 65.9 | |||||||||
| Total product revenue |
$ | 502.7 | $ | 531.2 | $ | 509.5 | ||||||
| Engineering revenue: |
||||||||||||
| Medical Imaging |
$ | 3.4 | $ | 4.0 | $ | 4.3 | ||||||
| Ultrasound |
2.4 | 2.6 | 0.2 | |||||||||
| Security and Detection |
0.3 | 2.5 | 3.5 | |||||||||
| Total engineering revenue |
$ | 6.1 | $ | 9.1 | $ | 8.0 | ||||||
| Net revenue: |
||||||||||||
| Medical Imaging |
$ | 289.2 | $ | 292.6 | $ | 295.6 | ||||||
| Ultrasound |
163.2 | 166.2 | 152.5 | |||||||||
| Security and Detection |
56.4 | 81.5 | 69.4 | |||||||||
| Total net revenue |
$ | 508.8 | $ | 540.3 | $ | 517.5 | ||||||
| Income from operations: |
||||||||||||
| Medical Imaging (A) |
$ | 38.6 | $ | 37.9 | $ | 31.0 | ||||||
| Ultrasound (B) |
(18.8 | ) | (7.9 | ) | (6.8 | ) | ||||||
| Security and Detection (C ) |
5.4 | 10.6 | 4.9 | |||||||||
| Total income from operations |
25.2 | 40.6 | 29.1 | |||||||||
| Total other income, net |
(4.9 | ) | 0.4 | (0.1 | ) | |||||||
| Income before income taxes |
$ | 20.3 | $ | 41.0 | $ | 29.0 | ||||||
| (in millions) | As of July 31, 2016 |
As of July 31, 2015 |
||||||
| Identifiable total assets by segment: |
||||||||
| Medical Imaging (D) |
$ | 191.1 | $ | 194.3 | ||||
| Ultrasound (E ) |
152.5 | 169.4 | ||||||
| Security and Detection (F) |
49.8 | 50.4 | ||||||
| Total reportable segment assets |
393.4 | 414.1 | ||||||
| Corporate assets (G) |
165.6 | 156.4 | ||||||
| Total identifiable assets (H) |
$ | 559.0 | $ | 570.5 | ||||
| (in millions) | As of July 31, 2016 |
As of July 31, 2015 |
||||||
| Goodwill by segment: |
||||||||
| Medical Imaging |
$ | 1.9 | $ | 1.9 | ||||
| Ultrasound |
71.5 | 55.1 | ||||||
| Security and Detection |
0.5 | 0.5 | ||||||
| Total goodwill |
$ | 73.9 | $ | 57.5 | ||||
99
Table of Contents
ANALOGIC CORPORATION
NOTES TO CONSOLIDATED FINANCIAL STATEMENTS – (Continued)
(in millions, except share and per share data)
| (A) | Includes restructuring charges of $6.0 million, $(0.2) million and $1.7 million for fiscal years 2016, 2015 and 2014, respectively. |
| (B) | Includes restructuring charges of $1.9 million, $(0.1) million and $1.4 million for fiscal year 2016, 2015 and 2014, respectively. |
Includes a $10.1 million and $1.0 million charge for the BK Medical matter for fiscal year 2016 and 2015, respectively.
| (C) | Includes restructuring charges of $1.7 million, $(0.1) million and $0.4 million for fiscal year 2016, 2015 and 2014, respectively. |
| (D) | Includes net intangible assets from acquisitions of $20.3 million and 23.2 million at July 31, 2016 and 2015, respectively. |
| (E) | Includes net intangible assets from acquisitions of $15.2 million and $15.2 million at July 31, 2016 and 2015, respectively, of which $3.7 million net intangible assets relating to our acquisition of Oncura during the second quarter of fiscal year 2016. |
| (F) | Includes net intangible assets from acquisitions of $0.6 million and $0.1 million at July 31, 2016 and 2015, respectively, relating to our acquisition of Pathfinder during the first quarter of fiscal year 2015. |
| (G) | Includes cash, cash equivalents and marketable securities of $97.3 million and $86.2 million, as of July 31, 2016 and 2015, respectively. |
| (H) | The Company in the past included the balance of goodwill in identifiable assets by segment table, but felt it more relevant to disclose the identifiable assets by segment excluding the associated goodwill balances as the goodwill balances are separately stated by segment. As such, the prior period presentation was modified to exclude the associated goodwill balances as well for comparability purposes. |
Revenues are attributed to countries based on the location of our customers. For OEM sales, our customer location may differ from the location where the ultimate completed systems are sold by the OEM into the market.
Information regarding share-based compensation and depreciation and amortization by segment for the fiscal years 2016, 2015 and 2014 are as follows:
| For the Year ended July 31, | ||||||||||||
| (in millions) | 2016 | 2015 | 2014 | |||||||||
| Share-based compensation expense: |
||||||||||||
| Medical Imaging |
$ | 3.9 | $ | 4.9 | $ | 6.6 | ||||||
| Ultrasound |
2.6 | 3.2 | 2.8 | |||||||||
| Security and Detection |
2.3 | 2.8 | 2.1 | |||||||||
| Total share-based compensation expense |
$ | 8.8 | $ | 10.9 | $ | 11.5 | ||||||
| Depreciation and amortization: |
||||||||||||
| Medical Imaging |
$ | 11.3 | $ | 11.1 | $ | 11.5 | ||||||
| Ultrasound |
10.4 | 10.5 | 9.1 | |||||||||
| Security and Detection |
1.8 | 1.7 | 1.5 | |||||||||
| Total depreciation and amortization |
$ | 23.5 | $ | 23.3 | $ | 22.1 | ||||||
100
Table of Contents
ANALOGIC CORPORATION
NOTES TO CONSOLIDATED FINANCIAL STATEMENTS – (Continued)
(in millions, except share and per share data)
Information regarding geographic areas for fiscal years 2016, 2015 and 2014 are as follows:
| For the Year ended July 31, | ||||||||||||
| (in millions) | 2016 | 2015 | 2014 | |||||||||
| Net Revenue: |
||||||||||||
| United States |
$ | 192.3 | $ | 215.3 | $ | 183.8 | ||||||
| Japan |
47.0 | 60.4 | 66.2 | |||||||||
| Germany |
68.5 | 60.2 | 61.8 | |||||||||
| Netherlands |
54.9 | 60.4 | 70.2 | |||||||||
| Other |
146.1 | 144.0 | 135.5 | |||||||||
| Total net revenue |
$ | 508.8 | $ | 540.3 | $ | 517.5 | ||||||
| For the Year ended July 31, | ||||||||||||
| (in millions) | 2016 | 2015 | 2014 | |||||||||
| Property, plant and equipment, net: |
||||||||||||
| United States |
$ | 64.1 | $ | 63.7 | $ | 66.1 | ||||||
| Denmark |
16.4 | 15.6 | 19.8 | |||||||||
| China |
20.4 | 19.6 | 20.0 | |||||||||
| Other (A) |
6.9 | 7.4 | 8.3 | |||||||||
| Total property, plant and equipment, net |
$ | 107.8 | $ | 106.3 | $ | 114.2 | ||||||
| (A) | – Other property, plant and equipment are primarily in Canada. |
17. Common stock repurchases
On June 2, 2014, our board of directors authorized the repurchase of up to $30.0 million of our common stock. The repurchase program will be funded by our available cash. During fiscal year 2016, we repurchased and retired 171,899 shares of common stock under this repurchase program for $13.7 million at an average purchase price of $79.66 per share. During fiscal year 2015, we repurchased and retired 176,611 shares of common stock under this repurchase program for $13.9 million at an average purchase price of $78.51 per share. During the fiscal year 2014, we repurchased 18,683 shares of common stock under this repurchase program for $1.4 million at an average purchase price of $76.22 per share. The cumulative shares that were repurchased and retired under the program were 367,193 shares of common stock for $29 million at an average price of $78.96 per share.
On May 26, 2016, our board of directors authorized the repurchase of up to $15.0 million of our common stock. No shares have been repurchased under this agreement.
18. Accumulated other comprehensive income (loss)
Components of comprehensive income include net income and certain transactions that have generally been reported in the Consolidated Statements of Changes in Stockholders’ Equity. Other comprehensive income consists of reported foreign currency translation gains and losses (net of taxes), actuarial gains and losses on pension plan assets (net of taxes), and changes in the unrealized value on foreign currency forward contracts (net of taxes). Deferred taxes are not provided on cumulative translation adjustments where we expect earnings of a foreign subsidiary to be indefinitely reinvested. The income tax effect of currency translation adjustments related to foreign subsidiaries that are not considered indefinitely reinvested is recorded as a component of deferred taxes with an offset to other comprehensive income.
101
Table of Contents
ANALOGIC CORPORATION
NOTES TO CONSOLIDATED FINANCIAL STATEMENTS – (Continued)
(in millions, except share and per share data)
The following table summarizes the components of accumulated other comprehensive income (loss):
| (in millions) | Unrealized Gain on Foreign Currency Forward Contracts |
Unrealized Losses on Pension Plan |
Currency Translation Adjustment |
Accumulated Other Comprehensive Income |
||||||||||||
| Balance as of July 31, 2013 |
$ | (0.1 | ) | $ | (2.3 | ) | $ | 11.5 | $ | 9.1 | ||||||
| Pre-tax change before reclassification to earnings |
— | (1.9 | ) | (0.2 | ) | (2.1 | ) | |||||||||
| Amount reclassified to earnings |
0.1 | 0.1 | — | 0.2 | ||||||||||||
| Income tax benefit (provision) |
— | 0.5 | 0.1 | 0.6 | ||||||||||||
| Balance as of July 31, 2014 |
— | (3.6 | ) | 11.4 | 7.8 | |||||||||||
| Pre-tax change before reclassification to earnings |
— | 0.9 | (12.4 | ) | (11.5 | ) | ||||||||||
| Amount reclassified to earnings |
(0.5 | ) | — | — | (0.5 | ) | ||||||||||
| Income tax benefit |
0.1 | (0.3 | ) | (0.1 | ) | (0.3 | ) | |||||||||
| Balance as of July 31, 2015 |
(0.4 | ) | (3.0 | ) | (1.1 | ) | (4.5 | ) | ||||||||
| Pre-tax change before reclassification to earnings |
— | (2.6 | ) | (2.3 | ) | (4.8 | ) | |||||||||
| Amount reclassified to earnings |
0.3 | 0.1 | — | 0.3 | ||||||||||||
| Income tax benefit (provision) |
(0.1 | ) | 0.6 | — | 0.5 | |||||||||||
| Balance as of July 31, 2016 |
$ | (0.2 | ) | $ | (4.9 | ) | $ | (3.4 | ) | $ | (8.5 | ) | ||||
The ineffective portion of the unrealized gains and losses on foreign currency forward contracts and realized gains or losses on currency translation is included in other income (expense) on our Consolidated Statement of Operations.
Realized gains and losses on the pension plan are included in general and administrative expenses on our Consolidated Statement of Operations.
19. Quarterly results of operations (unaudited)
The following is a summary of unaudited quarterly results of operations for fiscal years 2016 and 2015:
| Year 2016 | ||||||||||||||||
| (in millions, except per share data) | First Quarter |
Second Quarter |
Third Quarter |
Fourth Quarter |
||||||||||||
| Net revenue |
$ | 114.9 | $ | 127.9 | $ | 128.0 | $ | 138.1 | ||||||||
| Gross profit |
50.9 | 58.8 | 54.9 | 63.4 | ||||||||||||
| Net income (loss) |
1.4 | (3.0 | ) | 5.0 | 8.8 | |||||||||||
| Basic net income (loss) per share |
$ | 0.11 | $ | (0.24 | ) | $ | 0.40 | $ | 0.71 | |||||||
| Diluted net income (loss) per share |
$ | 0.11 | $ | (0.24 | ) | $ | 0.40 | $ | 0.70 | |||||||
| Year 2015 | ||||||||||||||||
| (in millions, except per share data) | First Quarter |
Second Quarter |
Third Quarter |
Fourth Quarter |
||||||||||||
| Net revenue |
$ | 118.3 | $ | 133.9 | $ | 133.6 | $ | 154.5 | ||||||||
| Gross profit |
52.0 | 57.5 | 56.0 | 64.0 | ||||||||||||
| Net income |
3.7 | 9.8 | 9.1 | 10.9 | ||||||||||||
| Basic net income per share |
$ | 0.29 | $ | 0.79 | $ | 0.73 | $ | 0.88 | ||||||||
| Diluted net income per share |
$ | 0.29 | $ | 0.78 | $ | 0.72 | $ | 0.86 | ||||||||
102
Table of Contents
ANALOGIC CORPORATION
NOTES TO CONSOLIDATED FINANCIAL STATEMENTS – (Continued)
(in millions, except share and per share data)
As discussed in Note 4. Restucturing charges, we recorded restructuring costs of $3.3 million, $3.1 million, $1.8 million, and $1.4 million, in the first quarter, second quarter, third quarter, and fourth quarter of fiscal year 2016, respectively, in association with the 2016 restructuring plan.
As discussed in Note 3. Business combination, during the second quarter of fiscal year 2016, we recorded acquisition related expense of $0.4 million, in association with the Oncura acquisition.
As discussed in Note 11. Commitments, guarantees and contingencies, during the second quarter of fiscal year 2016, we recorded a $10.1 million expenses related to our BK Medical matter.
As discussed in Note 13. Other income (expense), during the second quarter of fiscal year 2016, we recorded a $3.2 million interest charge related to our BK Medical matter.
As discussed in Note 15. Income taxes, during the second quarter of fiscal year 2016, we recognized a $1.5 million increase in uncertain tax positions primarily associated with the BK Medical matter.
As discussed in Note 3. Business combination, during the first quarter of fiscal year 2015, we recorded acquisition related expense of $0.1 million, in association with the Pathfinder acquisition.
As discussed in Note 15. Income taxes, during the third quarter of fiscal year 2015, we recognized a discrete tax benefit of $3.4 million reduction in uncertain tax positions primarily associated with the expiration of statute of limitations.
20. Subsequent events
On September 16, 2016, our Board of Directors declared a dividend of $0.10 per common share, which will be paid on October 12, 2016 to stockholders of record on October 1, 2016.
103
Table of Contents
SCHEDULE II — VALUATION AND QUALIFYING ACCOUNTS
(In millions)
| Balance at the beginning of Period |
Charged to Costs and Expenses |
Deductions | Balance at End of Period |
|||||||||||||
| Allowance for doubtful accounts |
||||||||||||||||
| For the Year ended July 31, 2016 |
$ | 1.2 | $ | 0.1 | $ | (0.3 | ) | $ | 1.0 | |||||||
| For the Year ended July 31, 2015 |
$ | 0.8 | $ | 0.4 | $ | — | $ | 1.2 | ||||||||
| For the Year ended July 31, 2014 |
$ | 0.6 | $ | 0.2 | $ | — | $ | 0.8 | ||||||||
| Balance at the beginning of Period |
Charged to Costs and Expenses |
Deductions | Balance at End of Period |
|||||||||||||
| Income Tax Valuation Allowance |
||||||||||||||||
| For the Year ended July 31, 2016 |
$ | 10.6 | $ | 0.9 | $ | — | $ | 11.5 | ||||||||
| For the Year ended July 31, 2015 |
$ | 6.6 | $ | 4.3 | $ | (0.3 | ) | $ | 10.6 | |||||||
| For the Year ended July 31, 2014 |
$ | 6.3 | $ | 0.4 | $ | (0.1 | ) | $ | 6.6 | |||||||
Changes in valuation allowance represents changes in Federal, state and foreign tax attributes for which we believe it is more likely than not that they will not be able to be utilized.
104
Table of Contents
| 2.5 | Arrangement Agreement, dated January 7, 2013, by and among Analogic Corporation, 8385998 Canada Inc., Ultrasonix Medical Corporation and Scott Ratushny, Ronald Pelzer and Laurent Pelissier, solely in their capacity as the representatives of Ultrasonix. | Exhibit 2.1 to the Company’s Current Report on Form 8-K filed on January 8, 2013. | ||||||
| 3.1 | Restated Articles of Organization, as amended | Exhibit 3.1 to the Company’s Current Report on Form 8-K filed on January 30, 2009 | ||||||
| 3.2 | By-laws, as amended | Exhibit 3.1 to the Company’s Current Report on Form 8-K filed on February 3, 2010 | ||||||
| * |
10.1 | Form of Indemnity Agreement | Exhibit 10.19 to the Company’s Annual Report on Form 10-K for the fiscal year ended July 31, 1987 | |||||
| * |
10.2 | Form of Indemnity Agreement for Directors and Executive Officers of Analogic Corporation | Exhibit 10.1 to the Company’s Current Report on Form 8-K filed on October 9, 2007 | |||||
| * |
10.3 | Key Employee Stock Bonus Plan dated March 14, 1983, as amended on January 27, 1988 | Exhibit 10.1 to the Company’s Quarterly Report on Form 10-Q for the three months ended January 31, 2006 | |||||
| * |
10.4 | Form of Restricted Stock Grant for Key Employee Stock Bonus Plan dated March 14, 1983, as amended on January 27, 1988 | Exhibit 10.23 to the Company’s Annual Report on Form 10-K for the fiscal year ended July 31, 2007 | |||||
| * |
10.5 | Amended and Restated Employee Stock Purchase Plan | Exhibit 99.2 to the Company’s Current Report on Form 8-K filed on January 27, 2014 | |||||
| * |
10.6 | Form of Annual Retainer Deferral Election under Amended and Restated Employee Stock Purchase Plan | Exhibit 10.2 to the Company’s Quarterly Report on Form 10-Q filed on December 10, 2013 | |||||
| * |
10.7 | Key Employee Incentive Stock Option Plan dated June 11, 1993, as amended October 12, 2000, November 16, 2001, and September 20, 2006 | Exhibit 10.7 to the Company’s Annual Report on Form 10-K for the fiscal year ended July 31, 2006 | |||||
| * |
10.8 | 1997 Non-Qualified Stock Option Plan for Non-Employee Directors dated January 31, 1997, as amended December 8, 2003 and September 20, 2006 | Exhibit 10.8 to the Company’s Annual Report on Form 10-K for the fiscal year ended July 31, 2006 | |||||
| * |
10.9 | Form of Stock Option Grant for 1997 Non-Qualified Stock Option Plan for Non-Employee Directors dated January 31, 1997, as amended December 8, 2003 and September 20, 2006 | Exhibit 10.29 to the Company’s Annual Report on Form 10-K for the fiscal year ended July 31, 2004 | |||||
| * |
10.10 | Key Employee Incentive Stock Option Plan dated June 11, 1998, as amended October 12, 2000, November 16, 2001, and September 20, 2006 | Exhibit 10.9 to the Company’s Annual Report on Form 10-K for the fiscal year ended July 31, 2006 | |||||
| * |
10.11 | Form of Stock Options Grant for Key Employee Incentive Stock Option Plan dated June 11, 1998, as amended October 12, 2000, November 16, 2001, and September 20, 2006 | Exhibit 10.30 to the Company’s Annual Report on Form 10-K for the fiscal year ended July 31, 2004 | |||||
105
Table of Contents
| * |
10.12 | Key Employee Stock Bonus Plan dated October 12, 2000, as amended March 11, 2003 | Appendix A to the Company’s Definitive Proxy Statement dated December 15, 2003 for the Company’s Annual Meeting of Stockholders held January 16, 2004 | |||||
| * |
10.13 | Form of Restricted Stock Grant for Key Employee Stock Bonus Plan dated October 12, 2000, as amended March 11, 2003 | Exhibit 10.31 to the Company’s Annual Report on Form 10-K for the fiscal year ended July 31, 2004 | |||||
| * |
10.14 | 2007 Stock Option Plan | Exhibit 10.1 to the Company’s Current Report on Form 8-K filed on February 2, 2007 | |||||
| * |
10.15 | Form of Stock Option Award Agreement for 2007 Stock Option Plan | Exhibit 10.3 to the Company’s Current Report on Form 8-K filed on February 2, 2007 | |||||
| * |
10.16 | 2007 Restricted Stock Plan | Exhibit 10.2 to the Company’s Current Report on Form 8-K filed on February 2, 2007 | |||||
| * |
10.17 | Form of Restricted Stock Award Agreement for 2007 Restricted Stock Plan used for awards granted prior to October 14, 2009 | Exhibit 10.4 to the Company’s Current Report on Form 8-K filed on February 2, 2007 | |||||
| * |
10.18 | Form of Restricted Stock Award Agreement for 2007 Restricted Stock Plan used for awards granted on October 14, 2009 | Exhibit 10.17 to the Company’s Annual Report on Form 10-K for the fiscal year ended July 31, 2010 | |||||
| * |
10.19 | Analogic Corporation Amended and Restated 2009 Stock Incentive Plan | Exhibit 99.1 to the Company’s Current Report on Form 8-K filed on January 27, 2014 | |||||
| * |
10.20 | Form of Performance-Based Restricted Stock Unit Award Agreement for the Analogic Corporation 2009 Stock Incentive Plan (used prior to September 9, 2013) | Exhibit 10.2 to the Company’s Current Report on Form 8-K filed on February 3, 2010 | |||||
| 10.21 | Form of Performance-Based Restricted Stock Unit Award Agreement for the Analogic Corporation 2009 Stock Incentive Plan (used subsequent to September 9, 2013) | Exhibit 99.1 to the Company’s Current Report on Form 8-K filed on September 13, 2013 | ||||||
| * |
10.22 | Form of Time-Based Restricted Stock Unit Agreement for 2009 Stock Incentive Plan (used prior to September 9, 2013) | Exhibit 10.3 to the Company’s Quarterly Report on Form 10-Q for the six months ended January 31, 2010 | |||||
| 10.23 | Form of Time-Based Restricted Stock Unit Agreement for 2009 Stock Incentive Plan (used subsequent to September 9, 2013) | Exhibit 99.2 to the Company’s Current Report on Form 8-K filed on September 13, 2013 | ||||||
| 10.24 | Restricted Stock Unit Agreement between Analogic Corporation and James Green dated March 8, 2013 | Exhibit 10.1 to the Company’s Quarterly Report on Form 10-Q for the six months ended January 31, 2013 | ||||||
| * |
10.25 | Form of Nonstatutory Stock Option Agreement for 2009 Stock Incentive Plan (used prior to September 9, 2013) | Exhibit 10.2 to the Company’s Quarterly Report on Form 10-Q for the three months ended October 31, 2011 | |||||
| 10.26 | Form of Nonstatutory Stock Option Agreement for 2009 Stock Incentive Plan (used subsequent to September 9, 2013) | Exhibit 99.3 to the Company’s Current Report on Form 8-K filed on September 13, 2013 | ||||||
106
Table of Contents
| * |
10.27 | Amended and Restated Non-Employee Director Stock Plan | Appendix B to the Company’s Definitive Proxy Statement dated November 25, 2011 for the Company’s Annual Meeting of Stockholders held January 23, 2012 | |||||
| * |
10.28 | Nonqualified Deferred Compensation Plan | Exhibit 10.1 to the Company’s Current Report on Form 8-K filed on August 14, 2008 | |||||
| * |
10.29 | Non-Qualified Stock Option Program for Non-Employee Directors | Exhibit 10.1 to the Company’s Quarterly Report on Form 10-Q for the nine months ended April 30, 2012 | |||||
| * |
10.30 | Form of Nonstatutory Stock Option Agreement for Non-Employee Directors for 2009 Stock Incentive Plan | Exhibit 10.2 to the Company’s Quarterly Report on Form 10-Q for the nine months ended April 30, 2012 | |||||
| * |
10.31 | Form of Notice to Executive Officers (at Vice President or higher level) Regarding the Fiscal Year 2014 Annual Incentive Plan | Exhibit 10.1 to the Company’s Quarterly Report on Form 10-Q filed on December 10, 2013 | |||||
| * |
10.32 | 2014 Annual Incentive Plan | Exhibit 99.3 to the Company’s Current Report on Form 8-K filed on January 27, 2014 | |||||
| * |
10.33 | Analogic 401(k) Plan (January 1, 2007 Restatement) | Exhibit 10.22 to the Company’s Annual Report on Form 10-K for the fiscal year ended July 31, 2007 | |||||
| * |
10.40 | Letter Agreement between Analogic Corporation and Mervat Faltas, dated March 31, 2010 and accepted and agreed to by Ms. Faltas on April 29, 2010 | Exhibit 10.2 to the Company’s Quarterly Report on Form 10-Q for the three months ended January 31, 2011 | |||||
| * |
10.41 | Letter Agreement between Analogic Corporation and James Green, dated April 20, 2007 and accepted and agreed to by Mr. Green on May 1, 2007 | Exhibit 10.1 to the Company’s Current Report on Form 8-K filed on May 7, 2007 | |||||
| * |
10.42 | Amendment, dated December 24, 2008, to the Letter Agreement between Analogic Corporation and James Green, dated April 20, 2007 | Exhibit 10.2 to the Company’s Quarterly Report on Form 10-Q for the three months ended January 31, 2009 | |||||
| * |
10.43 | Letter Agreement, dated as of November 23, 2007, between Analogic Corporation and Bernard M. Gordon | Exhibit 10.1 to the Company’s Current Report on Form 8-K filed on November 29, 2007 | |||||
| * |
10.44 | Letter Agreement between Analogic Corporation and John J. Fry, dated October 29, 2007 and accepted and agreed to by Mr. Fry on October 30, 2007 | Exhibit 10.3 to the Company’s Quarterly Report on Form 10-Q for the three months ended October 31, 2007 | |||||
| * |
10.45 | Amendment, dated December 24, 2008, to Letter Agreement between Analogic Corporation and John J. Fry, dated October 29, 2007 | Exhibit 10.3 to the Company’s Quarterly Report on Form 10-Q for the three months ended January 31, 2009 | |||||
| * |
10.46 | Form of Change of Control Agreement for Certain Executive Officers of Analogic Corporation | Exhibit 10.1 to the Company’s Current Report on Form 8-K filed on May 24, 2007 | |||||
107
Table of Contents
| * |
10.47 | Incumbent Director Resignation Policy | Appendix C to the Company’s Definitive Proxy Statement dated November 28, 2008 for the Company’s Annual Meeting of Stockholders held January 26, 2009 | |||||
| * |
10.48 | Severance Plan for Management Employees, as Amended and Restated, effective as of December 31, 2008 | Exhibit 10.4 to the Company’s Quarterly Report on Form 10-Q for the three months ended January 31, 2009 | |||||
| 10.55 | Form of Notice to Executive Officers (at Vice President or higher level) Regarding the Fiscal Year 2015 Annual Incentive Plan | Exhibit 10.1 to the Company’s Quarterly Report on Form 10-Q filed on December 10, 2014 | ||||||
| 10.56 | Form of Annual Retainer Deferral Election | Exhibit 10.2 to the Company’s Quarterly Report on Form 10-Q filed on December 10, 2014 | ||||||
| 10.57 | Amended and Restated 1997 Non-Qualified Stock Option Plan for Non-Employee Directors | Exhibit 10.1 to the Company’s Quarterly Report on Form 10-Q filed on March 11, 2015 | ||||||
| * |
10.58 | Letter Agreement between Analogic Corporation and Michael Bourque, dated September 24, 2015 and accepted and agreed to by Mr. Bourque on September 24, 2015. | Exhibit 10.58 to the Company’s Annual Report on Form 10-K to the fiscal year ended July 31,2015 | |||||
| * |
10.59 | Employment Agreement, dated November 5, 2015, between Analogic Corporation and Mark T. Frost | Exhibit 10.1 to the Company’s Current Report on Form 8-K filed on November 09, 2015 | |||||
| 10.60 | Form of Notice to Executive Officers (at Vice President or higher level) Regarding the Fiscal Year 2016 Annual Incentive Plan | Exhibit 10.1 to the Company’s Quarterly Report on Form 10-Q filed on December 9, 2015 | ||||||
| 10.61 | Form of Annual Retainer Deferral Election | Exhibit 10.2 to the Company’s Quarterly Report on Form 10-Q filed on December 9, 2015 | ||||||
| 10.62 | Credit Agreement by and among Analogic Corporation, the financial institutions identified therein as lenders, JPMorgan Chase Bank, N.A., as Administrative Agent dated November 23, 2015 | Exhibit 10.1 to the Company’s Current Report on Form 8-K filed on November 30, 2015 | ||||||
| 21 | List of Subsidiaries | |||||||
| 23.1 | Consent of Ernst & Young LLP, independent registered public accounting firm | |||||||
| 23.2 | Consent of PricewaterhouseCoopers LLP, independent registered public accounting firm | |||||||
| 31.1 | Certification of Chief Executive Officer pursuant to Rule 13a-14(a)/Rule 15d-14(a) of the Securities Exchange Act of 1934, as amended | |||||||
| 31.2 | Certification of Chief Financial Officer pursuant to Rule 13a-14(a)/Rule 15d-14(a) of the Securities Exchange Act of 1934, as amended | |||||||
108
Table of Contents
| 32.1 | Certification of Chief Executive Officer pursuant to 18 U.S.C. Section 1350, as adopted pursuant to Section 906 of the Sarbanes-Oxley Act of 2002 | |||||||
| 32.2 | Certification of Chief Financial Officer pursuant to 18 U.S.C. Section 1350, as adopted pursuant to Section 906 of the Sarbanes-Oxley Act of 2002 | |||||||
| ** |
101.INS | XBRL Instance Document. | ||||||
| ** |
101.SCH | XBRL Taxonomy Extension Schema Document. | ||||||
| ** |
101.CAL | XBRL Taxonomy Calculation Linkbase Document. | ||||||
| ** |
101.LAB | XBRL Taxonomy Label Linkbase Document. | ||||||
| ** |
101.PRE | XBRL Taxonomy Presentation Linkbase Document. | ||||||
| ** |
101.DEF | XBRL Taxonomy Extension Definition Linkbase Document. | ||||||
| * | Management contract or compensatory plan or arrangement |
| ** | Submitted electronically herewith |
Attached as Exhibit 101 to this report are the following formatted in XBRL (Extensible Business Reporting Language): (i) Consolidated Balance Sheets at July 31, 2016 and July 31, 2015, (ii) Consolidated Statements of Operations for the years ended July 31, 2016, 2015, and 2014, (iii) Consolidated Statements of Comprehensive Income for the years ended July 31, 2016, 2015 and 2014, (iv) Consolidated Statements of Changes in Stockholders’ Equity for the years ended July 31, 2016, 2015 and 2014, (v) Consolidated Statements of Cash Flows for the years ended July 31, 2016, 2015 and 2014, and (vi) Notes to Consolidated Financial Statements.
109