Attached files
| file | filename |
|---|---|
| 8-K - 8-K - WEST PHARMACEUTICAL SERVICES INC | sept262016form8k.htm |
| EX-99.1 - EXHIBIT 99.1 - WEST PHARMACEUTICAL SERVICES INC | exh991sept262016pressrelea.htm |

West Pharmaceutical Services, Inc.
September 2016

Cautionary Statement Under the Private Securities Litigation Reform Act of 1995
This slide presentation and any accompanying management commentary contain “forward-looking statements” as that term is defined in the Private Securities
Litigation Reform Act of 1995. Such statements include, but are not limited to, statements about product development and operational performance.
Each of these statements is based on preliminary information, and actual results could differ from any preliminary estimates. We caution investors that the risk
factors listed under “Cautionary Statement” in our press releases, as well as those set forth under the caption "Risk Factors" in our most recent Annual Report
on Form 10-K as filed with the Securities and Exchange Commission and as revised or supplemented by our quarterly reports on Form 10-Q, could cause our
actual results to differ materially from those estimated or predicted in the forward-looking statements. You should evaluate any statement in light of these
important factors. Except as required by law or regulation, we undertake no obligation to publicly update any forward-looking statements, whether as a result
of new information, future events, or otherwise.
Non-U.S. GAAP Financial Measures
Certain financial measures included in these presentation materials, or which may be referred to in management’s discussion of the Company’s results and
outlook, have not been calculated in accordance with U.S. generally accepted accounting principles (“U.S. GAAP”), and therefore are referred to as non-
GAAP financial measures. Non-GAAP financial measures should not be considered in isolation or as an alternative to such measures determined in
accordance with GAAP. Please refer to “Reconciliation of Non-GAAP Measures” at the end of these materials for more information.
Trademarks
Registered trademarks used in this report are the property of West Pharmaceutical Services, Inc. or its subsidiaries, in the United States and other
jurisdictions, unless noted otherwise. Daikyo Crystal Zenith® and Flurotec® are trademarks or registered trademarks, and are licensed from of Daikyo Seiko,
Ltd. Repatha® is a registered trademark of Amgen, Inc.
Safe harbor statement
2
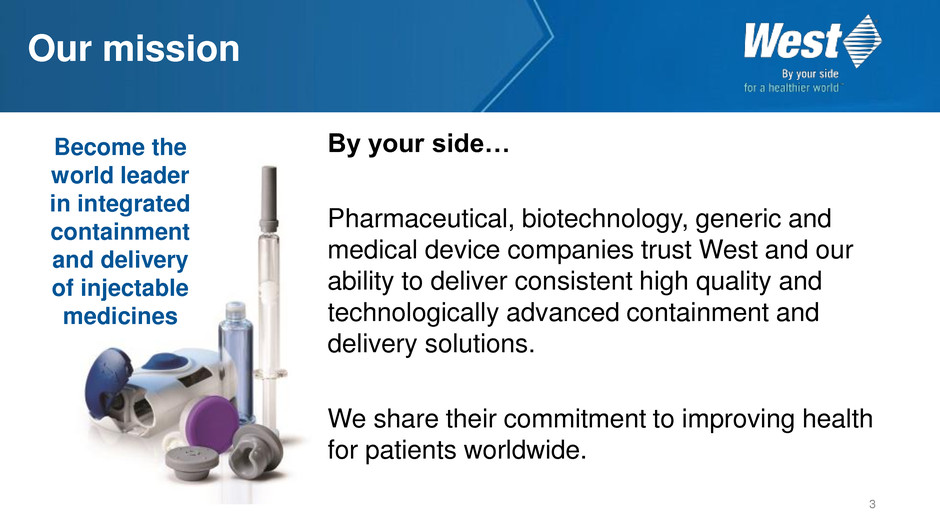
By your side…
Pharmaceutical, biotechnology, generic and
medical device companies trust West and our
ability to deliver consistent high quality and
technologically advanced containment and
delivery solutions.
We share their commitment to improving health
for patients worldwide.
Our mission
3
Become the
world leader
in integrated
containment
and delivery
of injectable
medicines

4
Injectable market
$284 Billion
of Annual
Drug Sales
$7- 8 Billion
Containment &
Delivery Product Sales
Source: IMS and Company estimates

An integral part of the
healthcare industry
Top 35
Injectable biologics
rely on West and
Daikyo components
~ 40 Billion
Components
manufactured
annually
Top 75
Supplier to the top 75
pharmaceutical & biotech
injectable companies
5

2015 Sales
$1.4 billion
2015 Sales
$1.4 billion
2015 Net Sales
by Geography
West business – at a glance
7%
39%
33%
21%
Americas
Europe, Middle East, Africa
Asia Pacific
2015 Net Sales
by Category
53% 40%
7%
High-Value Components
Standard Packaging
Delivery Devices
Contract Manufacturing
P
RO
P
RI
E
T
A
R
Y
P
RO
D
U
C
T
S
6

Proprietary Products
Stoppers
Seals
Caps
Syringe Components
Daikyo CZ Vials & Syringes
Reconstitution Systems
Self-Injection Devices
West’s role in delivering
medicines to patients
Contract-Manufactured
Products
Program Management
Injection Molding
High-volume Integrated
Assemblies
Quality Systems
$0.3B
$1.1B
~8,000
product
SKU’s
7
%
%
%
%
%
%
%
%
%
2011 2012 2013 2014 2015
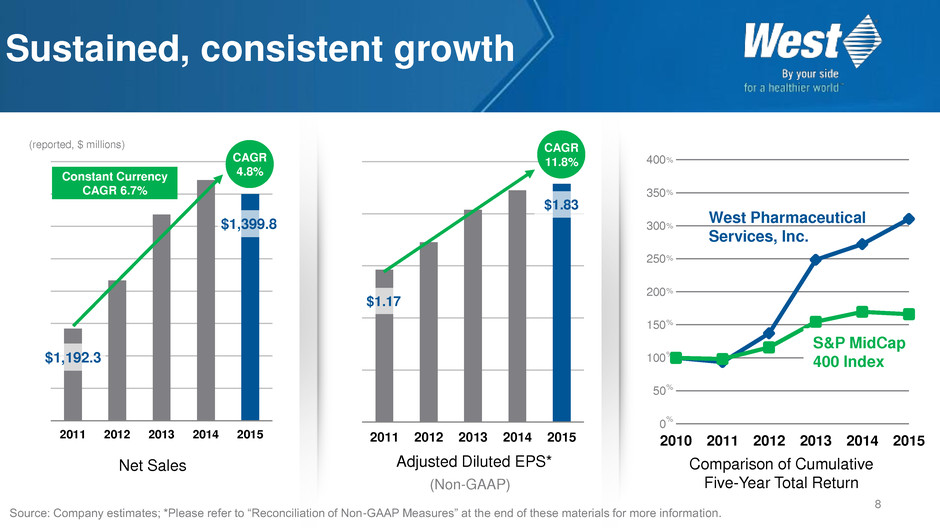
Net Sales
Sustained, consistent growth
8
2011 2012 2013 2014 2015
Adjusted Diluted EPS*
(reported, $ millions)
CAGR
4.8%
$1,192.3
$1,399.8
CAGR
11.8%
$1.17
$1.83
(Non-GAAP)
Constant Currency
CAGR 6.7%
Comparison of Cumulative
Five-Year Total Return
0
50
100
150
200
250
300
350
400
2010 2011 2012 2013 2014 2015
S&P MidCap
400 Index
West Pharmaceutical
Services, Inc.
Source: Company estimates; *Please refer to “Reconciliation of Non-GAAP Measures” at the end of these materials for more information.
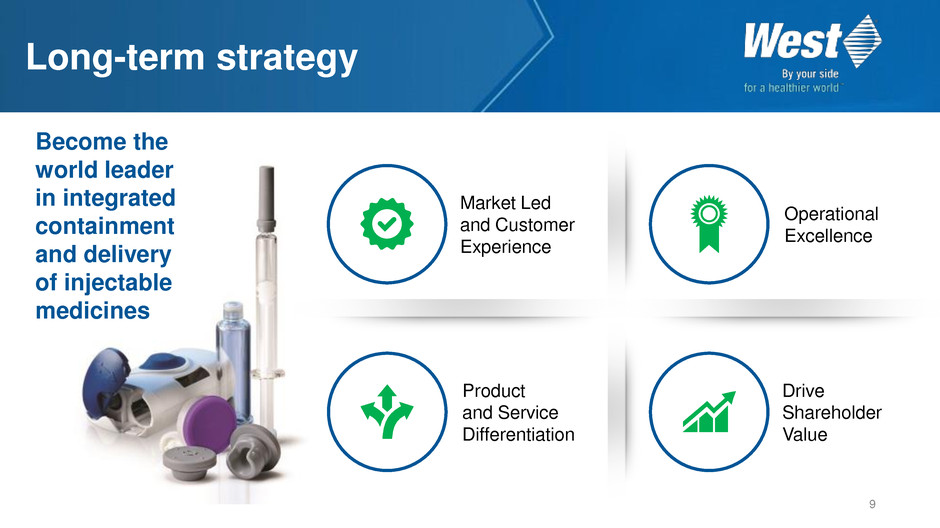
Long-term strategy
9
Market Led
and Customer
Experience
Operational
Excellence
Product
and Service
Differentiation
Drive
Shareholder
Value
Become the
world leader
in integrated
containment
and delivery
of injectable
medicines
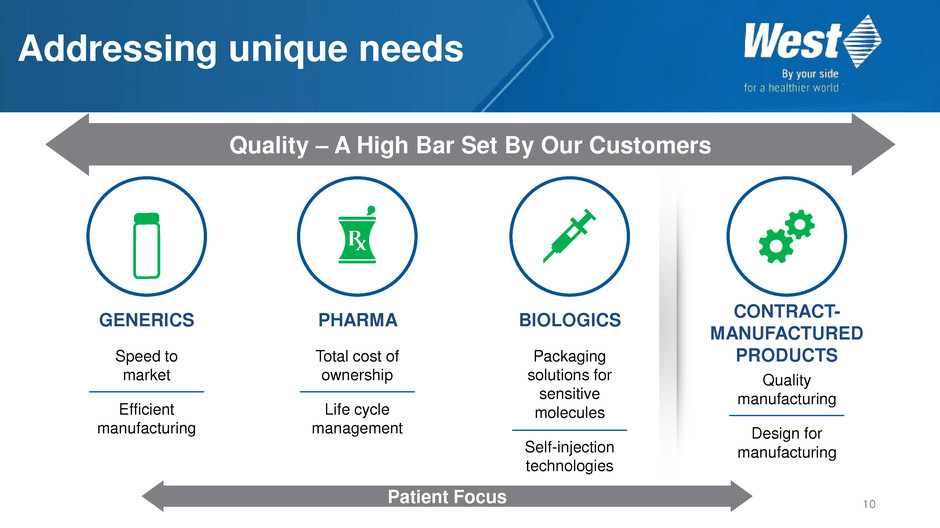
Addressing unique needs
10
Quality – A High Bar Set By Our Customers
GENERICS
Speed to
market
Efficient
manufacturing
BIOLOGICS
Packaging
solutions for
sensitive
molecules
Self-injection
technologies
PHARMA
Total cost of
ownership
Life cycle
management
Quality
manufacturing
Design for
manufacturing
CONTRACT-
MANUFACTURED
PRODUCTS
Patient Focus
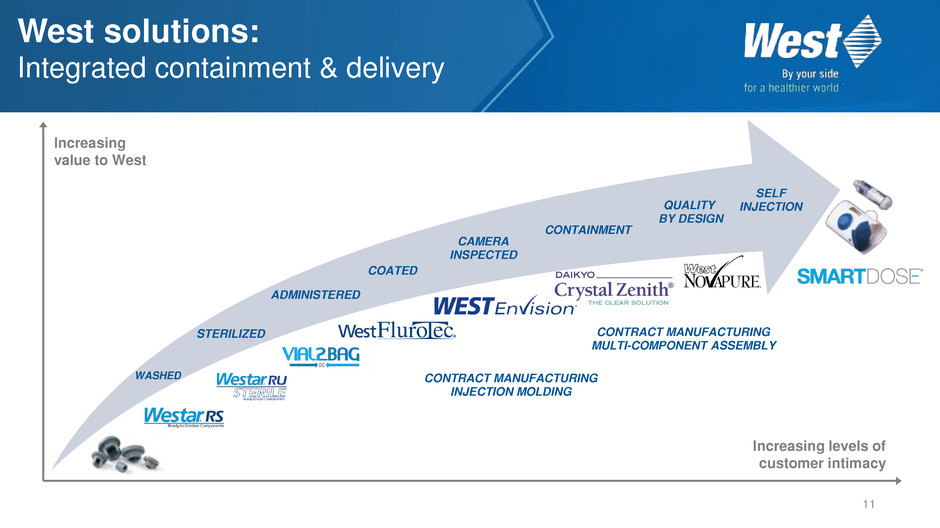
West solutions:
Integrated containment & delivery
11
Increasing levels of
customer intimacy
Increasing
value to West
STERILIZED
WASHED
COATED
ADMINISTERED
CAMERA
INSPECTED
QUALITY
BY DESIGN
CONTAINMENT
SELF
INJECTION
CONTRACT MANUFACTURING
INJECTION MOLDING
CONTRACT MANUFACTURING
MULTI-COMPONENT ASSEMBLY

Circles reflect relative size of 2015 net sales
Standard
Packaging
High-Value
Components
0%
5%
10%
15%
20%
0% 30% 60%
2015 Category Gross Margin %
Proprietary
Devices
Contract
Manufacturing
2015 GM 32.6%
5-Yr Sales CAGR 6.7%
Product net sales & margin growth
2011-2015 compound annual net sales growth rates
(excludes currency)
> High-Value
components have
driven growth
> Proprietary devices
present significant
growth opportunity
> Steady Contract
Manufacturing
and standard
packaging businesses
5
-Y
ear
C
AG
R
12
0%
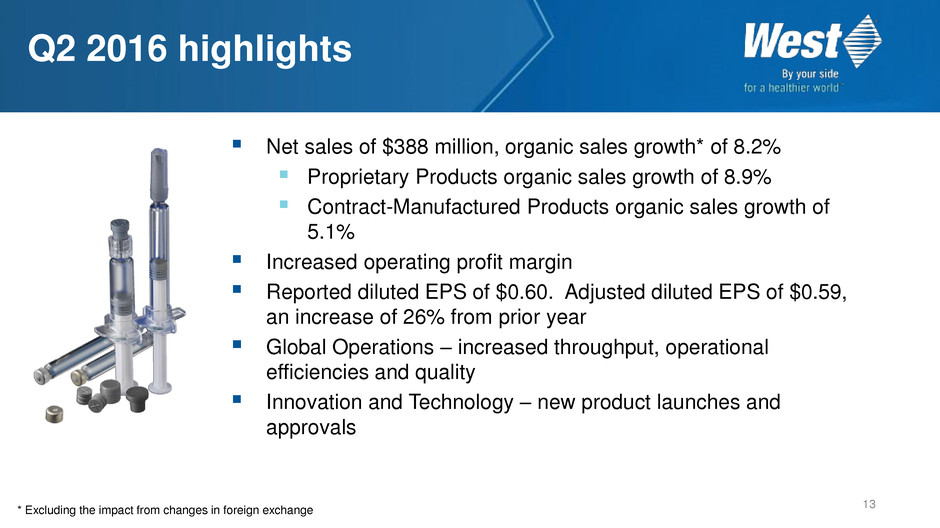
Net sales of $388 million, organic sales growth* of 8.2%
Proprietary Products organic sales growth of 8.9%
Contract-Manufactured Products organic sales growth of
5.1%
Increased operating profit margin
Reported diluted EPS of $0.60. Adjusted diluted EPS of $0.59,
an increase of 26% from prior year
Global Operations – increased throughput, operational
efficiencies and quality
Innovation and Technology – new product launches and
approvals
Q2 2016 highlights
13
* Excluding the impact from changes in foreign exchange
14
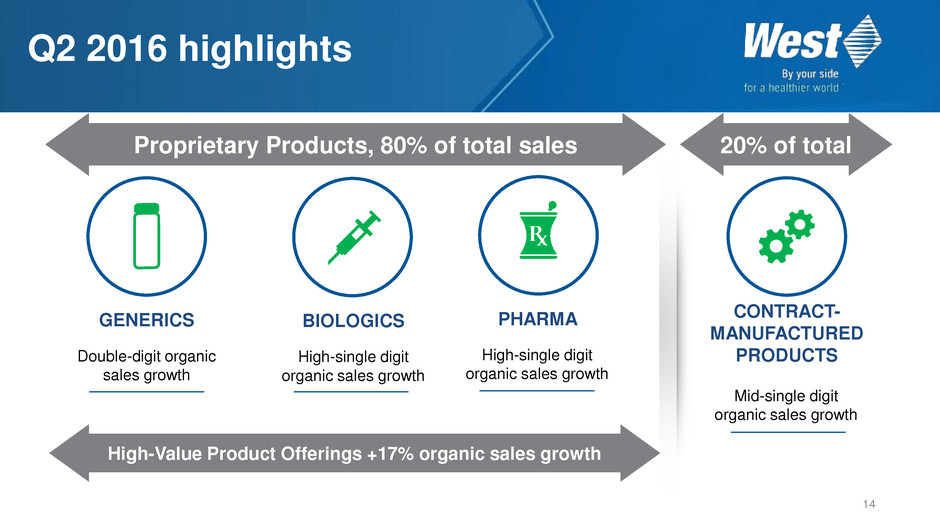
Proprietary Products, 80% of total sales
GENERICS
Double-digit organic
sales growth
BIOLOGICS
High-single digit
organic sales growth
PHARMA
High-single digit
organic sales growth
Mid-single digit
organic sales growth
CONTRACT-
MANUFACTURED
PRODUCTS
Q2 2016 highlights
20% of total
High-Value Product Offerings +17% organic sales growth
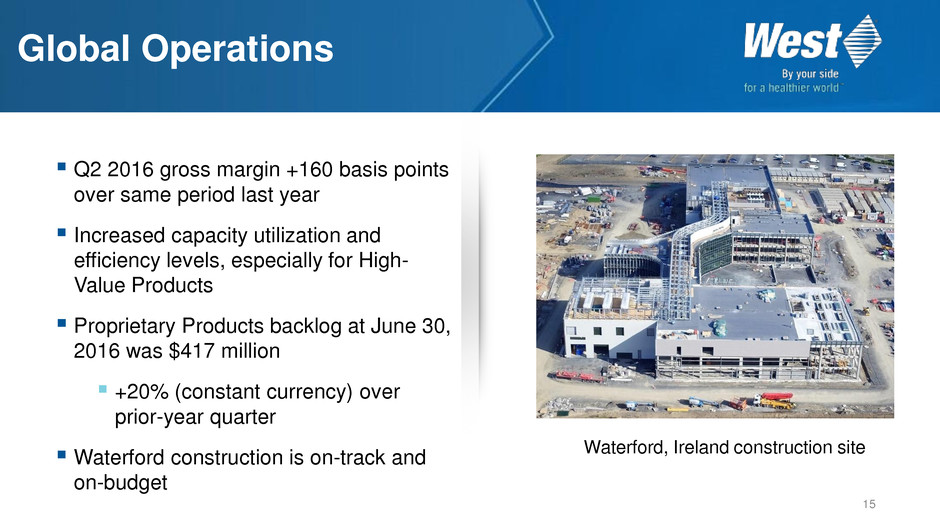
Global Operations
Q2 2016 gross margin +160 basis points
over same period last year
Increased capacity utilization and
efficiency levels, especially for High-
Value Products
Proprietary Products backlog at June 30,
2016 was $417 million
+20% (constant currency) over
prior-year quarter
Waterford construction is on-track and
on-budget
15
Waterford, Ireland construction site

SmartDose® technology
developments
First commercial approval
Selected by Amgen for
Repatha® monthly single dosing
FDA approval in July
Multiple active programs in
place with additional customers
Next-generation technology in
development
16

17
Engineered for
Multiple Injection
Modalities
Designed for
Biologics
Developed for
Quality Risk
Management
Launched
1-3mL NovaPure® Plunger

2016 full-year guidance
($ millions, except EPS - Non-GAAP) (1) (2)
18
Estimated
2016 Revenue
Estimated Gross
Profit %
Proprietary Products $1,195 - $1,200 37.9% to 38.4%
Contract-Manufactured Products $310 - $320 17.1% to 17.6%
Consolidated $1,505 - $1,520 33.6% to 34.0 %
Est. Capital Spending $150 - $175
Est. Adjusted Diluted EPS (1) $2.15 to $2.25 per share
Est. Reported Diluted EPS (1) (2) $1.79 to $1.99 per share
(1)
Guidance includes various currency exchange rate assumptions, most significantly the euro at $1.12 for the remainder of 2016.
Actual results will vary as a result of variability of exchange rates, among other items.
(2)
Estimated reported diluted EPS includes estimated restructuring charges of $0.23 to $0.28 per share and estimated Venezuela currency
devaluation charge of $0.03 to $0.08 per share.
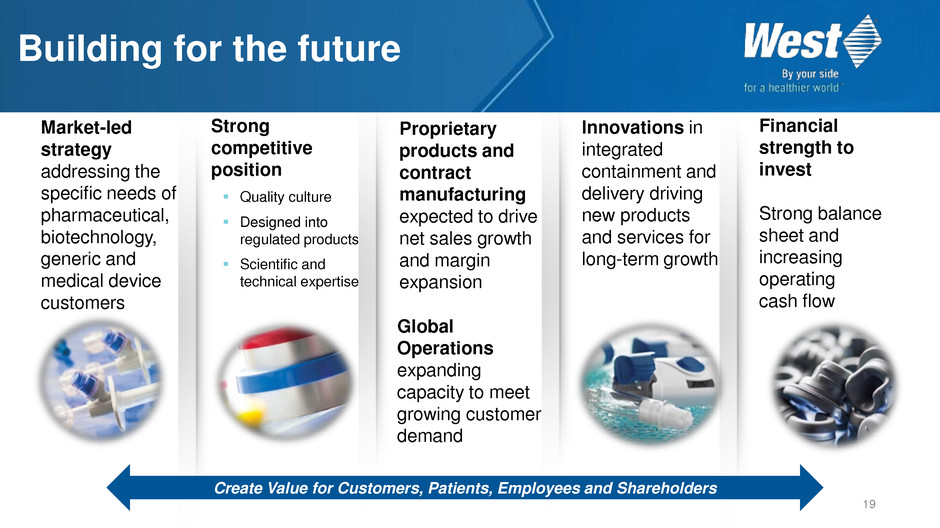
Building for the future
Market-led
strategy
addressing the
specific needs of
pharmaceutical,
biotechnology,
generic and
medical device
customers
Strong
competitive
position
Quality culture
Designed into
regulated products
Scientific and
technical expertise
Global
Operations
expanding
capacity to meet
growing customer
demand
Proprietary
products and
contract
manufacturing
expected to drive
net sales growth
and margin
expansion
Financial
strength to
invest
Strong balance
sheet and
increasing
operating
cash flow
19
Innovations in
integrated
containment and
delivery driving
new products
and services for
long-term growth
Create Value for Customers, Patients, Employees and Shareholders
Create Value for Customers, Patients, Employees and Shareholders
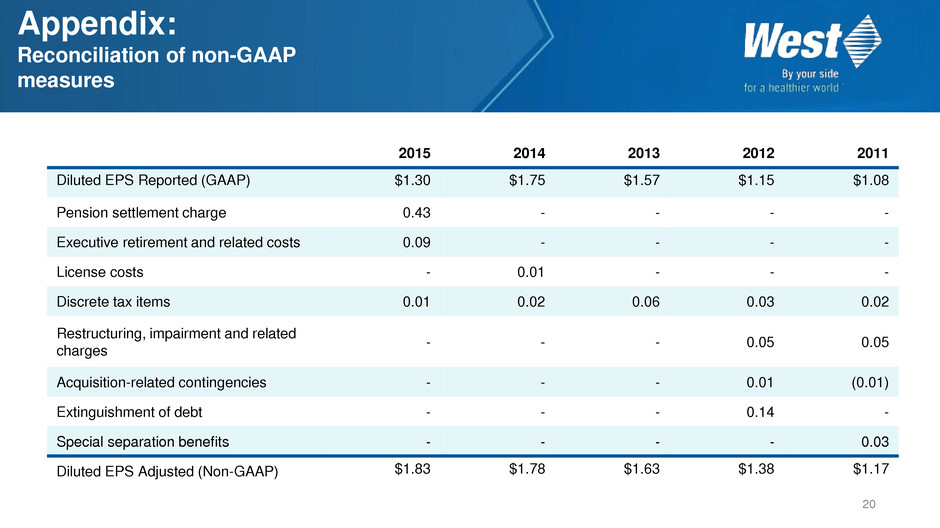
Appendix:
Reconciliation of non-GAAP
measures
20
2015 2014 2013 2012 2011
Diluted EPS Reported (GAAP) $1.30 $1.75 $1.57 $1.15 $1.08
Pension settlement charge 0.43 - - - -
Executive retirement and related costs 0.09 - - - -
License costs - 0.01 - - -
Discrete tax items 0.01 0.02 0.06 0.03 0.02
Restructuring, impairment and related
charges
- - - 0.05 0.05
Acquisition-related contingencies - - - 0.01 (0.01)
Extinguishment of debt - - - 0.14 -
Special separation benefits - - - - 0.03
Diluted EPS Adjusted (Non-GAAP) $1.83 $1.78 $1.63 $1.38 $1.17

($ million, except EPS data)
Reconciliation of Reported and Adjusted Operating Profit, Net Income and Diluted EPS
21
Three months ended June 30, 2016
Operating
profit
Income
tax
expense
Net
income
Diluted
EPS
Reported (GAAP) $61.2 $17.0 $44.7 $0.60
Restructuring and related charges (1.5) (0.5) (1.0) (0.01)
Venezuela currency devaluation - (0.2) 0.2 -
Adjusted (Non-GAAP) $59.7 $16.3 $43.9 $0.59
Six months ended June 30, 2016
Operating
profit
Income
tax
expense
Net
income
Diluted
EPS
Reported (GAAP) $91.2 $23.9 $66.9 $0.90
Restructuring and related charges 21.4 7.4 14.0 0.19
Venezuela currency devaluation 2.7 - 2.7 0.03
Adjusted (Non-GAAP) $115.3 $31.3 $83.6 $1.12
Appendix:
Reconciliation of non-GAAP
measures

($ million, except EPS data)
Reconciliation of Net Sales to Net Sales at Constant Currency(1)
(1) Net sales at constant currency translates the current-period reported sales of subsidiaries whose functional currency is other
than the U.S. dollar at the applicable foreign exchange rates in effect during the comparable prior-year period.
22
Three months ended June 30, 2016 Proprietary CM Eliminations Total
Reported net sales (GAAP) $311.0 $77.2 $(0.2) $388.0
Effect of changes in currency translation rates 1.5 (0.3) - 1.2
Net sales at constant currency (Non-GAAP)(1) $312.5 $76.9 $(0.2) $389.2
Six months ended June 30, 2016 Proprietary CM Eliminations Total
Reported net sales (GAAP) $601.8 $148.8 $(0.5) $750.1
Effect of changes in currency translation rates 10.4 (0.2) - 10.2
Net sales at constant currency (Non-GAAP)(1) $612.2 $148.6 $(0.5) $760.3
Appendix:
Reconciliation of non-GAAP
measures
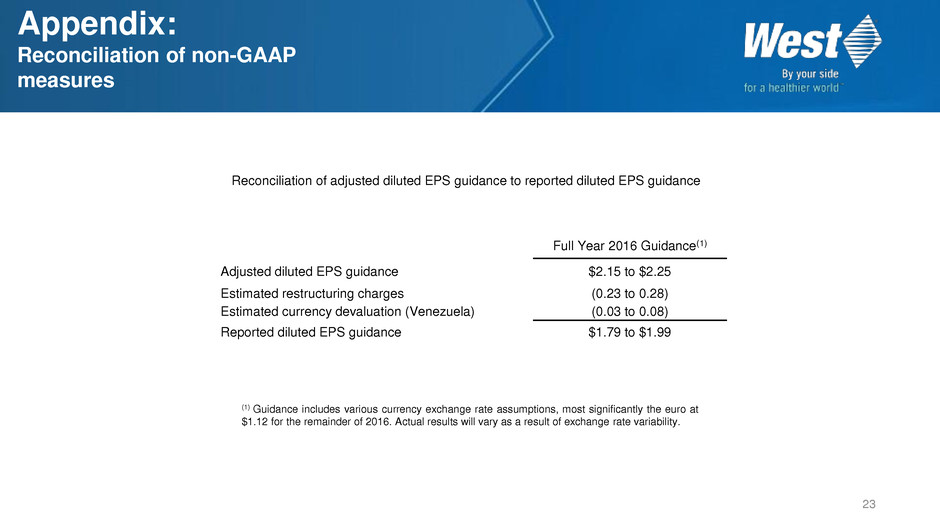
(1) Guidance includes various currency exchange rate assumptions, most significantly the euro at
$1.12 for the remainder of 2016. Actual results will vary as a result of exchange rate variability.
Reconciliation of adjusted diluted EPS guidance to reported diluted EPS guidance
23
Full Year 2016 Guidance(1)
Adjusted diluted EPS guidance $2.15 to $2.25
Estimated restructuring charges
Estimated currency devaluation (Venezuela)
(0.23 to 0.28)
(0.03 to 0.08)
Reported diluted EPS guidance $1.79 to $1.99
Appendix:
Reconciliation of non-GAAP
measures
