Attached files
| file | filename |
|---|---|
| EX-23.2 - EX-23.2 - Advanced Disposal Services, Inc. | a2229759zex-23_2.htm |
| EX-3.1 - EX-3.1 - Advanced Disposal Services, Inc. | a2229759zex-3_1.htm |
Use these links to rapidly review the document
TABLE OF CONTENTS
INDEX TO CONSOLIDATED FINANCIAL STATEMENTS
As filed with the Securities and Exchange Commission on September 26, 2016
Registration No. 333-206508
UNITED STATES
SECURITIES AND EXCHANGE COMMISSION
Washington, D.C. 20549
Amendment No. 7
to
Form S-1
REGISTRATION STATEMENT
UNDER
THE SECURITIES ACT OF 1933
Advanced Disposal Services, Inc.
(Exact name of registrant as specified in its charter)
(formerly known as ADS Waste Holdings, Inc.)
| Delaware (State or other jurisdiction of incorporation or organization) |
4953 (Primary Standard Industrial Classification Code Number) |
90-0875845 (I.R.S. Employer Identification Number) |
90 Fort Wade Road
Ponte Vedra, Florida 32081
(904) 737-7900
(Address, Including Zip Code, and Telephone Number, Including Area Code, of Registrant's Principal Executive Offices)
Michael K. Slattery, Esq.
General Counsel
Advanced Disposal Services, Inc.
90 Fort Wade Road
Ponte Vedra, FL 32081
(904) 737-7900
(Name, Address, Including Zip Code, and Telephone Number, Including Area Code, of Agents For Service)
| With a copy to: | ||
Richard B. Alsop Jonathan M. DeSantis Shearman & Sterling LLP 599 Lexington Avenue New York, New York 10022-6069 (212) 848-4000 |
Kirk A. Davenport II Erika L. Weinberg Latham & Watkins LLP 885 Third Avenue New York, New York 10022-4834 (212) 906-1200 |
|
Approximate date of commencement of proposed sale to the public:
As soon as practicable after this registration statement becomes effective.
If the securities being registered on this Form are to be offered on a delayed or continuous basis pursuant to Rule 415 under the Securities Act of 1933 check the following box. o
If this Form is filed to register additional securities for an offering pursuant to Rule 462(b) under the Securities Act, please check the following box and list the Securities Act registration statement number of the earlier effective registration statement for the same offering. o
If this Form is a post-effective amendment filed pursuant to Rule 462(c) under the Securities Act, check the following box and list the Securities Act registration statement number of the earlier effective registration statement for the same offering. o
If this Form is a post-effective amendment filed pursuant to Rule 462(d) under the Securities Act, check the following box and list the Securities Act registration statement number of the earlier effective registration statement for the same offering. o
Indicate by check mark whether the registrant is a large accelerated filer, an accelerated filer, a non-accelerated filer, or a smaller reporting company. See the definitions of "large accelerated filer," "accelerated filer" and "smaller reporting company" in Rule 12b-2 of the Exchange Act.
| Large accelerated filer o | Accelerated filer o | Non-accelerated filer ý (Do not check if a smaller reporting company) |
Smaller reporting company o |
CALCULATION OF REGISTRATION FEE
| Title of Each Class of Securities to be Registered |
Proposed Maximum Aggregate Offering Price (1) (2) |
Amount of Registration Fee (3) |
||
|---|---|---|---|---|
| Common stock, par value $0.01 per share | $465,000,000 | $46,825.50 | ||
- (1)
- Estimated
solely for the purpose of calculating the registration fee pursuant to Rule 457(o) under the Securities Act of 1933, as amended. Includes
offering price of additional shares that the underwriters have the option to purchase. See "Underwriting."
- (2)
- Includes
shares of common stock subject to the underwriters' option to purchase additional shares of common stock.
- (3)
- The registrant previously paid a registration fee of $53,170.
The registrant hereby amends this registration statement on such date or dates as may be necessary to delay its effective date until the registrant shall file a further amendment which specifically states that this registration statement shall thereafter become effective in accordance with Section 8(a) of the Securities Act of 1933, or until the registration statement shall become effective on such date as the Commission, acting pursuant to said Section 8(a), may determine.
The information in this preliminary prospectus is not complete and may be changed. We may not sell these securities until the registration statement filed with the Securities and Exchange Commission is effective. This preliminary prospectus is not an offer to sell these securities, and we are not soliciting offers to buy these securities in any state where the offer or sale is not permitted.
Subject to Completion, Dated September 26, 2016
Advanced Disposal Services, Inc.

19,250,000 Shares
Common Stock
This is Advanced Disposal Services, Inc.'s initial public offering. We are selling 19,250,000 shares of our common stock. We expect the public offering price to be between $18.00 and $21.00. Prior to this offering, there has been no public market for our common stock. Our common stock has been approved for listing on the New York Stock Exchange under the symbol ADSW.
After the completion of this offering, affiliates of Highstar Capital LP may continue to own a majority of the voting power of shares eligible to vote in the election of our directors. As a result, we may be a "controlled company" within the meaning of the corporate governance standards of the New York Stock Exchange. See "Risk Factors" and "Management—Controlled Company."
Investing in our common stock involves risks. See "Risk Factors" beginning on page 20 to read about factors you should consider before buying our common stock.
Neither the Securities and Exchange Commission nor any state securities commission has approved or disapproved of these securities or passed upon the adequacy or the accuracy of this prospectus. Any representation to the contrary is a criminal offense.
| |
Price to Public |
Underwriting Discounts and Commissions (1) |
Proceeds, before expenses, to the Company |
|||
|---|---|---|---|---|---|---|
Per Share |
$ | $ | $ | |||
Total |
$ | $ | $ |
- (1)
- The underwriters will receive compensation in addition to the underwriting discount. See "Underwriting."
The underwriters have the option to purchase up to an additional 2,887,500 shares from the Company, at the initial public offering price, less the underwriting discounts and commissions.
The underwriters expect to deliver the shares of common stock to purchasers on or about , 2016.
| Deutsche Bank Securities | Credit Suisse | Barclays |
| UBS Investment Bank | ||||||
BofA Merrill Lynch |
Macquarie Capital |
Morgan Stanley |
Stifel |
|||
| SMBC Nikko | First Analysis Securities Corp. |
Prospectus dated , 2016
You should rely only upon the information contained in this prospectus or in any free writing prospectus prepared by or on behalf of us. None of us or the underwriters have authorized anyone to provide you with additional or different information. If anyone provides you with additional, different or inconsistent information, you should not rely on it. If you are in a jurisdiction where offers to sell, or solicitations of offers to purchase, shares of our common stock are unlawful, or if you are a person to whom it is unlawful to direct these types of activities, then the offer presented in this document does not extend to you. You should assume the information appearing in this prospectus is accurate only as of the respective dates of such information. Our business, financial condition, results of operations, and prospects may have changed since those dates.
Except where the context requires otherwise, references in this prospectus to "Advanced Disposal," "Company," "we," "us," and "our" refer to Advanced Disposal Services, Inc., together with its consolidated subsidiaries. On January 27, 2016, ADS Waste Holdings, Inc. was renamed Advanced Disposal Services, Inc. References to "Parent" refer to Advanced Disposal Waste Holdings Corp. In this prospectus, when we refer to our fiscal years, we say "fiscal" and the year number, as in "fiscal 2015," which refers to our fiscal year ended December 31, 2015. Except where otherwise noted, statistical data of the Company is as of June 30, 2016.
i
Market, Industry and Other Data
This prospectus includes estimates regarding market and industry data and forecasts, which are based on publicly available information, industry publications and surveys, reports from government agencies and reports by market research firms, including IBISWorld, Waste Business Journal, Woods & Poole, Spears & Associates, the National Association of Home Builders and the U.S. Census Bureau. We have not independently verified market and industry data provided by any of these or any other third-party sources referred to in this prospectus, although we believe such market and industry data included in this prospectus is reliable. This information cannot always be verified with complete certainty due to the limits on the availability and reliability of raw data, the voluntary nature of the data gathering process and other limitations and uncertainties inherent in surveys of market size.
Management estimates are derived from the information and data referred to above, as well as our internal research, calculations and assumptions made by us based on our analysis of such information and data and our knowledge of our industry and markets, which we believe to be reasonable, although they have not been independently verified. While we believe that the market position information included in this prospectus is generally reliable, such information is inherently imprecise. Assumptions, expectations and estimates of our future performance and the future performance of the industry in which we operate are necessarily subject to a high degree of uncertainty and risk due to a variety of factors, including those described in "Risk Factors" and "Forward-Looking Statements." These and other factors could cause results to differ materially from those expressed in the estimates made by the independent parties and by us.
ii
This summary highlights some of the information contained in this prospectus. This summary may not contain all of the information that may be important to you. For a more complete understanding of our business and this offering, we encourage you to read this entire prospectus, including "Risk Factors," "Management's Discussion and Analysis of Financial Condition and Results of Operations," the more detailed information regarding our Company and the common stock being sold in this offering, as well as our consolidated financial statements and the related notes appearing elsewhere in this prospectus, before deciding to invest in our common stock. Some of the statements in this prospectus constitute forward-looking statements. See "Forward-Looking Statements."
Our Company
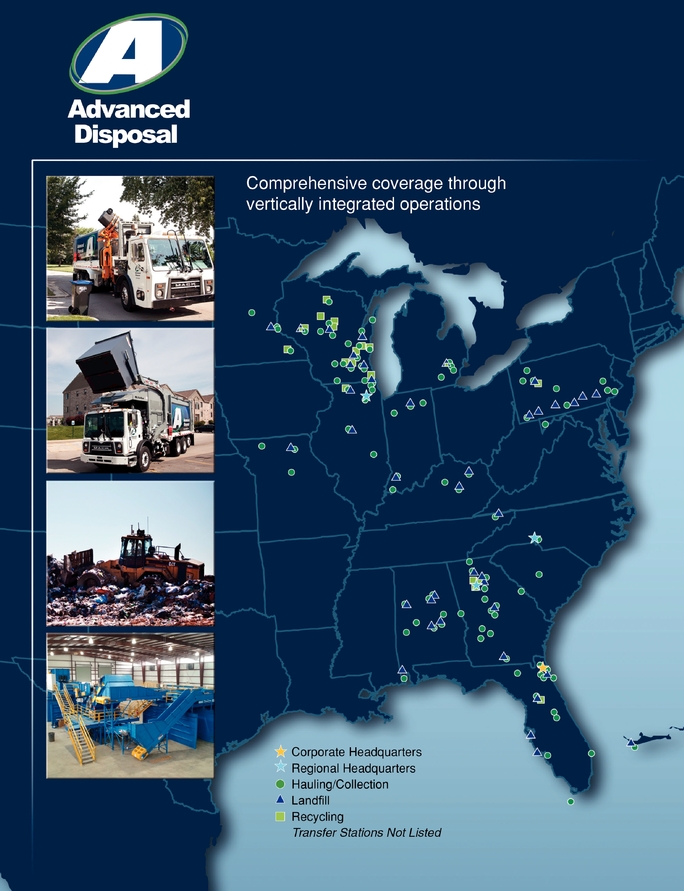
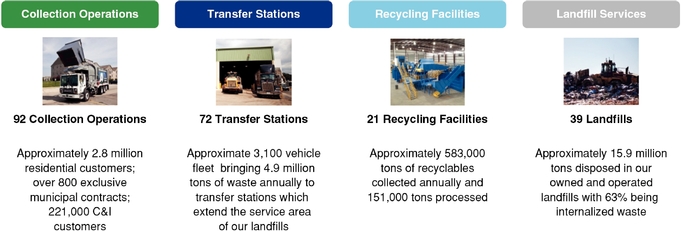
We are a leading integrated provider of non-hazardous solid waste collection, transfer, recycling and disposal services operating primarily in secondary markets or under exclusive arrangements with municipalities. We have a presence in 16 states across the Midwest, South and East regions of the United States, serving approximately 2.8 million residential and 221,000 commercial and industrial ("C&I") customers through our extensive network of 92 collection operations, 72 transfer stations, 21 owned or operated recycling facilities and 39 owned or operated landfills. We seek to drive financial performance in markets in which we own or operate a landfill or in certain disposal-neutral markets, where the landfill is owned by our municipal customer. In markets in which we own or operate a landfill, we aim to create and maintain vertically integrated operations through which we manage a majority of our customers' waste from the point of collection through the point of disposal, a process we refer to as internalization. By internalizing a majority of the waste in these markets, we are able to deliver high quality customer service while also ensuring a stable revenue stream and maximizing profitability and cash flow from operations. In disposal-neutral markets, we focus selectively on opportunities where we can negotiate exclusive arrangements with our municipal customers, facilitating highly-efficient and profitable collection operations with lower capital requirements.
Geographically, we focus our business principally in secondary, or less densely populated non-urban, markets where the presence of large national providers is generally more limited. We also compete selectively in primary, or densely populated urban, markets where we can capitalize on opportunities for vertical integration through our high-quality transfer and disposal infrastructure and where we can benefit from highly-efficient collection route density. Through our disciplined focus on secondary markets and on markets with favorable disposal
1
characteristics, we are able to maximize customer retention and benefit from a higher and more stable pricing environment.
We have historically generated consistent revenue growth across economic cycles. To continue to drive growth, we are focused on a number of key areas, including: municipal contract wins, new customer additions, disciplined pricing and expansion into additional geographies and markets with favorable dynamics and demographic trends. We have established a systematic and replicable approach to municipal contract bidding and identifying privatization opportunities. Since the consummation of our transformational $1.9 billion acquisition of Veolia ES Solid Waste, Inc. in 2012 (the "Veolia Acquisition") to date, we have been awarded 128 new long-term, exclusive municipal contracts for a net increase of 42 municipal contracts. Our existing operations also provide us with a scalable platform to drive profitable growth through strategic acquisitions. From the Veolia Acquisition to date, we have executed 45 tuck-in acquisitions, primarily of collection operations. By assimilating acquisitions into our vertically integrated geographic operations, we have been able to improve adjusted EBITDA margin post-acquisition. Due to our scale, our tuck-in acquisition strategy enables us to drive robust inorganic growth despite a relatively small average transaction size.
For the twelve months ended June 30, 2016, our revenue by geography, revenue by source and revenue by category were as follows:
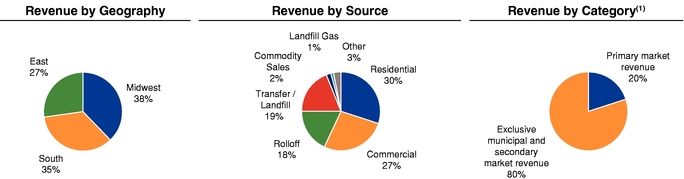
- (1)
- Primary market revenue includes revenue from the following four markets (excluding revenue from exclusive municipal contracts): Atlanta, Chicago, Detroit and Philadelphia.
We operate across the Midwest, South and East regions of the United States, which accounted for 38%, 35% and 27% of our revenue for the twelve months ended June 30, 2016, respectively. We believe that our broad geographic presence positions us well to capitalize on favorable demographic and macroeconomic trends in the markets that we serve. According to the U.S. Census Bureau and Woods & Poole, population and gross regional product growth in certain of our markets, particularly those in the Southeast, are expected to outpace overall U.S. population and gross domestic product ("GDP") growth through 2030.
Complementing our geographic diversity, we maintain an attractive mix of revenue from varying sources with limited exposure to commodity sales, which helps to enhance our financial performance across economic cycles. We also benefit from a high degree of customer diversification, with no single customer accounting for more than 2% of revenue for the twelve months ended June 30, 2016. Our municipal customer relationships are generally supported by exclusive contracts ranging from three to ten years in initial duration with subsequent renewal periods, and we have historically achieved a renewal rate of approximately 85% with these customers. Our standard C&I service agreement is a five-year renewable agreement. Management believes we maintain strong relationships with our C&I
2
customers. Our large and diverse customer base, combined with our long-term contracts and consistently high renewal rates, provide us with significant revenue and earnings stability and visibility.
We are led by a veteran management team with extensive experience in operating, acquiring and integrating solid waste services businesses. Our senior leadership team averages more than 20 years of experience in the solid waste industry. During their tenure, they have instituted a strong, unified corporate culture and successfully implemented our growth and operational initiatives. We believe our management team has positioned our business well for continued growth and improvements in adjusted EBITDA margin and cash flow from operations, and we intend to continue to focus our efforts on generating both organic and inorganic growth.
For the twelve months ended June 30, 2016, we generated revenues of $1.4 billion, net loss of $28.3 million, adjusted EBITDA of $401.4 million and cash flow from operations of $219.6 million. For a reconciliation of adjusted EBITDA to net income (loss) see "Summary Consolidated Financial Information and Other Data."
Our Industry
More than 250 million tons of solid waste are generated in the United States each year. The U.S. solid waste industry generated approximately $59 billion in revenue in 2013 and is expected to reach approximately $66 billion in 2019, according to IBISWorld. The industry can be classified into the following asset categories: collection operations, transfer stations, landfills, recycling facilities and waste-to-energy plants. Vertical integration of these assets typically drives greater efficiency and superior operating margins and as a result, waste companies attempt to create integrated operations in an effort to enhance profitability, cash flow and return on capital.
The solid waste industry is relatively resistant to cyclical economic trends due to the non-discretionary nature of the services provided and, as such, has experienced just one year of relatively modest decline since 1997. The industry is characterized by a range of attractive features, including: (i) high visibility of earnings due to predictable waste generation of residential and commercial customers; (ii) the absence of cost-effective substitutes for collection, beneficial re-use and landfill disposal; (iii) high barriers to entry created by the lengthy permitting process and significant capital costs of landfill development; and (iv) the ongoing trend of municipalities and local governments seeking to turn over management of public services, including waste services, to private firms.
3
The following table sets forth historical and projected solid waste industry revenue growth:
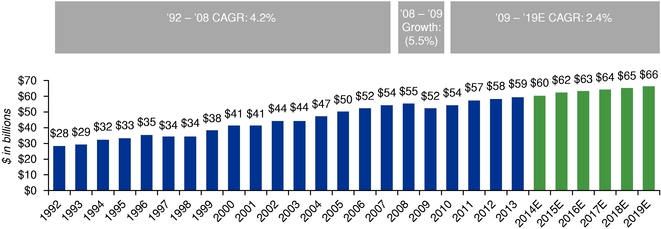
Source: Waste Business Journal's Waste Market Overview & Outlook 2012, IBISWorld US Waste Treatment & Disposal and US Waste Collection Reports April 2014
The solid waste industry is served by a few large, national and regional publicly owned companies, which comprise approximately 57% of the total U.S. solid waste market, several regional privately owned solid waste companies, and thousands of small privately owned companies, which generally maintain collection operations with limited or no in-house transfer, recycling or disposal capabilities. Privately owned waste collection operations in the aggregate represent approximately 20% of the total solid waste market. In addition, municipalities continue to own and operate waste collection and/or disposal operations in certain markets, representing approximately 23% of the overall U.S. solid waste market. The industry is characterized by high barriers to entry, driven in large part by the high cost of developing and maintaining transfer and disposal assets. The implementation of the Resource Conservation and Recovery Act ("RCRA") Subtitle D in 1991 significantly raised the environmental standards for landfill operators, requiring costly upgrades and closure of many disposal sites, and resulted in a trend toward fewer larger landfills. This consolidation trend and the resulting increased scarcity of active disposal locations have benefited larger waste companies by providing improved pricing and profitability dynamics.
There are three principal markets in the solid waste industry, including:
- •
- Residential Waste Market
- •
- Consists of the periodic curbside pickup of residential household waste and delivery to either a landfill, transfer
station or recycling facility
- •
- Waste volumes are driven primarily by population growth and GDP growth
- •
- Commercial and Industrial Waste
Market
- •
- Consists of the collection and disposal of waste generated by non-residential customers that utilize front load, rolloff
containers or waste compactors
- •
- Waste volumes are driven primarily by GDP growth, new business formations, industrial production and non-residential
construction
- •
- Construction & Demolition Waste
Market
- •
- Consists of the collection and disposal of debris generated during construction, renovation and demolition typically using rolloff containers
4
- •
- Waste volumes are driven primarily by residential and non-residential construction activity
In addition to the residential and C&I waste streams traditionally serviced by waste companies, regulatory and other market factors have created opportunities to expand services to other non-hazardous waste streams such as coal ash generated by coal-fired electricity producing plants and energy waste produced by oil & gas exploration and production firms.
Our Operating Strengths
Vertically Integrated Geographic Operations
Our vertically integrated geographic operations enable us to provide high-quality service to our customers while simultaneously capitalizing on growth opportunities, capturing additional revenue streams and maximizing profitability. In most of the markets we serve, we integrate our network of collection, transfer and disposal assets into geographic operations that allow us to manage the waste stream throughout the entire value chain—from the point of collection to the point of disposal—exclusively using our own resources. This enables us to generate a steady, predictable stream of waste volume and capture the incremental disposal margin that otherwise would be paid to a third party. It also enables us to charge third-party collection service providers tipping fees for the use of our transfer stations or landfills, providing a source of recurring revenue at attractive EBITDA margins. In addition, our high internalization rate provides us with a meaningful cost advantage, positioning us well to win additional profitable business through new customer acquisition and municipal contract awards. Finally, our vertically integrated geographic operations position us well for inorganic growth, as we can acquire transfer stations or collection operations and efficiently integrate them into our existing platform.
Strategically Located Network of Landfill and Transfer Station Assets
Our network of 39 active and strategically located landfills is a critical component of our integrated operations and provides a distinct competitive advantage in the markets that we serve. Our network of landfill assets is difficult to replicate due to a range of factors, including substantial upfront capital requirements for new landfill development, lengthy permitting processes, geographic and political constraints on new landfills and stringent requirements for ongoing environmental and regulatory compliance. Our landfill assets have substantial remaining capacity, which will help us to sustain the long-term competitive advantages that our vertically integrated model provides.
The value of our landfill assets is further enhanced by our complementary network of transfer stations, which provides us with an additional competitive advantage by allowing us to capture waste volumes that we could not otherwise service. The shift toward fewer, larger landfills has resulted in landfills that are generally located farther from population centers and waste being transported longer distances between collection and disposal, often after consolidation at a transfer station. With a landfill and collection services, we can provide vertically integrated operations that cover a substantial geographic area surrounding the landfill. However, with one or more transfer stations strategically located at the periphery of this service area, and with additional collection operations around the transfer station(s), we can direct substantially more waste volume from a significantly broader service area to an existing landfill. By expanding the geographic reach of our landfills, our network of transfer stations enhances our economies of scale and strengthens the competitive advantage that our landfills provide.
5
Well-Positioned in Secondary and Exclusive Markets
We focus our business principally in secondary markets where the presence of large national providers is generally more limited. We also participate in certain disposal-neutral markets in which we provide services under exclusive arrangements with our municipal customers, which facilitates highly-efficient and profitable collection operations and lower capital requirements. We believe this strategic focus positions us to maintain significant share within our target markets, maximize customer retention and benefit from a higher and more stable pricing environment. For the twelve months ended June 30, 2016, revenue from our secondary markets and exclusive municipal contracts accounted for approximately 80% of total revenue.
Proven Ability to Identify, Execute and Integrate Acquisitions and Win New Municipal Contracts
Our ability to execute and integrate value-enhancing, tuck-in acquisitions and win new municipal contracts has been a core component of our growth. Our scale, geographic reach, vertical integration and strong position in secondary markets position us well to identify and execute strategic acquisitions. From the Veolia Acquisition to date, we have completed 45 tuck-in acquisitions, and by integrating acquired operations into our existing network, we have been able to improve adjusted EBITDA margin and enhance cash flow from operations post-acquisition.
We also have experience executing large-scale transactions, as highlighted by the Veolia Acquisition. In addition to significantly expanding our scale and scope of operations, the Veolia Acquisition enhanced our geographic footprint by providing us with complementary operations in our East and South regions, as well as strong, new positions in secondary markets in the Midwestern United States. We have also achieved cost efficiencies and economies of scale through improved internalization, increased route density and more efficient asset utilization while maintaining our strong positions in the local markets that we serve.
Finally, we have demonstrated success in municipal contract bidding and capitalizing on privatization opportunities and, from the Veolia Acquisition to date, we have been awarded 128 new long-term municipal contracts. Due to the strength of our localized operations and our highly experienced regional management team, we maintain close relationships with key decision-makers throughout our markets, which position us well to capitalize on new municipal contracts and privatization opportunities.
Customer Diversification with Long-Term Contracts
We serve approximately 2.8 million residential and 221,000 C&I customers and over 800 municipalities, with no single customer representing more than 2% of revenue in 2015 or for the six months ended June 30, 2016. Our municipal customer relationships are generally supported by contracts ranging from three to ten years in initial duration with subsequent renewal periods, and we have historically achieved a renewal rate of approximately 85% with these customers. Our standard C&I service agreement is a five-year renewable agreement. Management believes we maintain strong relationships with our C&I customers. Our breadth of customer relationships, long-term contracts and high renewal rates provide us with a high degree of revenue and earnings stability and visibility.
6
Disciplined Focus on Service and Safety
Our corporate slogan is "Service First, Safety Always." We maintain a relentless focus on customer service and we strive to consistently exceed our customers' expectations. Our localized approach to customer service and high quality management at our local operations result in a highly responsive, customer service oriented organization. By providing a high level of customer service, we maximize the value our customers receive from the services we deliver, which we believe ultimately increases customer loyalty and supports price stability.
The safety of our workforce and our customers is paramount to us. We have a strong track record of safety and environmental compliance driven by company-wide programs centered on workforce training, stringent risk management and safety-related practices. Our shift toward an automated fleet has also enhanced our safety profile. Automated trucks, which only require a driver and collect waste automatically using a hydraulic lifting mechanism, are substantially safer than traditional rear-load vehicles, which require both a driver and an operator who manually loads waste into the rear of a vehicle. With a growing portion of our fleet comprised of automated vehicles, we have sought to create a safer work environment for our employees and to reduce the frequency of workplace injuries.
Industry Leading Management Team
Led by CEO Richard Burke, CFO Steven Carn and COO John Spegal, our management team has extensive experience in the solid waste industry, consisting of operations, acquisitions and the development of disposal capacity. Our leadership team has instituted a strong, unified corporate culture and has successfully executed a differentiated growth strategy that positions us well to capitalize on continued organic and inorganic growth initiatives. While our leadership team drives our overall strategy, our decentralized management structure facilitates local management autonomy and enables us to capitalize on growth and cost reduction opportunities at the local level. Averaging more than 20 years of industry experience, our senior management team is supported by a talented group of regional, district and general managers who execute on our strategy in their respective markets.
Our Growth Strategies
Continue to Develop Vertically Integrated Geographic Operations
Our vertically integrated geographic operating model serves as the foundation for our business strategy. We pursue a multi-faceted growth strategy within this operating framework, including both growth within our existing network of landfill and transfer stations and expansion into additional geographies in which we establish new vertically integrated operations. Further development of our existing vertically integrated operations will allow us to capitalize on incremental growth initiatives and efficiency gains, including the internalization of additional waste streams to expand volume, increase revenue and improve profitability.
Pursue Disciplined Acquisition Strategy
Our ability to execute value-enhancing, tuck-in acquisitions has been a core component of our growth. From the Veolia Acquisition to date, we have completed 45 strategic tuck-in acquisitions at attractive EBITDA multiples. The U.S. solid waste industry remains highly fragmented, with approximately 43% of the total market consisting of either privately held providers or municipal operators. We believe that significant opportunities exist for further
7
consolidation and that, as a result of our scale and broad geographic presence, we remain ideally positioned to capitalize on these opportunities.
We intend to expand the scope of our operations by continuing to acquire solid waste management companies and disposal facilities in new markets and in existing or adjacent markets that are combined with, or tucked into, our existing operations. We intend to focus our acquisition efforts on markets that we believe provide significant growth opportunities. This focus typically highlights markets in which we can: (i) provide vertically integrated collection and disposal services; or (ii) provide waste collection services under exclusive arrangements. We believe that our experienced management team, decentralized operating strategy, financial strength and scale make us an attractive buyer to waste collection and disposal acquisition candidates.
Secure Additional Exclusive Municipal Contracts
We intend to continue to devote significant resources to securing additional municipal contracts. We have established a systematic and replicable approach to municipal contract bidding and privatization opportunities. In bidding for municipal contracts, our management team draws on its experience in the solid waste industry and knowledge of local service areas in existing and target markets. Our highly aligned district and local general management and sales and marketing personnel maintain relationships with local decision-makers within their service areas and are responsible for renewing and renegotiating existing municipal contracts and securing additional agreements and contracts with attractive financial returns.
Drive Financial Performance through Operational Excellence
We maintain a consistent operational focus on prudent cost management and pricing discipline to drive profitability. Our strategy is implemented by our district and local general managers who continuously monitor their local markets and target profit maximization rather than throughput alone. We closely align the incentive structure of our local managers to the safety and financial performance of the local operations that they oversee to drive adjusted EBITDA and operating cash flow growth at the local level. In addition to increasing earnings through this operational focus, we remain committed to financial discipline through prudent management of returns on equity and capital deployed. We seek to increase operating margins, adjusted EBITDA and cash flow from operations and drive higher returns on invested capital by implementing programs focused on areas such as sales productivity and pricing effectiveness, driver productivity and route optimization, maintenance efficiency and effective purchasing.
Invest in Strategic Infrastructure
We will continue to invest in our strategic infrastructure to support growth and expand our adjusted EBITDA margin. Given the long remaining life of our existing network of landfills, we continuously invest resources toward the development and enhancement of our landfills to increase our disposal capacity. Similarly, we will continue to evaluate opportunities to maximize the efficiency of our collection operations. We are currently in the process of converting our collection fleet to compressed natural gas ("CNG") fueled vehicles in certain markets where we can achieve an attractive return on our investment. CNG-fueled vehicles, which can provide significant operating cost savings relative to diesel alternatives, currently comprise 18% of our routed fleet, and we continue to evaluate further conversion opportunities. We believe this will result in an improved profitability profile as a result of the added fuel efficiency and labor savings. Finally, we have converted approximately 54% of our routed residential collection fleet to automated vehicles and continue to convert more of our
8
routed collection fleet to automated vehicles, which should result in incremental operating cost savings. In addition to labor cost savings, management believes the shift toward an automated fleet will result in reduced injury claims and workers compensation expense.
Invest in Our People
Employing and developing a broad base of highly talented employees is essential to success in our decentralized operating model. We will continue to invest in high-quality talent in order to most effectively manage our existing operations and execute our growth strategy. We rely on managers and employees with specific local market knowledge to not only operate our business but also to identify and integrate tuck-in acquisitions and new municipal contract wins. As such, we continuously recruit and hire talented local-level employees who are capable of supporting our growth initiatives and provide the best-in-class customer service we strive to deliver.
We have consistently realized organic growth driven by a strong, dedicated sales force. Our team of professionals has executed our sales strategy by focusing not only on growth, but also on profitability. We will continue to drive this strategy by rewarding our managers who successfully monitor their local markets and have a proven track record of achieving profitable growth. We will also invest in new sales employees and marketing initiatives within markets that further our overall vertically integrated geographic operating strategy, driving new wins, enhancing our route density and increasing volumes to landfills.
Risk Factors
There are a number of risks you should consider before buying our shares. These risks are discussed more fully under "Risk Factors" beginning on page 20 of this prospectus. These risks include, but are not limited to:
- •
- We have a history of losses and may not achieve or sustain profitability in the future.
- •
- We operate in a highly competitive industry and may not be able to compete effectively with larger and better capitalized companies
and governmental service providers.
- •
- We may lose contracts through competitive bidding, early termination or governmental action.
- •
- Our results are vulnerable to economic conditions.
- •
- Some of our customers, including governmental entities, have suffered financial difficulties affecting their credit risk, which could
negatively impact our operating results.
- •
- Our financial and operating performance may be affected by the inability in some instances to renew landfill permits, obtain new
landfills or expand existing ones. Further, the cost of operation and/or future construction of our landfills may become economically unfeasible causing us to abandon or cease operations.
- •
- Our accruals for our landfill site closure and post-closure costs and contamination-related costs may be inadequate.
- •
- Our business requires a high level of capital expenditures.
- •
- We may engage in strategic acquisitions in the future, which may pose significant risks and could have an adverse effect on our operations.
9
- •
- The seasonal nature of our business and "event-driven" waste projects cause our results to fluctuate.
- •
- Fluctuations in the prices of commodities may adversely affect our financial condition, results of operations and cash flows.
- •
- Increases in labor and disposal and related transportation costs could impact our financial results.
- •
- Our operations are subject to environmental, health and safety laws and regulations, as well as contractual obligations that may
result in significant liabilities.
- •
- Our indebtedness could adversely affect our financial condition and limit our financial flexibility. As of June 30, 2016, we
had approximately $2,300.5 million of indebtedness outstanding and cash interest expense of $115.1 million for the twelve months ended June 30, 2016.
- •
- Despite our high indebtedness level, we and our subsidiaries will still be able to incur significant additional amounts of debt, which
could further exacerbate the risks associated with our substantial indebtedness.
- •
- Our debt agreements contain restrictions that limit our flexibility in operating our business.
Our History
Our predecessor company was formed in November 2000 with the vision to build a vertically integrated non-hazardous solid waste business in the Southeastern United States. Following the acquisition of Advanced Disposal Services, Inc. ("ADS Inc."), a predecessor company, and Interstate Waste by Highstar Capital LP ("Highstar Capital") in 2006, our management team, together with Highstar Capital, successfully implemented growth and operational strategies to establish these companies as among the largest waste management companies in their respective markets. In addition to substantially increasing our overall scale, the Veolia Acquisition provided a synergistic overlap in key South and East market segments while establishing a strong presence in several secondary markets in the Midwest. Subsequent to the Veolia Acquisition, we divested certain operations in the Northeast and South regions, including substantially all of our New York, New Jersey, Massachusetts, Mississippi and Vermont operations, which did not align with our strategic focus. We have continued to pursue our vertically integrated approach to the market through both organic initiatives and through strategic tuck-in acquisitions, having completed 45 acquisitions since the Veolia Acquisition to date.
Our Corporate Information
Our principal executive office is located at 90 Fort Wade Road, Ponte Vedra, Florida 32081. Our telephone number at that address is (904) 737-7900. Our website address is www.advanceddisposal.com. Information on our website is deemed not to be a part of this prospectus.
Our Sponsor
Highstar Capital provides operationally focused, value-added investment management services. Since 2000, the Highstar Capital team has managed approximately $8.0 billion on behalf of its managed funds and co-investment vehicles in a diversified portfolio of energy, transportation and environmental services assets and businesses.
10
Recent Equity Investment in Controlling Limited Partnership
On August 3, 2016, the Company announced that Canada Pension Plan Investment Board ("CPPIB") invested $280 million in preferred units of Star Atlantic Waste Holdings II, L.P. ("Star Atlantic II"), a Highstar Capital sponsored limited partnership that controls Parent. The proceeds of the investment were used by Star Atlantic II to redeem the preferred units formerly owned by OPTrust Infrastructure Europe I Inc. All preferred units owned by CPPIB will convert automatically into shares of our common stock upon completion of this offering. In connection with its investment, CPPIB received the right to designate one member of our board of directors. CPPIB will also become a party to the stockholders' agreement and registration rights agreement upon consummation of this offering. See "Certain Relationships and Related Party Transactions."
Organizational Structure Following This Offering
Concurrently with the consummation of this offering, Parent, which owns substantially all of the common stock of the Company, will be merged into the Company, with the Company being the surviving corporation. Parent has no assets other than the common stock of the Company and no liabilities except for liabilities under severance agreements with certain former members of management approximating $5.2 million at June 30, 2016. Star Atlantic Waste Holdings II, L.P. will be liquidated contemporaneously with the consummation of the offering and the other pre-IPO investors in Star Atlantic Waste Holdings II, L.P. will become direct shareholders of the Company. The Company will recapitalize in the merger, and immediately prior to this offering the Company will have 64,493,542 shares of common stock issued and outstanding. We refer to these transactions as the "Reorganization." On January 27, 2016, we changed our name from ADS Waste Holdings, Inc. to Advanced Disposal Services, Inc.
11
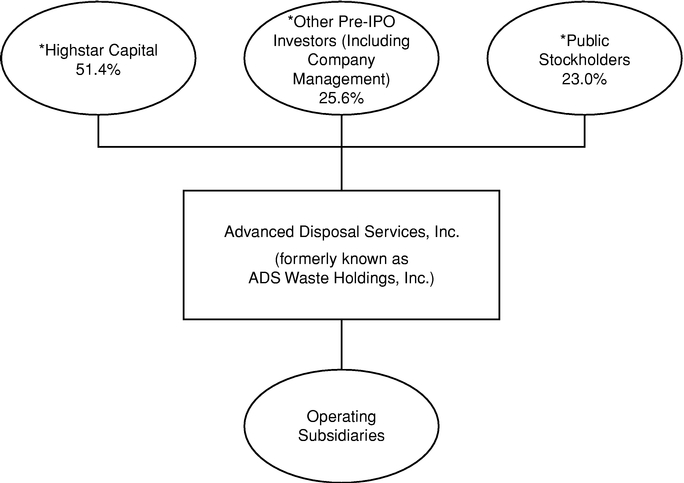
The diagram below depicts our summary organizational structure immediately following this offering:
- *
- Based on the mid point of the price range set forth on the cover of this prospectus and assuming no exercise of the underwriters' option to purchase additional shares of common stock. See "Use of Proceeds." After the completion of this offering, depending on the price of the shares offered and the exercise of the over-allotment option, affiliates of Highstar Capital LP may not continue to own a majority of the voting power of shares eligible to vote in the election of our directors. As a result, we may not be a "controlled company" within the meaning of the corporate governance standards of the New York Stock Exchange. See "Management—Controlled Company."
12
Shares of common stock offered by us |
19,250,000 shares | |
Option to purchase additional shares from us |
2,887,500 shares |
|
Shares of common stock to be outstanding immediately after this offering |
83,743,542 shares |
|
Use of proceeds |
We estimate that the net proceeds to us from this offering, after deducting the underwriting discount and estimated offering expenses payable by us, will be approximately $351.4 million, based on an assumed initial public offering price of $19.50 per share, the mid-point of the range described on the cover of this prospectus, and assuming no exercise of the underwriters' option to purchase additional shares of common stock. An increase or decrease in the initial public offering price by $1.00 would result in an increase or decrease of approximately $18.1 million of net proceeds to us, assuming the number of shares offered by us stays constant. |
|
|
We intend to use the net proceeds from the sale of common stock by us in this offering to repay certain outstanding indebtedness. On February 4, 2016, we obtained lender consent for certain amendments to our Senior Secured Credit Facilities, including the extension of the maturity of the commitments under the Revolving Credit Facility, the effectiveness of which is conditioned on the consummation of this offering and a minimum Term Loan B paydown of $100.0 million. In connection with the amendment to our Senior Secured Credit Facilities, we paid total fees of approximately $5.2 million, which were paid to the lenders and the administrative agent, at the closing of the consent. |
|
|
On August 4, 2016, we entered into a waiver to our Senior Secured Credit Facilities to waive the IPO condition to the extension of the maturity of the commitments under our senior secured credit facilities referred to above. As a result of the execution of the amendment and waiver, the maturity date with respect to approximately $280 million of the $300 million of commitments under the Revolving Credit Facility has been extended to October 2019. See "Description of Certain Indebtedness—Amendments to the Senior Secured Credit Facilities." |
|
|
See "Use of Proceeds." |
13
Risk factors |
Investing in our common stock involves a high degree of risk. See "Risk Factors" beginning on page 20 of this prospectus for a discussion of factors you should carefully consider before deciding to invest in our common stock. |
|
Dividend policy |
We have no current plans to pay dividends on our common stock following this offering. Any decision to declare and pay dividends in the future will be made at the sole discretion of our board of directors and will depend on, among other things, our results of operations, cash requirements, financial condition, contractual restrictions and other factors that our board of directors may deem relevant. Because we are a holding company and have no direct operations, we will only be able to pay dividends from funds we receive from our subsidiaries. In addition, our ability to pay dividends will be limited by covenants in our existing indebtedness and may be limited by the agreements governing other indebtedness we or our subsidiaries incur in the future. See "Description of Certain Indebtedness." |
|
Proposed symbol for trading on the NYSE |
Our common stock has been approved for listing on the New York Stock Exchange (the "NYSE"), under the symbol "ADSW". |
Unless otherwise indicated, the shares of common stock outstanding after this offering and information based thereon excludes:
- •
- 4,260,000 shares of common stock available for future issuance under our new omnibus executive compensation plan; and
- •
- 2,887,500 shares of common stock issuable pursuant to the underwriters' option to purchase additional shares of common stock from us.
All share numbers reflect the recapitalization of the Company to be effected in connection with the Reorganization.
All share numbers assume an initial public offering price of $19.50 per share, the mid-point of the range set forth on the cover of this prospectus.
14
SUMMARY CONSOLIDATED FINANCIAL INFORMATION AND OTHER DATA
The following table summarizes our historical consolidated financial information for the periods and as of the dates indicated. The summary historical consolidated financial information as of June 30, 2016 and for the six months ended June 30, 2016 and 2015 is derived from our unaudited condensed consolidated financial statements included elsewhere in this prospectus. The summary historical consolidated financial information as of June 30, 2015 is derived from our unaudited condensed consolidated financial statements not included in this prospectus. Our unaudited consolidated financial statements have been prepared on the same basis as our audited consolidated financial statements and, in our opinion, reflect all adjustments, consisting only of normal and recurring adjustments, necessary for a fair presentation of such financial statements in all material respects.
The summary historical consolidated financial information as of December 31, 2015 and 2014 and for the years ended December 31, 2015, 2014, and 2013 is derived from our audited consolidated financial statements included elsewhere in this prospectus. The summary historical consolidated financial information as of December 31, 2013 is derived from our audited consolidated financial statements not included in this prospectus.
The financial data set forth in the following tables should be read in conjunction with our historical consolidated financial statements and related notes and "Management's Discussion and Analysis of Financial Condition and Results of Operations," each included elsewhere in this prospectus. The results for any interim period are not necessarily indicative of the results that may be expected for a full year or any future period.
15
| |
Six Months Ended June 30, |
Year Ended December 31, | ||||||||||||||
|---|---|---|---|---|---|---|---|---|---|---|---|---|---|---|---|---|
| |
2016 | 2015 | 2015 | 2014 | 2013 | |||||||||||
| |
(in millions, except per share data and percentages) |
|||||||||||||||
Consolidated Statement of Operations Data: |
||||||||||||||||
Service revenues |
$ | 692.0 | $ | 685.5 | $ | 1,396.4 | $ | 1,403.0 | $ | 1,319.1 | ||||||
| | | | | | | | | | | | | | | | | |
Costs and expenses: |
||||||||||||||||
Operating |
432.3 | 428.9 | 866.6 | 896.1 | 832.8 | |||||||||||
Selling, general and administrative (a) |
84.1 | 72.9 | 152.6 | 154.9 | 170.9 | |||||||||||
Depreciation and amortization |
125.4 | 127.4 | 259.1 | 271.4 | 278.9 | |||||||||||
Acquisition and development costs |
0.2 | 1.1 | 1.4 | 0.1 | 1.2 | |||||||||||
Loss on disposal of assets and asset impairments (b) |
0.1 | 17.5 | 21.6 | 6.5 | 3.2 | |||||||||||
Restructuring |
0.8 | — | — | 4.6 | 10.0 | |||||||||||
| | | | | | | | | | | | | | | | | |
|
642.9 | 647.8 | 1,301.3 | 1,333.6 | 1,297.0 | |||||||||||
| | | | | | | | | | | | | | | | | |
Operating income |
49.1 | 37.7 | 95.1 | 69.4 | 22.1 | |||||||||||
Interest expense |
(68.6 | ) | (69.8 | ) | (138.0 | ) | (141.5 | ) | (163.1 | ) | ||||||
Other income/(expense), net (c) |
0.4 | 3.7 | (10.1 | ) | (25.9 | ) | 0.3 | |||||||||
| | | | | | | | | | | | | | | | | |
Loss before income taxes |
(19.1 | ) | (28.4 | ) | (53.0 | ) | (98.0 | ) | (140.7 | ) | ||||||
Benefit for income taxes (d) |
(5.1 | ) | (9.1 | ) | (19.4 | ) | (80.6 | ) | (45.4 | ) | ||||||
| | | | | | | | | | | | | | | | | |
Net loss from continuing operations |
(14.0 | ) | (19.3 | ) | (33.6 | ) | (17.4 | ) | (95.3 | ) | ||||||
Income (loss) from discontinued operations, net of tax (e) |
— | — | — | 0.3 | (22.5 | ) | ||||||||||
| | | | | | | | | | | | | | | | | |
Net loss |
$ | (14.0 | ) | $ | (19.3 | ) | $ | (33.6 | ) | $ | (17.1 | ) | $ | (117.8 | ) | |
| | | | | | | | | | | | | | | | | |
| | | | | | | | | | | | | | | | | |
| | | | | | | | | | | | | | | | | |
Loss from continuing operations per share: |
||||||||||||||||
Basic and diluted loss per share |
$ | (14,000 | ) | $ | (19,300 | ) | $ | (33,600 | ) | $ | (17,400 | ) | $ | (95,300 | ) | |
Net loss per share: |
||||||||||||||||
Basic and diluted loss per share |
$ | (14,000 | ) | $ | (19,300 | ) | $ | (33,600 | ) | $ | (17,100 | ) | $ | (117,800 | ) | |
Pro forma net loss per share (f): |
||||||||||||||||
Basic and diluted loss per share |
$ | (0.17 | ) | $ | (0.23 | ) | $ | (0.40 | ) | $ | (0.20 | ) | $ | (1.41 | ) | |
Consolidated Statement of Cash Flows Data: |
||||||||||||||||
Net cash provided by operating activities |
$ | 104.4 | $ | 129.3 | $ | 244.5 | $ | 243.2 | $ | 180.3 | ||||||
Net cash used in investing activities |
(70.8 | ) | (85.3 | ) | (197.4 | ) | (201.2 | ) | (154.8 | ) | ||||||
Net cash used in financing activities |
(33.0 | ) | (35.7 | ) | (47.5 | ) | (53.0 | ) | (32.3 | ) | ||||||
Consolidated Balance Sheet Data (at period end): |
||||||||||||||||
Total assets (k) |
$ | 3,374.7 | $ | 3,448.1 | $ | 3,422.3 | $ | 3,489.5 | $ | 3,554.2 | ||||||
Debt, including current portion (g)(k) |
2,240.4 | 2,239.7 | 2,247.1 | 2,243.0 | 2,259.3 | |||||||||||
Total Advanced Disposal stockholders' equity |
466.5 | 501.9 | 489.8 | 528.9 | 551.5 | |||||||||||
Other Data: |
||||||||||||||||
Adjusted EBITDA from continuing operations (h) |
$ | 194.3 | $ | 192.9 | $ | 400.0 | $ | 378.8 | $ | 361.1 | ||||||
Adjusted EBITDA margin from continuing operations (i) |
28.1 | % | 28.1 | % | 28.6 | % | 27.0 | % | 27.4 | % | ||||||
Free cash flow (j) |
$ | 36.2 | $ | 42.3 | $ | 69.8 | $ | 80.2 | $ | 25.6 | ||||||
- (a)
- Includes
stock-based compensation expense. Stock based compensation expense for all periods presented was determined using the fair value method set forth
in ASC 718, "Compensation—Stock Compensation."
- (b)
- We
disposed of certain businesses in the South segment for strategic reasons in June 2015 and recorded a loss on disposal of $10.9 million for fiscal
2015. Additionally, we recorded an impairment of $6.4 million during fiscal 2015 in connection with the strategic decision to divest certain businesses in the South segment and the decision not
to pursue a landfill permit. In fiscal 2014, we recorded an impairment charge of $5.3 million in connection with the decision to divest a small brokerage business.
- (c)
- Changes
in the fair value and settlements of fuel derivative instruments are recorded in other income (expense), net in the condensed consolidated
statements of operations and amounted to income of $1.5 million and expense of $0.2 million for the six months ended June 30, 2016 and 2015, respectively. Changes in the fair
value of the interest rate caps purchased in May 2016 are recorded in other income (expense), net in the condensed consolidated statements of operations and amounted to a loss of
$2.8 million for the six months ended June 30, 2016. Amounts included in other (expense)/income, net for fiscal 2015 and 2014 contain unrealized and realized losses, net related to fuel
derivative instruments of $15.4 million and $27.3 million, respectively, and a gain on the redemption of a security of $2.5 million for fiscal 2015.
- (d)
- In fiscal 2014, we completed a legal entity reorganization to achieve administrative efficiencies and as such recorded a valuation allowance release of $51.4 million related to certain net operating losses that are more likely than not to be utilized.
16
- (e)
- Amounts
represent those operations that are considered to be discontinued operations. Refer to Note 4 "Discontinued Operations" in our audited
consolidated financial statements included elsewhere in this prospectus for further information.
- (f)
- Pro
forma net loss per share is based on the shares to be issued in the Reorganization and an offering by the Company of shares of common stock at a price
per share equal to the mid-point of the price range set forth on the cover of this prospectus and assuming no exercise of the underwriters' option to purchase additional shares of common stock. Under
certain circumstances, we may elect to increase the total number of shares issued and sold by us in this offering. See "Use of Proceeds." Any increase in the number of shares issued by us in this
offering will increase the total number of shares outstanding after this offering and will decrease the pro forma net loss per share.
- (g)
- Total
debt includes capital lease obligations of $38.7 million, $24.7 million, $28.2 million, $23.3 million and
$15.4 million at June 30, 2016 and 2015 and December 31, 2015, 2014, and 2013, respectively.
- (h)
- We define EBITDA as net income (loss) from continuing operations adjusted for interest, taxes, depreciation and amortization and accretion. We define adjusted EBITDA as EBITDA adjusted to exclude non-cash and non-recurring items as well as other adjustments permitted in calculating covenant compliance under the agreements governing our outstanding debt securities and Senior Secured Credit Facilities. We believe adjusted EBITDA is useful to investors in evaluating our performance compared to other companies in our industry because it eliminates the effect of financing, income taxes and the accounting effects of capital spending, as well as certain items that are not indicative of our performance on an ongoing basis. Management uses adjusted EBITDA to measure the performance of our core operations at the consolidated, segment and business unit levels and as a metric for a significant portion of our management incentive plans. EBITDA and adjusted EBITDA are non-GAAP measures and, when analyzing our operating performance, investors should not consider EBITDA and adjusted EBITDA in isolation or as substitutes for net income, cash flows from operating activities or other statement of operations or cash flow statement data prepared in accordance with GAAP. Our calculations of EBITDA and adjusted EBITDA are not necessarily comparable to those of similarly titled measures provided by other companies. We believe excluding, among other items, stock based compensation, restructuring costs, sale of assets and asset impairments, rebranding and integration costs and share issuance and capital market costs from adjusted EBITDA is useful additional information in evaluating ongoing financial performance of the business and is consistent with how management evaluates performance. Our approach to these items is also consistent with the approach used in determining covenant compliance in our Senior Secured Credit Facilities and these items do not represent normal recurring cash operating expenses necessary to operate the business. We have also excluded losses and gains on derivative instruments. In fiscal 2014 we made a strategic decision to enter into fuel derivatives as economic hedges of a rise in the price of diesel fuel for fiscal 2015 and fiscal 2016. These derivatives resulted in realized losses in fiscal 2015 and in the six months ended June 30, 2016 as oil prices declined and we are likely to realize additional losses when the remaining contracts settle in the second half of fiscal 2016. We have not entered into fuel derivatives since fiscal 2014 when the economic hedges for fiscal 2015 and fiscal 2016 were put in place and have no present intention to enter into fuel derivatives in fiscal 2016 or fiscal 2017. We therefore believe that excluding realized losses from fuel derivatives from our Adjusted EBITDA is useful additional information in evaluating ongoing financial performance of the business and is consistent with how management evaluates performance. In fiscal 2016, we entered into interest rate caps as economic hedges of a rise in interest rates for fiscal 2017, fiscal 2018 and the nine months ended September 30, 2019. These interest rate derivatives resulted in $2.8 million in unrealized losses in the six months ended June 30, 2016. We believe that excluding unrealized losses from interest rate derivatives from our Adjusted EBITDA provides useful additional information in evaluating ongoing financial performance of the business as these derivatives represent a risk management tool to reduce our exposure to rising interest rates and are viewed by management as a financing cost similar to interest expense. Our approach to fuel and interest rate derivative contracts is also consistent with the approach used in determining covenant compliance in our Senior Secured Credit Facilities, as it will be amended upon consummation of this offering. See "Description Certain Indebtedness—Senior Secured Credit Facilities" and "—Amendments to the Senior Secured Credit Facilities".
17
| |
Six Months Ended June 30, |
Year Ended December 31, |
||||||||||||||
|---|---|---|---|---|---|---|---|---|---|---|---|---|---|---|---|---|
| |
2016 | 2015 | 2015 | 2014 | 2013 | |||||||||||
| |
(in millions, except percentages) |
|||||||||||||||
Net loss |
$ | (14.0 | ) | $ | (19.3 | ) | $ | (33.6 | ) | $ | (17.1 | ) | $ | (117.8 | ) | |
Less (loss) income from discontinued operations, net |
— | — | — | 0.3 | (22.5 | ) | ||||||||||
| | | | | | | | | | | | | | | | | |
Loss from continuing operations |
(14.0 | ) | (19.3 | ) | (33.6 | ) | (17.4 | ) | (95.3 | ) | ||||||
Additions/deductions: |
||||||||||||||||
Income tax benefit |
(5.1 | ) | (9.1 | ) | (19.4 | ) | (80.6 | ) | (45.4 | ) | ||||||
Interest expense |
68.6 | 69.8 | 138.0 | 141.5 | 163.1 | |||||||||||
Depreciation and amortization |
125.4 | 127.4 | 259.1 | 271.4 | 278.9 | |||||||||||
Accretion on landfill retirement obligations |
6.5 | 6.7 | 13.1 | 13.5 | 13.7 | |||||||||||
Accretion on loss contracts and other long-term liabilities |
0.2 | 0.4 | 0.8 | 0.9 | 0.4 | |||||||||||
| | | | | | | | | | | | | | | | | |
EBITDA from continuing operations |
181.6 | 175.9 | 358.0 | 329.3 | 315.4 | |||||||||||
EBITDA adjustments: |
||||||||||||||||
Acquisition and development costs |
0.2 | 1.1 | 1.4 | 0.1 | 1.2 | |||||||||||
Stock based compensation |
3.3 | 1.2 | 3.1 | 2.1 | 4.6 | |||||||||||
(Earnings) losses in equity investee, net |
(0.5 | ) | (0.4 | ) | 0.3 | (0.1 | ) | (0.3 | ) | |||||||
Restructuring charges (l) |
0.8 | — | — | 4.6 | 10.0 | |||||||||||
Loss on sale of assets and asset impairments |
0.1 | 17.5 | 21.6 | 6.5 | 5.5 | |||||||||||
Unrealized (gain) loss on derivative instruments (o)(p) |
(7.0 | ) | (10.9 | ) | (11.1 | ) | 27.3 | — | ||||||||
Gain on redemption of security |
— | (2.5 | ) | (2.5 | ) | — | — | |||||||||
Rebranding and integration costs (m) |
— | — | — | 7.1 | 25.8 | |||||||||||
Write-off of share issuance and other capital market costs (n) |
7.5 | — | 2.8 | — | — | |||||||||||
Other |
— | (0.1 | ) | — | — | — | ||||||||||
Realized loss (gain) on fuel derivative instruments (o) |
8.3 | 11.1 | 26.4 | 1.9 | (1.1 | ) | ||||||||||
| | | | | | | | | | | | | | | | | |
Adjusted EBITDA from continuing operations |
$ | 194.3 | $ | 192.9 | $ | 400.0 | $ | 378.8 | $ | 361.1 | ||||||
| | | | | | | | | | | | | | | | | |
| | | | | | | | | | | | | | | | | |
| | | | | | | | | | | | | | | | | |
Revenue from continuing operations |
$ | 692.0 | $ | 685.5 | $ | 1,396.4 | $ | 1,403.0 | $ | 1,319.1 | ||||||
Adjusted EBITDA margin from continuing operations |
28.1 | % | 28.1 | % | 28.6 | % | 27.0 | % | 27.4 | % | ||||||
- (i)
- Adjusted
EBITDA margin is defined as adjusted EBITDA divided by revenue from continuing operations.
- (j)
- Free cash flow is defined as net cash provided by operating activities less capital expenditures (purchases of property and equipment, excluding expenditures for significant new municipal contracts and land purchased for future landfill airspace, net of proceeds from the sale of property and equipment). The following table sets forth a reconciliation of free cash flow to net cash provided by operating activities.
| |
Six Months Ended June 30, |
Year Ended December 31, | ||||||||||||||
|---|---|---|---|---|---|---|---|---|---|---|---|---|---|---|---|---|
| |
2016 | 2015 | 2015 | 2014 | 2013 | |||||||||||
| |
(in millions, except percentages) |
|||||||||||||||
Net cash provided by operating activities |
$ | 104.4 | $ | 129.3 | $ | 244.5 | $ | 243.2 | $ | 180.3 | ||||||
Purchases of property & equipment * |
(69.2 | ) | (87.3 | ) | (177.3 | ) | (166.0 | ) | (158.1 | ) | ||||||
Proceeds from sale of property & equipment |
1.0 | 0.7 | 2.6 | 3.0 | 3.4 | |||||||||||
| | | | | | | | | | | | | | | | | |
Free cash flow |
36.2 | 42.7 | 69.8 | 80.2 | 25.6 | |||||||||||
- *
- The six months ended June 30, 2015 excludes the impact of land purchased for future airspace of $2.4 million. The fiscal year ended December 31, 2015 excludes the impact of land purchased for future landfill airspace of $2.4 million. The fiscal year ended December 31, 2014 excludes the impact of land purchases for future airspace of $8.8 million at one landfill and capital related to the start of a major municipal contract of $21.6 million.
- (k)
- Balances
have been adjusted to reflect the retrospective adoption of Accounting Standard Update ("ASU") 2015-03, Interest—Imputation of
Interest.
- (l)
- In September 2012, we announced a reorganization of our operations in anticipation of the Veolia Acquisition. The $4.6 million of restructuring charges in fiscal 2014 and $10.0 million of restructuring charges in fiscal 2013 relate to these reorganization efforts. During the first quarter of 2016, we eliminated a corporate executive position and re-aligned three districts in the Midwest segment into two districts. The $0.8 million of restructuring charges incurred during the six months ended June 30, 2016 relate to these permanent changes to our business. Adjustments reflect amounts accrued in the period; a portion of the corresponding cash expenditures have been or will be made in other fiscal periods.
18
- (m)
- In
connection with the Veolia Acquisition and the reorganization efforts noted in Note (e) above, we incurred costs to re-brand our fleet of trucks and
containers with the Advanced Disposal branding. We also incurred costs to integrate our legacy businesses together with the Veolia ES Solid Waste division. Adjustments reflect amounts accrued in the
period; a portion of the corresponding cash expenditures have been or will be made in other fiscal periods.
- (n)
- In
February 2016, we launched, but did not complete, an initial public offering process. In relation to this initial public offering process, we incurred
various costs including legal costs, accounting costs, printing costs and costs to amend our Senior Secured Credit Facilities contingent on the initial public offering. Adjustments reflect amounts
accrued in the period; a portion of the corresponding cash expenditures have been or will be made in other fiscal periods.
- (o)
- In
fiscal 2014, we made a strategic decision to implement a large scale economic hedge on the price of diesel fuel by entering into commodity swap
agreements for 23.8 million gallons that matured in fiscal 2015 and for 13.4 million gallons that will mature in fiscal 2016. For reference, we purchased approximately 26 million
gallons of diesel fuel for use in our operations during fiscal 2015. Unrealized (gains)/losses represent non-cash (income)/expense in the periods in which they are reported.
- (p)
- In fiscal 2016, we implemented economic hedges on a rise in interest rates for fiscal 2017, fiscal 2018 and the nine months ended September 30, 2019. These hedges resulted in $2.8 million in unrealized losses in the six months ended June 30, 2016. These derivatives represent a risk management tool to reduce the Company's exposure to rising interest rates and are viewed by management as a financing cost similar to interest. Unrealized (gains)/losses represent non-cash (income)/expense in the periods in which they are reported.
19
Investing in our common stock involves a high degree of risk. You should carefully consider the risks and uncertainties described below, together with the risks and uncertainties described elsewhere in this prospectus, including our consolidated financial statements and the related notes contained elsewhere in this prospectus, before you decide to purchase shares of our common stock. If any of the following risks or uncertainties actually occurs, our business, financial condition, results of operations, cash flow and prospects could be materially and adversely affected. As a result, the price of our common stock could decline and you could lose all or part of your investment in our common stock.
Risks Related to Our Business
We have a history of losses and may not achieve or sustain profitability in the future.
We incurred net losses of $33.6 million, $17.1 million and $117.8 million for the years ended December 31, 2015, 2014 and 2013 respectively, and $14.0 million and $19.3 million for the six months ended June 30, 2016 and 2015, respectively. Although we achieved profitability during the second quarter of 2016, we may not sustain this profitability in the future. In addition, we may be unable to fully utilize our net operating losses prior to their expiration, which may result in lower earnings going forward.
We operate in a highly competitive industry and may not be able to compete effectively with larger and better capitalized companies and governmental service providers.
Our industry is highly competitive and requires substantial labor and capital resources. Some of the markets in which we compete or plan to compete are served by one or more large, national companies, as well as by regional and local companies of varying sizes and resources, some of which may have accumulated substantial goodwill in their markets. Some of our competitors may also be better capitalized than we are, have greater name recognition than we do or be able to provide or be willing to bid their services at a lower price than we may be willing to offer. Our inability to compete effectively could hinder our growth or adversely impact our operating results.
We also compete with counties, municipalities and solid waste districts that maintain or could in the future choose to maintain their own waste collection and disposal operations, including through the implementation of flow control ordinances or similar legislation. These operators may have financial advantages over us because of their access to user fees and similar charges, tax revenues, tax-exempt financing or government subsidies.
We may lose contracts through competitive bidding, early termination or governmental action.
We derive a significant portion of our revenues from markets in which we have exclusive arrangements, including municipal contracts. Our municipal contracts are for a specified term and are or will be subject to competitive bidding in the future. Although we intend to bid on additional municipal contracts in our target markets, we may not always, or ever, be the successful bidder. In addition, some or all of our customers, including municipalities, may terminate their contracts with us prior to their scheduled expiration dates. Similar risks may affect contracts that we are awarded to operate municipally owned assets, such as landfills.
Governmental action may also affect our exclusive arrangements. Municipalities may annex unincorporated areas within counties where we provide collection services. As a result, our customers in such annexed areas may be required to obtain services from competitors that have been franchised by the annexing municipalities to provide those services. In
20
addition, municipalities in which we provide services on a competitive basis may elect to franchise those services. Unless we are awarded franchises by these municipalities, we will lose customers. Municipalities may also decide to directly provide services to their residents, on an optional or mandatory basis, which may cause us to lose customers. If we are not able to replace lost revenues resulting from unsuccessful competitive bidding, early termination or the renegotiation of existing contracts with other revenues within a reasonable time period, our results of operations and financial condition could be adversely affected. Additionally, the loss of municipal contracts through competitive bidding, early termination or governmental action could cause long lived tangible and intangible assets to be impaired and require a charge against earnings.
Our results are vulnerable to economic conditions.
Our business and financial results would be harmed by downturns in the general economy, or in the economy of the regions in which we operate as well as other factors affecting those regions. In an economic slowdown, we experience the negative effects of decreased waste generation, increased competitive pricing pressure, customer turnover, reductions in customer service requirements, and customer business closings and bankruptcies. Two lines of business that could see a more immediate impact would be 1) construction and demolition and 2) special waste disposal. In addition, a weaker economy may result in declines in recycled commodity prices. Worsening economic conditions or a prolonged or recurring economic recession could adversely affect our operating results and expected seasonal fluctuations. Further, we cannot assure you that any improvement in economic conditions after such a downturn will result in positive improvement in our operating results or cash flows.
Some of our customers, including governmental entities, have suffered financial difficulties affecting their credit risk, which could negatively impact our operating results.
We provide service to a number of governmental entities and municipalities, some of which have suffered significant financial difficulties due to the downturn in the economy, reduced tax revenue and/or high cost structures. Some of these entities could be unable to pay amounts owed to us or renew contracts with us at previous or increased rates. Many non-governmental customers have also suffered serious financial difficulties, including bankruptcy in some cases. Purchasers of our recyclable commodities can be particularly vulnerable to financial difficulties in times of commodity price volatility. The inability of our customers to pay us in a timely manner or to pay increased rates, particularly large national accounts, could negatively affect our operating results.
Our financial and operating performance may be affected by the inability in some instances to renew landfill permits, obtain new landfills or expand existing ones. Further, the cost of operation and/or future construction of our existing landfills may become economically unfeasible causing us to abandon or cease operations.
We currently own or operate 39 active landfills. Our ability to meet our financial and operating objectives may depend in part on our ability to acquire, lease or renew landfill permits, expand existing landfills and develop new landfill sites. It has become increasingly difficult and expensive to obtain required permits and approvals to build, operate and expand solid waste management facilities, including landfills and transfer stations. Operating permits for landfills in states where we operate generally must be renewed periodically (typically, every five to ten years). These operating permits often must be renewed several times during the permitted life of a landfill pursuant to a process that is often time-consuming, requires numerous hearings and compliance with zoning, environmental and other requirements, is
21
frequently challenged by special interest and other groups and may result in the denial of a permit or renewal, the award of a permit or renewal for a shorter duration than we believed was otherwise required by law or the imposition of burdensome terms and conditions that may adversely affect our results of operations. We may not be able to obtain new landfill sites in order to expand into new, non-exclusive markets or expand existing landfill sites in order to support acquisitions and internal growth in our existing markets because increased volumes would further shorten the lives of these landfills. It is also possible that the operation or expansion of existing landfills may become economically unfeasible based on management's assessment of permitting issues, acceptable waste streams, available volumes and operating costs, in which case we may abandon expansion plans or abandon or cease operations entirely at a particular landfill. Any such decision could result in impairment charges as well as ongoing costs for closure and site remediation. See "Management's Discussion and Analysis of Financial Condition and Results of Operations—Critical Accounting Policies and Estimates—Landfill Accounting—Amortization of Landfill Assets."
We could be precluded from entering into or maintaining permits or certain contracts if we are unable to obtain sufficient third-party financial assurance or adequate insurance coverage.
Public solid waste collection, recycling and disposal contracts, and obligations associated with landfill closure and post-closure monitoring typically require us to obtain performance or surety bonds, letters of credit or other means of financial assurance to secure our contractual performance. We currently obtain performance and surety bonds from multiple financial institutions. However, if we are unable to obtain financial assurance in the future in sufficient amounts from appropriately rated sureties or at acceptable rates, we could be precluded from entering into additional municipal contracts or from obtaining or retaining landfill management contracts or operating permits. Any future difficulty in obtaining insurance could also impair our ability to secure future contracts conditioned upon having adequate insurance coverage.
Our accruals for our landfill site closure and post-closure costs and contamination-related costs may be inadequate.
We are required to pay capping, closure and post-closure maintenance costs for all of our landfill sites. Our obligations to pay closure or post-closure costs or other contamination-related costs may exceed the amount we have accrued and reserved and other amounts available from funds or reserves established to pay such costs. In addition, subsequent to the completion or closure of a landfill site, we may be liable for unforeseen environmental issues, which could result in our payment of substantial remediation costs that could adversely affect our financial condition or operating results. See "Management's Discussion and Analysis of Financial Condition and Results of Operations—Critical Accounting Policies and Estimates—Landfill Accounting—Amortization of Landfill Assets."
Our business requires a high level of capital expenditures.
Our business is capital-intensive. We must use a substantial portion of our cash flows from operating activities toward capital expenditures, which reduces our flexibility to use such cash flows for other purposes, such as reducing our indebtedness. Our capital expenditures could increase if we make acquisitions or further expand our operations or as a result of factors beyond our control, such as changes in federal, state, local or non-U.S. governmental requirements. The amount that we spend on capital expenditures may exceed current expectations, which may require us to obtain additional funding for our operations or impair our ability to grow our business.
22
We may engage in strategic acquisitions in the future, which may pose significant risks and could have an adverse effect on our operations.
We seek to grow through strategic acquisitions in addition to internal growth. We may engage in acquisitions in order to acquire or develop additional disposal capacity or businesses that are complementary to our core business strategy. We expect that increased consolidation in the solid waste services industry will continue to reduce the number of attractive acquisition candidates. If we identify suitable acquisition candidates, we may be unable to negotiate successfully their acquisition at a price or on terms and conditions acceptable to us, including limitations imposed by our debt obligations. We may have to borrow money or incur liabilities in order to finance any future obligations and we may not be able to do so on terms favorable to us or at all. In addition, we may be unable to obtain the necessary regulatory approvals to complete potential acquisitions. The integration of acquired businesses and other assets may require significant management time and resources that would otherwise be available for the ongoing management of our existing operations. Furthermore, acquired assets may be subject to liabilities and risks that were not identified at the time they were acquired.
A portion of our growth and future financial performance depends on our ability to integrate acquired businesses and the success of our acquisitions.
One component of our growth strategy involves achieving economies of scale and operating efficiencies by growing through acquisitions. We may not achieve these goals unless we are able effectively to combine the operations of acquired businesses with our existing operations. Similar risks may affect contracts that we are awarded to operate municipally-owned assets, such as landfills. In addition, we are not always able to control the timing of our acquisitions. Our inability to complete acquisitions within the time frames that we expect may cause our operating results to be less favorable than expected, which could cause our stock price to decline.
Even if we are able to make acquisitions on advantageous terms and are able to integrate them successfully into our operations and organization, some acquisitions may not fulfill our anticipated financial or strategic objectives in a given market due to factors that we cannot control, such as the price of crude oil, market position, competition, customer base, loss of key employees, third-party legal challenges or governmental actions. In addition, we may change our strategy with respect to a market or acquired businesses and decide to sell such operations at a loss, or keep those operations and recognize an impairment of goodwill and/or intangible assets. Additionally, the loss of municipal contracts through competitive bidding, early termination or governmental action could cause long lived tangible and intangible assets acquired in business combinations to be impaired. Similar risks may affect contracts that we are awarded to operate municipally owned assets, such as landfills.
Each business that we acquire or have acquired may have liabilities or risks that we fail or are unable to discover, or that become more adverse to our business than we anticipated at the time of acquisition.
It is possible that the operations or sites we have acquired in the past, or which we may acquire in the future, have liabilities or risks with respect to former or existing operations or properties, or otherwise, which we have not been able to identify and assess through our due diligence investigations. As a successor owner, we may be legally responsible for those liabilities that arise from businesses that we acquire. Even if we obtain legally enforceable representations, warranties and indemnities from the sellers of such businesses, they may not cover the liabilities fully or the sellers may not have sufficient funds to perform their obligations. Some environmental liabilities, even if we do not expressly assume them, may be
23
imposed on us under various regulatory schemes and other applicable laws regardless of whether we caused or contributed to any conditions that result in such liabilities. In addition, our insurance program may not cover such sites and will not cover liabilities associated with some environmental issues that may have existed prior to attachment of coverage. A successful uninsured claim against us could harm our financial condition or operating results. Furthermore, risks or liabilities of which we are unaware or we judge to be not material or remote at the time of acquisition may develop into more serious risks to our business. Any adverse outcome resulting from such risks or liabilities could harm our operations and financial results and create negative publicity, which could damage our reputation, competitive position and stock price.
The seasonal nature of our business and "event-driven" waste projects cause our results to fluctuate.
Based on historic trends, we expect our operating results to vary seasonally, with revenues typically lowest in the first quarter, higher in the second and third quarters, and lower in the fourth quarter than in the second and third quarters. This seasonality reflects the lower volume of solid waste generated during the late fall, winter and early spring because of decreased construction and demolition activities during the winter months in the U.S., and reduced drilling activity during harsh weather conditions. Conversely, mild winter weather conditions may reduce demand for oil and natural gas, which may cause our customers to curtail their drilling programs, which could result in production of lower volumes of waste.
Our business is located mainly in the Southern, Midwestern and Eastern United States. Therefore, our business, financial condition and results of operations are susceptible to downturns in the general economy in these geographic regions and other factors affecting the regions, such as state regulations and severe weather conditions.
Adverse winter weather conditions slow waste collection activities, resulting in higher labor and operational costs. Greater precipitation in the winter increases the weight of collected waste, resulting in higher disposal costs, which are calculated on a per ton basis, and increased leachate disposal costs. Certain weather conditions, including severe storms, may result in temporary suspension of our operations, which can significantly impact the operating results of the affected areas. Conversely, weather-related occurrences and other "event-driven" waste projects can boost revenues through heavier weight loads or additional work for a limited time period. These factors impact period-to-period comparisons of financial results.
We may be subject in the normal course of business to judicial, administrative or other third-party proceedings that could interrupt or limit our operations, result in adverse judgments, settlements or fines and create negative publicity.
Individuals, citizens groups, trade associations, community groups or environmental activists may bring actions against us in connection with our operations that could interrupt or limit the scope of our business. Many of these matters raise difficult and complicated factual and legal issues and are subject to uncertainties and complexities. The timing of the final resolutions to lawsuits, regulatory inquiries, and governmental and other legal proceedings is uncertain. Additionally, the possible outcomes or resolutions to these matters could include adverse judgments or settlements, either of which could require substantial payments or other financial obligations. Any adverse outcome in such proceedings could harm our operations and financial results and create negative publicity, which could damage our reputation and competitive position. See "Business—Legal Proceedings."
24
Fuel supply and prices may fluctuate significantly and we may not be able to pass on cost increases to our customers.
The price and supply of fuel can fluctuate significantly based on international, political and economic circumstances, as well as other factors outside our control, such as actions by the Organization of the Petroleum Exporting Countries and other gas producers, regional production patterns, weather conditions, political instability in oil and gas producing regions and environmental concerns. We rely on fuel to run our collection and transfer trucks and our equipment used in our transfer stations and landfill operations. Supply shortages could substantially increase our operating expenses. Additionally, as fuel prices increase, our direct and indirect operating expenses increase and many of our vendors raise their prices as a means to offset their own rising costs.
To manage our exposure to volatility in fuel prices, we may enter into fuel derivative contracts as a risk management tool to mitigate the potential impact of certain market risks associated with fluctuations in fuel prices; however, because energy prices can fluctuate significantly in a relatively short amount of time, we must also continually monitor and adjust our risk management strategies to address not only fuel price increases, but also fuel price volatility. As evidenced by the extreme decline in diesel fuel prices during the fourth quarter of 2014, diesel fuel prices are subject to significant volatility based on a variety of factors. In addition, the cost of these risk management tools generally increases with sustained high potential for volatility in the fuel market. For fiscal 2016, we utilized fuel derivative contracts to manage our exposure to fluctuations in fuel pricing and as of June 30, 2016 we had 6.7 million gallons under fixed price derivative contracts.
A portion of our contracts have cost pass-through provisions pursuant to which we pass through to our customers the incremental cost or benefit from higher or lower fuel prices, respectively. Since we economically hedge our fuel costs, depending on the extent and level of our fuel derivative contracts, we are subject to the risk that fuel prices will fall below the level of our fuel derivative contracts and we will have to pass such lower prices through to our customers resulting in lower fuel fee revenue, even though our fuel costs remain higher under our fuel derivative contracts.
Over the last several years, regulations have been adopted mandating changes in the composition of fuels for motor vehicles. The renewable fuel standards that the United States Environmental Protection Agency (the "EPA") sets annually affect the type of fuel our motor vehicle fleet uses. Pursuant to the Energy Independence and Security Act of 2007, the EPA establishes annual renewable fuel volume requirements and separate volume requirements for four different categories of renewable fuels (renewable fuel, advanced biofuel, cellulosic biofuel and biomass-based diesel). These volume requirements set standards for the proportion of refiners' or importers' total fuel volume that must be renewable and must take into account the fuels' impact on reducing greenhouse gas ("GHG") emissions. These regulations are one of many factors that may affect the cost of the fuel we use.
Our operations also require the use of products (such as liners at our landfills) the costs of which may vary with the price of petrochemicals. An increase in the price of petrochemicals could increase the cost of those products, which would increase our operating and capital costs. We are also susceptible to increases in indirect fuel fees from our vendors.
We are expanding our CNG truck fleet, which makes us increasingly dependent on the availability of CNG and CNG fueling infrastructure and vulnerable to CNG prices.
We currently operate CNG trucks which make up a portion of our fleet. We plan to continue to transition an additional portion of our collection fleet from diesel fuel to CNG. However, CNG is not yet broadly available in North America; as a result, we have constructed
25
and operate natural gas fueling stations, some of which also serve the public or pre-approved third parties. Until the public and third parties in North America broadly adopt CNG, which may not be on the timetable we anticipate, it will remain necessary for us to invest capital in CNG fueling infrastructure in order to power our CNG fleet. Concerns have been raised about the potential for emissions from fueling infrastructure that serve natural gas-fueled vehicles. New regulation of, or restrictions on, CNG fueling infrastructure or reductions in associated tax incentives could increase our operating costs.
Additionally, fluctuations in the price and supply of CNG could substantially increase our operating expenses, and a reduction in the existing cost differential between CNG and diesel fuel could materially reduce the benefits we anticipate from our investment in CNG vehicles.
Fluctuations in the prices of commodities may adversely affect our financial condition, results of operations and cash flows.
We collect and process recyclable materials such as paper, cardboard, plastics, aluminum and other metals for sale to third parties. Our results of operations may be affected by changing prices or market requirements for recyclable materials. The resale and purchase prices of, and market demand for, recyclable materials fluctuate due to changes in economic conditions and numerous other factors beyond our control. These fluctuations may affect our financial condition, results of operations and cash flows.
Increases in labor and disposal and related transportation costs could impact our financial results.
Our continued success will depend on our ability to attract and retain qualified personnel. We compete with other businesses in our markets for qualified employees. From time to time, the labor supply is tight in some of our markets. A shortage of qualified employees, such as truck drivers or mechanics, would require us to enhance our wage and benefits packages to compete more effectively for employees, to hire more expensive temporary employees or to contract for services with more expensive third-party vendors. Labor is one of our highest costs and relatively small increases in labor costs per employee could materially affect our cost structure. If we fail to attract and retain qualified employees, control our labor costs during periods of declining volumes or recover any increased labor costs through increased prices we charge for our services or otherwise offset such increases with cost savings in other areas, our operating margins could suffer. Disposal and related transportation costs are a significant cost category for us. If we incur increased disposal and related transportation costs to dispose of solid waste and if we are unable to pass these costs on to our customers, our operating results would suffer.
Efforts by labor unions could divert management attention and adversely affect operating results.
From time to time, labor unions attempt to organize our employees. Some groups of our employees are represented by unions, and we have negotiated collective bargaining agreements with most of these groups. We are currently engaged in negotiations with other groups of employees represented by unions. Additional groups of employees may seek union representation in the future. From time to time, we are subject to unfair labor practice charges, complaints and other legal, administrative and arbitration proceedings initiated against us by unions, the National Labor Relations Board or our employees, which could negatively impact our operating results. Negotiating collective bargaining agreements could divert management attention, which could also adversely affect operating results. If we are unable to negotiate acceptable collective bargaining agreements, we may be subject to labor disruptions, such as union-initiated work stoppages, including strikes. Depending on the type
26
and duration of any labor disruptions, our operating expenses could increase significantly, which could adversely affect our financial condition, results of operations and cash flows.
We could face significant withdrawal liability if we withdraw either individually or as part of a mass withdrawal from participation in any underfunded multiemployer pension plans in which we participate.
We participate in a number of "multiemployer" pension plans administered by employer and employee trustees. We make periodic contributions to these plans pursuant to our various contractual obligations to do so. In the event that we withdraw from participation in or otherwise cease our contributions to one of these plans, then applicable law regarding withdrawal liability could require us to make additional contributions to the plan if it is underfunded, and we would have to reflect that as an expense in our consolidated statement of operations and as a liability on our consolidated balance sheet. Our withdrawal liability that would be paid to any multiemployer plan would depend on the extent of the plan's funding of vested benefits. In the ordinary course of our renegotiation of collective bargaining agreements with labor unions that participate in these plans, we may decide to discontinue participation in a plan, and in that event, we could face a withdrawal liability. Some multiemployer plans in which we participate may, from time to time, have significant underfunded liabilities. Such underfunding could increase the size of our potential withdrawal liability.
Increases in insurance costs and the amount that we self-insure for various risks could reduce our operating margins and reported earnings.
We maintain high deductible insurance policies for automobile, general, employer's, environmental, directors' and officers', employment practices and fiduciary liability as well as for employee group health insurance, property insurance and workers' compensation. We carry umbrella policies for certain types of claims to provide excess coverage over the underlying policies and per incident deductibles. The amounts that we self-insure could cause significant volatility in our operating margins and reported earnings based on the occurrence and claim costs of incidents, accidents, injuries and adverse judgments. Our insurance accruals are based on claims filed and estimates of claims incurred but not reported and are developed by our management with assistance from our third-party actuary and our third-party claims administrator. To the extent these estimates are inaccurate, we may recognize substantial additional expenses in future periods that would reduce operating margins and reported earnings. From time to time, actions filed against us include claims for punitive damages, which are generally excluded from coverage under all of our liability insurance policies. A punitive damage award could have an adverse effect on our reported earnings in the period in which it occurs. Significant increases in premiums on insurance that we retain also could reduce our margins.
We may record material charges against our earnings due to any number of events that could cause impairments to our assets.
In accordance with GAAP, we capitalize certain expenditures and advances relating to disposal site development, expansion projects, acquisitions, software development costs and other projects. Additionally, we record long term tangible and intangible assets in relation to businesses we acquire. Events that could, in some circumstances, lead to an impairment of these assets include, but are not limited to, shutting down a facility or operation or abandoning a development project or the denial of an expansion permit or the loss of a municipal contract through the competitive bidding process, early termination or governmental action. Additionally, declining waste volumes and development of, and
27
customer preference for, alternatives to traditional waste disposal could warrant asset impairments. If we determine an asset or expansion project is impaired, we will charge against earnings any unamortized capitalized expenditures and advances relating to such asset or project reduced by any portion of the capitalized costs that we estimate will be recoverable, through sale or otherwise. We also carry a significant amount of goodwill on our Consolidated Balance Sheet, which is required to be assessed for impairment annually, and more frequently in the case of certain triggering events. We may be required to incur charges against earnings if such impairment tests indicate that the fair value of a reporting unit is below its carrying value. Any such charges could have a material adverse effect on our results of operations.
We depend significantly on the services of the members of our senior, regional and local management teams, and the departure of any of those persons could cause our operating results to suffer.
Our success depends significantly on the continued individual and collective contributions of our senior, regional and local management teams. The loss of the services of any member of our senior, regional or local management or the inability to hire and retain experienced management personnel could have a material adverse effect on us.
If we are not able to develop new service offerings or if a competitor develops or obtains exclusive rights to a breakthrough technology, our financial results may suffer.
Our existing and proposed service offerings to customers may require that we invest in, develop or license, and protect, new technologies. We may experience difficulties or delays in the research, development, production or marketing of new services, which may negatively impact our operating results and prevent us from recouping or realizing a return on the investments required to bring new services to market. We and others in the industry are increasingly focusing on new technologies that provide alternatives to traditional disposal and maximize the resource value of waste. If a competitor develops or obtains exclusive rights to a breakthrough technology that provides a revolutionary change in traditional waste management, our financial results may suffer.
We are increasingly dependent on technology in our operations and, if our technology fails, our business could be adversely affected.
We may experience problems with the operation of our current information technology systems or the technology systems of third parties on which we rely, as well as the development and deployment of new information technology systems, that could adversely affect, or even temporarily disrupt, all or a portion of our operations until resolved. Inabilities and delays in implementing new systems can also affect our ability to realize projected or expected cost savings. Additionally, any systems failures could impede our ability to timely collect and report financial results in accordance with applicable laws.
Our business is subject to operational and safety risks, including the risk of personal injury to employees and others.
Provision of environmental and waste management services involves risks, such as truck accidents, equipment defects, malfunctions and failures and natural disasters, which could potentially result in releases of hazardous materials, injury or death of employees and others or a need to shut down or reduce operation of our facilities while remedial actions are undertaken. These risks expose us to potential liability for pollution and other environmental damages, personal injury, loss of life, business interruption and property damage or destruction.
28
While we seek to minimize our exposure to such risks through comprehensive training and compliance programs, as well as vehicle and equipment maintenance programs, if we were to incur substantial liabilities in excess of any applicable insurance, our business, results of operations and financial condition could be adversely affected.
The adoption of new accounting standards or interpretations could adversely affect our financial results.
Our implementation of and compliance with changes in accounting rules and interpretations could adversely affect our operating results or cause unanticipated fluctuations in our results in future periods. The accounting rules and regulations that we must comply with are complex and continually changing. Recent actions and public comments from the U.S. Securities and Exchange Commission (the "SEC") have focused on the integrity of financial reporting. The Financial Accounting Standards Board (the "FASB") has recently introduced several new or proposed accounting standards, or is developing new proposed standards, which would represent a significant change from current industry practice. In addition, many companies' accounting policies are being subjected to heightened scrutiny by regulators and the public. While our financial statements have been prepared in accordance with GAAP, we cannot predict the impact of future changes to accounting principles or our accounting policies on our financial statements in the future.
We are subject to substantial governmental regulation and failure to comply with these requirements, as well as enforcement actions and litigation arising from an actual or perceived breach of such requirements, could subject us to fines, penalties and judgments, and impose limits on our ability to operate and expand.
We are subject to potential liability and restrictions under environmental laws and regulations, including those relating to the transportation, recycling, treatment, storage and disposal of wastes, discharges of pollutants to air and water, and the remediation of contaminated soil, surface water and groundwater. The waste management industry has been and will continue to be subject to regulation, including permitting and related financial assurance requirements, as well as attempts to further regulate the industry, including efforts to regulate the emission of GHG. Our operations are subject to a wide range of federal, state and, in some cases, local environmental, odor and noise and land use restrictions. Further restrictions could include:
- •
- limitations on siting and constructing new waste disposal, transfer, recycling or processing facilities or on expanding existing
facilities;
- •
- regulations or levies on collection and disposal prices, rates and volumes;
- •
- limitations or bans on disposal or transportation of out-of-state waste or certain categories of waste;
- •
- mandates regarding the management of solid waste, including requirements to recycle, divert or otherwise process certain waste,
recycling and other streams; or
- •
- limitations or restrictions on the recycling, processing or transformation of waste, recycling and other streams.
Regulations affecting the siting, design and closure of landfills could require us to undertake investigatory or remedial activities, curtail operations or close landfills temporarily or permanently. Future changes in these regulations may require us to modify, supplement or replace equipment or facilities. The costs of complying with these regulations could be substantial. In order to develop, expand or operate a landfill or other waste management facility, we must have various facility permits and other governmental approvals, including
29
those relating to zoning, environmental protection and land use. These permits and approvals are often difficult, time consuming and costly to obtain and could contain conditions that limit our operations.
We also have significant financial obligations relating to final capping, closure, post-closure and environmental remediation at our existing landfills. We establish accruals for these estimated costs, but we could underestimate such accruals. Environmental regulatory changes could accelerate or increase capping, closure, post-closure and remediation costs, requiring our expenditures to materially exceed our current accruals.
Legislation allowing restrictions on interstate transportation of out-of-state or out-of-jurisdiction waste and certain types of flow control, or judicial interpretations of interstate waste and flow control legislation, could adversely affect our solid and hazardous waste management services.
Additionally, regulations establishing extended producer responsibility ("EPR") are being considered or implemented in many places around the world, including in the U.S. EPR regulations are designed to place either partial or total responsibility on producers to fund the post-use life cycle of the products they create. Along with the funding responsibility, producers may be required to take over management of local recycling programs by taking back their products from end users or managing the collection operations and recycling processing infrastructure. There is no federal law establishing EPR in the U.S.; however, state and local governments could, and in some cases have, taken steps to implement EPR regulations. If wide-ranging EPR regulations were adopted, they could have a fundamental impact on the waste streams we manage and how we operate our business, including contract terms and pricing. A significant reduction in the waste, recycling and other streams we manage could have a material adverse effect on our financial condition, results of operations and cash flows.
Enforcement or implementation of foreign regulations can affect our ability to export products. In 2013, the Chinese government began to strictly enforce regulations that establish limits on moisture and non-conforming materials that may be contained in imported recycled paper and plastics. The higher quality expectations resulting from initiatives such as Operation Green Fence can drive up operating costs in the recycling industry, particularly for single stream materials recovery facilities ("MRFs"). Single stream MRFs process a wide range of commingled materials and tend to receive a higher percentage of non-recyclables, which results in increased processing and residual disposal costs. If Operation Green Fence or other similar initiatives or new regulations increase our operating costs in the future, and we are not able to recapture those costs from our customers, such regulations could have a material adverse effect on our results of operations.
If we are not able to comply with the requirements that apply to a particular facility or if we operate without the necessary approvals or permits, we could be subject to administrative or civil, and possibly criminal, fines and penalties, and we may be required to spend substantial capital to bring an operation into compliance, to temporarily or permanently discontinue activities and/or take corrective actions, possibly including the removal of landfilled materials. We may be liable for any environmental damage that our current or former facilities cause, including damage to neighboring landowners or residents, particularly as a result of the contamination of soil, groundwater or surface water, and especially drinking water, or to natural resources. We may also be liable for any on-site environmental contamination caused by pollutants or hazardous substances whose transportation, treatment or disposal we or our predecessors arranged or conducted. Those costs or actions could be significant to us and impact our results of operations, cash flows and available capital. We may not have sufficient insurance coverage for our environmental liabilities, such coverage
30
may not cover all of the potential liabilities to which we may be subject and we may not be able to obtain insurance coverage in the future at reasonable expense or at all.
We may make additional acquisitions from time to time in the future, and we have tried and will continue to try to evaluate and limit environmental risks and liabilities presented by businesses to be acquired prior to the acquisition. It is possible that some liabilities, including ones that may exist only because of the past operations of an acquired business, may prove to be more difficult or costly to address than we anticipate.
It is also possible that government officials responsible for enforcing environmental laws and regulations may believe an issue is more serious than we expect, or that we will fail to identify or fully appreciate an existing liability before we become legally responsible for addressing it. Some of the legal sanctions to which we could become subject could cause the suspension or revocation of a needed permit, prevent us from, or delay us in, obtaining or renewing permits to operate or expand our facilities, or harm our reputation.
Future changes in regulations applicable to oil and gas drilling and production could adversely affect our energy services business.
Our energy services business may be adversely affected if drilling activity slows due to industry conditions beyond our control, in addition to changes in oil and gas prices. Changes in laws or government regulations regarding GHG emissions from oil and gas operations and/or hydraulic fracturing could increase our customer's costs of doing business and reduce oil and gas exploration and production by customers. Recently, there has been increased attention from the public, some states and the EPA to the alleged potential for hydraulic fracturing to impact drinking water supplies. There is also heightened regulatory focus on emissions of methane that occur during drilling and transportation of natural gas, as well as protective disposal of drilling residuals. Increased regulation of oil and gas exploration and production and new rules regarding the treatment and disposal of wastes associated with exploration and production operations could increase our costs to provide oilfield services, decrease demand for our energy services business, and reduce our margins and revenue from such services.
Our operations are subject to environmental, health and safety laws and regulations, as well as contractual obligations that may result in significant liabilities.
There is risk of incurring significant environmental, health and safety liabilities in the use, treatment, storage, transfer and disposal of waste materials. Under applicable environmental laws and regulations, we could be liable if our operations have a negative impact on human health or cause environmental damage to our properties or to the property of other landowners, particularly as a result of the contamination of air, drinking water or soil. Under current law, we could also be held liable for damage caused by conditions that existed before we acquired the assets or operations involved. This risk is of particular concern as we execute our growth strategy, partially through acquisitions, because we may be unsuccessful in identifying and assessing potential liabilities during our due diligence investigations. Further, the counterparties in such transactions may be unable to perform their indemnification obligations owed to us. Our operations include the hauling of medical waste and the hauling and disposal of asbestos. If, notwithstanding our efforts, we inadvertently arrange for the transportation, disposal or treatment of hazardous substances that cause environmental contamination, or if a predecessor owner made such arrangements and, under applicable law, we are treated as a successor to the prior owner, we could be held liable. Any substantial liability for environmental damage or violations of health and safety laws and regulations could have a material adverse effect on our financial condition, results of operations and cash flows.
31
In the ordinary course of our business, we have in the past, we are currently, and we may in the future, become involved in legal and administrative proceedings relating to land use and environmental laws and regulations. These include proceedings in which:
- •
- agencies of federal, state, local or foreign governments seek to impose liability on us under applicable statutes, sometimes involving
civil or criminal penalties for violations, or to revoke or deny renewal of a permit we need;
- •
- local communities, citizen groups, landowners or governmental agencies oppose the issuance of a permit or approval we need, allege violations of the permits under which we operate or laws or regulations to which we are subject, or seek to impose liability on us for environmental damage.
We generally seek to work with the authorities or other persons involved in these proceedings to resolve any issues raised. If we are not successful, the adverse outcome of one or more of these proceedings could result in, among other things, material increases in our costs or liabilities as well as material charges for asset impairments.
The adoption of climate change legislation or regulations restricting emissions of GHGs could increase our costs to operate.
Our landfill operations emit methane, which is identified as a GHG. There are a number of legislative and regulatory efforts at the state, regional and federal levels to curtail the emission of GHGs to ameliorate the effect of climate change. On August 3, 2015, the EPA finalized the Clean Power Plan rule, which regulates CO2 emissions from existing power plants, and the Carbon Pollution Standards for new, modified and reconstructed power plants. Also, on January 14, 2015, the Obama Administration announced the goal of limiting methane emissions via a host of proposed and anticipated regulations directed at the oil and gas industry. On August 18, 2015, the EPA proposed updated methane emissions standards for new and modified oil and gas emissions sources. On August 14, 2015, the EPA proposed updates to its 1996 Emission Guidelines for existing MSW landfills that would further reduce methane emissions, and, in a separate action, the EPA issued a supplemental proposal for reducing methane emissions from new and modified landfills. Comprehensive federal climate change legislation could impose costs on our operations that might not be offset by the revenue increases associated with our lower-carbon service options, the materiality of which we cannot predict. In 2010, the EPA published a Prevention of Significant Deterioration ("PSD") and Title V GHG Tailoring Rule, which expanded the EPA's federal air permitting authority to include the six GHGs. The rule sets new thresholds for GHG emissions that define when the Clean Air Act of 1970, as amended (the "Clean Air Act"), permits are required. In June 2015, the EPA and the Department of Transportation's National Highway Traffic Safety Administration proposed a national program that would establish the next phase of GHG emissions and fuel efficiency standards for medium and heavy-duty vehicles. The current requirements of these rules have not significantly affected our operations or cash flows, due to the tailored thresholds and exclusions of certain emissions from regulation. However, if certain changes to these regulations were enacted, such as lowering the thresholds or the inclusion of biogenic emissions, then the amendments could have an adverse effect on our operating costs.
Future changes in laws or renewed enforcement of laws regulating the flow of solid waste in interstate commerce could adversely affect our operating results.
Various state and local governments have enacted, or are considering enacting, laws and regulations that restrict the disposal within the jurisdiction of solid waste generated outside the jurisdiction. In addition, some state and local governments have promulgated, or are
32
considering promulgating, laws and regulations which govern the flow of waste generated within their respective jurisdictions. These "flow control" laws and regulations typically require that waste generated within the jurisdiction be directed to specified facilities for disposal or processing, which could limit or prohibit the disposal or processing of waste in our transfer stations and landfills. Such flow control laws and regulations could also require us to deliver waste collected by us within a particular jurisdiction to facilities not owned or controlled by us, which could increase our costs and reduce our revenues. In addition, such laws and regulations could require us to obtain additional costly licenses or authorizations to be deemed an authorized hauler or disposal facility.
The waste management industry is undergoing fundamental change as traditional waste streams are increasingly viewed as renewable resources and changes in laws and environmental policies may limit the items that enter the waste stream, any of which may adversely impact volumes and tipping fees at our landfills. Alternatives to landfill disposal may cause our revenues and operating results to decline.
As we have continued to develop our landfill capacity, the waste management industry has increasingly recognized the value of the waste stream as a renewable resource and new alternatives to landfilling are being developed that seek to maximize the renewable energy and other resource benefits of waste. We are increasingly competing with companies that seek to use parts of the waste stream as feedstock for renewable energy supplies. In addition, environmental initiatives, such as product stewardship and EPR, which hold manufacturers or other actors in the product life cycle responsible for the disposal of manufactured goods, may reduce the volume of products that enter the waste stream. Further, there may be changes in the laws that reclassify items in the waste stream as hazardous or that prohibit the disposal of certain wastes in our landfills. These alternatives and changes in laws may impact the demand for landfill space, which may affect our ability to operate our landfills at full capacity, as well as the tipping fees and prices that we can charge for utilization of landfill space. As a result, our revenues and operating margins could be adversely affected.
Counties and municipalities in which we own or operate landfills may be required to formulate and implement comprehensive plans to reduce the volume of solid waste deposited in landfills through waste planning, composting, recycling or other programs. Some state and local governments prohibit the disposal of certain types of wastes, such as yard waste, at landfills. Such actions have reduced and may in the future further reduce the volume of waste going to landfills in certain areas, which may affect our ability to operate our landfills at full capacity and could adversely affect our operating results.
We rely on computer systems to run our business and security breaches could disrupt or damage our internal operations, information technology systems or reputation and expose us to litigation risk.
We use computers in substantially all aspects of our business operations. We also use mobile devices, social networking and other online activities to connect with our employees and our customers. Such uses give rise to cybersecurity risks, including security breach, espionage, system disruption, hacking, cyber-attack, theft and inadvertent release of information. Our business involves the storage and transmission of numerous classes of sensitive and/or confidential information and intellectual property, including customers' personal information, private information about employees, and our financial and strategic information. Further, as we pursue our strategy to grow through strategic acquisitions in addition to internal growth, our technological presence and corresponding exposure to cybersecurity risk will increase. If we fail to assess and identify cybersecurity risks associated with acquisitions and new initiatives, we may become increasingly vulnerable to such risks.
33
Despite our implementation of network security measures, computer programmers and hackers, or even internal users, may be able to penetrate, create systems disruptions or cause shutdowns of our network security or that of third-party companies with which we have contracted. As a result, we could experience significant disruptions of our operations and incur significant expenses addressing problems created by these breaches. Such unauthorized access could disrupt our business and could result in a loss of revenue or assets and any compromise of customer information could subject us to customer or government litigation and harm our reputation, which could adversely affect our business and growth.
Many states have adopted breach of data security statutes or regulations that require notification to consumers if the security of their personal information is breached. Governmental focus on data security may lead to additional legislative action, and the increased emphasis on information security may lead customers to request that we take additional measures to enhance security. As a result, we may have to modify our business with the goal of further improving data security, which would result in increased expenses and operating complexity.
Risks Related to Our Indebtedness
Our indebtedness could adversely affect our financial condition and limit our financial flexibility.
As of June 30, 2016, we had approximately $2,300.5 million of indebtedness outstanding. We had cash interest expense of $115.1 million for the twelve months ended June 30, 2016. We may incur additional debt in the future. This amount of our indebtedness could:
- •
- increase our vulnerability to general adverse economic and industry conditions or increases in interest rates;
- •
- limit our ability to obtain additional financing or refinancings at attractive rates;
- •
- require the dedication of a substantial portion of our cash flow from operations to the payment of principal of, and interest on, our
indebtedness, thereby reducing the availability of such cash flow to fund our growth strategy, working capital, capital expenditures, dividends, share repurchases and other general corporate purposes;
- •
- limit our flexibility in planning for, or reacting to, changes in our business and the industry; and
- •
- place us at a competitive disadvantage relative to our competitors with less debt.
Further, our outstanding indebtedness is subject to financial and other covenants, which may be affected by changes in economic or business conditions or other events that are beyond our control. If we fail to comply with the covenants under any of our indebtedness, we may be in default under the documents governing such indebtedness, which may entitle the lenders thereunder to accelerate the debt obligations. A default under any of our indebtedness could result in cross-defaults under our other indebtedness. In order to avoid defaulting on our indebtedness, we may be required to take actions such as reducing or delaying capital expenditures, reducing or eliminating dividends or stock repurchases, selling assets, restructuring or refinancing all or part of our existing debt, or seeking additional equity capital, any of which may not be available on terms that are favorable to us, if at all.
34
Despite our high indebtedness level, we and our subsidiaries will still be able to incur significant additional amounts of debt, which could further exacerbate the risks associated with our substantial indebtedness.
We and our subsidiaries may be able to incur substantial additional indebtedness in the future. Although the agreements governing our indebtedness contain restrictions on incurring additional indebtedness, these restrictions are subject to a number of significant qualifications and exceptions and, under certain circumstances, the amount of indebtedness that could be incurred in compliance with these restrictions could be substantial.
Our debt agreements contain restrictions that limit our flexibility in operating our business.
The agreements governing our outstanding indebtedness and our existing Senior Secured Credit Facility contain various covenants that limit our ability to engage in specified types of transactions. These covenants may limit our ability and the ability of our restricted subsidiaries, under certain circumstances, to, among other things:
- •
- incur additional indebtedness and issue certain preferred stock;
- •
- pay dividends on, repurchase or make distributions in respect of capital stock or make other restricted payments;
- •
- place limitations on distributions from restricted subsidiaries;
- •
- issue or sell capital stock of restricted subsidiaries;
- •
- guarantee certain indebtedness;
- •
- make certain investments;
- •
- sell or exchange assets;
- •
- enter into transactions with affiliates;
- •
- create certain liens; and
- •
- consolidate, merge or transfer all or substantially all of our assets and the assets of our subsidiaries on a consolidated basis.
A breach of any of these covenants could result in a default under one or more of these agreements, including as a result of cross default provisions, and, in the case of our existing Revolving Credit Facility, permit the lenders to cease making loans to us.
We may utilize derivative financial instruments to reduce our exposure to market risks from changes in interest rates on our variable rate indebtedness and we will be exposed to risks related to counterparty credit worthiness or non-performance of these instruments.
We may enter into interest rate caps to limit our exposure to changes in variable interest rates. Such instruments will result in economic losses should interest rates not rise above the strike price in the derivative contracts. We will be exposed to credit-related losses which could impact the results of operations in the event of fluctuations in the fair value of the interest rate caps due to a change in the credit worthiness or non-performance by the counterparties to the interest rate caps. See Note 8, Derivative Instruments and Hedging Activities, to our audited consolidated financial statements included elsewhere in this prospectus.
35
Risks Related to this Offering and Ownership of Our Common Stock
No market currently exists for our common stock and an active, liquid trading market for our common stock may not develop, which may cause our common stock to trade at a discount from the initial offering price and make it difficult for you to sell the common stock you purchase.
Prior to this offering, there has not been a public market for our common stock. We cannot predict the extent to which investor interest in us will lead to the development of an active trading market on the NYSE or otherwise or how active and liquid that market may become. If an active and liquid trading market does not develop or continue, you may have difficulty selling any of our common stock that you purchase. The initial public offering price for the shares will be determined by negotiations between us and the underwriters and may not be indicative of prices that will prevail in the open market following this offering. The market price of our common stock may decline below the initial offering price and you may not be able to sell your shares of our common stock at or above the price you paid in this offering, or at all.
You will incur immediate and substantial dilution in the net tangible book value of the shares you purchase in this offering.
Existing stockholders have paid substantially less per share of our common stock than the price in this offering. The initial public offering price of our common stock will be substantially higher than the net tangible book value per share of outstanding common stock prior to completion of the offering. Based on our net tangible book value as of June 30, 2016 and upon the issuance and sale of shares of common stock by us at an assumed initial public offering price of $19.50 per share, which is the mid-point of the range set forth on the cover page of this prospectus, if you purchase our common stock in this offering, you will pay more for your shares than the amounts paid by our existing stockholders for their shares and you will suffer immediate dilution of approximately $27.87 per share in net tangible book value. Dilution is the amount by which the offering price paid by purchasers of our common stock in this offering will exceed the pro forma net tangible book value per share of our common stock upon completion of this offering. If the underwriters exercise their option to purchase additional shares, you will experience additional dilution. You may experience additional dilution upon future equity issuances or the exercise of stock options to purchase common stock granted to our employees, executive officers and directors under our current and future stock incentive plans. See "Dilution."
Our stock price may fluctuate significantly following the offering, and you may not be able to resell shares of our common stock at or above the price you paid or at all, and you could lose all or part of your investment as a result.
The trading price of our common stock is likely to be volatile. Market volatility often has been unrelated or disproportionate to the operating performance of particular companies. We and the underwriters will negotiate to determine the initial public offering price. You may not be able to resell your shares at or above the initial public offering price due to a number of factors such as those listed in "—Risks Related to Our Business" and the following:
- •
- results of operations that vary from the expectations of securities analysts and investors;
- •
- results of operations that vary from those of our competitors;
- •
- changes in expectations as to our future financial performance, including financial estimates and investment recommendations by securities analysts and investors;
36
- •
- declines in the market prices of stocks generally, or those of waste management companies;
- •
- strategic actions by us or our competitors;
- •
- announcements by us or our competitors of significant contracts, new services or products, acquisitions, joint ventures, other
strategic relationships or capital commitments;
- •
- changes in general economic or market conditions or trends in our industry or markets;
- •
- future sales of our common stock or other securities;
- •
- investor perceptions or the investment opportunity associated with our common stock relative to other investment alternatives;
- •
- the public's response to press releases or other public announcements by us or third parties, including our filings with the SEC;
- •
- announcements relating to litigation;
- •
- guidance, if any, that we provide to the public, any changes in this guidance or our failure to meet this guidance;
- •
- the development and sustainability of an active trading market for our stock;
- •
- changes in accounting principles; and
- •
- other events or factors, including those resulting from natural disasters, war, acts of terrorism or responses to these events.
These broad market and industry fluctuations may adversely affect the market price of our common stock, regardless of our actual operating performance. In addition, price volatility may be greater if the public float and trading volume of our common stock is low.
In the past, following periods of market volatility, stockholders have instituted securities class action litigation. If we were involved in securities litigation, it could have a substantial cost and divert resources and the attention of executive management from our business regardless of the outcome of such litigation.
Because we have no current plans to pay cash dividends on our common stock for the foreseeable future, you may not receive any return on investment unless you sell your common stock for a price greater than that which you paid for it.
We intend to retain future earnings, if any, for future operations, expansion and debt repayment and have no current plans to pay any cash dividends for the foreseeable future. The declaration, amount and payment of any future dividends on shares of common stock will be at the sole discretion of our board of directors. Our board of directors may take into account general and economic conditions, our financial condition and results of operations, our available cash and current and anticipated cash needs, capital requirements, contractual, legal, tax and regulatory restrictions and implications on the payment of dividends by us to our stockholders or by our subsidiaries to us and such other factors as our board of directors may deem relevant. In addition, our ability to pay dividends is limited by covenants contained in our existing indebtedness and may be limited by covenants contained in any future indebtedness we or our subsidiaries incur. As a result, you may not receive any return on an investment in our common stock unless you sell our common stock for a price greater than that which you paid for it.
37
If securities analysts do not publish research or reports about our business or if they downgrade our stock or our sector, our stock price and trading volume could decline.
The trading market for our common stock will rely in part on the research and reports that industry or financial analysts publish about us or our business. We do not control these analysts. Furthermore, if one or more of the analysts who do cover us downgrade our stock or our industry, or the stock of any of our competitors, or publish inaccurate or unfavorable research about our business, the price of our stock could decline. If one or more of these analysts ceases coverage of us or fail to publish reports on us regularly, we could lose visibility in the market, which in turn could cause our stock price or trading volume to decline.
Future sales, or the perception of future sales, by us or our existing stockholders in the public market following this offering could cause the market price for our common stock to decline.
After this offering, the sale of substantial amounts of shares of our common stock in the public market, or the perception that such sales could occur, could harm the prevailing market price of shares of our common stock. These sales, or the possibility that these sales may occur, also might make it more difficult for us to sell equity securities in the future at a time and at a price that we deem appropriate.
Upon consummation of this offering we will have a total of 83,743,542 shares of common stock outstanding. All of the shares of common stock sold in this offering will be freely tradable without restriction or further registration under the Securities Act.
Any shares held by our affiliates, as that term is defined under Rule 144 of the Securities Act ("Rule 144"), including our directors, executive officers and other affiliates (including affiliates of Highstar Capital) may be sold only in compliance with the limitations described in "Shares Eligible for Future Sale."
The remaining shares will be "restricted securities" within the meaning of Rule 144 and subject to certain restrictions on resale following the consummation of this offering. Restricted securities may be sold in the public market only if they are registered under the Securities Act or are sold pursuant to an exemption from registration such as Rule 144, as described in "Shares Eligible for Future Sale."
In connection with this offering, we, our directors and executive officers, affiliates of Highstar Capital and our other key pre-IPO investors receiving our common stock in the Reorganization prior to this offering have each agreed to customary lock-up agreements with the underwriters, subject to certain exceptions, not to dispose of or hedge any of our or their common stock or securities convertible into or exchangeable for shares of common stock during the 180-day period starting from the date of this prospectus, except with the prior written consent of Deutsche Bank Securities Inc., Credit Suisse Securities (USA) LLC and Barclays Capital Inc. Securities subject to these lock-up agreements represent substantially all shares of common stock outstanding prior to this offering. See "Underwriting" for a description of these lock-up agreements.
Upon the expiration of the lock-up agreements described above, the remaining shares will be eligible for resale, which would be subject to volume, manner of sale and other limitations under Rule 144. In addition, pursuant to a registration rights agreement, our existing owners have the right, subject to certain conditions, to require us to register the sale of their shares of our common stock under the Securities Act. By exercising their registration rights and selling a large number of shares, our existing owners could cause the prevailing market price of our common stock to decline. Following completion of this offering, the shares covered by registration rights would represent approximately 77.0% of our outstanding common stock (or
38
74.4%, if the underwriters exercise in full their option to purchase additional shares). Registration of any of these outstanding shares of common stock would result in such shares becoming freely tradable without compliance with Rule 144 upon effectiveness of the registration statement. See "Shares Eligible for Future Sale."
As restrictions on resale end or if these stockholders exercise their registration rights, the market price of our shares of common stock could drop significantly if the holders of these shares sell them or are perceived by the market as intending to sell them. These factors could also make it more difficult for us to raise additional funds through future offerings of our shares of common stock or other securities. In the future, we may also issue our securities in connection with investments or acquisitions. The amount of shares of our common stock issued in connection with an investment or acquisition could constitute a material portion of then-outstanding shares of our common stock. Any issuance of additional securities in connection with investments or acquisitions may result in additional dilution to you.
Anti-takeover provisions in our organizational documents could delay or prevent a change of control.
Certain provisions of our certificate of incorporation and bylaws may have an anti-takeover effect and may delay, defer or prevent a merger, acquisition, tender offer, takeover attempt or other change of control transaction that a stockholder might consider in its best interest, including those attempts that might result in a premium over the market price for the shares held by our stockholders.
These provisions will provide for, among other things:
- •
- a classified board of directors with staggered three-year terms;
- •
- the ability of our board of directors to issue one or more series of preferred stock;
- •
- advance notice for nominations of directors by stockholders and for stockholders to include matters to be considered at our annual
meetings;
- •
- certain limitations on convening special stockholder meetings;
- •
- the removal of directors for cause and only upon the affirmative vote of holders of a majority of the shares of common stock entitled
to vote in the election of directors if Highstar Capital and its affiliates hold less than 50% of our outstanding shares of common stock; and
- •
- that certain provisions may be amended only by the affirmative vote of at least 66 2/3% of the shares of common stock entitled to vote.
These anti-takeover provisions could make it more difficult for a third party to acquire us, even if the third-party's offer may be considered beneficial by many of our stockholders. As a result, our stockholders may be limited in their ability to obtain a premium for their shares. See "Description of Capital Stock."
Affiliates of Highstar Capital may continue to control us and their interests may conflict with ours or yours in the future.
The beneficial ownership interests of affiliates of Highstar Capital following the offering will depend on the price of the shares offered, the number of shares sold and the underwriters' exercise of the option to purchase additional shares. Immediately following this offering, affiliates of Highstar Capital will beneficially own approximately 51.4% of our common stock, based on a public offering price of $19.50 per share, the mid-point of the range set forth on the cover of this prospectus, or approximately 49.7% if the underwriters
39
exercise in full their option to purchase additional shares. Moreover, under our stockholders' agreement with Highstar Capital, for so long as Highstar Capital and its affiliates own shares of our common stock representing at least 50% of the total voting power, we have agreed to nominate to our board individuals designated by Highstar Capital, representing a majority of seats on the board. Even when Highstar Capital and its affiliates cease to own shares of our stock representing a majority of the total voting power, for so long as Highstar Capital and its affiliates continue to own a significant percentage of our stock, Highstar Capital will still be able to significantly influence the composition of our board of directors and thereby influence our policies and operations, including the appointment of management, future issuances of our common stock or other securities, the payment of dividends, if any, on our common stock, the incurrence or modification of debt by us, amendments to our certificate of incorporation and bylaws and the entering into of extraordinary transactions, and their interests may not in all cases be aligned with your interests. In addition, Highstar Capital may have an interest in pursuing acquisitions, divestitures and other transactions that, in its judgment, could enhance its investment, even though such transactions might involve risks to you. For example, Highstar Capital could cause us to make acquisitions that increase our indebtedness or cause us to sell revenue-generating assets. Additionally, in certain circumstances, acquisitions of debt at a discount by purchasers that are related to a debtor can give rise to cancellation of indebtedness income to such debtor for U.S. federal income tax purposes.
So long as Highstar Capital continues to own a significant amount of our combined voting power, even if such amount is less than 50%, Highstar Capital will continue to be able to strongly influence or effectively control our decisions. In addition, Highstar Capital will be able to determine the outcome of all matters requiring stockholder approval and will be able to cause or prevent a change of control of the Company or a change in the composition of our board of directors and could preclude any unsolicited acquisition of the Company. The concentration of ownership could deprive you of an opportunity to receive a premium for your shares of common stock as part of a sale of the Company and ultimately might affect the market price of our common stock.
We may continue to be a "controlled company" within the meaning of the rules of the NYSE and the rules of the SEC. As a result, we may qualify for and, if qualified, intend to rely on, exemptions from certain corporate governance requirements that would otherwise provide protection to stockholders of other companies.
After completion of this offering, Highstar Capital may continue to control a majority of the voting power of our outstanding common stock. As a result, we may be a "controlled company" within the meaning of the corporate governance standards of the NYSE. Under these rules, a company of which more than 50% of the voting power is held by an individual, group or another company is a "controlled company" and may elect not to comply with certain corporate governance requirements, including:
- •
- the requirement that a majority of our board of directors consist of "independent directors" as defined under the rules of the NYSE;
- •
- the requirement that our director nominees be selected, or recommended for our board of directors' selection by a
nominating/governance committee comprised solely of independent directors with a written charter addressing the nominations process;
- •
- the requirement that the compensation of our executive officers be determined, or recommended to our board of directors for determination, by a compensation committee comprised solely of independent directors; and
40
- •
- the requirement for an annual performance evaluation of the nominating/corporate governance and compensation committees.
Following this offering, if we are a "controlled company" we intend to utilize these exemptions, if available. As a result, we may not have a majority of independent directors, our nominating/corporate governance committee, and compensation committee may not consist entirely of independent directors and such committees may not be subject to annual performance evaluations. Accordingly, you may not have the same protections afforded to stockholders of companies that are subject to all of the corporate governance requirements of the NYSE.
In addition, on June 20, 2012, the SEC passed final rules implementing provisions of the Dodd-Frank Wall Street Reform and Consumer Protection Act of 2010 pertaining to compensation committee independence and the role and disclosure of compensation consultants and other advisers to the compensation committee. The SEC's rules direct each of the national securities exchanges (including the NYSE on which we intend to list our common stock) to develop listing standards requiring, among other things, that:
- •
- compensation committees be composed of fully independent directors, as determined pursuant to new independence requirements;
- •
- compensation committees be explicitly charged with hiring and overseeing compensation consultants, legal counsel and other committee
advisors; and
- •
- compensation committees be required to consider, when engaging compensation consultants, legal counsel or other advisors, certain independence factors, including factors that examine the relationship between the consultant or advisor's employer and us.
Following this offering, if we are a "controlled company," we would not be subject to these compensation committee independence requirements.
41
This prospectus contains forward-looking statements within the meaning of the U.S. federal securities laws. All statements other than statements of historical facts in this prospectus, including, without limitation, those regarding our business strategy, financial position, results of operations, plans, prospects and objectives of management for future operations (including development plans and objectives relating to our activities), are forward-looking statements. Many, but not all, of these statements can be found by looking for words like "expect," "anticipate," "goal," "project," "plan," "believe," "seek," "will," "may," "forecast," "estimate," "intend," "future" and similar words. Statements that address activities, events or developments that we intend, expect or believe may occur in the future are forward-looking statements. Forward-looking statements do not guarantee future performance and may involve risks, uncertainties and other factors which could cause our actual results, performance or achievements to differ materially from the future results, performance or achievements expressed or implied in those forward-looking statements.
Examples of these risks, uncertainties and other factors include, but are not limited to:
- •
- our history of losses;
- •
- operating in a highly competitive industry and the inability to compete effectively with larger and better capitalized companies and
governmental service providers;
- •
- results being vulnerable to a downturn in economic conditions;
- •
- we may lose contracts through competitive bidding, early termination or governmental action;
- •
- some of our customers, including governmental entities, have suffered financial difficulties affecting their credit risk, which could
negatively impact our operating results;
- •
- our financial and operating performance may be affected by the inability in some instances to renew landfill operating permits, obtain
new landfills or expand existing ones;
- •
- the cost of operation and/or future construction of our existing landfills may become economically unfeasible causing us to abandon or
cease operations;
- •
- we could be precluded from maintaining permits or entering into certain contracts if we are unable to obtain sufficient third-party
financial assurance or adequate insurance coverage;
- •
- our accruals for our landfill site closure and post-closure costs may be inadequate;
- •
- our cash flow may not be sufficient to finance our high capital expenditure requirements;
- •
- our acquisitions, including our ability to integrate acquired businesses, or that the acquired businesses will have unexpected risks
or liabilities;
- •
- the seasonal nature of our business and event-driven waste projects that could cause our results to fluctuate;
- •
- we may be subject to judicial, administrative or other third-party proceedings that could interrupt or limit our operations, result in adverse judgments, settlements or fines and create negative publicity;
42
- •
- fuel supply and prices that may fluctuate significantly and that we may not be able to pass on cost increases to our customers or
effectively hedge such costs;
- •
- fluctuations in the prices of commodities;
- •
- increases in labor and disposal costs and related transportation costs could adversely impact our financial results;
- •
- derivatives could adversely affect our results;
- •
- efforts by labor unions to organize our workforce could adversely affect operating results;
- •
- we depend significantly on the services of the members of our senior, regional and local management teams, and the departure of any of
those persons could cause our operating results to suffer;
- •
- we are increasingly dependent on technology in our operations and, if our technology fails, our business could be adversely affected;
- •
- a cybersecurity incident could negatively impact our business and our relationships with customers;
- •
- operational and safety risks, including the risk of personal injury to employees and others;
- •
- we are subject to substantial governmental regulation and failure to comply with these requirements, as well as enforcement actions
and litigation arising from an actual or perceived breach of such requirements, could subject us to fines, penalties and judgments, and impose limits on our ability to operate and expand;
- •
- operations being subject to environmental, health and safety laws and regulations, as well as contractual obligations that may result
in significant liabilities;
- •
- future changes in laws or renewed enforcement of laws regulating the flow of solid waste in interstate commerce could adversely affect
our operating results;
- •
- fundamental change in the waste management industry as traditional waste streams are increasingly viewed as renewable resources and
changes in laws and environmental policies may limit the items that enter the waste stream, any of which may adversely impact volumes and tipping fees at our landfills;
- •
- alternatives to landfill disposal may cause our revenues and operating results to decline;
- •
- our substantial indebtedness and our working capital deficit;
- •
- our ability to implement growth strategy as and when planned; and
- •
- other risks described in "Risk Factors."
The above examples are not exhaustive and new risks may emerge from time to time. Except as required by law, we undertake no obligation to publicly update or revise any forward-looking statements, whether as a result of new information, future events or otherwise. Such forward-looking statements are based on our current beliefs, assumptions, expectations, estimates and projections regarding our present and future business strategies and the environment in which we will operate in the future. These forward-looking statements speak only as of the date of this report. We expressly disclaim any obligation or undertaking to release publicly any updates or revisions to any forward-looking statement contained herein to reflect any change in our expectations with regard thereto or any change of events, conditions or circumstances on which any such statement was based.
43
We estimate that the net proceeds to us from this offering, after deducting the underwriting discount and estimated offering expenses payable by us, will be approximately $351.4 million, based on an assumed initial public offering price of $19.50 per share, the mid-point of the range set forth on the cover of this prospectus, and assuming no exercise of the underwriters' option to purchase additional shares of common stock. An increase or decrease in the initial public offering price by $1.00 per share above or below the mid-point of the proposed range would result in an increase or decrease of approximately $18.1 million, as applicable, in net proceeds to us assuming the number of shares offered by us stays constant.
We intend to use the net proceeds from the sale by us of common stock in this offering to repay outstanding borrowings under the Term Loan B portion of our Senior Secured Credit Facilities. The Term Loan B borrowings accrue interest at 3.75% (as of June 30, 2016) and mature October 2019. On February 4, 2016, we obtained lender consent for certain amendments to our Senior Secured Credit Facilities, including the extension of the maturity of the commitments under the Revolving Credit Facility, the effectiveness of which is conditioned on the consummation of this offering and a minimum paydown of $100.0 million of borrowings under our Term Loan B (the "Minimum Debt Paydown") with the net proceeds of this offering. In connection with the amendment to our Senior Secured Credit Facilities, we paid total fees of approximately $5.2 million, which was paid to the lenders and the administrative agent, at the closing of the consent.
On August 4, 2016, we entered into a waiver to our Senior Secured Credit Facilities to waive the IPO condition to the extension of the maturity of the commitments under our Senior Secured Credit Facilities referred to above. As a result of the execution of the amendment and waiver, the maturity date with respect to approximately $280 million of the $300 million of commitments under the Revolving Credit Facility has been extended to October 2019. See "Description of Certain Indebtedness—Amendments to the Senior Secured Credit Facilities."
If the price per share in this offering exceeds the mid-point of the proposed range, we intend to use the additional net proceeds to repay additional indebtedness.
44
We have no current plans to pay dividends on our common stock following this offering. Any decision to declare and pay dividends in the future will be made at the sole discretion of our board of directors and will depend on, among other things, our results of operations, cash requirements, financial condition, contractual restrictions and other factors that our board of directors may deem relevant. Because we are a holding company and have no direct operations, we will only be able to pay dividends from funds we receive from our subsidiaries. In addition, our ability to pay dividends will be limited by covenants in our existing indebtedness and may be limited by the agreements governing other indebtedness we or our subsidiaries incur in the future. See "Description of Certain Indebtedness."
We paid dividends to Parent in the amount of $12.6 million, $7.5 million, and $9.0 million on our shares of common stock for the six months ended June 30, 2016 and for the years ended December 31, 2015 and 2014, respectively.
45
The following table sets forth our cash and cash equivalents and capitalization as of June 30, 2016:
- •
- on an actual basis from continuing operations; and
- •
- on an as adjusted basis to give effect to the following transactions:
- •
- the Reorganization, as defined in "Prospectus Summary—Organizational Structure Following This Offering;" and
- •
- the sale by us of 19,250,000 shares of our common stock in this offering, based on a public offering price of $19.50 per share, the mid-point of the range set forth on the cover of this prospectus, and after deducting the underwriting discount and estimated offering expenses payable by us and the intended application of the net proceeds therefrom as described in "Use of Proceeds."
You should read the following table in conjunction with the sections entitled "Use of Proceeds," "Selected Historical Consolidated Financial Information" and "Management's Discussion and Analysis of Financial Condition and Results of Operations" and our consolidated financial statements and related notes included elsewhere in this prospectus. The pro forma as adjusted column assumes that the underwriters do not exercise their option to purchase additional shares.
| |
As of June 30, 2016 | ||||||
|---|---|---|---|---|---|---|---|
| |
Actual | As Adjusted | |||||
| |
(in millions) |
||||||
Cash and cash equivalents |
$ | 1.2 | $ | 1.2 | |||
| | | | | | | | |
| | | | | | | | |
| | | | | | | | |
Long-term debt and capital lease obligations: |
|||||||
Revolving Credit Facility |
$ | 11.0 | $ | 11.0 | |||
Term Loan B |
1,685.5 | 1,334.1 | |||||
81/4% Senior Notes due 2020 |
550.0 | 550.0 | |||||
Capital lease obligations |
38.7 | 38.7 | |||||
Other debt |
15.3 | 15.3 | |||||
| | | | | | | | |
Total debt |
$ | 2,300.5 | $ | 1,949.1 | |||
| | | | | | | | |
Stockholders' Equity: |
|||||||
Common stock: $.01 par value, 1,000 shares authorized, issued and outstanding (a) |
$ | — | $ | 0.8 | |||
Additional paid-in capital |
1,091.7 | 1,442.3 | |||||
Accumulated deficit |
(625.2 | ) | (625.2 | ) | |||
| | | | | | | | |
Total stockholders' equity |
466.5 | 817.9 | |||||
| | | | | | | | |
Total capitalization |
$ | 2,767.0 | $ | 2,767.0 | |||
| | | | | | | | |
| | | | | | | | |
| | | | | | | | |
- (a)
- In conjunction with the Reorganization, our authorized capital will be increased to 1,000,000,000 shares of common stock and 100,000,000 shares of preferred stock, $0.01 per value per share, and we will be recapitalized so that there will be 64,493,542 shares of common stock issued and outstanding, prior to the sale of shares by us in this offering. No shares of preferred stock will be outstanding following the offering.
46
If you invest in shares of our common stock in this offering, your investment will be immediately diluted to the extent of the difference between the initial public offering price per share of common stock and the net tangible book deficit per share of common stock after this offering. Dilution results from the fact that the per share offering price of the shares of common stock is substantially in excess of the net tangible value per share attributable to the shares of common stock held by existing owners.
Our net tangible book deficit as of June 30, 2016 was approximately $(1,052.7) million, or $(16.32) per share of common stock. We calculate net tangible book deficit per share by taking the amount of our total tangible assets, reduced by the amount of our total liabilities, and then dividing that amount by the total number of shares of common stock outstanding after giving effect to the Reorganization.
After giving effect to the Reorganization and our sale of shares in this offering at an assumed initial public offering price of $19.50 per share, the mid-point of the range set forth on the cover of this prospectus, and after deducting underwriting discounts and estimated offering expenses payable by us, our net tangible book deficit as of June 30, 2016 would have been $(701.30) million, or $(8.37) per share of common stock. This represents an immediate decrease in net tangible book deficit of $7.95 per share of common stock to our existing owners and an immediate and substantial dilution of $27.87 per share of common stock to investors in this offering at the assumed initial public offering price.
The following table illustrates this dilution on a per share of common stock basis assuming the underwriters do not exercise their option to purchase additional shares of common stock:
Initial public offering price per share |
$ | 19.50 | |||||
Net tangible book deficit per share as of June 30, 2016 |
$ | (16.32 | ) | ||||
Decrease in pro forma net tangible book deficit per share attributable to new investors in this offering |
$ | 7.95 | |||||
As adjusted net tangible book deficit per share after giving effect to this offering |
$ | (8.37 | ) | ||||
| | | | | | | | |
Dilution per share to new investors purchasing shares in this offering |
$ | 27.87 | |||||
| | | | | | | | |
| | | | | | | | |
| | | | | | | | |
A $1.00 decrease in the assumed initial public offering price of $19.50 per share of common stock would increase our net tangible book deficit per share of our common stock by $0.22, assuming that the number of shares offered, as set forth on the cover of this prospectus, remains the same, after deducting estimated underwriting discounts and commissions payable by us.
If the underwriters exercise their option to purchase additional shares of our common stock in full, the pro forma as adjusted net tangible book deficit per share will be $(7.48) per share, the decrease in pro forma net tangible book deficit per share attributable to new investors in this offering will be $(8.84) per share and the dilution per share to new investors purchasing shares in this offering will be $26.98 per share. If we elect to increase the number of shares issued by us in this offering, the dilution in net tangible book value per share to investors in this offering will be increased. See "Use of Proceeds."
The table below summarizes as of June 30, 2016, on a pro forma as adjusted basis described above, the number of shares of our common stock, the total consideration, and the
47
average price per share (i) paid to us by our existing stockholders (determined based on our additional paid-in capital) and (ii) to be paid by new investors purchasing our common stock in this offering (assuming no exercise of the underwriters' option to purchase additional shares), before deducting the underwriting discount and estimated offering expenses payable by us and assuming an initial public offering price of $19.50 per share, the mid-point of the range set forth on the cover of this prospectus.
| |
|
|
Total Consideration (in thousands) |
|
||||||||||||
|---|---|---|---|---|---|---|---|---|---|---|---|---|---|---|---|---|
| |
Shares Purchased | |
||||||||||||||
| |
Average Price Per Share |
|||||||||||||||
| |
Number | Percent | Amount | Percent | ||||||||||||
Existing stockholders |
64,493,542 | 77.0 | % | $ | 1,091,700 | 74.4 | % | $ | 16.92 | |||||||
New investors |
19,250,000 | 23.0 | % | 375,375 | 25.6 | % | 19.50 | |||||||||
| | | | | | | | | | | | | | | | | |
Total |
83,743,542 | 100.0 | % | $ | 1,467,075 | 100.0 | % | |||||||||
| | | | | | | | | | | | | | | | | |
| | | | | | | | | | | | | | | | | |
| | | | | | | | | | | | | | | | | |
If the underwriters' option to purchase additional shares in this offering is exercised in full, the percentage of shares of our common stock held by existing stockholders will be reduced to 74.4% of the total number of shares of our common stock outstanding after this offering, and the number of shares held by new investors will increase to 22,137,500 shares, or 25.6% of the total number of shares of our common stock outstanding after this offering.
48
SELECTED HISTORICAL CONSOLIDATED FINANCIAL INFORMATION
The following table is derived from our historical consolidated financial information for the periods and as of the dates indicated. The selected historical consolidated financial information as of June 30, 2016 and for the six months ended June 30, 2016 and 2015 is derived from our unaudited condensed consolidated financial statements included elsewhere in this prospectus. The selected historical consolidated financial information as of June 30, 2015 is derived from our unaudited consolidated financial statements not included in this prospectus. Our unaudited consolidated financial statements have been prepared on the same basis as our audited consolidated financial statements and, in our opinion, reflect all adjustments, consisting only of normal and recurring adjustments, necessary for a fair presentation of such financial statements in all material respects.
The selected historical consolidated financial information as of December 31, 2015 and 2014 and for the years ended December 31, 2015, 2014 and 2013 is derived from our audited consolidated financial statements included elsewhere in this prospectus. The selected historical consolidated financial information as of December 31, 2013, 2012 and 2011 and for the years ended December 31, 2012 and 2011 is derived from our audited consolidated financial statements not included in this prospectus.
The financial data set forth in the following tables should be read in conjunction with our historical consolidated financial statements and related notes and "Management's Discussion and Analysis of Financial Condition and Results of Operations," each included elsewhere in this prospectus. The results for any interim period are not necessarily indicative of the results that may be expected for a full year or any future period.
49
| |
Six Months Ended June 30, |
For the Year Ended December 31, | ||||||||||||||||||||
|---|---|---|---|---|---|---|---|---|---|---|---|---|---|---|---|---|---|---|---|---|---|---|
| |
2016 | 2015 | 2015 | 2014 | 2013 | 2012 | 2011 | |||||||||||||||
| |
(in millions, except per share data) |
|||||||||||||||||||||
Consolidated Statement of Operations Data (a): |
||||||||||||||||||||||
Service revenues |
$ | 692.0 | $ | 685.5 | $ | 1,396.4 | $ | 1,403.0 | $ | 1,319.1 | $ | 537.9 | $ | 427.4 | ||||||||
Costs and expenses: |
||||||||||||||||||||||
Operating |
432.3 | 428.9 | 866.6 | 896.1 | 832.8 | 336.7 | 261.8 | |||||||||||||||
Selling, general and administrative (b) |
84.1 | 72.9 | 152.6 | 154.9 | 170.9 | 101.0 | 61.6 | |||||||||||||||
Depreciation and amortization |
125.4 | 127.4 | 259.1 | 271.4 | 278.9 | 104.1 | 76.5 | |||||||||||||||
Acquisition and development costs |
0.2 | 1.1 | 1.4 | 0.1 | 1.2 | 1.2 | 3.5 | |||||||||||||||
Loss on disposal of assets and asset impairments (c) |
0.1 | 17.5 | 21.6 | 6.5 | 3.2 | 45.8 | 14.1 | |||||||||||||||
Restructuring |
0.8 | — | — | 4.6 | 10.0 | 9.9 | — | |||||||||||||||
| | | | | | | | | | | | | | | | | | | | | | | |
Total operating costs and expenses |
642.9 | 647.8 | 1,301.3 | 1,333.6 | 1,297.0 | 598.7 | 417.5 | |||||||||||||||
| | | | | | | | | | | | | | | | | | | | | | | |
Operating income (loss) |
49.1 | 37.7 | 95.1 | 69.4 | 22.1 | (60.8 | ) | 9.9 | ||||||||||||||
Interest expense |
(68.6 | ) | (69.8 | ) | (138.0 | ) | (141.5 | ) | (163.1 | ) | (49.4 | ) | (24.5 | ) | ||||||||
Other income/(expense), net (d) |
0.4 | 3.7 | (10.1 | ) | (25.9 | ) | 0.3 | (8.1 | ) | (4.3 | ) | |||||||||||
| | | | | | | | | | | | | | | | | | | | | | | |
Loss before income taxes |
(19.1 | ) | (28.4 | ) | (53.0 | ) | (98.0 | ) | (140.7 | ) | (118.3 | ) | (18.9 | ) | ||||||||
(Benefit) expense for income taxes (e) |
(5.1 | ) | (9.1 | ) | (19.4 | ) | (80.6 | ) | (45.4 | ) | (13.5 | ) | 3.5 | |||||||||
| | | | | | | | | | | | | | | | | | | | | | | |
Net loss from continuing operations |
(14.0 | ) | (19.3 | ) | (33.6 | ) | (17.4 | ) | (95.3 | ) | (104.8 | ) | (22.4 | ) | ||||||||
Income (loss) from discontinued operations, net of tax (f) |
— | — | — | 0.3 | (22.5 | ) | (89.2 | ) | 0.2 | |||||||||||||
| | | | | | | | | | | | | | | | | | | | | | | |
Net loss |
(14.0 | ) | (19.3 | ) | (33.6 | ) | (17.1 | ) | (117.8 | ) | (194.0 | ) | (22.2 | ) | ||||||||
Less: net loss attributable to non-controlling interest |
— | — | — | — | — | (1.4 | ) | (0.2 | ) | |||||||||||||
| | | | | | | | | | | | | | | | | | | | | | | |
Net loss attributable to Advanced Disposal |
$ | (14.0 | ) | $ | (19.3 | ) | $ | (33.6 | ) | $ | (17.1 | ) | $ | (117.8 | ) | $ | (192.6 | ) | $ | (22.0 | ) | |
| | | | | | | | | | | | | | | | | | | | | | | |
| | | | | | | | | | | | | | | | | | | | | | | |
| | | | | | | | | | | | | | | | | | | | | | | |
Loss attributable to common stockholder from continuing operations per share |
||||||||||||||||||||||
Basic and diluted loss per share |
$ | (14,000 | ) | $ | (19,300 | ) | $ | (33,600 | ) | $ | (17,400 | ) | $ | (95,300 | ) | $ | (103,400 | ) | $ | (22,200 | ) | |
Net loss per share: |
||||||||||||||||||||||
Basic and diluted loss per share |
$ | (14,000 | ) | $ | (19,300 | ) | $ | (33,600 | ) | $ | (17,100 | ) | $ | (117,800 | ) | $ | (192,600 | ) | $ | (22,000 | ) | |
Consolidated Statement of Cash Flows Data: |
||||||||||||||||||||||
Net cash provided by operating activities |
$ | 104.4 | $ | 129.3 | $ | 244.5 | $ | 243.2 | $ | 180.3 | $ | 55.2 | $ | 86.8 | ||||||||
Net cash used in investing activities |
(70.8 | ) | (85.3 | ) | (197.4 | ) | (201.2 | ) | (154.8 | ) | (1,980.5 | ) | (133.7 | ) | ||||||||
Net cash (used in)/provided by financing activities |
(33.0 | ) | (35.7 | ) | (47.5 | ) | (53.0 | ) | (32.3 | ) | 1,937.2 | 40.7 | ||||||||||
Consolidated Balance Sheet Data (at period end): |
||||||||||||||||||||||
Total assets (h) |
$ | 3,374.7 | $ | 3,434.4 | $ | 3,422.3 | $ | 3,489.5 | $ | 3,554.2 | $ | 3,725.2 | $ | 1,374.6 | ||||||||
Debt, including current portion (g)(h) |
2,240.4 | 2,226.0 | 2,247.1 | 2,243.0 | 2,259.3 | 2,272.5 | 439.4 | |||||||||||||||
Total Advanced Disposal stockholder's equity |
466.5 | 501.9 | 489.8 | 528.9 | 551.5 | 662.5 | 721.5 | |||||||||||||||
- (a)
- We
completed the Veolia Acquisition on November 20, 2012 and the results of operations have been consolidated from the date of acquisition.
- (b)
- Includes
stock-based compensation expense. Stock based compensation expense for all periods presented was determined using the fair value method set forth
in ASC 718, "Compensation—Stock Compensation."
- (c)
- We
disposed of certain businesses in the South segment for strategic reasons in June 2015 and recorded a loss on disposal of $10.9 million for fiscal
2015. Additionally, we recorded an impairment of $6.4 million during fiscal 2015 in connection with the strategic decision to divest certain businesses in the South segment and the decision not
to pursue a landfill permit. In fiscal 2014, we recorded an impairment charge of $5.3 million in connection with the decision to divest a small brokerage business. In fiscal 2012, we recorded
an impairment charge of $43.7 million in connection with recoverability testing performed on a long-lived asset.
- (d)
- Changes in the fair value and settlements of the fuel derivative instruments are recorded in other income (expense), net in the condensed consolidated statements of operations and amounted to income of $1.5 million and expense of $0.2 million for the six months ended June 30, 2016 and 2015, respectively. Changes in the fair value of the interest rate caps purchased in May of 2016 are recorded in other income (expense), net in the condensed consolidated statements of operations and amounted to a loss of $2.8 million for the six months ended June 30, 2016. Amounts included in other (expense)/income net for fiscal 2015 and 2014 contain
50
unrealized and realized losses, net related to fuel derivative instruments of $15.4 million and $27.3 million, respectively, and a gain on the sale of a debt investment security of $2.5 million for fiscal 2015.
- (e)
- In
fiscal 2014, we completed a legal entity reorganization to achieve administrative efficiencies and as such recorded a valuation allowance release of
$51.4 million related to certain net operating losses that are more likely than not to be utilized.
- (f)
- Amounts
represent those operations that are considered to be discontinued operations. Refer to Note 4 "Discontinued Operations" in our audited
consolidated financial statements included elsewhere in this prospectus for further information.
- (g)
- Total
debt includes capital lease obligations of $38.7 million, $24.7 million, $28.2 million, $23.3 million,
$15.4 million and $12.3 million at June 30, 2016 and 2015 and December 31, 2015, 2014, 2013, and 2012, respectively.
- (h)
- Balances have been adjusted to reflect the retrospective adoption of ASU 2015-03, Interest—Imputation of Interest.
51
MANAGEMENT'S DISCUSSION AND ANALYSIS OF FINANCIAL CONDITION
AND RESULTS OF OPERATIONS
The following discussion should be read in conjunction with the "Summary Consolidated Financial Information and Other Data," "Selected Historical Consolidated Financial Information" and our consolidated financial statements and the related notes included elsewhere in this prospectus. In addition to historical consolidated financial information, the following discussion contains forward-looking statements that reflect our plans, estimates and beliefs. Our actual results could differ materially from those discussed in the forward-looking statements. Factors that could cause or contribute to these differences include those discussed elsewhere in this prospectus, particularly in "Risk Factors."
Overview
We are a leading integrated provider of non-hazardous solid waste collection, transfer, recycling and disposal services, operating primarily in secondary markets or under exclusive arrangements. We have a presence in 16 states across the Midwest, South and East regions of the United States, serving approximately 2.8 million residential and 221,000 C&I customers through our extensive network of 92 collection operations, 72 transfer stations, 21 owned or operated recycling facilities and 39 owned or operated landfills. We seek to drive financial performance in markets in which we own or operate a landfill or in certain disposal-neutral markets, where the landfill is owned by our municipal customer. In markets in which we own or operate a landfill, we aim to create and maintain vertically integrated operations through which we manage a majority of our customers' waste from the point of collection through the point of disposal, a process we refer to as internalization. By internalizing a majority of the waste in these markets, we are able to deliver high quality customer service while also ensuring a stable revenue stream and maximizing profitability and cash flow from operations. In disposal-neutral markets, we focus selectively on opportunities where we can negotiate exclusive arrangements with our municipal customers, facilitating highly-efficient and profitable collection operations with lower capital requirements.
Geographically, we focus our business principally in secondary, or less densely populated non-urban, markets where the presence of large national providers is generally more limited. We also compete selectively in primary, or densely populated urban, markets where we can capitalize on opportunities for vertical integration through our high-quality transfer and disposal infrastructure and where we can benefit from highly-efficient collection route density. We maintain an attractive mix of revenue from varying sources, including residential collections, C&I collections, landfill gas and special waste streams and fees charged to third parties for disposal in our network of transfer stations and landfills, with limited exposure to commodity sales. We also benefit from a high degree of customer diversification, with no single customer accounting for more than 2% of revenue for the twelve months ended June 30, 2016. Our business mix and large and diverse customer base, combined with our long term contracts and historically high renewal rates, provide us with significant revenue and earnings stability and visibility.
We intend to grow our business and expand the scope of our operations by adding new C&I customers, securing additional exclusive municipal contracts and executing value enhancing, tuck-in acquisitions, while maintaining a relentless focus on prudent cost management and pricing discipline. To this end, we are committed to investing in strategic infrastructure including the development and enhancement of our landfills, the conversion of our residential collection fleet to automated vehicles and the conversion of our collection fleet to CNG-fueled vehicles in certain markets in which we can achieve an attractive return on our investment. In addition to our focus on growing revenues and enhancing profitability, we
52
remain financially disciplined through our careful management of returns on equity and capital deployed.
Our fiscal year ends December 31 of each year and we refer to the fiscal year ended December 31, 2015 as "fiscal 2015," the fiscal year ended December 31, 2014 as "fiscal 2014," the fiscal year ended December 31, 2013 as "fiscal 2013" and the fiscal year ended December 31, 2012 as "fiscal 2012."
How We Generate Revenue
Through our subsidiaries, we generate revenue primarily by providing collection and disposal services to commercial, industrial, municipal and residential customers. Our remaining revenue is generated from recycling, fuel fees and environmental fees, landfill gas-to-energy operations and other ancillary revenue-generating activities. Revenues from our collection operations consist of fees we receive from municipal, subscription, residential and C&I customers and are influenced by factors such as collection frequency, type of collection equipment furnished, type and volume or weight of the waste collected, distance to the recycling, transfer station or disposal facilities and our disposal costs. Our standard C&I service agreement is a five-year renewable agreement. Management believes it maintains strong relationships with our C&I customers. Our municipal customer relationships are generally supported by exclusive contracts ranging from three to ten years in initial duration with subsequent renewal periods and we have historically achieved a renewal rate of approximately 85% with these customers. Certain of our municipal contracts have annual price escalation clauses that are tied to changes in an underlying base index such as the consumer price index. We provide commercial front load and temporary and permanent rolloff service offerings to our customers. While the majority of our rolloff services are provided to customers under long-term service agreements, we generally do not enter into contracts with our temporary rolloff customers due to the relatively short-term nature of most C&D projects.
Our transfer stations and landfills generate revenue from disposal or tipping fees. Revenues from our landfill operations consist of fees which are generally based on the type and weight or volume of waste being disposed of at our disposal facilities. Fees charged at transfer stations are generally based on the weight or volume of waste deposited, taking into account our cost of loading, transporting and disposing of the solid waste at a disposal site. Recycling revenue consists of disposal or tipping fees and proceeds from the sale of recyclable commodities to third parties.
The amounts charged for collection, disposal and recycling services may include fuel fees and environmental fees. Fuel fees and environmental fees are not designed to be specific to the direct costs and expenses to service an individual customer's account, but rather are designed to address and to help recover for changes in our overall cost structure and to achieve an operating margin acceptable to us.
Other revenue is comprised of ancillary revenue-generating activities, such as trucking, landfill gas-to-energy operations at municipal solid waste ("MSW") landfills, management of third-party owned landfills, customer service charges relating to overdue payments and customer administrative fees relating to customers who request paper copies of invoices rather than opting for electronic invoices and a small brokerage business (which we divested in 2015).
53
Key Factors Affecting Our Results of Operations
Business Expansion and Rationalization
Our results of operations are affected by our ability to complete tuck-in acquisitions and retain existing and win new municipal contracts at favorable margins. When we decide to pursue a new acquisition or contract, we focus particularly on operational efficiencies, including route optimization and our ability to leverage our network of landfills and transfer stations. We have completed 45 tuck-in acquisitions, primarily of collection operations, and we have been awarded 128 new long-term exclusive municipal contracts since the consummation of the Veolia Acquisition. We also seek to divest lower margin businesses which may result in impairment charges in the period of sale but benefit us by allowing us to redeploy capital to higher margin businesses.
General Economic Conditions and C&I Activity
Our results of operations are also affected by the strength of the economy and the level of C&I activity near our operations. Economic conditions have a direct effect on construction, demolition, new business formations and roll-off activity which impacts volumes of C&I waste. Residential waste volumes are also impacted by economic conditions, although to a lesser extent. Special waste volume, such as soil projects, energy waste, coal ash and other industrial process waste, which is driven by C&I projects and other general economic conditions, can vary substantially year to year based on economic and industrial conditions as well as the timing and size of projects in proximity to our operations. For example, our special waste volume was particularly high in 2014, primarily driven by a number of large soil projects and a higher level of shale gas activity, which have not persisted in 2015 and 2016. During periods of strong GDP growth, our business is fueled by increases in C&D activity, new business formations and new residential housing.
Pricing Discipline
Our ability to maintain or increase the price of our services has a significant effect on our results of operations. Our focus on secondary markets enhances our ability to maintain or increase prices. We also intend to enter into contracts or service agreements that permit rate increases and contain favorable pricing structures.
Operational Efficiency
We maintain a focus on prudent cost management and efficiency. We have implemented programs to increase sales productivity and pricing effectiveness, driver productivity, route optimization, maintenance efficiency and effective purchasing. Our ability to manage costs is a significant driver of our results.
Fuel costs represent a significant operating expense. When economically practical, we may enter into contracts or engage in other strategies to mitigate fuel price risk. In certain cases, we enter into fuel derivative contracts as a risk management tool to mitigate the potential impact of market risks associated with fluctuations in fuel prices. When available, we implement a fuel fee that is designed to recover a portion of our direct and indirect increases in fuel costs. Furthermore, we seek to minimize fuel costs through route optimization and the conversion to more CNG vehicles in our fleet. See "Quantitative and Qualitative Disclosures About Market Risk—Fuel Price Risk."
54
Seasonality and Severe Weather
Based on historic trends, we expect our operating results to vary seasonally, with revenues typically lowest in the first quarter, higher in the second and third quarters and lower in the fourth quarter than in the second and third quarters. This seasonality reflects the lower volume of solid waste generated during the late fall, winter and early spring because of decreased construction and demolition activities during the winter months in the U.S., and lower volumes of energy waste due to reduced drilling activity during harsh weather conditions. Conversely, mild winter weather conditions may reduce demand for oil and natural gas, which may cause some of our mining and exploration customers to curtail their drilling programs, which could result in production of lower volumes of waste.
Adverse winter weather conditions can slow waste collection activities, resulting in higher labor and operational costs. Greater precipitation in the winter increases the weight of collected waste, resulting in higher disposal costs, which are calculated on a per ton basis and increased leachate disposal costs. Certain weather conditions, including severe storms, may result in temporary suspension of our operations, which can significantly impact the operating results of the affected areas. Conversely, weather related occurrences and other "event driven" waste projects can boost revenues through heavier weight loads or additional work for a limited time period. These factors impact period to period comparisons of financial results.
Results of Operations
The following table sets forth for the periods indicated our consolidated results of operations and the percentage relationship that certain items from our consolidated financial statements bear to revenue (in millions and as a percentage of our revenue).
| |
Six Months Ended June 30, | Year Ended December 31, | |||||||||||||||||||||||||||||
|---|---|---|---|---|---|---|---|---|---|---|---|---|---|---|---|---|---|---|---|---|---|---|---|---|---|---|---|---|---|---|---|
| |
2016 | 2015 | 2015 | 2014 | 2013 | ||||||||||||||||||||||||||
Service revenues |
$ | 692.0 | 100.0 | % | $ | 685.5 | 100.0 | % | $ | 1,396.4 | 100.0 | % | $ | 1,403.0 | 100.0 | % | $ | 1,319.1 | 100.0 | % | |||||||||||
| | | | | | | | | | | | | | | | | | | | | | | | | | | | | | | | |
Operating costs and expenses |
|||||||||||||||||||||||||||||||
Operating |
432.3 | 62.5 | % | 428.9 | 62.6 | % | 866.6 | 62.1 | % | 896.1 | 63.9 | % | 832.8 | 63.1 | % | ||||||||||||||||
Selling, general and administrative |
84.1 | 12.2 | % | 72.9 | 10.6 | % | 152.6 | 10.9 | % | 154.9 | 11.0 | % | 170.9 | 13.0 | % | ||||||||||||||||
Depreciation and amortization |
125.4 | 18.1 | % | 127.4 | 18.6 | % | 259.1 | 18.6 | % | 271.4 | 19.3 | % | 278.9 | 21.1 | % | ||||||||||||||||
Acquisition and development costs |
0.2 | — | % | 1.1 | 0.2 | % | 1.4 | 0.1 | % | 0.1 | — | % | 1.2 | 0.1 | % | ||||||||||||||||
Loss on disposal of assets and asset impairments |
0.1 | — | % | 17.5 | 2.6 | % | 21.6 | 1.5 | % | 6.5 | 0.5 | % | 3.2 | 0.2 | % | ||||||||||||||||
Restructuring charges |
0.8 | 0.1 | % | — | — | % | — | — | % | 4.6 | 0.3 | % | 10.0 | 0.8 | % | ||||||||||||||||
| | | | | | | | | | | | | | | | | | | | | | | | | | | | | | | | |
Total operating costs and expenses |
642.9 | 92.9 | % | 647.8 | 94.5 | % | 1,301.3 | 93.2 | % | 1,333.6 | 95.1 | % | 1,297.0 | 98.3 | % | ||||||||||||||||
| | | | | | | | | | | | | | | | | | | | | | | | | | | | | | | | |
Operating income |
$ | 49.1 | 7.1 | % | $ | 37.7 | 5.5 | % | $ | 95.1 | 6.8 | % | $ | 69.4 | 4.9 | % | $ | 22.1 | 1.7 | % | |||||||||||
| | | | | | | | | | | | | | | | | | | | | | | | | | | | | | | | |
| | | | | | | | | | | | | | | | | | | | | | | | | | | | | | | | |
| | | | | | | | | | | | | | | | | | | | | | | | | | | | | | | | |
Operating income increased $11.4 million or 30.2% to $49.1 million for the six months ended June 30, 2016 from $37.7 million for the six months ended June 30, 2015. The increase for the six months ended June 30, 2016 was primarily the result of losses on disposal of businesses and impairment charges recorded in the 2015 period of $17.4 million relating to strategic divestitures in the South segment and discontinuing the pursuit of permitting at one landfill site. The increase in operating income was partially offset by expenses of $7.1 million related to the launch of the February initial public offering process including the $5.2 million fee associated with the amendment of our credit agreement contingent on an initial public
55
offering. Additional offsetting variances are described in the detailed discussion later in this section.
Operating income increased $25.7 million, or 37.0%, to $95.1 million in fiscal 2015 from $69.4 million in fiscal 2014 primarily due to the favorable net impact of acquiring higher margin businesses while divesting of lower margin operations, pricing gains, lower net fuel costs (defined as fuel expense less fuel recovery fees), reduced depreciation and amortization expense, lower risk management expense, decreased selling, general and administrative costs due to completion of the rebranding and integration efforts associated with the Veolia Acquisition, partially offset by lower special waste volumes, reduced revenue from sale of recyclables and higher repairs and maintenance costs.
Operating income increased $47.3 million, or 214.0%, to $69.4 million in fiscal 2014 from $22.1 million in fiscal 2013 as a result of organic growth, the full year impact of acquisitions, decreased selling, general and administrative costs and lower restructuring charges.
Revenue
The following table sets forth our consolidated revenues for the periods indicated (in millions and as a percentage of our total revenue).
| |
Six Months Ended June 30, | Year Ended December 31, | |||||||||||||||||||||||||||||
|---|---|---|---|---|---|---|---|---|---|---|---|---|---|---|---|---|---|---|---|---|---|---|---|---|---|---|---|---|---|---|---|
| |
2016 | 2015 | 2015 | 2014 | 2013 | ||||||||||||||||||||||||||
Collection |
$ | 486.2 | 70.3 | % | $ | 480.6 | 70.1 | % | $ | 971.4 | 69.6 | % | $ | 950.8 | 67.8 | % | $ | 897.3 | 68.0 | % | |||||||||||
Disposal |
254.1 | 36.7 | % | 238.5 | 34.8 | % | 499.0 | 35.7 | % | 492.8 | 35.1 | % | 453.8 | 34.4 | % | ||||||||||||||||
Sale of recyclables |
9.7 | 1.4 | % | 11.8 | 1.7 | % | 24.8 | 1.8 | % | 33.5 | 2.4 | % | 35.9 | 2.7 | % | ||||||||||||||||
Fuel fees and environmental fees |
39.9 | 5.8 | % | 41.0 | 6.0 | % | 85.8 | 6.1 | % | 92.8 | 6.6 | % | 81.5 | 6.2 | % | ||||||||||||||||
Other |
38.7 | 5.6 | % | 43.6 | 6.4 | % | 82.2 | 5.9 | % | 95.5 | 6.8 | % | 95.2 | 7.2 | % | ||||||||||||||||
Intercompany eliminations |
(136.6 | ) | (19.7 | )% | (130.0 | ) | (19.0 | )% | (266.8 | ) | (19.1 | )% | (262.4 | ) | (18.7 | )% | (244.6 | ) | (18.5 | )% | |||||||||||
| | | | | | | | | | | | | | | | | | | | | | | | | | | | | | | | |
Total |
$ | 692.0 | 100.0 | % | $ | 685.5 | 100.0 | % | $ | 1,396.4 | 100.0 | % | $ | 1,403.0 | 100.0 | % | $ | 1,319.1 | 100.0 | % | |||||||||||
| | | | | | | | | | | | | | | | | | | | | | | | | | | | | | | | |
| | | | | | | | | | | | | | | | | | | | | | | | | | | | | | | | |
| | | | | | | | | | | | | | | | | | | | | | | | | | | | | | | | |
Six Months Ended June 30, 2016 compared to the Six Months Ended June 30, 2015
Revenue for the six months ended June 30, 2016 was $692.0 million, an increase of $6.5 million or 0.9% from revenue of $685.5 million for the six months ended June 30, 2015. The revenue change was impacted by the following:
- •
- Collection revenue increased by $5.6 million or 1.2%, of which $3.7 million was from the commercial business due to
acquisitions and pricing initiatives, $1.3 million from the residential business due to acquisitions and new contracts in the South and East segments partially offset by the loss of residential
contracts in the Midwest segment, and $0.5 million from the rolloff business due to price and volume growth in our South segment.
- •
- Disposal revenue increased by $15.6 million or 6.5% due to increased volume across all waste streams, except shale, most
notably in our South and East segments.
- •
- Sale of recyclables decreased by $2.1 million or 17.8%, primarily due to a divestiture completed in the fourth quarter of 2015
which accounted for $1.9 million of the decrease.
- •
- Fuel fees and environmental fees decreased by $1.1 million or 2.7%, driven by decreased fuel fees as a result of lower diesel fuel prices which contributed $7.4 million
56
- •
- Other revenue decreased by $4.9 million or 11.2%, due to the sale of a small brokerage business in April 2015 which contributed $3.2 million of the decrease and a reduction in landfill gas revenue which contributed $1.3 million of the decrease. Landfill gas revenue decreased due to the expiration of landfill gas credit agreements and a decline in the market price for landfill gas.
partially offset by increased environmental fees of $6.0 million due to an increased rate that went into effect in July 2015.
The following table reflects changes in components of our revenue, as a percentage of total revenue, for the six months ended June 30, 2016 and 2015:
| |
Six Months Ended June 30, | ||||||
|---|---|---|---|---|---|---|---|
| |
2016 | 2015 | |||||
Average yield |
1.9 | % | 2.0 | % | |||
Recycling |
— | % | (0.8 | )% | |||
Fuel fee revenue |
(1.1 | )% | (1.1 | )% | |||
| | | | | | | | |
Total yield |
0.8 | % | 0.1 | % | |||
Organic volume |
(0.3 | )% | 0.4 | % | |||
Acquisitions |
2.0 | % | 1.1 | % | |||
Divestitures |
(1.6 | )% | (1.0 | )% | |||
| | | | | | | | |
Total revenue growth |
0.9 | % | 0.6 | % | |||
| | | | | | | | |
| | | | | | | | |
| | | | | | | | |
Average yield is defined as aggregate contribution of price changes excluding recycled commodities and fuel fee revenue. During the six months ended June 30, 2016, we experienced the following changes in components of our revenue as compared to the same period in 2015:
- •
- Average yield increased revenue by 1.9% for the six months ended June 30, 2016, due primarily to positive pricing in our
commercial and rolloff lines of business and an increase in our environmental fees that went into effect in July 2015.
- •
- Fuel fee revenue decreased revenue by 1.1% during the six months ended June 30, 2016. These fees fluctuate in response to
changes in prices for diesel fuel on which the surcharge is based and, consequently, any decrease in fuel prices results in a decrease in our revenue. Lower fuel fee revenue for the six months ended
June 30, 2016 resulted primarily from the decrease in fuel prices.
- •
- Organic volume decreased revenue by 0.3% during the six months ended June 30, 2016, primarily due to the loss of residential
contracts in the Midwest segment and lower shale volumes in the East segment, offset in part by increased disposal volume across all waste streams, except shale, most notably in our South and East
segments
- •
- Acquisitions increased revenue by 2.0% during the six months ended June 30, 2016, due to our execution of acquisition
opportunities that further enhance our vertical integration strategy.
- •
- Divestitures decreased revenue by 1.6% during the six months ended June 30, 2016, due to our strategic decisions to divest low margin businesses.
57
Fiscal Year Ended December 31, 2015 compared to the Fiscal Year Ended December 31, 2014
Revenue for fiscal 2015 was $1,396.4 million, a decrease of $6.6 million, or 0.5%, from revenue of $1,403.0 million in fiscal 2014. The change was primarily impacted by the following:
- •
- Collection revenue increased by $20.6 million, or 2.2%, of which $12.1 million was contributed by acquisitions,
$10.4 million was from pricing gains, and $5.4 million was from residential volume primarily from new contract wins. The increase was partially offset by reduced shale volume of
$2.8 million and decreased rolloff volume of $1.5 million.
- •
- Disposal revenue increased by $6.2 million, or 1.3%, driven primarily by higher pricing and increased disposal volumes at
transfer stations in our South segment, offset by declines in special waste volumes.
- •
- Sale of recyclables decreased by $8.7 million, or 26.0%, primarily resulting from the decline in average commodity prices.
- •
- Fuel fees and environmental fees decreased by $7.0 million, or 7.5%, driven primarily by decreased fuel fees which contributed
$18.6 million, partially offset by increased environmental fees of $10.4 million.
- •
- Other revenue decreased by $13.3 million, or 13.9%, mainly due to the sale of a small brokerage business which accounted for $14.0 million of revenue in 2014.
The following table reflects changes in components of our revenue, as a percentage of total revenue, for the years ended December 31, 2015 and 2014:
| |
Year Ended December 31, | ||||||
|---|---|---|---|---|---|---|---|
| |
2015 | 2014 | |||||
Average yield |
2.2 | % | 1.1 | % | |||
Recycling |
(0.5 | )% | (0.4 | )% | |||
Fuel fee revenue |
(1.3 | )% | 0.4 | % | |||
| | | | | | | | |
Total yield |
0.4 | % | 1.1 | % | |||
Organic volume |
(0.8 | )% | 4.0 | % | |||
Acquisitions |
1.2 | % | 1.3 | % | |||
Divestitures |
(1.3 | )% | — | % | |||
| | | | | | | | |
Total revenue change |
(0.5 | )% | 6.4 | % | |||
| | | | | | | | |
| | | | | | | | |
| | | | | | | | |
During the year ended December 31, 2015, we experienced the following changes in components of our revenue as compared to the same period in 2014:
- •
- Average yield increased revenue by 2.2% for the year ended December 31, 2015, due to an increase in our environmental fees that
went into effect in July 2015 and positive pricing in all lines of business with the exception of our residential collection business and our C&D disposal business which were relatively flat.
- •
- Recycling revenue decreased 0.5% for the year ended December 31, 2015 primarily resulting from the decline in average commodity
prices.
- •
- Fuel fee revenue decreased revenue by 1.3% during the year ended December 31, 2015. These fees fluctuate in response to changes in prices for diesel fuel on which the surcharge is based and, consequently, any decrease in fuel prices results in a decrease
58
- •
- Organic volume decreased revenue by 0.8% during the year ended December 31, 2015, primarily due to lower special waste volumes,
offset in part by increased disposal volumes at transfer stations in our South segment.
- •
- Acquisitions increased revenue by 1.2% during the year ended December 31, 2015, due to our execution of acquisition
opportunities that further enhance our vertical integration strategy.
- •
- Divestitures decreased revenue by 1.3% during the year ended December 31, 2015, due to our strategic decisions to divest low margin businesses.
in our revenue. Lower fuel fee revenue for the year ended December 31, 2015 resulted primarily from the decrease in fuel prices.
Fiscal Year Ended December 31, 2014 compared to the Fiscal Year Ended December 31, 2013
Revenue for fiscal 2014 was $1,403.0 million, an increase of $83.9 million, or 6.4%, from revenue of $1,319.1 million in fiscal 2013. The increase was due to the following:
- •
- Strong residential growth of $18.8 million, which included new contract wins of approximately $8.6 million, increased
rolloff volumes of $9.3 million, increased commercial volumes of $8.4 million and increased volume due to acquisitions of $16.7 million;
- •
- Landfill volume increases driven by special waste projects and MSW, which contributed $14.0 million and $4.4 million,
respectively;
- •
- MSW and special waste price increases, which accounted for $5.5 million and $2.9 million, respectively;
and
- •
- Fuel fees and environmental fees contributed $10.3 million and were partially offset by headwinds from recycling pricing.
During the year ended December 31, 2014, we experienced the following changes in our revenue as compared to the same period in 2013:
- •
- Average yield increased revenue by 1.1% for the year ended December 31, 2014, due to positive pricing related to rolloff, MSW
and special waste disposal.
- •
- Recycling revenue decreased 0.4% for the year ended December 31, 2014 primarily resulting from the decline in average commodity
prices.
- •
- Fuel fee revenue increased revenue by 0.4% during the year ended December 31, 2014. These fees fluctuate in response to changes
in prices for diesel fuel on which the surcharge is based and, consequently, any increase in fuel prices results in an increase in our revenue. Higher fuel fee revenue for the year ended
December 31, 2014 resulted primarily from the increase in fuel prices.
- •
- Organic volume increased revenue by 4.0% during the year ended December 31, 2014, due to higher collection and disposal
volumes.
- •
- Acquisitions increased revenue by 1.3% during the year ended December 31, 2014, due to our execution of acquisition opportunities that further enhance our vertical integration strategy.
59
Operating Expenses
The following table summarizes our operating expenses (in millions and as a percentage of our revenue).
| |
Six Months Ended June 30, | Year Ended December 31, | |||||||||||||||||||||||||||||
|---|---|---|---|---|---|---|---|---|---|---|---|---|---|---|---|---|---|---|---|---|---|---|---|---|---|---|---|---|---|---|---|
| |
2016 | 2015 | 2015 | 2014 | 2013 | ||||||||||||||||||||||||||
Operating |
$ | 425.8 | 61.5 | % | $ | 422.2 | 61.6 | % | $ | 853.5 | 61.1 | % | $ | 882.6 | 62.9 | % | $ | 819.1 | 62.1 | % | |||||||||||
Accretion of landfill retirement obligations |
6.5 | 0.9 | % | 6.7 | 1.0 | % | 13.1 | 1.0 | % | 13.5 | 1.0 | % | 13.7 | 1.0 | % | ||||||||||||||||
| | | | | | | | | | | | | | | | | | | | | | | | | | | | | | | | |
Operating expense |
$ | 432.3 | 62.5 | % | $ | 428.9 | 62.6 | % | $ | 866.6 | 62.1 | % | $ | 896.1 | 63.9 | % | $ | 832.8 | 63.1 | % | |||||||||||
| | | | | | | | | | | | | | | | | | | | | | | | | | | | | | | | |
| | | | | | | | | | | | | | | | | | | | | | | | | | | | | | | | |
| | | | | | | | | | | | | | | | | | | | | | | | | | | | | | | | |
Our operating expenses include the following:
- •
- Labor and related benefits, which consist of salaries and wages, health and welfare benefits, incentive compensation and payroll
taxes.
- •
- Transfer and disposal costs, which include tipping fees paid to third-party disposal facilities and transfer stations and
transportation and subcontractor costs (which include costs for independent haulers who transport waste from transfer stations to our disposal facilities and costs for local operators who provide
waste handling services associated with our national accounts in markets outside our standard operating areas).
- •
- Maintenance and repairs expenses, which include labor, maintenance and repairs to our vehicles, equipment and containers.
- •
- Fuel costs, which include the direct cost of fuel used by our vehicles, net of fuel tax credits. We also incur certain indirect fuel
costs in our operations that are not taken into account in the foregoing sentence.
- •
- Franchise fees and taxes, which consist of municipal franchise fees, host community fees and royalties.
- •
- Risk management expenses, which include casualty insurance premiums and claims payments and estimates for claims incurred but not
reported.
- •
- Other expenses, which include expenses such as facility operating costs, equipment rent, leachate treatment and disposal and other
landfill maintenance costs.
- •
- Accretion expense related to landfill capping, closure and post-closure is included in "Operating Expenses" in our consolidated financial statements, however, it is excluded from the table below (refer to discussion below "Accretion of Landfill Retirement Obligations" for a detailed discussion of the changes in amounts).
The following table summarizes the major components of our operating expenses, excluding accretion expense on our landfill retirement obligations (in millions and as a percentage of our revenue):
| |
Six Months Ended June 30, | Year Ended December 31, | |||||||||||||||||||||||||||||
|---|---|---|---|---|---|---|---|---|---|---|---|---|---|---|---|---|---|---|---|---|---|---|---|---|---|---|---|---|---|---|---|
| |
2016 | 2015 | 2015 | 2014 | 2013 | ||||||||||||||||||||||||||
Labor and related benefits |
$ | 146.3 | 21.1 | % | $ | 141.6 | 20.7 | % | $ | 286.7 | 20.5 | % | $ | 281.3 | 20.0 | % | $ | 261.7 | 19.8 | % | |||||||||||
Transfer and disposal costs |
93.6 | 13.5 | % | 95.3 | 13.9 | % | 195.2 | 14.0 | % | 207.8 | 14.8 | % | 189.1 | 14.3 | % | ||||||||||||||||
Maintenance and repairs |
65.2 | 9.4 | % | 60.0 | 8.8 | % | 123.7 | 8.9 | % | 114.9 | 8.2 | % | 102.5 | 7.8 | % | ||||||||||||||||
Fuel |
26.2 | 3.8 | % | 36.1 | 5.3 | % | 66.6 | 4.8 | % | 101.3 | 7.2 | % | 99.7 | 7.6 | % | ||||||||||||||||
Franchise fees and taxes |
31.6 | 4.6 | % | 32.3 | 4.7 | % | 67.1 | 4.8 | % | 64.8 | 4.6 | % | 57.1 | 4.3 | % | ||||||||||||||||
Risk management |
15.3 | 2.2 | % | 12.8 | 1.9 | % | 25.9 | 1.9 | % | 28.4 | 2.0 | % | 23.5 | 1.8 | % | ||||||||||||||||
Other |
47.6 | 6.9 | % | 44.1 | 6.4 | % | 88.3 | 6.3 | % | 84.1 | 6.1 | % | 85.5 | 6.5 | % | ||||||||||||||||
| | | | | | | | | | | | | | | | | | | | | | | | | | | | | | | | |
Total operating expenses |
$ | 425.8 | 61.5 | % | $ | 422.2 | 61.6 | % | $ | 853.5 | 61.1 | % | $ | 882.6 | 62.9 | % | $ | 819.1 | 62.1 | % | |||||||||||
| | | | | | | | | | | | | | | | | | | | | | | | | | | | | | | | |
| | | | | | | | | | | | | | | | | | | | | | | | | | | | | | | | |
| | | | | | | | | | | | | | | | | | | | | | | | | | | | | | | | |
60
The cost categories shown above may not be comparable to similarly titled categories used by other companies. Thus, you should exercise caution when comparing our cost of operations by cost component to that of other companies.
Six Months Ended June 30, 2016 compared to the Six Months Ended June 30, 2015
Operating expenses increased by $3.6 million or 0.9% to $425.8 million for the six months ended June 30, 2016 from $422.2 million for the six months ended June 30, 2015. The change was due to the following:
- •
- Labor and related benefits increased by $4.7 million, or 3.3%, to $146.3 million which was primarily attributable to
merit increases, acquisition activity, startup costs for new municipal contracts and acquisitions. The increases were partially offset by disposals of certain businesses in the prior year and a
$1.2 million reduction in workers' compensation costs.
- •
- Transfer and disposal costs decreased by $1.7 million or 1.8% to $93.6 million due to the sale of a small brokerage
business in April 2015, which contributed $3.8 million of the decline, and increased internalization in the Midwest. These decreases were partially offset by increased volumes during the first
quarter of 2016.
- •
- Maintenance and repairs expense increased by $5.2 million, or 8.7%, to $65.2 million. The increase was driven primarily
by the implementation of a standardized maintenance plan on our collection fleet and landfill equipment which resulted in increased labor and material costs. Additionally, costs increased
$1.6 million as a result of start up costs for new municipal contracts and acquisitions.
- •
- Fuel costs decreased $9.9 million, or 27.4%, to $26.2 million primarily resulting from decreases in fuel prices and
converting trucks to compressed natural gas fuel, which is less expensive than diesel fuel.
- •
- Franchise fees and taxes decreased $0.7 million, or 2.2%, to $31.6 million primarily due to changes in the mix of waste
in the Midwest segment.
- •
- Risk management expenses increased $2.5 million, or 19.5%, to $15.3 million. The six months ended June 30, 2015
benefited $0.8 million from the favorable settlement of a legacy claim and favorable actuarial development in our vehicle liability insurance programs which did not reoccur in the six months
ended June 30, 2016.
- •
- Other operating costs increased $3.5 million, or 7.9%, to $47.6 million primarily due to increased landfill site and other facility operating expenses of $1.8 million. Additionally, costs increased related to leachate treatment and disposal due to wet weather in the first quarter of 2016 of $1.1 million.
Fiscal Year Ended December 31, 2015 compared to the Fiscal Year Ended December 31, 2014
Operating expenses decreased by $29.1 million, or 3.3%, to $853.5 million for fiscal 2015 from $882.6 million in fiscal 2014. Operating expenses, as a percentage of revenue, decreased by 180 basis points in fiscal 2015 from fiscal 2014. The change was due to the following:
- •
- Labor and related benefits increased by $5.4 million, or 1.9%, to $286.7 million, which was primarily attributable to merit increases and acquisition activity partially offset by disposal of certain businesses, as discussed in Note 1 to the audited consolidated financial statements included elsewhere in this prospectus.
61
- •
- Transfer and disposal costs decreased by $12.6 million, or 6.1%, to $195.2 million. The decrease was primarily
attributable to divestitures of certain businesses, decreased fuel surcharges from vendors, decreased trucking costs as a result of decreased special waste volumes and reduced sub contracting costs.
- •
- Maintenance and repairs expense increased by $8.8 million, or 7.7%, to $123.7 million. The increase was driven primarily
by the implementation of a standardized maintenance plan on our collection fleet and landfill equipment which resulted in increased labor and material costs and increased container repair costs
related to increased collection volumes. Additionally, costs increased as a result of acquisition activity.
- •
- Fuel costs decreased $34.7 million, or 34.3%, to $66.6 million primarily resulting from decreases in fuel prices, less
severe weather, and converting trucks to compressed natural gas fuel which is less expensive than diesel fuel.
- •
- Franchise fees and taxes increased $2.3 million, or 3.5%, to $67.1 million for 2015 primarily due to changes in the mix
of waste in disposal volumes.
- •
- Risk management expenses decreased $2.5 million, or 8.8%, to $25.9 million in 2015 primarily due to favorable
settlements of prior year claims and an improvement in the development of existing claims compared to the same period in the prior year.
- •
- Other operating costs increased $4.2 million, or 5.0%, to $88.3 million in 2015 as a result of increases in leachate costs due to wet weather, increased gas system costs and increased costs to operate our facilities.
Fiscal Year Ended December 31, 2014 compared to the Fiscal Year Ended December 31, 2013
Operating expenses increased by $63.5 million, or 7.8%, to $882.6 million for fiscal 2014 from $819.1 million in fiscal 2013. Operating expenses, as a percentage of revenue, increased by 80 basis points in fiscal 2014 over fiscal 2013. The change was due to the following:
- •
- Labor and related benefits increased by $19.6 million, or 7.5%, to $281.3 million. Approximately $4.2 million of
this increase was attributable to merit-based wage increases, $1.3 million was attributable to weather-related impacts in the first quarter of fiscal 2014 and the remainder primarily due to
acquisitions and increased overtime costs and temporary labor due to driver shortages.
- •
- Transfer and disposal costs increased by $18.7 million, or 9.9%, to $207.8 million. The increase was primarily driven by
increased volume in the collection operation, increased third party disposal costs and higher transportation costs.
- •
- Maintenance and repairs expense increased by $12.4 million, or 12.1%, to $114.9 million. The increase was driven by
weather impacts in the first quarter of fiscal 2014, as well as increased cost of parts and increased overtime wages due to a shortage of mechanics.
- •
- Fuel costs increased $1.6 million, or 1.6%, to $101.3 million, of which $0.4 million was driven by weather
impacts on the fuel burn in the first quarter of fiscal 2014, and the remaining increase was primarily attributable to acquisition volume.
- •
- Franchise fees and taxes increased $7.7 million, or 13.5%, to $64.8 million during fiscal 2014 primarily due to
increased volumes.
- •
- Risk management expenses increased $4.9 million, or 20.9%, to $28.4 million during fiscal 2014 primarily due to adverse development in the severity of claims.
62
- •
- Other operating costs decreased $1.4 million, or 1.6%, to $84.1 million in fiscal 2014, of which $0.6 million was related to weather impacts in the first quarter of fiscal 2014 and an increase in the cost of leachate treatment due to wet weather and taxes and utilities at our operating sites.
Accretion of Landfill Retirement Obligations
Accretion expense was $6.5 million and $6.7 million for the six months ended June 30, 2016 and 2015, respectively. The decrease of $0.2 million was primarily attributable to the timing of certain capping obligations.
Accretion expense was $13.1 million, $13.5 million and $13.7 million for fiscal 2015, 2014 and 2013, respectively. Accretion expense decreased by $0.4 million, or 3.0%, in fiscal 2015 from fiscal 2014 primarily due to the timing of certain capping obligations. Accretion expense decreased by $0.2 million, or 1.5%, in fiscal 2014 from fiscal 2013 primarily due to lower average interest rates and expenditures of capping and post-closure related costs.
Selling, General and Administrative
Selling, general and administrative expenses include salaries, legal and professional fees, rebranding and integration costs and other expenses. Salaries expenses include salaries and wages, health and welfare benefits and incentive compensation for corporate and field general management, field support functions, sales force, accounting and finance, legal, management information systems and clerical and administrative departments. Rebranding and integration costs are those costs associated with rebranding all of the acquired and merged businesses' trucks and containers and those costs expended to align the corporate and strategic operations of the acquired and merged businesses. Other expenses include rent and office costs, fees for professional services provided by third parties, marketing, directors' and officers' insurance, general employee relocation, travel, entertainment and bank charges, but exclude any such amounts recorded as restructuring charges.
The following table provides the components of our selling, general and administrative expenses for the periods indicated (in millions and as a percentage of our revenue):
| |
Six Months Ended June 30, |
Year Ended December 31, | |||||||||||||||||||||||||||||
|---|---|---|---|---|---|---|---|---|---|---|---|---|---|---|---|---|---|---|---|---|---|---|---|---|---|---|---|---|---|---|---|
| |
2016 | 2015 | 2015 | 2014 | 2013 | ||||||||||||||||||||||||||
Salaries |
$ | 50.8 | 7.3 | % | $ | 45.3 | 6.6 | % | $ | 92.7 | 6.6 | % | $ | 90.1 | 6.4 | % | $ | 89.7 | 6.8 | % | |||||||||||
Legal and professional |
12.1 | 1.7 | % | 5.4 | 0.8 | % | 15.1 | 1.1 | % | 10.7 | 0.8 | % | 8.7 | 0.7 | % | ||||||||||||||||
Rebranding and integration costs |
— | — | % | — | — | % | — | — | % | 7.1 | 0.5 | % | 25.8 | 2.0 | % | ||||||||||||||||
Other |
21.2 | 3.1 | % | 22.2 | 3.2 | % | 44.8 | 3.2 | % | 47.0 | 3.3 | % | 46.7 | 3.5 | % | ||||||||||||||||
| | | | | | | | | | | | | | | | | | | | | | | | | | | | | | | | |
Total selling, general and administrative expenses |
$ | 84.1 | 12.2 | % | $ | 72.9 | 10.6 | % | $ | 152.6 | 10.9 | % | $ | 154.9 | 11.0 | % | $ | 170.9 | 13.0 | % | |||||||||||
| | | | | | | | | | | | | | | | | | | | | | | | | | | | | | | | |
| | | | | | | | | | | | | | | | | | | | | | | | | | | | | | | | |
| | | | | | | | | | | | | | | | | | | | | | | | | | | | | | | | |
Six Months Ended June 30, 2016 compared to the Six Months Ended June 30, 2015
Selling, general and administrative expenses increased by $11.2 million, or 15.4%, to $84.1 million for the six months ended June 30, 2016 from $72.9 million for the six months ended June 30, 2015. The change was due to the following:
Salaries expenses increased by $5.5 million or 12.1% to $50.8 million for the six months ended June 30, 2016 compared to the 2015 period attributable to increased stock based compensation of $2.1 million with the remainder primarily due to merit increases and acquisition activity.
63
Legal and professional fees increased by $6.7 million or 124.1% to $12.1 million which was primarily the result of expenses related to the February launch of the initial public offering process in the amount of $7.1 million, including the $5.2 million fee associated with the amendment of our credit agreement contingent on an initial public offering.
Other selling, general and administrative expenses decreased by $1.0 million or 4.5% to $21.2 million for the six months ended June 30, 2016 compared to the 2015 period.
Fiscal Year Ended December 31, 2015 compared to the Fiscal Year Ended December 31, 2014
Selling, general and administrative expenses decreased by $2.3 million, or 1.5%, to $152.6 million for fiscal 2015 from $154.9 million for fiscal 2014. The change was due to the following:
Salaries expenses increased by $2.6 million, or 2.9%, in fiscal 2015 compared to 2014 primarily due to merit increases provided to employees and the addition of management positions in preparation for potentially becoming a publicly traded company.
Legal and professional fees increased by $4.4 million, or 41.1%, in fiscal 2015 compared to 2014 primarily due to higher regulatory compliance costs and fees associated with the Company's public equity offering that was initiated but not finalized.
Rebranding and integration costs are mainly comprised of professional fees, including legal, accounting and rebranding costs and relate to rebranding all of the acquired and merged businesses' trucks and containers and those costs expended to align the corporate and strategic operations of the acquired and merged businesses. The decrease of $7.1 million in fiscal 2015 compared to 2014 is a result of the completing the overall programs associated with the rebranding and integration of the Veolia Acquisition.
Other selling, general and administrative expenses decreased by $2.2 million, or 4.5%, due to lower travel expenses and lower facility costs as a result of cost control measures.
Fiscal Year Ended December 31, 2014 compared to the Fiscal Year Ended December 31, 2013
Selling, general and administrative expenses decreased $16.0 million, or 9.4%, to $154.9 million for fiscal 2014 from $170.9 million for fiscal 2013. The change was due to the following:
Salaries expenses increased by $0.4 million for fiscal 2014 compared to fiscal 2013, but decreased 40 basis points as a percentage of revenue. The increase was primarily due to merit increases in fiscal 2014, offset by lower salaries expense related to a reduction in force that occurred in August 2014 and the resignation of an executive in the first quarter of fiscal 2014.
Legal and professional fees increased by $2.0 million in fiscal 2014 compared to fiscal 2013, primarily as a result of increased fees related to the defense of a legal matter. Refer to Note 20 "Commitments and Contingencies" in the audited consolidated financial statements included elsewhere in this prospectus for further details regarding the legal matter.
Rebranding and integration costs were primarily related to the costs associated with the integration program from the Veolia Acquisition and other entities. The decrease of $18.7 million in fiscal 2014 from fiscal 2013 was primarily a result of efforts to complete the integration program in fiscal 2014.
64
Other selling, general and administrative expenses increased by $0.3 million, but decreased 20 basis points as a percentage of revenue, mainly due to an increase in bank charges and payroll processing costs.
Depreciation and Amortization
The following table summarizes the components of depreciation and amortization expense by asset type (in millions and as a percentage of our revenue).
| |
Six Months Ended June 30, | Year Ended December 31, | |||||||||||||||||||||||||||||
|---|---|---|---|---|---|---|---|---|---|---|---|---|---|---|---|---|---|---|---|---|---|---|---|---|---|---|---|---|---|---|---|
| |
2016 | 2015 | 2015 | 2014 | 2013 | ||||||||||||||||||||||||||
Depreciation, amortization and depletion of property and equipment expense |
$ | 103.7 | 15.0 | % | $ | 105.9 | 15.4 | % | $ | 216.3 | 15.5 | % | $ | 229.1 | 16.3 | % | $ | 236.7 | 17.9 | % | |||||||||||
Amortization of other intangible assets and other assets |
21.7 | 3.1 | % | 21.5 | 3.1 | % | 42.8 | 3.1 | % | 42.3 | 3.0 | % | 42.2 | 3.2 | % | ||||||||||||||||
| | | | | | | | | | | | | | | | | | | | | | | | | | | | | | | | |
Depreciation and amortization |
$ | 125.4 | 18.1 | % | $ | 127.4 | 18.6 | % | $ | 259.1 | 18.6 | % | $ | 271.4 | 19.3 | % | $ | 278.9 | 21.1 | % | |||||||||||
| | | | | | | | | | | | | | | | | | | | | | | | | | | | | | | | |
| | | | | | | | | | | | | | | | | | | | | | | | | | | | | | | | |
| | | | | | | | | | | | | | | | | | | | | | | | | | | | | | | | |
Depreciation, Amortization and Depletion of Property and Equipment
Depreciation, amortization and depletion expense includes depreciation of fixed assets over the estimated useful life of the assets using the straight-line method, and amortization and depletion of landfill airspace assets under the units-of-consumption method. We depreciate all fixed assets to a zero net book value, and do not apply salvage values.
The following table summarizes depreciation, amortization and depletion of property and equipment for the periods indicated (in millions and as a percentage of our revenue):
| |
Six Months Ended June 30, | Year Ended December 31, | |||||||||||||||||||||||||||||
|---|---|---|---|---|---|---|---|---|---|---|---|---|---|---|---|---|---|---|---|---|---|---|---|---|---|---|---|---|---|---|---|
| |
2016 | 2015 | 2015 | 2014 | 2013 | ||||||||||||||||||||||||||
Depreciation and amortization of property and equipment |
$ | 63.4 | 9.2 | % | $ | 63.4 | 9.2 | % | $ | 127.5 | 9.1 | % | $ | 122.8 | 8.7 | % | $ | 141.8 | 10.7 | % | |||||||||||
Landfill depletion and amortization |
40.3 | 5.8 | % | 42.5 | 6.2 | % | 88.8 | 6.4 | % | 106.3 | 7.6 | % | 94.9 | 7.2 | % | ||||||||||||||||
| | | | | | | | | | | | | | | | | | | | | | | | | | | | | | | | |
Depreciation, amortization and depletion expense |
$ | 103.7 | 15.0 | % | $ | 105.9 | 15.4 | % | $ | 216.3 | 15.5 | % | $ | 229.1 | 16.3 | % | $ | 236.7 | 17.9 | % | |||||||||||
| | | | | | | | | | | | | | | | | | | | | | | | | | | | | | | | |
| | | | | | | | | | | | | | | | | | | | | | | | | | | | | | | | |
| | | | | | | | | | | | | | | | | | | | | | | | | | | | | | | | |
Depreciation and amortization of property and equipment remained constant at $63.4 million for the six months ended June 30, 2016, as compared to the six months ended June 30, 2015. Landfill depletion and amortization decreased $2.2 million to $40.3 million for the six months ended June 30, 2016, as compared to the six months ended June 30, 2015, primarily due to an increase in deemed permitted expansion airspace resulting from favorable developments in permitting activities at several of our landfills. The impact of increased deemed permitted airspace was partially offset by increased disposal volumes.
Depreciation and amortization of property and equipment increased by $4.7 million, or 3.8%, for 2015 to $127.5 million as compared to 2014, primarily due to acquisitions completed and new contract starts during the prior period. Landfill depletion and amortization decreased by $17.5 million, or 16.5%, for fiscal 2015 as compared to fiscal 2014 primarily due to an increase in landfill densities, which drove a decrease in the overall landfill depletion rates and reduced volumes.
Depreciation and amortization of property and equipment decreased by $19.0 million for fiscal 2014, as compared to fiscal 2013, to $122.8 million, primarily due to certain assets acquired in the Veolia Acquisition becoming fully depreciated, offset by acquisitions completed during the respective periods. Landfill depletion and amortization increased by $11.4 million in fiscal 2014 compared to fiscal 2013 due to increased costs associated with increased disposal volume and cost of landfill construction.
65
Amortization of Other Intangible Assets and Other Assets
Our other intangible assets and other assets primarily relate to customer lists, municipal and customer contracts, operating permits and non-compete agreements.
Amortization of other intangible assets was $21.7 million and $21.5 million or as a percentage of revenue, 3.1% and 3.1%, for the six months ended June 30, 2016 and 2015, respectively. The increase in amortization expense is directly attributable to increased acquisition activity in the prior year.
Amortization of other intangibles and other assets was $42.8 million, $42.3 million and $42.2 million for fiscal 2015, 2014 and 2013, respectively, or as a percentage of revenue, 3.0% to 3.2% for all years presented. The increase in amortization expense is directly attributable to increased acquisition activity.
Acquisitions
In the ordinary course of our business, we regularly evaluate and pursue acquisition opportunities that could further enhance our vertical integration strategy.
We completed six acquisitions during the six months ended June 30, 2016 for a cash purchase price of $4.9 million and notes payable of $0.3 million, subject to net working capital adjustments, which we expect to be completed within approximately one year. Seven acquisitions were completed during the six months ended June 30, 2015 for a cash purchase price of $23.8 million and notes payable of $3.3 million. The results of operations of each acquisition are included in our unaudited condensed consolidated statements of operations subsequent to the closing date of each acquisition.
In fiscal 2015, we completed the acquisitions of twelve collection companies for aggregate consideration of approximately $56.3 million, of which $6.6 million will be paid in future periods. Transaction costs related to these acquisitions were not significant for fiscal 2015.
In fiscal 2014, we completed the acquisitions of eight collection companies for aggregate cash consideration of approximately $8.6 million, of which $0.8 million was paid in fiscal 2015. Transaction costs related to these acquisitions were not significant for fiscal 2014. Purchase price adjustments related to acquisitions in prior years amounted to approximately $2.1 million for the year ended December 31, 2014.
In fiscal 2013, we completed the acquisitions of seventeen collection companies for aggregate cash consideration of approximately $31.3 million, of which $1.5 million was paid in fiscal 2014. Transaction costs related to these acquisitions were not significant for fiscal 2013.
Asset Impairments and Divestitures/Discontinued Operations
From time to time, we may divest certain components of our business. Such divestitures may be undertaken for a number of reasons, including as a result of a determination that a specified asset will no longer provide adequate returns to us or will no longer serve a strategic purpose in connection with our business.
We disposed of certain businesses in June 2015 and recorded a loss on disposal of $10.9 million for fiscal 2015. In connection with the sale in June 2015, we impaired certain assets in the amount of $4.3 million. Further, we strategically allowed an inactive landfill permit to lapse and in connection with the permit lapse recorded a non-cash impairment charge of $2.1 million primarily for permitting costs for fiscal 2015.
66
We entered into a letter of intent in December 2013 to sell certain assets in Panama City, Florida, for approximately $2.0 million and in connection with the planned divestiture recorded a non-cash impairment charge of $3.6 million for fiscal 2013, as the fair value determined through the selling price was less than the carrying value. The sale was completed in January 2014. The assets are classified as held for sale in the accompanying consolidated balance sheets as of December 31, 2013 and the results of operations have been included in discontinued operations in the accompanying consolidated statements of operations for all periods presented.
In connection with the Veolia Acquisition, we were required by the DOJ to divest certain businesses. We completed these divestitures in fiscal 2013 and recorded no additional impairment charge upon sale for fiscal 2013. A non-cash impairment charge of $13.7 million was recorded for fiscal 2012, as the fair value determined through the selling price was less than the carrying value. The results of operations have been included in discontinued operations in the accompanying consolidated statements of operations for all periods presented.
We completed the sale in fiscal 2013 of certain assets and liabilities in the New York and New Jersey area for approximately $45.0 million, of which $25.0 million was received in cash on the date of closing, $5.0 million was received in December 2013 and the remainder in the form of a debt security, which originally matured in 2017 but was repaid in fiscal 2015. We also reacquired the outstanding minority interest of $2.5 million previously held by the minority shareholder in August 2013. In connection with the divestiture, we recorded a non-cash impairment charge of approximately $7.6 million for fiscal 2013. The results of operations have been included in discontinued operations in the accompanying consolidated statements of operations for all periods presented.
Losses from discontinued operations before income tax for fiscal 2015, 2014 and 2013 were $0.0 million, $0.7 million and $29.6 million, respectively. The decreases in the loss from 2015 to 2014 and 2014 to 2013 were due to the completion of the sale of the businesses that were classified within discontinued operations.
Restructuring Charges
During the six months ended June 30, 2016, we incurred $0.8 million of restructuring costs related to the departure of a corporate executive and the realignment of the districts in our Midwest Segment.
In fiscal 2015, no new restructuring plans were adopted and no new restructuring costs were incurred.
In fiscal 2014, we recognized approximately $4.6 million of restructuring costs driven by $0.4 million of severance costs, $0.6 million of lease termination costs and $0.3 million of relocation costs in the Midwest segment; $0.4 million of severance costs and $0.3 million of relocation costs in the East segment; $0.2 million of severance costs and $0.8 million of relocation costs in the South segment; as well as $1.6 million of primarily relocation costs for Corporate.
In fiscal 2013, we recognized approximately $10.0 million of restructuring costs driven by $2.5 million of severance costs, $1.7 million of lease termination costs and $2.3 million of relocation costs in the Midwest segment; $0.6 million of lease termination costs in the East segment; $0.3 million of lease termination costs in the South segment and $0.3 million of other expenses; as well as $2.3 million of severance costs for Corporate.
67
Other, Net
Changes in the fair value and settlements of fuel derivative instruments are recorded in other income (expense), net in the condensed consolidated statements of operations and amounted to income of $1.5 million and expense of $0.2 million for the six months ended June 30, 2016 and 2015, respectively. Changes in the fair value of the interest rate caps purchased in May of 2016 are recorded in other income (expense), net in the condensed consolidated statements of operations and amounted to a loss of $2.8 million for the six months ended June 30, 2016. Income from equity investee for the six months ended June 30, 2016 and 2015 was $1.1 million and $0.8 million, respectively. Income from a gain on the redemption of a security of $2.5 million was recorded in other income (expense), net during the six months ended June 30, 2015.
Changes in the fair value and settlements of the fuel derivative instruments are recorded in other (expense) income, net in the audited consolidated statements of operations and amounted to an expense of $15.4 million and $29.0 million for fiscal 2015 and 2014, respectively. Income from equity investee for fiscal 2015, 2014 and 2013 was $1.3 million, $1.2 million and $0.8 million, respectively. We realized a gain on sale of $2.5 million from the redemption of a security in fiscal 2015.
Interest Expense
The following table provides the components of interest expense for the periods indicated (in millions and as a percentage of our revenue):
| |
Six Months Ended June 30, | Year Ended December 31, | |||||||||||||||||||||||||||||
|---|---|---|---|---|---|---|---|---|---|---|---|---|---|---|---|---|---|---|---|---|---|---|---|---|---|---|---|---|---|---|---|
| |
2016 | 2015 | 2015 | 2014 | 2013 | ||||||||||||||||||||||||||
Interest expense on debt and capital lease obligations |
$ | 58.9 | 8.5 | % | $ | 60.0 | 8.8 | % | $ | 119.4 | 8.6 | % | $ | 123.1 | 8.8 | % | $ | 140.1 | 10.6 | % | |||||||||||
Accretion of original issue discounts and amortization of loan costs |
9.8 | 1.4 | % | 9.8 | 1.4 | % | 19.5 | 1.4 | % | 20.0 | 1.4 | % | 17.6 | 1.3 | % | ||||||||||||||||
Amortization of terminated interest rate swaps |
— | — | % | — | — | % | — | — | % | — | — | % | 6.0 | 0.5 | % | ||||||||||||||||
Less: Capitalized interest |
(0.1 | ) | (0.0 | )% | — | 0.0 | % | (0.9 | ) | (0.1 | )% | (1.6 | ) | (0.1 | )% | (0.6 | ) | — | % | ||||||||||||
| | | | | | | | | | | | | | | | | | | | | | | | | | | | | | | | |
Total interest expense |
$ | 68.6 | 9.9 | % | $ | 69.8 | 10.2 | % | $ | 138.0 | 9.9 | % | $ | 141.5 | 10.1 | % | $ | 163.1 | 12.4 | % | |||||||||||
| | | | | | | | | | | | | | | | | | | | | | | | | | | | | | | | |
| | | | | | | | | | | | | | | | | | | | | | | | | | | | | | | | |
| | | | | | | | | | | | | | | | | | | | | | | | | | | | | | | | |
The $1.2 million decrease in interest expense for the six months ended June 30, 2016 compared to the 2015 period was principally due to lower average balances on the Term Loan B.
Interest expense decreased in fiscal 2015 from fiscal 2014 due to lower debt levels on the Term Loan B Facility (as defined below) in fiscal 2015 compared to fiscal 2014. Interest expense decreased in fiscal 2014 from fiscal 2013 as a result of refinancing the Term Loan B Facility (see "Debt Modifications" section below), which lowered the overall interest rate on the Term Loan B Facility by 50 basis points. Additionally, we benefited from lower debt levels on the Term Loan B Facility in fiscal 2014 compared to fiscal 2013.
Debt Modifications
We modified our Term Loan B Facility in February 2014 and 2013 and incurred approximately $1.3 million and $22.5 million, respectively of costs in connection with the modifications, which were classified as a reduction to long-term debt and are being amortized as an adjustment to interest expense using the effective interest rate method. The modification in February 2014 lowered the interest rate floor by 50 basis points and the modification in February 2013 lowered the margin by 100 basis points. No gain or loss was
68
recorded upon consummation of these transactions, as they were treated as a modification of debt in accordance with current accounting guidance.
Income Taxes
Continuing Operations
Our effective income tax benefit rate for the six months ended June 30, 2016 and 2015 was 26.6% and 32.0%, respectively. Our effective income tax benefit rate was 36.6%, 82.2%, and 32.3% for 2015, 2014 and 2013, respectively. Our tax rate is affected by recurring items, such as differences in tax rates in state jurisdictions and the relative amount of income we earn in each jurisdiction, which we expect to be fairly consistent in the near term. It is also affected by discrete items that may occur in any given year, but are not consistent from year to year. In addition to state income taxes, the following items had the most significant impact on the difference between our statutory U.S. federal income tax rate and our effective tax rate:
Six Months Ended June 30, 2016 and June 30, 2015
The difference between income taxes computed at the federal statutory rate of 35% and reported income tax benefit for the six months ended June 30, 2016 was primarily due to the unfavorable impact of permanently non-deductible expenses and the unfavorable impact of the change in recorded valuation allowance. The difference between income taxes computed at the federal statutory rate of 35% and reported income taxes for the six months ended June 30, 2015 was primarily due to the unfavorable impact of the change in recorded valuation allowance.
Fiscal Year Ended December 31, 2015
Our effective income tax rate for fiscal 2015 was higher than the enacted statutory rate due to the favorable impact of state and local taxes. Additionally, the favorable impact of a $0.9 million release in recorded valuation allowance was recognized as we continued our plan of legal entity restructuring, designed to drive administrative and legal efficiencies. These favorable benefits were partially offset by the unfavorable impact of changes in state tax rates and non deductible transaction costs.
Fiscal Year Ended December 31, 2014
The difference between income taxes computed at the federal statutory rate of 34% and reported income taxes from continuing operations was due to a $51.4 million valuation allowance release primarily related to a legal entity restructuring undertaken by us in order to drive administrative and legal efficiencies. As a result of the restructuring completed during the fourth quarter, we project that we will be able to utilize certain federal net operating losses ("NOLs") that previously required a full valuation allowance. We believe that it is more likely than not that the full benefit of these NOLs and net deferred tax assets will be realized.
Fiscal Year Ended December 31, 2013
The difference between income taxes computed at the federal statutory rate of 34% and reported income taxes from continuing operations was due to a $3.4 million increase in recorded valuation allowance against certain federal and state NOLs, capital loss carryovers, and net deferred tax assets. We believe that it is more likely than not that the full benefit of these NOLs, capital loss carryovers, and net deferred tax assets will not be realized.
69
Discontinued Operations
We did not have any discontinued operations during the six months ended June 30, 2016 or fiscal 2015. Our benefit for income taxes from discontinued operations was $1.0 million and $7.1 million for fiscal 2014 and 2013, respectively. Our effective income tax rate was 142.9% and 24.0% for fiscal 2014 and 2013, respectively. Similar to income taxes from continued operations, our tax rate is affected by recurring items, such as differences in tax rates in state jurisdictions and the relative amount of income we earn in each jurisdiction. It is also affected by discrete items that may occur in any given year, but are not consistent from year to year. In addition to state income taxes, the following items had the most significant impact on the difference between our statutory U.S. federal income tax rate and our effective tax rate:
Fiscal Year Ended December 31, 2014
The difference between income taxes computed at the federal statutory rate of 34% and reported income taxes from discontinued operations was due to the result of unanticipated tax benefits associated with prior divestitures that were realized upon the filing of our tax return.
Fiscal Year Ended December 31, 2013
The difference between income taxes computed at the federal statutory rate of 34% and reported income taxes from discontinued operations was due to an increase in the valuation allowance of $2.7 million related to the loss on asset disposals for we will not receive a tax benefit.
State Audits
During 2016, we settled tax audits with the state of Mississippi for tax years 2011, 2012 and 2013. The settlement of these audits resulted in no change to income tax expense for 2016.
During 2013, we settled tax audits with the state of Florida for tax years 2008, 2009 and 2010 and Mississippi for tax year 2010. The settlement of these audits resulted in $0.1 million of additional income tax expense for 2013.
For additional discussion and detail regarding our income taxes, see Note 18, Income Taxes, to our audited consolidated financial statements.
70
Reportable Segments
Our operations are managed through three geographic regions (South, East and Midwest) that we designate as our reportable segments. Revenues and operating income/(loss) for our reportable segments for the periods indicated is shown in the following tables (in millions):
| |
Service Revenues |
Operating Income (Loss) |
Depreciation and Amortization |
|||||||
|---|---|---|---|---|---|---|---|---|---|---|
Six Months Ended June 30, 2016 |
||||||||||
South |
$ | 247.3 | $ | 41.9 | $ | 37.3 | ||||
East |
184.5 | 12.8 | 36.6 | |||||||
Midwest |
260.2 | 32.0 | 47.5 | |||||||
Corporate |
— | (37.6 | ) | 4.0 | ||||||
| | | | | | | | | | | |
|
$ | 692.0 | $ | 49.1 | $ | 125.4 | ||||
| | | | | | | | | | | |
| | | | | | | | | | | |
| | | | | | | | | | | |
Six Months Ended June 30, 2015 |
||||||||||
South |
$ | 246.1 | $ | 28.3 | $ | 36.5 | ||||
East |
177.5 | 8.5 | 36.7 | |||||||
Midwest |
261.9 | 28.0 | 50.0 | |||||||
Corporate |
— | (27.1 | ) | 4.2 | ||||||
| | | | | | | | | | | |
|
$ | 685.5 | $ | 37.7 | $ | 127.4 | ||||
| | | | | | | | | | | |
| | | | | | | | | | | |
| | | | | | | | | | | |
| |
Services Revenue |
Operating Income (Loss) |
Depreciation and Amortization |
|||||||
|---|---|---|---|---|---|---|---|---|---|---|
For the Year Ended December 31, 2015 |
||||||||||
South |
$ | 488.7 | $ | 66.9 | $ | 73.2 | ||||
East |
366.3 | 25.0 | 74.0 | |||||||
Midwest |
541.5 | 61.1 | 103.8 | |||||||
Corporate |
(0.1 | ) | (57.9 | ) | 8.1 | |||||
| | | | | | | | | | | |
|
$ | 1,396.4 | $ | 95.1 | $ | 259.1 | ||||
| | | | | | | | | | | |
| | | | | | | | | | | |
| | | | | | | | | | | |
For the Year Ended December 31, 2014 |
||||||||||
South |
$ | 493.7 | $ | 72.2 | $ | 70.3 | ||||
East |
364.3 | 8.7 | 85.1 | |||||||
Midwest |
545.2 | 51.2 | 108.1 | |||||||
Corporate |
(0.2 | ) | (62.7 | ) | 7.9 | |||||
| | | | | | | | | | | |
|
$ | 1,403.0 | $ | 69.4 | $ | 271.4 | ||||
| | | | | | | | | | | |
| | | | | | | | | | | |
| | | | | | | | | | | |
For the Year Ended December 31, 2013 |
||||||||||
South |
$ | 475.4 | $ | 66.4 | $ | 79.0 | ||||
East |
331.1 | 7.7 | 78.7 | |||||||
Midwest |
512.6 | 39.6 | 112.6 | |||||||
Corporate |
— | (91.6 | ) | 8.6 | ||||||
| | | | | | | | | | | |
|
$ | 1,319.1 | $ | 22.1 | $ | 278.9 | ||||
| | | | | | | | | | | |
| | | | | | | | | | | |
| | | | | | | | | | | |
Comparison of Reportable Segments—Six Months Ended June 30, 2016 compared to the Six Months Ended June 30, 2015
South Segment
Revenue increased $1.2 million or 0.5% for the six months ended June 30, 2016 compared to the six months ended June 30, 2015. The increase was primarily due to an increase in
71
disposal revenue of $5.1 million as a result of higher price and volume, an increase in residential collection revenue of $1.2 million due to acquisitions in the prior year and new contract starts in the prior year partially offset by the loss of certain municipal contracts, an increase in commercial collection revenue of $1.2 million due to increased volume partly due to acquisitions in the prior year partially offset by a divestiture in the prior year, an increase in rolloff revenue of $1.9 million due to price and volume increases and an increase in environmental fees of $1.4 million due to an increased rate that went into effect in July 2015. These increases were partially offset by a decline in revenue of $9.6 million due to the divestiture of businesses in the prior year, a decrease in fuel fee revenue of $2.0 million as a result of lower diesel fuel prices, a decrease in landfill gas revenue of $1.1 million due to the expiration of landfill gas credit agreements and a decline in the market price for landfill gas and a decrease in trucking revenue of $0.5 million due to the timing of special waste projects.
Operating income increased by $13.6 million or 48.1% for the six months ended June 30, 2016 compared to the six months ended June 30, 2015. The increase was primarily the result of losses on disposal of businesses and impairment charges recorded in the 2015 period of $15.2 million related to strategic divestitures. Additionally, operating income increased due to the revenue increase discussed above and lower fuel expense of $4.1 million due to lower diesel fuel prices. These increases were partially offset by higher labor costs of $3.3 million due to increased headcount, merit increases and start up costs related to acquisitions and new municipal contracts and higher repairs and maintenance expense of $2.7 million due to the implementation of a standardized maintenance plan on our collection fleet and landfill equipment and acquisition activity.
East Segment
Revenue increased by $7.0 million or 3.9% for the six months ended June 30, 2016 compared to the six months ended June 30, 2015. The increase is primarily due to an increase in commercial collection revenue of $2.0 million due to prior year acquisitions and higher price, an increase in residential collection revenue of $2.3 million due to acquisitions in the prior year and new contract starts, an increase in rolloff revenue of $1.1 million due to higher price, an increase in disposal revenue of $5.3 million due to increased volume and an increase in environmental fees of $1.4 million due to an increased rate that went into effect in July 2015. These increases were partially offset by a reduction in disposal revenue of $1.2 million due to the divestiture of three transfer stations, a reduction in revenue of $2.5 million from shale volumes due to the continued decline in the oil and gas market and a reduction in fuel fees of $1.0 million as a result of lower diesel fuel prices.
Operating income increased $4.3 million or 50.6% for the six months ended June 30, 2016 compared to the six months ended June 30, 2015. The increase is due to discontinuing the pursuit of permitting at one landfill site in the prior year which resulted in expense of $2.1 million. Additionally, operating income increased due to the revenue increase discussed above and lower fuel expense of $2.5 million due to lower diesel fuel prices. These increases were partially offset by higher insurance expense of $0.7 million, higher salaries and wages of $1.2 million and higher repair and maintenance expense of $1.3 million.
Midwest Segment
Revenue decreased $1.7 million or 0.6% for the six months ended June 30, 2016 compared to the six months ended June 30, 2015. The decrease is primarily due to lower collection revenue of $0.5 million due to the loss of residential contracts and lower fuel fees of $4.5 million due to lower diesel fuel prices. These decreases were partially offset by an
72
increase in environmental fees of $3.2 million due to an increased rate that went into effect in July 2015.
Operating income increased by $4.0 million or 14.3% for the six months ended June 30, 2016 compared to the six months ended June 30, 2015. The increase in operating income is due to higher environmental fees of $3.2 million and a reduction in wages of $0.8 million due to a decrease in driver headcount.
Corporate Segment
Operating loss increased $10.5 million or 38.7% for the six months ended June 30, 2016 compared to the six months ended June 30, 2015, primarily due to $7.5 million in expenses related to the February launch of the initial public offering process and the evaluation of strategic alternatives. Additionally, stock based compensation expense increased by $2.1 million.
Comparison of Reportable Segments—Fiscal Year Ended December 31, 2015 compared to the Fiscal Year Ended December 31, 2014
South Segment
Revenue for fiscal 2015 decreased $5.0 million or 1.0% from fiscal 2014. Approximately $14.0 million of the decrease was due to the divestiture of businesses (see Note 1, Business Operations, to our audited consolidated financial statements included elsewhere in this prospectus), $2.2 million was due to declines in commodity revenue and $1.3 million was due to declines in fuel fee revenue. The decrease was partially offset by a $12.5 million increase in disposal revenue impacted by stronger volumes and pricing gains.
Operating income decreased by $5.3 million, or 7.3%, from fiscal 2014 to $66.9 million in fiscal 2015. The decrease in operating income was driven by an increase in the loss on disposal of assets of $12.7 million, higher franchise fees of $3.9 million, higher repair and maintenance expense of $3.2 million, higher wages of $3.2 million and increased sub contract costs of $2.2 million. The decreases were partially offset by a reduction in fuel expense of $13.7 million and increases due to disposal volumes and pricing gains discussed above.
East Segment
Revenue for fiscal 2015 increased $2.0 million, or 0.5% from fiscal 2014. The segment's revenue increase was driven by new contract wins and acquisitions, which accounted for approximately $12.3 million and higher environmental fees of $2.6 million. The increase was partially offset by lower rolloff volume of $5.3 million, lower fuel fee revenue of $3.7 million and lower disposal volume of $2.3 million.
Operating income increased by $16.3 million, or 187.4%, from fiscal 2014 to $25.0 million in fiscal 2015, which was primarily the result of lower depreciation and amortization of $11.1 million due to an increase in landfill densities, lower fuel fees of $8.2 million and reduced disposal costs of $1.7 million. The increase was partially offset by higher wages of $3.1 million and higher repairs and maintenance expense of $2.8 million.
Midwest Segment
Revenue for fiscal 2015 decreased $3.7 million or, 0.7%, from fiscal 2014 which is attributable to lower fuel fee revenue of $10.4 million, lower revenue from the sale of recyclables of $5.7 million and lower special waste disposal volumes of $4.1 million. The
73
decreases were partially offset by new contract wins and acquisitions, which accounted for approximately $10.8 million and higher environmental fees of $5.7 million.
Operating income for fiscal 2015 increased $9.9 million or 19.3% from fiscal 2014, driven by higher revenue from environmental fees of $5.7 million, lower depreciation and amortization expense of $4.3 million due to an increase in landfill densities and lower net fuel costs of $2.3 million. These increases were partially offset by higher repairs and maintenance expense of $2.8 million.
Corporate Segment
Operating loss decreased by $4.8 million, or 7.7%, to a loss of $57.9 million in fiscal 2015 primarily as a result of the completion of the merger and restructuring programs.
Comparison of Reportable Segments—Fiscal Year Ended December 31, 2014 compared to the Fiscal Year Ended December 31, 2013
South Segment
Revenue for fiscal 2014 increased $18.3 million, or 3.8%, from fiscal 2013. The segment's revenue increase was driven by strong collection volume of $14.9 million, acquisition volume of $3.1 million and MSW landfill pricing of $5.1 million, offset by headwinds from recycling pricing of $1.8 million and lower trucking revenue and broker revenue of $4.6 million.
Operating income from our South Region increased by $5.8 million, or 8.7%, from fiscal 2013. The increase in operating income was driven by the revenue increases discussed above as well as a focus on reducing administrative costs, partially offset by the severe winter weather in the first quarter of fiscal 2014 which had an impact of $0.6 million.
East Segment
Revenue for fiscal 2014 increased $33.2 million, or 10.0%, from fiscal 2013. The segment's revenue increase was driven by new contract wins, which accounted for approximately $8.6 million, acquisition volume of $7.8 million, strong rolloff volume of $4.3 million, landfill volumes of $4.5 million and pricing increases of approximately $5.7 million.
Operating income from our East Region increased by $1.0 million, or 13.0%, from fiscal 2013 to $8.7 million in fiscal 2014, which was impacted by adverse weather in the first quarter of fiscal 2014 by $2.5 million, higher repairs and maintenance costs, higher transportation and disposal costs, increased overtime costs and increased fuel costs.
Midwest Segment
Revenue for fiscal 2014 increased $32.6 million, or 6.4%, which was attributable to strong special waste volume of $10.1 million, acquisition volume of $5.8 million, overall strong collection volumes in all lines of business of $7.1 million and pricing initiatives of $7.6 million, offset by headwinds from recycling pricing of $2.5 million.
Operating income for fiscal 2014 increased $11.6 million, or 29.3%, from fiscal 2013 which was driven by the revenue generating activities described above, partially offset by the severe winter weather in the first quarter of fiscal 2014 of $1.9 million.
74
Corporate Segment
Operating loss decreased by $28.9 million, or 31.6%, to a loss of $62.7 million in fiscal 2014 as a result of the substantial completion of the costs associated with the rebranding and integration efforts and the merger and restructuring programs.
Quarterly Results of Operations Data
The following table sets forth a summary of our statement of operations data and a reconciliation of EBITDA and adjusted EBITDA to net loss for each of the most recent eight fiscal quarters. We have prepared the quarterly data on a basis that is consistent with the audited consolidated financial statements included in this prospectus. In the opinion of management, the financial information reflects all necessary adjustments, consisting only of normal recurring adjustments, necessary for a fair presentation of these data. This information is not a complete set of financial statements and should be read in conjunction with the audited consolidated financial statements and related notes included elsewhere in this prospectus. The results of historical periods are not necessarily indicative of the results of operations for a full year or any future period.
| |
Three Months Ended | ||||||||||||||||||||||||
|---|---|---|---|---|---|---|---|---|---|---|---|---|---|---|---|---|---|---|---|---|---|---|---|---|---|
| |
September 30, 2014 |
December 31, 2014 |
March 31, 2015 |
June 30, 2015 |
September 30, 2015 |
December 31, 2015 |
March 31, 2016 |
June 30, 2016 |
|||||||||||||||||
| |
(in millions, unaudited) |
||||||||||||||||||||||||
Consolidated Statements of Operations Data: |
|||||||||||||||||||||||||
Service revenues |
$ | 368.1 | $ | 353.8 | $ | 330.4 | $ | 355.2 | $ | 361.3 | $ | 349.5 | $ | 333.8 | $ | 358.2 | |||||||||
Costs and expenses |
343.0 | 333.6 | 306.4 | 341.5 | 328.8 | 324.6 | 320.8 | 322.1 | |||||||||||||||||
| | | | | | | | | | | | | | | | | | | | | | | | | | |
Operating income |
25.1 | 20.2 | 24.0 | 13.7 | 32.5 | 24.9 | 13.0 | 36.1 | |||||||||||||||||
Total other income/(expense), net (a) |
(33.7 | ) | (64.6 | ) | (38.5 | ) | (27.5 | ) | (42.7 | ) | (39.4 | ) | (34.3 | ) | (34.0 | ) | |||||||||
| | | | | | | | | | | | | | | | | | | | | | | | | | |
Loss before income taxes |
(8.6 | ) | (44.4 | ) | (14.5 | ) | (13.8 | ) | (10.2 | ) | (14.4 | ) | (21.3 | ) | 2.1 | ||||||||||
Benefit for income taxes |
(1.3 | ) | (68.5 | ) | (3.7 | ) | (5.3 | ) | (4.7 | ) | (5.7 | ) | (7.0 | ) | 1.9 | ||||||||||
| | | | | | | | | | | | | | | | | | | | | | | | | | |
Net (loss) income from continuing operations |
(7.3 | ) | 24.1 | (10.8 | ) | (8.5 | ) | (5.5 | ) | (8.8 | ) | (14.3 | ) | 0.2 | |||||||||||
(Loss) income from discontinued operations, net of tax |
0.8 | — | — | — | — | — | — | — | |||||||||||||||||
| | | | | | | | | | | | | | | | | | | | | | | | | | |
Net (loss) income attributable to Advanced Disposal |
$ | (6.5 | ) | $ | 24.1 | $ | (10.8 | ) | $ | (8.5 | ) | $ | (5.5 | ) | $ | (8.8 | ) | $ | (14.3 | ) | $ | 0.2 | |||
| | | | | | | | | | | | | | | | | | | | | | | | | | |
| | | | | | | | | | | | | | | | | | | | | | | | | | |
| | | | | | | | | | | | | | | | | | | | | | | | | | |
Other Data: |
|||||||||||||||||||||||||
Adjusted EBITDA from continuing operations |
$ | 105.6 | $ | 100.2 | $ | 90.5 | $ | 102.5 | $ | 105.6 | $ | 101.4 | $ | 86.8 | $ | 107.5 | |||||||||
- (a)
- Includes "interest expense" and "other income/(expense), net"
75
| |
Three Months Ended | ||||||||||||||||||||||||
|---|---|---|---|---|---|---|---|---|---|---|---|---|---|---|---|---|---|---|---|---|---|---|---|---|---|
| |
September 30, 2014 |
December 31, 2014 |
March 31, 2015 |
June 30, 2015 |
September 30, 2015 |
December 31, 2015 |
March 31, 2016 |
June 30, 2016 |
|||||||||||||||||
| |
(in millions, unaudited) |
||||||||||||||||||||||||
Net (loss) income |
$ | (6.5 | ) | $ | 24.1 | $ | (10.8 | ) | $ | (8.5 | ) | $ | (5.5 | ) | $ | (8.8 | ) | $ | (14.3 | ) | $ | 0.2 | |||
Less (loss) income from discontinued operations, net |
0.8 | — | — | — | — | — | — | — | |||||||||||||||||
| | | | | | | | | | | | | | | | | | | | | | | | | | |
(Loss) gain from continuing operations |
(7.3 | ) | 24.1 | (10.8 | ) | (8.5 | ) | (5.5 | ) | (8.8 | ) | (14.3 | ) | 0.2 | |||||||||||
| | | | | | | | | | | | | | | | | | | | | | | | | | |
Additions/deductions: |
|||||||||||||||||||||||||
Income tax benefit |
(1.3 | ) | (68.5 | ) | (3.8 | ) | (5.3 | ) | (4.7 | ) | (5.6 | ) | (7.0 | ) | 1.9 | ||||||||||
Interest expense |
35.4 | 35.7 | 34.2 | 35.6 | 34.2 | 34.0 | 34.4 | 34.2 | |||||||||||||||||
Depreciation and amortization |
73.8 | 64.7 | 60.9 | 66.5 | 67.5 | 64.2 | 60.8 | 64.6 | |||||||||||||||||
Accretion on landfill retirement obligations |
3.1 | 4.2 | 3.4 | 3.3 | 3.3 | 3.1 | 3.3 | 3.3 | |||||||||||||||||
Accretion on loss contracts and other long-term liabilities |
0.2 | 0.2 | 0.2 | 0.2 | 0.2 | 0.2 | 0.1 | 0.1 | |||||||||||||||||
| | | | | | | | | | | | | | | | | | | | | | | | | | |
EBITDA from continuing operations |
103.9 | 60.4 | 84.1 | 91.8 | 95.0 | 87.1 | 77.3 | 104.3 | |||||||||||||||||
EBITDA adjustments: |
|||||||||||||||||||||||||
Acquisition and development costs |
— | 0.1 | 0.7 | 0.4 | 0.2 | 0.1 | 0.1 | — | |||||||||||||||||
Stock option vesting |
0.4 | 0.3 | 0.7 | 0.5 | 0.4 | 1.5 | 0.4 | 2.9 | |||||||||||||||||
Earnings (losses) in equity investee, net |
(0.2 | ) | (0.2 | ) | (0.2 | ) | (0.2 | ) | (0.1 | ) | 0.8 | (0.5 | ) | 0.1 | |||||||||||
Restructuring charges |
1.6 | 1.0 | — | — | — | — | 0.8 | — | |||||||||||||||||
Loss (gain) on sale of assets and businesses disposed and asset impairments |
(0.6 | ) | 6.3 | 0.1 | 17.4 | 0.7 | 3.4 | 0.9 | (0.8 | ) | |||||||||||||||
Unrealized (gain) loss on derivative instruments |
— | 27.3 | (0.9 | ) | (10.0 | ) | 2.3 | (2.5 | ) | (4.1 | ) | (2.9 | ) | ||||||||||||
Gain on redemption of security |
— | — | — | (2.5 | ) | — | — | — | — | ||||||||||||||||
Rebranding and integration costs |
0.4 | 3.2 | — | — | — | — | — | — | |||||||||||||||||
Write-off of share issuance and other capital market costs |
— | — | — | — | — | 2.8 | 7.2 | 0.3 | |||||||||||||||||
Realized loss on fuel derivative instruments |
0.1 | 1.8 | 6.0 | 5.1 | 7.1 | 8.2 | 4.7 | 3.6 | |||||||||||||||||
| | | | | | | | | | | | | | | | | | | | | | | | | | |
Adjusted EBITDA from continuing operations |
$ | 105.6 | $ | 100.2 | $ | 90.5 | $ | 102.5 | $ | 105.6 | $ | 101.4 | $ | 86.8 | $ | 107.5 | |||||||||
Capital Expenditures
Historically, we have allocated our capital expenditure by balancing replacement and growth capital expenditure needs and expect to continue to do so. During the period from July 1, 2016 to June 30, 2017, we expect to spend $196.0 million on capital expenditures which are expected to be funded with cash flows from operations. During the six months ended June 30, 2016, we spent $69.2 million on capital expenditure, representing 10.0% of our revenue, of which $44.0 million was spent on replacement capital expenditure, $11.1 million on growth and $14.1 million on infrastructure. During the six months ended June 30, 2016, our capital expenditure across asset classes was trucks of $27.4 million, cell construction and landfill infrastructure of $23.4 million, containers of $8.5 million with the remainder spent on other needs. During the six months ended June 30, 2015, we spent $87.3 million on capital expenditure (excluding the impact of land purchased for future landfill airspace of $2.4 million), representing 12.7% of our revenue, of which $75.6 million was spent on replacement capital expenditure, $8.7 million on growth and $3.0 million on infrastructure. During the six months ended June 30, 2015, our capital expenditure across asset classes was trucks of $29.9 million, cell construction and landfill infrastructure of $33.4 million, containers
76
of $14.6 million with the remainder spent on other needs. In fiscal 2015, we spent $177.3 million on capital expenditure (excluding the impact of land purchased for future land fill airspace of $2.4 million), representing 12.7% of our revenue, of which $144.9 million was spent on replacement capital expenditure, $15.3 million on growth and $17.1 million on infrastructure. In fiscal 2015, our capital expenditure across asset classes was trucks of $59.7 million, cell construction and landfill infrastructure of $71.4 million, containers of $26.0 million with the remainder spent on other needs. In fiscal 2014, we spent $166.0 million on capital expenditure (excluding the impact of land purchased for future airspace of $8.8 million at one landfill and capital related to the start of a major municipal contract of $21.6 million), representing 11.8% of our revenue, of which approximately $123 million was spent on replacement capital expenditure, $35 million on growth and $8 million on infrastructure. In fiscal 2014, our capital expenditure across asset classes was trucks of $59 million, cell construction and landfill infrastructure of $57 million, containers of $32 million with the remainder spent on other needs.
Liquidity and Capital Resources
Our primary sources of cash are cash flows from operations, bank borrowings and debt offerings. We intend to use excess cash on hand and cash from operating activities, together with bank borrowings, to fund purchases of property and equipment, working capital, acquisitions and debt repayments. Actual debt repayments may include purchases of our outstanding indebtedness in the secondary market or otherwise. We believe that our current cash balances, cash from operating activities and funds available under our Revolving Credit Facility (as defined below) will provide us with sufficient financial resources to meet our anticipated capital requirements and maturing obligations as they come due. At June 30, 2016, we had negative working capital driven by purchases of property and equipment and construction and development during the six months ended June 30, 2016 as well as the use of our cash to fund debt repayments and to return capital to the Parent. At December 31, 2015, we had negative working capital which was driven by repayments on the Term Loan B Facility and cash used for acquisitions. At December 31, 2014, we had negative working capital which was driven by repayments of our Term Loan B and our Revolving Credit Facility in the fourth quarter of 2014.
We expect to have a working capital deficit for the foreseeable future as excess cash flows from operations are utilized to either complete acquisitions or pay additional amounts on our Term Loan B. We have more than adequate availability on our Revolving Credit Facility, which was $243.0 million, $227.6 million, $222.1 million and $241.9 million at June 30, 2016 and 2015 and December 31, 2015 and 2014, respectively, to fund short term working capital requirements. We have no amounts currently available for borrowing on our Term Loan B, nor were any such amounts available as of June 30, 2016 and 2015 and December 31, 2015 and 2014.
77
Summary of Cash and Cash Equivalents, Restricted Cash and Debt Obligations
The table below presents a summary of our cash and cash equivalents, restricted cash and debt balances as of June 30, 2016, December 31, 2015 and 2014 (in millions):
| |
|
December 31, | ||||||||
|---|---|---|---|---|---|---|---|---|---|---|
| |
June 30, 2016 |
|||||||||
| |
2015 | 2014 | ||||||||
Cash and cash equivalents |
$ | 1.2 | $ | 0.6 | $ | 1.0 | ||||
| | | | | | | | | | | |
| | | | | | | | | | | |
| | | | | | | | | | | |
Total restricted funds |
$ | — | $ | — | $ | 0.2 | ||||
| | | | | | | | | | | |
| | | | | | | | | | | |
| | | | | | | | | | | |
Debt: |
||||||||||
Current portion |
$ | 38.8 | $ | 49.1 | $ | 25.3 | ||||
Long-term portion |
2,201.6 | 2,198.0 | 2,217.7 | |||||||
| | | | | | | | | | | |
Total debt |
$ | 2,240.4 | $ | 2,247.1 | $ | 2,243.0 | ||||
| | | | | | | | | | | |
| | | | | | | | | | | |
| | | | | | | | | | | |
Long-term debt decreased from fiscal 2014 to fiscal 2015 due to scheduled payments on the Term B Loan as well as prepayments of $15.5 million. The current portion of debt increased from fiscal 2014 to fiscal 2015 due to borrowings of $32.0 million on the Revolving Credit Facility to fund acquisitions in the fourth quarter of fiscal 2015.
Summary of Cash Flow Activity
The following table sets forth for the periods indicated a summary of our cash flows (in millions):
| |
Six months ended June 30, |
For the Years Ended December 31, |
||||||||||||||
|---|---|---|---|---|---|---|---|---|---|---|---|---|---|---|---|---|
| |
2016 | 2015 | 2015 | 2014 | 2013 | |||||||||||
Net cash provided by operating activities |
$ | 104.4 | $ | 129.3 | $ | 244.5 | $ | 243.2 | $ | 180.3 | ||||||
Net cash used in investing activities |
$ | (70.8 | ) | $ | (85.3 | ) | $ | (197.4 | ) | $ | (201.2 | ) | $ | (154.8 | ) | |
Net cash used in financing activities |
$ | (33.0 | ) | $ | (35.7 | ) | $ | (47.5 | ) | $ | (53.0 | ) | $ | (32.3 | ) | |
Cash Flows Provided by Operating Activities
We generated $104.4 million of cash flows from operating activities during the six months ended June 30, 2016, compared with $129.3 million during the six months ended June 30, 2015. The decrease of $24.9 million was due in part to an increase in accounts receivable in the six months ended June 30, 2016 compared to a decrease in the comparable prior period which accounted for $11.1 million of the net variance. The accounts receivable decrease in the prior year was due to increased emphasis on collection activities starting in late 2014 that resulted in significant improvement in days sales outstanding throughout fiscal 2015. Higher capping, closure and post closure expenditures contributed $5.0 million to the decrease and was due to timing of payments and an increase in required capping events in 2016 compared to 2015. Higher payments on accrued expenses of $4.8 million also contributed to the decrease and was due primarily to higher bonus payments in the first quarter of 2016 compared to 2015. Cash flows from operations are used to fund capital expenditures, acquisitions, interest payments and debt and capital repayments.
In fiscal 2015, we generated $244.5 million of cash flows from operating activities compared to $243.2 million in fiscal 2014, representing an increase of $1.3 million. The increase in 2015 is the result of a decrease in accounts receivable due to an increased emphasis on collections offset by the impact of an increase in capping, closure and post closure expenditures as a result of several large capping projects during 2015. In fiscal 2014,
78
we generated $243.2 million of cash flows from operating activities compared to $180.3 million in 2013, representing an increase of $62.9 million. The increase in fiscal 2014 is a result of lower integration and restructuring costs of approximately $18.7 million and a focus on days sales outstanding as well as organic and acquisition growth year over year.
Cash flows from operations are used to fund capital expenditures, acquisitions, interest payments and debt repayments.
Cash Flows Used in Investing Activities
We used $70.8 million of cash in investing activities during the six months ended June 30, 2016 compared with $85.3 million during the six months ended June 30, 2015, a decrease of $14.5 million, which was primarily attributable to reduced capital spending of $20.5 million mostly due to the timing of projects and reduced acquisition spending of $18.7 million related to a large acquisition during the first quarter of 2015. These reductions in spending were partially offset by the redemption of an investment security for $15.0 million during the six months ended June 30, 2015 and a reduction in proceeds from divestitures of $10.0 million during the six months ended June 30, 2016 compared to the six months ended June 30, 2015.
We used $197.4 million of cash in fiscal 2015 for investing activities, of which $179.7 million was utilized to acquire property and equipment and for landfill cell construction and development and $50.0 million was utilized for acquisitions. Further, we divested certain businesses and received $14.7 million in cash. We also redeemed an investment security and received $15.0 million in proceeds.
We used $201.2 million of cash in investing activities in fiscal 2014, of which $196.4 million was utilized to acquire property and equipment and for landfill cell construction and development and $9.9 million was utilized for acquisitions. Further, we divested certain businesses and received $2.1 million in cash related to those divestitures.
We used $154.8 million of cash in investing activities in fiscal 2013, of which $158.1 million was utilized to acquire property and equipment and for landfill cell construction and development, $29.8 million was utilized to acquire new businesses and $20.6 million was paid to settle the net working capital and net company debt adjustment related to the prior year Veolia Acquisition. Further, we divested certain businesses and received $50.2 million in cash related to those divestitures, of which $45.2 million was received upon sale and $5.0 million was received through the maturity of a debt security.
Cash Flows Used in Financing Activities
During the six months ended June 30, 2016, net cash used in financing activities was $33.0 million compared to $35.7 million during the six months ended June 30, 2015, a decrease of $2.7 million. The decrease is primarily due to an increase in outstanding checks of $12.6 million due to the timing of payments partially offset by higher net payments of debt of $4.7 million and a higher return of capital to the parent of $5.1 million.
Cash flows used in financing activities in fiscal 2015 were $47.5 million, as compared to $53.0 million in fiscal 2014. We made payments on our Revolving Credit Facility and long-term debt obligations in the amount of $153.4 million and borrowed approximately $114.0 million in fiscal 2015. Borrowings on the Revolving Credit Facility were utilized to fund working capital, acquisition of businesses and for interest payments on debt. Additionally, $7.5 million of capital was returned to our parent during fiscal 2015.
Cash flows used in financing activities in fiscal 2014 were $53.0 million, as compared to $32.3 million in fiscal 2013. In fiscal 2014, we incurred approximately $1.3 million in costs paid
79
to our lenders in connection with refinancing our Term Loan B Facility and payments of other costs associated with the original Term Loan B Facility. In fiscal 2013, we incurred approximately $22.9 million in costs paid to our lenders in connection with refinancing our Term Loan B Facility and payments of other costs associated with the original Term Loan B Facility.
We made payments on our Revolving Credit Facility and long-term debt obligations in the amount of $141.3 million and borrowed approximately $95.0 million in fiscal 2014. Borrowings on the Revolving Credit Facility were utilized to fund working capital, acquisition of businesses and for interest payments on debt. Additionally, $9.0 million of capital was returned to our parent during fiscal 2014.
We made payments on our Revolving Credit Facility and long-term debt obligations in the amount of $196.8 million and borrowed approximately $184.0 million on the Revolving Credit Facility during fiscal 2013. Borrowings on the Revolving Credit Facility were utilized to fund working capital, acquisition of businesses and for interest payments on debt.
Senior Secured Credit Facilities
In November 2012, we entered into (i) a $1,800.0 million Term Loan B facility and (ii) a $300.0 million revolving credit facility (the "Revolving Credit Facility," and together with the Term Loan B, the "Senior Secured Credit Facilities") with Deutsche Bank Trust Company Americas, as administrative agent, and affiliates of Barclays Capital Inc., Deutsche Bank Securities Inc., Macquarie Capital (USA) Inc., UBS Securities LLC and Credit Suisse Securities (USA) LLC, and other lenders from time to time party thereto and effected re-pricing transactions on the Term Loan B in February 2014 and February 2013, that reduced the applicable interest rate floor by 50 basis points and the applicable margin by 100 basis points, respectively. See Note 13, Long-Term Debt, to our audited consolidated financial statements and Note 4, Debt, to our unaudited condensed consolidated financial statements, each included elsewhere in this prospectus, for additional details regarding our Senior Secured Credit Facilities. The Term Loan B matures in October 2019. The Revolving Credit Facility matures in October 2019, pursuant to an amendment and waiver. See "Description of Certain Indebtedness—Amendments to the Senior Secured Credit Facilities."
Borrowings under our Senior Secured Credit Facilities can be used for working capital, capital expenditures, acquisitions and other general corporate purposes. As of June 30, 2016, we had an aggregate committed capacity of $300.0 million, of which $100.0 million was available for letters of credit under our Senior Secured Credit Facilities. As of June 30, 2016 and December 31, 2015, we had an aggregate of approximately $46.0 million and $45.9 million of letters of credit outstanding under our Senior Secured Credit Facilities. As of June 30, 2016 and December 31, 2015, we had $11.0 million and $32.0 million of outstanding borrowings on the Revolving Credit Facility, respectively. The agreement governing our Senior Secured Credit Facilities requires us to comply with certain financial and other covenants, including a total leverage ratio for the benefit of the lenders under the Revolving Credit Facility that is applicable when there are outstanding loans or letters of credit under the Revolving Credit Facility. Compliance with these covenants is a condition to any incremental borrowings under our Senior Secured Credit Facilities and failure to meet these covenants would enable the lenders to require repayment of any outstanding loans (which would adversely affect our liquidity). As of June 30, 2016, we were in compliance with the covenants under the Senior Secured Credit Facilities. Our ability to maintain compliance with our covenants will be highly dependent on our results of operations and, to the extent necessary, our ability to implement remedial measures such as reductions in operating costs.
80
We are subject to the following total leverage ratio covenant for the applicable periods as indicated.
| |
Maximum Total Leverage Ratio |
|||
|---|---|---|---|---|
December 31, 2015 through December 31, 2016 |
6.50:1.00 | |||
January 1, 2017 through June 30, 2017 |
6.25:1.00 | |||
July 1, 2017 through September 30, 2017 |
6.125:1.00 | |||
October 1, 2017 and thereafter |
6.00:1.00 | |||
Our total leverage ratio for purposes of compliance with the covenant in our Senior Secured Credit Facilities is the ratio of total consolidated debt on any date to Adjusted EBITDA for the four consecutive fiscal quarters most recently ended on or prior to such date. The actual total leverage ratio as of June 30, 2016, December 31, 2015 and December 31, 2014 was 6.02:1.00, 6.11:1.00 and 6.12:1.00, respectively.
81/4% Senior Notes due 2020
On October 9, 2012, we issued $550 million aggregate principal amount of 81/4% Senior Notes due 2020 pursuant to the Indenture between us and Wells Fargo Bank, National Association, as trustee. In December 2013, we exchanged all of the outstanding notes for registered notes with identical terms. The Senior Notes mature in October 2020. As of June 30, 2016, we were in compliance with the covenants under the Indenture. See Note 13, Long-Term Debt, to our audited consolidated financial statements and Note 4, Debt, to our unaudited condensed consolidated financial statements for additional details regarding the notes, each included elsewhere in this prospectus.
Off-Balance Sheet Arrangements
As of June 30, 2016 and December 31, 2015, we had no off-balance sheet debt or similar obligations, other than financial assurance instruments and operating leases, which are not classified as debt. We do not guarantee any third-party debt.
Seasonality
We expect our operating results to vary seasonally, with revenues typically lowest in the first quarter, higher in the second and third quarters and lower in the fourth quarter than in the second and third quarters. This seasonality reflects the lower volume of solid waste generated during the late fall, winter and early spring in the East and Midwest segments because of decreased construction and demolition activities during winter months in these regions of the United States. In addition, some of our operating costs may be higher in the winter months. Adverse winter weather conditions slow waste collection activities, resulting in higher labor and operational costs. Greater precipitation in the winter increases the weight of collected municipal solid waste, resulting in higher disposal costs, which are calculated on a per ton basis.
Liquidity Impacts of Income Tax Items
Uncertain Tax Positions—As of June 30, 2016, we had $10.0 million of liabilities associated with unrecognized tax benefits and related interest. These liabilities are primarily included as a component of long-term "Other liabilities" in our unaudited condensed consolidated balance sheet because we generally do not anticipate that settlement of the liabilities will require payment of cash within the next 12 months. We are not able to
81
reasonably estimate when we would make any cash payments required to settle these liabilities, but we do not believe that the ultimate settlement of our obligations will materially affect our liquidity.
Financial Assurance
We must provide financial assurance to governmental agencies and a variety of other entities under applicable environmental regulations relating to our landfill operations for capping, closure and post-closure costs, and related to our performance under certain collection, landfill and transfer station contracts. We satisfy these financial assurance requirements by providing surety bonds and letters of credit. The amount of the financial assurance requirements for capping, closure and post-closure costs is determined by applicable state environmental regulations. The financial assurance requirements for capping, closure and post-closure costs may be associated with a portion of the landfill or the entire landfill. Generally, states require a third-party engineering specialist to determine the estimated capping, closure and post-closure costs that are used to determine the required amount of financial assurance for a landfill. The amount of financial assurance required can, and generally will, differ from the obligation determined and recorded under GAAP. The amount of the financial assurance requirements related to contract performance varies by contract. Additionally, we must provide financial assurance for our insurance program and collateral for certain performance obligations. We do not expect a material increase in financial assurance requirements in the foreseeable future, although the mix of financial assurance instruments may change.
These financial instruments are issued in the normal course of business and are not considered company indebtedness. Because we currently have no liability for these financial assurance instruments, they are not reflected in our audited consolidated balance sheets or unaudited condensed consolidated balance sheets. However, we record capping, closure and post-closure liabilities and self-insurance liabilities as they are incurred. The underlying obligations of the financial assurance instruments, in excess of those already reflected in our audited consolidated balance sheets and unaudited condensed consolidated balance sheets, would be recorded if it is probable that we would be unable to fulfill our related obligations. We do not expect this to occur.
Contractual Commitments
We have various contractual obligations in the normal course of our operations and financing activities. The following table summarizes our contractual cash obligations as of December 31, 2015 (in millions):
| |
Operating Leases |
Final Capping, Closure and Post-Closure (a) |
Debt Payments (b) |
Unconditional Purchase Commitments (c) |
Total | |||||||||||
|---|---|---|---|---|---|---|---|---|---|---|---|---|---|---|---|---|
2016 |
$ | 5.8 | $ | 30.2 | $ | 159.5 | $ | 4.8 | $ | 200.3 | ||||||
2017 |
4.6 | 30.6 | 138.9 | 3.5 | 177.6 | |||||||||||
2018 |
4.2 | 23.1 | 133.1 | 3.6 | 164.0 | |||||||||||
2019 |
3.6 | 19.4 | 1,743.0 | 3.6 | 1,769.6 | |||||||||||
2020 |
3.0 | 18.1 | 598.2 | 3.7 | 623.0 | |||||||||||
Thereafter |
18.7 | 191.3 | 11.7 | 49.2 | 270.9 | |||||||||||
| | | | | | | | | | | | | | | | | |
Total |
$ | 39.9 | $ | 312.7 | $ | 2,784.4 | $ | 68.4 | $ | 3,205.4 | ||||||
| | | | | | | | | | | | | | | | | |
| | | | | | | | | | | | | | | | | |
| | | | | | | | | | | | | | | | | |
- (a)
- The
estimated remaining final capping, closure and post-closure and remediation expenditures presented above are not inflated or discounted and reflect the
estimated future payments for liabilities incurred and recorded as of December 31, 2015.
- (b)
- Debt
payments include both principal and interest payments on debt and capital lease obligations. Interest on variable rate debt was calculated at 3.75%,
which is the LIBOR floor plus applicable spread in effect as of December 31, 2015.
- (c)
- Unconditional purchase commitments consist primarily of disposal related agreements that include fixed or minimum royalty payments and host agreements.
82
Critical Accounting Policies and Estimates
General
Our audited consolidated financial statements and unaudited condensed consolidated financial statements have been prepared in accordance with GAAP. The preparation of audited consolidated financial statements and unaudited condensed consolidated financial statements in conformity with GAAP requires management to make estimates and assumptions that affect the amounts reported in the financial statements and the accompanying notes. Actual results could differ from those estimates. We believe the following accounting policies and estimates are the most critical and could have the most impact on our results of operations. For a discussion of these and other accounting policies, see the notes to the audited consolidated financial statements and unaudited condensed consolidated financial statements included elsewhere in this prospectus.
We have noted examples of the residual accounting and business risks inherent in the accounting for these areas. Residual accounting and business risks are defined as the inherent risks that we face after the application of our policies and processes that are generally outside of our control or ability to forecast.
Revenue Recognition
Revenues are generally recognized as the services are provided. Revenue is recognized as waste is collected, as tons are received at the landfill or transfer stations, as recycled commodities are delivered to a customer or as services are rendered to customers. Certain customers are billed in advance and, accordingly, recognition of the related revenues is deferred until the services are provided. Revenues are reported net of state landfill taxes. No single customer individually accounted for more than 2% of our consolidated revenue for the six months ended June 30, 2016 or for the year ended December 31, 2015.
Landfill Accounting
Costs Basis of Landfill Assets—Landfills are typically developed in a series of cells, each of which is constructed, filled and capped in sequence over the operating life of the landfill. When the final cell is filled and the operating life of the landfill is completed, the cell must be capped and then closed and post-closure care and monitoring activities begin. Capitalized landfill costs include expenditures for land (which includes the land of the landfill footprint and landfill buffer property and setbacks) and related airspace associated with the permitting, development and construction of new landfills, expansions at existing landfills, landfill gas systems and landfill cell development. Landfill permitting, development and construction costs represent direct costs related to these activities, including land acquisition, engineering, legal and construction. These costs are deferred until all permits are obtained and operations have commenced, at which point they are capitalized and amortized. If necessary permits are not obtained, costs are charged to operations. The cost basis of our landfill assets also includes asset retirement costs, which represent estimates of future costs associated with landfill final capping, closure and post-closure activities.
Final Capping, Closure and Post-Closure Costs—The following is a description of our asset retirement activities and related accounting:
Final Capping—Includes installing flexible geosynthetic membrane and clay liners, drainage, compact soil layers and topsoil, and is constructed over an area of the landfill where total airspace capacity has been consumed and waste disposal operations have ceased. These final capping activities occur in phases as needed throughout the operating life of a landfill as
83
specific areas are filled to capacity and the final elevation for that specific area is reached in accordance with the provisions of the operating permit. Final capping asset retirement obligations are recorded on a units-of-consumption basis as airspace is consumed related to the specific final capping event with a corresponding increase in the landfill asset. Each final capping event is accounted for as a discrete obligation and recorded as an asset and a liability based on estimates of the discounted cash flows and capacity associated with each final capping event.
Closure and post-closure—These activities involve methane gas control, leachate management and groundwater monitoring, surface water monitoring and control and other operational and maintenance activities that occur after the site ceases to accept waste. The post-closure period generally runs for 30 years after final site closure for landfills. Landfill costs related to closure and post-closure are recorded as an asset retirement obligation as airspace is consumed over the life of the landfill with a corresponding increase in the landfill asset. Obligations are recorded over the life of the landfill based on estimates of the discounted cash flows associated with performing closing and post-closure activities.
We update our estimates for these obligations annually, considering the respective State regulatory requirements, input from our internal engineers, operations, accounting personnel and external consulting engineers. The closure and post-closure requirements are established under the standards of the EPA's Subtitle D regulations as implemented and applied on a state-by-state basis. These estimates involve projections of costs that will be incurred as portions of the landfill are closed and during the post-closure monitoring period.
Capping, closure and post-closure costs are estimated assuming such costs would be incurred by a third party contractor in present day dollars and are inflated by the 20-year average change in the historical consumer price index ("CPI") (consistent historical rate which agrees to historical CPI per government website of 2.50% from 1990 to 2015) to the time periods within which it is estimated the capping, closure and post-closure costs will be expended. We discount these costs to present value using the credit-adjusted, risk-free rate effective at the time an obligation is incurred, consistent with the expected cash flow approach. Any change that results in an upward revision to the estimated cash flows are treated as a new liability and discounted at the current rate while downward revisions are discounted at the historical weighted-average rate of the recorded obligation. As a result, the credit-adjusted, risk-free discount rate used to calculate the present value of an obligation is specific to each individual asset retirement obligation. The range of rates utilized within the calculation of our asset retirement obligations at December 31, 2015 was between 6.4% and 10.5%.
We record the estimated fair value of the final capping, closure and post-closure liabilities for our landfills based on the capacity consumed to date. The fair value of the final capping obligations is developed based on our estimates of the airspace consumed to date for each final capping event and the expected timing of each final capping event. The fair value of closure and post-closure obligations is developed based on our estimates of the airspace consumed to date for the entire landfill and the expected timing of each closure and post-closure activity. Because these obligations are measured at estimated fair value using present value techniques, changes in the estimated cost or timing of future final capping, closure and post-closure activities could result in a material change in these liabilities, related assets and results of operations. We assess the appropriateness of the estimates used to develop our recorded balances annually, or more often if significant facts change.
Changes in inflation rates or the estimated costs, timing or extent of future final capping, closure and post-closure activities typically result in both (i) a current adjustment to the
84
recorded liability and landfill asset; and (ii) a change in liability and asset amounts to be recorded prospectively over either the remaining capacity of the related discrete final capping event or the remaining permitted and expansion airspace (as defined below) of the landfill. Any changes related to the capitalized and future cost of the landfill assets are then recognized in accordance with our amortization policy, which would generally result in amortization expense being recognized prospectively over the remaining capacity of the final capping event or the remaining permitted and expansion airspace of the landfill, as appropriate. Changes in such estimates associated with airspace that has been fully utilized result in an adjustment to the recorded liability and landfill assets with an immediate corresponding adjustment to landfill airspace amortization expense.
Interest accretion on final capping, closure and post-closure liabilities is recorded using the effective interest method and is recorded in operating expenses in the consolidated statements of operations.
Amortization of Landfill Assets—The amortizable basis of a landfill includes (i) amounts previously expended and capitalized; (ii) capitalized and projected landfill final capping, closure and post-closure costs; (iii) projections of future acquisition and development costs required to develop the landfill site to its remaining permitted and expansion capacity; and (iv) land underlying both the footprint of the landfill and the surrounding required setbacks and buffer land.
Amortization is recorded on a units-of-consumption basis, applying expense as a rate per ton. The rate per ton is calculated by dividing each component of the amortizable basis of a landfill by the number of tons needed to fill the corresponding asset's remaining airspace. For landfills that we do not own, but operate through operating or lease arrangements, the rate per ton is calculated based on expected capacity to be utilized over the lesser of the contractual term of the underlying agreement or the life of the landfill.
Landfill site costs are depleted to zero upon final closure of a landfill. We develop our estimates of the obligations using input from our operations personnel, engineers, accountants and external consulting engineers and the obligations are based upon interpretation of current requirements and proposed regulatory changes and are intended to approximate fair value. The estimate of fair value is based upon present value techniques using historical experience and, where available, quoted or actual market prices paid for similar work.
The determination of airspace usage and remaining airspace is an essential component in the calculation of landfill asset depletion. This estimation is performed by conducting periodic topographic surveys, using aerial survey techniques, of our landfill facilities to determine remaining airspace in each landfill. The surveys are reviewed by our external consulting engineers, internal operating staff and our management, financial and accounting staff.
Remaining airspace includes additional "deemed permitted" or unpermitted expansion airspace if the following criteria are met:
- (1)
- We
must either own the property for the expansion or have a legal right to use or obtain property to be included in the expansion plan;
- (2)
- Conceptual
design of the expansion must have been completed;
- (3)
- Personnel are actively working to obtain land use and local and state approvals for an expansion of an existing landfill and the application for expansion must reasonably be expected to be received within the normal application and processing time periods for approvals in the jurisdiction in which the landfill is located;
85
- (4)
- There
are no known significant technical, community, business or political restrictions or similar issues that would likely impair the success of the
expansion; and
- (5)
- Financial analysis has been completed and the results demonstrate that the expansion has a positive financial and operational impact.
Senior management has reviewed and approved all of the above. Of our 39 landfills, 15 included deemed permitted airspace at June 30, 2016.
Upon successful meeting of the preceding criteria, the costs associated with developing, constructing, closing and monitoring the total additional future capacity are considered in the calculation of the amortization and closure and post-closure rates.
Once expansion airspace meets these criteria for inclusion in our calculation of total available disposal capacity, management continuously monitors each site's progress in obtaining the expansion permit. If at any point it is determined that an expansion area no longer meets the required criteria, the probable expansion airspace is removed from the landfill's total available capacity, and the rates used at the landfill to amortize costs to acquire, construct, close and monitor the site during the post-closure period are adjusted prospectively. In addition, any amounts related to the probable expansion are charged to expense in the period in which it is determined that the criteria are no longer met.
Once the remaining permitted and expansion airspace is determined in cubic yards, an airspace utilization factor ("AUF") is established to calculate the remaining permitted and expansion capacity in tons. The AUF is established using the measured density obtained from previous annual surveys and is then adjusted to account for future settlement. The amount of settlement that is forecasted will take into account several site-specific factors including: current and projected mix of waste type, initial and projected waste density, estimated number of years of life remaining, depth of underlying waste, anticipated access to moisture through precipitation or recirculation of landfill leachate and operating practices. In addition, the initial selection of the AUF is subject to a subsequent multi-level review by our engineering group, and the AUF used is reviewed on a periodic basis and revised as necessary. Our historical experience generally indicates that the impact of settlement at a landfill is greater later in the life of the landfill when the waste placed at the landfill approaches its highest point under the permit requirements.
After determining the costs and remaining permitted and expansion capacity at each of our landfills, we determine the per ton rates that will be expensed as waste is received and deposited at the landfill by dividing the costs by the corresponding number of tons. We calculate per ton amortization rates for each landfill for assets associated with each final capping event, for assets related to closure and post-closure activities and for all other costs capitalized or to be capitalized in the future. These rates per ton are updated annually, or more often, as significant facts change.
It is possible that our estimates or assumptions could ultimately be significantly different from actual results. In some cases we may be unsuccessful in obtaining an expansion permit or we may determine that an expansion permit that we previously thought was probable has become unlikely. To the extent that such estimates, or the assumptions used to make those estimates, prove to be significantly different than actual results, or the belief that we will receive an expansion permit changes adversely in a significant manner, the costs of the landfill, including the costs incurred in the pursuit of the expansion, may be subject to impairment testing and lower profitability may be experienced due to higher amortization rates, higher capping, closure and post-closure rates, and higher expenses or asset impairments related to the removal of previously included expansion airspace.
86
The assessment of impairment indicators and the recoverability of our capitalized costs associated with landfills and related expansion projects requires significant judgment due to the unique nature of the waste industry, the highly regulated permitting process and the estimates involved. During the review of a landfill expansion application, a regulator may initially deny the expansion application although the permit is ultimately granted. In addition, management may periodically divert waste from one landfill to another to conserve remaining permitted landfill airspace or a landfill may be required to cease accepting waste, prior to receipt of the expansion permit. However, such events occur in the ordinary course of business in the waste industry and do not necessarily result in an impairment of our landfill assets because, after consideration of all facts, such events may not affect our belief that we will ultimately obtain the expansion permit. As a result, our tests of recoverability, which generally make use of a cash flow estimation approach, may indicate that an impairment loss should be recorded. No landfill impairments were recorded for the six months ended June 30, 2016 or 2015 or the years ended December 31, 2015, 2014 and 2013, respectively.
Self-Insurance Reserves and Related Costs
Our insurance programs for workers' compensation, general liability, vehicle liability and employee-related health care benefits are effectively self-insured. Accruals for self-insurance reserves are based on claims filed and estimates of claims incurred but not reported. We maintain either high deductibles or self-insured retentions for commercial general liability, vehicle liability and workers' compensation coverage of $0.5 million, $1.0 million and $0.8 million, respectively, as of June 30, 2016.
Accruals for self-insurance reserves are based on claims filed and estimate of claims incurred but not reported and are recorded gross of expected recoveries. The accruals for these liabilities could be revised if future occurrences of loss development differ significant from our assumptions.
Loss Contingencies
We are subject to various legal proceedings, claims and regulatory matters, the outcomes of which are subject to significant uncertainty. We determine whether to disclose or accrue for loss contingencies based on an assessment of whether the risk of loss is remote, reasonably possible or probable and whether it can be reasonably estimated. We analyze our litigation and regulatory matters based on available information to assess the potential liabilities. Management's assessment is developed based on an analysis of possible outcomes under various strategies. We record and disclose loss contingencies pursuant to the applicable accounting guidance for such matter.
We record losses related to contingencies in cost of operations or selling, general and administrative expenses, depending on the nature of the underlying transaction leading to the loss contingency.
Asset Impairment
We monitor the carrying value of our long-lived assets for potential impairment and test the recoverability of such assets whenever events or changes in circumstances indicate that their carrying amounts may not be recoverable. These events or changes in circumstances, including management decisions pertaining to such assets, are referred to as impairment indicators. Typical indicators that an asset may be impaired include (i) a significant adverse change in legal factors in the business climate, (ii) an adverse action or assessment by a regulator and (iii) a significant adverse change in the extent or manner in which a long-lived
87
asset is being utilized or in its physical condition. If an impairment indicator occurs, we perform a test of recoverability by comparing the carrying value of the asset or asset group to its undiscounted expected future cash flows. If cash flows cannot be separately and independently identified for a single asset, we will determine whether an impairment has occurred for the asset group for which we can identify the projected cash flows. If the carrying values are in excess of undiscounted expected future cash flows, we measure any impairment by comparing the fair value of the asset or asset group to its carrying value. Fair value is generally determined by considering: (i) an internally developed discounted projected cash flow analysis of the asset or asset group; (ii) third-party valuations; and/or (iii) information available regarding the current market for similar assets. If such assets are considered to be impaired, the impairment to be recognized is measured as the amount by which the carrying value exceeds the fair value of the asset.
Goodwill
Goodwill is the excess of our purchase price over the fair value of the net identifiable assets of acquired businesses. We do not amortize goodwill. Goodwill is subject to at least an annual assessment for impairment by evaluating quantitative factors.
We perform a quantitative assessment or two-step impairment test to determine whether a goodwill impairment exists at a reporting unit. The reporting units are equivalent to our segments and when an individual business within an integrated operating segment is divested, goodwill is allocated to that business based on its fair value relative to the fair value of its operating segment. We compare the fair value with its carrying amount to determine if there is potential impairment of goodwill. If the carrying value exceeds estimated fair value, there is an indication of potential impairment and the second step is performed to measure the amount of impairment. Fair value is estimated using an income approach based on forecasted cash flows. Fair value computed via this method is arrived at using a number of factors, including projected future operating results, economic projections, anticipated future cash flows and comparable marketplace data. There are inherent uncertainties related to these factors and to our judgment in applying them to this analysis. However, we believe that this method provides a reasonable approach to estimating the fair value of its reporting units.
We perform our annual assessment as of December 31 of each year. The impairment test indicated the fair value of each reporting unit exceeded the carrying value. If we do not achieve our anticipated disposal volumes, our collection or disposal rates decline, our costs or capital expenditures exceed our forecasts, costs of capital increase or we do not receive landfill expansions, the estimated fair value could decrease and potentially result in an impairment charge. Refer to Note 4 "Discontinued Operations" of our audited consolidated financial statements for information regarding impairment charges recorded in connection with discontinued operations. We recorded no goodwill impairment charges for the years ended December 31, 2015, 2014 and 2013, respectively, in connection with the annual assessments.
Income Taxes
Deferred tax assets and liabilities are determined based on differences between the financial reporting and income tax basis of assets (other than non-deductible goodwill) and liabilities. Deferred tax assets and liabilities are measured using the income tax rate in effect during the year in which the differences are expected to reverse.
We record net deferred tax assets to the extent we believe these assets will more likely than not be realized. In making this determination, we consider all available positive and
88
negative evidence, including scheduled reversals of deferred tax liabilities, projected future taxable income, tax planning strategies and recent financial results. In the event we determine that we would be able to realize our deferred income tax assets in the future in excess of their net recorded amount, we will make an adjustment to the valuation allowance which would reduce our provision for income taxes.
Our income tax expense, deferred tax assets and liabilities and reserves for unrecognized tax benefits reflect management's best assessment of estimated future taxes to be paid. We are subject to U.S. federal income taxes and numerous state jurisdictions. Significant judgments and estimates are required in determining the combined income tax expense.
Regarding the accounting for uncertainty in income taxes recognized in the financial statements, we record a tax benefit from an uncertain tax position when it is more likely than not that the position will be sustained upon examination, including resolutions of any related appeals or litigation processes, based on the technical merits. We recognize interest and penalties related to uncertain tax positions within the provision for income taxes in our consolidated statements of income. Accrued interest and penalties are included within other accrued liabilities and deferred income taxes and other long-term liabilities in our consolidated balance sheets. Refer to Note 18 "Income Taxes" in our audited consolidated financial statements included elsewhere in this prospectus for details regarding adjustments to our valuation allowance in fiscal 2015 and fiscal 2014.
Recently Issued and Proposed Accounting Standards
In March 2016, the Financial Accounting Standards Board (FASB) issued Accounting Standards Update (ASU) 2016-09, Compensation—Stock Compensation (Topic 718), which simplifies the accounting for employee stock-based payment transactions, including the accounting for income taxes, forfeitures and statutory tax withholding requirements, as well as classification in the statement of cash flows. The standard is effective for fiscal years beginning after December 31, 2016, including interim periods within those fiscal years. Early adoption is permitted. The Company is currently evaluating the timing of the adoption and the potential impact this guidance may have on its consolidated financial statements.
In February 2016, the FASB issued Accounting Standards Update ("ASU") 2016-02, Leases, which will require lessees to recognize most leases on their balance sheets as a right-of-use asset with a corresponding lease liability, and lessors to recognize a net lease investment. Additional qualitative and quantitative disclosures will also be required to increase transparency and comparability among organizations. This standard is effective for fiscal years beginning after December 15, 2018, including interim periods within those fiscal years. Early adoption of the standard is permitted however the Company does not expect to early adopt this ASU. Lessees and lessors are required to recognize and measure leases at the beginning of the earliest period presented. While the Company is still assessing the impact of this standard, it does not believe this standard will have a material impact on the Company's financial condition, results of operations or liquidity.
In May 2014, the FASB issued ASU 2014-09, Revenue from Contracts with Customers, which supersedes previous revenue recognition guidance. The new standard requires that a company recognize revenue when it transfers promised goods or services to customers in an amount that reflects the consideration the company expects to receive in exchange for those goods or services. Companies will need to use more judgment and estimates than under the guidance currently in effect, including estimating the amount of variable revenue to recognize over each identified performance obligation. Additional disclosures will be required to help users of financial statements understand the nature, amount and timing of revenue and cash
89
flows arising from contracts. In July 2015, the FASB approved a one-year deferral of the effective date. This standard will now become effective for the Company beginning with the first quarter 2018 and can be adopted either retrospectively to each prior reporting period presented or as a cumulative effect adjustment as of the date of adoption. The Company is currently evaluating the impact of adopting this new guidance on the consolidated financial statements and has not selected a transition method.
Quantitative and Qualitative Disclosures About Market Risk
Market Risk
We are exposed to various types of market risk in the normal course of business, including the impact of interest rate changes and changes in the prices of fuel and commodities. We employ risk management strategies that may include the use of derivatives, such as interest rate cap agreements and fuel derivative contracts, to manage these exposures. We do not enter into derivatives for trading purposes. While we are exposed to credit risk in the event of non-performance by counterparties to our derivative agreements, in all cases such counterparties are highly rated financial institutions and we do not anticipate non-performance. We monitor our derivative positions by regularly evaluating the positions at market and by performing sensitivity analysis over our fuel and variable rate debt exposures.
Interest Rate Risk
Our major market risk exposure of our financial instruments is changing interest rates in the United States and fluctuations in LIBOR. The interest rate on borrowings under our Senior Secured Credit Facilities varies depending on prevailing interest rates from time to time. We intend to manage interest rate risk through the use of a combination of fixed and floating rate debt. The carrying value of our variable rate debt approximates fair value because interest rates are variable and, accordingly, approximates current market rates for instruments with similar risk and maturities. The fair value of our debt is determined as of the balance sheet date and is subject to change. The Term Loan B and the Revolving Credit Facility each bear interest at a base or LIBOR rate plus an applicable margin. The base rate is defined as the greater of the prime rate, federal funds rate plus 50 basis points or LIBOR subject to a 0.75% floor. A 100 basis point change in the Term Loan B interest rate would result in a $16.9 million change in interest expense.
We use interest rate caps as an economic hedge to manage interest rate risk, but these are recorded at fair value in the financial statements.
Fuel Price Risk
Fuel costs represent a significant operating expense. When economically practical, we may enter into new or renew contracts, or engage in other strategies to mitigate market risk. Where appropriate, we have implemented a fuel fee that is designed to recover a portion of our direct and indirect increases in our fuel costs. While we charge fuel fees to many of our customers, we are unable to charge fuel fees to all customers. Consequently, an increase in fuel costs results in (1) an increase in our cost of operations, (2) a smaller increase in our revenue (from the fuel fee) and (3) a decrease in our operating margin percentage, because the increase in revenue is more than offset by the increase in cost. Conversely, a decrease in fuel costs results in (1) a decrease in our cost of operations, (2) a smaller decrease in our revenue and (3) an increase in our operating margin percentage.
To manage our exposure to volatility in fuel prices, we may enter into fuel derivative contracts as a risk management tool to mitigate the potential impact of certain market risks
90
associated with fluctuations in fuel prices; however, because energy prices can fluctuate significantly in a relatively short amount of time, we must also continually monitor and adjust our risk management strategies to address not only fuel price increases, but also fuel price volatility. As evidenced by the extreme decline in diesel fuel prices during the fourth quarter of 2014, diesel fuel prices are subject to significant volatility based on a variety of factors. In addition, the cost of these risk management tools generally increases with sustained high potential for volatility in the fuel market. For fiscal 2016, we utilized fuel derivative contracts to manage our exposure to fluctuations in fuel pricing and as of June 30, 2016 we had 6.7 million gallons under fixed price contracts. For a summary of our outstanding derivative instruments and changes in fair values as of and for the six months ended June 30, 2016 and 2015, respectively, see Note 5, Derivative Instruments and Hedging Activities, to our unaudited condensed consolidated financial statements. Settlements and payments on fuel derivatives amounted to $8.3 million and $11.1 million for the six months ended June 30, 2016 and 2015, respectively. A one-cent change in the underlying index would impact our other income by $0.1 million on an annual basis. Fuel price declines below the level of our derivative contracts may adversely affect us due to declines in fuel fee revenue that are not offset by lower pricing.
A portion of our contracts have cost pass-through provisions pursuant to which we pass through to our customers the incremental cost or benefit from higher or lower fuel prices, respectively based on third party indices. Since we economically hedge our fuel costs, depending on the extent and level of our fuel derivative contracts, we are subject to the risk that fuel prices will fall below the level of our fuel derivative contracts and we will have to pass such lower prices through to our customers resulting in lower fuel fee revenue, even though our fuel costs remain higher under our fuel derivative contracts.
Over the last several years, regulations have been adopted mandating changes in the composition of fuels for motor vehicles. The renewable fuel standards that the EPA sets annually affect the type of fuel our motor vehicle fleet uses. Pursuant to the Energy Independence and Security Act of 2007, the EPA establishes annual renewable fuel volume requirements and separate volume requirements for four different categories of renewable fuels (renewable fuel, advanced biofuel, cellulosic biofuel and biomass-based diesel). These volume requirements set standards for the proportion of refiners' or importers' total fuel volume that must be renewable and must take into account the fuels' impact on reducing GHG emissions. These regulations are one of many factors that may affect the cost of the fuel we use.
At our current consumption levels, a one-cent per gallon change in the price of diesel fuel changes our direct fuel costs by approximately $0.3 million on an annual basis, which would be partially offset by a smaller change in the fuel fees charged to our customers and the impact of changes in the fair value of our fuel derivative instruments. Accordingly, a substantial rise or drop in fuel costs could have a material effect on our revenue, cost of operations and operating margin.
Our operations also require the use of certain petrochemical-based products (such as liners at our landfills) whose costs may vary with the price of petrochemicals. An increase in the price of petrochemicals could increase the cost of those products, which would increase our operating and capital costs. We also are susceptible to (1) fuel fees charged by our vendors and (2) other pricing from our vendors due to their increases in indirect fuel costs.
91
Commodities Prices
We market recycled products such as cardboard, newspaper, plastics, aluminum, mixed paper and single stream from our MRFs. Market demand for recyclable materials causes volatility in commodity prices. At current volumes and mix of materials, we believe a ten dollar per ton change in the price of recyclable materials will change revenue and operating income by approximately $5.7 million and $4.5 million, respectively, on an annual basis.
Inflation and Prevailing Economic Conditions
To date, inflation has not had a significant impact on our operations. Consistent with industry practice, most of our service agreements provide for a pass-through of certain costs, including increases in landfill tipping fees and, in some cases, fuel costs. Competitive factors may require us to absorb at least a portion of these cost increases, particularly during periods of high inflation. Our business is located mainly in the Southern, Midwestern and Eastern United States. Therefore, our business, financial condition and results of operations are susceptible to downturns in the general economy in these geographic regions and other factors affecting the regions, such as state regulations and severe weather conditions. We are unable to forecast or determine the timing and/or the future impact of a sustained economic slowdown.
92
Our Company
We are a leading integrated provider of non-hazardous solid waste collection, transfer, recycling and disposal services operating primarily in secondary markets or under exclusive arrangements with municipalities. We have a presence in 16 states across the Midwest, South and East regions of the United States, serving approximately 2.8 million residential and 221,000 C&I customers through our extensive network of 92 collection operations, 72 transfer stations, 21 owned or operated recycling facilities and 39 owned or operated landfills. We seek to drive financial performance in markets in which we own or operate a landfill or in certain disposal-neutral markets, where the landfill is owned by our municipal customer. In markets in which we own or operate a landfill, we aim to create and maintain vertically integrated operations through which we manage a majority of our customers' waste from the point of collection through the point of disposal, a process we refer to as internalization. By internalizing a majority of the waste in these markets, we are able to deliver high quality customer service while also ensuring a stable revenue stream and maximizing profitability and cash flow from operations. In disposal-neutral markets, we focus selectively on opportunities where we can negotiate exclusive arrangements with our municipal customers, facilitating highly-efficient and profitable collection operations with lower capital requirements.
Geographically, we focus our business principally in secondary, or less densely populated non-urban, markets where the presence of large national providers is generally more limited. We also compete selectively in primary, or densely populated urban, markets where we can capitalize on opportunities for vertical integration through our high-quality transfer and disposal infrastructure and where we can benefit from highly-efficient collection route density. Through our disciplined focus on secondary markets and on markets with favorable disposal characteristics, we are able to maximize customer retention and benefit from a higher and more stable pricing environment.
We have historically generated consistent revenue growth across economic cycles. To continue to drive growth, we are focused on a number of key areas, including: municipal contract wins, new customer additions, disciplined pricing and expansion into additional geographies and markets with favorable dynamics and demographic trends. We have established a systematic and replicable approach to municipal contract bidding and identifying privatization opportunities. Since the consummation of our transformational $1.9 billion acquisition of Veolia ES Solid Waste, Inc. in 2012 to date, we have been awarded 128 new long-term, exclusive municipal contracts for a net increase of 42 municipal contracts. Our existing operations also provide us with a scalable platform to drive profitable growth through
93
strategic acquisitions. From the Veolia Acquisition to date, we have executed 45 tuck-in acquisitions, primarily of collection operations. By assimilating acquisitions into our vertically integrated geographic operations, we have been able to improve adjusted EBITDA margin post-acquisition. Due to our scale, our tuck-in acquisition strategy enables us to drive robust inorganic growth despite a relatively small average transaction size.
For the twelve months ended June 30, 2016, our revenue by geography, revenue by source and revenue by category were as follows:
- (1)
- Primary market revenue includes revenue from the following four markets (excluding revenue from exclusive municipal contracts): Atlanta, Chicago, Detroit and Philadelphia.
We operate across the Midwest, South and East regions of the United States, which accounted for 38%, 35% and 27% of our revenue for the twelve months ended June 30, 2016, respectively. We believe that our broad geographic presence positions us well to capitalize on favorable demographic and macroeconomic trends in the markets that we serve. According to the U.S. Census Bureau and Woods & Poole, population and gross regional product growth in certain of our markets, particularly those in the Southeast, are expected to outpace overall U.S. population and GDP growth through 2030.
Complementing our geographic diversity, we maintain an attractive mix of revenue from varying sources with limited exposure to commodity sales, which helps to enhance our financial performance across economic cycles. We also benefit from a high degree of customer diversification, with no single customer accounting for more than 2% of revenue for the twelve months ended June 30, 2016. Our municipal customer relationships are generally supported by exclusive contracts ranging from three to ten years in initial duration with subsequent renewal periods, and we have historically achieved a renewal rate of approximately 85% with these customers. Our standard C&I service agreement is a five-year renewable agreement. Management believes we maintain strong relationships with our C&I customers. Our large and diverse customer base, combined with our long-term contracts and consistently high renewal rates, provide us with significant revenue and earnings stability and visibility.
We are led by a veteran management team with extensive experience in operating, acquiring and integrating solid waste services businesses. Our senior leadership team averages more than 20 years of experience in the solid waste industry. During their tenure, they have instituted a strong, unified corporate culture and successfully implemented our growth and operational initiatives. We believe our management team has positioned our business well for continued growth and improvements in adjusted EBITDA margin and cash flow from operations, and we intend to continue to focus our efforts on generating both organic and inorganic growth.
94
For the twelve months ended June 30, 2016, we generated revenues of $1.4 billion, net loss of $28.3 million, adjusted EBITDA of $401.4 million and cash flow from operations of $219.6 million. For a reconciliation of adjusted EBITDA to net income (loss) see "Summary Consolidated Financial Information and Other Data."
Our Industry
More than 250 million tons of solid waste are generated in the United States each year. The U.S. solid waste industry generated approximately $59 billion in revenue in 2013 and is expected to reach approximately $66 billion in 2019, according to IBISWorld. The industry can be classified into the following asset categories: collection operations, transfer stations, landfills, recycling facilities and waste-to-energy plants. Vertical integration of these assets typically drives greater efficiency and superior operating margins and as a result, waste companies attempt to create integrated operations in an effort to enhance profitability, cash flow and return on capital.
The solid waste industry is relatively resistant to cyclical economic trends due to the non-discretionary nature of the services provided and, as such, has experienced just one year of relatively modest decline since 1997. The industry is characterized by a range of attractive features, including: (i) high visibility of earnings due to predictable waste generation of residential and commercial customers; (ii) the absence of cost-effective substitutes for collection, beneficial re-use and landfill disposal; (iii) high barriers to entry created by the lengthy permitting process and significant capital costs of landfill development; and (iv) the ongoing trend of municipalities and local governments seeking to turn over management of public services, including waste services, to private firms.
The following table sets forth historical and projected solid waste industry revenue growth:
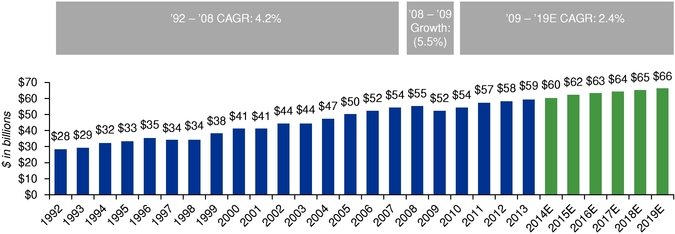
Source: Waste Business Journal's Waste Market Overview & Outlook 2012, IBISWorld US Waste Treatment & Disposal and US Waste Collection Reports April 2014
Once residential and C&I waste is collected, it is either delivered directly to a landfill for disposal, to an incinerator, to a MRF to be recycled or to a transfer station, where waste is consolidated for more efficient transfer to a landfill by either truck or rail. The majority of waste in the United States continues to be deposited in landfills given the inherent cost advantages of landfill disposal relative to other alternatives. The implementation of RCRA Subtitle D in 1991 significantly raised the environmental standards required of landfill operators, including by mandating the use of composite liners, leachate collection systems
95
and gas collection systems. Following the introduction of RCRA Subtitle D, the cost of both new and existing landfills increased substantially and a large number of low cost, substandard landfills were forced to close, resulting in a trend toward larger landfills that are generally located farther from waste generating population centers. To ensure waste volumes for these larger and more remote landfills, transfer stations have become an increasingly valuable component of the solid waste value chain. The high cost of developing and maintaining transfer and disposal assets has resulted in industry consolidation with the top five providers in the industry accounting for more than 50% of U.S. disposal capacity. Furthermore, this consolidation trend and the resulting scarcity of active disposal locations have resulted in improved pricing and profitability dynamics for these providers.
The solid waste industry is served by a few large, national and regional publicly-owned companies, which comprise approximately 57% of the total U.S. solid waste market, several regional privately owned solid waste companies, and thousands of small privately owned companies, which generally maintain collection operations with limited or no in house transfer, recycling or disposal capabilities. Privately owned waste collection operations in the aggregate represent approximately 20% of the total solid waste market. In addition, municipalities continue to own and operate waste collection and/or disposal operations in certain markets, representing approximately 23% of the overall U.S. solid waste market.
Residential Collection Market
The residential collection market consists of periodic curbside pickup of residential household waste and delivery to either a landfill or recycling facility. Residential collection services are provided under long-term contracts with municipalities ranging from three to ten years, often on an exclusive basis in a particular region. Volume growth in the residential market is driven primarily by population growth and GDP growth, while pricing is generally tied to CPI and is typically adjusted annually. Since the previous economic downturn in 2008 and 2009, annual GDP growth has been in the 1.5% - 2.5% range. The International Monetary Fund currently forecasts consistent expansion going forward, with GDP growth expected to be 2.2% in 2016 and 2.5% in 2017. Despite deflationary pressures resulting from recent oil price declines, the CPI is expected to increase by 2.0% in 2016 and 1.7% in 2017 according to the Federal Planning Bureau, compared to 0.6% in 2015 and 0.3% in 2014.
Commercial and Industrial Waste Market
The C&I market consists of non-residential customers that utilize either permanent rolloff containers or waste compactors to meet their disposal needs. As with residential waste, C&I waste is collected periodically and either disposed of in a landfill or recycled. New C&I development often occurs shortly after new residential construction to meet the needs of a growing population, and volume growth in the C&I market is driven primarily by GDP growth, new business formations, industrial production and non-residential construction. According to the Federal Reserve, the Industrial Production Index has reached pre-recession levels and has grown almost 20% since the 2009 recession low. After several years since the 2008 and 2009 recession, the non-residential construction market is still in a period of recovery. According to Dodge Data & Analytics, non-residential construction spending is expected to grow by 7.4% in 2016 and 9.3% in 2017. Non-residential construction activity remains below the pre-recession peak of $711 billion in 2008, suggesting incremental upside in the near-term.
Construction and Demolition Waste Market
The C&D market involves the collection and disposal of debris generated during the construction, renovation and demolition of residential or non-residential structures. C&D
96
customers generally utilize temporary rolloff containers provided by a waste collection firm for the duration of the project. C&D waste volumes are highly correlated to both residential and non-residential construction activity which is expected to significantly grow in the near-term. The residential construction market has experienced robust growth in recent years, with housing starts having risen by 7.6% in 2014 and 10.7% in 2015 to 1.1 million. Despite the recent recovery, housing starts remain well below the peak of 2.1 million starts in 2005 and the long-term historical average of 1.4 million starts from 1960 through 2015. According to the Mortgage Bankers Association, housing starts are expected to grow a further 6.8% in 2016 and 6.9% in 2017, which should support incremental growth in the C&D market. The C&D market is also driven by residential repair and remodel spending, which is expected to grow at an annualized rate of 6.2% through 2016 according to the Joint Center for Housing Studies of Harvard University, driven by increasing home values, existing home sales, the current low interest rate environment and high levels of employment.
Adjacent Market Categories
In addition to the residential and C&I waste streams traditionally serviced by waste collection companies, regulatory and other factors have created opportunities to expand services in other non-hazardous waste markets. Two significant examples of such waste streams include coal ash and energy waste.
Coal combustion residuals ("CCR"), also known as coal ash, are one of the largest industrial waste streams generated in the United States. In 2014, 557 coal-fired electric utilities burned over 850 million tons of coal, generating approximately 120 million tons of coal ash, roughly half of which is recycled and used in concrete production, aggregates and related applications. The EPA recently determined that improperly constructed or managed coal ash disposal units have been linked to cases of ground water and air contaminations. In April 2015, the EPA introduced stricter technical requirements for coal ash surface impoundments and landfills on both state and federal levels, with new regulations taking effect in October 2015 and applying to all U.S. electric utilities and independent power producers. Under the new regulations, non-compliant coal ash disposal units must be replaced with secure, lined landfills similar to those currently used in MSW landfills, creating an opportunity for waste management companies to significantly increase waste volume in an adjacent market, particularly those with existing landfills in close proximity to ash producing facilities. We have identified 129 active coal-fired plants within a 75-mile radius of 28 of our landfills that are permitted to accept coal ash, allowing us to logistically transport and handle their CCR.
As U.S. oil and natural gas production has increased substantially in recent years, the annual volume of energy waste generated by the petroleum and natural gas industry has increased to roughly 260,000 metric tons per year according to the EPA. Energy waste consists of both solid and liquid waste generated as a byproduct of well development and ongoing production of oil and natural gas. The need for environmentally sustainable collection, treatment, recycling and disposal of contaminated water, completion fluids, drilling muds, drill cuttings, contaminated soils and other waste byproducts represents a significant opportunity for waste and environmental services providers. Despite the recent decline in oil and gas prices, U.S. oil and gas production is expected to continue to increase, and Spears & Associates expects approximately 105,000 total wells to be drilled in the U.S. through 2020. As the oil and gas market continues to expand, it creates a significant opportunity for waste management companies, particularly those with existing landfills in close proximity to energy waste producing sites. Our strategically located infrastructure positions us well to capitalize on the positive long-term opportunity from the fracking-intense Marcellus Shale region, including 6 landfills and 8 collection operations.
97
Our Operating Strengths
Vertically Integrated Geographic Operations
Our vertically integrated geographic operations enable us to provide high-quality service to our customers while simultaneously capitalizing on growth opportunities, capturing additional revenue streams and maximizing profitability. In most of the markets we serve, we integrate our network of collection, transfer and disposal assets into geographic operations that allow us to manage the waste stream throughout the entire value chain—from the point of collection to the point of disposal—exclusively using our own resources. This enables us to generate a steady, predictable stream of waste volume and capture the incremental disposal margin that otherwise would be paid to a third party. It also enables us to charge third-party collection service providers tipping fees for the use of our transfer stations or landfills, providing a source of recurring revenue at attractive EBITDA margins. In addition, our high internalization rate provides us with a meaningful cost advantage, positioning us well to win additional profitable business through new customer acquisition and municipal contract awards. Finally, our vertically integrated geographic operations position us well for inorganic growth, as we can acquire transfer stations or collection operations and efficiently integrate them into our existing platform.
Strategically Located Network of Landfill and Transfer Station Assets
Our network of 39 active and strategically located landfills is a critical component of our integrated operations and provides a distinct competitive advantage in the markets that we serve. Our network of landfill assets is difficult to replicate due to a range of factors, including substantial upfront capital requirements for new landfill development, lengthy permitting processes, geographic and political constraints on new landfills and stringent requirements for ongoing environmental and regulatory compliance. Our landfill assets have substantial remaining capacity, which will help us to sustain the long-term competitive advantages that our vertically integrated model provides.
The value of our landfill assets is further enhanced by our complementary network of transfer stations, which provides us with an additional competitive advantage by allowing us to capture waste volumes that we could not otherwise service. The shift toward fewer, larger landfills has resulted in landfills that are generally located farther from population centers and waste being transported longer distances between collection and disposal, often after consolidation at a transfer station. With a landfill and collection services, we can provide vertically integrated operations that cover a substantial geographic area surrounding the landfill. However, with one or more transfer stations strategically located at the periphery of this service area, and with additional collection operations around the transfer station(s), we can direct substantially more waste volume from a significantly broader service area to an existing landfill. By expanding the geographic reach of our landfills, our network of transfer stations enhances our economies of scale and strengthens the competitive advantage that our landfills provide.
Well-Positioned in Secondary and Exclusive Markets
We focus our business principally in secondary markets where competition among large national providers is generally more limited. We also participate in certain disposal-neutral markets in which we provide services under exclusive arrangements with our municipal customers, which facilitates highly-efficient and profitable collection operations and lower capital requirements. We believe this strategic focus positions us to maintain significant share within our target markets, maximize customer retention and benefit from a higher and more
98
stable pricing environment. For the twelve months ended June 30, 2016, revenue from our secondary markets and exclusive municipal contracts accounted for approximately 80% of total revenue.
Proven Ability to Identify, Execute and Integrate Acquisitions and Win New Municipal Contracts
Our ability to execute and integrate value-enhancing, tuck-in acquisitions and win new municipal contracts has been a core component of our growth. Our scale, geographic reach, vertical integration and strong position in secondary markets position us well to identify and execute strategic acquisitions. From the Veolia Acquisition to date, we have completed 45 tuck-in acquisitions, and by integrating acquired operations into our existing network, we have been able to improve adjusted EBITDA margin and enhance cash flow from operations post-acquisition.
We also have experience executing large-scale transactions, as highlighted by the Veolia Acquisition. In addition to significantly expanding our scale and scope of operations, the Veolia Acquisition enhanced our geographic footprint by providing us with complementary operations in our East and South regions, as well as strong, new positions in secondary markets in the Midwestern United States. We have also achieved cost efficiencies and economies of scale through improved internalization, increased route density and more efficient asset utilization while maintaining our strong positions in the local markets that we serve.
Finally, we have demonstrated success in municipal contract bidding and capitalizing on privatization opportunities and, since the Veolia Acquisition to date, we have been awarded 131 new long-term municipal contracts. Due to the strength of our localized operations and our highly experienced regional management team, we maintain close relationships with key decision-makers throughout our markets, which position us well to capitalize on new municipal contracts and privatization opportunities.
Customer Diversification with Long-Term Contracts
We serve approximately 2.8 million residential and 221,000 C&I customers and over 800 municipalities, with no single customer representing more than 2% of revenue in 2015 or for the six months ended June 30, 2016. Our municipal customer relationships are generally supported by contracts ranging from three to ten years in initial duration with subsequent renewal periods, and we have historically achieved a renewal rate of approximately 85% with these customers. Our standard C&I service agreement is a five-year renewable agreement. Management believes we maintain strong relationships with our C&I customers. Our breadth of customer relationships, long-term contracts and high renewal rates provide us with a high degree of revenue and earnings stability and visibility.
Disciplined Focus on Service and Safety
Our corporate slogan is "Service First, Safety Always." We maintain a relentless focus on customer service and we strive to consistently exceed our customers' expectations. Our localized approach to customer service and high quality management at our local operations result in a highly responsive, customer service oriented organization. By providing a high level of customer service, we maximize the value our customers receive from the services we deliver, which we believe ultimately increases customer loyalty and supports price stability.
The safety of our workforce and our customers is paramount to us. We have a strong track record of safety and environmental compliance driven by company-wide programs
99
centered on workforce training, stringent risk management and safety-related practices. Our shift toward an automated fleet has also enhanced our safety profile. Automated trucks, which only require a driver and collect waste automatically using a hydraulic lifting mechanism, are substantially safer than traditional rear-load vehicles, which require both a driver and an operator who manually loads waste into the rear of a vehicle. With a growing portion of our fleet comprised of automated vehicles, we have sought to create a safer work environment for our employees and to reduce the frequency of workplace injuries.
Industry Leading Management Team
Led by CEO Richard Burke, CFO Steven Carn and COO John Spegal, our management team has extensive experience in the solid waste industry, consisting of operations, acquisitions and the development of disposal capacity. Our leadership team has instituted a strong, unified corporate culture and has successfully executed a differentiated growth strategy that positions us well to capitalize on continued organic and inorganic growth initiatives. While our leadership team drives our overall strategy, our decentralized management structure facilitates local management autonomy and enables us to capitalize on growth and cost reduction opportunities at the local level. Averaging more than 20 years of industry experience, our senior management team is supported by a talented group of regional, district and general managers who execute on our strategy in their respective markets.
Our Growth Strategies
Continue to Develop Vertically Integrated Geographic Operations
Our vertically integrated geographic operating model serves as the foundation for our business strategy. We pursue a multi-faceted growth strategy within this operating framework, including both growth within our existing network of landfill and transfer stations and expansion into additional geographies in which we establish new vertically integrated operations. Further development of our existing vertically integrated operations will allow us to capitalize on incremental growth initiatives and efficiency gains, including the internalization of additional waste streams to expand volume, increase revenue and improve profitability.
Pursue Disciplined Acquisition Strategy
Our ability to execute value-enhancing, tuck-in acquisitions has been a core component of our growth. From the Veolia Acquisition to date, we have completed 45 strategic tuck-in acquisitions at attractive EBITDA multiples. The U.S. solid waste industry remains highly fragmented, with approximately 43% of the total market consisting of either privately held providers or municipal operators. We believe that significant opportunities exist for further consolidation and that, as a result of our scale and broad geographic presence, we remain ideally positioned to capitalize on these opportunities.
We intend to expand the scope of our operations by continuing to acquire solid waste management companies and disposal facilities in new markets and in existing or adjacent markets that are combined with, or tucked into, our existing operations. We intend to focus our acquisition efforts on markets that we believe provide significant growth opportunities. This focus typically highlights markets in which we can: (i) provide vertically integrated collection and disposal services; or (ii) provide waste collection services under exclusive arrangements. We believe that our experienced management team, decentralized operating
100
strategy, financial strength and scale make us an attractive buyer to waste collection and disposal acquisition candidates.
Secure Additional Exclusive Municipal Contracts
We intend to continue to devote significant resources to securing additional municipal contracts. We have established a systematic and replicable approach to municipal contract bidding and privatization opportunities. In bidding for municipal contracts, our management team draws on its experience in the solid waste industry and knowledge of local service areas in existing and target markets. Our highly aligned district and local general management and sales and marketing personnel maintain relationships with local decision-makers within their service areas and are responsible for renewing and renegotiating existing municipal contracts and securing additional agreements and contracts with attractive financial returns.
Drive Financial Performance through Operational Excellence
We maintain a consistent operational focus on prudent cost management and pricing discipline to drive profitability. Our strategy is implemented by our district and local general managers who continuously monitor their local markets and target profit maximization rather than throughput alone. We closely align the incentive structure of our local managers to the safety and financial performance of the local operations that they oversee to drive adjusted EBITDA and operating cash flow growth at the local level. In addition to increasing earnings through this operational focus, we remain committed to financial discipline through prudent management of returns on equity and capital deployed. We seek to increase operating margins, adjusted EBITDA and cash flow from operations and drive higher returns on invested capital by implementing programs focused on areas such as sales productivity and pricing effectiveness, driver productivity and route optimization, maintenance efficiency and effective purchasing.
Invest in Strategic Infrastructure
We will continue to invest in our strategic infrastructure to support growth and expand our adjusted EBITDA margin. Given the long remaining life of our existing network of landfills, we continuously invest resources toward the development and enhancement of our landfills to increase our disposal capacity. Similarly, we will continue to evaluate opportunities to maximize the efficiency of our collection operations. We are currently in the process of converting our collection fleet to CNG-fueled vehicles in certain markets where we can achieve an attractive return on our investment. CNG-fueled vehicles, which can provide significant operating cost savings relative to diesel alternatives, currently comprise 18% of our routed fleet, and we continue to evaluate further conversion opportunities. We believe this will result in an improved profitability profile, as a result of the added fuel efficiency and labor savings. Finally, we have converted approximately 54% of our routed residential collection fleet to automated vehicles and continue to convert more of our routed collection fleet to automated vehicles, which should result in incremental operating cost savings. In addition to labor cost savings, management believes the shift toward an automated fleet will result in reduced injury claims and workers compensation expense.
Invest in Our People
Employing and developing a broad base of highly talented employees is essential to success in our decentralized operating model. We will continue to invest in high-quality talent in order to most effectively manage our existing operations and execute our growth strategy. We rely on managers and employees with specific local market knowledge to not only operate
101
our business but also to identify and integrate tuck-in acquisitions and new municipal contract wins. As such, we continuously recruit and hire talented local-level employees who are capable of supporting our growth initiatives and provide the best-in-class customer service we strive to deliver.
We have consistently realized organic growth driven by a strong, dedicated sales force. Our team of professionals has executed our sales strategy by focusing not only on growth, but also on profitability. We will continue to drive this strategy by rewarding our managers who successfully monitor their local markets and have a proven track record of achieving profitable growth. We will also invest in new sales employees and marketing initiatives within markets that further our overall vertically integrated geographic operating strategy, driving new wins, enhancing our route density and increasing volumes to landfills.
Our History
Our predecessor company was formed in November 2000 with the vision to build a vertically integrated non-hazardous solid waste business in the Southeastern United States. Following the acquisition of ADS Inc. and Interstate Waste by Highstar Capital in 2006, our management team, together with Highstar Capital, successfully implemented growth and operational strategies to establish these companies as among the largest waste management companies in their respective markets. In addition to substantially increasing our overall scale, the Veolia Acquisition provided a synergistic overlap in key South and East market segments while establishing a strong presence in several secondary markets in the Midwest. Subsequent to the Veolia Acquisition, we divested certain operations in the Northeast and South regions, including substantially all of our New York, New Jersey, Massachusetts, Mississippi and Vermont operations, which did not align with our strategic focus. We have continued to pursue our vertically integrated approach to the market through both organic initiatives and through strategic tuck-in acquisitions, having completed 45 acquisitions since the Veolia Acquisition to date.
Our Sponsor
Highstar Capital provides operationally focused, value-added investment management services. Since 2000, the Highstar Capital team has managed approximately $8 billion on behalf of its managed funds and co-investment vehicles in a diversified portfolio of energy, transportation and environmental services assets and businesses.
Operations
Our operations are managed through three regional offices located in the South, Midwest and East regions of the United States. Each of the regions has a diversified portfolio of collection, disposal and recycling operations that are supervised by regional vice presidents with extensive experience in growing, operating and managing solid waste management companies within their local markets. Each regional vice president works with and supervises several district and general managers who manage facilities and operations.
Collection Services. We serve approximately 2.8 million residential and 221,000 C&I customers and over 800 municipalities through our 92 collection operations. We internalize 63% of the waste into our own landfills as of June 30, 2016. 18% of our routed fleet uses CNG, which significantly reduces carbon emissions compared to diesel-fueled collection trucks.
Our residential collection operations consist of curbside collection of residential refuse from small carts or containers into collection vehicles for transport to a disposal/recycling site. These services are typically performed either under long-term contracts with local government entities or on a subscription basis, whereby individual households contract directly with us for our collection services. Our residential contracts generally allow for rate increases.
102
We generally secure our contracts with municipalities through a competitive bid process and such contracts give us exclusive rights to service all or a portion of the homes in the respective municipalities. These contracts generally range in term from three to ten years and represent approximately 91% of our residential collection revenue. Municipal contracts can be designed as either mandatory or non-mandatory franchises. Mandatory franchises allow us to become the exclusive provider of waste management services for the areas of the municipality included in the contract, which requires all residential customers within those areas to use our services for solid waste collection and disposal. Non-mandatory franchises allow us to retain the exclusive right to service the specified areas of the municipality, with no competitor permitted to offer services to residential customers, but residential customers may choose not to use our services.
The fees that we receive for residential collection on an individual subscription basis are based primarily on market factors, frequency and type of service, the distance to the disposal facility and the cost of disposal. In general, subscription residential collection fees are paid quarterly or monthly in advance by the residential customers receiving the service and other residential services are paid in arrears. Residential collection revenue represents approximately 30% of our overall revenue.
For C&I operations, we supply our customers with waste containers suitable for their needs and rent or sell compactors to large waste generators. Standard service agreements with C&I customers are typically three to five years in length with pricing based on estimated disposal weight and time required to service the account. We generally bill commercial customers monthly in advance. Industrial customers are generally billed in arrears for our services. The customer generally may not cancel C&I standard service agreements for a period of 36 to 60 months from the start of service without incurring a cancellation penalty. In addition, contracts typically are renewed automatically unless the customer specifically requests cancellation. Our standard C&I service contracts generally allow for rate increases and represent about 53% of our overall collection revenue.
Our C&D waste services provide C&D sites with rolloff containers and waste collection, transportation and disposal services. C&D services are typically provided pursuant to arrangements in which the customer provides 24-hour advance notice of its disposal needs and is billed on a "per pull" plus disposal basis. While the majority of our rolloff services are provided to customers under long-term contracts, we generally do not enter into contracts with our C&D customers that utilize temporary rolloff containers due to the relatively short-term nature of most C&D projects. Our temporary rolloff customers pay us in arrears for our services.
Disposal Services. Landfill disposal services represent the final stage in our vertically integrated waste collection and disposal services solution. We own or operate 30 MSW landfills and 9 C&D landfills, enabling us to offer comprehensive service to our customers. Our landfills average approximately 15.9 million tons of waste annually, of which 63% of the volume is internalized from our collection operations and transfer stations as of June 30, 2016. We charge tipping fees to third parties that utilize our landfills and transfer stations.
As of June 30, 2016, our landfills had approximately 319.6 million cubic yards of utilized airspace and total permitted and deemed airspace of approximately 950.9 million cubic yards. Our active landfills that are currently accepting waste have an average of 37 years of aggregate remaining permitable and deemed permitable life with a capacity utilization of 34%. The in-place capacity of our landfills is subject to change based on engineering factors, requirements of regulatory authorities, our ability to continue to operate our landfills in compliance with applicable regulations and our ability to successfully renew operating permits
103
and obtain expansion permits at our sites. Some of our landfills accept non-hazardous special waste, including coal ash, asbestos and contaminated soils.
Most of our active landfill sites have the potential for expanded disposal capacity beyond the currently permitted acreage. We monitor the availability of permitted disposal capacity at each of our landfills and evaluate whether to pursue an expansion at a given landfill based on estimated future waste volumes and prices, market needs, remaining capacity and the likelihood of obtaining an expansion. To satisfy future disposal demand, we are currently seeking to expand permitted capacity at certain of our landfills. However, we cannot assure you that all proposed or future expansions will be permitted as designed.
We also have responsibility for five closed landfills, for which we have associated closure and post-closure obligations.
As part of our vertically integrated solid waste disposal services, we operate 75 transfer stations. Transfer stations receive, consolidate and transfer solid waste to landfills and recycling facilities. Transfer stations enable us to:
- •
- increase the operational reach of our landfill operations;
- •
- increase the volume of revenue-generating disposal at our landfills;
- •
- achieve greater leverage in negotiating more favorable disposal rates at landfills that we do not operate;
- •
- improve efficiency of collection, personnel and equipment; and
- •
- build relationships with municipalities and other operators that deliver waste to our transfer stations, leading to additional growth and acquisition opportunities.
Revenue at transfer stations is primarily generated by charging tipping or disposal fees. Our collection operations deposit waste at these transfer stations, as do other private and municipal haulers, for compaction and transfer to disposal sites or MRFs. Transfer stations provide our collection operations with a cost-effective means to consolidate waste and reduce transportation costs while providing our landfill sites with an additional point of access to extend the geographic reach of a particular landfill site with the goal of increased internalization.
Recycling Services. We are focused on opportunistically developing our base of recycling facilities. There has been a growing interest in recycling, which is driven by public and private markets that are placing environmental stewardship as a top priority. This is evidenced by requests for proposals that incorporate alternate methods to manage the collection, processing and disposal of waste.
We have a network of 21 recycling facilities that we own, manage or operate. These facilities generate revenue through the collection, processing and sale of old corrugated cardboard, old newspaper, mixed paper, aluminum, glass and other materials. These recyclable materials are internally collected by our residential and industrial collection operations as well as third-party haulers.
Fuel and Environmental Fees. The amounts charged for collection, disposal, transfer, and recycling services may include fuel fees and environmental fees. Fuel fees and environmental fees are not designed to be specific to the direct costs and expense to service an individual customer's account, but rather are designed to address and to help recover for changes in our overall cost structure and to achieve an operating margin acceptable to us.
Other Services. Other revenue is comprised of ancillary revenue-generating activities, such as landfill gas-to-energy operations at MSW landfills, management of third-party owned
104
landfills, customer service charges relating to overdue payments, customer administrative fees relating to customers who request paper copies of invoices rather than opting for electronic invoices and a small brokerage business (which we divested in 2015).
Customers
We provide services to a broad base of commercial, industrial, municipal and residential customers. No single customer individually accounted for more than 2% of our consolidated revenue for the six months ended June 30, 2016 or for the year ended December 31, 2015.
Competition
Although we operate in a highly competitive industry, entry into our business and the ability to operate profitably require substantial amounts of capital and managerial experience. Competition in the non-hazardous solid waste industry comes from a few large, national publicly owned companies, several regional publicly and privately owned solid waste companies, and thousands of small privately owned companies. In any given market, competitors may have larger operations and greater resources. In addition to national and regional firms and numerous local companies, we compete with municipalities that maintain waste collection or disposal operations. These municipalities may have financial advantages due to the availability of tax revenue and tax-exempt financing.
We compete for collection accounts primarily on the basis of price and the quality of our services. From time to time, our competitors reduce the price of their services in an effort to expand market share or to win a competitively bid municipal contract. Our ability to maintain and increase prices in certain markets may be impacted by our competitors' pricing policies. This may have an impact on our future revenue and profitability.
Regulation
Our facilities and operations are subject to a variety of federal, state and local requirements that regulate the environment, public health, safety, zoning and land use. Operating and other permits, licenses and other approvals are required for landfills and transfer stations, recycling facilities, certain solid waste collection vehicles, fuel storage tanks and other facilities that we own or operate. These permits are subject to denial, revocation, suspension, modification and renewal in certain circumstances. Federal, state and local laws and regulations vary, but generally govern wastewater or storm water discharges, air emissions, the handling, transportation, treatment, storage and disposal of hazardous and non-hazardous waste, and the remediation of contamination associated with the release or threatened release of hazardous substances. These laws and regulations provide governmental authorities with strict powers of enforcement, which include the ability to revoke or decline to renew environmental or other permits, obtain injunctions, or impose fines or penalties in the event of violations, including criminal penalties. The EPA and various other federal, state and local authorities administer these regulations.
We strive to conduct our operations in compliance with applicable laws, regulations and permits. However, from time to time we have been issued notices and citations from governmental authorities that have resulted in fines, penalties, the need to expend funds for compliance with environmental laws and regulations, remedial work and related activities at various landfills and other facilities. We cannot assure you that citations and notices will not be issued in the future or that any such notice or citation will not have a material effect on our operations or results.
105
Federal Regulation. The following summarizes the primary federal environmental and occupational health and safety-related statutes that affect our facilities and operations:
RCRA, as amended, regulates handling, transporting and disposing of hazardous and non-hazardous waste and delegates authority to states to develop programs to ensure the safe disposal of solid waste. In 1991, the EPA issued its final regulations under Subtitle D of RCRA, which set forth minimum federal performance and design criteria for solid waste landfills. These regulations are typically implemented by the states, although states can impose requirements that are more stringent than the Subtitle D standards. Occasionally, the condensates or other materials generated during our operations may be classified as a "regulated hazardous waste," and require special handling, transport and treatment. As a result, some of our operations are subject to RCRA, and comparable state laws, which impose requirements for the handling, storage, treatment and disposal of hazardous waste. Owners and operators of facilities that generate hazardous waste must obtain an EPA ID number and comply with generator requirements, including proper containerization, storage, handling, transportation and disposal. RCRA also imposes extensive recordkeeping and reporting obligations. We incur costs in complying with these standards in the ordinary course of our operations.
The Comprehensive Environmental Response, Compensation and Liability Act of 1980, as amended, ("CERCLA") which is also known as Superfund, provides for authorized federal authorities to respond directly to releases or threatened releases of hazardous substances into the environment that have created actual or potential environmental hazards. CERCLA's primary means for addressing such releases is to impose strict liability for cleanup of certain contaminated or disposal sites upon current and former site owners and operators, generators of the hazardous substances at the site and transporters who selected the disposal site and transported substances thereto. Liability under CERCLA is strict, joint and several and not dependent on the intentional release of hazardous substances; it can be based upon the release or threatened release, even as a result of lawful, unintentional and non-negligent action, of hazardous substances as the term is defined by CERCLA and other applicable statutes and regulations. The EPA may issue orders requiring responsible parties to perform response actions at sites, or the EPA may seek recovery of funds expended or to be expended in the future at sites. Liability may include contribution for cleanup costs incurred by a defendant in a CERCLA civil action or by an entity that has previously resolved its liability to federal or state regulators in an administrative or judicially-approved settlement. Liability under CERCLA could also include obligations to a potentially responsible party ("PRP") that voluntarily expends site clean-up costs. Further, liability for damage to publicly-owned natural resources may also be imposed. We are subject to potential liability under CERCLA as an owner or operator of facilities at which hazardous substances have been disposed and as an arranger, generator or transporter of hazardous substances disposed of at other locations.
The Federal Water Pollution Control Act of 1972, as amended, known as the Clean Water Act, regulates the discharge of pollutants into streams, rivers, groundwater or other surface waters from a variety of sources, including solid and hazardous waste disposal sites. If run-off from our operations may be discharged into surface waters, the Clean Water Act requires us to apply for and obtain discharge permits, conduct sampling and monitoring and, under certain circumstances, reduce the quantity of pollutants in those discharges. In 1990, the EPA issued additional standards for management of storm water runoff that require landfills and other waste-handling facilities to obtain storm water discharge permits. In addition, if a landfill or other facility discharges wastewater through a sewage system to a publicly-owned treatment works, the facility must comply with discharge limits imposed by the treatment works. Also, before the development or expansion of a landfill can alter or affect wetlands, a permit may have to be obtained providing for mitigation or replacement wetlands. The Clean
106
Water Act provides for civil, criminal and administrative penalties for violations of its provisions.
The Clean Air Act provides for increased federal, state and local regulation of the emission of air pollutants. Certain of our operations are subject to the requirements of the Clean Air Act, including large MSW landfills and landfill gas-to-energy facilities. In 1996 the EPA issued new source performance standards ("NSPS") and emission guidelines ("EG") controlling landfill gases from new and existing large landfills. In January 2003, the EPA issued Maximum Achievable Control Technology ("MACT") standards for MSW landfills subject to the NSPS. These regulations impose limits on air emissions from large MSW landfills, subject most of our large MSW landfills to certain operating permit requirements under Title V of the Clean Air Act and, in many instances, require installation of landfill gas collection and control systems to control emissions or to treat and utilize landfill gas on- or off-site. The EPA entered into a settlement agreement with the Environmental Defense Fund to evaluate the 1996 NSPS for new landfills as required by the Clean Air Act every eight years and revise them if deemed necessary. The EPA initially published a proposed landfill NSPS rule July 17, 2014. The new NSPS would apply to new or modified landfills, and impose requirements on independent operators of landfill gas and renewable natural gas facilities. On August 14, 2015, as part of the Obama Administration's Climate Action Plan—Strategy to Reduce Methane Emissions, the EPA issued a supplemental NSPS proposal for reducing emissions from new and modified landfills and, in a separate action, the EPA proposed updates to its 1996 Emission Guidelines for existing MSW landfills that would further reduce methane emissions. If implemented, these regulations would also require both new, modified and existing landfills to install pollution controls if nonmethane organic compounds emissions of landfill gas exceed 34 metric tons per year; closed landfills under the rule would remain subject to the current threshold of 50 metric tons per year. When the EPA issues the final NSPS rule, we will re-assess the capital and operating cost impact to our operations. If the EPA were to adopt more stringent requirements, capital expenditures and operating costs would increase. However, we do not believe that the regulatory changes would have a material adverse impact on our business as a whole.
In 2010, the EPA issued the PSD and Title V GHG Tailoring Rule, which expanded the EPA's federal air permitting authority to include the six GHGs, including methane and carbon dioxide. The rule sets new thresholds for GHG emissions that define when Clean Air Act permits are required. The requirements of these rules have not significantly affected our operations or cash flows, due to the tailored thresholds and exclusions of certain emissions from regulation.
In June 2013, the U.S. Supreme Court issued a decision that significantly limited the applicability and scope of EPA permitting requirements for GHGs from stationary sources, concluding that the EPA may not treat GHGs as an air pollutant for purposes of determining whether a source is required to obtain a PSD or Title V permit, although the court also concluded that the EPA can continue to require that PSD permits, which are otherwise required based on emissions of conventional pollutants, contain limitations on GHG emissions based on Best Available Control Technology ("BACT"). (In May 2015, the D.C. Circuit upheld the EPA's authority to continue regulating GHG emissions at sources already subject to Title V permitting requirements for other pollutants.) In November, 2014, the EPA issued a policy memorandum advising that it intends to propose exempting biogenic carbon dioxide emissions from waste-derived feedstocks (MSW and landfill gas) from PSD and Title V air permitting. The EPA based this proposal on the rationale that those emissions are likely to have minimal or no net atmospheric contributions, or even reduce such impacts, when compared to an alternate method of disposal. As a result of this U.S. Supreme Court ruling and EPA policy action, the anticipated impact of the PSD and Title V GHG Tailoring Rule on
107
our air permits, compliance and results of operations is not expected to have a material impact on our operations or results.
On August 3, 2015, the EPA published the final Clean Power Plan setting CO2 emission performance standards for affected electric generating units and requiring states to submit State Implementation Plans for reducing GHG emissions from affected sources and meeting the state's CO2 emission reduction goals. The Clean Power Plan contemplates that states may choose to meet their emission reduction obligations through a variety of measures including landfill gas. The final Clean Power Plan and the Proposed Federal Implementation Plan notes that states may choose to rely on waste derived biogenic feedstocks in their future proposed compliance plans required by the proposed Clean Power Plan rules. This recognition by the EPA may create new or expanded opportunities for renewable energy projects.
Other recent final and proposed rules to increase the stringency of certain National Ambient Air Quality Standards, such as the Ozone rule proposed in December 2014, and related PSD increment/significance thresholds could affect the cost, timeliness and availability of air permits for new and modified large MSW landfills and landfill gas to energy facilities. In general, controlling emissions involves installing collection wells in a landfill and routing the gas to a suitable energy recovery system or combustion device. As of June 30, 2016, we had five active projects at solid waste landfills where landfill gas was captured and utilized for its renewable energy value rather than flared. Efforts to curtail the emission of GHGs and to ameliorate the effect of climate change may require our landfills to deploy more stringent emission controls, with associated capital or operating costs, however, we do not believe that such regulations will have a material adverse impact on our business as a whole. The adoption of climate change legislation or regulations restricting emissions of GHG could increase our costs to operate.
Potential climate change and GHG regulatory initiatives have influenced our business strategy to provide low-carbon services to our customers, and we increasingly view our ability to offer lower carbon services as a key component of our business growth. If the U.S. were to impose a carbon tax or other form of GHG regulation increasing demand for low-carbon service offerings in the future, the services we are developing will be increasingly valuable.
In 2011, the EPA published the Non-Hazardous Secondary Materials ("NHSM") Rule, which provides the standards and procedures for identifying whether NHSM are solid waste under RCRA when used as fuels or ingredients in combustion units. The EPA also published NSPS and EGs for commercial and industrial solid waste incineration units, and MACT Standards for commercial and industrial boilers. The EPA published clarifications and amendments to these rules in 2013, and there is litigation surrounding the rules. Although the recently published amendments are generally favorable to our industry, some of the potential regulatory interpretations are undergoing review and other regulatory outcomes may be dependent on case-by-case administrative determinations. These could have a significant impact on some of our projects in which we are seeking to convert biomass or other secondary materials into products, fuels or energy. Therefore, it is not possible to quantify the financial impact of these rulemakings or pending administrative determinations at the present time. However, we believe the rules and administrative determinations will not have a material adverse impact on our business as a whole and are more likely to facilitate our efforts to reuse or recover energy value from secondary material streams.
In December 2014, the EPA issued a final rule regulating the disposal and beneficial use of CCR. The regulations encourage beneficial use of CCR in encapsulated uses (e.g., used in cement or wallboard), and use according to established industry standards (e.g., application of sludge for agricultural enrichment). The EPA also deemed disposal and beneficial use of CCR at permitted MSW landfills exempt from the new regulations because the RCRA Subtitle D
108
standards applicable at MSW landfills provide at least equivalent protection. The new standards are consistent with our approach to handling CCR at our sites currently, and we believe the new standards will provide a potential growth opportunity for us. States may impose standards more stringent than the federal program, and we will be monitoring state implementation to determine impact.
Additionally, emission and fuel economy standards have been imposed on manufacturers of transportation vehicles (including waste collection vehicles). The EPA continues to evaluate and develop regulations to increase fuel economy standards and reduce vehicle emissions. Such regulations could increase the costs of operating our fleet, but we do not believe any such regulations would have a material adverse impact on our business as a whole.
The Occupational Safety and Health Act of 1970, as amended, ("OSH") establishes certain employer responsibilities, including maintenance of a workplace free of recognized hazards likely to cause death or serious injury, compliance with standards promulgated by the Occupational Safety and Health Administration ("OSHA"), and various reporting and record keeping obligations as well as disclosure and procedural requirements. Various standards for notices of hazards, safety in excavation and demolition work and the handling of asbestos, may apply to our operations. The Department of Transportation and OSHA, along with other federal agencies, have jurisdiction over certain aspects of hazardous materials and hazardous waste, including safety, movement and disposal. Various state and local agencies with jurisdiction over disposal of hazardous waste may seek to regulate movement of hazardous materials in areas not otherwise preempted by federal law.
State and Local Regulation. Each state in which we operate has its own laws and regulations governing solid waste disposal, water and air pollution, and, in most cases, releases and cleanup of hazardous substances and liabilities for such matters. States also have adopted regulations governing the design, operation, maintenance and closure of landfills and transfer stations. Some counties, municipalities and other local governments have adopted similar laws and regulations. In addition, our operations may be affected by the trend in many states toward requiring solid waste reduction and recycling programs. For example, several states have enacted laws that require counties or municipalities to adopt comprehensive plans to reduce, through solid waste planning, composting, recycling or other programs, the volume of solid waste deposited in landfills. Additionally, laws and regulations restricting the disposal of certain waste in solid waste landfills, including yard waste, newspapers, beverage containers, unshredded tires, lead-acid batteries, electronic wastes and household appliances, have been adopted in several states and are being considered in others. Legislative and regulatory measures to mandate or encourage waste reduction at the source and waste recycling also have been or are under consideration by the U.S. Congress and the EPA.
To construct, operate and expand a landfill, we must obtain one or more construction or operating permits, as well as zoning and land use approvals. These permits and approvals may be burdensome to obtain and to comply with, are often opposed by neighboring landowners and citizens' and environmental groups, may be subject to periodic renewal, and are subject to denial, modification, non-renewal and revocation by the issuing agency. Significant compliance disclosure obligations often accompany these processes. In connection with our acquisition of existing landfills, we may be required to spend considerable time, effort and money to bring the acquired facilities into compliance with applicable requirements and to obtain the permits and approvals necessary to increase their capacity. While we typically take into account the costs to bring an asset into compliance with applicable requirements during the acquisition process, we may incur costs beyond those estimated in the pre-acquisition stage.
109
Other Regulations. Many of our facilities own and operate above ground or underground storage tanks that are generally used to store petroleum-based products. These tanks are subject to federal, state and local laws and regulations that mandate their periodic testing, upgrading, closure and removal. In the event of leaks or releases from these tanks, these regulations require that polluted groundwater and soils be remediated. While we believe that all of our underground storage tanks currently meet applicable regulatory requirements in all material respects, there can be no guarantee that some tanks will not fail to meet such requirements in the future. We maintain a storage tank liability policy which, subject to limitations and exclusions, provides coverage for first-party remediation and third-party claims.
With regard to our solid waste transportation operations, we are subject to the jurisdiction of the Surface Transportation Board and are regulated by the Federal Highway Administration, Office of Motor Carriers, and by regulatory agencies in states that regulate such matters. Various state and local government authorities have adopted, or are considering adopting, laws and regulations that would restrict the transportation of solid waste across state, county, or other jurisdiction lines. In 1978, the U.S. Supreme Court ruled that a law that restricts the importation of out-of-state solid waste is unconstitutional; however, states have attempted to distinguish proposed laws from those involved in and implicated by that ruling. In 1994, the U.S. Supreme Court ruled that a flow control law, which attempted to restrict solid waste from leaving its place of generation, imposes an impermissible burden upon interstate commerce and is unconstitutional. However, in 2007, the U.S. Supreme Court upheld the right of a local government to direct the flow of solid waste to a publicly owned and publicly operated waste facility. A number of county and other local jurisdictions have enacted ordinances or other regulations restricting the free movement of solid waste across jurisdictional boundaries. Other governments may enact similar regulations in the future. These regulations may, in some cases, cause a decline in volumes of waste delivered to our landfills or transfer stations and may increase our costs of disposal.
Emissions from Natural Gas Fueling and Infrastructure. We operate a fleet of 396 CNG vehicles and we plan to continue to transition a portion of our collection fleet from diesel fuel to CNG, in locations where it is cost beneficial. We have constructed and operate natural gas fueling stations. Concerns have been raised about the potential for emissions from the fueling stations and infrastructure that serve natural gas-fueled vehicles. Additional regulation of, or restrictions on, CNG fueling infrastructure or reductions in associated tax incentives could increase our operating costs. We are not yet able to evaluate potential operating changes or costs associated with such regulations, but we do not anticipate that such regulations would have a material adverse impact on our business or our current plan to continue transitioning to CNG vehicles.
Liabilities Established for Landfill and Environmental Costs. We have established reserves for landfill and environmental costs, which include landfill site final capping, closure and post-closure costs and costs for contamination-related obligations. We periodically reassess such costs based on various methods and assumptions regarding landfill airspace and the technical requirements of Subtitle D of RCRA, and we adjust our rates used to expense final capping, closure and post-closure costs accordingly. Based on current information and regulatory requirements, we believe that our recorded reserves for such landfill and environmental expenditures are adequate. However, environmental laws and regulations may change, and we cannot assure you that our recorded reserves will be adequate to cover requirements under existing or new environmental laws and regulations, future changes or interpretations of existing laws and regulations or adverse environmental conditions previously unknown to us.
110
Liability Insurance and Bonding
The nature of our business exposes us to the risk of liabilities arising out of our operations, including possible damages to the environment. Such potential liabilities could involve, for example, claims for remediation costs, personal injury, property damage and damage to the environment, claims of employees, customers or third parties for personal injury or property damage occurring in the course of our operations or claims alleging negligence or other wrongdoing in the planning or performance of work. We also could be subject to fines and civil and criminal penalties in connection with alleged violations of regulatory requirements, which could be significant. Our solid waste operations have third-party environmental liability insurance with limits in excess of those required by permit regulations, subject to certain limitations and exclusions. However, we cannot assure you that our environmental liability insurance would be adequate, in scope or amount, in the event of a major loss, nor can we assure you that we would continue to carry excess environmental liability insurance should market conditions in the insurance industry make such coverage costs prohibitive.
We maintain general liability, vehicle liability, employment practices liability, fiduciary liability, pollution liability, directors and officers' liability, workers' compensation and employer's liability coverage, as well as umbrella liability policies to provide excess coverage over the underlying limits contained in these primary policies. We also carry property insurance. Although we strive to operate safely and prudently and we have, subject to limitations and exclusions, substantial liability insurance, we cannot assure you that we will not be exposed to uninsured liabilities that could have a material adverse effect on our consolidated financial condition, results of operations and cash flows.
Our insurance programs for workers' compensation, general liability, vehicle liability and employee-related health care benefits are effectively self-insured. Claims in excess of self-insurance levels are insured subject to the excess policy limits and exclusions. Accruals are based on claims filed and actuarial estimates of claims development and claims incurred but not reported. Due to the variable condition of the insurance market, we have experienced, and may experience in the future, increased self-insurance retention levels and increased premiums. As we assume more risk for self-insurance through higher retention levels, we may experience more variability in our self-insurance reserves and expense.
In the normal course of business, we post performance bonds, insurance policies, letters of credit or cash or marketable securities deposits in connection with municipal residential collection contracts, closure and post-closure of landfills, environmental remediation, environmental permits and business licenses and permits as a financial guarantee of our performance. To date, we have satisfied financial responsibility requirements by making cash or marketable securities deposits or by obtaining bank letters of credit, insurance policies or surety bonds. The amount of surety bonds issued by third parties at June 30, 2016 was $702.5 million and our outstanding letters of credit amounted to $46.0 million.
Properties
Our corporate headquarters is located at 90 Fort Wade Rd, Ponte Vedra, Florida 32081, where we currently lease approximately 63,000 square feet of office space under leases expiring through 2020. We also maintain regional administrative offices in North Carolina, Georgia and Illinois.
Our principal property and equipment consists of land, landfills, buildings, vehicles and equipment. We own or lease real property in the states in which we conduct operations. We own or operate 92 collection operations, 72 transfer stations, 21 recycling facilities and 39 landfills in 16 states and the Bahamas. In aggregate, our active solid waste landfills total
111
approximately 21,490 acres, including approximately 10,700 permitted and expansion acres. "Expansion acreage" consists of unpermitted acreage where the related expansion efforts meet our criteria to be included as expansion airspace. A discussion of the related criteria is included within the "Management's Discussion and Analysis of Financial Condition and Results of Operations—Critical Accounting Estimates and Assumptions" section included herein. We also own or have responsibilities for five closed landfills. We believe that our property and equipment are adequate for our current needs.
Employees
As of June 30, 2016, we had over 5,400 employees, approximately 14% of whom were covered by collective bargaining agreements. From time to time, our operating locations may experience union organizing efforts. We have not historically experienced any significant work stoppages. We currently have no disputes or bargaining circumstances that we believe could cause significant disruptions in our business. Our management believes we have good relations with our employees.
Legal Proceedings
In February 2009, we and certain of our subsidiaries were named as defendants in a purported class action suit in the Circuit Court of Macon County, Alabama. Similar class action complaints were brought against us and certain of our subsidiaries in 2011 in Duval County, Florida and in 2013 in Quitman County, Georgia and Barbour County, Alabama, and in 2014 in Chester County, Pennsylvania. The 2013 Georgia complaint was dismissed in March 2014. In late 2015 in Gwinnett County, Georgia, another purported class action suit was filed. The plaintiffs in those cases primarily allege that the defendants charged improper fees (fuel, administrative and environmental fees) that were in breach of the plaintiffs' service agreements with the Company and seek damages in an unspecified amount. We believe that we have meritorious defenses against these purported class actions, which we will vigorously pursue. Given the inherent uncertainties of litigation, including the early stage of these cases, the unknown size of any potential class, and legal and factual issues in dispute, the outcome of these cases cannot be predicted and a range of loss, if any, cannot currently be estimated.
In November 2014, the Attorney General of the State of Vermont filed a complaint against us relating to the Moretown, Vermont landfill regarding alleged odor and other environmental-related noncompliances with environmental laws and regulations and environmental permits. In the complaint, the Attorney General requested that the State of Vermont Superior Court find the Company liable for the alleged noncompliances, issue related civil penalties and order the Company to reimburse the State of Vermont for enforcement costs. While the complaint does not specify a monetary penalty, prior correspondence from the Attorney General of the State of Vermont indicates that it may seek a penalty relating to the alleged noncompliances that is not expected to be material. Given the inherent uncertainties of litigation, including the early stage of this case, the outcome cannot be predicted and a range of loss, if any, cannot currently be estimated.
We are subject to various other proceedings, lawsuits, disputes and claims and regulatory investigations arising in the ordinary course of our business. Many of these actions raise complex factual and legal issues and are subject to uncertainties. Actions filed against us include commercial, customer and employment-related claims. The plaintiffs in some actions seek unspecified damages or injunctive relief, or both. These actions are in various procedural stages and some are covered in part by insurance. Although we cannot predict the ultimate outcome and the range of loss cannot be currently estimated, we do not believe that the eventual outcome of any such action could have a material adverse effect on our business, financial condition, results of operations or cash flows.
112
The following table sets forth the name, age, position and a summary of business experience for each person who is currently an executive officer or director of Advanced Disposal. Prior to the completion of the offering, we expect to add Mr. Preslar as a director. The board of directors has determined that Messrs. Koen, Pedreiro and Preslar are independent directors within the meaning of the NYSE rules.
Name
|
Age (1) | Position | ||
|---|---|---|---|---|
Richard Burke |
52 | Chairperson of the Board, Chief Executive Officer and Director | ||
John Spegal |
63 | Chief Operating Officer | ||
Steven R. Carn |
52 | Chief Financial Officer, Treasurer, Director | ||
Matthew Gunnelson |
53 | Chief Accounting Officer, Assistant Treasurer | ||
Michael K. Slattery |
63 | Senior Vice President—General Counsel, Secretary | ||
William Westrate |
56 | Chief Administrative Officer | ||
Bret Budenbender |
44 | Director | ||
Christopher Beall |
41 | Director | ||
John Miller |
69 | Director | ||
Jared Parker |
34 | Director | ||
Matthew Rinklin |
34 | Director | ||
Sergio Pedreiro |
51 | Director | ||
Michael Koen |
42 | Director | ||
B. Clyde Preslar |
62 | Director nominee |
- (1)
- As of September 23, 2016.
Each Director serves until his successor is duly elected and qualified or until his earlier death, resignation or removal.
Richard Burke—Mr. Burke has served as the Chief Executive Officer and a Director of Advanced Disposal since July 1, 2014. Prior to being named Chief Executive Officer, effective July 1, 2014, Mr. Burke served as President of Advanced Disposal since November 2012. Prior to joining Advanced Disposal, Mr. Burke served as President and Chief Executive Officer of Veolia Environmental Services North America Corp., a water, waste and energy management company, from 2009 to 2012 and as President and Chief Executive Officer of Veolia ES Solid Waste, Inc., a water, waste and energy management company, from 2007 to 2009. Mr. Burke began his employment with Veolia, Inc. in 1999 as Area Manager for the Southeast Wisconsin area and served as Regional Vice President for the Eastern and Southern markets until he was appointed Chief Executive Officer. Prior to joining Veolia, Inc., he spent 12 years with Waste Management, Inc., a waste management company, in a variety of leadership positions. Mr. Burke holds a Bachelor's degree from Randolph Macon College. Mr. Burke's qualifications to sit on our board of directors include his substantial experience in the area of corporate strategy, operations and finance.
John Spegal—Mr. Spegal has served as the Chief Operating Officer of Advanced Disposal since 2014. Mr. Spegal joined Advanced Disposal in 2013 as the Vice President of Business Development. Prior to joining Advanced Disposal, Mr. Spegal spent more than six years with AIR-serv Group LLC, a tire inflation and vacuum specialist company, as Regional Vice President and was responsible for their East Coast operations. Prior to that, he was at Allied Waste Industries/Browning Ferris Industries, a waste management company, for more than 20 years serving in various management roles throughout the Mid-Atlantic, Southeast and Southern regions, including Puerto Rico. Mr. Spegal holds a Bachelor's degree from the University of South Carolina.
113
Steven R. Carn—Mr. Carn has served as the Chief Financial Officer, Treasurer and a Director of Advanced Disposal since 2012. Mr. Carn joined ADS Inc., a historical business of Advanced Disposal, in April 2001 and served as Chief Accounting Officer until August 2006, when he became the Chief Financial Officer of ADS Inc. Prior to joining ADS Inc., Mr. Carn served for three years as Chief Financial Officer for Town Star Food Stores, LLC, a chain of convenience stores, from 1998 to 2001. Prior to his service with Town Star, Mr. Carn served as Senior Consultant with CFO Services, Inc., a company engaged primarily in providing temporary chief financial officer services to emerging companies in the Jacksonville, Florida area. He began his career as an auditor with Ernst & Young in 1987. Mr. Carn graduated from The Ohio State University with a Bachelor's degree in Business Administration in 1987. Mr. Carn is a certified public accountant in Ohio. Mr. Carn's qualifications to sit on our board of directors include his substantial experience in the area of corporate strategy, accounting and finance.
Matthew Gunnelson—Mr. Gunnelson has served as the Chief Accounting Officer and Assistant Treasurer of Advanced Disposal since 2012. Prior to becoming our Chief Accounting Officer and Assistant Treasurer in 2012, Mr. Gunnelson served as Corporate Controller and Assistant Secretary of Veolia ES Solid Waste, Inc. from 2005 to 2012. Prior to joining Veolia ES Solid Waste, Inc., Mr. Gunnelson served as Division Controller for Tecumseh Products—Engine and Transmission Group, a manufacturer of refrigeration and cooling products, from 1999 through 2005. Prior to his service with Tecumseh Products—Engine and Transmission Group, Mr. Gunnelson held various finance positions with Giddings & Lewis, Inc., a machine tool manufacturer. He began his career as an auditor with Ernst & Young in 1986. Mr. Gunnelson is a certified public accountant and holds a Bachelor's of Business Administration degree in accounting and finance from the University of Wisconsin-Madison.
Michael K. Slattery—Mr. Slattery has served as the Senior Vice President, General Counsel and Secretary of Advanced Disposal since July 2014. He also serves as corporate secretary. Prior to joining Advanced Disposal, Mr. Slattery most recently served as Senior Vice President and General Counsel for Veolia Environmental Services North America Corp. from 2004 to 2012 with responsibility for the management of the law department and all legal affairs in North America. Prior to joining the Veolia group, Mr. Slattery served as Vice President & Deputy General Counsel for Fruit of the Loom, Inc., a clothing manufacturer, with responsibility for the management of legal affairs throughout North America, Canada, Europe, North Africa and Latin America. Prior to joining Fruit of the Loom, Mr. Slattery served as Vice President and General Counsel for Wheelabrator Technologies, Inc., a solid waste management firm, and as General Counsel for several major North and Latin American operating divisions for Waste Management, Inc. Mr. Slattery is a graduate of the John Marshall Law School in Chicago, where he was an assistant editor of the John Marshall Law Review and earned his Bachelor's degree in Economics from St. Joseph's College in Rensselaer, Indiana.
William Westrate—Mr. Westrate has served as the Chief Administrative Officer of Advanced Disposal since 2014. In this role, Mr. Westrate is responsible for Advanced Disposal's administrative functions, including human resources, procurement and information technology. Mr. Westrate had previously served as Vice President of Information Technology for Advanced Disposal since 2013. Prior to that post, he served as the Chief Information Officer at Veolia Environmental Services North America Corp. from 2010 to 2013 and was instrumental in leading a number of significant technology changes and service offerings. Mr. Westrate has over 17 years of executive IT leadership experience with companies including Aramark, a food and facilities management services company, ServiceMaster, a residential and commercial services company, Interdent, a dental services support company,
114
and Van Kampen Funds, a mutual fund, and holds a Bachelor's degree in Computer Science and Business Administration from Taylor University.
Christopher Beall—Mr. Beall has served as a Director of Advanced Disposal since 2012. Mr. Beall previously served as a director of ADS Inc. from 2006 to 2012. Mr. Beall joined Highstar Capital in 2004. He serves on Highstar Capital's Investment Committee and Executive Committee. Mr. Beall has over 15 years of experience in direct investments, investment banking and finance. He currently serves on the boards of directors for the Star Atlantic Companies ("Star Atlantic"), our indirect parent, the Ports America Companies, a maritime operator and Highstar Capital portfolio company, Northstar Transloading, a rail infrastructure company, Wespac Midstream LLC, an energy infrastructure company, NGL Energy Partners, a limited partnership company formed to own and operate a vertically-integrated propane business, and AMTRAK. Prior to joining Highstar Capital, he worked in the Global Natural Resources Group at Lehman Brothers, Inc. and in operations and engineering at Koch Pipeline Company, a natural gas transmission pipeline owned by Koch Industries, Inc. Mr. Beall received a Bachelor's of Science in Mechanical Engineering from Oklahoma State University and a Master of Business Administration from Harvard Business School. Mr. Beall's qualifications to sit on our board of directors include his substantial experience in the area of corporate strategy and finance, including capital markets and mergers and acquisitions.
John Miller—Mr. Miller has served as a Director of Advanced Disposal since 2012. Mr. Miller is currently a Senior Advisor to Highstar Capital and has advised Highstar Capital for over six years. Mr. Miller served as a director of ADStar Waste Holdings, Corp. He has over 40 years of experience in the energy, waste and waste-to-energy industries. From 2006 to 2011, Mr. Miller served on the board and the audit committee of Mirant Corporation, a listed energy company. Mr. Miller currently serves as a director of the Ports America Companies. Prior to joining Highstar Capital in 2007, Mr. Miller served from 2001 to 2005 as chief executive officer of former Highstar Capital portfolio company, American Ref-Fuel, a solid waste disposal company, until the company was sold to Covanta Energy. Prior to his position as chief executive officer, Mr. Miller served as American Ref-Fuel's chief financial officer. Before joining American Ref-Fuel, Mr. Miller held various executive finance positions with a number of energy companies involved in petroleum exploration and production, international trading and refined product retailing. Mr. Miller is a graduate of John Carroll University and is a certified public accountant. Mr. Miller's qualifications to sit on our board of directors include his substantial experience in the area of corporate strategy, operations and finance, including capital markets and mergers and acquisitions.
Bret Budenbender—Mr. Budenbender has served as a Director of Advanced Disposal since 2012. Mr. Budenbender is currently a Partner at Highstar Capital and has over 19 years of experience in direct investments, investment banking and finance. He currently serves on the boards of directors for Star Atlantic, our indirect parent, Linden Cogeneration, an energy generation company, and Wildcat Midstream, an energy infrastructure and Highstar Capital portfolio company. Prior to joining Highstar Capital in 2012, he was a Managing Director in the Global Power Groups at Barclays Capital and Lehman Brothers where he worked from 1998 to 2012 with lead responsibility for all aspects of mergers and acquisitions, capital raising and restructurings for integrated energy, power and infrastructure companies. In his previous roles, Mr. Budenbender was actively involved with Highstar Capital on its investments in Southern Star Central, an energy infrastructure company, and Northern Star Generation and Intergen, power generation companies. He received a Bachelor's of Science in Finance from Boston College. Mr. Budenbender's qualifications to sit on our board of directors include his substantial experience in the area of corporate strategy and finance, including capital markets and mergers and acquisitions.
115
Jared Parker—Mr. Parker has served as a Director of Advanced Disposal since 2012. Mr. Parker joined Highstar Capital in 2005 and has over nine years of experience in private equity, operational leadership, investment banking and finance. Most recently, Mr. Parker served as President of Ports America Stevedoring, the largest business unit inside the Ports America Companies from 2010 to 2012. Mr. Parker is on the board of directors for Advanced Disposal and WesPac Midstream LLC, an energy infrastructure company, and previously served as a Director on the boards of London City Airport, the Ports America Companies and as an observer on the boards of Northern Star Generation and InterGen. Prior to joining Highstar Capital, he worked as an advisor to the Highstar Capital team on several transactions as an investment banker at Deutsche Bank. While at Deutsche Bank, Mr. Parker advised domestic and international power generation companies and financial sponsors on mergers and acquisitions and financings. Mr. Parker holds a Bachelor's of Arts in International Relations from Stanford University. Mr. Parker's qualifications to sit on our board of directors include his substantial experience in the area of corporate strategy and finance, including, capital markets and mergers and acquisitions.
Matthew Rinklin—Mr. Rinklin has served as a Director of Advanced Disposal since 2012. Mr. Rinklin has also served as a Vice President at Highstar Capital since 2011. Prior to joining Highstar Capital in 2011, Mr. Rinklin was an Associate at the UBS International Infrastructure Fund from 2010 to 2011. While at UBS, Mr. Rinklin focused on leveraged buyout investments in the power, midstream/pipeline and transportation sectors. Before that, he was an investment banking analyst in the Natural Resources Group at J.P. Morgan. Mr. Rinklin received a Bachelor's of Arts in Economics from the University of Chicago. Mr. Rinklin's qualifications to sit on our board of directors include his substantial experience in the area of corporate finance, including capital markets and mergers and acquisitions.
Sergio Pedreiro—Mr. Pedreiro joined Advanced Disposal as a Director on January 29, 2016 as the designated director of BTG Pactual International Portfolio Fund II SPC, Segregated Portfolio BTGPH Corp Hedge ("BTG"), a stockholder and an affiliate of BTG Pactual. Since May 2015, Mr. Pedreiro has served as CEO of Estre Ambiental, a Brazilian waste management company, where he has also served as Director since 2011. He has also served as a Director of ALL—American Latina Logistica SA., a Brazilian logistics company mainly focused on the railway line logistics in Brazil, from 2005 to 2011. Since April 2014, Mr.Pedreiro has been an Associate Partner and a Portfolio Management Team member of BTG Pactual, an investment bank and asset and wealth manager based in Brazil. Prior to joining BTG Pactual, Mr. Pedreiro served as the Chief Financial Officer of Coty, Inc., an American beauty products manufacturer based in New York, from 2009 to 2014. Prior to joining Coty Inc., Mr. Pedreiro served as Chief Financial Officer of ALL—America Latina Logıstica S.A. from 2002 to 2008. Mr. Pedreiro received a Bachelor's Degree with honors in Aeronautical Engineering from ITA—Instituto Tecnológico de Aeronáutica, and has a Master of Business Administration degree from Stanford University Graduate School of Business.
Michael Koen—Mr. Koen joined Advanced Disposal as a Director on August 3, 2016 as the designated director of CPPIB. Mr. Koen is a Senior Principal in CPPIB's Relationship Investments group where he is responsible for leading significant minority equity investments in publicly listed companies as well as privately held companies in select situations. Mr. Koen has more than 17 years of experience in direct investing and banking, including working with portfolio company directors and management teams. Prior to joining CPPIB in 2009, Mr. Koen was a Vice President and Director in TD Bank's merchant banking group where he focused on mezzanine debt and structured equity investments. Prior to his seven years at TD Capital, Mr. Koen worked at Scotia Capital in the institutional equities and investment banking groups. Mr. Koen holds a Master of Business Administration with high honors from the University of
116
Chicago, Booth School of Business and a Bachelor of Arts from Queen's University, Canada. Mr. Koen's qualifications to sit on our board of directors include his substantial experience in the area of corporate finance and strategy, including capital markets, capital allocation and mergers and acquisitions.
B. Clyde Preslar—Mr. Preslar is expected to join Advanced Disposal as a Director prior to the completion of this offering. Mr. Preslar previously served as a Director of Alliance One International, Inc., an independent leaf tobacco merchant, from 2005 to 2013, Forward Air Corporation, a provider of time-definite surface transportation and related logistics services, from 2004 to 2008, and Standard Commercial Corporation, an enterprise engaged in the purchase, processing and sale of leaf tobacco, from 1999 to 2005. Since August 2015, Mr. Preslar has served as Executive Vice President and Chief Financial Officer for Dollar Express Stores LLC, a privately owned dollar store chain formerly part of Dollar Tree, Inc. Prior to joining Dollar Express Stores LLC, Mr. Preslar served as Senior Vice President and Chief Financial Officer for The Pantry, Inc., a convenience store chain, from 2013 to 2015. Mr. Preslar previously served as Senior Vice President and Chief Financial Officer for the short line and regional freight railroad operator, RailAmerica, Inc., from 2008 to 2013. Prior to RailAmerica, Inc., Mr. Preslar held the positions of Executive Vice President and Chief Financial Officer at Cott Corporation, a manufacturer of non-alcoholic beverage products, from 2005 to 2006, and as Vice President and Chief Financial Officer and Secretary at snack food manufacturer Lance, Inc., from 1996 to 2005. Earlier in his career, Mr. Preslar served as Director of Financial Services for Worldwide Power Tools at Black & Decker and as Director of Investor Relations at RJR Nabisco. Mr. Preslar holds a Bachelor's Degree in Business Administration and Economics from Elon College and a Master's degree in Business Administration from Wake Forest University. He is a Certified Public Accountant licensed by the North Carolina State Board of Certified Public Accountant Examiners, and has been a Certified Management Accountant since 1980.
Our executive officers are appointed by, and serve at the discretion of, our board of directors. There are no family relationships among our directors and executive officers.
Background and Experience of Nominated Director
When considering whether our director nominee has the experience, qualifications, attributes and skills, taken as a whole, to assist our board of directors in satisfying its oversight responsibilities effectively in light of our business and structure, our board of directors focused primarily on the information discussed in Mr. Preslar's biographical information set forth above. Additionally, our board of directors considered Mr. Preslar's accounting expertise as a certified public accountant and his experience across a number of diverse industries. Mr. Preslar possesses high ethical standards, acts with integrity and exercises careful, mature judgment. Mr. Preslar is committed to employing his skills and abilities to aid the long-term interests of our stakeholders. Moreover, Mr. Preslar is knowledgeable and experienced in many business endeavors, which further qualifies him for service as a member of our board of directors. Specifically, Mr. Preslar is experienced in business management and is familiar with corporate finance and strategic business planning activities. Having served as chief financial officer and director on multiple occasions, as discussed above, Mr. Preslar has displayed leadership that is emblematic of the experience, qualifications and skills that we look for in our directors.
Controlled Company
Upon completion of this offering, Highstar Capital and its affiliates may continue to control a majority of the voting power of our outstanding common stock. As a result, we may
117
be a "controlled company" under NYSE corporate governance standards. As a "controlled company," exemptions under the NYSE standards would exempt us from certain NYSE corporate governance requirements, including the requirements:
- •
- that a majority of our board of directors consists of "independent directors," as defined under the rules of the NYSE;
- •
- that our board of directors have a compensation committee that is comprised entirely of independent directors with a written charter
addressing the committee's purpose and responsibilities; and
- •
- that our board of directors have a nominating and corporate governance committee that is comprised entirely of independent directors with a written charter addressing the committee's purpose and responsibilities.
Accordingly, you may not have the same protections afforded to stockholders of companies that are subject to all of the corporate governance requirements. In the event that, following the completion of the offering, we are not or we otherwise cease to be a "controlled company," we will be required to comply with these provisions within the transition periods specified in the rules of the NYSE.
These exemptions do not modify the independence requirements for our audit committee, and we expect to satisfy the member independence requirement for the audit committee prior to the end of the transition period provided under NYSE listing standards and SEC rules and regulations for companies completing their initial public offering. See "—Committees of the Board—Audit Committee."
Board of Directors
Our business and affairs are managed under the direction of our board of directors. Our board of directors currently consists of Messrs. Burke, Carn, Beall, Miller, Budenbender, Parker, Rinklin, Pedreiro and Koen. Prior to the completion of the offering, we expect to add Mr. Preslar as a director and Mr. Carn will resign from the Board. Following the completion of this offering, we expect our board of directors to consist initially of nine directors.
In accordance with our certificate of incorporation and the stockholder agreement, each of which will be in effect upon the closing of this offering, our board of directors will be divided into three classes with staggered three year terms. At each annual meeting of stockholders after the initial classification, the successors to the directors whose terms will then expire will be elected to serve from the time of election and qualification until the third annual meeting following their election. Our directors will be divided among the three classes as follows:
- •
- the Class I directors will be Mr. Beall, Mr. Parker and Mr. Rinklin and their terms will expire at the
first annual meeting of stockholders to be held following this offering;
- •
- the Class II directors will be Mr. Budenbender, Mr. Miller and Mr. Pedreiro, and their terms will expire
at the second annual meeting of stockholders to be held following this offering; and
- •
- the Class III directors will be Mr. Burke, Mr. Koen and Mr. Preslar, and their terms will expire at the third annual meeting of stockholders to be held following this offering.
Any increase or decrease in the number of directors will be distributed among the three classes so that, as nearly as possible, each class will consist of one-third of the directors. This classification of our board of directors may have the effect of delaying or preventing changes in control of our company.
118
Composition of the Board of Directors after this Offering
Upon completion of this offering, our charter and bylaws will provide that our board of directors will consist of such number of directors as may from time to time be fixed by our board of directors. So long as Highstar Capital and its affiliates together continue to beneficially own at least 50% of the total shares of our common stock entitled to vote generally in the election of our directors as of the record date of such meeting, we will agree to nominate individuals designated by Highstar Capital, representing a majority of seats on the board, for election as directors as specified in our stockholders' agreement. If Highstar Capital and its affiliates own less than a majority of the total shares of our common stock entitled to vote generally in the election of our directors as of the record date of such meeting, the number of directors Highstar Capital may nominate as a percentage of the board will be proportionate to its ownership percentage of total shares of our common stock that it holds until Highstar Capital owns less than 5% of the total shares of common stock. For a description of Highstar Capital's right to require us to nominate its designees to our board of directors, see "Certain Relationships and Related Person Transactions—Stockholders' Agreement."
Director Independence
If, following the completion of the offering, we are a "controlled company" under the rules of the NYSE, we will not be required to have a majority of our board of directors consist of "independent directors," as defined under the rules of the NYSE. If following the completion of the offering, we are not a "controlled company" or such rules change in the future, we will adjust the composition of the board of directors and its committees accordingly within the applicable transition period, in order to comply with such rules. Immediately following the offering, our board of directors will have three independent directors.
Committees of the Board of Directors
Our board of directors has an audit committee, a nominating and governance committee and a compensation committee. Our board of directors may also establish from time to time any other committees that it deems necessary and advisable. The committee assignments described below reflect an assumption that we will be a "controlled company" upon the completion of this offering, but will change if we are not a "controlled company."
Audit Committee
Upon completion of this offering, we expect our audit committee will consist of Messrs. Koen, Miller, and Preslar, with Mr. Preslar as Chair. Pursuant to applicable SEC and NYSE rules, we will be required to have one independent audit committee member upon the listing of our common stock on the NYSE, a majority of independent audit committee members within 90 days of listing and an audit committee consisting entirely of independent members within one year of listing. Our board of directors has determined that Messrs. Koen and Preslar each meets the requirements for independence of audit committee members under current NYSE listing standards and SEC rules and regulations. Each member of our audit committee meets the financial literacy requirements of the NYSE listing standards and our board of directors has determined that Mr. Preslar is an audit committee financial expert within the meaning of the SEC rules and regulations. The audit committee is responsible for assisting our board of directors with its oversight responsibilities regarding: (i) the integrity of our financial statements; (ii) our compliance with legal and regulatory requirements; (iii) our independent registered public accounting firm's qualifications and independence; and (iv) the performance of our internal audit function and independent registered public accounting firm.
119
Compensation Committee
Upon completion of this offering, we expect our compensation committee will consist of Messrs. Budenbender, Parker, and Pedreiro, with Mr. Budenbender as Chair. The purpose of our compensation committee is to discharge the responsibilities of our board of directors relating to compensation of our executive officers. Following the completion of this offering, our compensation committee will, among other things: (i) review, approve and determine, or make recommendations to our board of directors regarding, the compensation of our executive officers; (ii) administer our stock and equity incentive plans; (iii) review and approve, and make recommendations to our board of directors regarding, incentive compensation and equity plans; (iv) establish and review general policies relating to compensation and benefits of our employees; and (v) review and make recommendations to the full board of directors with respect to compensation of directors. Our compensation committee will operate under a written charter, to be effective prior to the completion of this offering.
Nominating and Governance Committee
Upon completion of this offering, we expect our nominating and governance committee will consist of Messrs. Burke, Miller and Rinklin, with Mr. Burke as Chair. Following the completion of this offering, our nominating and governance committee will, among other things: (i) identify, evaluate and select, or make recommendations to our board of directors regarding, nominees for election to our board of directors and its committees; (ii) evaluate the performance of our board of directors and of individual directors; (iii) consider and make recommendations to our board of directors regarding the composition of our board of directors and its committees; (iv) review developments in corporate governance practices; and (v) develop and make recommendations to our board of directors regarding corporate governance guidelines and matters. The nominating and governance committee will operate under a written charter, to be effective prior to the completion of this offering.
Compensation Committee Interlocks and Insider Participation
We expect that, at the time of the offering, none of our executive officers will currently serve, or in the past year have served, as a member of the board of directors or compensation committee of any entity other than Advanced Disposal that has one or more executive officers serving on our board of directors or compensation committee.
Role of Our Board of Directors in Risk Oversight
One of the key functions of our board of directors is informed oversight of our risk management process. Our board of directors administers this oversight function directly, with support from the three standing committees to be established upon the completion of this offering, our audit committee, our compensation committee and our nominating and corporate governance committee, each of which will address risks specific to its respective areas of oversight. In particular, our audit committee will have the responsibility to consider and discuss our major financial risk exposures and the steps our management takes to monitor and control these exposures, including guidelines and policies to govern the process by which risk assessment and management is undertaken. Our audit committee will also monitor compliance with legal and regulatory requirements, in addition to oversight of the performance of our internal audit function. Our compensation committee will assess and monitor whether any of our compensation policies and programs has the potential to encourage excessive risk-taking. Our nominating and corporate governance committee will provide oversight with respect to corporate governance and ethical conduct and will monitor
120
the effectiveness of our corporate governance guidelines, including whether such guidelines are successful in preventing illegal or improper liability-creating conduct. All committees report to the full board as appropriate, including when a matter rises to the level of a material or enterprise-level risk. In addition, the board of directors receives detailed regular reports from members of our senior management and other personnel that include assessments and potential mitigation of the risks and exposures involved with their respective areas of responsibility.
Code of Business Conduct
We have adopted a Code of Business Conduct that applies to our CEO, CFO and Chief Accounting Officer, as well as other of our officers, directors and employees. The Code of Business Conduct is posted on our website at www.advanceddisposal.com under the heading "Corporate Governance" within the "Investor Relations" tab. The information on our website is not a part of this prospectus.
Corporate Governance Guidelines
Our board of directors has adopted corporate governance guidelines that serve as a flexible framework within which our board of directors and its committees operate. These guidelines cover a number of areas including the size and composition of the board, board membership criteria and director qualifications, director responsibilities, board agenda, role of the chief executive officer, meetings of independent directors, committee responsibilities and assignments, board member access to management and independent advisors, director communications with third parties, director compensation, director orientation and continuing education, evaluation of senior management and management succession planning. Our nominating and corporate governance committee will review our corporate governance guidelines at least once a year and, if necessary, recommend changes to our board of directors. A copy of our corporate governance guidelines will be posted on our website at www.advanceddisposal.com. The information on our website is not part of this prospectus.
121
Compensation Discussion and Analysis
In accordance with applicable regulations, this Compensation Discussion and Analysis, and the related disclosures that follow, reflect compensation matters related to fiscal year 2015, our most recently completed fiscal year, which ended on December 31, 2015. Where relevant, the discussion below also reflects certain contemplated changes to our compensation structure that would be implemented in connection with, and contingent upon, the completion of this offering.
As described in more detail below, the material elements of our executive compensation program for our named executive officers (the "NEOs") include base salary, cash bonus opportunities, a long-term equity incentive opportunity, a deferred compensation opportunity and other retirement benefits and welfare benefits. The NEOs may also receive severance payments and other benefits in connection with certain terminations of employment or a change in control of Advanced Disposal or the Parent. We believe that each element of our executive compensation program helps us to achieve one or more of our compensation objectives, as illustrated by the table below. These individual compensation elements are intended to create a total compensation package for each NEO that we believe achieves our compensation objectives and provides competitive compensation opportunities.
Compensation Element
|
Compensation Objectives Designed to be Achieved | |
|---|---|---|
Base Salary |
Attract, motivate and retain high caliber talent | |
Cash Bonus Opportunity |
Compensation "at risk" and tied to achievement of business goals and individual performance |
|
Long-Term Equity Incentive Opportunity |
Align compensation with the creation of stockholder value and achievement of business goals |
|
Deferred Compensation Opportunity and Other Retirement Benefits |
Attract, motivate and retain high caliber talent |
|
Severance and Other Benefits Potentially Payable Upon Termination of Employment or a Change in Control |
Attract, motivate and retain high caliber talent |
|
Welfare Benefits |
Attract, motivate and retain high caliber talent |
The compensation committee annually reviews the compensation arrangements for our executive officers to assess whether the arrangements encourage risk taking that is reasonably likely to have a material adverse effect on the Company. The compensation committee conducted an annual review in February 2015 (and again in February 2016) and concluded that the compensation arrangements for our executive officers do not encourage risk taking that is reasonably likely to have a material adverse effect on us.
During fiscal 2015 we did not retain an independent compensation consultant to conduct a formal numeric benchmarking process for the NEOs' compensation opportunities. Starting in June 2015, however, we retained Pearl Meyer as an independent compensation consultant to advise in connection with compensation matters related to the offering and prospectively. With respect to 2015 compensation, our Chief Executive Officer ("CEO") reviewed the compensation of comparable public companies within the waste industry and benchmarked current compensation based upon size, scale and location of those companies and
122
recommended compensation adjustments for other NEOs to the compensation committee. The compensation committee performed similar procedures with respect to the compensation of our CEO for fiscal 2015.
Elements of the Company's Executive Compensation Program
Base Salaries
Base salaries are an important element of compensation because they provide the NEOs with a predictable base level of income. Our NEOs are entitled to an automatic adjustment to their base salaries on a 12-month cycle commencing on January 1, 2016 for not less than 100% of the CPI for all urban consumers, U.S. city average, as published by the U.S. Department of Labor for the immediately preceding year. The Summary Compensation Table below shows the base salary paid to each NEO.
Cash Bonus Opportunities
Annual Cash Bonus Opportunity
We sponsored a management incentive plan (the "MIP") in fiscal 2015 as set forth in formal individualized plan term sheets. All of our NEOs were eligible to participate in the MIP in fiscal 2015. In general, the primary purpose of the MIP is to focus management on key measures that drive financial performance and provide competitive bonus opportunities tied to the achievement of our financial and strategic growth objectives.
Fiscal 2015 MIP
A target annual bonus, expressed as a percentage of base salary (between 0% and 100%), is established within each NEO's employment agreement. This percentage may be adjusted from time to time by the compensation committee in connection with a NEO's promotion. The MIP award, which is a cash bonus, is tied to our (i) overall financial results (the "Business Performance Factor") and (ii) a combination of individual, financial and/or strategic goals appropriate for each position (the "Individual Performance Factor"). The Business Performance Factor determines 75% of the total MIP award and the Individual Performance Factor determines the remaining 25%.
With respect to the NEOs, financial performance is measured at the Company-wide level. Financial performance relative to specified financial performance targets set annually by the board of directors determines the aggregate funding level of the bonus pool and the Business Performance Factor for the MIP. If the financial performance target set by the board of directors is met, the aggregate bonus pool amount will be set at 100% of the target amount in the annual operating budget and the specified financial performance target payout percentages will be set at 100%, subject to the compensation committee's discretion for all NEOs. The compensation committee has the discretion to adjust the MIP aggregate bonus pool amount and the Business Performance Factor upwards or downwards to address special situations. Special situations may include, but are not limited to, items such as the divestiture of businesses, restructuring programs or unusual items in connection with a significant acquisition.
We believe that tying the NEOs' bonuses to Company-wide performance goals encourages collaboration across the executive leadership team. We attempt to establish the financial performance target(s) at challenging levels that are reasonably attainable if we meet our performance objectives. The Business Performance Factor is determined based on achievement of adjusted EBITDA (representing 50% of each NEO's bonus calculation), as well
123
as free cash flow (representing 25% of each NEO's bonus calculation). We believe that these factors provide reliable indicators of our strategic growth and the strength of our cash flow and overall financial results. For each of our NEOs, achievement of less than 90% of the EBITDA measure or the cash flow measure results in no amounts being paid in connection with that respective component of the Business Performance Factor. With respect to Messrs. Burke, Carn and Spegal, if achievement of the EBITDA measure or the cash flow measure is greater than or equal to 90% and less than or equal to 110%, the respective component of the Business Performance Factor will be pro-rated ratably, provided that the total MIP award cannot exceed a stated maximum. With respect to Messrs. Slattery and Westrate, if achievement of the EBITDA measure or the cash flow measure is greater than or equal to 90% and less than 92.5%, 40% of the respective component of the Business Performance Factor will be paid; if achievement of the EBITDA measure or the cash flow measure is greater than or equal to 92.5% and less than 95%, 60% of the respective component of the Business Performance Factor will be paid; finally, if achievement of the EBITDA measure or the cash flow measure is greater than or equal to 95% and less than or equal to 110%, the respective component of the Business Performance Factor will be pro-rated ratably, provided that the total MIP award cannot exceed a stated maximum.
After setting the Business Performance Factor, the compensation committee determines the actual bonuses paid to the NEOs based on an assessment of each NEO's Individual Performance Factor. The Individual Performance Factor payout percentage (which impacts 25% of a NEO's MIP award) can range from 0% to 110% for Messrs. Burke, Carn and Spegal and from 0% to 70% for Messrs. Slattery and Westrate, provided that the total MIP award cannot exceed a stated maximum. The compensation committee performs the assessment of Mr. Burke's Individual Performance Factor after reviewing the written assessments of his performance against the specific goals and objectives that Mr. Burke provided to the board of directors. The CEO performs the assessment of the other NEOs' Individual Performance Factors and makes a recommendation to the compensation committee based upon his assessment of their achievement of the goals and objectives as set forth by him.
The Individual Performance Factors for Messrs. Burke, Carn, Spegal, Slattery and Westrate are based upon their respective contributions towards achievement of the following: (1) completion of the integration of acquired and merged companies; (2) achieving estimated synergy targets; (3) institutionalizing culture; (4) positioning us for maximum value creation; (5) completing acquisitions and development projects; and (6) formalizing policies and procedures related to internal controls and governance.
Sign-On Bonuses
From time to time, our compensation committee may award sign-on bonuses, in the form of either cash or the right to purchase stock of the Company at fair market value, in connection with the commencement of a NEO's employment with us. Sign-on bonuses are used only when necessary to attract highly skilled officers to our Company. Generally, they are used to incentivize candidates to leave their current employers, or may be used to offset the loss of unvested compensation they may forfeit as a result of leaving their current employers. No such amounts were offered for the six months ended June 30, 2016 or the year ended December 31, 2015.
Discretionary Bonuses
From time to time, our compensation committee may award discretionary bonuses in addition to any annual bonus payable under the MIP in recognition of extraordinary
124
performance. For fiscal 2015, our compensation committee did not award any discretionary bonuses.
Long-Term Equity Incentive Awards
We believe that the NEOs' long-term compensation should be directly linked to the value we deliver to our stockholders. Equity awards for 2015 were granted under the Advanced Disposal Waste Holdings Corp. 2012 Stock Incentive Plan (the "2012 Plan") to the NEOs. The 2012 Plan is designed to provide long-term incentive opportunities over a period of several years. Stock options are currently our preferred equity award under the 2012 Plan because the options will not have any value unless the underlying shares of common stock appreciate in value following the grant date. Accordingly, awarding stock options causes more compensation to be "at risk" and further aligns our executive compensation with the long-term profitability of our Company and the creation of shareholder value. The 2012 Plan also permits Parent to grant stock purchase rights.
Prior to the Veolia Acquisition, we maintained the 2006 Equity Incentive Plan (the "2006 Plan"), under which the compensation committee granted incentive awards in the form of options to purchase shares of common stock to directors, officers and employees of us and our affiliates. Subsequent to the Veolia Acquisition, we adopted the 2012 Plan under which we may grant incentive awards in the form of stock purchase rights and common stock options based on stock of the Parent, to certain officers and employees of us and our affiliates. Following the combination of the historical businesses of HWStar Holdings, Corp. and ADStar Waste Holdings, Corp. in November 2012, all prior outstanding awards under the 2006 Plan were canceled and reissued under the 2012 Plan, with the number of shares and, where applicable, exercise price of such reissued awards determined using standard anti-dilution adjustments. The options vest 20% at date of grant and 20% annually thereafter on the anniversary of the date of grant.
For our executives, including our NEOs, upon a change in control, as defined in the 2012 Plan, all outstanding time-based options will, subject to certain limitations, become fully exercisable and vested, and any restrictions and deferral limitations applicable to any stock purchase rights will lapse. We believe that providing for acceleration upon a liquidity event such as a change of control helps to align the interests of the executives with those of the stockholders.
In March 2015, the compensation committee granted an aggregate of 1,653 options to our NEOs. Further details pertaining to these grants can be found within the Grants of Plan-Based Awards in Fiscal 2015 table below.
The amounts of each NEO's investment opportunity and stock option, as applicable, were determined based on several factors, including: (1) each NEO's position and expected contribution to our future growth; (2) dilution effects on our stockholders and the need to maintain the availability of an appropriate number of shares for option awards to less-senior employees; and (3) ensuring that the NEOs were provided with appropriate and competitive total long-term equity compensation and total compensation amounts. The number of options granted to NEOs during fiscal 2015 and the grant date fair value of these options as determined under FASB ASC Topic 718 are presented in the Grants of Plan-Based Awards in Fiscal 2015 table below.
Stock Redemption Program
The Parent implemented a stock redemption program based upon certain conditions as set forth in individual agreements entered into with certain individuals who have been NEOs
125
of the Company. The redemption program is subject to time limitations and floor prices for redemptions, as described within the relevant employment agreements, redemption agreements and applicable share price protection agreements. Mr. Carn is the only current NEO of the Company who participates in the redemption program, which is further described below under "—Summary of NEO Employment Agreements."
Deferred Compensation Opportunity
Our NEOs are eligible to participate in the ADS Waste Holdings, Inc. 401(k) Retirement Plan (the "401(k) plan"). We do not provide deferred compensation opportunities for our NEOs. We currently match 50% of the first 6% of eligible pay that employees contribute to the 401(k) plan.
Perquisites and Other Benefits
At our discretion, we may also provide certain executives with enhancements to our existing benefits that are not available to other employees, such as usage of a Company car (or a car allowance) and usage of the Company plane. Furthermore, we pay for life insurance benefits in an amount equal to the NEOs' base salary plus bonus potential. The NEO may designate a beneficiary of their choosing under the life insurance.
Severance and Other Benefits Payable Upon Termination of Employment or Change in Control
We believe that severance protections can play a valuable role in attracting and retaining high caliber talent. In the competitive market for executive talent, we believe severance payments and other termination benefits are an effective way to offer executives financial security to offset the risk of foregoing an opportunity with another company. Consistent with our objective of using severance payments and benefits to attract and retain executives, we generally provide each NEO with amounts and types of severance payments and benefits that we believe will permit us to attract and/or continue to employ the individual NEO.
The severance benefits provided under the NEO employment agreements are generally more favorable than the benefits payable under our general severance policy. For example, the NEO employment agreements provide for a severance benefit payable upon a termination by us without cause or by the NEO for "good reason". Details on NEO severance arrangements can be found below under "—Summary of NEO Employment Agreements."
Employment Agreements
We entered into an employment agreement with Mr. Burke, our current CEO, on November 20, 2012 for retention purposes. On July 18, 2014, we amended the employment agreement with Mr. Burke to reflect his new responsibilities as our current CEO. On June 24, 2016, we entered into an amendment to Mr. Burke's employment agreement to adjust the performance criteria applicable to performance-based stock options that Mr. Burke is eligible to earn with respect to 2016. On November 20, 2012, we entered into an employment agreement with Mr. Carn in recognition of his contributions to the continued growth and excellent performance of the Company under which he serves as our Chief Financial Officer. Mr. Carn's employment agreement contains certain price protections in connection with share repurchases. On May 1, 2014, we entered into an employment agreement with Mr. Spegal for retention purposes under which he serves as our Chief Operating Officer. We entered an employment agreement with Mr. Slattery on May 29, 2015 under which he serves as our Senior Vice President and General Counsel, and with Mr. Westrate on May 1, 2014 under
126
which he serves as our Chief Administrative Officer. Each of these employment agreements provides for an initial three-year term commencing on the respective agreement's effective date, and for automatic one-year renewals thereafter unless either party provides 60 days' written notice of intent to terminate. The material terms of the employment agreements are described in "—Summary of NEO Employment Agreements" found at pages 124 to 128.
Section 162(m) of the Code
Section 162(m) of the Internal Revenue Code ("Section 162(m)") generally disallows a tax deduction for compensation over $1,000,000 paid for any year to a corporation's principal executive officer or an individual acting in such a capacity and the three most highly compensated executive officers (not including the principal executive officer or the principal financial officer). Section 162(m) applies to corporations with any class of common equity securities required to be registered under Section 12 of the Securities Exchange Act of 1934, as amended (the "Exchange Act"). Because we do not currently have any publicly held common stock, Section 162(m)'s restrictions do not currently apply to us.
The following table provides summary information concerning the compensation of our CEO, our Chief Financial Officer ("CFO") and each of our other NEOs for the 2013-2015 fiscal years.
Summary Compensation Table
| |
Year | Salary | Option Awards (1) |
Non-Equity Incentive Plan Compensation (2) |
All Other Compensation (3) |
Total | |||||||||||||
|---|---|---|---|---|---|---|---|---|---|---|---|---|---|---|---|---|---|---|---|
Richard Burke |
2015 | $ | 557,000 | $ | — | $ | 548,924 | $ | 42,306 | $ | 1,148,230 | ||||||||
Chief Executive Officer |
2014 | $ | 520,698 | $ | — | $ | 530,880 | $ | 490,344 | $ | 1,541,922 | ||||||||
|
2013 | $ | 465,000 | $ | 3,425 | $ | — | $ | 318,131 | $ | 786,556 | ||||||||
Steven R. Carn |
2015 |
$ |
392,923 |
$ |
— |
$ |
391,155 |
$ |
30,834 |
$ |
814,912 |
||||||||
Chief Financial Officer |
2014 | $ | 381,750 | $ | — | $ | 370,756 | $ | 20,204 | $ | 772,710 | ||||||||
|
2013 | $ | 375,000 | $ | 5,635 | $ | 361,726 | $ | 34,774 | $ | 777,135 | ||||||||
John Spegal |
2015 |
$ |
378,133 |
$ |
55,405 |
$ |
365,088 |
$ |
21,508 |
$ |
820,134 |
||||||||
Chief Operating Officer |
2014 | $ | 297,038 | $ | 175,423 | $ | 349,632 | $ | 190,694 | $ | 1,012,787 | ||||||||
Michael K. Slattery |
2015 |
$ |
306,000 |
$ |
288,320 |
$ |
182,774 |
$ |
98,784 |
$ |
875,878 |
||||||||
Senior Vice President, General Counsel |
|||||||||||||||||||
William Westrate |
2015 |
$ |
280,000 |
$ |
183,729 |
$ |
165,089 |
$ |
20,886 |
$ |
649,704 |
||||||||
Chief Administrative Officer |
|||||||||||||||||||
- (1)
- Represents
options granted under the 2012 Plan by the Parent to each NEO. Amounts reported reflect the aggregate grant date fair value computed in
accordance with FASB ASC Topic 718. Amounts reported reflect the aggregate grant date fair value computed in accordance with FASB ASC Topic 718. For a discussion of the assumptions and
methodologies used to calculate the amounts reported in fiscal 2015, see the discussion of nonqualified option awards contained in Notes 1 and 15 to our audited consolidated financial
statements for the period ended December 31, 2015, included in this prospectus.
- (2)
- Figures
represent awards paid under our Management Incentive Plan (MIP) in respect of the year earned. See "Compensation Discussion and
Analysis—Elements of the Company's Executive Compensation Program—Cash Bonus Opportunities—Fiscal 2015 MIP" above for a description of our MIP.
- (3)
- The supplemental table below sets forth the details of amounts reported as "All Other Compensation" for fiscal 2015. For 2015, the All Other Compensation column includes amounts related to executive perquisites provided
127
by us, which may include relocation, Company car, plane usage and life insurance premiums as detailed in the chart below.
| |
Year | Auto (1) | Plane (2) | 401(k) Matching Contributions |
Other (4) | Total All Other Compensation |
|||||||||||||
|---|---|---|---|---|---|---|---|---|---|---|---|---|---|---|---|---|---|---|---|
Richard Burke |
2015 | $ | 15,181 | $ | 17,485 | $ | 8,554 | $ | 1,086 | $ | 42,306 | ||||||||
Chief Executive Officer |
|||||||||||||||||||
Steven R. Carn |
2015 |
$ |
10,800 |
$ |
9,948 |
$ |
9,000 |
$ |
1,086 |
$ |
30,834 |
||||||||
Chief Financial Officer |
|||||||||||||||||||
John Spegal |
2015 |
$ |
12,000 |
$ |
— |
$ |
8,422 |
$ |
1,086 |
$ |
21,508 |
||||||||
Chief Operating Officer |
|||||||||||||||||||
Michael K. Slattery |
2015 |
$ |
10,800 |
$ |
— |
$ |
6,059 |
$ |
81,925 |
(3) |
$ |
98,784 |
|||||||
Senior Vice President, General Counsel |
|||||||||||||||||||
William Westrate |
2015 |
$ |
10,800 |
$ |
— |
$ |
9,000 |
$ |
1,086 |
$ |
20,886 |
||||||||
Chief Administrative Officer |
|||||||||||||||||||
- (1)
- Each
NEO is entitled to the usage of an automobile of their choosing through either an auto allowance or Company car.
- (2)
- Personal
use of corporate aircraft is valued based on the aggregate incremental cost to the Company on a fiscal-year basis. The incremental cost to the
Company of personal use of corporate aircraft is calculated based on the variable operating cost to the Company, which includes the cost of fuel, aircraft maintenance, crew travel, on-board catering,
landing fees, ramp fees and other smaller variable costs. Because our corporate aircraft is used primarily for business travel, fixed costs that do not change based on usage, such as pilots' salaries
and purchase and lease costs, are excluded from this calculation.
- (3)
- Includes
relocation expenses paid by the Company in connection with Mr. Slattery's relocation to Florida from Chicago, Illinois.
- (4)
- Other amounts, excluding those detailed above for the respective individuals, generally include payments on life and long-term disability insurance.
Effective July 1, 2014, Mr. Burke was named CEO of the Company. In connection with his appointment as CEO, Mr. Burke's share purchase loan (as described below under "Certain Relationships and Related Party Transactions") and accrued interest thereon with Parent was forgiven ($253,585). Gross up taxes on the loan forgiveness, personal usage of the plane and automobile were also paid by the Company ($207,296). Effective May 1, 2014, Mr. Spegal was named Chief Operating Officer and subsequently relocated to Jacksonville, FL. We agreed to reimburse Mr. Spegal for the difference between the negotiated selling price less federal tax basis in his home, pay all closing costs on both the sale of his residence in Charlotte, NC and the purchase of his home in Jacksonville, FL, pay for all relocation costs incurred in connection with his move to Jacksonville, FL and the cost of temporary housing in Jacksonville, FL ($120,137) and include applicable federal tax gross up payments ($54,863). These amounts are reflected in the "All Other Compensation" column for 2014 for Messrs. Burke and Spegal.
128
Grants of Plan-Based Awards in Fiscal 2015
The following table provides supplemental information relating to grants of plan-based awards made during fiscal 2015 to help explain information provided above in our Summary Compensation Table. This table presents information regarding all grants of plan-based awards occurring during fiscal 2015. We have included estimates of the corresponding numbers of post-offering shares subject to these options, as well as their post-offering exercise prices, based on a pre-to-post offering conversion factor of 1 to 49.4089. The conversion is based on an assumed price of $19.50 per share, which is the mid-point of the range set forth on the cover of this prospectus.
| |
|
|
|
|
|
Estimated Future Payouts Under Equity Incentive Plan Awards | |||||||||||||||||||||||
|---|---|---|---|---|---|---|---|---|---|---|---|---|---|---|---|---|---|---|---|---|---|---|---|---|---|---|---|---|---|
| |
|
|
Estimated Future Payouts Under Non-Equity Incentive Plan Awards | All Other Option Awards: Number of Securities Underlying Options (#) (1) |
Post-Offering Number of Securities Underlying Options |
|
Post-Offering Exercise or Base Price of Option Awards |
Grant Date Fair Value of Stock and Option Awards (2) |
|||||||||||||||||||||
| |
|
|
Exercise or Base Price of Option Awards ($/Sh) |
||||||||||||||||||||||||||
| |
Type of Award |
Grant Date |
|||||||||||||||||||||||||||
Name
|
Threshold | Target | Maximum | ||||||||||||||||||||||||||
Richard Burke |
Cash Bonus | — | $ | 191,350 | $ | 537,500 | $ | 591,250 | — | — | — | — | — | ||||||||||||||||
Steven R. Carn |
Cash Bonus |
— |
$ |
241,655 |
$ |
391,154 |
$ |
430,270 |
— |
— |
— |
— |
— |
||||||||||||||||
John Spegal |
Cash Bonus |
— |
$ |
230,233 |
$ |
372,667 |
$ |
409,933 |
— |
— |
— |
— |
— |
||||||||||||||||
|
Stock Options | 3/4/15 | — | — | — | 190.14 | 9,387 | $ | 896.26 | $ | 18.14 | $ | 55,405 | ||||||||||||||||
Michael K. Slattery |
Cash Bonus |
— |
$ |
113,428 |
$ |
183,600 |
$ |
214,200 |
— |
— |
— |
— |
— |
||||||||||||||||
|
Stock Options | 3/4/15 | — | — | — | 776.00 | 38,341 | $ | 896.26 | $ | 18.14 | $ | 256,650 | ||||||||||||||||
|
Stock Options | 3/4/15 | — | — | — | 108.69 | 5,384 | $ | 896.26 | $ | 18.14 | $ | 31,671 | ||||||||||||||||
William Westrate |
Cash Bonus |
— |
$ |
104,087 |
$ |
168,480 |
$ |
196,560 |
— |
— |
— |
— |
— |
||||||||||||||||
|
Stock Options | 3/4/15 | — | — | — | 190.14 | 9,387 | $ | 896.26 | $ | 18.14 | $ | 55,405 | ||||||||||||||||
|
Stock Options | 3/4/15 | — | — | — | 388.00 | 19,170 | $ | 896.26 | $ | 18.14 | $ | 128,325 | ||||||||||||||||
- (1)
- Represents
options granted by Parent under the 2012 Plan to Messrs. Spegal, Slattery and Westrate. Options vest 20% on the date of issuance and 20%
thereafter on the first, second, third and fourth anniversaries of the grant date or immediately if the individual has attained the stipulated retirement age and have a 10-year term except for the 776
and 388 options granted to Messrs. Slattery and Westrate, respectively, which vest 100% after five years.
- (2)
- Reflects the aggregate grant date fair value computed in accordance with FASB ASC Topic 718. Exercise priced based upon third-party valuation or third-party transaction price.
For a discussion of the assumptions and methodologies used to calculate the amounts reported, please see the discussion of option awards contained in Note 15 to our audited consolidated financial statements for the period ended December 31, 2015, included in this prospectus.
Summary of NEO Employment Agreements
This section describes employment agreements in effect for our NEOs during fiscal 2015. In addition, the terms with respect to grants of stock options described above under "Long-Term Equity Incentive Awards" are further described below for our NEOs in the section entitled "Outstanding Equity Incentive Awards at December 31, 2015." Severance agreements and arrangements are described below in the section entitled "Potential Payments upon Termination or Change in Control."
Employment Agreement of Richard Burke
We entered into an employment agreement with Mr. Burke (the "Burke Agreement"), effective as of November 20, 2012, for a three-year initial term which will be automatically extended for successive one-year periods thereafter unless one of the parties provides the other with written notice of non-renewal at least sixty days prior to the end of the applicable term. The agreement was subsequently modified in connection with Mr. Burke's appointment as CEO effective July 1, 2014. On June 24, 2016, we entered into an amendment to Mr. Burke's employment agreement to adjust the performance criteria applicable to
129
performance-based stock options that Mr. Burke is eligible to earn with respect to 2016. Previously, the only applicable performance criterion was EBITDA; the amendment provides that the number of performance-based stock options earned will be based on EBITDA (50%) and free cash flow (50%). The amendment also clarifies that the full potential grant of performance-based stock options (covering up to 4,000 shares of Parent's common stock) is still available to be earned by Mr. Burke. The financial terms of the Burke Agreement, as modified for salary, include (1) an annual base salary of $525,000, subject to increases not less than 100% of the CPI, (2) participation in our MIP, with a target annual cash bonus amount up to 100% of his annual base salary, (3) a one-time purchase of 1,185 shares of common stock of the Parent for $1,000,000 via a cash payment of $750,000 and a note receivable issued by the Parent of $250,000 bearing interest at the applicable federal rate, which was forgiven in connection with his appointment as CEO, (4) a one-time grant of options to purchase 9,364 shares of common stock of the Parent subject to certain vesting conditions which were met upon Mr. Burke's selection as CEO, and (5) a pool of options established by the compensation committee for which Mr. Burke may earn up to 4,000 shares for fiscal 2016 if certain EBITDA and free cash flow targets are met.
We must maintain a long term disability plan which provides benefits in an amount at least equal to 662/3% of Mr. Burke's annual base salary then in effect, up to a maximum of $9,000 per month. Further, Mr. Burke is entitled on a tax grossed-up annual basis during each calendar year of his employment, to: (1) a Company automobile or allowance for an automobile, (2) participation in the incentive stock option award program, (3) participation in the group medical, dental, health and pension or profit-sharing plans which we make available to senior level employees, (4) six weeks' vacation, (5) short term disability benefits, (6) life insurance benefits in an amount equal to $1,000,000 for which we must pay the premiums and for which he may designate a beneficiary and (7) reimbursement of his relocation expenses from Pewuakee, WI to Jacksonville, FL, including the following: (a) reasonable out-of-pocket moving expenses plus $5,000 for miscellaneous items; (b) reasonable closing costs on the sale of his principal home in Pewuakee, WI and the purchase of his principal home in Jacksonville, FL; and (c) a temporary housing allowance in an amount equal to the mortgage payment on his Pewuakee, WI home up to the earlier of 12 months from the effective date of the Burke Agreement or the sale of his Pewuakee, WI residence, in addition to the purchase of his primary residence in Pewuakee, WI if the residence is not sold within three months of the effective date of the Burke Agreement.
Mr. Burke is also entitled to a seat on our board of directors. We retain the right to remove Mr. Burke from the board of directors in connection with any restructuring of the board of directors in connection with a public offering. In such an event, no payments would be due to Mr. Burke.
Severance benefits are payable to Mr. Burke in connection with his termination without cause or his resignation for "good reason," which is defined as either a breach of the Burke Agreement by the Company, a relocation of Mr. Burke's principal place of business to a location that represents a material change (50 miles from principal place of business) in geographic location or a material diminution in his authority, duties, responsibilities, reporting position or compensation. Such severance payments are provided in an amount equal to two times his base salary and bonus received during the preceding fiscal year, paid out in 24 equal monthly installments, and a pro-rata portion of his bonus as earned through the termination date, and an additional $36,000 cash payment payable in 24 equal monthly installments. Mr. Burke is subject to non-competition, non-solicitation and non-interference with employees provisions for two years following termination of employment for any reason and to indefinite confidentiality provisions.
130
In the event that any payments or benefits due to Mr. Burke constitute parachute payments under Section 280G of the Internal Revenue Code (the "Code"), and will be subject to the excise tax imposed by Section 4999 of the Code, then the Company will pay Mr. Burke a gross-up payment so as to put him in the same after-tax position as if the Section 4999 excise tax was not imposed.
Employment Agreement of Steven R. Carn
We entered into an employment agreement with Mr. Carn (the "Carn Agreement"), effective as of November 20, 2012 for a three-year initial term which will be automatically extended for successive one-year periods thereafter unless one of the parties provides the other with written notice of non-renewal at least sixty days prior to the end of the applicable term. Pursuant to the Carn Agreement, Mr. Carn serves as our Chief Financial Officer.
The financial terms of the Carn Agreement include: (1) an annual base salary of $375,000, subject to increases not less than 100% of the CPI and (2) continued participation in our MIP, with a target annual cash bonus amount up to 100% of his salary. In addition, Mr. Carn is entitled to: (a) vacation of up to six weeks, (b) participation in the group medical, dental, health and pension or profit-sharing plans which we make available to senior level employees, (c) short-term disability benefits, (d) a long term disability plan which provides benefits in an amount at least equal to 662/3% of Mr. Carn's annual base salary then in effect up to a maximum of $9,000 per month, (e) payment by the Company of premiums on a life insurance policy in an amount equal to the base salary plus 100% of annual bonus opportunity, (f) a Company vehicle or an allowance for an automobile and (g) a seat on our board of directors. We retain the right to remove Mr. Carn from the board of directors in connection with any restructuring of the board of directors in connection with a public offering. In such an event, no payments would be due to Mr. Carn.
Further, in the event that Mr. Carn sells his shares of Parent stock in connection with a change of control, we will pay Mr. Carn, on the 6-month anniversary of the date of the change in control, an amount equal to the excess, if any, of the floor price over the actual gross proceeds received from the sale (a "Price Protection Bonus"). The floor price is defined as $610.96 per share from the effective date of the agreement through December 31, 2013; $843.13 per share from January 1, 2014—December 31, 2014; $878.47 per share from January 1, 2015-December 31, 2015 and $932.25 per share from January 1, 2016 and thereafter.
Severance benefits are payable in connection with a termination of employment without cause or resignation for "good reason," which has the same meaning as in the Burke Agreement. Such benefits are provided on the same terms as provided for in the Burke Agreement, absent the additional $36,000 payment. Mr. Carn is subject to non-competition, non-solicitation and non-interference with employees provisions for two years following termination of employment for any reason and to indefinite confidentiality provisions.
Employment Agreement of John Spegal
We entered into an employment agreement with Mr. Spegal (the "Spegal Agreement"), effective as of May 1, 2014 for a three-year initial term which will be automatically extended for successive one-year periods thereafter unless one of the parties provides the other with written notice of non-renewal at least sixty days prior to the end of the applicable term. Pursuant to the Spegal Agreement, Mr. Spegal serves as our Chief Operating Officer.
The financial terms of the Spegal Agreement include: (1) an annual base salary of $360,000, subject to annual increases not less than 100% of the CPI; and (2) continued
131
participation in our MIP, with a target annual cash bonus amount up to 100% of his salary. In addition, Mr. Spegal is entitled to: (a) vacation of up to six weeks, (b) participation in the group medical, dental, health and pension or profit-sharing plans which we make available to senior level employees, (c) short-term disability benefits, (d) a long-term disability plan which provides benefits in an amount at least equal to 40% of Mr. Spegal's annual base salary then in effect up to a maximum of $11,000 per month, (e) participation in the 2012 Plan, as amended from time to time, at two times Level 1 of the 2012 Plan (where "Level 1" refers to a management-designated level of participation in the 2012 Plan that governs how many shares may be granted in connection with awards thereunder), (f) payment by the Company of premiums on a life insurance policy in an amount equal to two times the executive's base salary, (g) reimbursement of his relocation expenses in an amount equal to $175,000 and (h) a Company automobile and cell phone allowance.
Severance benefits are provided under the Spegal Agreement if Mr. Spegal's employment terminates without cause or, following a change in control and absent cause, for "good reason," subject to the execution and non-revocation of a general release. The term "good reason" has the same meaning as under Mr. Burke's employment agreement, except the breach of agreement component is replaced with termination by the Company in connection with a change in control. Upon such termination, Mr. Spegal is entitled to severance payments in (i) an amount equal to two times his annual base salary then in effect, payable in 24 equal monthly installments; (ii) a pro-rata portion of his bonus as earned through the termination date; (iii) an amount equal to two times his bonus received during the fiscal year immediately preceding termination payable in 24 equal monthly installments; and (iv) $50,000 net of taxes, for relocation services. Mr. Spegal is subject to non-competition, non-solicitation and non-interference with employees provisions for two years following termination of employment for any reason and to indefinite confidentiality provisions.
Employment Agreement of Michael K. Slattery
We entered into an employment agreement with Mr. Slattery (the "Slattery Agreement"), effective as of May 29, 2015 for a three-year initial term which will be automatically extended for successive one-year periods thereafter unless one of the parties provides the other with written notice of non-renewal at least sixty days prior to the end of the applicable term. Pursuant to the Slattery Agreement, Mr. Slattery serves as our Senior Vice President, General Counsel.
The financial terms of the Slattery Agreement include: (1) an annual base salary of $306,000, subject to annual increases and (2) continued participation in our MIP, with a target annual cash bonus amount up to 60% of his salary. In addition, Mr. Slattery is entitled to: (a) vacation of up to four weeks, (b) participation in the group medical, dental, health and pension or profit-sharing plans which we make available to senior level employees, (c) short-term disability benefits, (d) a long-term disability plan which provides benefits in an amount at least equal to 40% of Mr. Slattery's annual base salary then in effect up to a maximum of $11,000 per month, (e) participation in the Company's current equity compensation plan, as amended from time to time, (f) payment by the Company of premiums on a life insurance policy in an amount equal to two times Mr. Slattery's base salary and (g) reimbursement of direct and reasonable business expenses.
Severance benefits are provided under the Slattery Agreement if Mr. Slattery's employment terminates without cause or following a change in control for "good reason," subject to the execution and non-revocation of a general release. "Good Reason" means that (i) grounds for termination for cause do not exist, and (ii) either (1) Mr. Slattery's principal place of business is relocated by more than 50 miles without his consent, (2) there is a
132
diminution in Mr. Slattery's title, authority, duties, responsibilities, reporting position or compensation without his consent or (3) Mr. Slattery is terminated by the Company in connection with the change in control. Upon such termination, Mr. Slattery is entitled to severance payments in (i) an amount equal to two times his annual base salary then in effect, payable in 24 equal monthly installments; (ii) a pro-rata portion of his bonus as earned through the termination date; and (iii) an amount equal to two times the greater of (1) his bonus received during the fiscal year immediately preceding the year of termination and (2) the average of the bonuses paid to Mr. Slattery in the two years immediately preceding the year of termination, payable in 24 equal monthly installments. Mr. Slattery is subject to a non-competition covenant for two years following termination of employment for any reason, a non-solicitation and non-interference with employees covenant for two years following termination of employment for any reason and indefinite confidentiality provisions.
Employment Agreement of William Westrate
We entered into an employment agreement with Mr. Westrate (the "Westrate Agreement"), effective as of May 1, 2015 for a three-year initial term which will be automatically extended for successive one-year periods thereafter unless one of the parties provides the other with written notice of non-renewal at least sixty days prior to the end of the applicable term. Pursuant to the Westrate Agreement, Mr. Westrate serves as our Chief Administrative Officer.
The financial terms of the Westrate Agreement include: (1) an annual base salary of $270,000, subject to annual increases and (2) continued participation in our MIP, with a target annual cash bonus amount up to 60% of his salary. In addition, Mr. Westrate is entitled to: (a) vacation of up to four weeks, (b) participation in the group medical, dental, health and pension or profit-sharing plans which we make available to senior level employees, (c) short-term disability benefits, (d) a long-term disability plan which provides benefits in an amount at least equal to 40% of Mr. Westrate's annual base salary then in effect up to a maximum of $11,000 per month, (e) participation in the 2012 Plan, as amended from time to time, at Level 1 of the 2012 Plan, (f) payment by the Company of premiums on a life insurance policy in an amount equal to two times Mr. Slattery's base salary and (g) reimbursement of direct and reasonable business expenses.
Severance benefits are provided under the Westrate Agreement if Mr. Westrate's employment terminates without cause or following a change in control for "good reason," subject to the execution and non-revocation of a general release. "Good Reason" means that (i) grounds for termination for cause do not exist, and (ii) either (1) Mr. Westrate's principal place of business is relocated by more than 50 miles without his consent, (2) there is a diminution in Mr. Westrate's title, authority, duties, responsibilities, reporting position or compensation without his consent or (3) Mr. Westrate is terminated by the Company in connection with the change in control. Upon such termination, Mr. Westrate is entitled to severance payments in (i) an amount equal to two times his annual base salary then in effect, payable in 24 equal monthly installments; (ii) a pro-rata portion of his bonus as earned through the termination date; and (iii) an amount equal to two times the bonus received during the fiscal year immediately preceding the year of termination, payable in 24 equal monthly installments. Mr. Westrate is subject to a non-competition covenant for two years following termination of employment for any reason, a non-solicitation and non-interference with employees covenant for two years following termination of employment for any reason and indefinite confidentiality provisions.
133
Outstanding Equity Awards at December 31, 2015
The following table sets forth information concerning outstanding stock options held by each of our NEOs as of December 31, 2015.
The figures in this table reflect the numbers of shares of Parent's common stock covered by stock options, as well as the relevant exercise prices, as of December 31, 2015. We have included estimates of the corresponding numbers of post-offering shares subject to these options, as well as their post-offering exercise prices, based on a pre-to-post offering conversion factor of 1 to 49.4089. The conversion is based on an assumed price of $19.50 per share, which is the mid-point of the offering's price range.
Name
|
Grant Date | Exercisable | Exercisable (Post-Offering) |
Unexercisable | Unexercisable (Post-Offering) |
Option Exercise Price |
Option Exercise Price (Post-Offering) |
Option Expiration Date |
|||||||||||||||||
|---|---|---|---|---|---|---|---|---|---|---|---|---|---|---|---|---|---|---|---|---|---|---|---|---|---|
Richard Burke |
4/25/2013 | 12 | 592 | 9 | (1) | 444 | $ | 844.10 | $ | 17.09 | 4/25/2023 | ||||||||||||||
|
11/20/2012 | 9,364 | 462,664 | — | (2) | — | $ | 844.10 | $ | 17.09 | 11/20/2022 | ||||||||||||||
Steven R. Carn |
4/25/2013 | 20 | 988 | 14 | (1) | 691 | $ | 844.10 | $ | 17.09 | 4/25/2023 | ||||||||||||||
|
4/26/2012 | 1,025 | 50,644 | 256 | (1) | 12,648 | $ | 619.64 | $ | 12.55 | 4/26/2022 | ||||||||||||||
John Spegal |
3/4/2015 | 38 | 1,877 | 152 | (1) | 7,510 | $ | 896.26 | $ | 18.14 | 3/4/2025 | ||||||||||||||
|
5/14/2014 | 25 | 1,235 | 39 | (1) | 1,926 | $ | 910.78 | $ | 18.44 | 5/14/2024 | ||||||||||||||
|
5/14/2014 | — | — | 517 | (3) | 25,544 | $ | 910.78 | $ | 18.44 | 5/14/2024 | ||||||||||||||
|
4/25/2013 | — | — | 259 | (3) | 12,796 | $ | 844.10 | $ | 17.09 | 4/25/2023 | ||||||||||||||
Michael K. Slattery |
3/4/2015 | 22 | 1,086 | 87 | (1) | 4,298 | $ | 896.26 | $ | 18.14 | 3/4/2025 | ||||||||||||||
|
3/4/2015 | — | — | 776 | (3) | 38,341 | $ | 896.26 | $ | 18.14 | 3/4/2025 | ||||||||||||||
William Westrate |
3/4/2015 | 38 | 1,877 | 152 | (1) | 7,510 | $ | 896.26 | $ | 18.14 | 3/4/2025 | ||||||||||||||
|
3/4/2015 | — | — | 388 | (3) | 19,170 | $ | 896.26 | $ | 18.14 | 3/4/2025 | ||||||||||||||
|
5/14/2014 | — | — | 388 | (3) | 19,170 | $ | 910.78 | $ | 18.44 | 5/14/2024 | ||||||||||||||
- (1)
- Time-vested
options vest 20% on date of grant and 20% ratably thereafter on each annual anniversary of the date of grant.
- (2)
- Options
vested 100% with Mr. Burke's selection as CEO.
- (3)
- Represents stock options granted that vest 100% after five years from the date of grant.
Option Exercises and Stock Vested in 2015
No options were exercised in 2015 and no stock was vested in 2015.
Potential Payments Upon Termination or Change in Control
The following table quantifies the potential contractual and/or plan termination and change-in-control payment amounts assuming hypothetical triggering events had occurred as of December 31, 2015. The value per share of our stock as of the fiscal year-end used in calculating the value of outstanding stock was $1,236. See "—Summary of NEO Employment Agreements" above. Our incentive plans also provide for payments to NEOs in the event of termination under certain circumstances not related to change-in-control, such as death,
134
disability, retirement, and job elimination. Refer to the chart and footnotes included below for a full description of such benefits.
Name
|
Item of Compensation |
Termination Upon Death/Disability |
Termination Upon Retirement |
Involuntary Termination Not for Cause or Reason |
Termination for Cause |
Voluntary Resignation (2) |
Termination Upon Change in Control (3) |
||||||||||||||
|---|---|---|---|---|---|---|---|---|---|---|---|---|---|---|---|---|---|---|---|---|---|
| Richard Burke | Bonus | $ | 548,924 | $ | — | $ | 548,924 | $ | — | $ | 548,924 | $ | 548,924 | ||||||||
| Additional Severance (1) | $ | 36,000 | $ | — | $ | 36,000 | $ | — | $ | 36,000 | $ | 36,000 | |||||||||
| Unvested Stock Options | $ | 3,527 | $ | — | $ | — | $ | — | $ | — | $ | 3,527 | |||||||||
| Multiple of Salary and Bonus | $ | 2,211,848 | $ | — | $ | 2,211,848 | $ | — | $ | 2,211,848 | $ | 2,211,848 | |||||||||
| Total Payments | $ | 2,800,299 | $ | — | $ | 2,796,772 | $ | — | $ | 2,796,772 | $ | 2,800,299 | |||||||||
Steven Cam |
Bonus |
$ |
391,155 |
$ |
— |
$ |
391,155 |
$ |
— |
$ |
391,155 |
$ |
391,155 |
||||||||
| Unvested Stock Options | $ | 163,286 | $ | — | $ | — | $ | — | $ | — | $ | 163,286 | |||||||||
| Multiple of Salary and Bonus | $ | 1,568,157 | $ | — | $ | 1,568,157 | $ | — | $ | 1,568,157 | $ | 1,568,157 | |||||||||
| Total Payments | $ | 2,122,598 | $ | — | $ | 1,959,312 | $ | — | $ | 1,959,312 | $ | 2,122,598 | |||||||||
John Spegal |
Bonus |
$ |
365,088 |
$ |
— |
$ |
365,088 |
$ |
— |
$ |
365,088 |
$ |
365,088 |
||||||||
| Unvested Stock Options | $ | — | $ | — | $ | — | $ | — | $ | — | $ | 334,004 | |||||||||
| Multiple of Salary and Bonus | $ | 743,221 | $ | — | $ | 1,486,443 | $ | — | $ | 1,486,443 | $ | 1,486,443 | |||||||||
| Total Payments | $ | 1,108,309 | $ | — | $ | 1,851,531 | $ | — | $ | 1,851,531 | $ | 2,185,535 | |||||||||
Michael K Slattery |
Bonus |
$ |
182,774 |
$ |
— |
$ |
182,774 |
$ |
— |
$ |
182,774 |
$ |
182,774 |
||||||||
| Unvested Stock Options | $ | — | $ | — | $ | — | $ | — | $ | — | $ | 293,230 | |||||||||
| Multiple of Salary and Bonus | $ | 488,774 | $ | — | $ | 977,548 | $ | — | $ | 977,548 | $ | 977,548 | |||||||||
| Total Payments | $ | 671,548 | $ | — | $ | 1,160,322 | $ | — | $ | 1,160,322 | $ | 1,453,552 | |||||||||
William Westrate |
Bonus |
$ |
165,089 |
$ |
— |
$ |
165,089 |
$ |
165,089 |
$ |
165,089 |
||||||||||
| Unvested Stock Options | $ | — | $ | — | $ | — | $ | — | $ | — | $ | 309,682 | |||||||||
| Multiple of Salary and Bonus | $ | 445,889 | $ | — | $ | 891,778 | $ | — | $ | 891,778 | $ | 891,778 | |||||||||
| Total Payments | $ | 610,978 | $ | — | $ | 1,056,867 | $ | — | $ | 1,056,867 | $ | 1,366,549 | |||||||||
- (1)
- Paid
in 24 equal monthly installments.
- (2)
- Voluntary
resignation payments are based upon resignation for "good reason." Details of the definition of "good reason" applicable to each of our named
executive officers are provided above under "Compensation Discussion & Analysis—NEO Employment Agreements."
- (3)
- For Mr. Burke and Mr. Carn, Options outstanding as of December 31, 2015 would have automatically vested upon a change in control had one occurred as of that date. In that case, the value received by Mr. Burke on account of the acceleration of his unvested stock options would have been $3,527, and the value received by Mr. Carn on account of the acceleration of his unvested stock options would have been $163,286.
All NEOs are subject to non-competition covenants for two years following termination of employment, non-solicitation and non-interference with employees provisions for two years following termination of employment for any reason and indefinite confidentiality provisions.
Non-Employee Director Compensation
During the fiscal year ending in 2015, we did not provide any compensation to our directors on account of their service to the Company as non-employee directors. The only directors who received compensation from the Company were Mr. Appleby in connection with consulting services that he provides to the Company, and Messrs. Burke and Carn in connection with their service as officers of the Company. Payments to Messrs. Burke and Carn are set forth in the Summary Compensation Table. Payments to Mr. Appleby are described below and are set forth in the director compensation table included in the section labeled "Compensation Arrangements of Charles Appleby."
Upon the completion of this offering, our non-employee directors nominated by Highstar Capital, CPPIB and BTG will not receive compensation for their service as directors. We expect
135
to have one non-employee director not nominated by Highstar Capital, CPPIB and BTG upon completion of this offering, and we expect that his compensation will consist of:
- •
- An annual cash retainer of $50,000 for service as a non-employee director;
- •
- An annual cash retainer of $15,000 for service as the chairman of the audit committee; and
- •
- An annual restricted stock award under the 2016 Plan (as defined below) with a grant date fair market value of $100,000, which will be eligible to vest in full on the third anniversary of the date of grant.
Share Ownership Guidelines
Our non-employee directors who are not nominated by Highstar Capital, CPPIB or BTG are required to retain the shares covered by their annual equity awards until they own shares of our common stock with a value of $250,000. If such a director's share ownership subsequently drops below $250,000 of our common stock, the director must retain shares covered by future director equity awards until his or her level of ownership again reaches $250,000 of our common stock.
Compensation Arrangements of Charles Appleby
Mr. Appleby retired from his position as the Company's Chief Executive Officer effective July 1, 2014, but continued to serve on our board of directors until January 29, 2016. In connection with his retirement, we entered into a letter agreement on June 20, 2014 (the "Appleby Letter Agreement"), which amended the payment schedule provided for by a stock redemption program with the Parent. Pursuant to the stock redemption program, as amended by the Appleby Letter Agreement, the Parent will repurchase all of the then original outstanding stock owned by Mr. Appleby as of November 20, 2012 in three equal installments on each of January 15, 2015, January 15, 2016 and January 15, 2017 (each, a "Purchase Date"), payable on each Purchase Date in an amount equal to 331/3% of the number of original shares outstanding times the redemption price on the applicable Purchase Date. Stock acquired subsequent to November 20, 2012 will be purchased on the final installment payment date of the original share sale date or January 15, 2017. The Company has repurchased the shares required to be so repurchased on January 15, 2015 and January 15, 2016. Pursuant to a share price protection agreement, shares are redeemable at a price equal to the greater of the public company value per share or EBITDA value per share at a floor price of $884.62 per share, with the floor price only applicable to the shares held prior to November 20, 2012. Any difference between fair market value and the floor price is payable on January 15, 2017. In early 2016, Mr. Appleby challenged the calculation of his redemption payments made in 2015 and 2016, claiming that they should have been greater by approximately $2 million in total. We settled this dispute with Mr. Appleby on May 17, 2016 for approximately $1.1 million. Contemporaneous with the payment dates, Mr. Appleby will repay (and has repaid, as applicable) in ratable amounts 331/3% of his outstanding shareholder loan with the Parent, as described below under "Certain Relationships and Related Party Transactions."
In addition to his stock redemption, Mr. Appleby receives post-retirement medical benefits for himself and his spouse through December 31 of the year in which Mr. Appleby turns 75 (or, if Mr. Appleby dies prior to reaching age 75, then for his spouse through the end of the calendar year in which Mr. Appleby would have turned 75). This plan provides health insurance coverage and benefits similar to the health insurance provided by us to other of our executive employees at the time of Mr. Appleby's retirement or termination. The plan provides
136
for healthcare retirement benefits for Mr. Appleby and his wife and was valued utilizing the projected unit credit method with the following assumptions: (1) assumed discount rate of 3.80% based upon the Citigroup Pension Discount Curve, (2) enrollment in Medicare, (3) benefits are non-contributory by the employee up to $50,000, (4) retiree and his spouse receive coverage until retiree reaches the age of 75, (5) impact of the Patient Protection and Affordable Care Act enacted in March 2010, in particular the provision for an excise tax, (6) mortality rates from the RP 2000 Healthy Male and Female tables and (7) health care cost trend assumptions of 9.0% initially followed with an ultimate trend of 5.0%.
The following table reflects the compensation paid to Mr. Appleby in 2015. Other non-employee directors have not been included because they received no compensation in 2015.
Name
|
All Other Compensation (1) |
Total | |||||
|---|---|---|---|---|---|---|---|
Charles Appleby |
$ | 4,378,234 | $ | 4,378,234 | |||
- (1)
- Includes compensation for consulting services in an amount equal to $125,000, $4,237,900 for redemption of certain shares held by him and family trusts, and $15,334 in payments for post-retirement medical benefits.
137
Equity Compensation Plan Information
The following table presents information as of December 31, 2015 regarding equity compensation plans applicable to our employees. The only applicable equity compensation plan as of December 31, 2015 was the 2012 Plan, which involves issuance of equity at the Parent-level. In connection with the adoption of the 2012 Plan, awards under a previous equity plan, the 2006 Equity Incentive Plan, were cancelled and reissued under the 2012 Plan. We have included estimates of the corresponding numbers of post-offering shares subject to these options remaining available under the 2012 Plan, as well as the post-offering exercise prices, based on a pre-to-post offering conversion factor of 1 to 49.4089. The conversion is based on an assumed price of $19.50 per share, which is the mid-point of the range set forth on the cover of this prospectus.
Plan category
|
Number of securities to be issued upon exercise of outstanding options, warrants and rights |
Post-Offering number of securities to be issued upon exercise of outstanding options, warrants and rights |
Weighted-average exercise price of outstanding options, warrants and rights |
Post-Offering exercise price of outstanding options, warrants and rights |
Number of securities remaining available for future issuance under equity compensation plans (excluding securities reflected in column (a)) |
Post-Offering number of securities remaining available for future issuance under equity compensation plans (excluding securities reflected in column (a)) |
|||||||||||||
|---|---|---|---|---|---|---|---|---|---|---|---|---|---|---|---|---|---|---|---|
| |
(a) |
|
(b) |
|
(c) |
|
|||||||||||||
Equity compensation plans approved by security holders |
N/A | N/A | N/A | ||||||||||||||||
Equity compensation plans not approved by security holders |
82,972 | 4,099,555 | $ | 686 | (1) | 13.88 | 97,028 | 4,794,047 | |||||||||||
|
$ | 602 | (2) | 12.18 | |||||||||||||||
Total |
82,972 | 4,099,555 | $ | 686 | (1) | 13.88 | 97,028 | 4,794,047 | |||||||||||
|
$ | 602 | (2) | 12.18 | |||||||||||||||
- (1)
- Represents
the weighted-average exercise price of annual and senior management grants (41,635 shares outstanding pre-offering; approximately
2,057,140 shares outstanding post-offering), which is calculated separately from the weighted-average exercise price of strategic grants.
- (2)
- Represents the weighted-average exercise price of strategic grants (41,337 shares outstanding pre-offering; approximately 2,042,416 shares outstanding post-offering).
2016 Omnibus Equity Plan
Our board of directors adopted the Advanced Disposal Services, Inc. 2016 Omnibus Equity Plan (the "2016 Plan") on January 29, 2016. The 2016 Plan was approved by our shareholder on January 29, 2016, and will be effective prior to the completion of this offering (the "2016 Plan Effective Date"). It will terminate on the tenth anniversary of the 2016 Plan Effective Date, unless sooner terminated by our board of directors.
Awards and Eligibility
Eligible participants in the 2016 Plan are selected by the compensation committee of our board of directors, and may include our officers, employees, directors and consultants.
The 2016 Plan provides for the grant of non-qualified stock options, incentive stock options, stock appreciation rights, restricted stock awards, restricted stock unit awards,
138
performance stock awards, performance stock units, cash performance units and other forms of equity-based awards, including awards based on the value of dividends paid by us.
Stock options provide for the purchase of shares of our common stock in the future at an exercise price set on the grant date. Incentive stock options, in contrast to non-qualified stock options, may provide a tax deferral beyond exercise and favorable capital gains tax treatment to their holders if certain holding period and other requirements of the Code are satisfied. The exercise price of a stock option may not be less than 100% of the fair market value of the underlying share on the date of grant (or 110% in the case of incentive stock options granted to certain significant stockholders). The term of a stock option may not be longer than ten years (or five years in the case of incentive stock options granted to certain significant stockholders). Vesting conditions determined by the plan administrator may apply to stock options and may include continued service, performance and/or other conditions.
Stock appreciation rights entitle their holder, upon exercise, to receive from us an amount equal to the appreciation of the shares subject to the award between the grant date and the exercise date. The exercise price of a stock appreciation right may not be less than 100% of the fair market value of the underlying share on the date of grant and the term of a stock appreciation right may not be longer than ten years. Vesting conditions determined by the plan administrator may apply to stock appreciation rights and may include continued service, performance and/or other conditions.
The 2016 Plan explicitly prohibits the repricing of options or stock appreciation rights and the grant of discount options or discount stock appreciation rights.
Restricted stock is an award of nontransferable shares of our common stock that remain forfeitable unless and until specified conditions are met. Restricted stock units are contractual promises to deliver shares of our common stock in the future, which may also remain forfeitable unless and until specified conditions are met. Conditions applicable to restricted stock and restricted stock units may be based on continuing service, the attainment of performance goals and/or such other conditions as the plan administrator may determine.
Performance stock awards are contractual rights to receive a range of shares of our common stock in the future based on the attainment of specified performance goals, in addition to other conditions which may apply to these awards. Performance stock units are contractual rights to deliver shares of our common stock in the future in an amount to be determined based on achievement of certain performance goals and other conditions that may apply. Cash performance units are contractual promises to provide an amount of cash at a time in the future based on achievement of certain performance goals and other conditions that may apply. Conditions applicable to performance stock, performance stock units and cash performance units may be based on continuing service, the attainment of performance goals and/or such other conditions as the plan administrator may determine.
Authorized Shares
A maximum of 4,260,000 of the Company's shares of common stock outstanding upon completion of the offering calculated on a fully diluted basis, rounded up to the nearest 10,000 shares, may be issued under our 2016 Plan, which number may be adjusted to reflect certain corporate transactions or other changes in capitalization set forth therein.
No participant may be granted under the 2016 Plan in any calendar year awards covering more than 7.5% of the maximum number of shares of common stock that may be issued under the 2016 Plan. The maximum aggregate cash payment with respect to cash-based awards that may be granted to a participant in any one fiscal year is $5 million. Nonemployee
139
directors may not receive regular annual awards for any calendar year having a grant date fair value, determined using assumptions and methods that are consistent in all material respects with the assumptions used to disclose such grants in our proxy statement for the year to which such grants relate, that exceeds $500,000, or any special or one-time award upon election or appointment to the board of directors having a grant date fair value, determined as described above, that exceeds $500,000. To the extent not prohibited by applicable laws, rules and regulations, shares of common stock underlying "substitute awards" will not be counted against the number of shares of common stock remaining available for issuance and are not subject to the other limits described in this section. A "substitute award" is one granted upon assumption of, or in substitution or exchange for, an outstanding award previously granted by a company or other entity acquired by us or with which we combine in a corporate transaction, in each case under the terms of the equity plan that was approved by the shareholders of the granting entity.
Shares of common stock tendered by a participant or withheld by us to pay the exercise price of an award or to satisfy the participant's tax withholding obligations in connection with the vesting, exercise or settlement of an award, as well as shares of common stock subject to an option or stock appreciation right but not issued or delivered as a result of the net settlement of the award, shall be added back to the number of shares available for issuance under the 2016 Plan.
Administration
The 2016 Plan will be administered by the compensation committee of our board of directors. Subject to the terms of the 2016 Plan, the compensation committee has the power to: select participants for the 2016 Plan; grant awards; determine the number of shares of common stock subject to each award or the cash amounts payable in connection therewith; determine the terms and conditions of awards, including consequences of a termination of employment; amend the terms and conditions of awards; specify and approve the terms of award documents; make factual determinations in connection with the administration of the 2016 Plan; adopt and revise rules pertaining to the 2016 Plan; employ legal counsel and other consultants or advisors in connection with the administration of the 2016 Plan; vary the terms of awards to account for tax and securities laws; correct any defects and reconcile any omissions in the 2016 Plan; suspend the right to exercise during any blackout period and extend the period of exercise by an equal period of time; and make all other determinations and take any other actions necessary or desirable to interpret and administer the 2016 Plan.
The compensation committee also has the power, to the extent not prohibited by applicable laws, to delegate its authority under the 2016 Plan to a subcommittee thereof, or to other people or groups of people as it deems necessary and appropriate. The compensation committee may not, however, delegate its authority to make awards to individuals who are subject to the reporting rules of Section 16(a) of the Exchange Act or whose compensation for such a fiscal year may be subject to Section 162(m) of the Code. The compensation committee is also prohibited from delegating any authority that it has under Section 16 of the Exchange Act.
Section 162(m)
Section 162(m) of the Code imposes a $1,000,000 cap on the compensation deduction that a public company may take in respect of compensation paid to its "covered employees" (which should include its chief executive officer and its next three most highly compensated employees other than its chief financial officer), but excludes from the calculation of amounts subject to this limitation any amounts that constitute qualified performance-based
140
compensation ("QPBC"). Under current tax law, we do not expect Section 162(m) of the Code to apply to certain awards under the 2016 Plan until the earliest to occur of (1) our annual shareholders' meeting at which members of our board of directors are to be elected that occurs after the close of the third calendar year following the year of this offering; (2) a material modification of the 2016 Plan; (3) an exhaustion of the share supply under the 2016 Plan; or (4) the expiration of the 2016 Plan. However, performance criteria may still be used with respect to performance-based awards that are not intended to constitute QPBC.
In order to constitute QPBC, in addition to certain other requirements, the relevant amounts must be payable only upon the attainment of pre-established, objective performance goals set by our compensation committee and linked to shareholder-approved performance criteria. The 2016 Plan sets forth the applicable performance criteria that may be used in making such awards, and also permits the compensation committee to provide for objectively determinable adjustments to the applicable performance criteria in setting performance goals for QPBC. Performance targets applicable to awards intended to constitute QPBC must be based on one or more of the following performance categories: net income; cash flow or cash flow return on investment or cash flow per share; operating cash flow; pre-tax or post-tax profit levels or earnings; profit in excess of cost of capital; operating earnings; return on investment; free cash flow; free cash flow per share; earnings per share; return on assets; return on net assets; return on equity; return on capital; return on invested capital; return on sales; sales growth; growth in managed assets; gross margin; operating margin; operating income; total shareholder return or stock price appreciation; EBITDA; EBITA; revenue; net revenues; market share; market penetration; productivity improvements; inventory turnover measurements; working capital turnover measurements; reduction of losses, loss ratios or expense ratios; reduction in fixed costs; operating cost management; cost of capital; debt reduction; and safety measurements or other operational criteria that are objectively determinable.
Following the completion of each performance period, the compensation committee will determine the extent to which the performance targets have been achieved or exceeded. If the minimum performance targets established by the compensation committee for awards intended to constitute QPBC are not achieved, no payment will be made.
Changes in Capitalization
In the event of certain specified changes in capitalization set forth in the 2016 Plan, the number and kind of shares of common stock authorized for issuance under the 2016 Plan and subject to the sub-limits set forth above under "Authorized Shares" will be equitably adjusted in the manner deemed necessary by the compensation committee to preserve, but not increase, the benefits or potential benefits intended to be made available under the 2016 Plan. Unless otherwise determined by the compensation committee, such adjusted awards will be subject to the same restrictions and vesting or settlement schedules to which the underlying awards are subject (subject to the limitations of Section 409A of the Code).
Recoupment
Awards granted under the 2016 Plan, any payments made under the 2016 Plan and any gains realized upon exercise or settlement of an award will be subject to clawback or recoupment as permitted or mandated by applicable law, rules, regulations or any Company policy as enacted, adopted or modified from time to time.
141
Plan Amendment or Termination
Our board of directors has the authority to amend, suspend, or terminate our 2016 Plan, provided that such action does not materially impair the existing rights of any participant without such participant's consent. Furthermore, no amendment, suspension or termination will be effective without the approval of our shareholders if such approval is required under applicable laws, rules and regulations. No incentive stock options may be granted after the tenth anniversary of the 2016 Plan Effective Date.
New Plan Benefits
Because awards under the 2016 Plan are determined by the compensation committee in its sole discretion and may be based on the future achievement of performance goals to be established thereby, we cannot determine the benefits or amounts that will be received or allocated in the future under the 2016 Plan. The table below shows, for the individuals and groups listed, certain awards that we have made in connection with this offering (the "Offering Grants"), with the exception of the grant shown for non-employee directors, which represents an annual restricted stock award to one such non-employee director. Each of the awards reflected in the table below is scheduled to vest in full on the third anniversary of the date of grant. These awards are not necessarily indicative of awards that the compensation committee may make in the future.
These awards were calculated assuming a post-Offering share price of $19.50, the mid-point of the range set forth on the cover of this prospectus. The actual numbers of shares subject to these Offering Grants will be adjusted to reflect the final Offering price once it is known. The numbers of shares reflected in the table below are post-Offering shares, rather than pre-Offering shares of Parent.
| |
|
Number of Units | ||||||||||||||
|---|---|---|---|---|---|---|---|---|---|---|---|---|---|---|---|---|
Name and Position
|
Dollar Value ($) |
Options | Restricted Stock |
RSUs | Total | |||||||||||
Richard Burke, Chief Executive Officer |
3,000,000 | 155,763 | 102,564 | 258,327 | ||||||||||||
Steven R. Carn, Chief Financial Officer |
1,500,000 | 77,882 | 51,282 | 129,164 | ||||||||||||
John Spegal, Chief Operating Officer |
1,800,000 | 140,187 | 46,153 | 186,340 | ||||||||||||
Michael K. Slattery, Senior Vice President, General Counsel |
1,500,000 | 116,822 | 38,462 | 155,284 | ||||||||||||
William Westrate, Chief Administrative Officer |
1,500,000 | 116,822 | 38,462 | 155,284 | ||||||||||||
Total Executive Group |
9,300,000 | 607,476 | 276,923 | 884,399 | ||||||||||||
Non-Employee Directors |
100,000 | 0 | 5,128 | 0 | 5,128 | |||||||||||
Non-Executive Officer Employee Group |
1,404,900 | 223,000 | 0 | 0 | 223,000 | |||||||||||
2016 Short-Term Incentive Plan
Our board of directors adopted the Advanced Disposal Services, Inc. Short Term Incentive Compensation Plan (the "STIC Plan") on January 29, 2016. The STIC Plan was approved by our shareholder on January 29, 2016, and will be effective prior to the completion of this offering (the "STIC Effective Date"). The STIC Plan shall remain in effect until terminated pursuant to its terms.
Awards and Eligibility
The STIC Plan provides for the grant of short-term cash incentive compensation awards to those individuals selected by the compensation committee of the board of directors. Such
142
eligible individuals include key employees of the Company and our affiliates. The maximum award that may be granted to any one individual in a plan year is $5 million.
Administration
The STIC Plan will be administered by the compensation committee of our board of directors. Subject to the terms of the STIC Plan, the compensation committee has the power to designate participants; determine the terms and conditions of any award; determine whether, to what extent and under what circumstances awards may be forfeited or suspended; interpret, administer, reconcile any inconsistency, correct any defect and/or supply any omission in the STIC Plan or any instrument or agreement relating to, or award granted under, the STIC Plan; establish, amend, suspend or waive any rules for the administration, interpretation and application of the STIC Plan; and make any other determination and take any other action that it deems necessary or desirable for the administration of the STIC Plan.
The compensation committee also has the power to delegate its administrative duties to our directors or officers. However, it may not delegate its responsibilities to make awards to our executive officers, to make awards that are intended to be QPBC or to certify that performance targets applicable to awards intended to be QPBC have been satisfied.
Section 162(m)
As described above under "Section 162(m)" in the description of the 2016 Plan, we similarly do not expect Section 162(m) of the Code to apply to certain awards under the STIC Plan until the earliest to occur of (1) our annual shareholders' meeting at which members of our board of directors are to be elected that occurs after the close of the third calendar year following the year of this offering; (2) a material modification of the STIC Plan; or (3) the expiration of the STIC Plan. However, performance criteria may be used with respect to performance awards that are not intended to constitute QPBC. The performance criteria set forth in the STIC Plan are the same as those set forth in the 2016 Plan, as described above under "Section 162(m)."
In order to constitute QPBC, in addition to certain other requirements, the relevant amounts must be payable only upon the attainment of pre-established, objective performance goals set by our compensation committee and linked to shareholder-approved performance criteria. The STIC Plan sets forth the applicable performance criteria that may be used in making such awards, and also permits the compensation committee to provide for objectively determinable adjustments to the applicable performance criteria in setting performance goals for QPBC.
Following the completion of each performance period, the compensation committee will determine the extent to which the performance targets have been achieved or exceeded. If the minimum performance targets established by the compensation committee are not achieved, no payment will be made with respect to awards intended to constitute QPBC.
Adjustments to Awards
Our STIC Plan provides that the compensation committee may adjust the calculation of a performance target for a performance period to reflect the occurrence of certain changes in capitalization set forth therein, to exclude the effect of certain "extraordinary items" as set forth under the Generally Accepted Accounting Principles or to reflect all items of gain, loss or expense for a fiscal year that are related to special, unusual or non-recurring items, events or circumstances affecting the Company or our financial statements.
143
Recoupment
Awards granted under the STIC Plan will be subject to clawback or recoupment as permitted or mandated by applicable law, rules, regulations or any Company policy as enacted, adopted or modified from time to time.
Plan Amendment or Termination
The compensation committee or our board of directors may, at any time, amend, suspend or terminate the STIC Plan in whole or in part, provided that no amendment that requires shareholder approval in order for the STIC Plan to continue to comply with Section 162(m) of the Code will be effective unless approved by the requisite vote of our shareholders. However, no amendment will adversely affect the rights of any participant to awards allocated prior to such amendment.
Amendment to 2012 Plan
By unanimous written consent of Parent's board of directors dated June 24, 2016, the 2012 Plan was amended and restated as the Advanced Disposal Waste Holdings Corp. Amended and Restated 2012 Stock Incentive Plan (the "Amended 2012 Plan") to allow for the grant of performance shares, restricted shares, restricted share units and other equity awards in addition to stock options and stock purchase rights as originally provided for under the 2012 Plan. On the same date, Forms of Performance Share Unit, Restricted Share, Restricted Share Unit and Non-Qualified Stock Option Award Agreements under the Amended 2012 Plan were approved.
144
The following table sets forth information as of September 20, 2016 regarding the beneficial ownership of our common stock immediately prior to this offering (after giving effect to the merger and recapitalization that will occur as part of the Reorganization), and as adjusted to give effect to the Reorganization and this offering by:
- •
- each person or group who is known by us to own beneficially more than 5% of our outstanding shares of our common stock;
- •
- each of our NEOs;
- •
- each of our current directors; and
- •
- all of our current executive officers and directors as a group.
For further information regarding material transactions between us and our stockholders or their affiliates, see "Certain Relationships and Related Party Transactions."
Beneficial ownership for the purposes of the following table is determined in accordance with the rules and regulations of the SEC. These rules generally provide that a person is the beneficial owner of securities if such person has or shares the power to vote or direct the voting thereof, or to dispose or direct the disposition thereof or has the right to acquire such powers within 60 days. All amounts in the following table, except for the shares to be sold in this offering, are estimated assuming an initial public offering price at the mid-point of the range set forth on the cover of this prospectus. Except as disclosed in the footnotes to this table and subject to applicable community property laws, we believe that each stockholder identified in the table possesses sole voting and investment power over all shares of common stock shown as beneficially owned by the stockholder. Unless otherwise indicated in the table or footnotes below, the address for each beneficial owner is c/o Advanced Disposal Services, Inc., 90 Fort Wade Road, Ponte Vedra, FL 32081.
| |
Shares Beneficially Owned Prior to This Offering (1) |
Shares Beneficially Owned After This Offering Assuming No Exercise of Option to Purchase Additional Shares |
Shares Beneficially Owned After This Offering Assuming Full Exercise of Option to Purchase Additional Shares |
||||||||||||||||
|---|---|---|---|---|---|---|---|---|---|---|---|---|---|---|---|---|---|---|---|
Name
|
Number | Percent | Number | Percent | Number | Percent | |||||||||||||
5% stockholders |
|||||||||||||||||||
Star Atlantic Waste Holdings, L.P. (2) |
43,047,889 | 65.12 | % | 43,047,889 | 50.43 | % | 43,047,889 | 48.78 | % | ||||||||||
BTG (3) |
4,742,530 | 7.17 | % | 4,742,530 | 5.56 | % | 4,742,530 | 5.37 | % | ||||||||||
CPPIB (4) |
15,297,328 | 23.14 | % | 15,297,328 | 17.92 | % | 15,297,328 | 17.34 | % | ||||||||||
Our named executive officers |
|||||||||||||||||||
Richard Burke |
522,025 | * | 522,025 | * | 522,025 | * | |||||||||||||
Steven R. Carn |
431,142 | * | 431,142 | * | 431,142 | * | |||||||||||||
John Spegal |
11,117 | * | 11,117 | * | 11,117 | * | |||||||||||||
Michael K. Slattery |
7,609 | * | 7,609 | * | 7,609 | * | |||||||||||||
William Westrate |
6,473 | * | 6,473 | * | 6,473 | * | |||||||||||||
All directors and executive officers as a group |
985,530 | 1.49 | % | 985,530 | 1.15 | % | 985,530 | 1.12 | % | ||||||||||
- *
- Represents less than 1%.
- (1)
- Beneficial ownership by Star Atlantic Waste Holdings, L.P. ("Star Atlantic"), CPPIB and BTG reflects the completion of the Reorganization, including the dissolution of Star Atlantic Waste
145
Holdings II, L.P., and an allocation of shares assuming a price per share at the mid-point of the range set forth on the cover of this prospectus. An increase or decrease in the price per share from the mid-point of the proposed range will result in a reallocation of shares among the stockholders in order to satisfy the preferred conversion formula in Parent's Certificate of Incorporation. Assuming a price per share at the top end of the range, Star Atlantic, CPPIB and BTG would beneficially own 43,969,891, 14,204,663 and 4,884,226 shares, respectively. Assuming a price per share at the bottom end of the range, Star Atlantic, CPPIB and BTG would beneficially own 41,972,219, 16,572,106 and 4,577,217 shares respectively. Reallocation of shares among the remaining stockholders would not result in a material change to their respective ownership or ownership percentages.
- (2)
- Star
Atlantic is a limited partnership for which Star Atlantic GP, Inc. is the general partner. PineBridge Highstar (SPE) LLC ("PineBridge") serves as the
general partner of Star Atlantic GP, Inc. and, accordingly, Star Atlantic GP, Inc. and PineBridge may be deemed to beneficially own the shares owned of record by Star Atlantic. PineBridge has
delegated management authority for Star Atlantic GP, Inc. to Highstar Capital LP, which also serves as the investment manager for Star Atlantic. Highstar Capital LP is controlled by Christopher Lee,
Michael Miller, John Stokes, Christopher Beall and Scott Litman and, in such capacities, these individuals may be deemed to share beneficial ownership of the shares beneficially owned by Star
Atlantic. Such individuals expressly disclaim any such beneficial ownership in shares of Common Stock. The principal business address of each of the entities and persons identified in this and the
paragraph above is Highstar Capital, 277 Park Avenue, 45th floor, New York, New York 10172.
- (3)
- BTG
is wholly owned by Banco BTG Pactual S.A.—Cayman Islands Branch ("Cayman Branch"). Cayman Branch is a branch of Banco BTG
Pactual S.A. (the "Bank") duly incorporated in the Cayman Islands. The Bank is directly controlled by BTG Pactual Holding S.A. ("Holdings") which in turn is directly controlled by BTG
Pactual G7 Holding S.A. ("G7"). As a consequence, G7 is the indirect controller of the Bank. G7 is controlled and wholly owned by Marcelo Kalim, Roberto Balls Sallouti, James Marcos de
Oliveira, Guilherme da Costa Paes, Persio Arida, Renato Monteiro dos Santos and Antonio Carlos Canto Porto Filho. The principal business address of Cayman Branch is Butterfield House, 68 Fort Street,
Grand Cayman Islands, Cayman Islands. The principal business address of the Bank is Praia de Botafogo, 501, 5th Floor, 22250-040, City and State of Rio de Janeiro, Brazil. The principal business
address of Holdings is Av. Brigadeiro Faria Lima, 3477, 14th Floor, part, Itaim Bibi, City and State of São Paulo, 04538-133, Brazil. The principal business address of G7 is Praia de
Botafogo, 501, 5th Floor, 22250-040, City and State of Rio de Janeiro, Brazil. The principal business address of Marcelo Kalim, Roberto Balls Sallouti, James Marcos de Oliveira, Guilherme da Costa
Paes, Persio Arida, Renato Monteiro dos Santos and Antonio Carlos Canto Porto Filho is Av. Brigadeiro Faria Lima, 3477, 14th Floor, Itaim Bibi, City and State of São Paulo, 04538-133,
Brazil.
- (4)
- CPPIB is overseen by a board of directors. Because the board of directors acts by consensus/majority approval, none of the directors of the board of directors has sole voting or dispositive power with respect to the shares of our common stock beneficially owned by CPPIB. The address of CPPIB is One Queen Street East, Suite 2500, Toronto, ON, M5C 2W5.
146
CERTAIN RELATIONSHIPS AND RELATED PARTY TRANSACTIONS
Promissory Notes Relating to Exercise of Parent Stock Options
On December 31, 2008, Charles Appleby, Steven Carn, Mary O'Brien, Steven Del Corso and Christian Mills, then executive officers of Parent, issued to Parent promissory notes in an aggregate principal amount of approximately $20 million in connection with the exercise of stock options by such officers. Each of the borrowers pledged the shares purchased with the proceeds of the full recourse notes as collateral for the notes. The promissory notes accrued interest semi-annually at a rate of 2.83% through November 19, 2012 and .89% from November 20, 2012 and thereafter, which is payable on the due date of the notes.
The maturity of the promissory note with Mr. Appleby is subject to provisions of his redemption agreement. All other loans mature at the earlier of six years from the date of re-issuance on November 20, 2012, upon termination of employment or upon sale of stock. See "Executive Compensation—Summary of Employment Agreements" for repayment provisions.
The loan amounts consisting of unpaid principal and interest as of December 31, 2015 are as follows: Mr. Appleby for $7.2 million; Mr. Carn for $5.4 million, Mr. Del Corso for $2.2 million, Ms. Mills for $0.7 million and Ms. O'Brien for $4.3 million. The loans were distributed by ADS Inc. to Parent, the parent company of the Issuer, in November 2012. The loans are not obligations of ours or any of our subsidiaries. A separate loan was made to Mr. Burke in 2012 in connection with his purchase of stock of Parent in the amount of $0.3 million and forgiven in fiscal 2014 in connection with his appointment as CEO.
In February 2016, the loans outstanding to Mr. Carn, Ms. O'Brien, and Mr. Del Corso were net settled by taking back shares of Parent common stock with a value equal to the amount of the loan plus additional amounts to cover estimated capital gains tax. For purposes of the net settlement, Parent common stock was attributed the same per share value that we are using in connection with the preparation of our 2015 audited financial statements which was based on a third party valuation. This valuation is performed annually in connection with impairment testing and in connection with setting strike prices for compensatory options.
Employment Relationships
Certain related party employment relationships exist within the Company. Two of Mr. Appleby's immediate family members are employed by us and total compensation, excluding stock options granted for fiscal 2015 was $141,734 and $165,682, respectively. They were awarded options during 2015 with a fair market value of $10,053 and $6,568. See "Executive Compensation—Summary of NEO Employment Agreements" for a description of stock repurchase plans with certain named NEOs.
Our Policy Regarding Related Party Transactions
We approved a formal approval policy for related party transactions on June 12, 2015, which became effective on June 30, 2015. It is our policy to review transactions with parties meeting the definition of a "related-party" within the scope of the authoritative guidance set forth in the FASB Accounting Standards Codification ("ASC") 850—Related Party Disclosures (and other applicable SEC guidance) for the identification and disclosure of related-party transactions.
We require that all potential related party transactions be evaluated based on business case and for the potential financial impact. Potential related party transactions must be brought to the attention of the CEO and/or CFO and must be approved in writing prior to
147
entering into the transaction. Related party transactions with officers and management directors other than the CEO or of the Company greater than $50,000 must be approved by the CEO. For any related party transactions greater than $50,000 involving the CEO, a member of the board of directors who is not also an Executive Officer of the Company or minority shareholder who is not a member of management, written approval of the transaction must be obtained from the board of directors.
Stockholders' Agreement
In connection with our initial public offering, we expect to enter into a stockholders' agreement with Highstar Capital or an affiliate or affiliates of Highstar Capital, CPPIB or an affiliate or affiliates of CPPIB and BTG or an affiliate or affiliates of BTG. This agreement will grant Highstar Capital the right to nominate to our board of directors a number of designees equal to: (i) at least a majority of the total number of directors comprising our board of directors, at such time, as long as Highstar Capital and its affiliates beneficially own at least 50% of the shares of our common stock; (ii) at least 40% of the total number of directors comprising our board of directors at such time as long as Highstar Capital and its affiliates beneficially own at least 40% but less than 50% of the shares of our common stock; (iii) at least 30% of the total number of directors comprising our board of directors at such time as long as Highstar Capital and its affiliates beneficially own at least 30% but less than 40% of the shares of our common stock; (iv) at least 20% of the total number of directors comprising our board of directors at such time as long as Highstar Capital and its affiliates beneficially own at least 20% but less 30% of the shares of our common stock; and (v) at least 10% of the total number of directors comprising our board of directors at such time as long as Highstar Capital and its affiliates beneficially own at least 5% but less than 20% of the shares of our common stock. For purposes of calculating the number of directors that Highstar Capital is entitled to nominate pursuant to the formula outlined above, any fractional amounts would be rounded up to the nearest whole number (e.g., one and one quarter directors shall equate to two directors) and the calculation would be made on a pro forma basis after taking into account any increase in the size of our board of directors.
This agreement will also grant to each of CPPIB and BTG the right to nominate to our Board of Directors one designee, as long as CPPIB, and its affiliates, or BTG, and its affiliates, as applicable collectively beneficially own at least 5% of the outstanding shares of our common stock.
In addition, in the event a vacancy on the board of directors is caused by the death, retirement or resignation of a Highstar Capital, CPPIB or BTG director-designee, Highstar Capital, CPPIB or BTG, or their affiliates, as applicable, to the fullest extent permitted by law, have the right to have the vacancy filled by a new director-designee of Highstar Capital, CPPIB or BTG, as applicable.
Registration Rights Agreement
In connection with this offering, we expect to enter into a registration rights agreement with certain affiliates of Highstar Capital, CPPIB and BTG and certain other investors and members of management. This agreement will provide to Highstar Capital an unlimited number of "demand" registrations for the registration of the sale of our common stock in a minimum aggregate amount of $50 million. Additionally the agreement will provide CPPIB with two "demand" registrations on Form S-1 and unlimited "demand" registrations on Form S-3 and to Highstar Capital, CPPIB, BTG and such other investors and members of management party thereto, customary "piggyback" registration rights. The registration rights agreement will also provide that we will pay certain expenses relating to such registrations
148
and indemnify Highstar Capital, CPPIB, BTG and such other investors and the members of management party thereto against certain liabilities which may arise under the Securities Act.
Merger Agreement
Immediately prior to the consummation of this offering, we will enter into a merger agreement with Parent pursuant to which, among other things, (i) Parent will merge with and into the Company, with the Company surviving the merger; (ii) shares of common stock and preferred stock of Parent will be converted into the right to receive shares of common stock of the Company in accordance with conversion ratios and a recapitalization schedule in the Merger Agreement; and (iii) existing options and obligations of Parent will become options and obligations of the Company, and the options will be adjusted to reflect the common share exchange ratio in the Merger Agreement.
Compensation Arrangements of Charles Appleby
For information regarding the arrangements pursuant to which Mr. Appleby receives compensation from the Company, see "Executive Compensation—Compensation Arrangements of Charles Appleby."
CPPIB Participation
Prior to becoming an investor in us, CPPIB acquired, in the ordinary course of business, a participation of approximately $37 million in our Revolving Credit Facility.
149
DESCRIPTION OF CERTAIN INDEBTEDNESS
The following is a summary of provisions relating to our material indebtedness. The following summary does not purport to be complete and is subject to, and qualified in its entirety by reference to, the provisions of the corresponding agreements, including the definitions of certain terms therein that are not otherwise defined in this prospectus.
Senior Secured Credit Facilities
In October 2012, we entered into (i) a $1,800.0 million Term Loan B and (ii) a $300.0 million Revolving Credit Facility with Deutsche Bank Trust Company Americas, as administrative agent, and affiliates of Barclays Capital Inc., Deutsche Bank Securities Inc., Macquarie Capital (USA) Inc., UBS Securities LLC and Credit Suisse Securities (USA) LLC, and other lenders from time to time party thereto and effected re-pricing transactions on the Term Loan B in February 2014 and February 2013, that reduced the applicable interest rate floor by 50 basis points and the applicable margin by 100 basis points, respectively. We paid down $63.5 million $33.0 million and $18.0 million, during the years ended December 31, 2015, 2014 and 2013, respectively, of the Term Loan B. See Note 13, Long-Term Debt, to our audited consolidated financial statements and Note 4, Debt, to our unaudited condensed consolidated financial statements, each included elsewhere in this prospectus for additional details regarding our Senior Secured Credit Facilities. The Term Loan B matures in October 2019. The Revolving Credit Facility matures in October 2019, as described further below under "—Amendments to the Senior Secured Credit Facilities."
Borrowings under our Senior Secured Credit Facilities can be used for working capital, capital expenditures, acquisitions and other general corporate purposes. As of June 30, 2016 and December 31, 2015, we had $11.0 million and $32.0 million outstanding under our $300.0 million Revolving Credit Facility, respectively. The agreement governing our Senior Secured Credit Facilities requires us to comply with certain financial and other covenants, including a total leverage ratio for the benefit of the lenders under the Revolving Credit Facility that is applicable when there are outstanding loans or letters of credit under the Revolving Credit Facility. Compliance with these covenants is a condition to any incremental borrowings under our Senior Secured Credit Facilities and failure to meet these covenants would enable the lenders to require repayment of any outstanding loans (which would adversely affect our liquidity). As of June 30, 2016, we were in compliance with the covenants under the Senior Secured Credit Facilities. Our ability to maintain compliance with our covenants will be highly dependent on our results of operations and, to the extent necessary, our ability to implement remedial measures such as reductions in operating costs.
We are subject to the following total leverage ratio covenant for the applicable periods as indicated.
| |
Maximum Total Leverage Ratio |
|||
|---|---|---|---|---|
December 31, 2015 through December 31, 2016 |
6.50:1.00 | |||
January 1, 2017 through June 30, 2017 |
6.25:1.00 | |||
July 1, 2017 through September 30, 2017 |
6.125:1.00 | |||
October 1, 2017 and thereafter |
6.00:1.00 | |||
Our total leverage ratio for purposes of compliance with the covenant in our Senior Secured Credit Facilities is the ratio of total consolidated debt on any date to Adjusted EBITDA for the four consecutive fiscal quarters most recently ended on or prior to such date. The actual total leverage ratio as of June 30, 2016, December 31, 2015 and December 31, 2014 was 6.02:1:00, 6.11:1.00 and 6.12:1.00, respectively.
150
Amendments to the Senior Secured Credit Facilities
On February 4, 2016, we obtained lender consent for certain amendments to our Senior Secured Credit Facilities, the effectiveness of which is conditioned on the consummation of this offering and a minimum Term Loan B paydown of $100.0 million. The proposed amendments include the (i) extension of the maturity of the Revolving Credit Facility to October 2019; (ii) removal of the Parent guarantee and share pledge to streamline post-IPO financial reporting; (iii) reduction of maximum total leverage ratios by 0.25x and certain other favorable changes to baskets and definitions; and (iv) an amendment to the definition of Adjusted EBITDA to exclude unrealized and realized losses/gains on fuel derivatives. In connection with the amendment to our Senior Secured Credit Facilities, we paid total fees of approximately $5.2 million, which were paid to the lenders and the administrative agent, at the closing of the consent.
On August 4, 2016, we entered into a waiver to our Senior Secured Credit Facilities to waive the IPO condition to the extension of the maturity of the commitments under our Senior Secured Credit Facilities. As a result of the execution of the amendment and waiver, the maturity date with respect to approximately $280 million of the $300 million of commitments under the Revolving Credit Facility has been extended to October 2019.
81/4% Senior Notes due 2020
On October 9, 2012, we issued $550 million aggregate principal amount of 81/4% Senior Notes due 2020 pursuant to the Indenture between us and Wells Fargo Bank, National Association, as trustee (the "2020 Notes"). In December 2013, we exchanged all of the outstanding notes for registered notes with identical terms. As of June 30, 2016, we were in compliance with the covenants under the Indenture. See Note 13, Long-Term Debt, to our audited consolidated financial statements and Note 4, Debt, to our unaudited condensed consolidated financial statements for additional details regarding the notes.
Interest on the 2020 Notes is payable on April 1 and October 1 of each year. The 2020 Notes will mature on October 1, 2020. The 2020 Notes are redeemable at the applicable redemption prices set forth in the applicable indenture, plus accrued and unpaid interest. The indenture governing the 2020 Notes limits any increase in our secured indebtedness (other than certain forms of secured indebtedness expressly permitted under the indentures) and limits our incurrence of additional indebtedness.
The Indenture governing the 2020 Notes contains covenants that, among other things, restrict our ability to incur additional indebtedness and issue preferred stock, pay dividends or make other distributions with respect to any equity interests, make certain investments or other restricted payments, create liens, sell assets, incur restrictions on the ability of our restricted subsidiaries to pay dividends or make other payments to us, consolidate or merge with or into other companies or transfer all or substantially all of their assets, engage in transactions with affiliates, and enter into sale and leaseback transactions.
151
The following is a description of the material terms and provisions of our common stock and preferred stock, our certificate of incorporation and bylaws, as they will be in effect upon completion of this offering. For more complete information, you should read our certificate of incorporation and bylaws, copies of which are or will be filed with the SEC as exhibits to the registration statement, of which this prospectus is a part.
Authorized Capitalization
Upon completion of this offering and the Reorganization, our authorized capital stock will consist of 1,000,000,000 shares of common stock, par value $0.01 per share, and 100,000,000 shares of preferred stock, par value $0.01 per share. Immediately following the Reorganization but prior to the completion of this offering, we will have outstanding 64,493,542 shares of common stock. Assuming the issuance of 19,250,000 shares of common stock in this offering to be sold by us, there will be 83,743,542 shares of our common stock outstanding upon completion of this offering, and no shares of preferred stock will be outstanding.
Common Stock
Voting Rights
Holders of common stock are entitled to one vote for each share held of record on all matters submitted to a vote of the stockholders, including the election of directors. There will be no cumulative voting in the election of directors, which means that holders of a majority of the outstanding shares of common stock will be able to elect all of the directors, and holders of less than a majority of such shares will be unable to elect any director.
Dividends
Under our certificate of incorporation, subject to preferences that may be applicable to any outstanding shares of preferred stock, holders of common stock are entitled to receive such dividends, if any, as may be declared from time to time by our board of directors out of funds legally available for dividend payments. The Senior Secured Credit Facilities and the indentures governing the Senior Notes impose restrictions on our ability to declare dividends on our common stock.
Preemptive Rights
The holders of common stock have no preferences or rights of conversion, exchange, pre-emption or other subscription rights.
In the event that we grant any preemptive rights with respect to our common stock to any person, Highstar, BTG, and CPPIB, and their affiliates, as applicable, so long as they have the right to nominate a designee to our board, shall be entitled to preemptive rights no less favorable than those granted to such person.
Redemption or Sinking Fund
There are no redemption or sinking fund provisions applicable to the common stock.
152
Liquidation or Dissolution
In the event of any liquidation, dissolution or winding-up of our affairs, holders of common will be entitled to our assets that are remaining after payment or provision for payment of all of our debts and obligations and after liquidation payments to holders of outstanding shares of preferred stock, if any.
Preferred Stock
Upon the completion of this offering there will be 100,000,000 shares of authorized preferred stock which, if issued, would have priority over the common stock with respect to dividends and other distributions, including the distribution of our assets upon liquidation. Unless required by law or by the NYSE, our board of directors will have the authority without further stockholder authorization to issue from time to time shares of preferred stock in one or more series and to fix the terms, limitations, relative rights and preferences and variations of each series. Although we have no present plans to issue any shares of preferred stock, the issuance of shares of preferred stock, or the issuance of rights to purchase such shares, could decrease the amount of earnings and assets available for distribution to the holders of common stock, could adversely affect the rights and powers, including voting rights, of the common stock and could have the effect of delaying, deterring or preventing a change in control of us or an unsolicited acquisition proposal.
Limitations on Directors' Liability
Our certificate of incorporation and bylaws contain provisions indemnifying our directors and officers to the fullest extent permitted by law. Prior to the completion of this offering, we entered into indemnification agreements with each of our directors which, in some cases, are broader than the specific indemnification provisions contained under Delaware law.
In addition, as permitted by Delaware law, our certificate of incorporation provides that no director will be liable to us or our stockholders for monetary damages for breach of fiduciary duty as a director. The effect of this provision is to restrict our rights and the rights of our stockholders in derivative suits to recover monetary damages against a director for breach of fiduciary duty as a director, except that a director will be personally liable for:
- •
- any breach of his or her duty of loyalty to us or our stockholders;
- •
- acts or omissions not in good faith which involve intentional misconduct or a knowing violation of law;
- •
- the payment of dividends or the redemption or purchase of stock in violation of Delaware law; or
- •
- any transaction from which the director derived an improper personal benefit.
This provision does not affect a director's liability under the federal securities laws.
To the extent our directors, officers and controlling persons are indemnified under the provisions contained in our certificate of incorporation, our bylaws, Delaware law or contractual arrangements against liabilities arising under the Securities Act, we have been advised that in the opinion of the SEC such indemnification is against public policy as expressed in the Securities Act and is therefore unenforceable.
153
Registration Rights
Pursuant to the terms of a Registration Rights Agreement to be entered into immediately prior to the offering, Highstar Capital and certain other pre-IPO shareholders will be entitled to rights with respect to the registration of their shares of our common stock under the Securities Act. See "Certain Relationships and Related Party Transactions."
Corporate Opportunity
The Delaware General Corporation Law (the "DGCL") permits corporations to adopt provisions that renounce any interest or expectancy in, or any offer of an opportunity to participate in, specified business opportunities that are presented to the corporation or one or more of its officers, directors or stockholders. In recognition that our directors and officers may serve as (i) directors, officers and/or employees of Highstar Capital and its affiliates or CPPIB and its affiliates or (ii) as directors, officers and/or employees of other businesses engaged in designing, developing, providing services to, managing, owning or investing in waste management companies ("Dual Role Persons"), our certificate of incorporation will provide for the allocation of certain corporate opportunities between us and the Dual Role Persons. Specifically, none of the Dual Role Persons will have any duty to refrain from engaging directly or indirectly in the same or similar business activities or lines of business that we do. In the event that a Dual Role Person acquires knowledge of a potential transaction or matter outside of his or her capacity as a director of Advanced Disposal which may be a corporate opportunity, we will not have any expectancy in such corporate opportunity, and the Dual Role Person will not have any duty to present such corporate opportunity to us and may pursue or acquire such corporate opportunity for himself/herself or direct such opportunity to another person. A corporate opportunity that a Dual Role Person acquires knowledge of will not belong to us unless the corporate opportunity at issue is expressly offered to such person solely in his or her capacity as a director or officer of ours. In addition, even if a business opportunity is presented to a Dual Role Person, the following corporate opportunities will not belong to us: (1) those we are not financially able, contractually permitted or legally able to undertake; (2) those not in our line of business; (3) those of no practical advantage to us; and (4) those in which we have no interest or reasonable expectancy.
Anti-Takeover Provisions
In addition to the majority voting rights that Highstar Capital and its affiliates will have upon completion of this offering as a result of its ownership of our common stock, some provisions of Delaware law contain, and our certificate of incorporation and our bylaws described below will contain, a number of provisions which may have the effect of encouraging persons considering unsolicited tender offers or other unilateral takeover proposals to negotiate with our board of directors rather than pursue non-negotiated takeover attempts, which we believe may result in an improvement of the terms of any such acquisition in favor of our stockholders. However, these provisions will also give our board of directors the power to discourage acquisitions that some stockholders may favor.
Delaware Law
Upon the completion of this offering, we will be governed by the provisions of Section 203 of the DGCL regulating corporate takeovers. This section prevents some Delaware corporations from engaging, under some circumstances, in a business combination, which includes a merger or sale of at least 10% of the corporation's assets with any interested stockholder, meaning a stockholder who, together with affiliates and associates, owns or,
154
within three years prior to the determination of interested stockholder status, did own 15% or more of the corporation's outstanding voting stock, unless:
- •
- the transaction is approved by the board of directors prior to the time that the interested stockholder became an interested
stockholder;
- •
- upon consummation of the transaction which resulted in the stockholder's becoming an interested stockholder, the interested
stockholder owned at least 85% of the voting stock of the corporation outstanding at the time the transaction commenced, excluding stock owned by directors who are also officers of the corporation;
or
- •
- subsequent to such time that the stockholder became an interested stockholder, the business combination is approved by the board of directors and authorized at an annual or special meeting of stockholders by at least two-thirds of the outstanding voting stock which is not owned by the interested stockholder.
A Delaware corporation may "opt out" of these provisions with an express provision in its original certificate of incorporation or an express provision in its certificate of incorporation or bylaws resulting from a stockholders' amendment approved by at least a majority of the outstanding voting shares. We have not opted out of these provisions. As a result, mergers or other takeover or change in control attempts of us may be discouraged or prevented.
Certificate of Incorporation and Bylaw Provisions
Our certificate of incorporation and our bylaws include a number of provisions that could deter hostile takeovers or delay or prevent changes in control of our company, some of which are effective today and others of which will become effective after such time when Highstar Capital and its affiliates (other than Parent) collectively cease to beneficially own common shares representing at least 50% of the total voting power of the Company, including the following:
- •
- Number of Directors; Removal; Vacancies. Our certificate
of incorporation provides that the number of our directors can be increased or decreased by the board of directors without shareholder approval. Directors may be removed, with or without cause, by a
vote of the majority of shares entitled to vote until Highstar Capital and its affiliates (other than Parent) collectively cease to beneficially own common shares representing at least 50% of the
total voting power of our common stock, after which a director may be removed only for cause by a majority of shares entitled to vote. Vacancies on the board of directors may be filled only by the
affirmative vote of a majority of the remaining directors then in office and not by the stockholders. These provisions will prevent a stockholder from increasing the size of our board of directors and
gaining control of our board of directors by removing directors and filling the resulting vacancies with its own nominees.
- •
- Classified Board of Directors. Our board of directors
will be classified into three classes of approximately equal size, each of which will hold office for a staggered three-year term. The existence of a classified board of directors could delay a
successful tender offer or from obtaining majority control of our board of directors, and the prospect of that delay might deter a potential offeror.
- •
- Stockholder Action. Pursuant to Section 228 of the DGCL, until such time as Highstar Capital and its affiliates (other than Parent) collectively ceases to beneficially own 50% or more of voting power of our common stock, any action required to be taken at any annual or special meeting of our stockholders may be taken without a meeting, without prior notice and without a vote if a consent or consents in writing, setting forth the
155
- •
- Special Meetings of Stockholders. Our certificate of
incorporation will provide that a special meeting of stockholders may be called only by our board of directors by a resolution adopted by the affirmative vote of a majority of the total number of
directors then in office.
- •
- Advance Notice Requirements for Stockholder Proposals and Director
Nominations. Our bylaws provide advance notice procedures for stockholders seeking to bring business before our annual meeting of
stockholders, or to nominate candidates for election as directors at any meeting of stockholders. Our bylaws also specify certain requirements regarding the form and content of a stockholder's notice.
These provisions may preclude our stockholders from bringing matters before our annual meeting of stockholders or from making nominations for directors at our meetings of stockholders. Under these
provisions, a timely notice must be received at our principal executive office not later than the close of business on the 90th day nor earlier than the close of business on the 120th day prior to the
first anniversary of the previous year's annual meeting of stockholders, or in the case of a special meeting of the stockholders, not earlier than the 120th day prior to such special meeting and not
later than the close of business on the later of the 90th day before such special meeting or the 10th day following the day on which public announcement of the date of such meeting is first made.
- •
- No Cumulative Voting. The DGCL provides that
stockholders are not entitled to the right to cumulate votes in the election of directors unless a corporation's certificate of incorporation provides otherwise. Our certificate of incorporation and
bylaws do not provide for cumulative voting.
- •
- Issuance of Undesignated Preferred Stock. Our board of
directors has the authority, without further action by the stockholders, to issue undesignated preferred stock with rights and preferences, including voting rights, designated from time to time by the
board of directors. The existence of authorized but unissued shares of preferred stock enables our board of directors to render more difficult or to discourage an attempt to obtain control of us by
means of a merger, tender offer, proxy contest, or otherwise.
- •
- Amendments. Our board of directors will have the power to make, alter, amend, change or repeal our bylaws or adopt new bylaws by the affirmative vote of a majority of the total number of directors then in office. Our certificate of incorporation provides that for as long as Highstar Capital and its affiliates (other than Parent) collectively beneficially own common shares representing at least 50% of the total voting power of our common stock, in addition to any vote required by applicable law, certain provisions in our certificate of incorporation may be amended, altered, repealed or rescinded by the affirmative vote of the holders of a majority in voting power of all the then outstanding shares of stock of our company entitled to vote thereon, voting together as a single class. At any time when Highstar Capital and its affiliates (other than Parent) collectively cease to beneficially own common shares representing at least 50% of the total voting power of our common stock, the certain provisions in our certificate of incorporation may be amended, altered, repealed or rescinded only by the affirmative vote of the
action so taken, is signed by the holders of outstanding stock having not less than the minimum number of votes that would be necessary to authorize or take such action at a meeting at which all shares of our stock entitled to vote thereon were present and voted. After such time as Highstar Capital and its affiliates (other than Parent) collectively cease to beneficially own 50% or more of voting power of our common stock, our stockholders will not be permitted to take action by written consent.
156
holders of at least two thirds in voting power of all outstanding shares of stock of our company entitled to vote thereon, voting together as a single class, including the provisions providing for a classified board of directors (the election and term of our directors).
Listing
Our common stock has been approved for listing on the NYSE under the symbol ADSW.
Transfer Agent and Registrar
The transfer agent and registrar for our common stock will be Wells Fargo Bank, National Association.
157
SHARES ELIGIBLE FOR FUTURE SALE
Prior to this offering, there has not been any public market for our common stock, and a significant public market for our common stock may not develop or be sustained after this offering. We cannot predict what effect, if any, sales of shares of our common stock or the availability of shares of our common stock for sale will have on the prevailing market price of our common stock from time to time. The number of shares of our common stock available for future sale into the public markets is subject to legal and contractual restrictions, some of which are described below. The expiration of these restrictions will permit sales of substantial amounts of our common stock in the public market or could create the perception that these sales could occur, which could adversely affect the market price for our common stock and could make it more difficult for us to raise capital through the sale of our equity or equity-related securities at a time and price that we deem acceptable.
Upon the completion of this offering, we expect to have a total of 83,743,542 shares of our common stock outstanding, assuming no exercise of the underwriters' option to purchase additional shares of common stock from us. All of the shares of our common stock sold in this offering will be freely tradable without restriction or further registration under the Securities Act, except for shares held by persons who may be deemed our "affiliates," as that term is defined under Rule 144 of the Securities Act. An "affiliate" is a person that directly, or indirectly through one or more intermediaries, controls or is controlled by us or is under common control with us. The remaining shares will be "restricted securities" within the meaning of Rule 144 and subject to certain restrictions on resale following the consummation of this offering. Restricted securities may be sold in the public market only if they are registered under the Securities Act or are sold pursuant to an exemption from registration such as Rule 144.
Rule 144
In general, pursuant to Rule 144 under the Securities Act in effect on the date of this prospectus, once we have been subject to public company reporting requirements for at least 90 days, a person who is not one of our affiliates at any time during the 90 days preceding a sale and who has beneficially owned the shares of our common stock to be sold for at least six months, including the holding period of any prior owner other than our affiliates, would be entitled to sell those shares without complying with the manner of sale, volume limitation or notice provisions of Rule 144, subject to compliance with the public information requirements of Rule 144. In addition, under Rule 144, a person who is not one of our affiliates at any time during the 90 days preceding a sale, and who has beneficially owned the shares of our common stock to be sold for at least one year, including the holding period of any prior owner other than our affiliates, would be entitled to sell those shares without regard to the requirements of Rule 144. Our affiliates or persons selling on behalf of our affiliates are entitled to sell, upon expiration of the lock-up agreements described below, within any three-month period beginning 90 days after the date of this prospectus, a number of shares that does not exceed the greater of:
- •
- 1.0% of the number of shares of common stock then outstanding, which is approximately 837,435 shares of common stock upon the
completion of this offering assuming the underwriters do not exercise their option to purchase additional shares; and
- •
- the average weekly trading volume of our common stock on the NYSE during the four calendar weeks preceding each such sale, subject to certain restrictions.
158
Sales under Rule 144 by our affiliates or persons selling on behalf of our affiliates are also subject to manner of sale provisions and notice requirements and to the availability of current public information about us. Rule 144 also provides that affiliates relying on Rule 144 to sell shares of our common stock that are not restricted shares must nonetheless comply with the same restrictions applicable to restricted shares, other than the holding period requirement.
Lock-up Agreements
We and all of our directors and executive officers, as well as affiliates of Highstar Capital and substantially all of our other existing shareholders have agreed with the underwriters not to sell or otherwise transfer or dispose of any shares of our common stock, subject to specified exceptions, during the period from the date of this prospectus continuing through the date that is 180 days after the date of this prospectus, subject to an extension in certain circumstances, except with the prior written consent of Deutsche Bank Securities Inc., Credit Suisse Securities (USA) LLC and Barclays Capital Inc. See "Underwriting" for a description of the terms of the lock-up agreements.
Shares Issued Under Future Plans
We will file a registration statement on Form S-8 under the Securities Act to register common stock issuable under the Amended 2012 Plan and the 2016 Plan. Shares registered under any such registration statement would be available for sale in the public market following the effective date, unless such shares are subject to vesting restrictions with us, Rule 144 restrictions applicable to our affiliates, or the lock-up agreements described above.
159
MATERIAL U.S. FEDERAL INCOME TAX CONSEQUENCES TO NON-U.S. HOLDERS OF OUR
COMMON STOCK
The following is a summary of the material U.S. federal income tax consequences to Non-U.S. Holders (as defined below) associated with the purchase, ownership and disposition of our common stock, but does not purport to be a complete analysis of all the potential tax considerations relating thereto. This summary is based upon the provisions of the Internal Revenue Code of 1986, as amended (the "Code"), Treasury regulations promulgated thereunder ("Treasury Regulations"), administrative rulings and judicial decisions, all as of the date hereof. These authorities may be changed, possibly retroactively, and any changes may result in U.S. federal income tax consequences different from those set forth below. We have not sought any ruling from the Internal Revenue Service (the "IRS") with respect to the statements made and the conclusions reached in the following summary. The authorities on which this discussion is based are subject to various interpretations and there can be no assurance that the IRS or the courts will agree with such statements and conclusions.
This summary also does not address the tax considerations arising under the laws of any state, local or non-U.S. jurisdiction or under U.S. federal gift and estate tax laws, except to the limited extent set forth below. This summary is limited to persons who hold our common stock as a capital asset for U.S. federal income tax purposes (within the meaning of section 1221 of the Code). In addition, because this section is a general summary, it does not address all aspects of taxation that may be relevant to particular shareholders in light of their personal investment or tax circumstances, or to certain types of shareholders that are subject to special treatment under the U.S. federal income tax laws, including, without limitation, brokers or dealers in securities, insurance companies, banks or other financial institutions, hybrid entities, regulated investment companies, real estate investment trusts, tax-exempt organizations or accounts, persons holding common stock as a part of a hedging, integrated, conversion transaction, straddle or other risk reduction transaction, traders in securities that elect to use a mark-to-market method of accounting for their securities holdings, persons subject to the alternative minimum tax or the Medicare tax on net investment income, entities or arrangements treated as partnerships for U.S. federal income tax purposes or investors in such entities, persons who acquired our common stock through the exercise of employee stock options or otherwise as compensation for services, certain former U.S. citizens or long-term residents, U.S. expatriates, "controlled foreign corporations" or "passive foreign investment companies" within the meaning of the Code, and persons deemed to sell our common stock under the constructive sale provisions of the Code.
Non-U.S. Holders are urged to consult their tax advisors with respect to the application of the U.S. federal income tax laws to their particular situations, as well as any tax consequences of the purchase, ownership and disposition of our common stock arising under the U.S. federal estate or gift tax rules or under the laws of any state, local, non-U.S. or other taxing jurisdiction or under any applicable tax treaty.
Non-U.S. Holder Defined
As used in this discussion, the term "Non-U.S. Holder" means a beneficial owner of our common stock that, for U.S. federal income tax purposes, is an individual, corporation, estate or trust and is not any of the following for U.S. federal income tax purposes:
- •
- an entity or arrangement treated as a partnership;
- •
- an individual who is a citizen or resident of the United States;
160
- •
- a corporation created or organized in the United States or under the laws of the United States or any state thereof or the District of
Columbia;
- •
- an estate whose income is subject to U.S. federal income tax regardless of its source; or
- •
- a trust (i) the administration of which is subject to the primary supervision of a U.S. court and that has one or more U.S. persons who have the authority to control all substantial decisions of the trust or (ii) that has a valid election in effect under applicable Treasury Regulations to be treated as a U.S. person.
Distributions
We do not anticipate making distributions on our common stock in the foreseeable future. However, if distributions of cash or property (other than certain pro rata stock distributions) are made to Non-U.S. Holders on shares of our common stock, such distributions generally will constitute dividends for U.S. federal income tax purposes to the extent paid from our current or accumulated earnings and profits, as determined under U.S. federal income tax principles. To the extent those distributions exceed both our current and our accumulated earnings and profits, they will constitute a return of capital and will first reduce a Non-U.S. Holder's basis in our common stock (determined separately with respect to each share of our common stock), but not below zero, and then will be treated as gain from the sale of that common stock as described below under "—Gain on Disposition of Our Common Stock."
Except as described in the next paragraph and subject to the discussion of FATCA, any dividend paid to a Non-U.S. Holder generally will be subject to U.S. federal withholding tax either at a rate of 30% of the gross amount of the dividend or such lower rate as may be specified by an applicable income tax treaty. In order to receive a reduced treaty rate, the Non-U.S. Holder must provide the applicable withholding agent in a timely manner a properly completed IRS Form W-8BEN or W-8BEN-E, whichever is applicable, or other appropriate version of IRS Form W-8, including a U.S. taxpayer identification number and certifying qualification for the reduced rate. A Non-U.S. Holder of shares of our common stock eligible for a reduced rate of U.S. federal withholding tax pursuant to an income tax treaty may obtain a refund of any excess amounts withheld by filing an appropriate claim for refund with the IRS in a timely manner. If the Non-U.S. Holder holds the common stock through a financial institution or other agent acting on the Non-U.S. Holder's behalf, the Non-U.S. Holder will be required to provide appropriate documentation to the agent, which then will be required to provide certification to the applicable withholding agent, either directly or through other intermediaries.
Dividends received by a Non-U.S. Holder that are effectively connected with its conduct of a U.S. trade or business (and, if an income tax treaty requires, that are attributable to a permanent establishment or fixed base maintained by the Non-U.S. Holder in the United States), are exempt from such withholding tax. In order to claim this exemption, the Non-U.S. Holder must provide the applicable withholding agent with a properly completed IRS Form W-8ECI or other applicable IRS Form W-8 properly certifying such exemption. Such effectively connected dividends, although not subject to U.S. federal withholding tax, generally are subject to U.S. federal income tax on a net income basis at applicable graduated U.S. federal income tax rates, net of certain deductions and credits, and generally in a manner applicable to U.S. persons. In addition, dividends received by a Non-U.S. Holder that is treated as a corporation for U.S. federal income tax purposes that are effectively connected with such Non-U.S. Holder's conduct of a U.S. trade or business may also, subject to certain
161
adjustments, be subject to a branch profits tax at a rate of 30% or such lower rate as may be specified by an applicable income tax treaty.
Gain on Disposition of Our Common Stock
Subject to the discussion of FATCA, Non-U.S. Holders generally will not be required to pay U.S. federal income tax, including by way of withholding, on any gain realized upon the sale or other disposition of our common stock unless:
- •
- the gain is effectively connected with the Non-U.S. Holder's conduct of a U.S. trade or business, and if an applicable income tax
treaty requires, is attributable to a U.S. permanent establishment or fixed base maintained by the Non-U.S. Holder in the United States;
- •
- the Non-U.S. Holder is an individual who is present in the United States for a period or periods aggregating 183 days or more
during the calendar year in which the sale or disposition occurs and certain other conditions are met; or
- •
- our common stock constitutes a U.S. real property interest by reason of our status as a "United States real property holding corporation" (a "USRPHC") for U.S. federal income tax purposes at any time during the shorter of the five-year period preceding the Non-U.S. Holder's disposition of, or the Non-U.S. Holder's holding period for, our common stock.
Generally, a corporation is a USRPHC if the fair market value of its U.S. real property interests (within the meaning of the Code and applicable Treasury Regulations) equals or exceeds 50% of the sum of the fair market value of its worldwide real property interests plus its other assets used or held for use in a trade or business. We believe that we are not currently a USRPHC and, based on our business plan and anticipated operations, do not expect to become a USRPHC in the future. However USRPHC status is an inherently factual determination that involves complex legal considerations. We have not sought an IRS ruling with respect to whether we are a USRPHC and we cannot give definitive assurance regarding our non-USRPHC status. Additionally, because the determination of whether we are a USRPHC depends on the fair market value of our U.S. real property interests relative to the fair market value of our other business assets, there can be no assurance that we will not become a USRPHC in the future. Even if we are or become a USRPHC, as long as our common stock is regularly traded on an established securities market (within the meaning of the Code and applicable Treasury Regulations), such common stock will be treated as a U.S. real property interest only if a Non-U.S. Holder actually or constructively holds more than 5% of such regularly traded common stock at any time during the shorter of the five-year period preceding the Non-U.S. Holder's disposition of, or the Non-U.S. Holder's holding period for, our common stock. Non-U.S. Holders should be aware that no prediction can be made as to whether our common stock will be regularly traded on an established securities market (within the meaning of the Code and applicable Treasury Regulations).
Non-U.S. Holders described in the first bullet above will be required to pay tax on the net gain derived from the sale under regular graduated U.S. federal income tax rates, and a corporate Non-U.S. Holder described in the first bullet above also may be subject to the branch profits tax at a 30% rate, or such lower rate as may be specified by an applicable income tax treaty. Individual Non-U.S. Holders described in the second bullet above will be required to pay a flat 30% tax on the gain derived from the sale, which gain may be offset by U.S.-source capital losses for that year. Non-U.S. Holders should consult any applicable income tax or other treaties that may provide for different rules.
162
U.S. Federal Estate Taxes
Our common stock beneficially owned or treated as beneficially owned by an individual who at the time of death is not a citizen or resident of the United States (as specifically defined for U.S. federal estate tax purposes), and certain lifetime transfers of an interest in common stock made by such an individual, will be included in his or her gross estate for U.S. federal estate tax purposes and, therefore, may be subject to U.S. federal estate tax, unless an applicable estate tax treaty provides otherwise.
Backup Withholding and Information Reporting
Generally, we must report annually to the IRS the amount of dividends paid to a Non-U.S. Holder, the Non-U.S. Holder's name and address, and the amount of U.S. federal income tax withheld, if any. A similar report will be sent to the Non-U.S. Holder. These information reporting requirements apply even if withholding was not required because the dividends were effectively connected to the conduct of a Non-U.S. Holder's trade or business within the United States or withholding was reduced or eliminated by an applicable income tax treaty. Pursuant to applicable income tax treaties or other agreements, the IRS may make these reports available to tax authorities in the Non-U.S. Holder's country of residence.
Payments of dividends on, or of proceeds from the disposition of, our common stock made to Non-U.S. Holders may be subject to additional information reporting and backup withholding unless the Non-U.S. Holder establishes an exemption, for example, by properly certifying its non-U.S. status on an IRS Form W-8BEN or W-8BEN-E, whichever is applicable, or another appropriate version of IRS Form W-8. Notwithstanding the foregoing, backup withholding and information reporting may apply if the applicable withholding agent has actual knowledge, or reason to know, that a holder claiming to be a Non-U.S. Holder is a U.S. person.
U.S. information reporting and backup withholding generally will not apply to a payment of proceeds of a disposition of common stock where the transaction is effected outside the United States through a non-U.S. office of a non-U.S. broker. However, information reporting requirements, but not backup withholding, generally will apply to such a payment if the broker is (i) a U.S. person; or (ii) a foreign person with certain U.S. connections, unless the broker has documentary evidence in its records that the holder is a Non-U.S. Holder and certain conditions are met or the holder otherwise establishes an exemption.
Backup withholding is not an additional tax; rather, the U.S. federal income tax liability of persons subject to backup withholding will be reduced by the amount of tax withheld. If withholding results in an overpayment of taxes, a refund or credit may generally be obtained from the IRS, provided that the required information is furnished to the IRS in a timely manner. Non-U.S. Holders should consult their own tax advisors regarding the application of backup withholding in their particular circumstances and the availability of and procedure for obtaining an exemption from backup withholding under current Treasury Regulations.
FATCA
Legislation commonly known as FATCA (under Sections 1471 to 1474 of the Code) generally will impose a U.S. federal withholding tax of 30% on dividends on and the gross proceeds of a disposition of our common stock paid to a "foreign financial institution" (as defined under FATCA and the applicable Treasury Regulations), unless such institution enters into an agreement with the U.S. government to withhold on certain payments and to collect and provide to the U.S. tax authorities substantial information regarding the U.S. account holders of such institution (which includes certain equity and debt holders of such institution,
163
as well as certain account holders that are foreign entities with U.S. owners) or otherwise establishes an exemption. The legislation also generally will impose a U.S. federal withholding tax of 30% on dividends on and the gross proceeds of a disposition of our common stock paid to a non-financial foreign entity unless such entity provides the applicable withholding agent with a certification identifying certain substantial direct and indirect U.S. owners of the entity, certifies that there are none or otherwise establishes an exemption. The withholding taxes described above will apply to any dividend payments on our common stock and, after December 31, 2018, to payments of gross proceeds from dispositions of our common stock. Under certain circumstances, a Non-U.S. Holder might be eligible for refunds or credits of such taxes. An intergovernmental agreement between the United States and an applicable foreign country may modify the requirements described in this paragraph. Prospective investors are urged to consult with their own tax advisors regarding the possible implications of this legislation on their investment in our common stock.
164
Subject to the terms and conditions of the underwriting agreement, the underwriters named below, through their representatives Deutsche Bank Securities Inc., Credit Suisse Securities (USA) LLC and Barclays Capital Inc., have severally agreed to purchase from us the following respective number of shares of common stock at a public offering price less the underwriting discounts and commissions set forth on the cover page of this prospectus:
Underwriters
|
Number of Shares |
|||
|---|---|---|---|---|
Deutsche Bank Securities Inc. |
||||
Credit Suisse Securities (USA) LLC |
||||
Barclays Capital Inc. |
||||
UBS Securities LLC |
||||
Merrill Lynch, Pierce, Fenner & Smith |
||||
Macquarie Capital (USA) Inc. |
||||
Morgan Stanley & Co. LLC |
||||
Stifel, Nicolaus & Company, Incorporated |
||||
SMBC Nikko Securities America, Inc. |
||||
First Analysis Securities Corporation |
||||
| | | | | |
Total: |
||||
The underwriting agreement provides that the obligations of the several underwriters to purchase the shares of common stock offered hereby are subject to certain conditions precedent and that the underwriters will purchase all of the shares of common stock offered by this prospectus, other than those covered by the option to purchase additional shares described below, if any of these shares are purchased. The underwriting agreement also provides that if an underwriter defaults, the purchase commitments of non-defaulting underwriters may also be increased or this offering may be terminated.
We have agreed to indemnify the underwriters against some specified types of liabilities, including liabilities under the Securities Act, and to contribute to payments the underwriters may be required to make in respect of any of these liabilities.
The underwriters are offering the shares, subject to prior sale, when, as and if issued to and accepted by them, subject to approval of legal matters by their counsel, including the validity of the shares, and other conditions contained in the underwriting agreement, such as the receipt by the underwriters of officer's certificates and legal opinions. The underwriters reserve the right to withdraw, cancel or modify offers to the public and to reject orders in whole or in part.
Commissions and Discounts
We have been advised by the representatives of the underwriters that the underwriters propose to offer the shares of common stock to the public at the public offering price set forth on the cover of this prospectus and to dealers at a price that represents a concession not in excess of $ per share under the public offering price. After the initial public offering, representatives of the underwriters may change the offering price and other selling terms. This offering of the shares of common stock by the underwriters is subject to receipt and acceptance and subject to the underwriters' right to reject any order in whole or in part.
165
The underwriting discounts and commissions per share are equal to the public offering price per share of common stock less the amount paid by the underwriters to us per share of common stock. The underwriting discounts and commissions are % of the initial public offering price. We have agreed to pay the underwriters the following discounts and commissions, assuming either no exercise or full exercise by the underwriters of the underwriters' option to purchase additional shares:
| |
|
Total Fees | ||||||||
|---|---|---|---|---|---|---|---|---|---|---|
| |
Per Share | Without Exercise of Option to Purchase Additional Shares |
With Full Exercise of Option to Purchase Additional Shares |
|||||||
Discounts and commissions paid by us |
||||||||||
We have also agreed to reimburse the underwriters for certain expenses, including expenses in connection with the qualification of the offering with the Financial Industry Regulatory Authority, or FINRA, by counsel to the underwriters, which will not exceed $ .
In addition, we estimate that our share of the total expenses of this offering, excluding underwriting discounts and commissions, will be approximately $1.5 million.
Option to Purchase Additional Shares
We have granted to the underwriters an option, exercisable not later than 30 days after the date of this prospectus, to purchase up to 2,887,500 additional shares of common stock from us at the public offering price less the underwriting discounts and commissions set forth on the cover page of this prospectus. To the extent that the underwriters exercise this option, each of the underwriters will become obligated, subject to conditions, to purchase approximately the same percentage of these additional shares of common stock as the number of shares of common stock to be purchased by it in the above table bears to the total number of shares of common stock offered by this prospectus. We will be obligated, pursuant to the option, to sell these additional shares of common stock to the underwriters to the extent the option is exercised. If any additional shares of common stock are purchased, the underwriters will offer the additional shares on the same terms as those on which the initial shares referred to in the above table are being offered.
No Sales of Similar Securities
Each of our officers and directors, and substantially all of our stockholders and holders of options and warrants to purchase our stock, have agreed not to offer, sell, contract to sell or otherwise dispose of, or enter into any transaction that is designed to, or could be expected to, result in the disposition of any shares of our common stock or other securities convertible into or exchangeable or exercisable for shares of our common stock or derivatives of our common stock owned by these persons prior to this offering or common stock issuable upon exercise of options or warrants held by these persons for a period of 180 days after the effective date of the registration statement of which this prospectus is a part without the prior written consent of Deutsche Bank Securities Inc., Credit Suisse Securities (USA) LLC and Barclays Capital Inc. This consent may be given at any time without public notice. Subject to certain conditions, transfers or dispositions of shares of common stock may be made during the lock-up period in the case of (a) gift, will or intestacy, (b) distributions to partners, members or stockholders of the transferor, in each case, where the transferee signs a lock-up agreement, and (c) to us pursuant to an existing redemption agreement with one of our directors. We have entered into a similar agreement with Deutsche Bank Securities Inc., Credit
166
Suisse Securities (USA) LLC and Barclays Capital Inc., as representatives of the underwriters. There are no agreements between the representatives and any of our stockholders or affiliates releasing them from these lock-up agreements prior to the expiration of the 180-day period.
Price Stabilization, Short Positions and Penalty Bids
In connection with this offering, the underwriters may purchase and sell shares of our common stock in the open market. These transactions may include short sales, purchases to cover positions created by short sales and stabilizing transactions. Short sales involve the sale by the underwriters of a greater number of shares than they are required to purchase in this offering. "Covered" short sales are sales made in an amount not greater than the underwriters' option to purchase additional shares of common stock from us in this offering. The underwriters may close out any covered short position by either exercising their option to purchase additional shares or purchasing shares in the open market. In determining the source of shares to close out the covered short position, the underwriters will consider, among other things, the price of shares available for purchase in the open market as compared to the price at which they may purchase additional shares of common stock pursuant to the option granted to them. "Naked" short sales are any sales in excess of such option. The underwriters must close out any naked short position by purchasing shares in the open market. A naked short position is more likely to be created if underwriters are concerned that there may be downward pressure on the price of the shares in the open market prior to the completion of this offering. Stabilizing transactions consist of various bids for or purchases of our common stock made by the underwriters in the open market prior to the completion of this offering.
The underwriters may also impose a penalty bid. This occurs when a particular underwriter repays to the other underwriters a portion of the underwriting discount received by it because the representative of the underwriters has repurchased shares sold by or for the account of that underwriter in stabilizing or short covering transactions.
Purchases to cover a short position and stabilizing transactions may have the effect of preventing or slowing a decline in the market price of our common stock. Additionally, these purchases, along with the imposition of the penalty bid, may stabilize, maintain or otherwise affect the market price of our common stock. As a result, the price of our common stock may be higher than the price that might otherwise exist in the open market. These transactions may be effected in the over-the-counter market or otherwise.
Listing
Our common stock has been approved for listing on the NYSE under the symbol "ADSW". In order to meet the requirements for listing on that exchange, the underwriters have undertaken to sell a minimum number of shares to a minimum number of beneficial owners as required by that exchange.
Pricing of this Offering
Prior to this offering, there has been no public market for our common stock. Consequently, the initial public offering price of our common stock will be determined by negotiation among us and Deutsche Bank Securities Inc., Credit Suisse Securities (USA) LLC and Barclays Capital Inc. as representatives of the underwriters. Among the primary factors that will be considered in determining the public offering price are:
- •
- prevailing market conditions;
167
- •
- our results of operations in recent periods;
- •
- the present stage of our development;
- •
- the market capitalizations and stages of development of other companies that we and the representatives of the underwriters believe to
be comparable to our business; and
- •
- estimates of our business potential.
An active trading market for the shares may not develop. It is also possible that after the offering the shares will not trade in the public market at or above the initial public offering price.
Electronic Offer, Sale and Distribution of Shares
In connection with this offering, certain of the underwriters or securities dealers may distribute prospectuses by electronic means, such as e-mail. In addition, the underwriters may facilitate Internet distribution for this offering to certain of its Internet subscription customers. The underwriters may allocate a limited number of shares for sale to its online brokerage customers. A prospectus in electronic format is being made available on Internet web sites maintained by one or more of the lead underwriters of this offering and may be made available on web sites maintained by other underwriters. Other than the prospectus in electronic format, the information on any underwriter's web site and any information contained in any other web site maintained by an underwriter is not part of the prospectus or the registration statement of which the prospectus forms a part.
Other Relationships
Some of the underwriters and their affiliates have engaged in, and may in the future engage in, investment banking and other commercial dealings in the ordinary course of business with us or our affiliates. They have received, or may in the future receive, customary fees and commissions for these transactions.
Deutsche Bank Trust Company Americas, an affiliate of Deutsche Bank Securities Inc., is the administrative agent under our Senior Secured Credit Facility and Deutsche Bank Securities Inc., Credit Suisse Securities (USA) LLC and Barclays Bank PLC, an affiliate of Barclays Capital Inc., each acted as joint bookrunner and joint lead arranger under the Senior Secured Credit Facilities. Additionally, affiliates of certain of the underwriters are lenders under our Senior Secured Credit Facility. In connection with the amendment to our Senior Secured Credit Facilities, we paid total fees of approximately $5.2 million, which were paid to the lenders and the administrative agent, at the closing of the consent, irrespective of whether the consent becomes effective.
In addition, in the ordinary course of their business activities, the underwriters and their affiliates may make or hold a broad array of investments and actively trade debt and equity securities (or related derivative securities) and financial instruments (including bank loans) for their own account and for the accounts of their customers. Such investments and securities activities may involve securities and/or instruments of ours or our affiliates. The underwriters and their affiliates may also make investment recommendations and/or publish or express independent research views in respect of such securities or financial instruments and may hold, or recommend to clients that they acquire, long and/or short positions in such securities and instruments.
168
Selling Restrictions
Notice to Prospective Investors in the European Economic Area
In relation to each Member State of the European Economic Area which has implemented the Prospectus Directive (each, a "Relevant Member State"), each underwriter has represented and agreed that with effect from and including the date on which the Prospectus Directive is implemented in that Relevant Member State (the "Relevant Implementation Date") it has not made and will not make an offer of shares to the public in that Relevant Member State prior to the publication of a prospectus in relation to the shares which has been approved by the competent authority in that Relevant Member State or, where appropriate, approved in another Relevant Member State and notified to the competent authority in that Relevant Member State, all in accordance with the Prospectus Directive, except that it may, with effect from and including the Relevant Implementation Date, make an offer of shares to the public in that Relevant Member State at any time:
- (a)
- to
any legal entity which is a qualified investor as defined in the Prospectus Directive;
- (b)
- to
fewer than 100 or, if the Relevant Member State has implemented the relevant provision of the 2010 PD Amending Directive, 150 natural or legal persons
(other than qualified investors, as defined in the Prospectus Directive) subject to obtaining the prior consent of the representative for any such offer; or
- (c)
- in any other circumstances which do not require the publication by us of a prospectus pursuant to Article 3 of the Prospectus Directive.
For the purposes of this provision, the expression an "offer of shares to the public" in relation to any shares in any Relevant Member State means the communication in any form and by any means of sufficient information on the terms for the offer and the shares to be offered so as to enable an investor to decide to purchase or subscribe the shares, as the same may be varied in that Relevant Member State by any measure implementing the Prospectus Directive in that Relevant Member State, the expression Prospectus Directive means Directive 2003/71/EC (and amendments thereto, including the PD 2010 Amending Directive to the extent implemented in the Relevant Member State) and includes any relevant implementing measure in each Relevant Member State, and the expression 2010 PD Amending Directive means Directive 2010/73/EU.
Notice to Prospective Investors in the United Kingdom
This prospectus and any other material in relation to the shares described herein is only being distributed to, and is only directed at, persons in the United Kingdom that are qualified investors within the meaning of Article 2(1)(e) of the Prospective Directive ("qualified investors") that also (i) have professional experience in matters relating to investments falling within Article 19(5) of the Financial Services and Markets Act 2000 (Financial Promotion) Order 2005, as amended, or the Order, (ii) who fall within Article 49(2)(a) to (d) of the Order or (iii) to whom it may otherwise lawfully be communicated (all such persons together being referred to as "relevant persons"). The shares are only available to, and any invitation, offer or agreement to purchase or otherwise acquire such shares will be engaged in only with, relevant persons. This prospectus and its contents are confidential and should not be distributed, published or reproduced (in whole or in part) or disclosed by recipients to any other person in the United Kingdom. Any person in the United Kingdom that is not a relevant person should not act or rely on this prospectus or any of its contents.
169
Notice to Prospective Investors in Canada
The shares may be sold only to purchasers purchasing, or deemed to be purchasing, as principal that are accredited investors, as defined in National Instrument 45-106 Prospectus Exemptions or subsection 73.3(1) of the Securities Act (Ontario), and are permitted clients, as defined in National Instrument 31-103 Registration Requirements, Exemptions and Ongoing Registrant Obligations. Any resale of the shares must be made in accordance with an exemption from, or in a transaction not subject to, the prospectus requirements of applicable securities laws.
Securities legislation in certain provinces or territories of Canada may provide a purchaser with remedies for rescission or damages if this offering memorandum (including any amendment thereto) contains a misrepresentation, provided that the remedies for rescission or damages are exercised by the purchaser within the time limit prescribed by the Securities legislation of the purchaser's province or territory. The purchaser should refer to any applicable provisions of the Securities legislation of the purchaser's province or territory for particulars of these rights or consult with a legal advisor.
Pursuant to section 3A.3 of National Instrument 33-105 Underwriting Conflicts (NI 33-105), the underwriters are not required to comply with the disclosure requirements of NI 33-105 regarding underwriter conflicts of interest in connection with this offering.
Notice to Prospective Investors in Switzerland
The shares may not be publicly offered in Switzerland and will not be listed on the SIX Swiss Exchange (the "SIX") or on any other stock exchange or regulated trading facility in Switzerland. This document has been prepared without regard to the disclosure standards for issuance prospectuses under art. 652a or art. 1156 of the Swiss Code of Obligations or the disclosure standards for listing prospectuses under art. 27 ff. of the SIX Listing Rules or the listing rules of any other stock exchange or regulated trading facility in Switzerland. Neither this document nor any other offering or marketing material relating to the shares or the offering may be publicly distributed or otherwise made publicly available in Switzerland.
Neither this prospectus nor any other offering or marketing material relating to the offering, the issuer, the shares have been or will be filed with or approved by any Swiss regulatory authority. In particular, this prospectus will not be filed with, and the offer of shares will not be supervised by, the Swiss Financial Market Supervisory Authority FINMA (the "FINMA"), and the offer of shares has not been and will not be authorized under the Swiss Federal Act on Collective Investment Schemes (the "CISA"). The investor protection afforded to acquirers of interests in collective investment schemes under the CISA does not extend to acquirers of shares.
Notice to Prospective Investors in the Dubai International Financial Centre
This prospectus relates to an Exempt Offer in accordance with the Offered Securities Rules of the Dubai Financial Services Authority (the "DFSA"). This prospectus is intended for distribution only to persons of a type specified in the Offered Securities Rules of the DFSA. It must not be delivered to, or relied on by, any other person. The DFSA has no responsibility for reviewing or verifying any documents in connection with Exempt Offers. The DFSA has not approved this prospectus nor taken steps to verify the information set forth herein and has no responsibility for this prospectus. The shares to which this prospectus relates may be illiquid and/or subject to restrictions on their resale. Prospective purchasers of the shares offered should conduct their own due diligence on the shares. If you do not understand the contents of this prospectus you should consult an authorized financial advisor.
170
Notice to Prospective Investors in Hong Kong
The shares may not be offered or sold by means of any document other than (i) in circumstances which do not constitute an offer to the public within the meaning of the Companies Ordinance (Cap. 32, Laws of Hong Kong), or (ii) to "professional investors" within the meaning of the Securities and Futures Ordinance (Cap. 571, Laws of Hong Kong) and any rules made thereunder, or (iii) in other circumstances which do not result in the document being a "prospectus" within the meaning of the Companies Ordinance (Cap. 32, Laws of Hong Kong), and no advertisement, invitation or document relating to the shares may be issued or may be in the possession of any person for the purpose of issue (in each case whether in Hong Kong or elsewhere), which is directed at, or the contents of which are likely to be accessed or read by, the public in Hong Kong (except if permitted to do so under the laws of Hong Kong) other than with respect to shares which are or are intended to be disposed of only to persons outside Hong Kong or only to "professional investors" within the meaning of the Securities and Futures Ordinance (Cap. 571, Laws of Hong Kong) and any rules made thereunder.
Notice to Prospective Investors in Singapore
This prospectus has not been registered as a prospectus with the Monetary Authority of Singapore. Accordingly, this prospectus and any other document or material in connection with the offer or sale, or invitation for subscription or purchase, of the shares may not be circulated or distributed, nor may the shares be offered or sold, or be made the subject of an invitation for subscription or purchase, whether directly or indirectly, to persons in Singapore other than (i) to an institutional investor under Section 274 of the Securities and Futures Act, Chapter 289 of Singapore (the "SFA"), (ii) to a relevant person, or any person pursuant to Section 275(1A), and in accordance with the conditions, specified in Section 275 of the SFA or (iii) otherwise pursuant to, and in accordance with the conditions of, any other applicable provision of the SFA.
Where the shares are subscribed or purchased under Section 275 by a relevant person which is: (a) a corporation (which is not an accredited investor) the sole business of which is to hold investments and the entire share capital of which is owned by one or more individuals, each of whom is an accredited investor; or (b) a trust (where the trustee is not an accredited investor) whose sole purpose is to hold investments and each beneficiary is an accredited investor, shares, debentures and units of shares and debentures of that corporation or the beneficiaries' rights and interest in that trust shall not be transferable for six months after that corporation or that trust has acquired the shares under Section 275 except: (1) to an institutional investor under Section 274 of the SFA or to a relevant person, or any person pursuant to Section 275(1A), and in accordance with the conditions, specified in Section 275 of the SFA; (2) where no consideration is given for the transfer; or (3) by operation of law.
Notice to Prospective Investors in Japan
The securities have not been and will not be registered under the Financial Instruments and Exchange Law of Japan (Law No. 25 of 1948, as amended) and, accordingly, will not be offered or sold, directly or indirectly, in Japan, or for the benefit of any Japanese Person or to others for re-offering or resale, directly or indirectly, in Japan or to any Japanese Person, except in compliance with all applicable laws, regulations and ministerial guidelines promulgated by relevant Japanese governmental or regulatory authorities in effect at the relevant time. For the purposes of this paragraph, "Japanese Person" shall mean any person resident in Japan, including any corporation or other entity organized under the laws of Japan.
171
Notice to Prospective Investors in Australia
No placement document, prospectus, product disclosure statement or other disclosure document has been lodged with the Australian Securities and Investments Commission ("ASIC"), in relation to the offering. This prospectus does not constitute a prospectus, product disclosure statement or other disclosure document under the Corporations Act 2001 (the "Corporations Act"), and does not purport to include the information required for a prospectus, product disclosure statement or other disclosure document under the Corporations Act.
Any offer in Australia of the shares may only be made to persons (the "Exempt Investors") who are "sophisticated investors" (within the meaning of section 708(8) of the Corporations Act), "professional investors" (within the meaning of section 708(11) of the Corporations Act) or otherwise pursuant to one or more exemptions contained in section 708 of the Corporations Act so that it is lawful to offer the shares without disclosure to investors under Chapter 6D of the Corporations Act.
The shares applied for by Exempt Investors in Australia must not be offered for sale in Australia in the period of 12 months after the date of allotment under the offering, except in circumstances where disclosure to investors under Chapter 6D of the Corporations Act would not be required pursuant to an exemption under section 708 of the Corporations Act or otherwise or where the offer is pursuant to a disclosure document which complies with Chapter 6D of the Corporations Act. Any person acquiring shares must observe such Australian on-sale restrictions.
This prospectus contains general information only and does not take account of the investment objectives, financial situation or particular needs of any particular person. It does not contain any securities recommendations or financial product advice. Before making an investment decision, investors need to consider whether the information in this prospectus is appropriate to their needs, objectives and circumstances, and, if necessary, seek expert advice on those matters.
Notice to Prospective Investors in Qatar
The shares described in this prospectus have not been, and will not be, offered, sold or delivered, at any time, directly or indirectly in the State of Qatar in a manner that would constitute a public offering. This prospectus has not been, and will not be, registered with or approved by the Qatar Financial Markets Authority or Qatar Central Bank and may not be publicly distributed. This prospectus is intended for the original recipient only and must not be provided to any other person. It is not for general circulation in the State of Qatar and may not be reproduced or used for any other purpose.
172
The validity of the common stock offered hereby will be passed upon for us by Shearman & Sterling LLP, New York, New York. Certain legal matters will be passed upon for the underwriters by Latham & Watkins LLP, New York, New York.
The consolidated financial statements of Advanced Disposal Services, Inc. as of December 31, 2015 and 2014, and for each of the three years in the period ended December 31, 2015, appearing in this Prospectus and Registration Statement have been audited by Ernst & Young LLP, independent registered public accounting firm, as set forth in their report thereon appearing elsewhere herein, and are included in reliance upon such report given on the authority of such firm as experts in accounting and auditing.
WHERE YOU CAN FIND MORE INFORMATION
We have filed with the SEC a registration statement on Form S-1 under the Securities Act that registers the shares of our common stock to be sold in this offering. The registration statement, including the attached exhibits, contains additional relevant information about us and our common stock. The rules and regulations of the SEC allow us to omit from this document certain information included in the registration statement.
We file annual, quarterly and special reports and other information with the SEC. Our filings with the SEC are available to the public on the SEC's website at www.sec.gov. Those filings are also available to the public on, or accessible through, our corporate web site at www.advanceddisposal.com. The information we file with the SEC or contained on or accessible through our corporate web site or any other web site that we may maintain is not part of this prospectus or the registration statement of which this prospectus is a part. You may also read and copy, at SEC prescribed rates, any document we file with the SEC, including the registration statement (and its exhibits) of which this prospectus is a part, at the SEC's Public Reference Room located at 100 F Street, N.E., Washington D.C. 20549. You can call the SEC at 1-800-SEC-0330 to obtain information on the operation of the Public Reference Room.
173
INDEX TO CONSOLIDATED FINANCIAL STATEMENTS
F-1
ADVANCED DISPOSAL SERVICES, INC.
AUDITED CONSOLIDATED FINANCIAL STATEMENTS
F-2
Report of Independent Registered Public Accounting Firm
The
Board of Directors and Stockholder's of
Advanced Disposal Services, Inc.
We have audited the accompanying consolidated balance sheets of Advanced Disposal Services, Inc. and Subsidiaries (the "Company") as of December 31, 2015 and 2014, and the related consolidated statements of operations, comprehensive loss, stockholder's equity, and cash flows for each of the three years in the period ended December 31, 2015. These financial statements are the responsibility of the Company's management. Our responsibility is to express an opinion on these financial statements based on our audits.
We conducted our audits in accordance with the standards of the Public Company Accounting Oversight Board (United States). Those standards require that we plan and perform the audit to obtain reasonable assurance about whether the financial statements are free of material misstatement. We were not engaged to perform an audit of the Company's internal control over financial reporting. Our audits included consideration of internal control over financial reporting as a basis for designing audit procedures that are appropriate in the circumstances, but not for the purpose of expressing an opinion on the effectiveness of the Company's internal control over financial reporting. Accordingly, we express no such opinion. An audit also includes examining, on a test basis, evidence supporting the amounts and disclosures in the financial statements, assessing the accounting principles used and significant estimates made by management, and evaluating the overall financial statement presentation. We believe that our audits provide a reasonable basis for our opinion.
In our opinion, the financial statements referred to above present fairly, in all material respects, the consolidated financial position of Advanced Disposal Services, Inc. and Subsidiaries at December 31, 2015 and 2014, and the consolidated results of their operations and their cash flows for each of the three years in the period ended December 31, 2015, in conformity with U.S. generally accepted accounting principles.
/s/
Ernst & Young LLP
Independent certified public accountants
Jacksonville, FL
March 4, 2016 except for Note 26, as to which the date is August 11, 2016
F-3
Management Report on Internal Control Over Financial Reporting
Management of the Company, including the principal executive and financial officers, is responsible for establishing and maintaining adequate internal control over financial reporting, as defined in Rules 13a-15(f) and 15d-15(f) of the Securities Exchange Act of 1934, as amended. Our internal controls are designed to provide reasonable assurance as to the reliability of our financial reporting and the preparation of the consolidated financial statements for external purposes in accordance with accounting principles generally accepted in the United States and includes those policies and procedures that:
i. pertain to the maintenance of records that in reasonable detail accurately and fairly reflect the transactions and dispositions of the assets of the issuer;
ii. provide reasonable assurance that transactions are recorded as necessary to permit preparation of financial statements in accordance with generally accepted accounting principles, and that receipts and expenditures of the issuer are being made only in accordance with authorizations of management and directors of the issuer; and
iii. provide reasonable assurance regarding prevention or timely detection of unauthorized acquisition, use or disposition of the issuer's assets that could have a material effect on the financial statements.
Because of its inherent limitations, internal control over financial reporting may not prevent or detect misstatements. Also, projections of any evaluation of effectiveness to future periods are subject to risk that controls may become inadequate because of changes in conditions, or that the degree of compliance with the policies or procedures may deteriorate. Management of the Company assessed the effectiveness of our internal control over financial reporting as of December 31, 2015 based on the Internal Control—Integrated Framework issued by the Committee of Sponsoring Organizations of the Treadway Commission (2013 framework). Based on its assessment, management has concluded that our internal control over financial reporting was effective as of December 31, 2015.
F-4
Consolidated Financial Statements
Advanced Disposal Services, Inc. and Subsidiaries
Consolidated Balance Sheets
December 31, 2015 and 2014
| (In millions of dollars, except shares) |
2015 | 2014 | |||||
|---|---|---|---|---|---|---|---|
Assets |
|||||||
Current assets |
|||||||
Cash and cash equivalents |
$ | 0.6 | $ | 1.0 | |||
Accounts receivable, net of allowance for doubtful accounts of $4.4 and $5.0, respectively |
177.5 | 188.0 | |||||
Prepaid expenses and other current assets |
33.4 | 34.2 | |||||
Deferred income taxes |
— | 14.6 | |||||
| | | | | | | | |
Total current assets |
211.5 | 237.8 | |||||
Restricted cash |
— | 0.2 | |||||
Other assets, net |
22.9 | 40.8 | |||||
Property and equipment, net |
1,649.9 | 1,663.9 | |||||
Goodwill |
1,173.5 | 1,166.9 | |||||
Other intangible assets, net |
364.5 | 379.9 | |||||
| | | | | | | | |
Total assets |
$ | 3,422.3 | $ | 3,489.5 | |||
| | | | | | | | |
| | | | | | | | |
| | | | | | | | |
Liabilities and Stockholder's Equity |
|||||||
Current liabilities |
|||||||
Accounts payable |
$ | 98.1 | $ | 94.7 | |||
Accrued expenses |
135.7 | 130.7 | |||||
Deferred revenue |
63.1 | 60.0 | |||||
Current maturities of landfill retirement obligations |
30.2 | 29.2 | |||||
Current maturities of long-term debt |
49.1 | 25.3 | |||||
| | | | | | | | |
Total current liabilities |
376.2 | 339.9 | |||||
Other long-term liabilities |
55.8 | 61.2 | |||||
Long-term debt, less current maturities |
2,198.0 | 2,217.7 | |||||
Accrued landfill retirement obligations, less current maturities |
163.5 | 171.9 | |||||
Deferred income taxes |
139.0 | 169.9 | |||||
| | | | | | | | |
Total liabilities |
2,932.5 | 2,960.6 | |||||
| | | | | | | | |
Stockholder's equity |
|||||||
Common stock: $.01 par value, 1,000 shares authorized, 1,000 shares issued and outstanding |
— | — | |||||
Additional paid-in capital |
1,101.0 | 1,105.0 | |||||
Accumulated other comprehensive income |
— | 1.5 | |||||
Accumulated deficit |
(611.2 | ) | (577.6 | ) | |||
| | | | | | | | |
Total stockholder's equity |
489.8 | 528.9 | |||||
| | | | | | | | |
Total liabilities and stockholder's equity |
$ | 3,422.3 | $ | 3,489.5 | |||
| | | | | | | | |
| | | | | | | | |
| | | | | | | | |
The accompanying notes are an integral part of these consolidated financial statements.
F-5
Advanced Disposal Services, Inc. and Subsidiaries
Consolidated Statements of Operations
| |
Year Ended December 31, | |||||||||
|---|---|---|---|---|---|---|---|---|---|---|
| (In millions of dollars) |
2015 | 2014 | 2013 | |||||||
Service revenues |
$ | 1,396.4 | $ | 1,403.0 | $ | 1,319.1 | ||||
| | | | | | | | | | | |
Operating costs and expenses |
||||||||||
Operating expenses (exclusive of items shown separately below) |
866.6 | 896.1 | 832.8 | |||||||
Selling, general and administrative |
152.6 | 154.9 | 170.9 | |||||||
Depreciation and amortization |
259.1 | 271.4 | 278.9 | |||||||
Acquisition and development costs |
1.4 | 0.1 | 1.2 | |||||||
Loss on disposal of assets and asset impairments |
21.6 | 6.5 | 3.2 | |||||||
Restructuring charges |
— | 4.6 | 10.0 | |||||||
| | | | | | | | | | | |
Total operating costs and expenses |
1,301.3 | 1,333.6 | 1,297.0 | |||||||
| | | | | | | | | | | |
Operating income |
95.1 | 69.4 | 22.1 | |||||||
| | | | | | | | | | | |
Other (expense) income |
||||||||||
Interest expense |
(138.0 | ) | (141.5 | ) | (163.1 | ) | ||||
Other, net |
(10.1 | ) | (25.9 | ) | 0.3 | |||||
| | | | | | | | | | | |
Total other expense |
(148.1 | ) | (167.4 | ) | (162.8 | ) | ||||
| | | | | | | | | | | |
Loss from continuing operations before income taxes |
(53.0 | ) | (98.0 | ) | (140.7 | ) | ||||
Income tax benefit |
(19.4 | ) | (80.6 | ) | (45.4 | ) | ||||
| | | | | | | | | | | |
Loss from continuing operations |
(33.6 | ) | (17.4 | ) | (95.3 | ) | ||||
| | | | | | | | | | | |
Discontinued operations |
||||||||||
Loss from discontinued operations before income tax |
— | (0.7 | ) | (29.6 | ) | |||||
Income tax benefit |
— | (1.0 | ) | (7.1 | ) | |||||
| | | | | | | | | | | |
Discontinued operations, net |
— | 0.3 | (22.5 | ) | ||||||
| | | | | | | | | | | |
Net loss |
$ | (33.6 | ) | $ | (17.1 | ) | $ | (117.8 | ) | |
| | | | | | | | | | | |
| | | | | | | | | | | |
| | | | | | | | | | | |
Loss attributable to common stockholder from continuing operations per share |
||||||||||
Basic loss per share |
$ | (33,600 | ) | $ | (17,400 | ) | $ | (95,300 | ) | |
Diluted loss per share |
N/A | N/A | N/A | |||||||
Net loss attributable to common stockholder per share |
||||||||||
Basic loss per share |
$ | (33,600 | ) | $ | (17,100 | ) | $ | (117,800 | ) | |
Diluted loss per share |
N/A | N/A | N/A | |||||||
The accompanying notes are an integral part of these consolidated financial statements.
F-6
Advanced Disposal Services, Inc. and Subsidiaries
Consolidated Statements of Comprehensive Loss
| |
Year Ended December 31, | |||||||||
|---|---|---|---|---|---|---|---|---|---|---|
| (In millions of dollars) |
2015 | 2014 | 2013 | |||||||
Net loss |
$ | (33.6 | ) | $ | (17.1 | ) | $ | (117.8 | ) | |
| | | | | | | | | | | |
Other comprehensive (loss) income, net of tax |
||||||||||
Market value adjustments for hedges |
(1.5 | ) | (1.0 | ) | 4.7 | |||||
| | | | | | | | | | | |
Other comprehensive (loss) income |
(1.5 | ) | (1.0 | ) | 4.7 | |||||
| | | | | | | | | | | |
Comprehensive loss |
$ | (35.1 | ) | $ | (18.1 | ) | $ | (113.1 | ) | |
| | | | | | | | | | | |
| | | | | | | | | | | |
| | | | | | | | | | | |
The accompanying notes are an integral part of these consolidated financial statements.
F-7
Advanced Disposal Services, Inc. and Subsidiaries
Consolidated Statements of Stockholder's Equity
| |
|
|
|
|
Accumulated Other Comprehensive Income (Loss) |
|
|
|||||||||||||||
|---|---|---|---|---|---|---|---|---|---|---|---|---|---|---|---|---|---|---|---|---|---|---|
| |
Common Stock | |
|
|
|
|||||||||||||||||
| |
Additional Paid-In Capital |
Accumulated Deficit |
Noncontrolling Interests |
Total Stockholder's Equity |
||||||||||||||||||
| (In millions of dollars, except shares) |
Shares | Amount | ||||||||||||||||||||
Balance at December 31, 2012 |
1,000.0 | $ | — | $ | 1,104.9 | $ | (442.7 | ) | $ | (2.2 | ) | $ | 2.5 | $ | 662.5 | |||||||
Net loss |
— | — | — | (117.8 | ) | — | — | (117.8 | ) | |||||||||||||
Unrealized gain resulting from change in fair value of derivative instruments, net of tax |
— | — | — | — | 4.7 | — | 4.7 | |||||||||||||||
Acquisition of noncontrolling interest |
— | — | — | — | — | (2.5 | ) | (2.5 | ) | |||||||||||||
Stock-based compensation expense |
— | — | 4.6 | — | — | — | 4.6 | |||||||||||||||
| | | | | | | | | | | | | | | | | | | | | | | |
Balance at December 31, 2013 |
1,000.0 | — | 1,109.5 | (560.5 | ) | 2.5 | — | 551.5 | ||||||||||||||
Net loss |
— | — | — | (17.1 | ) | — | — | (17.1 | ) | |||||||||||||
Unrealized gain resulting from change in fair value of derivative instruments, net of tax |
— | — | — | — | (1.0 | ) | — | (1.0 | ) | |||||||||||||
Share based compensation expense |
— | — | 4.5 | — | — | — | 4.5 | |||||||||||||||
Capital contribution from parent |
— | — | — | — | — | — | — | |||||||||||||||
Return of capital to parent |
— | — | (9.0 | ) | — | — | — | (9.0 | ) | |||||||||||||
| | | | | | | | | | | | | | | | | | | | | | | |
Balance at December 31, 2014 |
1,000.0 | — | 1,105.0 | (577.6 | ) | 1.5 | — | 528.9 | ||||||||||||||
Net loss |
— | — | — | (33.6 | ) | — | — | (33.6 | ) | |||||||||||||
Realized loss resulting from change in fair value of derivative instruments, net of tax |
— | — | — | — | (1.5 | ) | — | (1.5 | ) | |||||||||||||
Share based compensation expense |
— | — | 3.1 | — | — | — | 3.1 | |||||||||||||||
Capital contribution from parent |
— | — | 0.4 | — | — | — | 0.4 | |||||||||||||||
Return of capital to parent |
— | — | (7.5 | ) | — | — | — | (7.5 | ) | |||||||||||||
| | | | | | | | | | | | | | | | | | | | | | | |
Balance at December 31, 2015 |
1,000.0 | $ | — | $ | 1,101.0 | $ | (611.2 | ) | $ | — | $ | — | $ | 489.8 | ||||||||
| | | | | | | | | | | | | | | | | | | | | | | |
| | | | | | | | | | | | | | | | | | | | | | | |
| | | | | | | | | | | | | | | | | | | | | | | |
The accompanying notes are an integral part of these consolidated financial statements.
F-8
Advanced Disposal Services, Inc. and Subsidiaries
Consolidated Statements of Cash Flows
| |
Year Ended December 31, | |||||||||
|---|---|---|---|---|---|---|---|---|---|---|
| (In millions of dollars) |
2015 | 2014 | 2013 | |||||||
Cash flows from operating activities |
||||||||||
Net loss |
$ | (33.6 | ) | $ | (17.1 | ) | $ | (117.8 | ) | |
Adjustments to reconcile net loss to net cash provided by operating activities |
||||||||||
Depreciation and amortization |
259.1 | 271.7 | 284.8 | |||||||
Amortization of option/interest rate cap premium |
1.5 | 2.1 | 1.3 | |||||||
Amortization of terminated derivative contracts |
— | — | 6.0 | |||||||
Interest accretion loss contracts, other debt and long-term liabilities |
2.7 | 2.2 | 2.7 | |||||||
Amortization of debt issuance costs |
14.4 | 15.1 | 12.6 | |||||||
Accretion of original issue discount |
5.1 | 4.9 | 5.0 | |||||||
Accretion on landfill retirement obligations |
13.1 | 13.5 | 15.0 | |||||||
Provision for doubtful accounts |
4.0 | 4.2 | 7.7 | |||||||
Loss on sale of property and equipment |
4.7 | 0.8 | 2.6 | |||||||
Gain on redemption of security |
(2.5 | ) | — | — | ||||||
Share based compensation |
3.1 | 4.5 | 4.6 | |||||||
Change in fair value of derivative instruments |
(11.1 | ) | 27.3 | — | ||||||
Amortization of other long-term assets |
— | 0.3 | — | |||||||
Deferred tax benefit |
(21.6 | ) | (84.5 | ) | (57.0 | ) | ||||
Earnings in equity investee |
(1.3 | ) | (0.1 | ) | (0.3 | ) | ||||
Asset impairment |
6.4 | 5.3 | 25.5 | |||||||
Loss on disposition of business |
10.5 | — | — | |||||||
Changes in operating assets and liabilities, net of businesses acquired |
||||||||||
Decrease (increase) in accounts receivable |
8.3 | 1.7 | (5.1 | ) | ||||||
Decrease (increase) in prepaid expenses, parts and supplies, and other current assets |
1.1 | 1.3 | (2.8 | ) | ||||||
Decrease (increase) in other assets |
3.9 | 2.9 | (1.1 | ) | ||||||
(Decrease) increase in accounts payable |
(2.8 | ) | 3.8 | 5.7 | ||||||
Increase (decrease) in accrued expenses |
3.9 | (6.6 | ) | (0.3 | ) | |||||
(Decrease) increase in unearned revenue |
(0.5 | ) | (1.7 | ) | 4.6 | |||||
(Decrease) increase in other long-term liabilities |
(3.5 | ) | 5.4 | (1.4 | ) | |||||
Capping, closure and post-closure expenditures |
(20.4 | ) | (13.8 | ) | (12.0 | ) | ||||
| | | | | | | | | | | |
Net cash provided by operating activities |
244.5 | 243.2 | 180.3 | |||||||
| | | | | | | | | | | |
Cash flows from investing activities |
||||||||||
Purchases of property and equipment and construction and development |
(179.7 | ) | (196.4 | ) | (158.1 | ) | ||||
Proceeds from sale of property and equipment |
2.6 | 3.0 | 3.4 | |||||||
Proceeds from redemption of securities |
15.0 | — | 5.0 | |||||||
Repayments of notes receivable |
— | — | 0.1 | |||||||
Acquisition of businesses, net of cash acquired |
(50.0 | ) | (9.9 | ) | (50.4 | ) | ||||
Proceeds from disposition of businesses |
14.7 | 2.1 | 45.2 | |||||||
| | | | | | | | | | | |
Net cash used in investing activities |
(197.4 | ) | (201.2 | ) | (154.8 | ) | ||||
| | | | | | | | | | | |
Cash flows from financing activities |
||||||||||
Proceeds from borrowings on debt instruments |
114.0 | 95.0 | 184.0 | |||||||
Repayments on debt instruments |
(153.4 | ) | (141.3 | ) | (196.8 | ) | ||||
Deferred financing charges |
(0.2 | ) | (1.3 | ) | (22.9 | ) | ||||
Bank overdraft |
1.2 | 1.4 | (3.3 | ) | ||||||
Return of capital |
(7.5 | ) | (9.0 | ) | — | |||||
Capital contributions from parent |
0.4 | — | — | |||||||
Other financing activities |
(2.0 | ) | 2.2 | 6.7 | ||||||
| | | | | | | | | | | |
Net cash used in financing activities |
(47.5 | ) | (53.0 | ) | (32.3 | ) | ||||
| | | | | | | | | | | |
Net decrease in cash and cash equivalents |
(0.4 | ) | (11.0 | ) | (6.8 | ) | ||||
Cash and cash equivalents, beginning of year |
1.0 | 12.0 | 18.8 | |||||||
| | | | | | | | | | | |
Cash and cash equivalents, end of year |
$ | 0.6 | $ | 1.0 | $ | 12.0 | ||||
| | | | | | | | | | | |
| | | | | | | | | | | |
| | | | | | | | | | | |
The accompanying notes are an integral part of these consolidated financial statements.
F-9
Advanced Disposal Services, Inc. and Subsidiaries
Notes to Consolidated Financial Statements
(In millions, unless otherwise indicated)
1. Business Operations
Advanced Disposal Services, Inc. (formerly "ADS Waste Holdings Inc." hereafter referred to as the "Company") together with its consolidated subsidiaries, as a consolidated entity, is a regional environmental services company providing nonhazardous solid waste collection, transfer, recycling and disposal services to customers in the Southeast, Midwest and Eastern regions of the United States, as well as in the Commonwealth of the Bahamas.
The Company currently manages and evaluates its principal operations through three reportable operating segments on a regional basis. Those operating segments are the South, East and Midwest regions which provide collection, transfer, disposal (in both solid waste and non-hazardous waste landfills), recycling services and billing services. Additional information related to our segments can be found in Note 22.
Twelve acquisitions were completed during fiscal 2015 for aggregate prices consisting of cash of $49.7 and notes payable of $6.6 subject to net working capital adjustments, which are expected to be completed within one year. Eight acquisitions were completed during fiscal 2014 for a purchase price of $8.6. The results of operations of each acquisition are included in the Company's consolidated statements of operations subsequent to the closing date of each acquisition.
The Company disposed of certain businesses in the South segment for strategic reasons in June 2015 and recorded a loss on disposal of $10.9 for fiscal 2015. In connection with the sale, the Company impaired property and equipment and intangible assets in the amount of $4.3 for fiscal 2015. Further, the Company strategically concluded not to pursue permitting on a landfill site and therefore recorded a non-cash impairment charge of $2.1 primarily for permitting costs in fiscal 2015.
2. Summary of Significant Accounting Policies
Basis of Presentation
The Company's consolidated financial statements include its wholly-owned subsidiaries of Advanced Disposal Services South, Inc. and HWStar Holdings Corp. and their respective subsidiaries. All intercompany accounts and transactions have been eliminated in consolidation.
Use of Estimates
In preparing its financial statements that conform with accounting principles generally accepted in the United States of America, the Company uses estimates and assumptions that affect the amounts reported in these financial statements and accompanying notes. The Company must make these estimates and assumptions because certain information is dependent on future events, cannot be calculated with a high degree of precision from data available or simply cannot be readily calculated based on generally accepted methodologies. In preparing its financial statements, the more subjective areas that deal with the greatest amount of uncertainty relate to accounting for long-lived assets, including recoverability, landfill development costs, and final capping, closure and post-closure costs, valuation allowances for accounts receivable and deferred tax assets, liabilities for potential litigation,
F-10
Advanced Disposal Services, Inc. and Subsidiaries
Notes to Consolidated Financial Statements (Continued)
(In millions, unless otherwise indicated)
2. Summary of Significant Accounting Policies (Continued)
claims and assessments, liabilities for environmental remediation, stock compensation, accounting for goodwill and intangible asset impairments, deferred taxes, uncertain tax positions, self-insurance reserves, and estimates of the fair values of assets acquired and liabilities assumed in any acquisition. Each of these items is discussed in more detail elsewhere in these Notes to the Consolidated Financial Statements. The Company's actual results may differ significantly from our estimates.
Cash and Cash Equivalents
For purposes of reporting cash flows, cash and cash equivalents includes cash on hand, bank demand deposit accounts, and overnight sweep accounts. Cash equivalents include highly liquid investments with original maturities of three months or less when purchased.
Restricted Cash
Restricted cash consists of amounts held for landfill closure and post-closure financial assurance. The balances will fluctuate based on changes in statutory requirements, future deposits made to comply with contractual arrangements, ongoing use of funds for qualifying events or the acquisitions or divestitures of landfills.
Parts and Supplies Inventory
Parts and supplies consist primarily of spare parts, fuel, tires, lubricants and processed recycled materials. Parts and supplies are stated at the lower of cost or market value utilizing an average cost method and are included in prepaid expenses and other current assets in the accompanying consolidated balance sheets.
Revenue Recognition
The Company recognizes revenues as the services are provided. Revenue is recognized as waste is collected, as tons are received at the landfill or transfer stations, as recycled commodities are delivered to a customer, or as services are rendered to customers. Certain customers are billed and pay in advance and, accordingly, recognition of the related revenues is deferred until the services are provided. Revenues are reported net of applicable state landfill taxes.
Trade Receivables
The Company records trade receivables when billed or when services are performed, as they represent claims against third parties that will generally be settled in cash. The carrying value of receivables, net of the allowance for doubtful accounts, represents the estimated net realizable value. The Company estimates losses for uncollectible accounts based on an evaluation of the aged accounts receivable and the likelihood of collection of the receivable based on historical collection data and existing economic conditions. If events or changes in circumstances indicate that specific receivable balances may be impaired, further consideration is given to the collectability of those balances.
F-11
Advanced Disposal Services, Inc. and Subsidiaries
Notes to Consolidated Financial Statements (Continued)
(In millions, unless otherwise indicated)
2. Summary of Significant Accounting Policies (Continued)
Insurance Reserves
The Company uses a combination of insurance with high deductibles and self-insurance for various risks including workers compensation, vehicle liability, general liability and employee group health claims. The exposure for unpaid claims and associated expenses, including incurred but not reported losses, is estimated by factoring in pending claims and historical trends data and other actuarial assumptions. In estimating our claims liability, we analyze our historical trends, including loss development and apply appropriate loss development factors to the incurred costs associated with the claims. The discounted estimated liability associated with settling unpaid claims is included in accrued expenses and other long-term liabilities in the consolidated balance sheets.
Concentrations of Credit Risk
Financial instruments that potentially subject the Company to concentrations of credit risk consist primarily of cash, accounts receivable and derivative instruments. The Company maintains cash and cash equivalents with banks that at times exceed applicable insurance limits. The Company reduces its exposure to credit risk by maintaining such deposits with high quality financial institutions. The Company has not experienced any losses in such accounts.
The Company generally does not require collateral on its trade receivables. Credit risk on accounts receivable is minimized as a result of the large and diverse nature of the Company's customer base and its ability to discontinue service, to the extent allowable, to non-paying customers. No single customer represented greater than 5% of total accounts receivable at December 31, 2015 and 2014, respectively.
Asset Impairments
The Company monitors the carrying value of its long-lived assets for potential impairment and test the recoverability of such assets whenever events or changes in circumstances indicate that the carrying amounts may not be recoverable. These events or changes in circumstances, including management decisions pertaining to such assets, are referred to as impairment indicators. Typical indicators that an asset may be impaired include (i) a significant adverse change in legal factors in the business climate, (ii) an adverse action or assessment by a regulator, and (iii) a significant adverse change in the extent or manner in which a long-lived asset is being utilized or in its physical condition. If an impairment indicator occurs, the Company performs a test of recoverability by comparing the carrying value of the asset or asset group to its undiscounted expected future cash flows. If cash flows cannot be separately and independently identified for a single asset, the Company will determine whether an impairment has occurred for the asset group for which it can identify the projected cash flows. If the carrying values are in excess of undiscounted expected future cash flows, the Company measures any impairment by comparing the fair value of the asset or asset group to its carrying value. Fair value is generally determined by considering (i) internally developed discounted projected cash flow analysis of the asset or asset group; (ii) third-party valuations; and/or (iii) information available regarding the current market for
F-12
Advanced Disposal Services, Inc. and Subsidiaries
Notes to Consolidated Financial Statements (Continued)
(In millions, unless otherwise indicated)
2. Summary of Significant Accounting Policies (Continued)
similar assets. If such assets are considered to be impaired, the impairment to be recognized is measured as the amount by which the carrying value exceeds the fair value of the asset.
Property and Equipment, Net
Property and equipment are recorded at cost, less accumulated depreciation. Expenditures for major additions and improvements are capitalized and maintenance activities are expensed as incurred. When property and equipment are retired, sold, or otherwise disposed of, the cost and accumulated depreciation are removed from the accounts, and any resulting gain or loss is included in the results of operations. Long-lived assets are reviewed for impairment whenever events or changes in circumstances indicate that the carrying amount of an asset may not be recoverable. Assets to be disposed of are reported at the lower of the carrying amount or fair value less cost to sell. Depreciation expense is calculated using the straight-line method over the estimated useful lives or the lease term, whichever is shorter. Estimated useful lives are as follows:
| |
Years | |||
|---|---|---|---|---|
| Vehicles | 5 - 10 | |||
| Machinery and equipment | 3 - 10 | |||
| Containers | 5 - 15 | |||
| Furniture and fixtures | 5 - 7 | |||
| Building and improvements | 5 - 39 | |||
Leases
The Company leases property and equipment in the ordinary course of its business. The most significant lease obligations are for property and equipment specific to the waste industry, including real property operated as landfills and transfer stations. The Company's leases have varying terms. Some may include renewal or purchase options, escalation clauses, restrictions, penalties or other obligations that are considered in determining minimum lease payments. The leases are classified as either operating leases or capital leases, as appropriate.
The majority of the Company's leases are operating leases. This classification generally can be attributed to either (i) relatively low fixed minimum lease payments as a result of real property lease obligations that vary based on the volume of waste we receive or process or (ii) minimum lease terms that are much shorter than the assets' economic useful lives. The Company expects that in the normal course of business, its operating leases will be renewed, replaced by other leases, or replaced with fixed asset expenditures. The Company's rent expense during each of the last three years and its future minimum operating lease payments for each of the next five years for which it is contractually obligated as of December 31, 2015 is disclosed in Note 14.
Assets under capital leases are capitalized using interest rates determined at the inception of each lease and are amortized over the lesser of the useful life of the asset or the lease term, as appropriate, on a straight-line basis. The present value of the related lease payments is recorded as a debt obligation.
F-13
Advanced Disposal Services, Inc. and Subsidiaries
Notes to Consolidated Financial Statements (Continued)
(In millions, unless otherwise indicated)
2. Summary of Significant Accounting Policies (Continued)
From an operating perspective, landfills that are leased are similar to landfills the Company owns because generally the Company owns the landfill's operating permit and will operate the landfill for the entire lease term, which in many cases is the life of the landfill. As a result, the Company's landfill leases are generally capital leases. For landfill capital leases that provide for minimum contractual rental obligations, the Company records the present value of the minimum obligation as part of the landfill asset, which is amortized on a units-of-consumption basis over the shorter of the lease term or the life of the landfill. The Company's one leased landfill was sold in fiscal 2013 as disclosed in Note 4.
Landfill Accounting
Costs Basis of Landfill Assets—Landfills are typically developed in a series of cells, each of which is constructed, filled and capped in sequence over the operating life of the landfill. When the final cell is filled and the operating life of the landfill is completed, the cell must be capped and then closed and post-closure care and monitoring activities begin. Capitalized landfill costs include expenditures for land (which includes the land of the landfill footprint and landfill buffer property and setbacks) and related airspace associated with the permitting, development and construction of new landfills, expansions at existing landfills, landfill gas systems and landfill cell development. Landfill permitting, development and construction costs represent direct costs related to these activities, including land acquisition, engineering, legal and construction. These costs are deferred until all permits are obtained and operations have commenced at which point they are capitalized and amortized. If necessary permits are not obtained, costs are charged to operations. The cost basis of our landfill assets also includes asset retirement costs, which represent estimates of future costs associated with landfill final capping, closure and post-closure activities.
Final Capping, Closure and Post-Closure Costs—The following is a description of the Company's asset retirement activities and related accounting:
Final Capping—Includes installing flexible membrane and geosynthetic clay liners, drainage and compact soil layers, and topsoil, and is constructed over an area of the landfill where total airspace capacity has been consumed and waste disposal operations have ceased. These final capping activities occur in phases as needed throughout the operating life of a landfill as specific areas are filled to capacity and the final elevation for that specific area is reached in accordance with the provisions of the operating permit. Final capping asset retirement obligations are recorded on a units-of-consumption basis as airspace is consumed related to the specific final capping event with a corresponding increase in the landfill asset. Each final capping event is accounted for as a discrete obligation and recorded as an asset and a liability based on estimates of the discounted cash flows and capacity associated with each final capping event.
Closure and post-closure—These activities involve methane gas control, leachate management and groundwater monitoring, surface water monitoring and control, and other operational and maintenance activities that occur after the site ceases to accept waste. The post-closure period generally runs for 30 years or longer after final site closure for landfills. Landfill costs related to closure and post-closure are recorded as an asset retirement
F-14
Advanced Disposal Services, Inc. and Subsidiaries
Notes to Consolidated Financial Statements (Continued)
(In millions, unless otherwise indicated)
2. Summary of Significant Accounting Policies (Continued)
obligation as airspace is consumed over the life of the landfill with a corresponding increase in the landfill asset. Obligations are recorded over the life of the landfill based on estimates of the discounted cash flows associated with performing the closure and post-closure activities.
The Company annually updates its estimates for these obligations considering the respective State regulatory requirements, input from our internal engineers, operations, accounting personnel and external consulting engineers. The closure and post-closure requirements are established under the standards of the U.S. Environmental Protection Agency's Subtitle D regulations as implemented and applied on a state-by-state basis. These estimates involve projections of costs that will be incurred as portions of the landfill are closed and during the post-closure monitoring period.
Capping, closure and post-closure costs are estimated assuming such costs would be incurred by a third party contractor in present day dollars and are inflated by the 25-year average change in the historical Consumer Price Index ("CPI") (consistent historical rate which agrees to historical CPI per government website of 2.50% from 1990 to 2015) to the time periods within which it is estimated the capping, closure and post-closure costs will be expended. The Company discounts these costs to present value using the credit-adjusted, risk-free rate effective at the time an obligation is incurred, consistent with the expected cash flow approach. Any change that results in an upward revision to the estimated cash flows are treated as a new liability and discounted at the current rate while downward revisions are discounted at the historical weighted-average rate of the recorded obligation. As a result, the credit-adjusted, risk-free discount rate used to calculate the present value of an obligation is specific to each individual asset retirement obligation. The range of rates utilized within the calculation of the asset retirement obligations at December 31, 2015 is between 6.4% and 10.5%.
The Company records the estimated fair value of the final capping, closure and post-closure liabilities for its landfills based on the capacity consumed in the current period. The fair value of the final capping obligations is developed based on the Company's estimates of the airspace consumed to date for each final capping event and the expected timing of each final capping event. The fair value of closure and post-closure obligations is developed based on the Company's estimates of the airspace consumed to date for the entire landfill and the expected timing of each closure and post-closure activity. Because these obligations are measured at estimated fair value using present value techniques, changes in the estimated cost or timing of future final capping, closure and post-closure activities could result in a material change in these liabilities, related assets and results of operations. The Company assesses the appropriateness of the estimates used to develop our recorded balances annually, or more often if significant facts change.
Changes in inflation rates or the estimated costs, timing or extent of future final capping, closure and post-closure activities typically result in both (i) a current adjustment to the recorded liability and landfill asset; and (ii) a change in liability and asset amounts to be recorded prospectively over either the remaining capacity of the related discrete final capping event or the remaining permitted and expansion airspace (as defined below) of the landfill. Any changes related to the capitalized and future cost of the landfill assets are then
F-15
Advanced Disposal Services, Inc. and Subsidiaries
Notes to Consolidated Financial Statements (Continued)
(In millions, unless otherwise indicated)
2. Summary of Significant Accounting Policies (Continued)
recognized in accordance with the Company's amortization policy, which would generally result in amortization expense being recognized prospectively over the remaining capacity of the final capping event or the remaining permitted and expansion airspace of the landfill, as appropriate. Changes in such estimates associated with airspace that has been fully utilized result in an adjustment to the recorded liability and landfill assets with an immediate corresponding adjustment to landfill airspace amortization expense.
Interest accretion on final capping, closure and post-closure liabilities is recorded using the effective interest method and is recorded in operating expenses in the consolidated statements of operations.
Amortization of Landfill Assets—The amortizable basis of a landfill includes (i) amounts previously expended and capitalized; (ii) capitalized and projected landfill final capping, closure and post-closure costs; (iii) projections of future acquisition and development costs required to develop the landfill site to its remaining permitted and expansion capacity; and (iv) land underlying both the footprint of the landfill and the surrounding required setbacks and buffer land.
Amortization is recorded on a units-of-consumption basis, applying expense as a rate per ton. The rate per ton is calculated by dividing each component of the amortizable basis of a landfill by the number of tons needed to fill the corresponding asset's airspace. For landfills that the Company does not own, but operates through operating or lease arrangements, the rate per ton is calculated based on expected capacity to be utilized over the lesser of the contractual term of the underlying agreement or the life of the landfill.
Landfill site costs are depleted to zero upon final closure of a landfill. The Company develops its estimates of the obligations using input from its operations personnel, engineers and accountants. The obligations are based upon interpretation of current requirements and proposed regulatory changes and are intended to approximate fair value. The estimate of fair value is based upon present value techniques using historical experience and, where available, quoted or actual market prices paid for similar work.
The determination of airspace usage and remaining airspace is an essential component in the calculation of landfill asset depletion. This estimation is performed by conducting periodic topographic surveys, using aerial survey techniques, of the Company's landfill facilities to determine remaining airspace in each landfill. The surveys are reviewed by the Company's external consulting engineers, internal operating staff, and its management, financial and accounting staff.
Remaining airspace will include additional "deemed permitted" or unpermitted expansion airspace if the following criteria are met:
- (1)
- The
Company must either own the property for the expansion or have a legal right to use or obtain property to be included in the expansion plan;
- (2)
- Conceptual
design of the expansion must have been completed;
- (3)
- Personnel are actively working to obtain land use and local and state approvals for an expansion of an existing landfill and the application for expansion must reasonably
F-16
Advanced Disposal Services, Inc. and Subsidiaries
Notes to Consolidated Financial Statements (Continued)
(In millions, unless otherwise indicated)
2. Summary of Significant Accounting Policies (Continued)
- (4)
- There
are no known significant technical, community, business, or political restrictions or similar issues that would likely impair the success of the
expansion; and
- (5)
- Financial analysis has been completed and the results demonstrate that the expansion has a positive financial and operational impact.
be expected to be received within the normal application and processing time periods for approvals in the jurisdiction in which the landfill is located;
Senior management must have reviewed and approved all of the above. Of the Company's 39 active landfills, fifteen include deemed permitted airspace at December 31, 2015.
Upon successful meeting of the preceding criteria, the costs associated with developing, constructing, closing and monitoring the total additional future capacity are considered in the calculation of the amortization and closure and post-closure rates.
Once expansion airspace meets these criteria for inclusion in the Company's calculation of total available disposal capacity, management continuously monitors each site's progress in obtaining the expansion permit. If at any point it is determined that an expansion area no longer meets the required criteria, the deemed expansion airspace is removed from the landfill's total available capacity, and the rates used at the landfill to amortize costs to acquire, construct, close and monitor the site during the post-closure period are adjusted prospectively. In addition, any amounts related to the probable expansion are charged to expense in the period in which it is determined that the criteria are no longer met.
Once the remaining permitted and expansion airspace is determined in cubic yards, an airspace utilization factor ("AUF") is established to calculate the remaining permitted and expansion capacity in tons. The AUF is established using the measured density obtained from previous annual surveys and is then adjusted to account for future settlement. The amount of settlement that is forecasted will take into account several site-specific factors including: current and projected mix of waste type, initial and projected waste density, estimated number of years of life remaining, depth of underlying waste, anticipated access to moisture through precipitation or recirculation of landfill leachate and operating practices. In addition, the initial selection of the AUF is subject to a subsequent multi-level review by our engineering group, and the AUF used is reviewed on a periodic basis and revised as necessary. The Company's historical experience generally indicates that the impact of settlement at a landfill is greater later in the life of the landfill when the waste placed at the landfill approaches its highest point under the permit requirements.
After determining the costs and remaining permitted and expansion capacity at each of its landfills, the Company determines the per ton rates that will be expensed as waste is received and deposited at the landfill by dividing the costs by the corresponding number of tons. The Company calculates per ton amortization rates for each landfill for assets associated with each final capping event, for assets related to closure and post-closure activities and for all other costs capitalized or to be capitalized in the future. These rates per ton are updated annually, or more often, as significant facts change.
F-17
Advanced Disposal Services, Inc. and Subsidiaries
Notes to Consolidated Financial Statements (Continued)
(In millions, unless otherwise indicated)
2. Summary of Significant Accounting Policies (Continued)
It is possible that the Company's estimates or assumptions could ultimately be significantly different from actual results. In some cases the Company may be unsuccessful in obtaining an expansion permit or the Company may determine that an expansion permit that it previously thought was probable has become unlikely. To the extent that such estimates, or the assumptions used to make those estimates, prove to be significantly different than actual results, or the belief that the Company will receive an expansion permit changes adversely in a significant manner, the costs of the landfill, including the costs incurred in the pursuit of the expansion, may be subject to impairment testing and lower profitability may be experienced due to higher amortization rates, higher capping, closure and post-closure rates, and higher expenses or asset impairments related to the removal of previously included expansion airspace.
The assessment of impairment indicators and the recoverability of the Company's capitalized costs associated with landfills and related expansion projects require significant judgment due to the unique nature of the waste industry, the highly regulated permitting process and the estimates involved. During the review of a landfill expansion application, a regulator may initially deny the expansion application although the permit is ultimately granted. In addition, the Company may periodically divert waste from one landfill to another to conserve remaining permitted landfill airspace, or a landfill may be required to cease accepting waste, prior to receipt of the expansion permit. However, such events occur in the ordinary course of business in the waste industry and do not necessarily result in an impairment of the landfill assets because, after consideration of all facts, such events may not affect the belief that the Company will ultimately obtain the expansion permit. As a result, the Company's tests of recoverability, which generally make use of a cash flow estimation approach, may indicate that an impairment loss should be recorded. No landfill impairments were recorded for the years ended December 31, 2015, 2014 and 2013.
Capitalized Interest
The Company capitalizes interest on certain projects under development, including landfill construction projects. For the years ending December 31, 2015, 2014 and 2013, total interest cost was $138.0, $141.5 and $163.1, respectively, after capitalized interest of $0.9, $1.6 and $0.6, respectively.
Derivative Financial Instruments
The Company uses interest rate caps to manage interest rate risk on its variable rate debt. The Company uses commodity futures contracts as an economic hedge to reduce the exposure of changes in diesel fuel and natural gas prices. The instruments qualifying for hedge accounting treatment have been designated as cash flow hedges for accounting purposes with changes in fair value, to the extent effective, recognized in accumulated other comprehensive income within the equity section of the consolidated balance sheets. Amounts are reclassified into earnings when the forecasted transaction affects earnings. Any ineffectiveness for those instruments that do not qualify for hedge accounting, the amount of ineffectiveness or change in market value, respectively is recognized into earnings
F-18
Advanced Disposal Services, Inc. and Subsidiaries
Notes to Consolidated Financial Statements (Continued)
(In millions, unless otherwise indicated)
2. Summary of Significant Accounting Policies (Continued)
immediately without offset. The commodity futures contracts do not qualify for hedge accounting and as such changes in fair value are recognized in other (expense) income, net in the consolidated statements of operations. The fair values of the derivatives are included in other current or long-term assets or other current or long term liabilities as appropriate. The Company obtains current valuations of its commodity futures contracts and interest rate caps based on quotes received from financial institutions that trade these contracts and a current forward fixed price swap curve, respectively.
Debt Issuance Costs
The costs related to the issuance of debt are deferred and recorded as a reduction to the carrying value of debt and amortized to interest expense using the effective interest method.
During fiscal 2014 and 2013, the Company refinanced its Term B Loan and the transaction was accounted for as a modification of debt. The total amount of debt costs deferred for fiscal 2014 and 2013 was approximately $1.3 and $22.9, respectively.
See "New Accounting Standards" section below for discussion of early adoption of ASU 2015-03, Interest—Imputation of Interest. Adoption of the new standard resulted in a $48.4 reduction to both other assets, net and long term debt on the December 31, 2015 consolidated balance sheet. Adoption of the new standard required retrospective application which resulted in a $60.6 reduction to both other assets, net and long term debt as of December 31, 2014.
Acquisitions
The Company recognizes assets acquired and liabilities assumed in business combinations, including contingent assets and liabilities, based on fair values as of the date of acquisition. Any excess of purchase price over the fair value of the net assets acquired is recorded as goodwill.
In certain acquisitions, the Company agrees to pay additional amounts to sellers contingent upon achievement by the acquired businesses of certain negotiated goals, such as targeted revenue levels, targeted disposal volumes or the issuance of permits for expanded landfill airspace. The Company has recognized liabilities for these contingent obligations based on their estimated fair value at the date of acquisition with any differences between the acquisition date fair value and the ultimate settlement of the obligations being recognized as an adjustment to income from operations.
Assets and liabilities arising from contingencies such as pre-acquisition environmental matters and litigation are recognized at their acquisition date fair value when their respective fair values can be determined. If the fair values of such contingencies cannot be determined, the Company reports provisional amounts for which the accounting is incomplete.
Acquisition date fair value estimates are revised as necessary and accounted for as an adjustment to the purchase accounting balances prior to the close of the purchase accounting window. If the purchase accounting window has closed, these estimates are accounted for as
F-19
Advanced Disposal Services, Inc. and Subsidiaries
Notes to Consolidated Financial Statements (Continued)
(In millions, unless otherwise indicated)
2. Summary of Significant Accounting Policies (Continued)
adjustments to income from operations if, and when, additional information becomes available to further define and quantify assets acquired and liabilities assumed. All acquisition-related transaction costs have been expensed as incurred.
Goodwill
Goodwill is the excess of the purchase price over the fair value of the net identifiable assets of acquired businesses. The Company does not amortize goodwill. Goodwill is subject to at least an annual assessment for impairment by evaluating quantitative factors.
The Company performs a quantitative assessment or two-step impairment test to determine whether a goodwill impairment exists at a reporting unit. The reporting units are equivalent to the Company's segments and when an individual business within an integrated operating segment is divested, goodwill is allocated to that business based on its fair value relative to the fair value of its operating segment. The Company compares the fair value with its carrying amount to determine if there is potential impairment of goodwill. If the carrying value exceeds estimated fair value, there is an indication of potential impairment and the second step is performed to measure the amount of impairment. Fair value is estimated using an equal weighting between a market approach and an income approach based on forecasted cash flows. Fair value computed via this method is arrived at using a number of factors, including projected future operating results, economic projections, anticipated future cash flows and comparable marketplace data. There are inherent uncertainties related to these factors and applying them to this analysis. However, the Company believes that this method provides a reasonable approach to estimating the fair value of its reporting units.
The Company performs its annual assessment as of December 31 of each year. The impairment test indicated the fair value of each reporting unit exceeded the carrying value. If the Company does not achieve its anticipated disposal volumes, our collection or disposal rates decline, costs or capital expenditures exceed forecasts, costs of capital increase, or the Company does not receive landfill expansions, the estimated fair value could decrease and potentially result in an impairment charge in the future. Refer to Note 4 for information regarding impairment charges recorded in connection with discontinued operations. The Company recorded no goodwill impairment charges for fiscal 2015, 2014 and 2013 in connection with the assessments.
Intangible Assets, Net
Intangible assets are stated at cost less accumulated amortization and consist of noncompete agreements, tradenames, customer contracts and customer lists and are amortized over their estimated useful lives. The carrying values of intangibles are periodically reviewed by the Company to determine if the facts and circumstances suggest that they may be impaired. If the carrying value exceeds estimated fair value, an impairment charge would be recognized in the amount of the excess. Fair value is typically estimated using an income approach for the respective asset, as described above. The Company recorded impairment charges of $0.0, $2.7 and $0.6 for fiscal 2015, 2014 and 2013, respectively. The impairments in both fiscal 2014 and 2013 were related to the discontinuance of trade names and certain
F-20
Advanced Disposal Services, Inc. and Subsidiaries
Notes to Consolidated Financial Statements (Continued)
(In millions, unless otherwise indicated)
2. Summary of Significant Accounting Policies (Continued)
customer lists. Refer to Note 4 for information regarding impairment charges recorded in connection with discontinued operations.
Income Taxes
The Company is subject to income tax in the United States. Current tax obligations associated with the provision for income taxes are reflected in the accompanying consolidated balance sheets as a component of accrued expenses and the deferred tax obligations are reflected in deferred income tax asset or liability. Deferred income taxes arise from temporary differences resulting from income and expense items reported for financial accounting and tax purposes in different periods. Deferred income taxes are classified as noncurrent as discussed in "New Accounting Standards" below. Significant judgment is required in assessing the timing and amounts of deductible and taxable items. The Company establishes reserves for uncertain tax positions, when despite its belief that its tax return positions are fully supportable, the Company believes that certain positions may be challenged and potentially disallowed. When facts and circumstances change, the Company adjusts these reserves through its provision for income taxes. To the extent interest and penalties may be assessed by taxing authorities on any underpayment of income tax, such amounts have been accrued and are classified as a component of tax expense in the consolidated statements of operations.
Contingencies
The Company is subject to various legal proceedings, claims and regulatory matters, the outcomes of which are subject to significant uncertainty. In general, the Company determines whether to disclose or accrue for loss contingencies based on an assessment of whether the risk of loss is remote, reasonably possible or probable, and whether it can be reasonably estimated. The Company assesses its potential liability relating to litigation and regulatory matters based on information available. The Company develops its assessment based on an analysis of possible outcomes under various strategies. The Company accrues for loss contingencies when such amounts are probable and reasonably estimable. If a contingent liability is only reasonably possible, the Company discloses the potential range of the loss, if estimable.
New Accounting Standards
In November 2015, the Financial Accounting Standards Board ("FASB") issued ASU 2015-17 Income Taxes (Topic 740), Balance Sheet Classification of Deferred Taxes, requiring all deferred tax assets and liabilities, and any related valuation allowance, to be classified as non-current on the balance sheet. The classification change for all deferred taxes as non-current simplifies entities' processes as it eliminates the need to separately identify the net current and net non-current deferred tax asset or liability in each jurisdiction and allocate valuation allowances. For a public entity, the amendments in this update are effective for annual reporting periods beginning after December 15, 2016, including interim periods within that reporting period. Early adoption is permitted for financial statements not previously
F-21
Advanced Disposal Services, Inc. and Subsidiaries
Notes to Consolidated Financial Statements (Continued)
(In millions, unless otherwise indicated)
2. Summary of Significant Accounting Policies (Continued)
issued. The Company elected to prospectively adopt the accounting standard in the beginning of the fourth quarter of fiscal 2015. Prior periods in the Consolidated Financial Statements were not retrospectively adjusted.
In August 2015, the FASB issued ASU No. 2015-15, "Interest—Imputation of Interest (Sub-Topic 835-30): Presentation and Subsequent Measurement of Debt Issuance Costs Associated with Line-of-Credit Arrangements". Given the absence of authoritative guidance within ASU 2015-03 for debt issuance costs related to line-of-credit arrangements, the SEC staff would not object to an entity deferring and presenting debt issuance costs as an asset and subsequently amortizing the deferred debt issuance costs ratably over the term of the line-of-credit arrangement, regardless of whether there are any outstanding borrowings on the line-of-credit arrangement. As with ASU No. 2015-03, for a public entity, the amendments in this Update are effective for annual reporting periods beginning after December 15, 2015, including interim periods within that reporting period. Early application is permitted for financial statements that have not been previously issued. The standard should be adopted retrospectively to each prior reporting period presented and adjusted to reflect the period-specific effects of applying the new guidance. The Company elected to adopt the accounting standard in the beginning of the fourth quarter of fiscal 2015. Prior periods in the Consolidated Financial Statements were not impacted by the adoption of this standard.
In April 2015, the FASB issued ASU 2015-03, Interest—Imputation of Interest, which changes the financial statement presentation of debt issuance costs to be a direct reduction to long-term debt, rather than presented as a long-term asset. The amortization of debt issuance costs will continue to be included in interest expense. This standard is effective for annual reporting periods beginning after December 15, 2015 with early adoption permitted. The Company elected to adopt the accounting standard in the beginning of the fourth quarter of fiscal 2015. Prior periods in the Consolidated Financial Statements have been retrospectively adjusted.
In May 2014, the FASB issued ASU 2014-09, Revenue from Contracts with Customers, which supersedes previous revenue recognition guidance. The new standard requires that a company recognize revenue when it transfers promised goods or services to customers in an amount that reflects the consideration the company expects to receive in exchange for those goods or services. Companies will need to use more judgment and estimates than under the guidance currently in effect, including estimating the amount of variable revenue to recognize over each identified performance obligation. Additional disclosures will be required to help users of financial statements understand the nature, amount and timing of revenue and cash flows arising from contracts. In July 2015, the FASB approved a one-year deferral of the effective date. This standard will now become effective for the Company beginning with the first quarter 2018 and can be adopted either retrospectively to each prior reporting period presented or as a cumulative effect adjustment as of the date of adoption. The Company is currently evaluating the impact of adopting this new guidance on the consolidated financial statements.
F-22
Advanced Disposal Services, Inc. and Subsidiaries
Notes to Consolidated Financial Statements (Continued)
(In millions, unless otherwise indicated)
3. Acquisitions
For fiscal 2015, the Company completed the acquisitions of twelve collection companies. Consideration transferred amounted to approximately $56.3 for these acquisitions, of which $6.6 will be paid in subsequent years. The Company recorded a reduction to the purchase price of prior year acquisitions during fiscal 2015 in the amount of $0.3. The goodwill recognized of $12.0 represents synergies from the combined operations of the acquired entities and the Company. The Company is still reviewing information surrounding property and equipment, intangible assets and current liabilities resulting from the acquisitions, which may result in changes to the Company's preliminary purchase price allocation during fiscal 2016. Transaction costs related to these acquisitions were not significant for fiscal 2015.
For fiscal 2014, the Company completed the acquisitions of eight collection companies. Consideration transferred amounted to approximately $8.6 for these acquisitions, of which $0.8 was paid in 2015. Transaction costs related to these acquisitions were not significant for fiscal 2014.
For the year ended December 31, 2013, the Company completed the acquisitions of seventeen collection companies. Consideration transferred amounted to approximately $31.3 for these acquisitions during fiscal 2013, of which $1.5 was paid in 2014. Transaction costs related to these acquisitions were not significant for the year ended December 31, 2013.
The results of operations of each acquisition are included in the consolidated statements of operations of the Company subsequent to the closing date of each acquisition.
The following table summarizes the estimated fair values of the assets acquired by year of acquisition:
| |
2015 | 2014 | |||||
|---|---|---|---|---|---|---|---|
Current assets |
$ | 2.8 | $ | 0.5 | |||
Property and equipment |
20.4 | 2.6 | |||||
Goodwill |
12.0 | 1.3 | |||||
Other intangible assets |
31.2 | 5.5 | |||||
| | | | | | | | |
Total assets acquired |
66.4 | 9.9 | |||||
| | | | | | | | |
Current liabilities |
4.3 | 1.3 | |||||
Total liabilities assumed |
10.1 | 1.3 | |||||
| | | | | | | | |
Net assets acquired |
$ | 56.3 | $ | 8.6 | |||
| | | | | | | | |
| | | | | | | | |
| | | | | | | | |
The following table presents the allocation of the purchase price to other intangible assets:
| |
2015 | 2014 | |||||
|---|---|---|---|---|---|---|---|
Customer lists and contracts |
$ | 27.8 | $ | 4.3 | |||
Noncompete |
2.6 | 1.2 | |||||
Other |
0.8 | — | |||||
| | | | | | | | |
|
$ | 31.2 | $ | 5.5 | |||
| | | | | | | | |
| | | | | | | | |
| | | | | | | | |
F-23
Advanced Disposal Services, Inc. and Subsidiaries
Notes to Consolidated Financial Statements (Continued)
(In millions, unless otherwise indicated)
3. Acquisitions (Continued)
The amount of goodwill recorded related to 2015 acquisitions for the South Segment, East Segment, and Midwest Segment was $1.6, $1.4, and $9.0, respectively. The amount of goodwill deductible for tax purposes related to acquisitions in fiscal 2015 and fiscal 2014 was $4.1 and $1.3, respectively. The total amount of goodwill deductible for tax purposes was $100.8 and $113.7 at December 31, 2015 and 2014, respectively.
The weighted average life of other intangible assets in years is as follows:
Customer lists and contracts |
15 | |||
Noncompete |
5 |
Goodwill and intangible assets increased by $0.1, $0.1 and $26.6, for the years ended December 31, 2015, 2014 and 2013, respectively, as a result of purchase price adjustments of acquisitions from the previous year. The increases were primarily related to working capital adjustments as a result of finalizing the purchase accounting for the acquisitions.
4. Discontinued Operations
The Company completed the sale of certain assets and liabilities in Oxford, MA for approximately $3.7 in December 2013 and recorded a loss of $11.1 in connection with the sale, as the selling price was less than the carrying value. The loss on the sale in 2013 and the results of operations have been included in discontinued operations in the accompanying consolidated statements of operations for the applicable periods presented.
The Company entered into a letter of intent in December 2013, to sell certain assets in Panama City, FL for approximately $2.0 and in connection with the planned divestiture recorded an impairment charge of $3.6 for the year ended December 31, 2013, as the fair value determined through the selling price was less than the carrying value. The sale was completed in January 2014. The impairment charge has been included in discontinued operations in the accompanying consolidated statement of operations for fiscal 2013.
In connection with the acquisition of Veolia ES Solid Waste division, the Company was required by the United States Department of Justice to divest certain businesses. The Company completed the divestitures in 2013, as required for those businesses in Georgia and New Jersey and recorded no additional impairment charge upon sale for the year ended December 31, 2013.
The Company completed the sale of certain assets and liabilities in New York and New Jersey for approximately $45.0, of which $25.0 was received in cash on the date of closing, $5.0 was received in December 2013 and the remainder was received in fiscal 2015. The Company also reacquired the outstanding minority interest of $2.5 previously held by the minority shareholder in August 2013. In connection with the divestiture, the Company recorded an impairment charge of approximately $7.6 for the year ended December 31, 2013. The results of operations have been included in discontinued operations in the accompanying consolidated statements of operations for the applicable periods presented.
F-24
Advanced Disposal Services, Inc. and Subsidiaries
Notes to Consolidated Financial Statements (Continued)
(In millions, unless otherwise indicated)
4. Discontinued Operations (Continued)
The following table summarizes the revenues and expenses of those businesses that are presented as discontinued operations in the accompanying consolidated statements of operations for the years ended December 31, 2015, 2014 and 2013.
| |
2015 | 2014 | 2013 | |||||||
|---|---|---|---|---|---|---|---|---|---|---|
Service revenues |
$ | — | $ | 0.4 | $ | 104.3 | ||||
Operating costs and expenses |
||||||||||
Operating expenses |
— | 0.9 | 98.7 | |||||||
Selling, general and administrative |
— | 0.3 | 6.9 | |||||||
Depreciation and amortization |
— | 0.3 | 5.9 | |||||||
Gain on disposal of assets |
— | (0.4 | ) | — | ||||||
Asset impairment |
— | — | 22.4 | |||||||
| | | | | | | | | | | |
Total expenses |
— | 1.1 | 133.9 | |||||||
| | | | | | | | | | | |
Other (expense) income |
||||||||||
Interest expense |
— | — | — | |||||||
| | | | | | | | | | | |
Total other (expense) income |
— | — | — | |||||||
| | | | | | | | | | | |
Loss from discontinued operations before income tax |
— | (0.7 | ) | (29.6 | ) | |||||
Tax benefit |
— | (1.0 | ) | (7.1 | ) | |||||
| | | | | | | | | | | |
Income (loss) from discontinued operations, net of taxes |
$ | — | $ | 0.3 | $ | (22.5 | ) | |||
| | | | | | | | | | | |
| | | | | | | | | | | |
| | | | | | | | | | | |
5. Restricted Cash
Restricted cash consists of the following at December 31:
| |
2015 | 2014 | |||||
|---|---|---|---|---|---|---|---|
Funds held for landfill closure and post-closure financial assurance |
$ | — | $ | 0.2 | |||
| | | | | | | | |
| | | | | | | | |
| | | | | | | | |
6. Valuation Allowances
Allowance for doubtful accounts consists of the following at December 31:
| |
2015 | 2014 | 2013 | |||||||
|---|---|---|---|---|---|---|---|---|---|---|
Beginning balance |
$ | 5.0 | $ | 8.4 | $ | 4.0 | ||||
Provision for doubtful accounts |
4.0 | 4.2 | 7.7 | |||||||
Recovery of bad debts |
2.2 | 0.6 | 1.7 | |||||||
Write-offs of bad debt |
(7.0 | ) | (8.2 | ) | (5.4 | ) | ||||
Other |
0.2 | — | 0.4 | |||||||
| | | | | | | | | | | |
|
$ | 4.4 | $ | 5.0 | $ | 8.4 | ||||
| | | | | | | | | | | |
| | | | | | | | | | | |
| | | | | | | | | | | |
F-25
Advanced Disposal Services, Inc. and Subsidiaries
Notes to Consolidated Financial Statements (Continued)
(In millions, unless otherwise indicated)
6. Valuation Allowances (Continued)
The deferred tax asset valuation allowances at December 31 consist of the following:
| |
2015 | 2014 | 2013 | |||||||
|---|---|---|---|---|---|---|---|---|---|---|
Balance at January 1, |
$ | 96.1 | $ | 141.6 | $ | 128.1 | ||||
Decrease in valuation allowance for tax provision for continuing operations |
(0.9 | ) | (51.4 | ) | — | |||||
Increase in valuation allowance for tax provision for continuing operations |
— | 5.9 | 7.6 | |||||||
Additions from purchase accounting |
— | — | 5.9 | |||||||
| | | | | | | | | | | |
Balance at December 31, |
$ | 95.2 | $ | 96.1 | $ | 141.6 | ||||
| | | | | | | | | | | |
| | | | | | | | | | | |
| | | | | | | | | | | |
7. Prepaid Expenses and Other Current Assets
Prepaid expenses and other current assets consist of the following at December 31:
| |
2015 | 2014 | |||||
|---|---|---|---|---|---|---|---|
Prepaid insurance |
$ | 5.6 | $ | 6.3 | |||
Prepaid expenses |
15.4 | 15.8 | |||||
Other receivables and current assets |
4.2 | 3.0 | |||||
Parts and supplies inventory |
8.2 | 9.1 | |||||
| | | | | | | | |
|
$ | 33.4 | $ | 34.2 | |||
| | | | | | | | |
| | | | | | | | |
| | | | | | | | |
8. Derivative Instruments and Hedging Activities
The following table summarizes the fair value of derivative instruments recorded in our consolidated balance sheets.
Derivatives Designated as Hedging Instruments
|
Balance Sheet Location | 2015 | 2014 | ||||||
|---|---|---|---|---|---|---|---|---|---|
Interest rate caps |
Other current assets | 0.2 | 2.7 | ||||||
Derivatives Not Designated as Hedging Instruments |
|||||||||
Fuel commodity derivatives |
Other current liabilities | 16.2 | 20.6 | ||||||
Fuel commodity derivatives |
Other long-term liabilities | — | 6.7 | ||||||
| | | | | | | | | | |
Total derivatives |
$ | 16.0 | $ | 24.6 | |||||
| | | | | | | | | | |
| | | | | | | | | | |
| | | | | | | | | | |
We have not offset fair value amounts recognized for our derivative instruments.
Interest Rate Cap
In December 2012, the Company entered into four interest rate cap agreements to hedge the risk of a rise in interest rates and associated cash flows on the variable rate debt. The interest rate caps expire in various tranches through 2016. The Company recorded the premium of $5.0 in other assets in the consolidated balance sheet and amortizes the premium
F-26
Advanced Disposal Services, Inc. and Subsidiaries
Notes to Consolidated Financial Statements (Continued)
(In millions, unless otherwise indicated)
8. Derivative Instruments and Hedging Activities (Continued)
to interest expense based upon decreases in time value of the caps. Amortization expense was approximately $1.5, $2.1, and $1.3 for fiscal 2015, 2014, and 2013, respectively. The aggregate notional amounts of the contracts were approximately $695.2 at December 31, 2015 and expire in tranches through 2016.
Commodity Futures Contracts
The Company utilizes fuel derivative instruments (commodity futures contracts) as economic hedges of the risk that fuel prices will fluctuate. The Company has used financial derivative instruments for both short-term and long-term time frames and utilizes fixed swap price agreements to manage the identified risk. The Company does not enter into derivative financial instruments for trading or speculative purposes.
Changes in the fair value and settlements of the fuel derivative instruments are recorded in other (expense) income, net in the consolidated statements of operations. The market price of diesel fuel is unpredictable and can fluctuate significantly.
Significant volatility in the price of fuel could adversely affect the business and reduce the Company's operating margins. To manage a portion of that risk, the Company entered into commodity swap agreements that matured in 2015 for 23.8 gallons and mature in 2016 for 13.4 gallons at weighted average prices per gallon that range from $2.20 to $2.84 per gallon. If the mean price of the high and the low of the calculation period for Gulf Coast Ultra Low Sulfur diesel pipeline platts for a gallon of diesel fuel exceeds the contract price per gallon, the Company receives the difference between the average price and the contract price (multiplied by the notional gallons) from the counterparty. If the average price is less than the contract price per gallon, the Company pays the difference to the counterparty. The loss on the Company's fuel derivative contracts during 2015 and 2014 was $15.4 and $29.0, respectively which resulted in a loss in the consolidated statements of operations.
F-27
Advanced Disposal Services, Inc. and Subsidiaries
Notes to Consolidated Financial Statements (Continued)
(In millions, unless otherwise indicated)
9. Property and Equipment, Net
Property and equipment, net consist of the following at December 31:
| |
2015 | 2014 | |||||
|---|---|---|---|---|---|---|---|
Land |
$ | 193.8 | $ | 186.0 | |||
Landfill site costs |
1,277.3 | 1,281.6 | |||||
Vehicles |
539.4 | 490.8 | |||||
Containers |
271.4 | 261.8 | |||||
Machinery and equipment |
141.2 | 134.4 | |||||
Furniture and fixtures |
21.0 | 24.1 | |||||
Building and improvements |
159.1 | 155.3 | |||||
Construction in process |
54.2 | 44.4 | |||||
| | | | | | | | |
|
2,657.4 | 2,578.4 | |||||
Less: Accumulated depreciation on property and equipment |
(500.4 | ) | (411.8 | ) | |||
Less: Accumulated landfill airspace amortization |
(507.1 | ) | (502.7 | ) | |||
| | | | | | | | |
|
$ | 1,649.9 | $ | 1,663.9 | |||
| | | | | | | | |
| | | | | | | | |
| | | | | | | | |
Gross assets under capital lease amount to approximately $38.0 and $27.9 at December 31, 2015 and 2014, respectively. Amortization expense of assets under capital lease was $4.1 and $2.0 for years ended December 31, 2015 and 2014 and not significant for the year ended December 31, 2013.
Depreciation, landfill amortization and depletion expense for fiscal 2015, 2014 and 2013 was $216.3, $229.1 and $236.7, respectively.
10. Landfill Accounting
Liabilities for final closure and post-closure costs consist of the following for the years ended December 31:
| |
2015 | 2014 | |||||
|---|---|---|---|---|---|---|---|
Balance at January 1 |
$ | 201.1 | $ | 184.3 | |||
Increase in retirement obligation |
9.8 | 11.5 | |||||
Accretion of closure and post-closure costs |
13.1 | 13.5 | |||||
Disposition |
(3.2 | ) | — | ||||
Change in estimate |
(2.9 | ) | 5.6 | ||||
Costs incurred |
(24.2 | ) | (13.8 | ) | |||
| | | | | | | | |
|
193.7 | 201.1 | |||||
Less: Current portion |
(30.2 | ) | (29.2 | ) | |||
| | | | | | | | |
Balance at December 31 |
$ | 163.5 | $ | 171.9 | |||
| | | | | | | | |
| | | | | | | | |
| | | | | | | | |
F-28
Advanced Disposal Services, Inc. and Subsidiaries
Notes to Consolidated Financial Statements (Continued)
(In millions, unless otherwise indicated)
11. Other Intangible Assets, Net and Goodwill
Intangible assets, net consist of the following at December 31:
| |
2015 | |||||||||||||||
|---|---|---|---|---|---|---|---|---|---|---|---|---|---|---|---|---|
| |
Gross Carrying Value |
Accumulated Amortization |
Impairment | Net Carrying Value |
Weighted Average Remaining Life (Years) |
|||||||||||
Noncompete agreements |
$ | 19.0 | $ | (14.6 | ) | $ | — | $ | 4.4 | 2.9 | ||||||
Tradenames |
17.2 | (7.8 | ) | — | 9.4 | 15.5 | ||||||||||
Customer lists and contracts |
510.6 | (163.1 | ) | — | 347.5 | 13.6 | ||||||||||
Operating permits |
2.9 | — | — | 2.9 | N/A | |||||||||||
Above/below market leases |
0.4 | (0.1 | ) | — | 0.3 | 10.6 | ||||||||||
| | | | | | | | | | | | | | | | | |
|
$ | 550.1 | $ | (185.6 | ) | $ | — | $ | 364.5 | |||||||
| | | | | | | | | | | | | | | | | |
| | | | | | | | | | | | | | | | | |
| | | | | | | | | | | | | | | | | |
| |
2014 | |||||||||||||||
|---|---|---|---|---|---|---|---|---|---|---|---|---|---|---|---|---|
| |
Gross Carrying Value |
Accumulated Amortization |
Impairment | Net Carrying Value |
Weighted Average Remaining Life (Years) |
|||||||||||
Noncompete agreements |
$ | 16.9 | $ | (12.5 | ) | $ | (0.1 | ) | $ | 4.3 | 2.3 | |||||
Tradenames |
17.0 | (7.1 | ) | — | 9.9 | 16.6 | ||||||||||
Customer lists and contracts |
491.3 | (125.6 | ) | (2.5 | ) | 363.2 | 14.6 | |||||||||
Operating permits |
2.2 | — | — | 2.2 | N/A | |||||||||||
Above/below market leases |
0.4 | (0.1 | ) | — | 0.3 | 11.6 | ||||||||||
| | | | | | | | | | | | | | | | | |
|
$ | 527.8 | $ | (145.3 | ) | $ | (2.6 | ) | $ | 379.9 | ||||||
| | | | | | | | | | | | | | | | | |
| | | | | | | | | | | | | | | | | |
| | | | | | | | | | | | | | | | | |
Amortization expense recorded on intangible assets for the years ended December 31, 2015, 2014 and 2013 was $42.8, $42.3 and $42.2, respectively.
Future amortization expense for intangible assets for the year ending December 31 is estimated to be:
2016 |
44.4 | |||
2017 |
40.9 | |||
2018 |
38.1 | |||
2019 |
29.4 | |||
2020 |
29.0 | |||
Thereafter |
182.7 | |||
| | | | | |
|
$ | 364.5 | ||
| | | | | |
| | | | | |
| | | | | |
F-29
Advanced Disposal Services, Inc. and Subsidiaries
Notes to Consolidated Financial Statements (Continued)
(In millions, unless otherwise indicated)
11. Other Intangible Assets, Net and Goodwill (Continued)
The changes in the carrying amount of goodwill for the years ended December 31, 2015 and 2014 are as follows:
| |
Goodwill | Accumulated Impairment |
Goodwill, Net |
|||||||
|---|---|---|---|---|---|---|---|---|---|---|
December 31, 2013 |
$ | 1,253.9 | $ | (87.5 | ) | $ | 1,166.4 | |||
Acquisition |
1.3 | — | 1.3 | |||||||
Disposition of businesses |
— | (0.8 | ) | (0.8 | ) | |||||
| | | | | | | | | | | |
December 31, 2014 |
1,255.2 | (88.3 | ) | 1,166.9 | ||||||
Acquisition |
12.0 | — | 12.0 | |||||||
Disposition of businesses |
— | (5.4 | ) | (5.4 | ) | |||||
| | | | | | | | | | | |
December 31, 2015 |
$ | 1,267.2 | $ | (93.7 | ) | $ | 1,173.5 | |||
| | | | | | | | | | | |
| | | | | | | | | | | |
| | | | | | | | | | | |
12. Accrued Expenses
Accrued expenses consist of the following at December 31:
| |
2015 | 2014 | |||||
|---|---|---|---|---|---|---|---|
Accrued compensation and benefits |
$ | 32.4 | $ | 28.3 | |||
Accrued waste disposal costs |
39.8 | 37.2 | |||||
Accrued insurance and self-insurance reserves |
15.1 | 14.9 | |||||
Accrued severance |
2.2 | 3.6 | |||||
Derivative valuation |
16.2 | 20.6 | |||||
Other accrued expenses |
30.0 | 26.1 | |||||
| | | | | | | | |
|
$ | 135.7 | $ | 130.7 | |||
| | | | | | | | |
| | | | | | | | |
| | | | | | | | |
F-30
Advanced Disposal Services, Inc. and Subsidiaries
Notes to Consolidated Financial Statements (Continued)
(In millions, unless otherwise indicated)
13. Long-Term Debt
Long-term debt consists of the following at December 31:
| |
2015 | 2014 | |||||
|---|---|---|---|---|---|---|---|
Revolving line of credit with lenders, interest at base rate plus margin, as defined (4.42% and 4.16% at December 31, 2015 and 2014, respectively) due quarterly; balance due at maturity on October 2017 |
$ | 32.0 | $ | — | |||
Term loans; quarterly payments commencing March 31, 2013 through June 30, 2019 with final payment due October 9, 2019; interest at LIBOR floor of 0.75% plus an applicable margin |
1,685.5 | 1,749.0 | |||||
Senior notes payable; interest at 8.25% payable in arrears semi-annually commencing April 1, 2013; maturing on October 1, 2020. |
550.0 | 550.0 | |||||
Capital lease obligations, maturing through 2024 |
28.2 | 23.3 | |||||
Other debt |
20.0 | 4.9 | |||||
| | | | | | | | |
|
2,315.7 | 2,327.2 | |||||
Less: Original issue discount and debt issuance costs classified as a reduction to long-term debt |
(68.6 | ) | (84.2 | ) | |||
Less: Current portion |
(49.1 | ) | (25.3 | ) | |||
| | | | | | | | |
|
$ | 2,198.0 | $ | 2,217.7 | |||
| | | | | | | | |
| | | | | | | | |
| | | | | | | | |
Annual aggregate principal maturities at December 31, 2015 are as follows:
2016 |
$ | 49.1 | ||
2017 |
29.6 | |||
2018 |
24.8 | |||
2019 |
1,649.3 | |||
2020 |
552.4 | |||
Thereafter |
10.5 | |||
| | | | | |
|
$ | 2,315.7 | ||
| | | | | |
| | | | | |
| | | | | |
In October 2012, the Company placed $1,800.0 in term B loans, $550.0 in bonds and a $300.0 revolving credit facility ("Revolver"). The proceeds were used to finance the acquisition of Veolia ES Solid Waste division and repay borrowings under its previously outstanding revolving credit facility and extinguish term loans and notes payable. Substantially all of the Company's assets collateralize the loans, bonds and credit facility and each of the agreements restrict further indebtedness and payment of dividends in excess of certain predefined amounts.
All borrowings under the term B loan and the Revolver are guaranteed by each of the Company's current and future U.S. subsidiaries (which also guarantee the 8.25% bonds), subject to certain agreed-upon exemptions. The Company has one non-guarantor foreign subsidiary that is minor, as its assets and income from continuing operations are less than 3% of the Company's consolidated amounts. All guarantors are jointly and severally and fully and unconditionally liable. The parent company has no independent assets or operations and each
F-31
Advanced Disposal Services, Inc. and Subsidiaries
Notes to Consolidated Financial Statements (Continued)
(In millions, unless otherwise indicated)
13. Long-Term Debt (Continued)
of the subsidiary guarantor is 100% owned by the Company. There are no significant restrictions on the Company or any guarantor to obtain funds from its subsidiaries by dividend or loan.
The Revolver is a syndicated revolving credit facility that is available for general corporate purposes including working capital, equipment purchases and business acquisitions and collateralized by the real property of the Company. It is due at maturity in October, 2017. At December 31, 2015, the Revolver had $32.0 of borrowings outstanding and $45.9 in letters of credit outstanding. At December 31, 2014, the Revolver facility had no borrowings outstanding and $58.1 in outstanding letters of credit. An annual commitment fee equal to 0.50% per annum on the daily unused amount is due quarterly. The amount of fees for 2015, 2014 and 2013 were not significant.
The term B loan is due in September 2019 and has payments due quarterly of $4.5 with mandatory prepayments due to the extent net cash proceeds from the sale of assets exceed $25.0 in any fiscal year and are not reinvested in the business within 365 days from the date of sale, upon notification of the Company's intent to take such action or in accordance with excess cash flow, as defined. The term B loan is collateralized by certain real property of the Company. Further prepayments are due when there is excess cash flow, as defined.
On October 1, 2016 and 2017, the bonds may be redeemed for a call premium of 104.125% and 102.063%, respectively. Subsequent to October 1, 2018, the notes are redeemable at par. The bonds bear interest at 8.25% and are due in October 2020.
The term B loan bears interest at a base rate (alternate base rate or LIBOR base rate) plus an applicable margin. The alternate base rate is defined as the greater of the prime rate or federal funds rate plus 50 basis points and the LIBOR base rate is subject to a 0.75% floor.
The Revolver loan bears interest at a base rate (alternate base rate or LIBOR base rate) plus an applicable margin. The alternate base rate is defined as the greater of the prime rate or federal funds rate plus 50 basis points and the LIBOR base rate is subject to a 1.25% floor.
The applicable margin for the term B loan is based on the total leverage ratio of the Company as follows:
Total Leverage Ratio
|
LIBOR Base Rate | Alternate Base Rate | ||
|---|---|---|---|---|
<4.75:1.00 |
2.50% | 2.50% | ||
³4.75:1.00 |
3.00% | 3.00% |
The applicable margin for the Revolver is based on the total leverage ratio of the Company as follows:
Total Leverage Ratio
|
LIBOR Base Rate | Alternate Base Rate | ||
|---|---|---|---|---|
<4.75:1.00 |
3.50% | 2.50% | ||
³4.75:1.00 |
4.00% | 3.00% |
F-32
Advanced Disposal Services, Inc. and Subsidiaries
Notes to Consolidated Financial Statements (Continued)
(In millions, unless otherwise indicated)
13. Long-Term Debt (Continued)
Fair Value of Debt
The fair value of the Company's debt is estimated using discounted cash flow analyses, based on rates the Company would currently pay for similar types of instruments except for variable rate debt for which cost approximates fair value due to the short-term nature of the interest rate (Level 2 inputs). Although the Company has determined the estimated fair value amounts using available market information and commonly accepted valuation methodologies, considerable judgment is required in interpreting the information and in developing the estimated fair values. Therefore, these estimates are not necessarily indicative of the amounts that the Company, or holders of the instruments, could realize in a current market exchange. The fair value estimates are based on information available as of December 31, 2015 and 2014 respectively.
The estimated fair value of our debt is as follows at December 31:
| |
2015 | 2014 | |||||
|---|---|---|---|---|---|---|---|
Revolving Credit Facility |
$ | 32.0 | $ | — | |||
Senior Notes |
$ | 555.5 | $ | 550.0 | |||
Term Loan B Facility |
1,639.2 | 1,692.2 | |||||
| | | | | | | | |
|
$ | 2,226.7 | $ | 2,242.2 | |||
| | | | | | | | |
| | | | | | | | |
| | | | | | | | |
The carrying value of the debt at December 31, 2015 is approximately $2,267.5 compared to $2,299.0 at December 31, 2014.
14. Leases
The Company leases certain facilities under operating lease agreements. Future minimum lease payments as of December 31, 2015 for noncancelable operating leases that have initial or remaining terms in excess of one year are as follows:
2016 |
$ | 5.8 | ||
2017 |
4.6 | |||
2018 |
4.2 | |||
2019 |
3.6 | |||
2020 |
3.0 | |||
Thereafter |
18.7 | |||
| | | | | |
|
$ | 39.9 | ||
| | | | | |
| | | | | |
| | | | | |
The total rental expense for all operating leases for the years ended December 31, 2015, 2014 and 2013 was $9.3, $10.2 and $12.4, respectively.
Direct rental expense, consisting of rental expense at operating locations, is included in operating expenses, and rental expense for corporate offices is included in selling, general and administrative expenses in the consolidated statements of operations.
F-33
Advanced Disposal Services, Inc. and Subsidiaries
Notes to Consolidated Financial Statements (Continued)
(In millions, unless otherwise indicated)
15. Stockholders' Equity and Stock Options
(Share amounts not in millions)
The Company's equity consists of one thousand shares of authorized, issued and outstanding common stock.
In October 2012, the Parent's Board of Directors adopted the 2012 Stock Incentive Plan (the "Plan") under which an aggregate of 150,000 shares of the Parent's common stock was reserved for issuance. The Plan provides for employees of the Company to participate in the plan and provides that the options or stock purchase rights have a term of ten years and vest equally over four years at a rate of 20% with 20% of the options being vested at the date of grant for all options except the Strategic grants which vest 100% after five years. All options of the Strategic Plan issued prior to 2010 vest upon a change of control. All other options vest in 20% tranches from the date of issuance upon a change of control.
These options have an assumed forfeiture rate ranging from 5.7%-14.8% for 2015 and 2014.
Stock Option Plans
The fair value of the options granted is estimated using the Black-Scholes option pricing model using the following assumptions:
| |
2015 | 2014 | 2013 | |||||
|---|---|---|---|---|---|---|---|---|
Average expected term (years) |
6.9 | 6.0 | 6.0 | |||||
Risk-free interest rate |
1.76% - 1.93% | 1.83% - 2.10% | 0.93 | % | ||||
Expected volatility |
30.0% | 30.0% | 20.0 | % | ||||
Since the Company does not have any historical exercise data that is indicative of expected future exercise performance, it has elected to use the "simplified method" to estimate the options expected term by taking the average of each vesting-tranche and the contractual term. The Company used the average weekly historical volatility for public companies in the solid waste sector to estimate historical volatility used in the Black-Scholes model. The risk-free rate used was based on the US Treasury security rate estimated for the expected term of the option at the date of grant. The Company has applied a discount for lack of marketability ranging from 9% to 10% for shares issued in 2015, 2014 and 2013, to the option value as the shares being valued are privately held and not readily marketable. No dividends are expected to issued.
F-34
Advanced Disposal Services, Inc. and Subsidiaries
Notes to Consolidated Financial Statements (Continued)
(In millions, unless otherwise indicated)
15. Stockholders' Equity and Stock Options (Continued)
Annual Stock Options
A summary of the Annual Stock Options and Senior Management Stock Options outstanding for the year ended December 31, 2015 (in millions, except share and per share amounts) is as follows:
| |
Number of Shares |
Weighted- Average Exercise Price |
Weighted- Average Remaining Contractual Term |
|||||||
|---|---|---|---|---|---|---|---|---|---|---|
Outstanding at January 1, 2015 |
38,928 | $ | 659 | |||||||
Granted |
4,750 | 896 | ||||||||
Exercised |
(117 | ) | 409 | |||||||
Expired or forfeited |
(1,925 | ) | 676 | |||||||
| | | | | | | | | | | |
Outstanding at December 31, 2015 |
41,636 | 686 | 6.08 | |||||||
| | | | | | | | | | | |
| | | | | | | | | | | |
| | | | | | | | | | | |
Exercisable at December 31, 2015 |
30,667 | $ | 628 | 5.45 | ||||||
| | | | | | | | | | | |
| | | | | | | | | | | |
| | | | | | | | | | | |
The weighted-average grant-date fair value of options granted per share was $291, $268 and $268 during 2015, 2014, and 2013, respectively. The total fair value of options vested was $1.0, $1.6 and $1.8 during fiscal 2015, 2014, and 2013, respectively. The intrinsic value of the options outstanding at December 31, 2015 was approximately $8.8. The intrinsic value of options exercised during fiscal 2015 was $0.1.
Strategic Stock Options
A summary of the Strategic Stock Options for the year ended December 31, 2015 (in millions, except share and per share amounts) is as follows:
| |
Number of Shares |
Weighted- Average Exercise Price |
Weighted- Average Remaining Contractual Term |
|||||||
|---|---|---|---|---|---|---|---|---|---|---|
Outstanding at January 1, 2015 |
39,728 | $ | 572 | |||||||
Granted |
6,410 | 896 | ||||||||
Exercised |
(715 | ) | 409 | |||||||
Expired or forfeited |
(4,085 | ) | 767 | |||||||
| | | | | | | | | | | |
Outstanding at December 31, 2015 |
41,338 | $ | 606 | 4.79 | ||||||
| | | | | | | | | | | |
| | | | | | | | | | | |
| | | | | | | | | | | |
Exercisable at December 31, 2015 |
21,608 | $ | 412 | 2.15 | ||||||
| | | | | | | | | | | |
| | | | | | | | | | | |
| | | | | | | | | | | |
The weighted-average grant-date fair value of options granted per share was $331, $306 and $272 during fiscal 2015, 2014 and 2013, respectively. The intrinsic value of the options outstanding at December 31, 2015 was approximately $12.1. The intrinsic value of options exercised during fiscal 2015 was $0.3.
F-35
Advanced Disposal Services, Inc. and Subsidiaries
Notes to Consolidated Financial Statements (Continued)
(In millions, unless otherwise indicated)
15. Stockholders' Equity and Stock Options (Continued)
Compensation Expense
Compensation expense is recognized ratably over the vesting period for those awards that the Company expects to vest. For fiscal 2015, 2014 and 2013, the Company recognized share-based compensation expense as a component of selling, general and administrative expenses of $3.1, $4.5 and $4.6, respectively. As of December 31, 2015, the Company estimates that a total of approximately $3.2 of currently unrecognized compensation expense will be recognized over a weighted average period of approximately three years for unvested options issued and outstanding.
16. Insurance
The Company carries insurance coverage for protection of its assets and operations from certain risks including automobile liability, general liability, real and personal property damage, workers' compensation claims, directors' and officers' liability, pollution liability, employee group health claims and other coverages that are customary in the industry. The Company's exposure to loss for insurance claims is generally limited to the per incident deductible under the related insurance policy. As of December 31, 2015, the Company's insurance programs carried self-insurance exposures of up to $0.5, $1.0 and $0.8 per incident for general liability, automobile and workers' compensation, respectively. Certain self-insurance claims reserves are recorded at present value using a 1.31% and a 1.10% discount rate as of December 31, 2015 and 2014, respectively.
The Company has a partially self-insured employee group health insurance program that carries an aggregate stop loss amount. The amount recorded for the health insurance liability at December 31, 2015 and 2014 for unpaid claims, including an estimate for IBNR claims, was $4.1 and $4.7, respectively. Liabilities are recorded gross of expected recoveries.
The self-insured portion of workers' compensation liability for unpaid claims and associated expenses, including IBNR claims, is based on an actuarial valuation and internal estimates. The amount recorded for workers' compensation liability at December 31, 2015 and 2014 for unpaid claims, including an estimate for IBNR claims, is $24.9 and $25.1, respectively.
The self-insured portion of general liability and automobile liability for unpaid claims and associated expenses, including IBNR claims, is based on an actuarial valuation and internal estimates. The amount recorded for general and automobile liability at December 31, 2015 and 2014 for unpaid claims, including an estimate for IBNR claims, was $17.5 and $18.0, respectively.
Of the above amounts, $19.2 and $19.6 is included in accrued expenses and the remainder is included in other long-term liabilities at December 31, 2015 and 2014, respectively.
17. Benefit Plans
The Company has 401(k) Savings Plans ("401(k) Plan") for the benefit of qualifying full-time employees who have more than 90 days of service and are over 21 years of age.
F-36
Advanced Disposal Services, Inc. and Subsidiaries
Notes to Consolidated Financial Statements (Continued)
(In millions, unless otherwise indicated)
17. Benefit Plans (Continued)
Employees make pre-tax contributions to the 401(k) Plan with a partial matching contribution made by the Company. The Company's matching contributions to the 401(k) Plan were $3.2, $2.8 and $2.8 for fiscal 2015, 2014 and 2013, respectively. Contributions by the Company are included in operating costs and expenses in the accompanying consolidated statements of operations.
The Company is a participating employer in a number of trustee-managed multiemployer, defined benefit pension plans for employees who participate in collective bargaining agreements. Approximately 13% of the Company's workforce is subject to a collective bargaining agreement and two of the collective bargaining agreements expire within one year. The risks of participating in the multiemployer plans are different from single-employer plans in that (i) assets contributed to the multiemployer plan by one employer may be used to provide benefits to employees of other participating employers; (ii) if a participating employers stops contributing to the plan, the unfunded obligations of the plan may be required to be assumed by the remaining participating employers; and (iii) if the Company chooses to stop participating in any of the multiemployer plans, it may be required to pay those plans a withdrawal amount based on the underfunded status of the plan. The total contributions made to all plans for fiscal 2015 was $4.7, of which $0.2 is related to plans that are not individually significant.
F-37
Advanced Disposal Services, Inc. and Subsidiaries
Notes to Consolidated Financial Statements (Continued)
(In millions, unless otherwise indicated)
17. Benefit Plans (Continued)
The following table outlines the Company's participation in multiemployer plans considered to be individually significant:
| |
|
Pension Protection Act Zone Status |
|
|
|
|
Expiration Date of Collective- Bargaining Agreement |
|||||||||||||||
|---|---|---|---|---|---|---|---|---|---|---|---|---|---|---|---|---|---|---|---|---|---|---|
| |
|
|
Contributions | |||||||||||||||||||
| |
EIN/Pension Plan Number |
FIP/RP Status Pending/ Implemented (B) |
||||||||||||||||||||
Pension Fund
|
2014 | 2013 | 2015 | 2014 | 2013 | |||||||||||||||||
Suburban Teamsters of Northern IL Pension Fund |
36-6155778-001 | Critical as of 1/1/2014 |
Critical as of 1/1/2013 |
Implemented | $ | 0.6 | $ | 0.5 | $ | 0.4 | 1/31/2019 | |||||||||||
Pension Fund of Automobile Mechanics Local No. 701 |
36-6042061-001 | Critical as of 1/1/2014 |
Critical as of 1/1/2013 |
Implemented | $ | 0.2 | $ | 0.2 | $ | 0.2 | 12/31/2018 | |||||||||||
Local 731 Private Scavengers and Garage Attendants Pension Fund (A) |
36-6513567-001 | Not Endangered as of 10/1/2014 |
Endangered as of 10/1/2013 |
Implemented | $ | 1.8 | $ | 1.7 | $ | 1.6 | 9/30/2018 | |||||||||||
Midwest Operating Engineers Pension Fund |
36-6140097-001 | Endangered as of 4/1/14 |
Endangered as of 4/1/12 |
Implemented | $ | 0.6 | $ | 0.6 | $ | 0.5 | 9/30/2016 | |||||||||||
Teamsters Local Union No. 301 Union Pension Fund (A) |
36-6492992-001 | Not endangered or critical as of 1/1/14 |
Not endangered or critical as of 1/1/13 |
No | $ | 0.9 | $ | 0.8 | $ | 0.6 | 9/30/2016 | |||||||||||
Central States Southeast and Southwest Areas Pension Fund |
36-6064560-001 | Critical as of 1/1/2014 | Critical as of 1/1/2013 | Implemented | $ | 0.2 | $ | 0.2 | $ | 0.2 | 1/31/2015 | |||||||||||
Local 705 Int'l Brotherhood of Teamsters Pension TR. FD. |
36-6492502-001 | Critical as of 1/1/2014 | Critical as of 1/1/2013 | Implemented | $ | 0.2 | $ | 0.2 | $ | 0.2 | 9/30/2018 | |||||||||||
- (A)
- The
employers' contributions to the plan represent greater than 5% of the total contributions to the plan for the most recent plan year available.
- (B)
- A multi-employer defined benefit pension plan that has been certified as endangered, seriously endangered, or critical may begin to levy a statutory surcharge on contribution rates. Once authorized, the surcharge is at the rate of 5% for the first 12 months and 10% for any periods thereafter. Contributing employers, however, may eliminate the surcharge by entering into a collective bargaining agreement that meets the requirements of the applicable funding improvement plan or rehabilitation plan.
F-38
Advanced Disposal Services, Inc. and Subsidiaries
Notes to Consolidated Financial Statements (Continued)
(In millions, unless otherwise indicated)
18. Income Taxes
The components of the benefit from income taxes from continuing operations are comprised of the following for the years ended December 31:
| |
2015 | 2014 | 2013 | |||||||
|---|---|---|---|---|---|---|---|---|---|---|
Current |
||||||||||
Federal |
$ | 0.4 | $ | 0.2 | $ | — | ||||
State |
1.8 | 2.7 | 2.4 | |||||||
| | | | | | | | | | | |
|
2.2 | 2.9 | 2.4 | |||||||
| | | | | | | | | | | |
Deferred |
||||||||||
Federal |
(17.4 | ) | (83.2 | ) | (39.4 | ) | ||||
State |
(4.2 | ) | (0.3 | ) | (8.4 | ) | ||||
| | | | | | | | | | | |
|
(21.6 | ) | (83.5 | ) | (47.8 | ) | ||||
| | | | | | | | | | | |
Benefit from income taxes |
$ | (19.4 | ) | $ | (80.6 | ) | $ | (45.4 | ) | |
| | | | | | | | | | | |
| | | | | | | | | | | |
| | | | | | | | | | | |
The Company accounts for income taxes in accordance with current guidance. For fiscal 2015, 2014 and 2013, the federal statutory rate in effect was 35%, 35% and 34%, respectively. A reconciliation between the benefit from income taxes and the expected tax benefit for continuing operations using the federal statutory rate in effect for the years ended December 31 as follows:
| |
2015 | 2014 | 2013 | |||||||
|---|---|---|---|---|---|---|---|---|---|---|
Amount computed using statutory rates |
$ | (18.6 | ) | $ | (34.3 | ) | $ | (47.6 | ) | |
State income taxes, net of Federal benefit |
(5.1 | ) | (1.3 | ) | (2.4 | ) | ||||
State tax rate adjustment |
1.7 | 6.6 | 0.1 | |||||||
Uncertain tax positions and interest |
1.0 | — | — | |||||||
Nondeductible expenses |
1.8 | — | — | |||||||
Other |
0.7 | (0.2 | ) | 1.1 | ||||||
Valuation allowance |
(0.9 | ) | (51.4 | ) | 3.4 | |||||
| | | | | | | | | | | |
Benefit from income taxes |
$ | (19.4 | ) | $ | (80.6 | ) | $ | (45.4 | ) | |
| | | | | | | | | | | |
| | | | | | | | | | | |
| | | | | | | | | | | |
F-39
Advanced Disposal Services, Inc. and Subsidiaries
Notes to Consolidated Financial Statements (Continued)
(In millions, unless otherwise indicated)
18. Income Taxes (Continued)
The Company's deferred tax assets and liabilities from continuing operations relate to the following sources and differences between financial accounting and the tax basis of the Company's assets and liabilities at December 31:
| |
2015 | 2014 | |||||
|---|---|---|---|---|---|---|---|
Deferred tax assets |
|||||||
Allowance for doubtful accounts |
$ | 1.7 | $ | 2.0 | |||
Insurance reserve |
16.8 | 17.5 | |||||
Net operating loss |
176.5 | 178.3 | |||||
Capital loss carryforward |
69.1 | 69.1 | |||||
Accrued bonus and vacation |
9.0 | 7.7 | |||||
Stock compensation |
1.9 | 1.8 | |||||
Other comprehensive income |
— | 0.6 | |||||
Tax credits |
7.2 | 6.9 | |||||
Other |
21.4 | 21.1 | |||||
| | | | | | | | |
Total deferred tax assets |
303.6 | 305.0 | |||||
Valuation allowance |
(95.2 | ) | (96.1 | ) | |||
| | | | | | | | |
Deferred tax assets less valuation allowance |
208.4 | 208.9 | |||||
| | | | | | | | |
Deferred tax liabilities |
|||||||
Fixed asset basis |
(110.8 | ) | (117.8 | ) | |||
Intangible basis |
(123.7 | ) | (127.2 | ) | |||
Landfill and environmental remediation liabilities |
(109.8 | ) | (113.8 | ) | |||
Other |
(3.1 | ) | (5.4 | ) | |||
| | | | | | | | |
Deferred tax liabilities |
(347.4 | ) | (364.2 | ) | |||
| | | | | | | | |
Net deferred tax liability |
$ | (139.0 | ) | $ | (155.3 | ) | |
| | | | | | | | |
| | | | | | | | |
| | | | | | | | |
The amounts recorded as deferred tax assets as of December 31, 2015 and 2014 represent the amounts of tax benefits of existing deductible temporary differences or net operating and capital loss carryforwards. Realization of deferred tax assets is dependent upon the generation of sufficient taxable income prior to expiration of any loss carryforwards. A valuation allowance has been recorded against deferred tax assets as of December 31, 2015 in the amount of $95.2. The valuation allowance for the year ended December 31, 2014 was $96.1. The Company has established valuation allowances for uncertainties in realizing the benefit of certain tax loss and credit carryforwards. While the Company expects to realize the deferred tax assets, net of the valuation allowances, changes in estimates of future taxable income or in tax laws may alter this expectation.
The Company had available federal NOL carryforwards from continuing operations of approximately $417.4 and $432.5 at December 31, 2015 and 2014 respectively. The Company's federal net operating losses have expiration dates beginning in the year 2019 through 2033 if not utilized against taxable income. The capital losses of $182.9 expire in 2017 and 2018, if not previously utilized against capital gains.
F-40
Advanced Disposal Services, Inc. and Subsidiaries
Notes to Consolidated Financial Statements (Continued)
(In millions, unless otherwise indicated)
18. Income Taxes (Continued)
In 2014, the Company recognized a decrease in valuation allowance of $51.4, which was primarily related to the completion of a legal entity restructuring that was undertaken in order to drive administrative and legal efficiencies. As a result of the operational restructuring, during the fourth quarter of 2014, the Company was able to project and support its ability to utilize certain federal net operating losses that were previously limited under the Seperate Return Limitation Year ("SRLY") tax rules.
The Company has grown through a series of acquisitions and mergers and has had change of control events that resulted in limitations on the utilization of NOLs pursuant to Section 382 of the Internal Revenue Code ("IRC"). Approximately $169.8 of the NOLs from continuing operations are limited under the SRLY rules of the IRC. These NOLs are only available to be utilized against taxable income of the HWStar Waste Holdings, Corp. and subsidiaries thereof, a wholly-owned subsidiary of the Company. At this time, the Company expects to utilize these NOLs, as a result of the operational restructuring discussed above.
A predecessor of the Company had a transaction on June 2, 2002 that was treated as a reorganization. The Company estimates that it is subject to an annual limitation of approximately $3.5 on NOLs of approximately $78.2 originating prior to June 28, 2002. The predecessor had a subsequent change of control on November 1, 2005. As such, NOLs of $4.8 originating after June 28, 2002 through November 1, 2005 are subject to an annual limitation of $4.2.
A reconciliation of the beginning and ending amount of gross unrecognized tax benefits for 2015, 2014 and 2013 is as follows:
| |
2015 | 2014 | 2013 | |||||||
|---|---|---|---|---|---|---|---|---|---|---|
Balance at January 1, |
$ | 6.2 | $ | 6.2 | $ | 6.2 | ||||
Additions based on tax positions of prior years |
0.5 | — | — | |||||||
Additions based on tax positions of current year |
0.6 | — | — | |||||||
| | | | | | | | | | | |
Balance at December 31, |
$ | 7.3 | $ | 6.2 | $ | 6.2 | ||||
| | | | | | | | | | | |
| | | | | | | | | | | |
| | | | | | | | | | | |
These liabilities are included as a component of other liabilities in the Company's consolidated balance sheet. The Company does not anticipate that settlement of the liabilities will require payment of cash within the next 12 months. As of December 31, 2015, $0.7 of net unrecognized tax benefit, if recognized in future periods, would impact the Company's effective rate.
The Company recognizes interest expense related to unrecognized tax benefits in tax expense. During the tax years ended December 31, 2015, 2014 and 2013, respectively, the Company recognized approximately $0.2 of such interest expense as a component of the "Provision for Income Taxes" in each of the years.
The Company had approximately $2.2 and $2.0 of accrued interest and $0.3 and $0.3 of accrued penalties in its balance sheet as of December 31, 2015 and 2014, respectively.
F-41
Advanced Disposal Services, Inc. and Subsidiaries
Notes to Consolidated Financial Statements (Continued)
(In millions, unless otherwise indicated)
18. Income Taxes (Continued)
The Company and its subsidiaries are subject to income tax in the United States at the federal, state, and local jurisdictional levels. During 2015, the Company finalized its 2012 federal audit with no changes reported. The company has open tax years dating back to 2000. There were no settlements of state audits during 2015. Prior to the acquisition, Veolia ES Solid Waste division was part of a consolidated group and is still subject to IRS and state examinations dating back to 2004. Pursuant to the terms of the acquisition of Veolia ES Solid Waste, Inc., the Company is entitled to certain indemnifications for Veolia ES Solid Waste Division's pre-acquisition tax liabilities. During 2015, there were no changes in federal or state law that would result in a material impact to the financial statements or future cash flows.
19. Fair Value of Financial Instruments
As a basis for considering assumptions, the fair value guidance establishes a three-tier fair value hierarchy, which prioritizes the inputs used in measuring fair value as follows:
Level 1 |
Observable inputs such as quoted prices in active markets; | |
Level 2 |
Inputs, other than the quoted prices in active markets, that are observable either directly or indirectly; and |
|
Level 3 |
Unobservable inputs in which there is little or no market data, which require the reporting entity to develop its own assumptions. |
Assets and liabilities measured at fair value are based on one or more of three valuation techniques noted in the guidance. The three valuation techniques are as follows:
Market approach
Prices and other relevant information generated by market transactions involving identical or comparable assets and liabilities;
Cost approach
Amount that would be required to replace the service capacity of an asset (i.e., replacement cost); and;
Income approach
Techniques to convert future amounts to a single present amount are based on market expectations (including present value techniques, option-pricing models, and lattice models).
The Company's financial assets and liabilities recorded at fair value on a recurring basis include derivative instruments and certain investments included in cash equivalent money market funds. The Company's fuel derivative instruments and interest rate caps are recorded at their estimated fair values based on quotes received from financial institutions that trade these contracts and a current forward fixed price swap curve, respectively. The Company verifies the reasonableness of these quotes using similar quotes from another financial institution as of each date for which financial statements are prepared. For the Company's fuel
F-42
Advanced Disposal Services, Inc. and Subsidiaries
Notes to Consolidated Financial Statements (Continued)
(In millions, unless otherwise indicated)
19. Fair Value of Financial Instruments (Continued)
derivative instruments, the Company also considers the Company's and counterparty's credit worthiness in its determination of the fair value measurement of these instruments in a net liability position. The Company's restricted cash measured at fair value is invested primarily in U.S. government and agency securities.
All instruments were valued using the market approach. The Company's interest rate caps are valued using a third-party pricing model that incorporates information about LIBOR yield curves, which is considered observable market data, for each instrument's respective term. Counterparties to the Company's interest rate caps are financial institutions who participate in the term B loan. Valuations of those interest rate caps may fluctuate significantly from period to period due to volatility in valuation interest rates which are driven by market conditions and the scheduled maturities of the caps. The Company's assets and liabilities that are measured at fair value on a recurring basis approximate the following:
| |
Fair Value Measurement at December 31, 2015 Reporting Date Using |
||||||||||||||||||
|---|---|---|---|---|---|---|---|---|---|---|---|---|---|---|---|---|---|---|---|
| |
Total | Quoted Prices in Active Markets for Identical Assets (Level 1) |
Significant Other Observable Inputs (Level 2) |
Significant Unobservable Inputs (Level 3) |
Total Gains (Losses) |
Carrying Value |
|||||||||||||
Recurring fair value measurements |
|||||||||||||||||||
Cash and cash equivalents |
$ | 0.6 | $ | 0.6 | $ | — | $ | — | $ | — | $ | 0.6 | |||||||
Derivative instruments—Asset position |
0.2 | — | 0.2 | — | — | 0.2 | |||||||||||||
Derivative instruments—Liability position |
(16.2 | ) | $ | — | (16.2 | ) | — | — | (16.2 | ) | |||||||||
| | | | | | | | | | | | | | | | | | | | |
Total recurring fair value measurements |
$ | (15.4 | ) | $ | 0.6 | $ | (16.0 | ) | $ | — | $ | — | $ | (15.4 | ) | ||||
| | | | | | | | | | | | | | | | | | | | |
| | | | | | | | | | | | | | | | | | | | |
| | | | | | | | | | | | | | | | | | | | |
F-43
Advanced Disposal Services, Inc. and Subsidiaries
Notes to Consolidated Financial Statements (Continued)
(In millions, unless otherwise indicated)
19. Fair Value of Financial Instruments (Continued)
| |
Fair Value Measurement at December 31, 2014 Reporting Date Using |
||||||||||||||||||
|---|---|---|---|---|---|---|---|---|---|---|---|---|---|---|---|---|---|---|---|
| |
Total | Quoted Prices in Active Markets for Identical Assets (Level 1) |
Significant Other Observable Inputs (Level 2) |
Significant Unobservable Inputs (Level 3) |
Total Gains (Losses) |
Carrying Value |
|||||||||||||
Recurring fair value measurements |
|||||||||||||||||||
Cash and cash equivalents |
$ | 1.0 | $ | 1.0 | $ | — | $ | — | $ | — | $ | 1.0 | |||||||
Restricted cash |
0.2 | 0.2 | — | — | — | 0.2 | |||||||||||||
Derivative instruments—Asset position |
2.7 | — | 2.7 | — | — | 2.7 | |||||||||||||
Derivative instruments—Liability position |
(27.3 | ) | — | (27.3 | ) | — | — | (27.3 | ) | ||||||||||
| | | | | | | | | | | | | | | | | | | | |
Total recurring fair value measurements |
$ | (23.4 | ) | $ | 1.2 | $ | (24.6 | ) | $ | — | $ | — | $ | (23.4 | ) | ||||
| | | | | | | | | | | | | | | | | | | | |
| | | | | | | | | | | | | | | | | | | | |
| | | | | | | | | | | | | | | | | | | | |
Refer to Note 13 for disclosures regarding long-term debt.
20. Commitments and Contingencies
Municipal solid waste service and other service contracts, permits and licenses to operate transfer stations, landfills and recycling facilities may require performance or surety bonds, letters of credit or other means of financial assurance to secure contractual performance. To secure its obligations, the Company has provided customers, various regulatory authorities and the Company's insurer with such bonds totaling to approximately $709.0 and $705.9 as of December 31, 2015 and 2014, respectively. The majority of these obligations expire each year and are automatically renewed. Additionally, letters of credit have been issued to fulfill such obligations and are included in the total letters of credit outstanding disclosed in Note 13 "Long Term Debt" in the notes to the consolidated financial statements herein.
In February 2009, the Company and certain of its subsidiaries were named as defendants in a purported class action suit in the Circuit Court of Macon County, Alabama. Similar class action complaints were brought against the Company and certain of its subsidiaries in 2011 in Duval County, Florida and in 2013 in Quitman County, Georgia and Barbour County, Alabama, and in 2014 in Chester County, Pennsylvania. The Georgia complaint was dismissed in March 2014. The plaintiffs in those cases primarily allege that the defendants charged improper fees (fuel, administrative and environmental fees) that were in breach of the plaintiffs' service agreements with the Company and seek damages in an unspecified amount. The Company believes that it has meritorious defenses against these purported class actions, which it will vigorously pursue. Given the inherent uncertainties of litigation, including the early stage of these cases, the unknown size of any potential class, and legal and factual issues in dispute, the outcome of these cases cannot be predicted and a range of loss, if any, cannot currently be estimated.
F-44
Advanced Disposal Services, Inc. and Subsidiaries
Notes to Consolidated Financial Statements (Continued)
(In millions, unless otherwise indicated)
20. Commitments and Contingencies (Continued)
In November 2014, the Attorney General of the State of Vermont filed a complaint against the Company relating to the Moretown, Vermont landfill regarding alleged odor and other environmental-related noncompliances with environmental laws and regulations and environmental permits. In the complaint, the Attorney General requested that the State of Vermont Superior Court find the Company liable for the alleged noncompliances, issue related civil penalties, and order the Company to reimburse the State of Vermont for enforcement costs. While the complaint does not specify a monetary penalty, prior correspondence from the Attorney General of the State of Vermont indicates that it may seek a penalty relating to the alleged noncompliances which are not expected to be material. Given the inherent uncertainties of litigation, including the early stage of this case, the outcome cannot be predicted and a range of loss, if any, cannot currently be estimated.
The Company is subject to various other proceedings, lawsuits, disputes and claims and regulatory investigations arising in the ordinary course of its business. Many of these actions raise complex factual and legal issues and are subject to uncertainties. Actions filed against the Company include commercial, customer, and employment-related claims. The plaintiffs in some actions seek unspecified damages or injunctive relief, or both. These actions are in various procedural stages, and some are covered in part by insurance. Although the Company cannot predict the ultimate outcome and the range of loss cannot be currently estimated, the Company does not believe that the eventual outcome of any such action could have a material adverse effect on its business, financial condition, results of operations, or cash flows.
The Company has an obligation as part of the purchase of one of its C&D landfills for payments of 6% of net revenue that began at the commencement of landfill operations and continues through the life of the landfill.
21. Restructuring
For fiscal 2015, no new restructuring plans were adopted and no restructuring costs were incurred.
For fiscal 2014, the Company recognized approximately $0.4 of severance costs, $0.6 for lease termination costs and $0.3 for relocation costs in the Midwest region; $0.4 for lease termination costs and $0.3 for relocation in the East region; $0.2 for lease termination costs and $0.8 for relocation costs in the South region, as well as $1.6 of severance costs for Corporate.
For fiscal 2013, the Company recognized employee severance and benefits restructuring charges of approximately $2.5, $1.7 for lease termination costs and $2.3 for relocation costs in the Midwest region; $0.6 for lease termination costs in the East region, $0.3 for lease
F-45
Advanced Disposal Services, Inc. and Subsidiaries
Notes to Consolidated Financial Statements (Continued)
(In millions, unless otherwise indicated)
21. Restructuring (Continued)
termination costs in the South region and $0.3 for other expenses, as well as $2.3 of severance costs for Corporate.
| |
2015 | 2014 | 2013 | |||||||
|---|---|---|---|---|---|---|---|---|---|---|
Restructuring charges |
$ | — | $ | 4.6 | $ | 10.0 | ||||
| | | | | | | | | | | |
Total pre-tax and restructuring charges |
$ | — | $ | 4.6 | $ | 10.0 | ||||
| | | | | | | | | | | |
| | | | | | | | | | | |
| | | | | | | | | | | |
The costs associated with the actions above are included in accrued expenses in the accompanying consolidated financial statements and include the amounts as follows:
| |
2015 | 2014 | 2013 | |||||||
|---|---|---|---|---|---|---|---|---|---|---|
Beginning balance |
$ | 5.4 | $ | 6.4 | $ | 5.1 | ||||
Expense |
— | 4.6 | 10.0 | |||||||
Cash expenditures |
||||||||||
Severance and relocation |
(2.7 | ) | (5.1 | ) | (7.7 | ) | ||||
Other |
(0.5 | ) | (0.5 | ) | (1.0 | ) | ||||
| | | | | | | | | | | |
Ending balance |
$ | 2.2 | $ | 5.4 | $ | 6.4 | ||||
| | | | | | | | | | | |
| | | | | | | | | | | |
| | | | | | | | | | | |
22. Segment and Related Information
The Company's operations are managed through three operating segments: South, East and Midwest regions. These three operating segments and corporate entities are presented below as its reportable segments. The historical results, discussion and presentation of the Company's reportable segments are the result of its integrated waste management services consisting of collection, transfer, recycling and disposal of non-hazardous solid waste.
F-46
Advanced Disposal Services, Inc. and Subsidiaries
Notes to Consolidated Financial Statements (Continued)
(In millions, unless otherwise indicated)
22. Segment and Related Information (Continued)
Summarized financial information concerning our reportable segments for fiscal 2015, 2014 and 2013 is shown in the following table:
| |
Services Revenue |
Operating Income (Loss) |
Depreciation and Amortization |
Capital Expenditures |
Total Assets | |||||||||||
|---|---|---|---|---|---|---|---|---|---|---|---|---|---|---|---|---|
2015 |
||||||||||||||||
South |
$ | 488.7 | $ | 66.9 | $ | 73.2 | $ | 52.1 | $ | 1,152.4 | ||||||
East |
366.3 | 25.0 | 74.0 | 46.4 | 791.0 | |||||||||||
Midwest |
541.5 | 61.1 | 103.8 | 76.2 | 1,447.3 | |||||||||||
Corporate |
(0.1 | ) | (57.9 | ) | 8.1 | 5.0 | 31.6 | |||||||||
| | | | | | | | | | | | | | | | | |
|
$ | 1,396.4 | $ | 95.1 | $ | 259.1 | $ | 179.7 | $ | 3,422.3 | ||||||
| | | | | | | | | | | | | | | | | |
| | | | | | | | | | | | | | | | | |
| | | | | | | | | | | | | | | | | |
2014 |
||||||||||||||||
South |
$ | 493.7 | $ | 72.2 | $ | 70.3 | $ | 52.3 | $ | 1,188.9 | ||||||
East |
364.3 | 8.7 | 85.1 | 63.7 | 810.7 | |||||||||||
Midwest |
545.2 | 51.2 | 108.1 | 73.1 | 1,437.3 | |||||||||||
Corporate |
(0.2 | ) | (62.7 | ) | 7.9 | 7.3 | 52.6 | |||||||||
| | | | | | | | | | | | | | | | | |
|
$ | 1,403.0 | $ | 69.4 | $ | 271.4 | $ | 196.4 | $ | 3,489.5 | ||||||
| | | | | | | | | | | | | | | | | |
| | | | | | | | | | | | | | | | | |
| | | | | | | | | | | | | | | | | |
2013 |
||||||||||||||||
South |
$ | 475.4 | $ | 66.4 | $ | 79.0 | $ | 63.2 | $ | 1,216.0 | ||||||
East |
331.1 | 7.7 | 78.7 | 29.2 | 802.8 | |||||||||||
Midwest |
512.6 | 39.6 | 112.6 | 53.8 | 1,460.6 | |||||||||||
Corporate |
— | (91.6 | ) | 8.6 | 11.9 | 74.8 | ||||||||||
| | | | | | | | | | | | | | | | | |
|
$ | 1,319.1 | $ | 22.1 | $ | 278.9 | $ | 158.1 | $ | 3,554.2 | ||||||
| | | | | | | | | | | | | | | | | |
| | | | | | | | | | | | | | | | | |
| | | | | | | | | | | | | | | | | |
23. Supplemental Cash Flow Information
Supplemental cash flow information for the years ended December 31 is as follows:
| |
2015 | 2014 | 2013 | |||||||
|---|---|---|---|---|---|---|---|---|---|---|
Cash paid for interest |
$ | 116.4 | $ | 119.7 | $ | 119.1 | ||||
Cash paid for taxes |
$ | 2.4 | $ | 3.2 | $ | 0.6 | ||||
F-47
Advanced Disposal Services, Inc. and Subsidiaries
Notes to Consolidated Financial Statements (Continued)
(In millions, unless otherwise indicated)
24. Accumulated Other Comprehensive Income
The changes in the balances of each component of accumulated other comprehensive income, net of tax, which is included as a component of stockholders' equity, are as follows:
| |
Gains and Losses on Derivative Instruments |
|||
|---|---|---|---|---|
Balance, December 31, 2012 |
(2.2 | ) | ||
| | | | | |
Other comprehensive loss before reclassifications, net of tax |
2.3 | |||
Amounts reclassified from accumulated other comprehensive income |
2.4 | |||
Net current period other comprehensive loss |
4.7 | |||
| | | | | |
Balance, December 31, 2013 |
2.5 | |||
| | | | | |
Other comprehensive income before reclassifications, net of tax |
(1.0 | ) | ||
Net current period other comprehensive income |
(1.0 | ) | ||
| | | | | |
Balance, December 31, 2014 |
1.5 | |||
| | | | | |
Other comprehensive income before reclassifications, net of tax |
(1.5 | ) | ||
Net current period other comprehensive income |
(1.5 | ) | ||
| | | | | |
Balance, December 31, 2015 |
— | |||
| | | | | |
| | | | | |
| | | | | |
The significant amounts either added to or reclassified out of each component of accumulated other comprehensive income are included in the tables below:
| |
Amount of Derivative Gain (Loss) Recognized in OCI—Effective for the Years Ended December 31, |
|||||||||
|---|---|---|---|---|---|---|---|---|---|---|
| |
2015 | 2014 | 2013 | |||||||
Derivatives Designated as Cash Flow Hedges |
||||||||||
Interest rate caps |
(2.0 | ) | (1.4 | ) | 2.6 | |||||
Other |
$ | — | $ | — | $ | 0.5 | ||||
| | | | | | | | | | | |
Total before tax |
(2.0 | ) | (1.4 | ) | 3.1 | |||||
Tax benefit (expense) |
0.5 | 0.4 | (0.8 | ) | ||||||
| | | | | | | | | | | |
Net of tax |
$ | (1.5 | ) | $ | (1.0 | ) | $ | 2.3 | ||
| | | | | | | | | | | |
| | | | | | | | | | | |
| | | | | | | | | | | |
F-48
Advanced Disposal Services, Inc. and Subsidiaries
Notes to Consolidated Financial Statements (Continued)
(In millions, unless otherwise indicated)
25. Quarterly Financial Data (Unaudited)
The following table summarizes the unaudited quarterly results of operations for the respective quarters:
| |
First Quarter |
Second Quarter |
Third Quarter |
Fourth Quarter |
|||||||||
|---|---|---|---|---|---|---|---|---|---|---|---|---|---|
2015 |
|||||||||||||
Operating revenues |
$ | 330.4 | $ | 355.2 | $ | 361.3 | $ | 349.5 | |||||
Income from operations |
$ | 24.0 | $ | 13.7 | $ | 32.5 | $ | 24.9 | |||||
Consolidated net loss |
$ | (10.8 | ) | $ | (8.5 | ) | $ | (5.5 | ) | $ | (8.8 | ) | |
2014 |
|||||||||||||
Operating revenues |
$ | 321.3 | $ | 359.9 | $ | 368.1 | $ | 353.7 | |||||
Income from operations |
$ | 8.3 | $ | 16.0 | $ | 25.8 | $ | 19.3 | |||||
Consolidated net (loss) income (a) |
$ | (19.3 | ) | $ | (15.4 | ) | $ | (6.5 | ) | $ | 24.1 | ||
- (a)
- In the fourth quarter of 2014, the Company recorded a loss on commodity futures contracts related to fuel of $27.3 in other income/(expense), net due to a decline in fuel prices in the fourth quarter of 2014 and recorded a valuation allowance release of $51.4 related to a legal entity restructuring project. Refer to Note 18 "Income Taxes" for further information.
26. Earnings per Share
| |
2015 |
2014 |
2013 |
|||||||
|---|---|---|---|---|---|---|---|---|---|---|
Amounts attributable to the Company: |
||||||||||
Loss available to common stockholder, before discontinued operations |
$ | (33.6 | ) | $ | (17.4 | ) | $ | (95.3 | ) | |
Earnings (loss) from discontinued operations attributable common stockholder |
— | .3 | (22.5 | ) | ||||||
| | | | | | | | | | | |
Net loss attributable to common stockholder |
$ | (33.6 | ) | $ | (17.1 | ) | $ | (117.8 | ) | |
| | | | | | | | | | | |
| | | | | | | | | | | |
| | | | | | | | | | | |
Per share data |
||||||||||
Loss per share available to common stockholder, before discontinued operations |
$ | (33,600 | ) | $ | (17,400 | ) | $ | (95,300 | ) | |
Discontinued operations |
$ | — | $ | 300 | $ | (22,500 | ) | |||
The Company had 1,000 shares of common stock outstanding for each of the years ended December 31, 2015, 2014 and 2013 and no other anti-dilutive securities.
F-49
Advanced Disposal Services, Inc. and Subsidiaries
Notes to Consolidated Financial Statements (Continued)
(In millions, unless otherwise indicated)
27. Subsequent Events
Name Change
On January 18, 2016, the Board approved a change in the Company's name from ADS Waste Holdings, Inc. to "Advanced Disposal Services, Inc." The change in the Company's name was effected by the filing of a Certificate of Amendment, pursuant to Section 242 of the Delaware General Corporation Law, on January 27, 2016.
Return of Capital
In January 2016, the Company returned capital to the parent of $9.6.
Borrowings on the Revolver
The Company borrowed $25.0 on the Revolving Credit Facility, net of repayments, subsequent to December 31, 2015.
Postponement of Initial Public Offering
The Company initiated a public offering of equity securities on February 1, 2016. Due to market conditions, the Company did not complete the public offering which resulted in the write off of deferred offerings costs in the amount of $2.2 for the year ended December 31, 2015.
F-50
ADVANCED DISPOSAL SERVICES, INC.
UNAUDITED CONDENSED CONSOLIDATED FINANCIAL STATEMENTS
F-51
PART I. FINANCIAL INFORMATION
Advanced Disposal Services, Inc. and Subsidiaries
Condensed Consolidated Balance Sheets
(Unaudited)
| (in millions, except share data) |
June 30, 2016 |
December 31, 2015 |
|||||
|---|---|---|---|---|---|---|---|
Assets |
|||||||
Current assets |
|||||||
Cash and cash equivalents |
$ | 1.2 | $ | 0.6 | |||
Accounts receivable, net of allowance for doubtful accounts of $3.8 and $4.4, respectively |
182.0 | 177.5 | |||||
Prepaid expenses and other current assets |
25.2 | 33.4 | |||||
| | | | | | | | |
Total current assets |
208.4 | 211.5 | |||||
Other assets |
22.0 | 22.9 | |||||
Property and equipment, net of accumulated depreciation of $1,091.0 and $1,007.5, respectively |
1,625.1 | 1,649.9 | |||||
Goodwill |
1,174.0 | 1,173.5 | |||||
Other intangible assets, net of accumulated amortization of $207.3 and $185.6, respectively |
345.2 | 364.5 | |||||
| | | | | | | | |
Total assets |
$ | 3,374.7 | $ | 3,422.3 | |||
| | | | | | | | |
| | | | | | | | |
| | | | | | | | |
Liabilities and Stockholder's Equity |
|||||||
Current liabilities |
|||||||
Accounts payable |
$ | 97.8 | $ | 98.1 | |||
Accrued expenses |
116.2 | 135.7 | |||||
Deferred revenue |
62.3 | 63.1 | |||||
Current maturities of landfill retirement obligations |
30.8 | 30.2 | |||||
Current maturities of long-term debt |
38.8 | 49.1 | |||||
| | | | | | | | |
Total current liabilities |
345.9 | 376.2 | |||||
Other long-term liabilities |
57.7 | 55.8 | |||||
Long-term debt, less current maturities |
2,201.6 | 2,198.0 | |||||
Accrued landfill retirement obligations, less current maturities |
170.1 | 163.5 | |||||
Deferred income taxes |
132.9 | 139.0 | |||||
| | | | | | | | |
Total liabilities |
2,908.2 | 2,932.5 | |||||
| | | | | | | | |
Commitments and contingencies |
|||||||
Equity |
|||||||
Common stock: $.01 par value, 1,000 shares authorized, issued and outstanding |
— | — | |||||
Additional paid-in capital |
1,091.7 | 1,101.0 | |||||
Accumulated deficit |
(625.2 | ) | (611.2 | ) | |||
| | | | | | | | |
Total stockholder's equity |
466.5 | 489.8 | |||||
| | | | | | | | |
Total liabilities and stockholder's equity |
$ | 3,374.7 | $ | 3,422.3 | |||
| | | | | | | | |
| | | | | | | | |
| | | | | | | | |
The accompanying notes are an integral part of these condensed consolidated
financial statements.
F-52
Advanced Disposal Services, Inc. and Subsidiaries
Condensed Consolidated Statements of Operations
(Unaudited)
| |
Six Months Ended June 30, |
||||||
|---|---|---|---|---|---|---|---|
| (in millions) |
2016 | 2015 | |||||
Service revenues |
$ | 692.0 | $ | 685.5 | |||
| | | | | | | | |
Operating costs and expenses |
|||||||
Operating |
432.3 | 428.9 | |||||
Selling, general and administrative |
84.1 | 72.9 | |||||
Depreciation and amortization |
125.4 | 127.4 | |||||
Acquisition and development costs |
0.2 | 1.1 | |||||
(Gain) loss on disposal of assets and asset impairments |
0.1 | 17.5 | |||||
Restructuring charges |
0.8 | — | |||||
| | | | | | | | |
Total operating costs and expenses |
642.9 | 647.8 | |||||
| | | | | | | | |
Operating income |
49.1 | 37.7 | |||||
| | | | | | | | |
Other income (expense) |
|||||||
Interest expense |
(68.6 | ) | (69.8 | ) | |||
Other income (expense), net |
0.4 | 3.7 | |||||
| | | | | | | | |
Total other income (expense) |
(68.2 | ) | (66.1 | ) | |||
| | | | | | | | |
Income (loss) before income taxes |
(19.1 | ) | (28.4 | ) | |||
Income tax expense (benefit) |
(5.1 | ) | (9.1 | ) | |||
| | | | | | | | |
Net income (loss) |
$ | (14.0 | ) | $ | (19.3 | ) | |
| | | | | | | | |
| | | | | | | | |
| | | | | | | | |
Net loss attributable to common stockholder per share |
|||||||
Basic loss per share |
$ | (14,000 | ) | $ | (19,300 | ) | |
Diluted loss per share |
N/A | N/A | |||||
The accompanying notes are an integral part of these condensed consolidated financial statements.
F-53
Advanced Disposal Services, Inc. and Subsidiaries
Condensed Consolidated Statements of Comprehensive Income (Loss)
(Unaudited)
| |
Six Months Ended June 30, |
||||||
|---|---|---|---|---|---|---|---|
| (in millions) |
2016 | 2015 | |||||
Net income (loss) |
$ | (14.0 | ) | $ | (19.3 | ) | |
Other comprehensive loss, net of tax |
— | (1.5 | ) | ||||
| | | | | | | | |
Comprehensive income (loss) |
$ | (14.0 | ) | $ | (20.8 | ) | |
| | | | | | | | |
| | | | | | | | |
| | | | | | | | |
The accompanying notes are an integral part of these condensed consolidated financial statements.
F-54
Advanced Disposal Services, Inc. and Subsidiaries
Condensed Consolidated Statement of Stockholder's Equity
(Unaudited)
| |
Common Stock | |
|
|
||||||||||||
|---|---|---|---|---|---|---|---|---|---|---|---|---|---|---|---|---|
| |
Additional Paid-In Capital |
Accumulated Deficit |
Total Stockholder's Equity |
|||||||||||||
| (in millions, except share data) |
Shares | Amount | ||||||||||||||
Balance at December 31, 2015 |
1,000 | $ | — | $ | 1,101.0 | $ | (611.2 | ) | $ | 489.8 | ||||||
Net loss |
— | — | — | (14.0 | ) | (14.0 | ) | |||||||||
Stock-based compensation expense |
— | — | 3.3 | — | 3.3 | |||||||||||
Return of capital to parent company |
— | — | (12.6 | ) | — | (12.6 | ) | |||||||||
| | | | | | | | | | | | | | | | | |
Balance at June 30, 2016 |
1,000 | $ | — | $ | 1,091.7 | $ | (625.2 | ) | $ | 466.5 | ||||||
| | | | | | | | | | | | | | | | | |
| | | | | | | | | | | | | | | | | |
| | | | | | | | | | | | | | | | | |
The
accompanying notes are an integral part of these condensed consolidated
financial statements.
F-55
Advanced Disposal Services, Inc. and Subsidiaries
Condensed Consolidated Statements of Cash Flows
(Unaudited)
| |
Six Months Ended June 30, |
||||||
|---|---|---|---|---|---|---|---|
| (in millions) |
2016 | 2015 | |||||
Cash flows from operating activities |
|||||||
Net loss |
$ | (14.0 | ) | $ | (19.3 | ) | |
Adjustments to reconcile net loss to net cash provided by operating activities |
|||||||
Depreciation and amortization |
125.4 | 127.4 | |||||
Change in fair value of derivative instruments |
(7.0 | ) | (10.9 | ) | |||
Amortization of interest rate cap premium |
0.2 | 1.0 | |||||
Amortization of debt issuance costs and original issue discount |
9.8 | 9.7 | |||||
Accretion on landfill retirement obligations |
6.5 | 6.7 | |||||
Accretion on capital leases, long-term debt, loss contracts and other long-term liabilities |
0.7 | 1.1 | |||||
Amortization of deferred contract costs |
0.2 | 0.2 | |||||
Provision for doubtful accounts |
1.4 | 2.0 | |||||
Loss on disposition of property and equipment |
1.8 | 0.5 | |||||
Impairment of assets |
— | 6.4 | |||||
(Gain) loss on disposition of businesses |
(1.7 | ) | 10.6 | ||||
Gain on redemption of security |
— | (2.5 | ) | ||||
Stock based compensation |
3.3 | 1.2 | |||||
Deferred tax benefit |
(6.2 | ) | (10.5 | ) | |||
Earnings in equity investee |
(1.1 | ) | (0.8 | ) | |||
Changes in operating assets and liabilities, net of businesses acquired |
|||||||
(Increase) decrease in accounts receivable |
(5.1 | ) | 6.0 | ||||
Decrease in prepaid expenses and other current assets |
8.2 | 6.9 | |||||
Decrease in other assets |
0.4 | 0.3 | |||||
Increase in accounts payable |
0.2 | 0.3 | |||||
Decrease in accrued expenses |
(10.0 | ) | (5.2 | ) | |||
Decrease in unearned revenue |
(1.1 | ) | (0.1 | ) | |||
Decrease in other long-term liabilities |
(0.8 | ) | — | ||||
Capping, closure and post-closure expenditures |
(6.7 | ) | (1.7 | ) | |||
| | | | | | | | |
Net cash provided by operating activities |
104.4 | 129.3 | |||||
| | | | | | | | |
Cash flows from investing activities |
|||||||
Purchases of property and equipment and construction and development |
(69.2 | ) | (89.7 | ) | |||
Proceeds from sale of property and equipment |
1.0 | 0.7 | |||||
Proceeds from maturity of securities |
— | 15.0 | |||||
Acquisition of businesses |
(5.1 | ) | (23.8 | ) | |||
Proceeds from sale of businesses |
2.5 | 12.5 | |||||
| | | | | | | | |
Net cash used in investing activities |
(70.8 | ) | (85.3 | ) | |||
| | | | | | | | |
Cash flows from financing activities |
|||||||
Proceeds from borrowings on debt instruments |
70.0 | 35.0 | |||||
Repayment on debt instruments including capital leases |
(101.9 | ) | (62.2 | ) | |||
Deferred financing charges |
0.2 | — | |||||
Bank overdraft |
11.3 | (1.3 | ) | ||||
Other financing activities |
— | 0.2 | |||||
Capital contribution from parent |
— | 0.1 | |||||
Return of capital to parent |
(12.6 | ) | (7.5 | ) | |||
| | | | | | | | |
Net cash used in financing activities |
(33.0 | ) | (35.7 | ) | |||
| | | | | | | | |
Net increase in cash and cash equivalents |
0.6 | 8.3 | |||||
Cash and cash equivalents, beginning of period |
0.6 | 1.0 | |||||
| | | | | | | | |
Cash and cash equivalents, end of period |
$ | 1.2 | $ | 9.3 | |||
| | | | | | | | |
| | | | | | | | |
| | | | | | | | |
The accompanying notes are an integral part of these condensed consolidated
financial statements.
F-56
Advanced Disposal Services, Inc. and Subsidiaries
Notes to Unaudited Condensed Consolidated Financial Statements
(in millions, except share data)
1. Business Operations
Advanced Disposal Services, Inc. (formerly ADS Waste Holdings Inc. hereafter referred to as the Company) together with its consolidated subsidiaries, as a consolidated entity, is a nonhazardous solid waste services company providing collection, transfer, recycling and disposal services to customers in the South, Midwest and Eastern regions of the United States, as well as in the Commonwealth of the Bahamas. The Company is wholly owned by ADS Waste Holdings Corp. (the "Parent").
The Company manages and evaluates its principal operations through three reportable operating segments on a regional basis. Those operating segments are the South, East and Midwest regions which provide collection, transfer, recycling and disposal services. Additional information related to segments can be found in Note 8.
Six acquisitions were completed during the six months ended June 30, 2016 for aggregate prices consisting of a cash purchase price of $4.9 and notes payable of $0.3, subject to net working capital adjustments, which are expected to be completed within approximately one year. Seven acquisitions were completed during the six months ended June 30, 2015 for a cash purchase price of $23.8 and notes payable of $3.3. The results of operations of each acquisition are included in the Company's condensed consolidated statements of operations subsequent to the closing date of each acquisition.
The Company recorded a reduction to the purchase price of prior year acquisitions during the six months ended June 30, 2016 in the amount of $0.2. The Company is still reviewing information surrounding intangible assets and current liabilities related to acquisitions completed subsequent to June 30, 2015.
2. Basis of Presentation
The Company's condensed consolidated financial statements include its wholly-owned subsidiaries of Advanced Disposal Services South, Inc. and HW Star Holdings Corp. and their respective subsidiaries.
All intercompany accounts and transactions have been eliminated in consolidation.
The condensed consolidated financial statements as of June 30, 2016 and for the six months ended June 30, 2016 and 2015 are unaudited. In the opinion of management, these condensed consolidated financial statements include all adjustments, which, unless otherwise disclosed, are of a normal recurring nature, necessary for a fair statement of the balance sheet, results of operations, comprehensive loss, cash flows, and changes in equity for the periods presented. The results for interim periods are not necessarily indicative of results for the entire year. The financial statements presented herein should be read in conjunction with the financial statements included in the Company's Annual Report on Form 10-K for the year ended December 31, 2015.
In conformity with accounting principles generally accepted in the United States of America, the Company uses estimates and assumptions that affect the amounts reported in these condensed consolidated financial statements and accompanying notes. The Company must make these estimates and assumptions because certain information that it uses is
F-57
Advanced Disposal Services, Inc. and Subsidiaries
Notes to Unaudited Condensed Consolidated Financial Statements (Continued)
(in millions, except share data)
2. Basis of Presentation (Continued)
dependent on future events, cannot be calculated with a high degree of precision from data available or simply cannot be readily calculated based on generally accepted methodologies. In preparing the Company's financial statements, the more subjective areas that deal with the greatest amount of uncertainty relate to: accounting for long-lived assets, including recoverability; landfill development costs, final capping, closure and post-closure costs; valuation allowances for accounts receivable and deferred tax assets; liabilities for potential litigation; claims and assessments; liabilities for environmental remediation; stock compensation; accounting for goodwill and intangible asset impairments; deferred taxes; uncertain tax positions; self-insurance reserves; and estimates of the fair values of assets acquired and liabilities assumed in any acquisition. Actual results could differ materially from the estimates and assumptions that the Company uses in preparation of its financial statements.
Recently Issued Accounting Standards
In March 2016, the Financial Accounting Standards Board (FASB) issued Accounting Standards Update (ASU) 2016-09, Compensation—Stock Compensation (Topic 718), which simplifies the accounting for employee stock-based payment transactions, including the accounting for income taxes, forfeitures, and statutory tax withholding requirements, as well as classification in the statement of cash flows. The standard is effective for fiscal years beginning after December 31, 2016, including interim periods within those fiscal years. Early adoption is permitted. The Company is currently evaluating the timing of the adoption and the potential impact this guidance may have on its consolidated financial statements.
In February 2016, the FASB issued ASU 2016-02, Leases, which will require lessees to recognize most leases on their balance sheets as a right-of-use asset with a corresponding lease liability, and lessors to recognize a net lease investment. Additional qualitative and quantitative disclosures will also be required to increase transparency and comparability among organizations. This standard is effective for fiscal years beginning after December 15, 2018, including interim periods within those fiscal years. Early adoption of the standard is permitted, however; the Company does not expect to early adopt the ASU. Lessees and lessors are required to recognize and measure leases at the beginning of the earliest period presented. While the Company is still assessing the impact of this standard, it does not believe this standard will have a material impact on the Company's financial condition, results of operations or liquidity.
In May 2014, the FASB issued ASU 2014-09, Revenue from Contracts with Customers, which supersedes previous revenue recognition guidance. The new standard requires that a company recognize revenue when it transfers promised goods or services to customers in an amount that reflects the consideration the company expects to receive in exchange for those goods or services. Companies will need to use more judgment and estimates than under the guidance currently in effect, including estimating the amount of variable revenue to recognize over each identified performance obligation. Additional disclosures will be required to help users of financial statements understand the nature, amount and timing of revenue and cash flows arising from contracts. In July 2015, the FASB approved a one-year deferral of the
F-58
Advanced Disposal Services, Inc. and Subsidiaries
Notes to Unaudited Condensed Consolidated Financial Statements (Continued)
(in millions, except share data)
2. Basis of Presentation (Continued)
effective date. This standard will now become effective for the Company beginning with the first quarter 2018 and can be adopted either retrospectively to each prior reporting period presented or as a cumulative effect adjustment as of the date of adoption. The Company is currently evaluating the impact of adopting this new guidance on the consolidated financial statements and has not selected a transition method.
3. Landfill Liabilities
Liabilities for final closure and post-closure costs for the year ended December 31, 2015 and for the six months ended June 30, 2016 are shown in the table below:
Balance at December 31, 2014 |
$ | 201.1 | ||
Increase in retirement obligation |
9.8 | |||
Accretion of closure and post-closure costs |
13.1 | |||
Disposition |
(3.2 | ) | ||
Change in estimate |
(2.9 | ) | ||
Costs incurred |
(24.2 | ) | ||
| | | | | |
Balance at December 31, 2015 |
193.7 | |||
Increase in retirement obligation |
4.6 | |||
Accretion of closure and post-closure costs |
6.5 | |||
Costs incurred |
(3.9 | ) | ||
| | | | | |
Balance at June 30, 2016 |
200.9 | |||
Less: Current portion |
(30.8 | ) | ||
| | | | | |
|
$ | 170.1 | ||
| | | | | |
| | | | | |
| | | | | |
F-59
Advanced Disposal Services, Inc. and Subsidiaries
Notes to Unaudited Condensed Consolidated Financial Statements (Continued)
(in millions, except share data)
4. Debt
The following table summarizes the major components of debt at each balance sheet date and provides the maturities and interest rate ranges of each major category of debt:
| |
June 30, 2016 |
December 31, 2015 |
|||||
|---|---|---|---|---|---|---|---|
Revolving line of credit with lenders (Revolver), interest at applicable rate plus margin, as defined (4.63% and 6.30% at June 30, 2016 and December 31, 2015, respectively) due quarterly; balance due at maturity in October 2017 |
$ | 11.0 | $ | 32.0 | |||
Term loans (Term Loan B); quarterly payments of $4.5 commencing March 31, 2013 through June 30, 2019 with final payment due October 9, 2019; interest at LIBOR floor of 0.75% plus an applicable margin of 300 basis points at June 30, 2016 and December 31, 2015 |
1,685.5 | 1,685.5 | |||||
Senior notes (Senior Notes) payable; interest at 8.25% payable in arrears semi-annually commencing April 1, 2013; maturing on October 1, 2020 |
550.0 | 550.0 | |||||
Capital lease obligations, maturing through 2024 |
38.7 | 28.2 | |||||
Other debt |
15.3 | 20.0 | |||||
| | | | | | | | |
|
2,300.5 | 2,315.7 | |||||
Less: Original issue discount and debt issuance costs classified as a reduction to long-term debt |
(60.1 | ) | (68.6 | ) | |||
Less: Current portion |
(38.8 | ) | (49.1 | ) | |||
| | | | | | | | |
|
$ | 2,201.6 | $ | 2,198.0 | |||
| | | | | | | | |
| | | | | | | | |
| | | | | | | | |
All borrowings under the Term Loan B and the Revolver are guaranteed by each of the Company's current and future U.S. subsidiaries (which also guarantee the Senior Notes), subject to certain agreed-upon exemptions. The Company has one non-guarantor foreign subsidiary as disclosed in Note 11. All guarantors are jointly and severally and fully and unconditionally liable. The Parent has no independent assets or operations and each subsidiary guarantor is 100% owned by the Company. There are no significant restrictions on the Company or any guarantor to obtain funds from its subsidiaries by dividend or loan.
Revolver and Letter of Credit Facilities
As of June 30, 2016, the Company had an aggregate committed capacity of $300.0, of which $100.0 was available for letters of credit under its credit facilities. The Company's Revolver is its primary source of letter of credit capacity and expires in October 2017. As of June 30, 2016 and December 31, 2015, the Company had $11.0 and $32.0 of borrowings outstanding on the Revolver, respectively. As of June 30, 2016 and December 31, 2015, the Company had an aggregate of approximately $46.0 and $45.9, respectively, of letters of credit outstanding under its credit facilities.
F-60
Advanced Disposal Services, Inc. and Subsidiaries
Notes to Unaudited Condensed Consolidated Financial Statements (Continued)
(in millions, except share data)
5. Derivative Instruments and Hedging Activities
The following table summarizes the fair values of derivative instruments recorded in the Company's condensed consolidated balance sheets:
| |
Balance Sheet Location | June 30, 2016 |
December 31, 2015 |
||||||
|---|---|---|---|---|---|---|---|---|---|
Derivatives Designated as Hedging Instruments |
|||||||||
2012 Interest rate caps |
Other assets | $ | — | $ | 0.2 | ||||
Derivatives Not Designated as Hedging Instruments |
|||||||||
2016 Interest rate caps |
Accrued expenses | 0.4 | — | ||||||
2016 Interest rate caps |
Other long term liabilities | 2.4 | — | ||||||
Fuel commodity derivatives |
Accrued expenses | $ | 6.4 | $ | 16.2 | ||||
| | | | | | | | | | |
Total derivatives |
$ | 9.2 | $ | 16.0 | |||||
| | | | | | | | | | |
| | | | | | | | | | |
| | | | | | | | | | |
The Company has not offset fair value of assets and liabilities recognized for its derivative instruments.
Interest Rate Caps
In December 2012, the Company entered into four interest rate cap agreements to hedge the risk of a rise in interest rates and associated cash flows on its variable rate debt. The Company recorded a premium of $5.0 in other assets in the condensed consolidated balance sheets and amortized the premium to interest expense based upon decreases in time value of the caps. Amortization expense for the six months ended June 30, 2016 and 2015 was $0.2 and $1.0, respectively. The notional amounts of the aggregated contracts were approximately $666.6 as of June 30, 2016 and expire in tranches through September 2016.
In May 2016, the Company entered into three interest rate cap agreements as economic hedges against the risk of a rise in interest rates and the associated cash flows on its variable rate debt. The Company will pay the $5.5 premium of the caps equally over eleven quarters beginning on March 31, 2017. The Company elected not to apply hedge accounting to these interest rate caps therefore changes in the fair value of the interest rate caps are recorded in other income (expense), net in the condensed consolidated statements of operations. The Company recorded losses of $2.8 for the six months ended June 30, 2016. The notional value of the contracts aggregated were $800 as of June 30, 2016 and will remain constant through maturity in September 2019.
Commodity Futures Contracts
The Company utilizes fuel derivative instruments (commodity futures contracts) as economic hedges of the risk that fuel prices will fluctuate. The Company has used financial derivative instruments for both short-term and long-term time frames and utilizes fixed price swap agreements to manage the identified risk. The Company does not enter into derivative financial instruments for trading or speculative purposes.
F-61
Advanced Disposal Services, Inc. and Subsidiaries
Notes to Unaudited Condensed Consolidated Financial Statements (Continued)
(in millions, except share data)
5. Derivative Instruments and Hedging Activities (Continued)
Changes in the fair value and settlements of the fuel derivative instruments are recorded in other income (expense), net in the condensed consolidated statements of operations and were $1.5 and ($0.2) for the six months ended June 30, 2016 and 2015, respectively. As of June 30, 2016, the Company has 6.7 gallons under fixed price derivative contracts with strike prices ranging from $2.20 to $2.64 per gallon. If the mean price of the high and the low exceeds the contract price per gallon, the Company receives the difference between the average price and the contract price (multiplied by the notional gallons) from the counterparty. If the mean average price is less than the contract price per gallon, the Company pays the difference to the counterparty.
6. Income Taxes
The Company's effective income tax rate for the six months ended June 30, 2016 and 2015 was 26.6% and 32.0%, respectively. The difference between income taxes computed at the federal statutory rate of 35% and reported income tax benefit for the six months ended June 30, 2016 was primarily due to the unfavorable impact of permanently non-deductible expenses and the unfavorable impact of a change in recorded valuation allowance. The difference between income taxes computed at the federal statutory rate of 35% and reported income taxes for the six months ended June 30, 2015 was primarily due to the unfavorable impact of a change in recorded valuation allowance.
As of June 30, 2016, the Company has $10.0 of liabilities associated with unrecognized tax benefits and related interest. These liabilities are primarily included as a component of long-term "Other liabilities" in the condensed consolidated balance sheet because the Company generally does not anticipate that settlement of the liabilities will require payment of cash within the next 12 months. The Company is not able to reasonably estimate when it would make any cash payments to settle these liabilities, but it does not believe that the ultimate settlement of the obligations will materially affect its liquidity.
7. Commitments and Contingencies
Financial Instruments
The Company has obtained letters of credit, performance bonds and insurance policies for the performance of landfill final capping, closure and post-closure requirements, environmental remediation, and other obligations. Letters of credit are supported by the Company's Revolver (Note 4).
The Company does not expect that any claims against or draws on these instruments would have a material adverse effect on the Company's condensed consolidated financial statements. The Company has not experienced any unmanageable difficulty in obtaining the required financial assurance instruments for its current operations. In an ongoing effort to mitigate risks of future cost increases and reductions in available capacity, the Company continues to evaluate various options to access cost-effective sources of financial assurance.
F-62
Advanced Disposal Services, Inc. and Subsidiaries
Notes to Unaudited Condensed Consolidated Financial Statements (Continued)
(in millions, except share data)
7. Commitments and Contingencies (Continued)
Insurance
The Company carries insurance coverage for protection of its assets and operations from certain risks including automobile liability, general liability, real and personal property, workers compensation, directors and officers liability, pollution, legal liability and other coverages the Company believes are customary to the industry. The Company's exposure to loss for insurance claims is generally limited to the per incident deductible, or self-insured retention, under the related insurance policy. Its exposure, however, could increase if its insurers are unable to meet their commitments on a timely basis.
The Company has retained a significant portion of the risks related to its automobile, general liability, workers compensation and health claims programs. For its self-insured retentions, the exposure for unpaid claims and associated expenses, including incurred but not reported losses, is based on an actuarial valuation and internal estimates. The accruals for these liabilities could be revised if future occurrences or loss development significantly differ from the Company's assumptions used. The Company does not expect the impact of any known casualty, property, environmental or other contingency to have a material impact on its financial condition, results of operations or cash flows.
Litigation and Other Matters
In February 2009, the Company and certain of its subsidiaries were named as defendants in a purported class action suit in the Circuit Court of Macon County, Alabama. Similar class action complaints were brought against the Company and certain of its subsidiaries in 2011 in Duval County, Florida and in 2013 in Quitman County, Georgia and Barbour County, Alabama, and in 2014 in Chester County, Pennsylvania. The 2013 Georgia complaint was dismissed in March 2014. In late 2015 in Gwinnett County, Georgia, another purported class action suit was filed. The plaintiffs in those cases primarily allege that the defendants charged improper fees (fuel, administrative and environmental fees) that were in breach of the plaintiffs' service agreements with the Company and seek damages in an unspecified amount. The Company believes that it has meritorious defenses against these purported class actions, which it will vigorously pursue. Given the inherent uncertainties of litigation, including the early stage of these cases, the unknown size of any potential class, and legal and factual issues in dispute, the outcome of these cases cannot be predicted and a range of loss, if any, cannot currently be estimated.
In November 2014, the Attorney General of the State of Vermont filed a complaint against the Company relating to the Moretown, Vermont landfill regarding alleged odor and other environmental-related noncompliances with environmental laws and regulations and environmental permits. In the complaint, the Attorney General requested that the State of Vermont Superior Court find the Company liable for the alleged noncompliances, issue related civil penalties, and order the Company to reimburse the State of Vermont for enforcement costs. While the complaint does not specify a monetary penalty, prior correspondence from the Attorney General of the State of Vermont indicates that it may seek a penalty relating to the alleged noncompliances that is not expected to be material. Given the inherent
F-63
Advanced Disposal Services, Inc. and Subsidiaries
Notes to Unaudited Condensed Consolidated Financial Statements (Continued)
(in millions, except share data)
7. Commitments and Contingencies (Continued)
uncertainties of litigation, including the early stage of this case, the outcome cannot be predicted and a range of loss, if any, cannot currently be estimated.
The Company is subject to various other proceedings, lawsuits, disputes and claims and regulatory investigations arising in the ordinary course of its business. Many of these actions raise complex factual and legal issues and are subject to uncertainties. Actions filed against the Company include commercial, customer, and employment-related claims. The plaintiffs in some actions seek unspecified damages or injunctive relief, or both. These actions are in various procedural stages, and some are covered in part by insurance. Although the Company cannot predict the ultimate outcome and the range of loss cannot be currently estimated, the Company does not believe that the eventual outcome of any such action could have a material adverse effect on its business, financial condition, results of operations, or cash flows.
Multiemployer Defined Benefit Pension Plans
Approximately 13% of the Company's workforce is covered by collective bargaining agreements with various local unions across its operating regions. As a result of some of these agreements, certain of the Company's subsidiaries are participating employers in a number of trustee-managed multiemployer, defined benefit pension plans for the affected employees. In connection with its ongoing renegotiation of various collective bargaining agreements, the Company may discuss and negotiate for the complete or partial withdrawal from one or more of these pension plans. A complete or partial withdrawal from a multiemployer pension plan may also occur if employees covered by a collective bargaining agreement vote to decertify a union from continuing to represent them. The Company is not aware of any such actions in connection with continuing operations. As a result of certain discontinued operations, the Company is potentially exposed to certain withdrawal liabilities. The Company does not believe that any future withdrawals, individually or in the aggregate, from the multiemployer plans to which it contributes could have a material adverse effect on the Company's business, financial condition or liquidity. However, such withdrawals could have a material adverse effect on the Company's results of operations for a particular reporting period, depending on the number of employees withdrawn in any future period and the financial condition of the multiemployer plan(s) at the time of such withdrawal(s).
Tax Matters
The Company has open tax years dating back to 2000 in certain jurisdictions. Prior to the acquisition, MW Star Holdings, Corp. (Veolia ES Solid Waste division) was part of a consolidated group and is still subject to IRS and state examinations dating back to 2004. Pursuant to the terms of the acquisition of Veolia ES Solid Waste, Inc., the Company is entitled to certain indemnifications for Veolia ES Solid Waste Division's pre-acquisition tax liabilities.
The Company maintains a liability for uncertain tax positions, the balance of which management believes is adequate. Results of audit assessments by taxing authorities are not
F-64
Advanced Disposal Services, Inc. and Subsidiaries
Notes to Unaudited Condensed Consolidated Financial Statements (Continued)
(in millions, except share data)
7. Commitments and Contingencies (Continued)
currently expected to have a material adverse impact on the Company's results of operations or cash flows.
8. Segment and Related Information
The Company manages and evaluates its operations primarily through its South, East and Midwest regional segments. These three groups are presented below as the Company's reportable segments. The Company's three geographic operating segments provide collection, transfer, disposal and recycling services. The Company serves residential, commercial and industrial, and municipal customers throughout its operating regions. Summarized financial information concerning its reportable segments for the six months ended June 30, 2016 and 2015 are shown in the table below:
| |
Service Revenues |
Operating Income (Loss) |
Depreciation and Amortization |
|||||||
|---|---|---|---|---|---|---|---|---|---|---|
Six Months Ended June 30, 2016 |
||||||||||
South |
$ | 247.3 | $ | 41.9 | $ | 37.3 | ||||
East |
184.5 | 12.8 | 36.6 | |||||||
Midwest |
260.2 | 32.0 | 47.5 | |||||||
Corporate |
— | (37.6 | ) | 4.0 | ||||||
| | | | | | | | | | | |
|
$ | 692.0 | $ | 49.1 | $ | 125.4 | ||||
| | | | | | | | | | | |
| | | | | | | | | | | |
| | | | | | | | | | | |
Six Months Ended June 30, 2015 |
||||||||||
South |
$ | 246.1 | $ | 28.3 | $ | 36.5 | ||||
East |
177.5 | 8.5 | 36.7 | |||||||
Midwest |
261.9 | 28.0 | 50.0 | |||||||
Corporate |
— | (27.1 | ) | 4.2 | ||||||
| | | | | | | | | | | |
|
$ | 685.5 | $ | 37.7 | $ | 127.4 | ||||
| | | | | | | | | | | |
| | | | | | | | | | | |
| | | | | | | | | | | |
Fluctuations in the Company's operating results may be caused by many factors, including period-to-period changes in the relative contribution of revenue by each line of business and operating segment and by general economic conditions. In addition, its revenues and income from operations typically reflect seasonal patterns. The Company expects its operating results to vary seasonally, with revenues typically lowest in the first quarter, higher in the second and third quarters and lower in the fourth quarter than in the second and third quarters. This seasonality reflects the lower volume of solid waste generated during the late fall, winter and early spring in the East and Midwest segments because of decreased construction and demolition activities during winter months in these regions of the United States. In addition, some of the Company's operating costs may be higher in the winter months. Adverse winter weather conditions slow waste collection activities, resulting in higher labor and operational costs. Greater precipitation in the winter increases the weight of collected municipal solid waste, resulting in higher disposal costs, which are calculated on a per ton basis.
F-65
Advanced Disposal Services, Inc. and Subsidiaries
Notes to Unaudited Condensed Consolidated Financial Statements (Continued)
(in millions, except share data)
8. Segment and Related Information (Continued)
Additionally, certain destructive weather conditions that tend to occur during the second half of the year, such as hurricanes that most often impact the South region, can increase the Company's revenues in the areas affected. While weather-related and other occurrences can boost revenues through additional work, as a result of significant start-up costs and other factors, such revenue sometimes generates earnings at comparatively lower margins. Certain weather conditions, including severe winter storms, may result in the temporary suspension of the Company's operations, which can significantly affect the operating results of the affected regions. No such events have occurred during the periods presented.
9. Fair Value Measurements
Assets and Liabilities Accounted for at Fair Value
In measuring fair values of assets and liabilities, the Company uses valuation techniques that maximize the use of observable inputs (Level 1) and minimize the use of unobservable inputs (Level 3). The Company also uses market data or assumptions that it believes market participants would use in pricing an asset or liability, including assumptions about risk when appropriate. The carrying value for certain of the Company's financial instruments approximate fair value because of their short-term nature. The Company's assets and liabilities that are measured at fair value on a recurring basis include the following:
| |
|
Fair Value Measurement at June 30, 2016 Reporting Date Using |
|||||||||||||||||
|---|---|---|---|---|---|---|---|---|---|---|---|---|---|---|---|---|---|---|---|
| |
Total | Quoted Prices in Active Markets for Identical Assets (Level 1) |
Significant Other Observable Inputs (Level 2) |
Significant Unobservable Inputs (Level 3) |
Total Gains (Losses) |
Carrying Value |
|||||||||||||
Recurring fair value measurements |
|||||||||||||||||||
Cash and cash equivalents |
$ | 1.2 | $ | 1.2 | $ | — | $ | — | $ | — | $ | 1.2 | |||||||
Derivative instruments—Liability position |
(9.2 | ) | — | (9.2 | ) | — | — | (9.2 | ) | ||||||||||
| | | | | | | | | | | | | | | | | | | | |
Total recurring fair value measurements |
$ | (8.0 | ) | $ | 1.2 | $ | (9.2 | ) | $ | — | $ | — | $ | (8.0 | ) | ||||
| | | | | | | | | | | | | | | | | | | | |
| | | | | | | | | | | | | | | | | | | | |
| | | | | | | | | | | | | | | | | | | | |
F-66
Advanced Disposal Services, Inc. and Subsidiaries
Notes to Unaudited Condensed Consolidated Financial Statements (Continued)
(in millions, except share data)
9. Fair Value Measurements (Continued)
| |
|
Fair Value Measurement at December 31, 2015 Reporting Date Using |
|||||||||||||||||
|---|---|---|---|---|---|---|---|---|---|---|---|---|---|---|---|---|---|---|---|
| |
Total | Quoted Prices in Active Markets for Identical Assets (Level 1) |
Significant Other Observable Inputs (Level 2) |
Significant Unobservable Inputs (Level 3) |
Total Gains (Losses) |
Carrying Value |
|||||||||||||
Recurring fair value measurements |
|||||||||||||||||||
Cash and cash equivalents |
$ | 0.6 | $ | 0.6 | $ | — | $ | — | $ | — | $ | 0.6 | |||||||
Derivative instruments—Asset position |
0.2 | — | 0.2 | — | — | 0.2 | |||||||||||||
Derivative instruments—Liability position |
(16.2 | ) | — | (16.2 | ) | — | — | (16.2 | ) | ||||||||||
| | | | | | | | | | | | | | | | | | | | |
Total recurring fair value measurements |
$ | (15.4 | ) | $ | 0.6 | $ | (16.0 | ) | $ | — | $ | — | $ | (15.4 | ) | ||||
| | | | | | | | | | | | | | | | | | | | |
| | | | | | | | | | | | | | | | | | | | |
| | | | | | | | | | | | | | | | | | | | |
The fair values of the fuel derivative instruments and interest rate caps are determined using standard option valuation models with assumptions about commodity prices and interest rates based on those observed in underlying markets (Level 2 in fair value hierarchy).
Fair Value of Debt
The fair value of the Company's debt (Level 2) is estimated using indirectly observable market inputs, except for the Revolver for which cost approximates fair value due to the short-term nature of the interest rate. Although the Company has determined the estimated fair value amounts using quoted market prices, considerable judgment is required in interpreting the information and in developing the estimated fair values. Therefore, these estimates are not necessarily indicative of the amounts that the Company, or holders of the instruments, could realize in a current market exchange. The fair value estimates are based on information available as of June 30, 2016 and December 31, 2015, respectively.
The estimated fair value of the Company's debt is as follows:
| |
June 30, 2016 |
December 31, 2015 |
|||||
|---|---|---|---|---|---|---|---|
Revolver |
$ | 11.0 | $ | 32.0 | |||
Senior Notes |
558.3 | 555.5 | |||||
Term Loan B |
1,662.3 | 1,639.2 | |||||
| | | | | | | | |
|
$ | 2,231.6 | $ | 2,226.7 | |||
| | | | | | | | |
| | | | | | | | |
| | | | | | | | |
The carrying value of the Company's debt at June 30, 2016 and December 31, 2015 was approximately $2,246.5 and $2,267.5, respectively.
F-67
Advanced Disposal Services, Inc. and Subsidiaries
Notes to Unaudited Condensed Consolidated Financial Statements (Continued)
(in millions, except share data)
10. Stock-Based Compensation
Amendment to Stock Incentive Plan
During the second quarter of 2016, the Board of Directors of the Parent amended the Advanced Disposal Waste Holdings Corp. 2012 Stock Incentive Plan (the 2012 Plan) to allow for the grant of performance shares, restricted shares, restricted share units, and other equity awards in addition to stock options and stock purchase rights as originally provided for under the 2012 Plan.
Named Executive Officer (NEO) Grants
During the six months ended June 30, 2016, there were 637 NEO restricted stock grants under the 2012 Plan with a fair value of $1,158.29 per share. The restricted stock will vest in three equal installments over each of the first three anniversaries of the date of the grant. For the six months ended June 30, 2016, none of the NEO restricted stock was forfeited. As of June 30, 2016, there were 637 shares of restricted stock outstanding under the 2012 Plan.
During the six months ended June 30, 2016, there were 1,274 NEO performance share units (PSUs) issued under the 2012 Plan with a fair value of $1,158.29 per share. The PSU's will vest in full on the third anniversary of the date of the grant. The PSU's shall be measured based on the Parent's budget and are weighted as follows: EBITDA: 50%; Free Cash Flow: 30%; and Revenue: 20%. The measurement criteria begin with an attainment of 90% of the budget which results in vesting of 25% of the shares underlying the PSU's granted and ends with an attainment of 110% of the budget which results in vesting of 175% of the shares underlying the PSU's granted. Performance will be measured separately for each of the three years in the performance period and the total number of PSU's earned at the conclusion of the three year performance period will be the sum of the PSU's earned with respect to each individual year. For the six months ended June 30, 2016, none of the NEO PSU's were forfeited. As of June 30, 2016, there were 1,274 PSU's outstanding under the 2012 Plan.
During the six months ended June 30, 2016, there were 2,032 NEO option grants under the 2012 Plan. The options will vest in three equal installments over each of the first three anniversaries of the date of the grant. For the six months ended June 30, 2016, none of these NEO options were forfeited or exercised. As of June 30, 2016, there were 2,032 options outstanding under the NEO plan. The weighted average exercise price of outstanding NEO options was $1,158.29. The weighted average remaining contractual term for the outstanding NEO options was ten years as of June 30, 2016.
During the six months ended June 30, 2016, the Company and its Chief Executive Officer (CEO), entered into an amendment to the CEO's employment agreement. The amendment adjusts the performance criteria applicable to performance-based stock options that the CEO is eligible to earn with respect to 2016. Previously, the only applicable criterion was EBITDA; the amendment provides that the number of performance-based stock options earned will be based on EBITDA (50%) and free cash flow (50%). The amendment also clarifies that the full potential grant of performance-based stock options (covering up to 4,000 shares of Parent's common stock) is still available to be earned by the CEO.
F-68
Advanced Disposal Services, Inc. and Subsidiaries
Notes to Unaudited Condensed Consolidated Financial Statements (Continued)
(in millions, except share data)
10. Stock-Based Compensation (Continued)
Total unrecognized compensation expense for all of the above NEO grants (including the impact of the amendment to the CEO performance-based stock options) was approximately $3.7 as of June 30, 2016, which will be recognized over the next 3.5 years. For the six months ended June 30, 2016, compensation expense for all of the above NEO grants (including the impact of the amendment to the CEO performance-based stock options) was approximately $0.0 due to the awards being granted during the last week of the second quarter.
Annual Stock Option Grants
During the six months ended June 30, 2016, there were 11,656 annual grants under the 2012 Plan for employees other than the NEO's. For the six months ended June 30, 2016, 1,803 annual options were forfeited. No annual options were exercised for the six months ended June 30, 2016. Total unrecognized compensation expense for the annual awards was approximately $4.1 as of June 30, 2016, which will be recognized over the next 3.1 years. For the six months ended June 30, 2016 and 2015, compensation expense for the annual options was $1.2 and $0.7, respectively.
Strategic Stock Option Grants
During the six months ended June 30, 2016, there were no strategic grant issuances under the 2012 Plan. For the six months ended June 30, 2016, 1,481 strategic options were forfeited. No strategic options were exercised for the six months ended June 30, 2016. Total unrecognized compensation expense for the strategic awards was approximately $1.6 as of June 30, 2016, which will be recognized over the next 2.9 years. For the six months ended June 30, 2016 and 2015, compensation expense for the strategic options was $0.4 and $0.5, respectively.
11. Guarantor Financial Statements
All borrowings under the Term Loan B and the Revolver are guaranteed by each of the Company's current and future U.S. subsidiaries (which also guarantee the Senior Notes), subject to certain agreed-upon exemptions. The Company has one non-guarantor foreign subsidiary, Sanitation Services Company Limited, which exceeded 3% of pretax income for the six months ended June 30, 2016. As a result, the Company is providing the following condensed consolidating financial information in accordance with SEC disclosure requirements. Prior periods are not presented as the non guarantor subsidiary was minor.
F-69
Advanced Disposal Services, Inc. and Subsidiaries
Notes to Unaudited Condensed Consolidated Financial Statements (Continued)
(in millions, except share data)
11. Guarantor Financial Statements (Continued)
Condensed Consolidated Balance Sheet as of June 30, 2016
| |
Company (Parent) |
Guarantor Subsidiaries |
Non-Guarantor Subsidiary |
Eliminations | Consolidated | |||||||||||
|---|---|---|---|---|---|---|---|---|---|---|---|---|---|---|---|---|
Assets |
||||||||||||||||
Current assets |
||||||||||||||||
Cash and cash equivalents |
$ | — | $ | 0.1 | $ | 1.1 | $ | — | $ | 1.2 | ||||||
Accounts receivable |
— | 182.0 | — | — | 182.0 | |||||||||||
Prepaid expenses and other current assets |
8.6 | 16.6 | — | — | 25.2 | |||||||||||
Deferred income taxes |
— | — | — | — | — | |||||||||||
Assets of business held for sale |
— | — | — | — | ||||||||||||
| | | | | | | | | | | | | | | | | |
Total current assets |
8.6 | 198.7 | 1.1 | — | 208.4 | |||||||||||
Restricted cash |
— | — | — | — | — | |||||||||||
Other assets |
7.1 | 5.0 | 9.9 | — | 22.0 | |||||||||||
Property and equipment, net |
10.0 | 1,615.1 | — | — | 1,625.1 | |||||||||||
Goodwill |
— | 1,174.0 | — | — | 1,174.0 | |||||||||||
Other intangible assets, net |
96.5 | 248.7 | — | — | 345.2 | |||||||||||
Investment in consolidated subsidiaries |
2,792.7 | — | — | (2,792.7 | ) | — | ||||||||||
| | | | | | | | | | | | | | | | | |
Total assets |
$ | 2,914.9 | $ | 3,241.5 | $ | 11.0 | $ | (2,792.7 | ) | $ | 3,374.7 | |||||
| | | | | | | | | | | | | | | | | |
| | | | | | | | | | | | | | | | | |
| | | | | | | | | | | | | | | | | |
Liabilities and Stockholders' Equity |
||||||||||||||||
Current liabilities |
||||||||||||||||
Accounts payable |
$ | 31.4 | $ | 60.0 | $ | 6.4 | $ | — | $ | 97.8 | ||||||
Accrued expenses |
51.4 | 64.8 | — | — | 116.2 | |||||||||||
Deferred revenue |
— | 62.3 | — | — | 62.3 | |||||||||||
Current maturities of landfill retirement obligations |
— | 30.8 | — | — | 30.8 | |||||||||||
Current maturities of long-term debt |
22.9 | 15.9 | — | — | 38.8 | |||||||||||
Liabilities of businesses held for sale |
— | — | — | — | — | |||||||||||
| | | | | | | | | | | | | | | | | |
Total current liabilities |
105.7 | 233.8 | 6.4 | — | 345.9 | |||||||||||
Other long-term liabilities, less current maturities |
43.9 | 13.8 | — | — | 57.7 | |||||||||||
Long-term debt, less current maturities |
2,165.9 | 35.7 | — | — | 2,201.6 | |||||||||||
Accrued landfill retirement obligations, less current maturities |
— | 170.1 | — | — | 170.1 | |||||||||||
Deferred income taxes |
132.9 | — | — | — | 132.9 | |||||||||||
| | | | | | | | | | | | | | | | | |
Total liabilities |
2,448.4 | 453.4 | 6.4 | — | 2,908.2 | |||||||||||
| | | | | | | | | | | | | | | | | |
Equity |
||||||||||||||||
Total stockholders' equity |
466.5 | 2,788.1 | 4.6 | (2,792.7 | ) | 466.5 | ||||||||||
| | | | | | | | | | | | | | | | | |
Total liabilities and stockholders' equity |
$ | 2,914.9 | $ | 3,241.5 | $ | 11.0 | $ | (2,792.7 | ) | $ | 3,374.7 | |||||
| | | | | | | | | | | | | | | | | |
| | | | | | | | | | | | | | | | | |
| | | | | | | | | | | | | | | | | |
F-70
Advanced Disposal Services, Inc. and Subsidiaries
Notes to Unaudited Condensed Consolidated Financial Statements (Continued)
(in millions, except share data)
11. Guarantor Financial Statements (Continued)
Condensed Consolidated Statement of Operations for the six months ended June 30, 2016
| |
Company (Parent) |
Combined Guarantor Subsidiaries |
Non-Guarantor Subsidiary |
Eliminations | Consolidated | |||||||||||
|---|---|---|---|---|---|---|---|---|---|---|---|---|---|---|---|---|
Service revenues |
$ | — | $ | 692.0 | $ | — | $ | — | $ | 692.0 | ||||||
| | | | | | | | | | | | | | | | | |
Operating costs and expenses |
||||||||||||||||
Operating |
— | 432.3 | — | — | 432.3 | |||||||||||
Selling, general and administrative |
25.0 | 59.1 | — | — | 84.1 | |||||||||||
Depreciation and amortization |
4.0 | 121.4 | — | — | 125.4 | |||||||||||
Acquisition and development costs |
0.2 | — | — | — | 0.2 | |||||||||||
Loss on disposal of assets |
— | 0.1 | — | — | 0.1 | |||||||||||
Restructuring charges |
0.8 | — | — | — | 0.8 | |||||||||||
| | | | | | | | | | | | | | | | | |
Total operating costs and expenses |
30.0 | 612.9 | — | — | 642.9 | |||||||||||
| | | | | | | | | | | | | | | | | |
Operating (loss) income |
(30.0 | ) | 79.1 | — | — | 49.1 | ||||||||||
| | | | | | | | | | | | | | | | | |
Other income (expense) |
||||||||||||||||
Equity in income of consolidated subsidiaries |
79.6 | — | — | (79.6 | ) | — | ||||||||||
Interest expense |
(67.5 | ) | (1.1 | ) | — | — | (68.6 | ) | ||||||||
Other (expense) income, net |
(1.2 | ) | 0.5 | 1.1 | — | 0.4 | ||||||||||
| | | | | | | | | | | | | | | | | |
Total other income (expense) |
10.9 | (0.6 | ) | 1.1 | (79.6 | ) | (68.2 | ) | ||||||||
| | | | | | | | | | | | | | | | | |
(Loss) income before income taxes |
(19.1 | ) | 78.5 | 1.1 | (79.6 | ) | (19.1 | ) | ||||||||
Income tax (benefit) expense |
(5.1 | ) | 29.4 | 0.4 | (29.8 | ) | (5.1 | ) | ||||||||
| | | | | | | | | | | | | | | | | |
Net (loss) income |
$ | (14.0 | ) | $ | 49.1 | $ | 0.7 | $ | (49.8 | ) | $ | (14.0 | ) | |||
| | | | | | | | | | | | | | | | | |
| | | | | | | | | | | | | | | | | |
| | | | | | | | | | | | | | | | | |
F-71
Advanced Disposal Services, Inc. and Subsidiaries
Notes to Unaudited Condensed Consolidated Financial Statements (Continued)
(in millions, except share data)
11. Guarantor Financial Statements (Continued)
Condensed Consolidated Statement of Cash Flows for the six months ended June 30, 2016
| |
Company (Parent) |
Combined Guarantor Subsidiaries |
Non-Guarantor Subsidiary |
Eliminations | Consolidated | |||||||||||
|---|---|---|---|---|---|---|---|---|---|---|---|---|---|---|---|---|
Cash flows from operating activities |
||||||||||||||||
Net cash (used in) provided by operating activities |
$ | (89.4 | ) | $ | 193.1 | $ | 0.7 | $ | — | $ | 104.4 | |||||
| | | | | | | | | | | | | | | | | |
Cash flows from investing activities |
||||||||||||||||
Purchases of property and equipment and construction and development |
(0.5 | ) | (68.7 | ) | — | — | (69.2 | ) | ||||||||
Proceeds from sale of property and equipment |
— | 1.0 | — | — | 1.0 | |||||||||||
Acquisition of businesses |
— | (5.1 | ) | — | — | (5.1 | ) | |||||||||
Proceeds from sale of businesses |
— | 2.5 | — | — | 2.5 | |||||||||||
| | | | | | | | | | | | | | | | | |
Net cash used in investing activities |
(0.5 | ) | (70.3 | ) | — | — | (70.8 | ) | ||||||||
| | | | | | | | | | | | | | | | | |
Cash flows from financing activities |
||||||||||||||||
Proceeds from borrowings on debt instruments |
70.0 | — | — | — | 70.0 | |||||||||||
Repayment on debt instruments |
(101.9 | ) | — | — | — | (101.9 | ) | |||||||||
Deferred financing charges |
0.2 | — | — | — | 0.2 | |||||||||||
Bank overdraft |
11.3 | — | — | — | 11.3 | |||||||||||
Return of capital to parent |
(12.6 | ) | — | — | — | (12.6 | ) | |||||||||
Intercompany cash transfers |
122.9 | (122.9 | ) | — | — | — | ||||||||||
| | | | | | | | | | | | | | | | | |
Net cash used in financing activities |
89.9 | (122.9 | ) | — | — | (33.0 | ) | |||||||||
| | | | | | | | | | | | | | | | | |
Net (decrease) increase in cash and cash equivalents |
— | (0.1 | ) | 0.7 | — | 0.6 | ||||||||||
Cash and cash equivalents, beginning of period |
— | 0.2 | 0.4 | — | 0.6 | |||||||||||
| | | | | | | | | | | | | | | | | |
Cash and cash equivalents, end of period |
$ | — | $ | 0.1 | $ | 1.1 | $ | — | $ | 1.2 | ||||||
| | | | | | | | | | | | | | | | | |
| | | | | | | | | | | | | | | | | |
| | | | | | | | | | | | | | | | | |
F-72
Advanced Disposal Services, Inc. and Subsidiaries
Notes to Unaudited Condensed Consolidated Financial Statements (Continued)
(in millions, except share data)
12. Earnings Per Share
| |
Six months ended June 30, |
||||||
|---|---|---|---|---|---|---|---|
| |
2016 | 2015 | |||||
Amounts attributable to the Company: |
|||||||
Net loss attributable to common stockholder for per-share calculations |
$ | (14.0 | ) | $ | (19.3 | ) | |
| | | | | | | | |
| | | | | | | | |
| | | | | | | | |
Per share loss attributable to stockholder owners |
$ | (14,000 | ) | $ | (19,300 | ) | |
Net loss attributable to common stockholder per share |
|||||||
Basic loss per share |
$ | (14,000 | ) | $ | (19,300 | ) | |
Diluted loss per share |
N/A | N/A | |||||
The Company had 1,000 shares of common stock outstanding for each of the periods ended June 30, 2016 and 2015 and no other anti-dilutive securities.
13. Subsequent Events
Return of Capital to the Parent
Subsequent to June 30, 2016, the Board of Directors approved $12.5 of capital to be returned to the parent.
Amendment to the Senior Secured Credit Agreement
On August 4, 2016, the Company entered into an amendment to the Senior Secured Credit Agreement dated October 9, 2012. The amendment, among other things, extended the maturity date with respect to approximately $280.0 of the Company's $300.0 commitments under the revolving credit facility to October 2019.
F-73
|
|
Advanced Disposal Services, Inc. |
19,250,000 Shares
Common Stock
Deutsche Bank Securities
Credit Suisse
Barclays
UBS Investment Bank
BofA Merrill Lynch
Macquarie Capital
Morgan Stanley
Stifel
SMBC Nikko
First Analysis Securities Corp.
Prospectus
, 2016
Through and including , 2016 (the 25th day after the date of this prospectus), all dealers effecting transactions in these securities, whether or not participating in this offering, may be required to deliver a prospectus. This is in addition to a dealer's obligation to deliver a prospectus when acting as an underwriter and with respect to an unsold allotment or subscription.
PART II
INFORMATION NOT REQUIRED IN THE PROSPECTUS
Item 13. Other Expenses of Issuance and Distribution
The following table sets forth the costs and expenses, other than the underwriting discount, payable in connection with the sale and distribution of the securities being registered. All amounts are estimated except the SEC registration fee and the FINRA filing fee. Except as otherwise noted, all the expenses below will be paid by us.
| |
Amount to be paid |
|||
|---|---|---|---|---|
SEC Registration Fee |
$ | 53,170 | ||
FINRA Filing Fee |
79,700 | |||
Legal Fees and Expenses |
412,000 | |||
Accounting Fees and Expenses |
304,000 | |||
Printing and Engraving Expenses |
297,000 | |||
Transfer Agent and Registrar Fees |
14,000 | |||
Miscellaneous Expenses |
300,000 | |||
Total |
$ | 1,459,870 | ||
Item 14. Indemnification of Directors and Officers
We are a Delaware corporation. Section 145(a) of the DGCL provides that a Delaware corporation may indemnify any person who was or is a party or is threatened to be made a party to any threatened, pending or completed action, suit or proceeding, whether civil, criminal, administrative or investigative, other than an action by or in the right of the corporation, by reason of the fact that such person is or was a director, officer, employee or agent of the corporation, or is or was serving at the request of the corporation as a director, officer, employee or agent of another corporation, partnership, joint venture, trust or other enterprise, against expenses (including attorney fees), judgments, fines and amounts paid in settlement actually and reasonably incurred by the person in connection with such action, suit or proceeding if the person acted in good faith and in a manner the person reasonably believed to be in or not opposed to the best interests of the corporation, and, with respect to any criminal action or proceeding, had no reasonable cause to believe his or her conduct was unlawful.
Section 145(b) of the DGCL provides that a Delaware corporation may indemnify any person who was or is a party or is threatened to be made a party to any threatened, pending or completed action or suit by or in the right of the corporation to procure a judgment in its favor by reason of the fact that such person acted in any of the capacities set forth above, against expenses (including attorney fees) actually and reasonably incurred by such person in connection with the defense or settlement of such action or suit if the person acted in good faith and in a manner the person reasonably believed to be in or not opposed to the best interests of the corporation, except that no indemnification shall be made in respect of any claim, issue or matter as to which such person shall have been adjudged to be liable to the corporation, unless and only to the extent that the Court of Chancery or the court in which such action or suit was brought shall determine that, despite the adjudication of liability but in view of all the circumstances of the case, such person is fairly and reasonably entitled to indemnity for such expenses which the court shall deem proper.
II-1
Further subsections of DGCL Section 145 provide that:
- (1)
- to
the extent a present or former director or officer of a corporation has been successful on the merits or otherwise in the defense of any action, suit or
proceeding referred to in subsections (a) and (b) of Section 145 or in the defense of any claim, issue or matter therein, such person shall be indemnified against expenses, including
attorneys' fees, actually and reasonably incurred by such person in connection therewith;
- (2)
- the
indemnification and advancement of expenses provided for pursuant to Section 145 shall not be deemed exclusive of any other rights to which those
seeking indemnification or advancement of expenses may be entitled under any bylaw, agreement, vote of stockholders or disinterested directors or otherwise; and
- (3)
- the corporation shall have the power to purchase and maintain insurance of behalf of any person who is or was a director, officer, employee or agent of the corporation, or is or was serving at the request of the corporation as a director, officer, employee or agent of another corporation, partnership, joint venture, trust or other enterprise, against any liability asserted against such person and incurred by such person in any such capacity, or arising out of such person's status as such, whether or not the corporation would have the power to indemnify such person against such liability under Section 145.
As used in this Item 14, the term "proceeding" means any threatened, pending, or completed action, suit, or proceeding, whether or not by or in the right of us, and whether civil, criminal, administrative, investigative or otherwise.
Section 145 of the DGCL makes provision for the indemnification of officers and directors in terms sufficiently broad to indemnify our officers and directors under certain circumstances from liabilities (including reimbursement for expenses incurred) arising under the Securities Act. Our certificate of incorporation will provide, in effect, that, to the fullest extent and under the circumstances permitted by Section 145 of the DGCL, we will indemnify any and all of our officers and directors. Our certificate of incorporation also will relieve our directors from monetary damages to us or our stockholders for breach of such director's fiduciary duty as a director to the fullest extent permitted by the DGCL. Under Section 102(b)(7) of the DGCL, a corporation may relieve its directors from personal liability to such corporation or its stockholders for monetary damages for any breach of their fiduciary duty as directors except (i) for a breach of the duty of loyalty, (ii) for failure to act in good faith, (iii) for intentional misconduct or knowing violation of law, (iv) for willful or negligent violations of certain provisions in the DGCL imposing certain requirements with respect to stock repurchases, redemptions and dividends, or (v) for any transactions from which the director derived an improper personal benefit.
We have purchased insurance policies which, within the limits and subject to the terms and conditions thereof, cover certain expenses and liabilities that may be incurred by directors and officers in connection with proceedings that may be brought against them as a result of an act or omission committed or suffered while acting as our director or officer.
We have entered, and intend to continue to enter, into separate indemnification agreements with our directors and executive officers to provide these directors and executive officers additional contractual assurances regarding the scope of the indemnification that will be set forth in our restated certificate of incorporation and restated bylaws and to provide additional procedural protections. At present, there is no pending litigation or proceeding involving a director or executive officer regarding which indemnification is sought.
II-2
The form of Underwriting Agreement, to be entered into in connection with this offering and to be attached as Exhibit 1.1 hereto, provides for the indemnification by the Underwriters of us and our officers and directors for certain liabilities, including liabilities arising under the Securities Act, and affords certain rights of contribution with respect thereto.
Item 15. Recent Sales of Unregistered Securities.
On October 9, 2012, we sold $550 million aggregate principal amount of 81/4% Senior Notes due 2020 to Deutsche Bank Securities Inc., Macquarie Capital (USA) Inc., UBS Securities LLC, Barclays Bank PLC and Credit Suisse Securities (USA) LLC, as initial purchasers at a cash purchase price equal to 100% of their principal amount. These securities were issued in a transaction by an issuer not involving any public offering and thereby exempt from the registration requirements in reliance of Section 4(a)(2) of the Securities Act. The 81/4% Senior Notes due 2020 were sold to "qualified institutional buyers" within the meaning of Rule 144A of the Securities Act, without any general advertising or solicitation or were sold in sales occurring outside the United States within the meaning of Regulation S.
In December 2013, we exchanged all of the outstanding notes for registered notes with identical terms.
Prior to the completion of this offering, in connection with the Reorganization, we are issuing shares of our common stock in exchange for outstanding shares of Advanced Disposal Services Corp. The issuance of such shares of common stock is not and will not be registered under the Securities Act and are being issued to investors in reliance upon the exemption from the registration requirements of the Securities Act, as set forth in Section 4(a)(2) under the Securities Act and Regulation D promulgated thereunder.
Item 16. Exhibits and Financial Statement Schedules.
- (a)
- Exhibits
The exhibit index attached hereto is incorporated herein by reference.
- (b)
- Financial Statement Schedules
No financial statement schedules are provided because the information called for is not required or is shown in the financial statements or the notes thereto.
- (a)
- The
undersigned registrant hereby undertakes to provide to the underwriters at the closing specified in the underwriting agreements certificates in such
denominations and registered in such names as required by the underwriters to permit prompt delivery to each purchaser.
- (b)
- Insofar as indemnification for liabilities arising under the Securities Act may be permitted to directors, officers and controlling persons of the registrant pursuant to the foregoing provisions, or otherwise, the registrant has been advised that in the opinion of the Securities and Exchange Commission such indemnification is against public policy as expressed in the Securities Act and is, therefore, unenforceable. In the event that a claim for indemnification against such liabilities (other than the payment by the registrant of expenses incurred or paid by a director, officer or controlling person of the registrant in the successful defense of any action, suit or proceeding) is asserted by such director, officer or controlling person in connection with the securities being registered, the registrant will, unless in the opinion of
II-3
- (c)
- The
undersigned registrant hereby undertakes that:
- (1)
- For
purposes of determining any liability under the Securities Act, the information omitted for the form of prospectus filed as part of this registration
statement in reliance upon Rule 430A and contained in a form of prospectus filed by the registrant pursuant to Rule 424(b)(1) or (4) or 497(h) under the Securities Act shall be deemed to
be a part of this registration statement as of the time it was declared effective.
- (2)
- For purposes of determining any liability under Securities Act, each post-effective amendment that contains a form of prospectus shall be deemed to be a new registration statement relating to the securities offered therein, and the offering of such securities at that time shall be deemed to be the initial bona fide offering thereof.
counsel the matter has been settled by controlling precedent, submit to a court of appropriate jurisdiction the question of whether such indemnification by it or them is against public policy as expressed in the Securities Act and will be governed by the final adjudication of such issue.
II-4
Pursuant to the requirements of the Securities Act, as amended, the registrant has duly caused this Amendment No. 7 to the Registration Statement to be signed on its behalf by the undersigned, thereunto duly authorized, in the City of Ponte Vedra, State of Florida, on September 26, 2016.
| Advanced Disposal Services, Inc. | ||||
By: |
/s/ RICHARD BURKE Richard Burke Chief Executive Officer and Director |
|||
Pursuant to the requirements of the Securities Act, this registration statement has been signed by the following persons in the capacities and on the dates indicated.
Signature
|
Title
|
Date
|
||
|---|---|---|---|---|
| /s/ RICHARD BURKE Richard Burke |
Chief Executive Officer and Director (Principal Executive Officer) | September 26, 2016 | ||
/s/ STEVEN R. CARN Steven R. Carn |
Chief Financial Officer, Treasurer and Director (Principal Financial Officer) |
September 26, 2016 |
||
/s/ MATTHEW GUNNELSON Matthew Gunnelson |
Chief Accounting Officer, Assistant Treasurer (Principal Accounting Officer) |
September 26, 2016 |
||
* Christopher Beall |
Director |
September 26, 2016 |
||
* John Miller |
Director |
September 26, 2016 |
||
* Bret Budenbender |
Director |
September 26, 2016 |
||
* Jared Parker |
Director |
September 26, 2016 |
||
* Sergio Pedreiro |
Director |
September 26, 2016 |
||
* Matthew Rinklin |
Director |
September 26, 2016 |
||
* Michael Koen |
Director |
September 26, 2016 |
| *By: | /s/ RICHARD BURKE Richard Burke Attorney-in-fact |
II-5
| |
Exhibit Number |
Description of Exhibits | |||
|---|---|---|---|---|---|
| 1.1** | Form of Underwriting Agreement | ||||
2.1**† |
Form of Agreement and Plan of Merger between Advanced Disposal Waste Holdings Corp. and Advanced Disposal Services, Inc. |
||||
3.1* |
Form of Amended and Restated Certificate of Incorporation of Advanced Disposal Services, Inc. |
||||
3.2** |
Form of Amended and Restated Bylaws of Advanced Disposal Services, Inc. |
||||
4.1** |
Specimen Stock Certificate |
||||
4.2 |
Indenture, dated as of October 9, 2012, between ADS Waste Escrow Corp. and Wells Fargo Bank, National Association, as trustee (incorporated by reference to Exhibit 4.1 of the Company's Registration Statement on Form S-4 filed with the Securities and Exchange Commission on September 11, 2013) |
||||
4.3 |
Supplemental Indenture, dated as of November 20, 2012 among certain subsidiaries of ADS Waste Holdings, Inc., as guarantors, and Wells Fargo Bank, National Association, as trustee (incorporated by reference to Exhibit 4.2 of the Company's Registration Statement on Form S-4 filed with the Securities and Exchange Commission on September 11, 2013) |
||||
4.4 |
Supplemental Indenture, dated as of November 20, 2012 between ADS Waste Holdings, Inc., and Wells Fargo Bank, National Association, as trustee (incorporated by reference to Exhibit 4.3 of the Company's Registration Statement on Form S-4 filed with the Securities and Exchange Commission on September 11, 2013) |
||||
4.5** |
Form of Registration Rights Agreement |
||||
5.1** |
Opinion of Shearman & Sterling LLP |
||||
10.1 |
Senior Secured Credit Agreement, dated as of October 9, 2012, among ADS Waste Escrow Corp. II, as escrow borrower, ADS Waste Holdings, Inc., as borrower upon the acquisition date, Advanced Disposal Waste Holdings Corp., as intermediate holdings upon the acquisition date, the lenders party thereto, Deutsche Bank Trust Company, Americans, as administrative agent and collateral agent, Deutsche Bank Securities Inc., Macquarie Capital (USA) Inc., UBS Securities LLC, Barclays Bank PLC and Credit Suisse Securities (USA) LLC, as joint bookrunners and joint lead arrangers, Macquarie Capital (USA) Inc. and UBS Securities LLC, as co-syndication agents, and Barclays Bank PLC and Credit Suisse Securities (USA) LLC, as co-documentation agents (incorporated by reference to Exhibit 10.1 of the Company's Registration Statement on Form S-4 filed with the Securities and Exchange Commission on September 11, 2013, as amended and/or supplemented by (i) Exhibit 10.1 of the Company's Amendment No. 1 to the Registration Statement on Form S-4 filed with the Securities and Exchange Commission on October 16, 2013, (ii) Exhibit 10.1(a) of the Company's Amendment No. 5 to the Registration Statement on Form S-4 filed with the Securities and Exchange Commission on November 1, 2013 and (iii) Exhibit 10.1(a) of the Company's Amendment No. 6 to the Registration Statement on Form S-4 filed with the Securities and Exchange Commission on November 6, 2013) |
||||
II-6
| |
Exhibit Number |
Description of Exhibits | |||
|---|---|---|---|---|---|
| 10.2 | Amendment No. 1, dated as of February 8, 2013, to the credit agreement, dated as of October 9, 2012, among ADS Waste Holdings, Inc., Advanced Disposal Waste Holdings Corp., the several banks and other financial institutions or entities from time to time parties to the Credit Agreement and Deutsche Bank Trust Company Americas, as administrative agent and collateral agent, issuing bank and swing line lender (incorporated by reference to Exhibit 10.2 of the Company's Registration Statement on Form S-4 filed with the Securities and Exchange Commission on September 11, 2013) | ||||
10.3 |
Amendment No. 2, dated as of February 14, 2014, to the credit agreement, dated as of October 9, 2012, among ADS Waste Holdings, Inc., Advanced Disposal Waste Holdings Corp., the several banks and other financial institutions or entities from time to time parties to the Credit Agreement and Deutsche Bank Trust Company Americas, as administrative agent and collateral agent, issuing bank and swing line lender (incorporated by reference to Exhibit 10.3 of the Company's Form 10-K filed with the Securities and Exchange Commission on March 21, 2014) |
||||
10.4 |
Amendment No. 3, dated February 4, 2016, and Partial Waiver to Amendment No. 3, dated August 4, 2016, to the credit agreement, dated as of October 9, 2012, among ADS Waste Holdings, Inc., Advanced Disposal Waste Holdings Corp., the several banks and other financial institutions or entities from time to time parties to the Credit Agreement and Deutsche Bank Trust Company Americas, as administrative agent and collateral agent, issuing bank and swing line lender (incorporated by reference to Exhibits 10.1 and 10.2 of the Company's Form 8-K filed with the Securities and Exchange Commission on August 5, 2016) |
||||
10.5 |
Share Purchase Agreement, dated as of July 18, 2012, by and among Veolia Environmental Services North America Corp., VES Solid Waste Holdings, LLC, and Star Atlantic Waste Holdings II, L.P. (incorporated by reference to Exhibit 10.3 of the Company's Registration Statement on Form S-4 filed with the Securities and Exchange Commission on September 11, 2013, as amended and/or supplemented by (i) Exhibit 10.3 of the Company's Amendment No. 2 to the Registration Statement on Form S-4 filed with the Securities and Exchange Commission on October 17, 2013, (ii) Exhibit 10.3 of the Company's Amendment No. 3 to the Registration Statement on Form S-4 filed with the Securities and Exchange Commission on October 17, 2013, (iii) Exhibit 10.3 of the Company's Amendment No. 4 to the Registration Statement on Form S-4 filed with the Securities and Exchange Commission on October 17, 2013 and (iv) Exhibit 10.3 of the Company's Amendment No. 6 to the Registration Statement on Form S-4 filed with the Securities and Exchange Commission on November 6, 2013) |
||||
10.6 |
Amendment, dated as of November 20, 2012, to the Share Purchase Agreement, dated as of July 18, 2012, by and among Veolia Environmental Services North America Corp., VES Solid Waste Holdings, LLC, and Star Atlantic Waste Holdings II, L.P. (incorporated by reference to Exhibit 10.4 of the Company's Registration Statement on Form S-4 filed with the Securities and Exchange Commission on September 11, 2013) |
||||
10.7** |
Form of Indemnity Agreement for Directors and Executive Officers of Advanced Disposal Services, Inc. |
||||
II-7
| |
Exhibit Number |
Description of Exhibits | |||
|---|---|---|---|---|---|
| 10.8 | Executive Employment Agreement for Charles Appleby, dated November 20, 2012 (incorporated by reference to Exhibit 10.6 of the Company's Registration Statement on Form S-4 filed with the Securities and Exchange Commission on September 11, 2013) | ||||
10.8a |
Letter Agreement with Charles Appleby, dated June 20, 2014 (incorporated by reference to Exhibit 10.1 of the company's Form 8-K filed with the Securities and Exchange Commission on June 26, 2014) |
||||
10.9 |
Executive Employment Agreement for Richard Burke, dated November 20, 2012 (incorporated by reference to Exhibit 10.7 of the Company's Registration Statement on Form S-4 filed with the Securities and Exchange Commission on September 11, 2013) |
||||
10.9a |
Amendment No. 1 to Executive Employment Agreement with Richard Burke, dated July 18, 2014 (incorporated by reference to Exhibit 10.1 of the Company's Form 8-K filed with the Securities and Exchange Commission on July 24, 2014) |
||||
10.9b |
Amendment No. 2 to Executive Employment Agreement with Richard Burke, dated June 24, 2016 (incorporated by reference to Exhibit 10.6 of the Company's Form 8-K filed with the Securities and Exchange Commission on June 30, 2016) |
||||
10.10 |
Executive Employment Agreement for Steven R. Carn, dated November 20, 2012 (incorporated by reference to Exhibit 10.9 of the Company's Registration Statement on Form S-4 filed with the Securities and Exchange Commission on September 11, 2013) |
||||
10.11 |
Executive Employment Agreement for John Spegal, dated May 1, 2014 (incorporated by reference to Exhibit 10.10 of the Company's Registration Statement on Form S-4 filed with the Securities and Exchange Commission on September 11, 2013) |
||||
10.12 |
Advanced Disposal Waste Holdings Corp. 2012 Stock Incentive Plan (incorporated by reference to Exhibit 10.12 of the Company's Registration Statement on Form S-4 filed with the Securities and Exchange Commission on September 11, 2013) |
||||
10.13 |
Advanced Disposal Waste Holdings Corp. Amended and Restated 2012 Stock Incentive Plan (incorporated by reference to Exhibit 10.1 of the Company's Form 8-K filed with the Securities and Exchange Commission on June 30, 2016) |
||||
10.14** |
Amendment No. 1 to 2012 Advanced Disposal Waste Holdings Corp. 2012 Stock Incentive Plan |
||||
10.15** |
Amendment No. 2 to 2012 Advanced Disposal Waste Holdings Corp. 2012 Stock Incentive Plan |
||||
10.16 |
Amended and Restated Share Price Protection Agreement, between the Company and Charles Appleby, dated December 20, 2012 (incorporated by reference to Exhibit 10.13 of the Company's Registration Statement on Form S-4 filed with the Securities and Exchange Commission on September 11, 2013) |
||||
10.17 |
Form of Senior Management Stock Option Award Agreement (for Substituted Option) under the Advanced Disposal Waste Holdings Corp. 2012 Stock Incentive Plan (incorporated by reference to Exhibit 10.14 of the Company's Registration Statement on Form S-4 filed with the Securities and Exchange Commission on September 11, 2013) |
||||
II-8
| |
Exhibit Number |
Description of Exhibits | |||
|---|---|---|---|---|---|
| 10.18 | Form of Management Stock Option Award Agreement, Annual Award (for Substituted Option) under the Advanced Disposal Waste Holdings Corp. 2012 Stock Incentive Plan (incorporated by reference to Exhibit 10.15 of the Company's Registration Statement on Form S-4 filed with the Securities and Exchange Commission on September 11, 2013) | ||||
10.19 |
Form of Management Stock Option Award Agreement, Strategic Performance Award (Post-2009) (for Substituted Option) under the Advanced Disposal Waste Holdings Corp. 2012 Stock Incentive Plan (incorporated by reference to Exhibit 10.16 of the Company's Registration Statement on Form S-4 filed with the Securities and Exchange Commission on September 11, 2013) |
||||
10.20 |
Form of Management Stock Option Award Agreement/Strategic Performance Award (Pre-2010) (for Substituted Option) under the Advanced Disposal Waste Holdings Corp. 2012 Stock Incentive Plan (incorporated by reference to Exhibit 10.17 of the Company's Registration Statement on Form S-4 filed with the Securities and Exchange Commission on September 11, 2013) |
||||
10.21 |
Form of Senior Management Stock Option Award Agreement under the Advanced Disposal Waste Holdings Corp. 2012 Stock Incentive Plan (incorporated by reference to Exhibit 10.18 of the Company's Registration Statement on Form S-4 filed with the Securities and Exchange Commission on September 11, 2013) |
||||
10.22 |
Form of Management Stock Option Award Agreement, Strategic Performance Award under the Advanced Disposal Waste Holdings Corp. 2012 Stock Incentive Plan (incorporated by reference to Exhibit 10.19 of the Company's Registration Statement on Form S-4 filed with the Securities and Exchange Commission on September 11, 2013) |
||||
10.23 |
Form of Management Stock Option Award Agreement, Annual Award under the Advanced Disposal Waste Holdings Corp. 2012 Stock Incentive Plan (incorporated by reference to Exhibit 10.20 of the Company's Registration Statement on Form S-4 filed with the Securities and Exchange Commission on September 11, 2013) |
||||
10.24** |
Executive Employment Agreement for Michael K. Slattery, dated May 29, 2015 |
||||
10.25** |
Executive Employment Agreement for William Westrate, dated May 1, 2015 |
||||
10.26** |
Form of Advance Disposal Services, Inc. 2016 Omnibus Equity Plan |
||||
10.27** |
Form of Advanced Disposal Services, Inc. Short Term Incentive Compensation Plan |
||||
10.28** |
Form of Award Agreement for Non-Qualified Stock Options for Executive Officers under the Advanced Disposal Services, Inc. 2016 Omnibus Equity Plan |
||||
10.29** |
Form of Award Agreement for Incentive Stock Options for Executive Officers under the Advanced Disposal Services, Inc. 2016 Omnibus Equity Plan |
||||
10.30** |
Form of Award Agreement for Restricted Shares for Executive Officers under the Advanced Disposal Services, Inc. 2016 Omnibus Equity Plan |
||||
10.31** |
Form of Award Agreement for Restricted Share Units for Executive Officers under the Advanced Disposal Services, Inc. 2016 Omnibus Equity Plan |
||||
II-9
| |
Exhibit Number |
Description of Exhibits | |||
|---|---|---|---|---|---|
| 10.32** | Form of Award Agreement for Restricted Shares for Directors under the Advanced Disposal Services, Inc. 2016 Omnibus Equity Plan | ||||
10.33** |
Form of Award Agreement for Non-Qualified Stock Options under the Advanced Disposal Services, Inc. 2016 Omnibus Equity Plan |
||||
10.34** |
Form of Award Agreement for Incentive Stock Options under the Advanced Disposal Services, Inc. 2016 Omnibus Equity Plan |
||||
10.35** |
Form of Award Agreement for Restricted Shares under the Advanced Disposal Services, Inc. 2016 Omnibus Equity Plan |
||||
10.36** |
Form of Award Agreement for Restricted Share Units under the Advanced Disposal Services, Inc. 2016 Omnibus Equity Plan |
||||
10.37 |
Form of Performance Share Unit Award Agreement for Named Executive Officers under the Advanced Disposal Waste Holdings Corp. Amended and Restated 2012 Stock Incentive Plan (incorporated by reference to Exhibit 10.2 of the Company's Form 8-K filed with the Securities and Exchange Commission on June 30, 2016) |
||||
10.38 |
Form of Restricted Share Award Agreement for Named Executive Officers under the Advanced Disposal Waste Holdings Corp. Amended and Restated 2012 Stock Incentive Plan (incorporated by reference to Exhibit 10.3 of the Company's Form 8-K filed with the Securities and Exchange Commission on June 30, 2016) |
||||
10.39 |
Form of Restricted Share Unit Award Agreement for Named Executive Officers under the Advanced Disposal Waste Holdings Corp. Amended and Restated 2012 Stock Incentive Plan (incorporated by reference to Exhibit 10.4 of the Company's Form 8-K filed with the Securities and Exchange Commission on June 30, 2016) |
||||
10.40 |
Form of Non-Qualified Stock Option Award Agreement for Named Executive Officers under the Advanced Disposal Waste Holdings Corp. Amended and Restated 2012 Stock Incentive Plan (incorporated by reference to Exhibit 10.5 of the Company's Form 8-K filed with the Securities and Exchange Commission on June 30, 2016) |
||||
10.41** |
Form of Stockholders Agreement among Advanced Disposal Services, Inc., Star Atlantic Waste Holdings, L.P., BTG Pactual International Portfolio Fund II SPC, Segregated Portfolio BTGPH Corp Hedge and Canada Pension Plan Investment Board |
||||
14.1 |
Code of Business Conduct (incorporated by reference to Exhibit 14.1 of the Company's Form 8-K filed with the Securities and Exchange Commission on December 2, 2015) |
||||
21.1** |
Subsidiaries of ADS Waste Holdings, Inc. |
||||
23.1** |
Consent of Shearman & Sterling LLP (included in Exhibit 5.1) |
||||
23.2* |
Consent of Ernst & Young LLP |
||||
24.1** |
Powers of Attorney |
||||
101.INS** |
XBRL Instance Document |
||||
101.SCH** |
XBRL Taxonomy Extension Schema Document |
||||
101.CAL** |
XBRL Taxonomy Extension Calculation Linkbase Document |
||||
101.DEF** |
XBRL Taxonomy Extension Definition Linkbase Document |
||||
II-10
| |
Exhibit Number |
Description of Exhibits | |||
|---|---|---|---|---|---|
| 101.LAB** | XBRL Taxonomy Extension Label Linkbase Document | ||||
101.PRE** |
XBRL Taxonomy Extension Presentation Linkbase Document |
||||
- *
- Filed
herewith.
- **
- Previously
filed.
- ***
- To
be filed by amendment.
- †
- The Form of Agreement and Plan of Merger filed as Exhibit 2.1 omits certain of the schedules and exhibits to the Form of Agreement and Plan of Merger in accordance with Item 601(b)(2) of Regulation S-K. A list briefly identifying the contents of all omitted schedules and exhibits is included with the Form of Agreement and Plan of Merger filed as Exhibit 2.1. ADS Waste Holdings, Inc. agrees to furnish supplementally a copy of any omitted schedule or exhibit to the Securities and Exchange Commission upon request.
II-11