Attached files
| file | filename |
|---|---|
| 8-K - 8-K - Silver Bay Realty Trust Corp. | a8-kq32016investorpresenta.htm |

Investor Presentation
September 2016
Forward-Looking Statements
This presentation and related conversations contain forward-looking statements within the meaning of the federal securities laws. Forward-looking statements relate
to expectations, beliefs, projections, future plans and strategies, anticipated events or trends and similar expressions concerning matters that are not historical facts.
In some cases, readers can identify forward-looking statements by the use of forward-looking terminology such as “may,” “will,” “should,” “expects,” “intends,” “plans,”
“anticipates,” “believes,” “estimates,” “predicts,” or “potential” or the negative of these words and phrases or similar words or phrases which are predictions of or
indicate future events or trends and which do not relate solely to historical matters. Readers can also identify forward-looking statements by discussions of strategy,
plans or intentions. Examples of forward-looking statements include statements about: expectations related to household formations, home ownership rates, and
other demographics and the impact of such matters on rental demand, rent growth, asset values, and other of our operating results; industry rent forecasts and our
ability to raise rents; intentions related to asset sales, including pricing, volume and identity of such assets and our ability to invest in higher yielding assets; our ability
to lease and operate acquired properties and to improve our operating performance, including our abilities and projections related to turnover rates and timeframes,
operating costs, rent increases, and occupancy rates; our projected financial and operating results; our intentions related to our capital allocation strategy, including
through the use of share repurchases; future real estate values and prices; and the general economy and its impact on Silver Bay’s results.
The forward-looking statements contained in this presentation and related conversations reflect Silver Bay’s current views about future events and are subject to
numerous known and unknown risks, uncertainties, assumptions and changes in circumstances that may cause Silver Bay’s actual results to differ significantly from
those expressed or implied in any forward-looking statement. Silver Bay is not able to predict all of the factors that may affect future results. Readers should not rely
on any of these forward-looking statements. They are neither statements of historical fact nor guarantees or assurances of future performance. Important factors that
could cause actual results to differ materially from those in the forward-looking statements include national, regional or local economic, business, competitive, market
and regulatory conditions and the following: those factors described in the discussion on risk factors in Part I, Item 1A, "Risk Factors" in the Company's Annual Report
on Form 10-K for the year ended December 31, 2015 and Part I, Item 2 “Management’s Discussion and Analysis of Financial Condition and Results of Operations”
and Part I, Item 3 "Quantitative and Qualitative Disclosures about Market Risk" in the Company's Quarterly Reports on Form 10-Q for the quarters ending March 31,
2016 and June 30, 2016 and other risks and uncertainties detailed in Silver Bay’s other reports and filings with the Securities and Exchange Commission (“SEC”);
defaults on, early terminations of or non-renewal of leases by residents; resident turnover or turnover costs; Silver Bay’s ability to maintain occupancy levels and
leasing traffic or to attract and retain qualified residents in light of increased competition in the leasing market for quality residents, the relatively short duration of
leases, inadequate marketing, reputational damage or other reasons; Silver Bay’s ability to control or reduce operating expenses, including repairs and maintenance
expense and other costs such as real estate taxes, homeowners’ association fees, insurance and other costs outside the Company’s control for reasons including
damage to properties due to storms, other natural causes or residents and other reasons; Silver Bay’s ability to successfully operate its properties; Silver Bay’s ability
to maintain rents at levels that are sufficient to keep pace with rising costs of operations; Silver Bay’s ability to dispose of assets at attractive pricing levels; the
amount of capital available for share repurchases and other purposes; Silver Bay’s ability to implement and manage its service technician initiatives or the impact of
such initiatives to reduce maintenance, turnover and other expenses as predicted; Silver Bay’s ability to obtain financing arrangements; Silver Bay’s failure to meet
the conditions to draw under the revolving credit facility; the Company’s ability to perform under the covenants of its revolving credit facility and securitization loan;
general volatility of the markets in which it participates; interest rates and the market value of Silver Bay’s assets; the impact of changes in governmental regulations,
tax law and rates, and similar matters; difficulties in identifying properties to acquire and completing acquisitions; increased time and/or expense to gain possession
and renovate properties; Silver Bay’s dependence on key personnel to carry its business and investment strategies and its ability to hire and retain skilled managerial,
investment, financial, and operational personnel, and the performance of third-party vendors and service providers, including third party management professionals,
maintenance providers, leasing agents, and property managers; and Silver Bay’s ability to remain qualified as a REIT.
The forward-looking statements in this presentation and related conversations represent Silver Bay’s views as of the date of this presentation. Subsequent events
and developments could cause these views to change. However, while Silver Bay may elect to update these forward-looking statements at some point in the future,
Silver Bay has no current intention of doing so except to the extent required by applicable laws. Readers should, therefore, not rely on these forward-looking
statements as representing Silver Bay’s views as of any date subsequent to the date of this presentation. All subsequent written and oral forward looking statements
concerning Silver Bay or matters attributable to Silver Bay or any person acting on its behalf are expressly qualified in their entirety by the cautionary statements
above.
2
About Silver Bay
Internally Managed REIT
NYSE Listed: SBY
First publicly traded single-family rental REIT formed in 2012
Internally managed REIT focused on acquisition, renovation,
leasing and management of single-family properties in the U.S.
Enterprise Value(1) $1.3 billion
Portfolio(1) 8,911 properties with concentration in Georgia, Florida and
Arizona
Estimated market value per property of $167,000
Average monthly rent of $1,190 for a 3 bed/2 bath home
Operating Metrics(1) Portfolio occupancy rate of 97.6%
Same-Home net operating income (NOI) (2) increased 12%
year over year in the second quarter 2016 to $12.6 million
Trailing four quarter turnover rate of 29.6%
Capital Allocation(1) Continued focus on recycling capital in higher yielding assets
Dividend yield of 2.7% as of September 19, 2016
Opportunistically repurchased 11% of Silver Bay market
capitalization since formation
3
(1) Data as of and for the quarter ended June 30, 2016, unless otherwise stated
(2) NOI is a non-GAAP financial measure. See the non-GAAP reconciliation included in the appendix. GAAP is defined as in
accordance with accounting principles generally accepted in the United States.
Investment Highlights
Strong Fundamentals
Underpin the
Single-Family Rental Industry
Household formations and
low homeownership rates
driving demand
Strong demographics
Prospects for continued
rental growth remain
Single-family rental industry
in early stages of
institutional ownership
Silver Bay is Well Positioned to
Drive Cash Flow and Maximize
Long-term Stockholder Value
Diversified portfolio of assets
in 11 markets
Emphasis on portfolio
optimization
Focus on operational
excellence
Disciplined capital allocation
strategy
4
Single-Family Rental Industry Overview

Households Growing & Housing Starts Lag(1) Homeownership Rates(1) (%)
Household Formations and Lower Homeownership Rates
Driving Rental Demand
6
(1) Current Population Survey/Housing Vacancy Survey, Series H-111, U.S. Census Bureau; National Association of Realtors; US
Census Bureau, Population Division
(2) Single-Family Rental Primer, Green Street Advisors – Advisory & Consulting Group
The number of households in the U.S. has continued to grow while the supply of
new housing has not kept pace
− An estimated 6.6 million total households are expected to be formed over the next 5 years(2)
− Single-family rentals are expected to capture approximately 1.5 million of these formations(2)
The decline in home ownership rates has benefited single-family rental demand
− Millennials (18-35 year-olds) have one of the lowest home ownership rates and it’s declining
0
500
1,000
1,500
2,000
0
20,000
40,000
60,000
80,000
100,000
120,000
1991 1995 1999 2003 2007 2011 2015
Total Households (000's) (LH) Housing Starts (000's) (RH)
20
30
40
50
60
70
80
Dec-95 Dec-05 Dec-15
Under 35 years 35 to 44 years
Household formations outpacing housing supply and
U.S. homeownership declining
-2,000,000
0
2,000,000
4,000,000
6,000,000
8,000,000
10,000,000
18-24 years 25-44 years 45-64 years
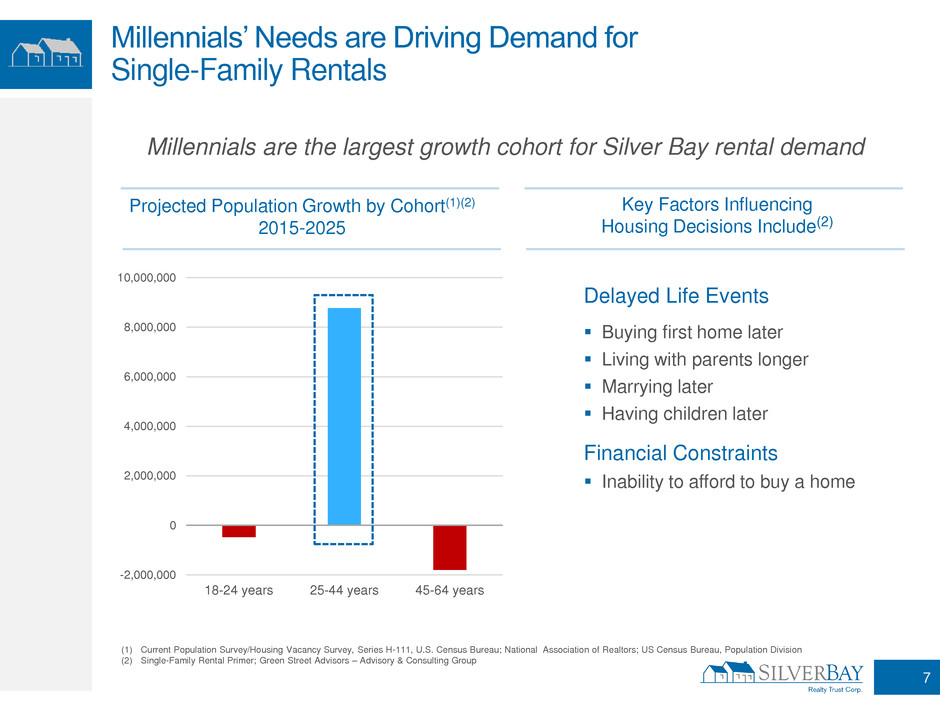
Projected Population Growth by Cohort(1)(2)
2015-2025
Key Factors Influencing
Housing Decisions Include(2)
Millennials’ Needs are Driving Demand for
Single-Family Rentals
7
(1) Current Population Survey/Housing Vacancy Survey, Series H-111, U.S. Census Bureau; National Association of Realtors; US Census Bureau, Population Division
(2) Single-Family Rental Primer; Green Street Advisors – Advisory & Consulting Group
Delayed Life Events
Buying first home later
Living with parents longer
Marrying later
Having children later
Financial Constraints
Inability to afford to buy a home
Millennials are the largest growth cohort for Silver Bay rental demand

3%
97%
3%
46%
42%
9%
Millennials Require More Space as They Start Families
Single-family rental homes
are more spacious than
most apartments
– The vast majority of single-
family rental homes are 3+
bedrooms versus only 9%
of apartments
Silver Bay’s single-family
rentals are priced
attractively at $0.69 per
square foot versus
apartments at $1.03 per
square foot
In comparable markets,
Silver Bay average rent is
33% below apartment
rental rates
(1) Silver Bay data is as of June 30, 2016
(2) Single-Family Rental Primer; Green Street Advisors – Advisory & Consulting Group
SBY Portfolio (1) Apartments (2)
Studio 1 Bedroom 2 Bedrooms 3+ Bedrooms
8
SBY Single-Family Portfolio(1) Apartments(2)
Market Avg. SF
Avg.
Rent Rent/SF
Avg.
SF
Avg.
Rent Rent/SF
Atlanta 1,803 $1,086 $0.60 1,031 $1,054 $1.02
Charlotte 1,646 $1,089 $0.66 965 $987 $1.02
Las Vegas 1,717 $1,209 $0.70 939 $883 $0.94
Phoenix 1,636 $1,118 $0.68 886 $926 $1.04
Tampa 1,623 $1,318 $0.81 938 $1,069 $1.14
Average 1,685 $1,164 $0.69 952 $984 $1.03
Avg. Rent/SF Discount to Multifamily -33%
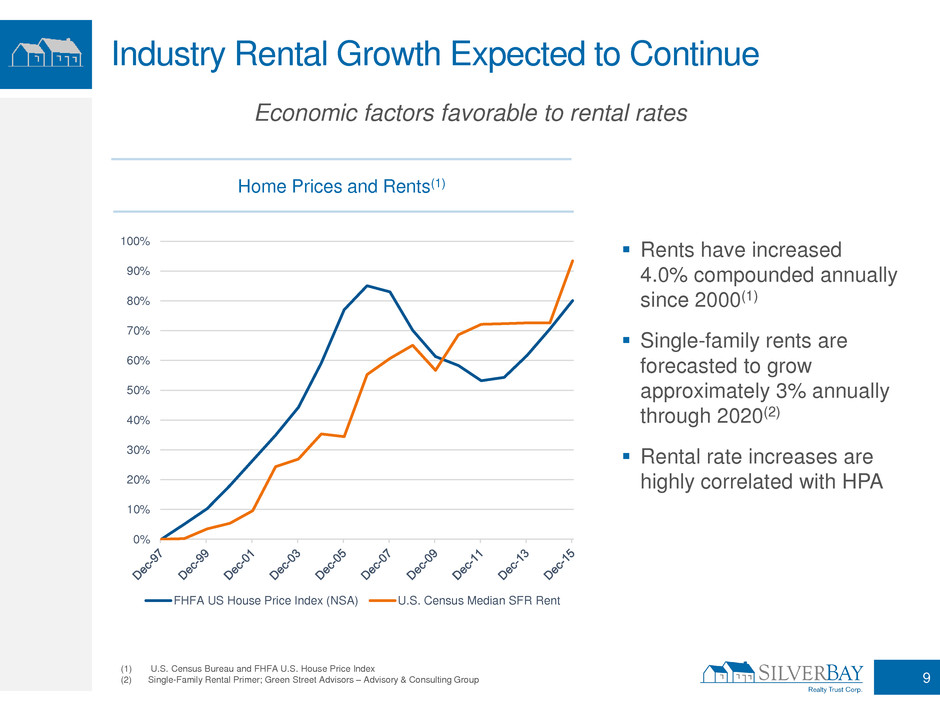
Home Prices and Rents(1)
Industry Rental Growth Expected to Continue
Rents have increased
4.0% compounded annually
since 2000(1)
Single-family rents are
forecasted to grow
approximately 3% annually
through 2020(2)
Rental rate increases are
highly correlated with HPA
(1) U.S. Census Bureau and FHFA U.S. House Price Index
(2) Single-Family Rental Primer; Green Street Advisors – Advisory & Consulting Group
0%
10%
20%
30%
40%
50%
60%
70%
80%
90%
100%
FHFA US House Price Index (NSA) U.S. Census Median SFR Rent
Economic factors favorable to rental rates
9
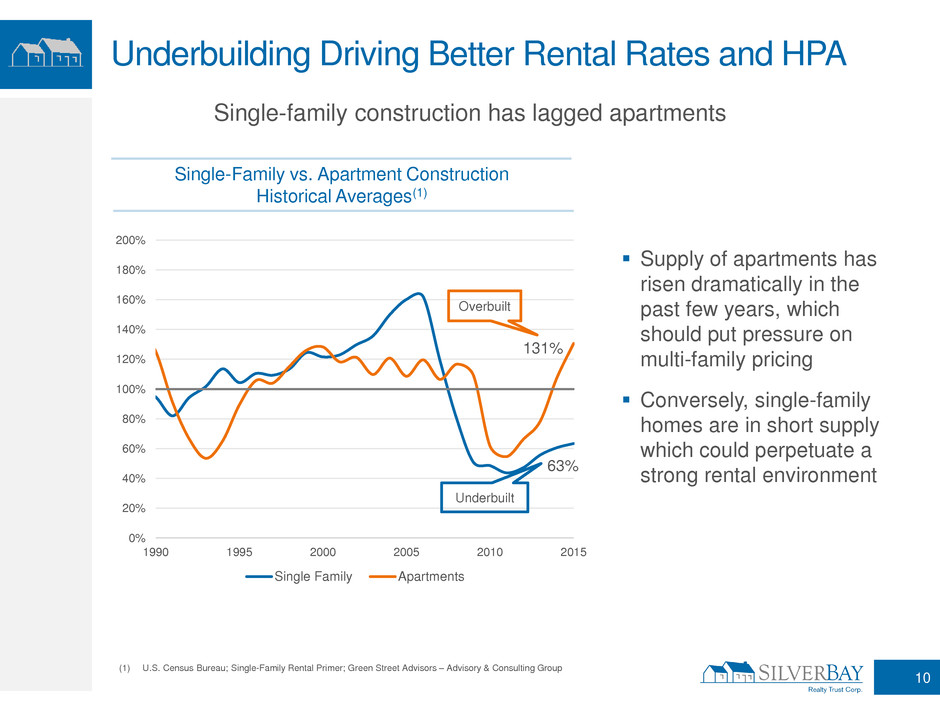
Single-Family vs. Apartment Construction
Historical Averages(1)
Underbuilding Driving Better Rental Rates and HPA
Supply of apartments has
risen dramatically in the
past few years, which
should put pressure on
multi-family pricing
Conversely, single-family
homes are in short supply
which could perpetuate a
strong rental environment
(1) U.S. Census Bureau; Single-Family Rental Primer; Green Street Advisors – Advisory & Consulting Group
63%
131%
0%
20%
40%
60%
80%
100%
120%
140%
160%
180%
200%
1990 1995 2000 2005 2010 2015
Single Family Apartments
Overbuilt
Underbuilt
10
Single-family construction has lagged apartments

Single-Family vs. Commercial Property Prices(1)
Residential Property Prices are Relatively More Stable
Commercial property valuations
are more sensitive to
movements in interest rates. As
interest rates rise, cap rates
typically rise which causes
more volatility in commercial
property prices.
Single-family rentals can be
valued in two ways:
– Following a traditional cap rate
methodology
– Alternatively, via sales
into the owner-occupant market,
offering downside protection in a
rising interest rate environment
(1) FHFA and Green Street Advisors Commercial Property Price Index.
0%
20%
40%
60%
80%
100%
120%
140%
160%
FHFA US House Price Index (NSA)
Green Street Commercial Property Price Index
11
Residential property prices are historically less volatile than commercial
prices highlighting a compelling risk-return profile

Single-Family Rental Industry in Early Stages of
Institutional Ownership
(1) Single-Family Rental Primer; Green Street Advisors – Advisory & Consulting Group
(2) Based on Silver Bay estimates
Institutional ownership represents a minority (1.3%) of total single-family
rentals in the U.S., leaving significant opportunity for portfolio acquisitions
12
Total SFR Units (1) Institutionally Owned Units (2)
15.7 M
200 K

Silver Bay Overview
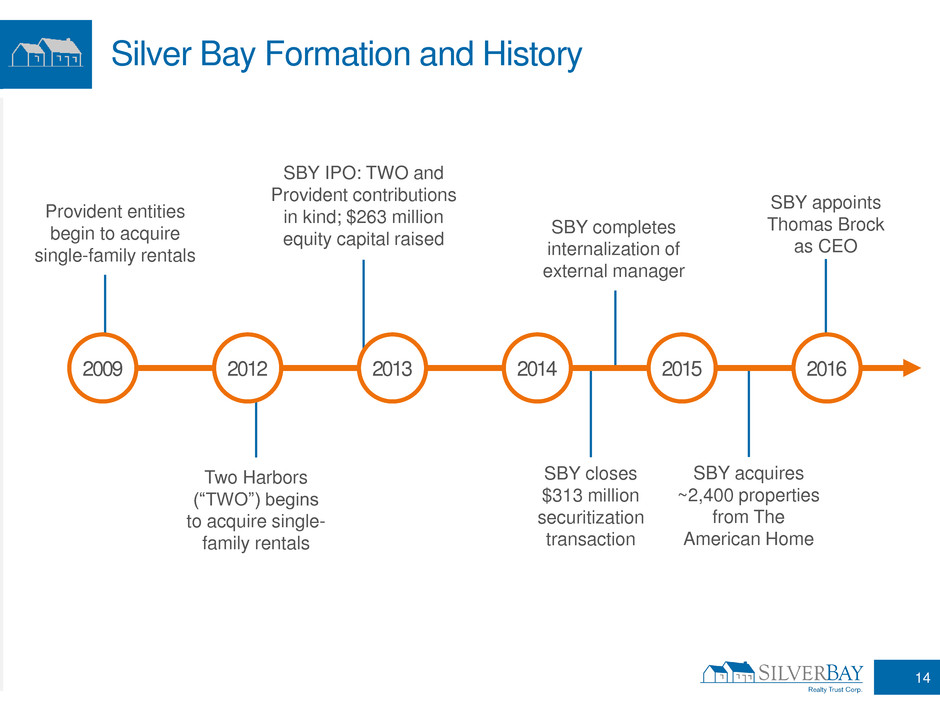
Silver Bay Formation and History
14
Two Harbors
(“TWO”) begins
to acquire single-
family rentals
SBY closes
$313 million
securitization
transaction
SBY acquires
~2,400 properties
from The
American Home
Provident entities
begin to acquire
single-family rentals
SBY IPO: TWO and
Provident contributions
in kind; $263 million
equity capital raised SBY completes internalization of
external manager
SBY appoints
Thomas Brock
as CEO
2009 2012 2013 2014 2015 2016
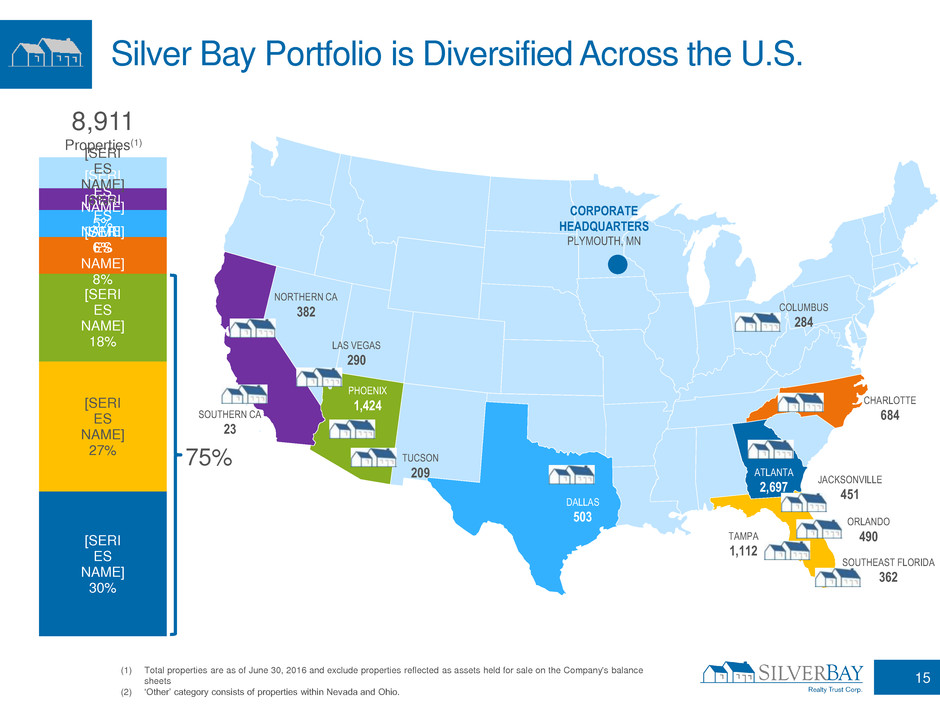
Silver Bay Portfolio is Diversified Across the U.S.
(1) Total properties are as of June 30, 2016 and exclude properties reflected as assets held for sale on the Company's balance
sheets
(2) ‘Other’ category consists of properties within Nevada and Ohio.
8,911
Properties(1)
[SERI
ES
NAME]
30%
[SERI
ES
NAME]
27%
[SERI
ES
NAME]
18%
[SERI
ES
NAME]
8%
[SERI
ES
NAME]
6%
[SERI
ES
NAME]
5%
[SERI
ES
NAME]
6%(2)
PERCENTAGE
75%
NORTHERN CA
382
SOUTHERN CA
23
LAS VEGAS
290
PHOENIX
1,424
TUCSON
209
DALLAS
503
SOUTHEAST FLORIDA
362
JACKSONVILLE
451
COLUMBUS
284
ATLANTA
2,697
CHARLOTTE
684
TAMPA
1,112
ORLANDO
490
15
CORPORATE
HEADQUARTERS
PLYMOUTH, MN
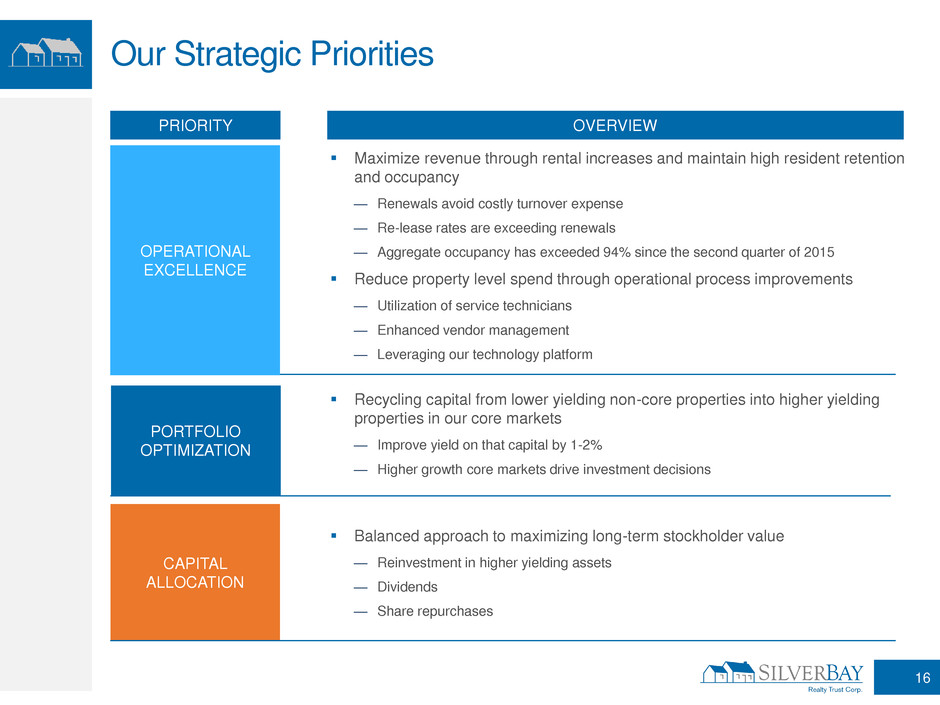
Our Strategic Priorities
PRIORITY OVERVIEW
CAPITAL
ALLOCATION
Balanced approach to maximizing long-term stockholder value
— Reinvestment in higher yielding assets
— Dividends
— Share repurchases
16
PORTFOLIO
OPTIMIZATION
Recycling capital from lower yielding non-core properties into higher yielding
properties in our core markets
— Improve yield on that capital by 1-2%
— Higher growth core markets drive investment decisions
OPERATIONAL
EXCELLENCE
Maximize revenue through rental increases and maintain high resident retention
and occupancy
— Renewals avoid costly turnover expense
— Re-lease rates are exceeding renewals
— Aggregate occupancy has exceeded 94% since the second quarter of 2015
Reduce property level spend through operational process improvements
— Utilization of service technicians
— Enhanced vendor management
— Leveraging our technology platform
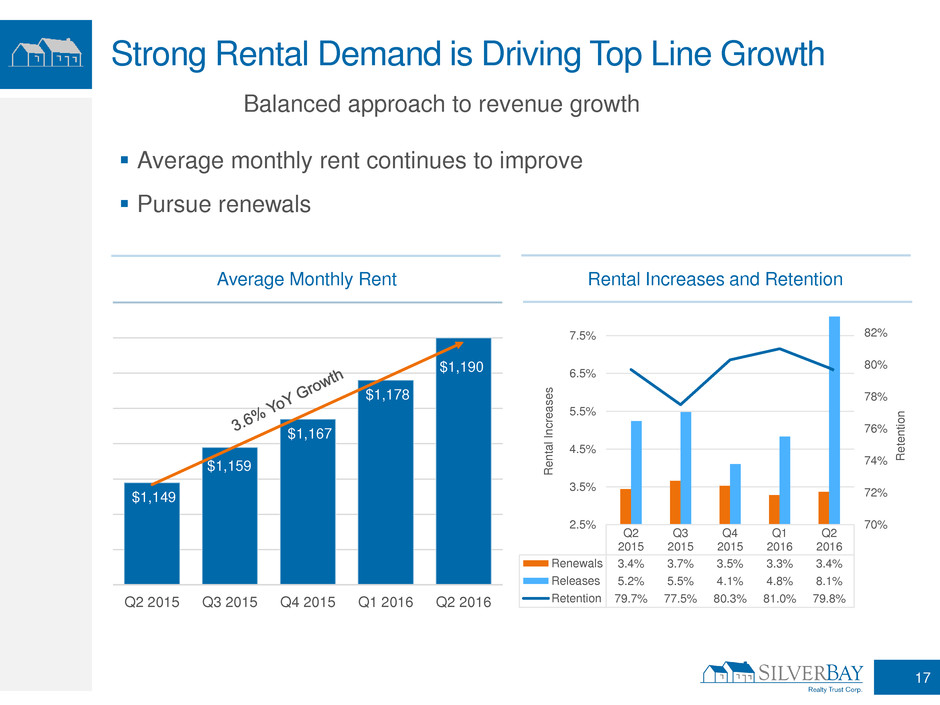
Rental Increases and Retention Average Monthly Rent
Balanced approach to revenue growth
Strong Rental Demand is Driving Top Line Growth
$1,149
$1,159
$1,167
$1,178
$1,190
Q2 2015 Q3 2015 Q4 2015 Q1 2016 Q2 2016
Average monthly rent continues to improve
Pursue renewals
Q2
2015
Q3
2015
Q4
2015
Q1
2016
Q2
2016
Renewals 3.4% 3.7% 3.5% 3.3% 3.4%
Releases 5.2% 5.5% 4.1% 4.8% 8.1%
Retention 79.7% 77.5% 80.3% 81.0% 79.8%
70%
72%
74%
76%
78%
80%
82%
2.5%
3.5%
4.5%
5.5%
6.5%
7.5%
Re
te
n
ti
o
n
Re
n
ta
l
In
c
re
a
s
e
s
17

(1) US Census; 12/31/15
The HUD’s housing
expenditure threshold is 30%
of household income
Silver Bay’s annual
average rent of $14,000
represents only 24% of a
resident’s income, well below
the HUD standard
This leaves considerable
room for rental increases while
still staying below the 30%
HUD standard
Silver Bay’s median
household income of $58,000
is slightly higher than the
national average of $56,000
Affordability Gap Gives SBY Ability to Grow Rents
U.S. SBY
$58,000
$17,400
$14,000
100%
30%
100%
50%
SBY Median
Household
Income
30%
50%
24%
Affordability
Gap =
$3,400
18
$56,000
$16,200
U.S. Median
Household
Income(1)

Same-Home NOI
($ in 000's)
Same-Home Revenue
($ in 000's)
$20,852
$21,103 $21,181
$21,672
$22,065
Q2 2015 Q3 2015 Q4 2015 Q1 2016 Q2 2016
High Occupancy and Rental Increases Drive
Same-Home NOI Growth
Same-home portfolio of
5,942 properties
represents approximately
67% of total portfolio
NOI(1) year-over-year
growth in the second
quarter of 2016 was
primarily due to revenue
growth as a result of robust
rental demand and
occupancy and reduced
turn time
(1) NOI is a non-GAAP financial measure. See the non-GAAP reconciliation included in the appendix.
GAAP is defined as in accordance with accounting principles generally accepted in the United States.
$11,207 $11,241
$11,776
$11,994
$12,555
Q2 2015 Q3 2015 Q4 2015 Q1 2016 Q2 2016
19
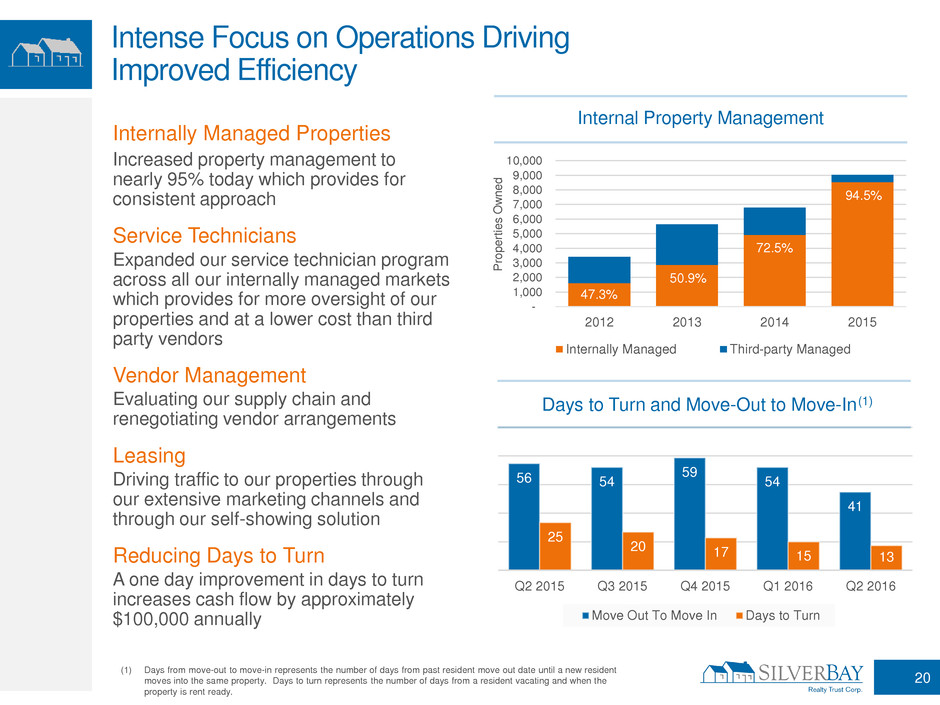
Days to Turn and Move-Out to Move-In (1)
Internal Property Management
56 54
59
54
41
25
20 17 15 13
Q2 2015 Q3 2015 Q4 2015 Q1 2016 Q2 2016
Move Out To Move In Days to Turn
Intense Focus on Operations Driving
Improved Efficiency
(1) Days from move-out to move-in represents the number of days from past resident move out date until a new resident
moves into the same property. Days to turn represents the number of days from a resident vacating and when the
property is rent ready.
-
1,000
2,000
3,000
4,000
5,000
6,000
7,000
8,000
9,000
10,000
2012 2013 2014 2015
Pr
o
p
e
rt
ie
s
O
w
n
e
d
Internally Managed Third-party Managed
Internally Managed Properties
Increased property management to
nearly 95% today which provides for
consistent approach
Service Technicians
Expanded our service technician program
across all our internally managed markets
which provides for more oversight of our
properties and at a lower cost than third
party vendors
Vendor Management
Evaluating our supply chain and
renegotiating vendor arrangements
Leasing
Driving traffic to our properties through
our extensive marketing channels and
through our self-showing solution
Reducing Days to Turn
A one day improvement in days to turn
increases cash flow by approximately
$100,000 annually
20
47.3%
50.9%
72.5%
94.5%
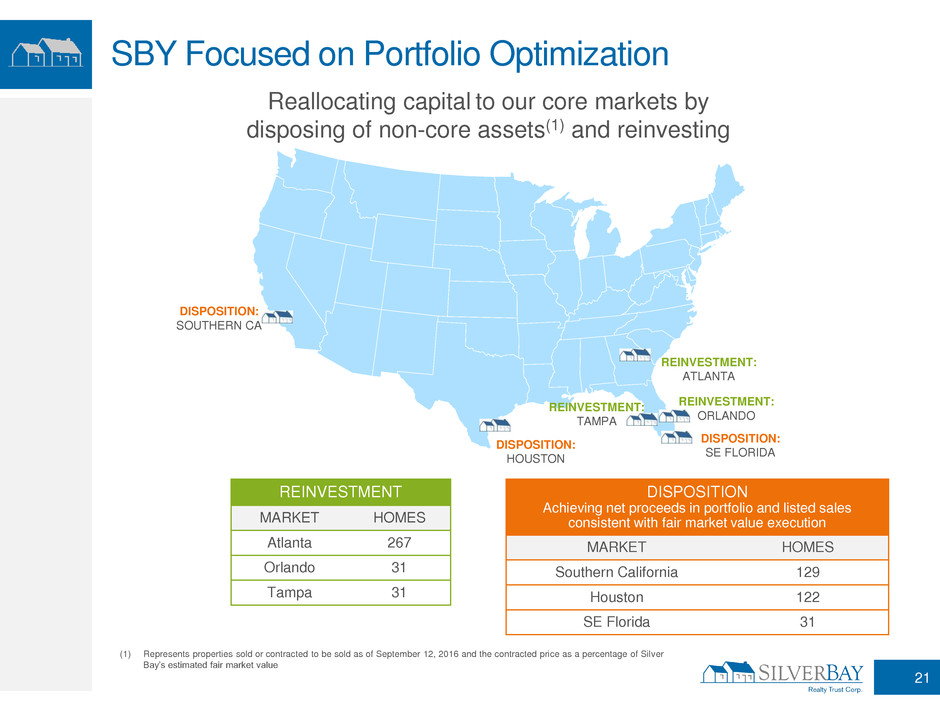
SBY Focused on Portfolio Optimization
(1) Represents properties sold or contracted to be sold as of September 12, 2016 and the contracted price as a percentage of Silver
Bay’s estimated fair market value
(1)
Reallocating capital to our core markets by
disposing of non-core assets(1) and reinvesting
DISPOSITION:
SOUTHERN CA
DISPOSITION:
SE FLORIDA
REINVESTMENT:
ATLANTA
REINVESTMENT:
TAMPA
REINVESTMENT:
ORLANDO
DISPOSITION:
HOUSTON
21
REINVESTMENT
MARKET HOMES
Atlanta 267
Orlando 31
Tampa 31
DISPOSITION
Achieving net proceeds in portfolio and listed sales
consistent with fair market value execution
MARKET HOMES
Southern California 129
Houston 122
SE Florida 31
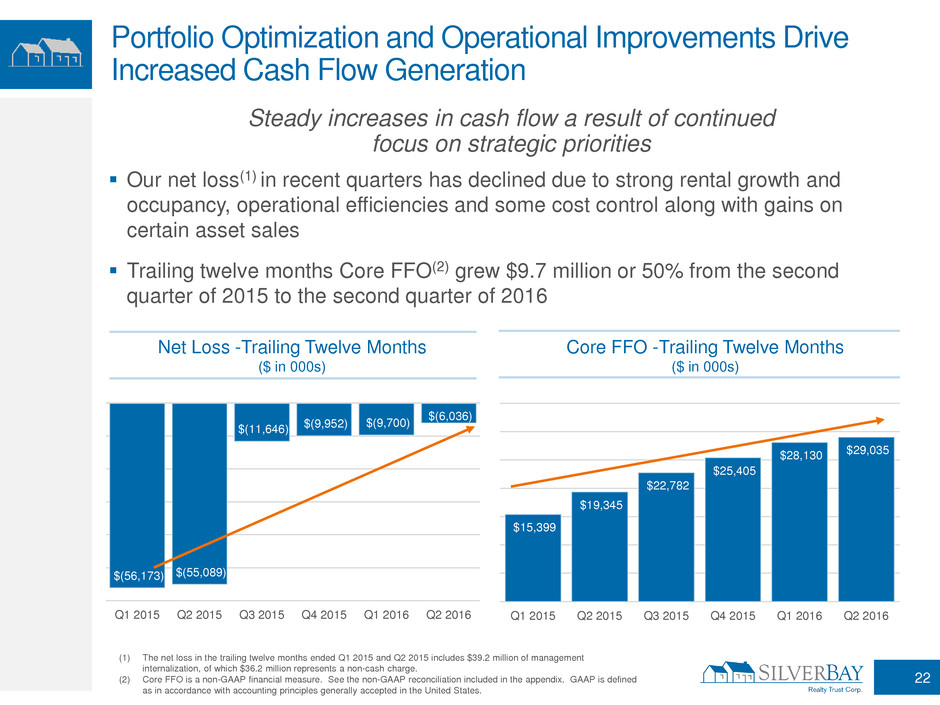
Core FFO -Trailing Twelve Months
($ in 000s)
Net Loss -Trailing Twelve Months
($ in 000s)
$15,399
$19,345
$22,782
$25,405
$28,130 $29,035
Q1 2015 Q2 2015 Q3 2015 Q4 2015 Q1 2016 Q2 2016
Portfolio Optimization and Operational Improvements Drive
Increased Cash Flow Generation
Steady increases in cash flow a result of continued
focus on strategic priorities
(1) The net loss in the trailing twelve months ended Q1 2015 and Q2 2015 includes $39.2 million of management
internalization, of which $36.2 million represents a non-cash charge.
(2) Core FFO is a non-GAAP financial measure. See the non-GAAP reconciliation included in the appendix. GAAP is defined
as in accordance with accounting principles generally accepted in the United States.
Our net loss(1) in recent quarters has declined due to strong rental growth and
occupancy, operational efficiencies and some cost control along with gains on
certain asset sales
Trailing twelve months Core FFO(2) grew $9.7 million or 50% from the second
quarter of 2015 to the second quarter of 2016
$(56,173) $(55,089)
$(11,646) $(9,952)
$(9,700)
$(6,036)
Q1 2015 Q2 2015 Q3 2015 Q4 2015 Q1 2016 Q2 2016
22

$0.22
$0.31
$0.39
$0.46
$0.50 $0.51
Q1 2015 Q2 2015 Q3 2015 Q4 2015 Q1 2016 Q2 2016
Capital Allocation Strategy
Steady increases in cash flow resulted in strong dividend growth and share
repurchases
– Dividend has grown 13-fold since formation
– Opportunistically repurchased 11% of market cap since formation at $15.82 per share(1)
Continue to focus on portfolio optimization including reinvestment in
higher yielding assets
(1) As of June 30, 2016, 4.2 million shares of SBY stock have been repurchased at an average
price of $15.82 per share. 23
Silver Bay has a balanced approach to maximizing
long-term stockholder value
Dividend Per Share
Trailing Twelve Months
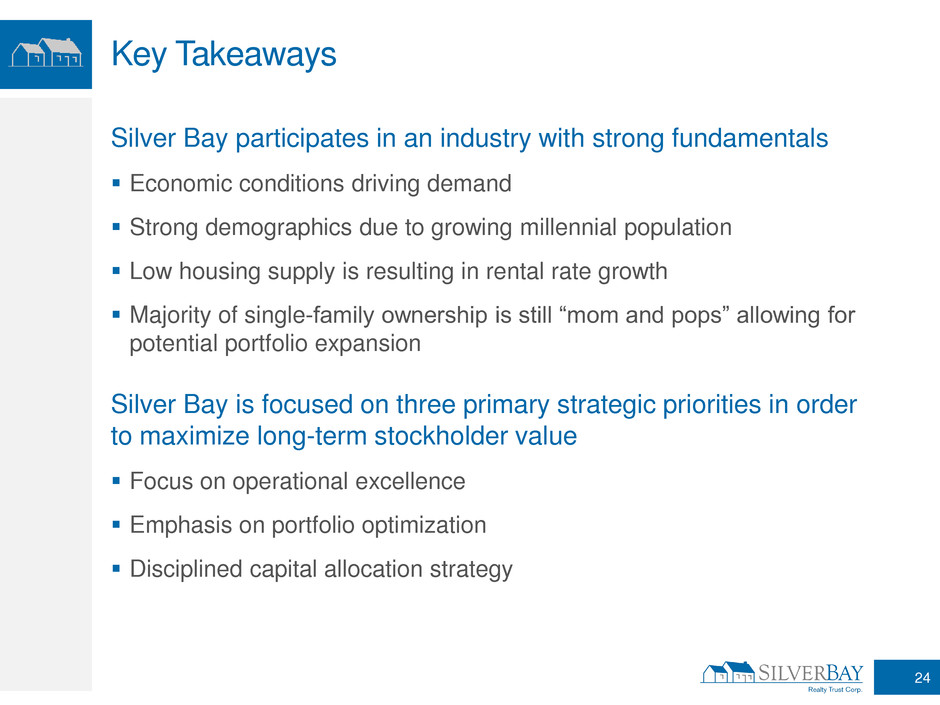
Key Takeaways
Silver Bay participates in an industry with strong fundamentals
Economic conditions driving demand
Strong demographics due to growing millennial population
Low housing supply is resulting in rental rate growth
Majority of single-family ownership is still “mom and pops” allowing for
potential portfolio expansion
Silver Bay is focused on three primary strategic priorities in order
to maximize long-term stockholder value
Focus on operational excellence
Emphasis on portfolio optimization
Disciplined capital allocation strategy
24
Appendix: Q2 Results and
Portfolio Details
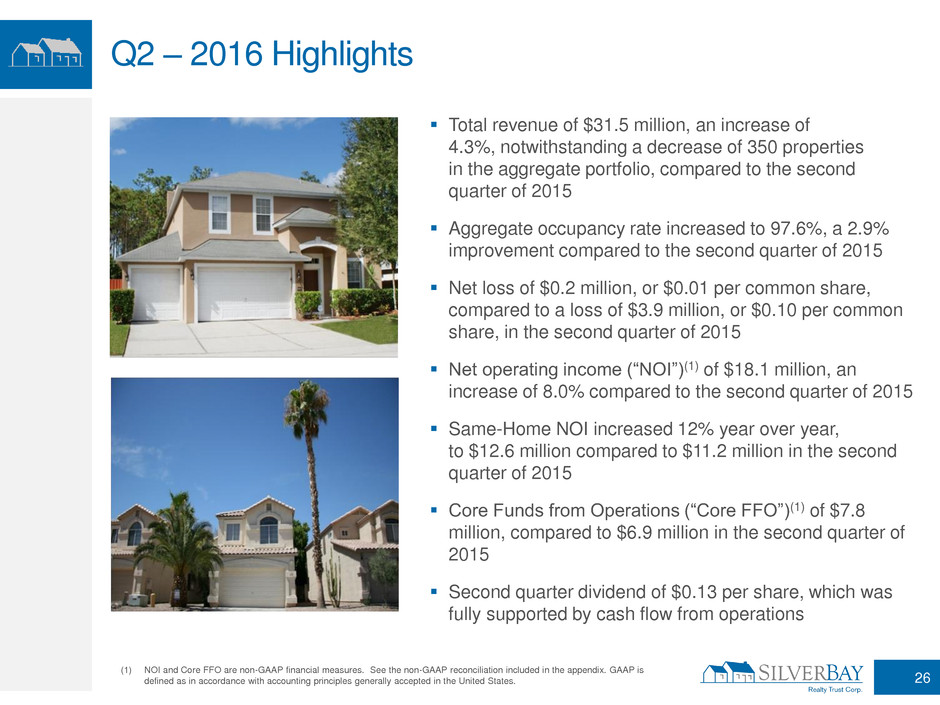
Q2 – 2016 Highlights
Total revenue of $31.5 million, an increase of
4.3%, notwithstanding a decrease of 350 properties
in the aggregate portfolio, compared to the second
quarter of 2015
Aggregate occupancy rate increased to 97.6%, a 2.9%
improvement compared to the second quarter of 2015
Net loss of $0.2 million, or $0.01 per common share,
compared to a loss of $3.9 million, or $0.10 per common
share, in the second quarter of 2015
Net operating income (“NOI”)(1) of $18.1 million, an
increase of 8.0% compared to the second quarter of 2015
Same-Home NOI increased 12% year over year,
to $12.6 million compared to $11.2 million in the second
quarter of 2015
Core Funds from Operations (“Core FFO”)(1) of $7.8
million, compared to $6.9 million in the second quarter of
2015
Second quarter dividend of $0.13 per share, which was
fully supported by cash flow from operations
(1) NOI and Core FFO are non-GAAP financial measures. See the non-GAAP reconciliation included in the appendix. GAAP is
defined as in accordance with accounting principles generally accepted in the United States.
26
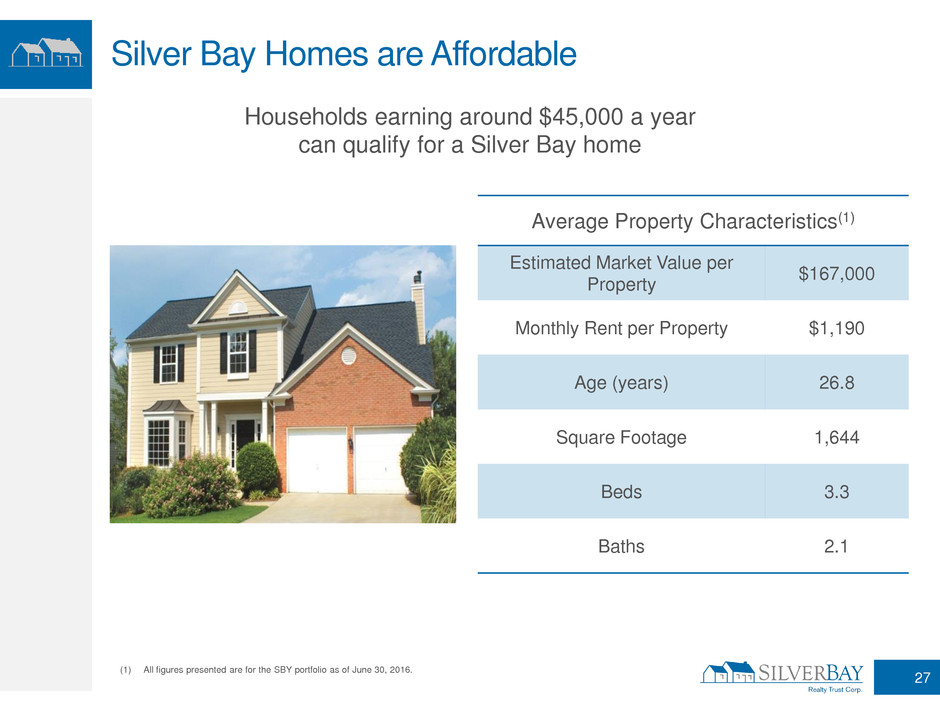
Silver Bay Homes are Affordable
Average Property Characteristics(1)
Estimated Market Value per
Property
$167,000
Monthly Rent per Property $1,190
Age (years) 26.8
Square Footage 1,644
Beds 3.3
Baths 2.1
(1) All figures presented are for the SBY portfolio as of June 30, 2016.
Households earning around $45,000 a year
can qualify for a Silver Bay home
27
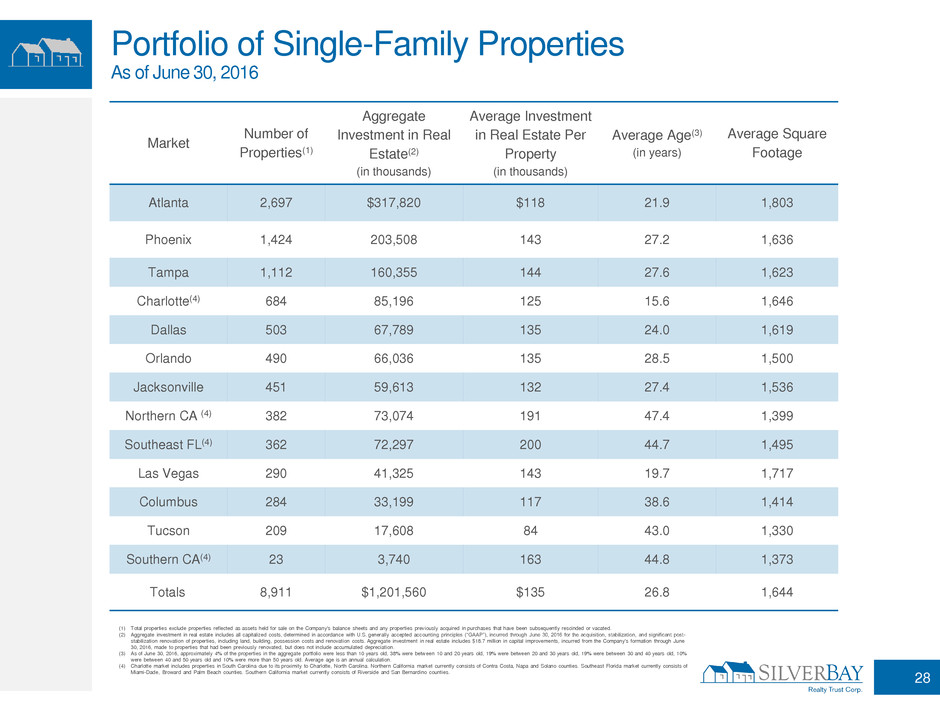
Portfolio of Single-Family Properties
As of June 30, 2016
Market
Number of
Properties(1)
Aggregate
Investment in Real
Estate(2)
(in thousands)
Average Investment
in Real Estate Per
Property
(in thousands)
Average Age(3)
(in years)
Average Square
Footage
Atlanta 2,697 $317,820 $118 21.9 1,803
Phoenix 1,424 203,508 143 27.2 1,636
Tampa 1,112 160,355 144 27.6 1,623
Charlotte(4) 684 85,196 125 15.6 1,646
Dallas 503 67,789 135 24.0 1,619
Orlando 490 66,036 135 28.5 1,500
Jacksonville 451 59,613 132 27.4 1,536
Northern CA (4) 382 73,074 191 47.4 1,399
Southeast FL(4) 362 72,297 200 44.7 1,495
Las Vegas 290 41,325 143 19.7 1,717
Columbus 284 33,199 117 38.6 1,414
Tucson 209 17,608 84 43.0 1,330
Southern CA(4) 23 3,740 163 44.8 1,373
Totals 8,911 $1,201,560 $135 26.8 1,644
(1) Total properties exclude properties reflected as assets held for sale on the Company's balance sheets and any properties previously acquired in purchases that have been subsequently rescinded or vacated.
(2) Aggregate investment in real estate includes all capitalized costs, determined in accordance with U.S. generally accepted accounting principles (“GAAP”), incurred through June 30, 2016 for the acquisition, stabilization, and significant post-
stabilization renovation of properties, including land, building, possession costs and renovation costs. Aggregate investment in real estate includes $18.7 million in capital improvements, incurred from the Company's formation through June
30, 2016, made to properties that had been previously renovated, but does not include accumulated depreciation.
(3) As of June 30, 2016, approximately 4% of the properties in the aggregate portfolio were less than 10 years old, 38% were between 10 and 20 years old, 19% were between 20 and 30 years old, 19% were between 30 and 40 years old, 10%
were between 40 and 50 years old and 10% were more than 50 years old. Average age is an annual calculation.
(4) Charlotte market includes properties in South Carolina due to its proximity to Charlotte, North Carolina. Northern California market currently consists of Contra Costa, Napa and Solano counties. Southeast Florida market currently consists of
Miami-Dade, Broward and Palm Beach counties. Southern California market currently consists of Riverside and San Bernardino counties.
28
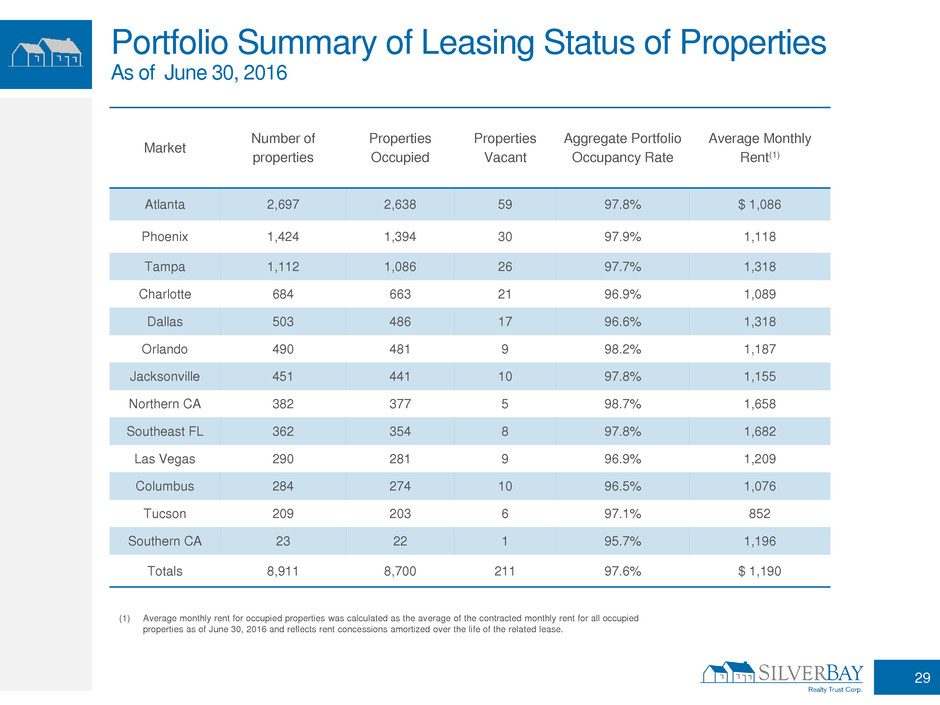
Market
Number of
properties
Properties
Occupied
Properties
Vacant
Aggregate Portfolio
Occupancy Rate
Average Monthly
Rent(1)
Atlanta 2,697 2,638 59 97.8% $ 1,086
Phoenix 1,424 1,394 30 97.9% 1,118
Tampa 1,112 1,086 26 97.7% 1,318
Charlotte 684 663 21 96.9% 1,089
Dallas 503 486 17 96.6% 1,318
Orlando 490 481 9 98.2% 1,187
Jacksonville 451 441 10 97.8% 1,155
Northern CA 382 377 5 98.7% 1,658
Southeast FL 362 354 8 97.8% 1,682
Las Vegas 290 281 9 96.9% 1,209
Columbus 284 274 10 96.5% 1,076
Tucson 209 203 6 97.1% 852
Southern CA 23 22 1 95.7% 1,196
Totals 8,911 8,700 211 97.6% $ 1,190
Portfolio Summary of Leasing Status of Properties
As of June 30, 2016
(1) Average monthly rent for occupied properties was calculated as the average of the contracted monthly rent for all occupied
properties as of June 30, 2016 and reflects rent concessions amortized over the life of the related lease.
29
Non-GAAP Definitions
Net Operating Income and Same-Home Net Operating Income. The Company defines net operating income ("NOI") as
total revenue less property operating and maintenance, real estate taxes, homeowners’ association fees, and property
management expenses. NOI excludes depreciation and amortization, portfolio acquisition expense, general and administrative
expenses, share-based compensation, severance and other, interest expense, net gain on disposition of real estate, income
tax expense, net and other non-comparable items as applicable. The Company considers NOI to be a meaningful financial
measure when considered with the financial statements determined in accordance with GAAP. The Company believes NOI is
helpful to investors in understanding the core performance of its real estate operations without regard to items excluded from
the calculation of such measure, which can vary substantially from company to company depending upon accounting methods,
book value of assets, capital structure and the method by which assets were acquired, among other factors.
The Company believes Same-Home NOI is a useful measure of performance because the population of properties in this
analysis is consistent from period to period, thereby eliminating the effects of changes in the composition of the portfolio.
Core Funds From Operations. Core funds from operations ("Core FFO") is a non-GAAP financial measure that the Company
uses and believes, when considered with the financial statements determined in accordance with GAAP, is helpful to investors
in understanding its performance because it captures features particular to real estate performance by recognizing that real
estate generally appreciates over time or maintains residual value to a much greater extent than do other depreciable assets.
The Company believes this supplemental measure of performance is helpful to investors as it provides a more consistent
measurement of its performance across reporting periods by removing the impact of certain items that are not comparable
from period to period. The Company adjusts net income for depreciation and amortization, gains or losses from sales of, and
impairment losses recognized with respect to, depreciable property, expensed acquisition fees and costs, including those
associated with the portfolio acquisition, share-based compensation, severance and other, income tax expense on the
disposition of real estate, and certain other non-cash or non-comparable costs to arrive at Core FFO.
Core FFO should not be considered an alternative to net income (loss) or net cash flows from operating activities, as
determined in accordance with GAAP, as indications of the Company's performance or a measure of liquidity. This non-GAAP
measure is not necessarily indicative of cash available to fund future cash needs. In addition, although the Company uses this
non-GAAP measure for comparability in assessing the Company’s performance against other REITs, not all REITs compute
this non-GAAP measure in the same manner. Accordingly, there can be no assurance that the Company's basis for computing
this non-GAAP measure is comparable with that of other REITs. This is due in part to the differences in capitalization policies
used by different companies and the significant effect these capitalization policies have on Core FFO. Real estate costs
incurred in connection with real estate operations which are accounted for as capital improvements are added to the carrying
value of the property and depreciated over time, whereas real estate costs that are expenses are accounted for as a current
period expense. This impacts Core FFO because costs that are accounted for as expenses reduce Core FFO. Conversely,
real estate costs associated with assets that are capitalized and then subsequently depreciated are excluded from the
calculation of Core FFO. Core FFO is calculated on a gross basis and, as such, does not reflect adjustments for the
noncontrolling interests - Operating Partnership.
30
Non-GAAP Reconciliation
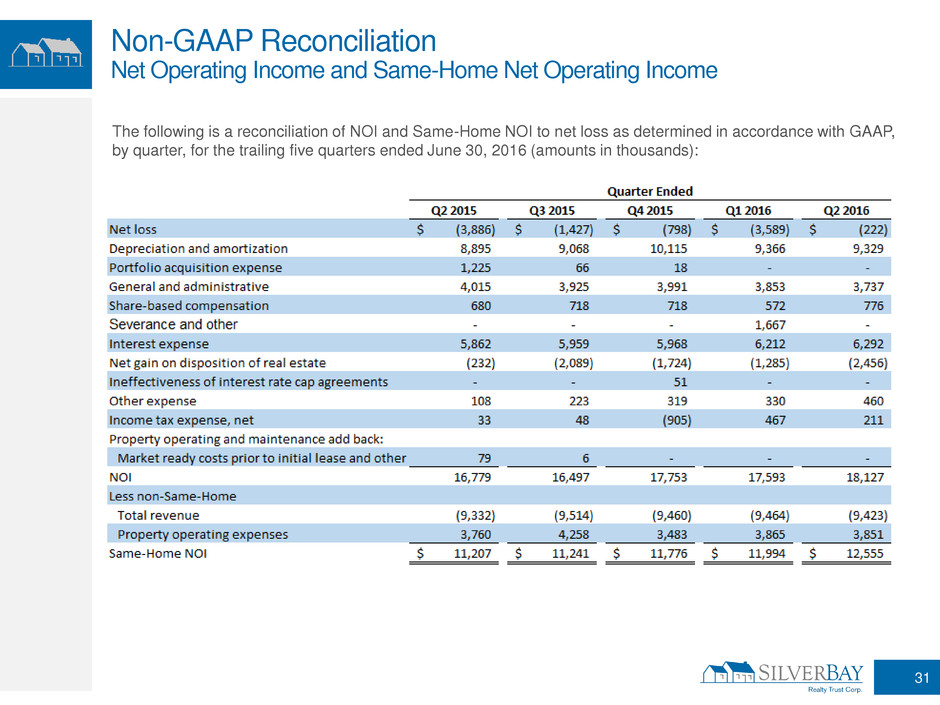
Net Operating Income and Same-Home Net Operating Income
The following is a reconciliation of NOI and Same-Home NOI to net loss as determined in accordance with GAAP,
by quarter, for the trailing five quarters ended June 30, 2016 (amounts in thousands):
31
Non-GAAP Reconciliation
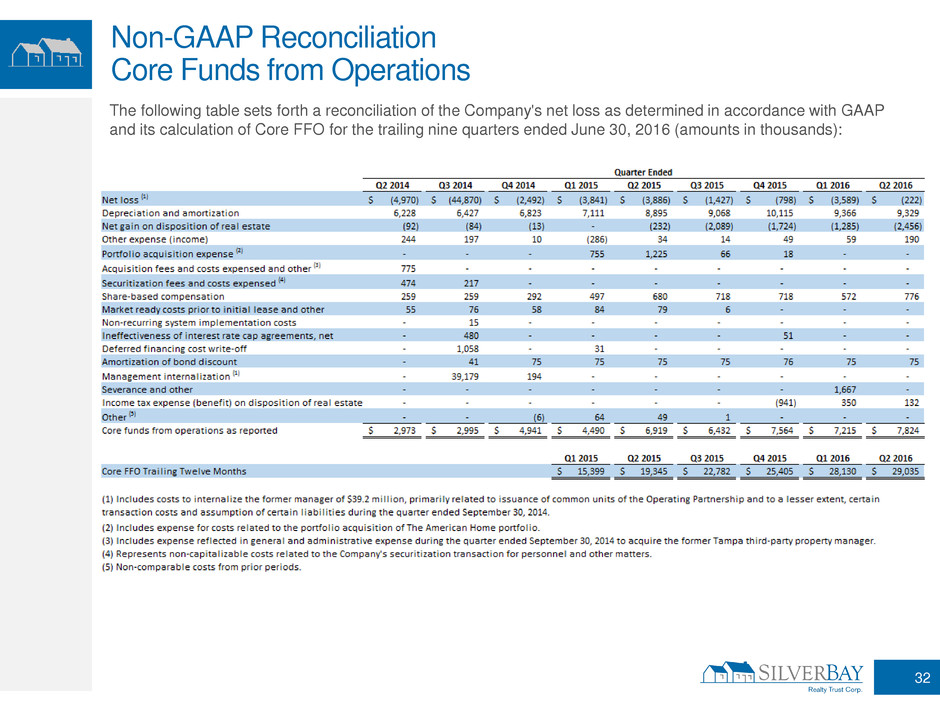
Core Funds from Operations
The following table sets forth a reconciliation of the Company's net loss as determined in accordance with GAAP
and its calculation of Core FFO for the trailing nine quarters ended June 30, 2016 (amounts in thousands):
32
