Attached files
| file | filename |
|---|---|
| 8-K - 8-K - Northern Power Systems Corp. | d258500d8k.htm |
September 22, 2016 Q2 2016 Earnings Presentation Northern Power Systems Ciel Caldwell President and COO Eric Larson VP and CAO Exhibit 99.1
Forward Looking Statement and non-gaap disclosures All statements and other information contained in this document related to anticipated future events or results constitute forward-looking statements. Forward-looking statements often, but not always, are identified by the use of words such as “seek”, “anticipate”, “believe”, “plan”, “estimate”, “expect”, “intend”, “forecast”, “project”, “likely”, “potential”, “targeted” and “possible” and statements that an event or result “may”, “will”, “would”, “should”, “could” or “might” occur or be achieved and other similar expressions. Forward-looking statements are subject to known and unknown business and economic risks and uncertainties and other factors that could cause actual results of operations to differ materially from those expressed or implied by the forward-looking statements. Forward-looking statements are based on estimates and opinions of management at the date the statements are made. Northern Power Systems does not undertake any obligation to update forward-looking statements even if circumstances or management’s estimates or opinions should change, except as required by law. For the reasons set forth above, investors should not place undue reliance on forward-looking statements. This presentation references non-GAAP financial measures with the required reconciliation referenced in the table captioned “Non-GAAP Reconciliations” to the most comparable GAAP financial measures.
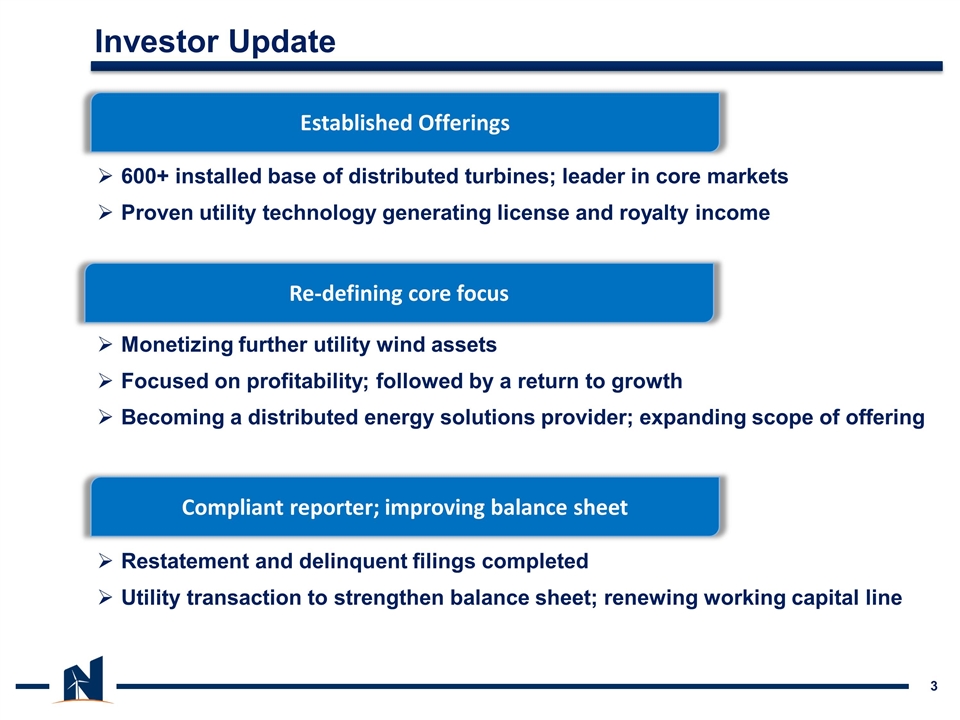
Investor Update 600+ installed base of distributed turbines; leader in core markets Proven utility technology generating license and royalty income Established Offerings Re-defining core focus Compliant reporter; improving balance sheet Restatement and delinquent filings completed Utility transaction to strengthen balance sheet; renewing working capital line Monetizing further utility wind assets Focused on profitability; followed by a return to growth Becoming a distributed energy solutions provider; expanding scope of offering
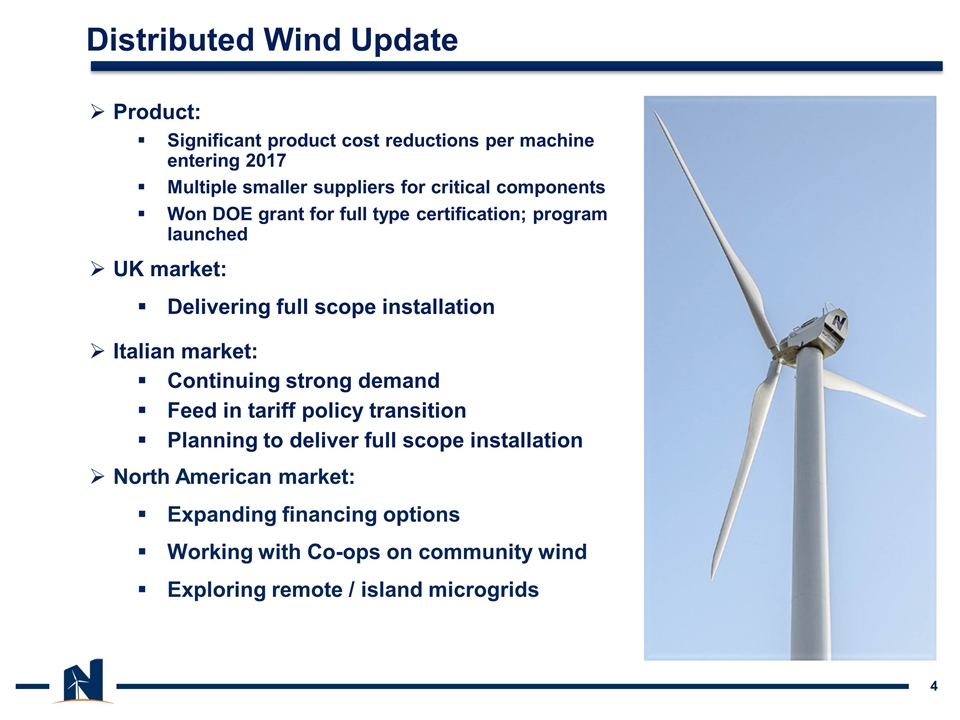
Distributed Wind Update Product: Significant product cost reductions per machine entering 2017 Multiple smaller suppliers for critical components Won DOE grant for full type certification; program launched UK market: Delivering full scope installation Italian market: Continuing strong demand Feed in tariff policy transition Planning to deliver full scope installation North American market: Expanding financing options Working with Co-ops on community wind Exploring remote / island microgrids
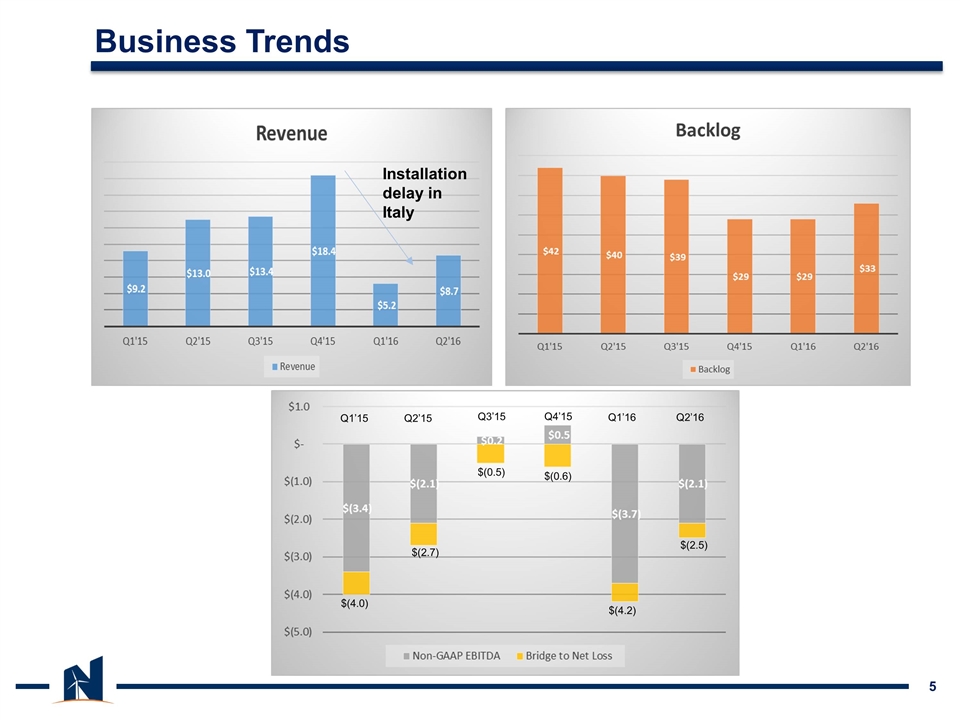
Business Trends Installation delay in Italy Q1’15 Q2’15 Q3’15 Q4’15 Q1’16 Q2’16 $(4.0) $(2.7) $(0.5) $(0.6) $(4.2) $(2.5)
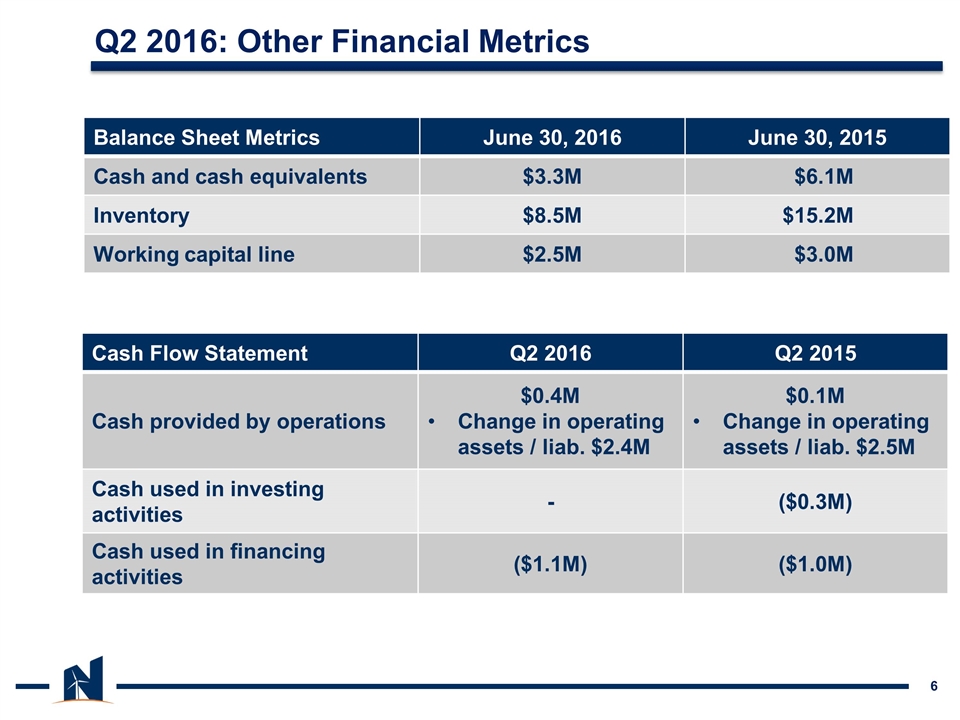
Q2 2016: Other Financial Metrics Cash Flow Statement Q2 2016 Q2 2015 Cash provided by operations $0.4M Change in operating assets / liab. $2.4M $0.1M Change in operating assets / liab. $2.5M Cash used in investing activities - ($0.3M) Cash used in financing activities ($1.1M) ($1.0M) Balance Sheet Metrics June 30, 2016 June 30, 2015 Cash and cash equivalents $3.3M $6.1M Inventory $8.5M $15.2M Working capital line $2.5M $3.0M
Non-GAAP Reconciliations
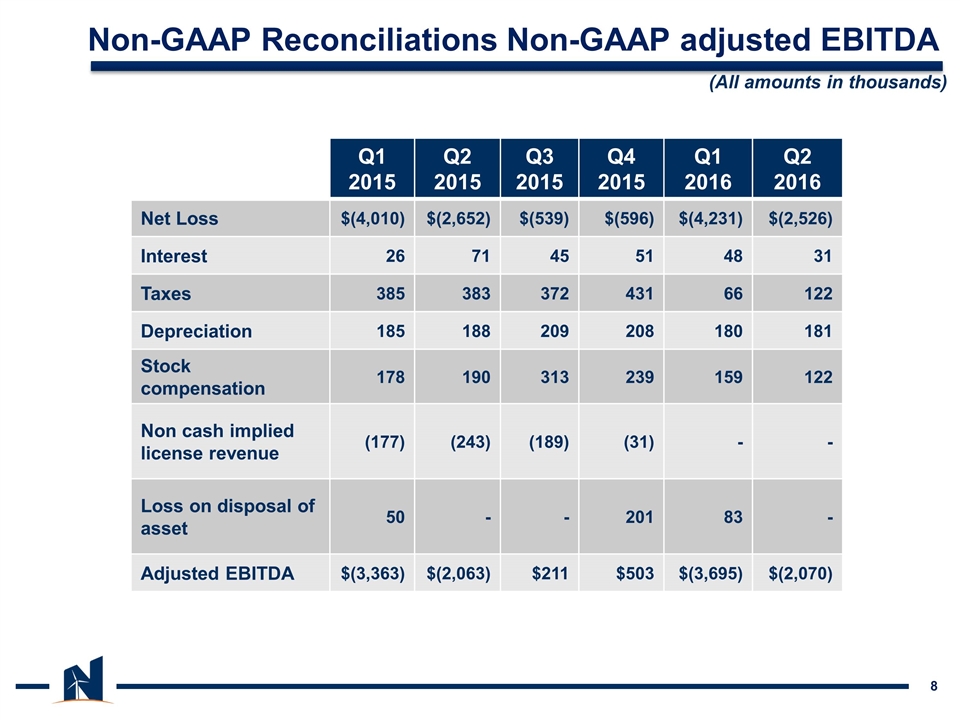
Non-GAAP Reconciliations Non-GAAP adjusted EBITDA 8 Q1 2015 Q2 2015 Q3 2015 Q4 2015 Q1 2016 Q2 2016 Net Loss $(4,010) $(2,652) $(539) $(596) $(4,231) $(2,526) Interest 26 71 45 51 48 31 Taxes 385 383 372 431 66 122 Depreciation 185 188 209 208 180 181 Stock compensation 178 190 313 239 159 122 Non cash implied license revenue (177) (243) (189) (31) - - Loss on disposal of asset 50 - - 201 83 - Adjusted EBITDA $(3,363) $(2,063) $211 $503 $(3,695) $(2,070) (All amounts in thousands)
