Attached files
| file | filename |
|---|---|
| 8-K - 8-K - Armour Residential REIT, Inc. | arrform8-kformonthlycompan.htm |
ARMOUR RESIDENTIAL REIT, Inc.
Company Update
September 22, 2016
PLEASE READ: Important Regulatory and Yield Estimate Risk Disclosures
2
Certain statements made in this presentation regarding ARMOUR Residential REIT, Inc. (“ARMOUR” or the “Company”), and
any other statements regarding ARMOUR’s future expectations, beliefs, goals or prospects constitute forward-looking
statements made within the meaning of Section 21E of the Securities Exchange Act of 1934. Any statements that are not
statements of historical fact (including statements containing the words “believes,” “plans,” “anticipates,” “expects,”
“estimates” and similar expressions) should also be considered forward-looking statements. Forward-looking statements
include but are not limited to statements regarding the projections for ARMOUR’s business and plans for future growth and
operational improvements. A number of important factors could cause actual results or events to differ materially from
those indicated by such forward-looking statements. ARMOUR assumes no obligation to update the information in this
communication, except as otherwise required by law. Readers are cautioned not to place undue reliance on these forward-
looking statements, which speak only as of the date hereof.
This material is for information purposes only and does not constitute an offer to sell, a solicitation of an offer to buy, or a
recommendation for any securities or financial instruments. The statements, information and estimates contained herein
are based on information that the presenter believes to be reliable as of today's date, but cannot be represented that such
statements, information or estimates are complete or accurate.
Actual realized yields, durations and net durations described herein will depend on a number of factors that cannot be
predicted with certainty. Estimated yields do not reflect any of the costs of operation of ARMOUR.
THE INFORMATION PRESENTED HEREIN IS UNAUDITED AND UNREVIEWED.
ARMOUR Monthly Metrics
3
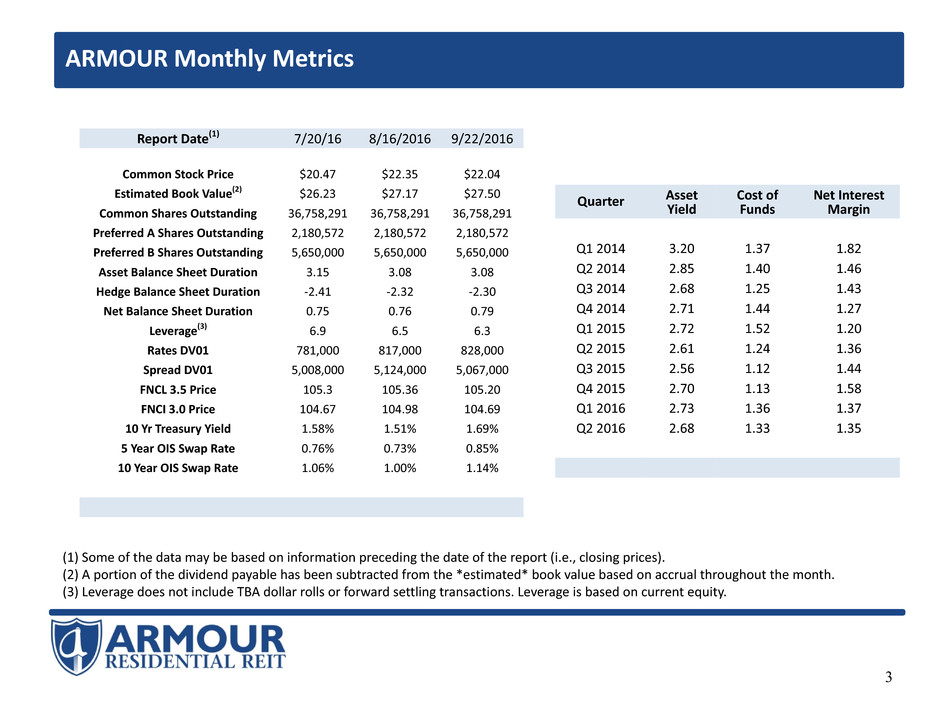
Report Date(1) 7/20/16 8/16/2016 9/22/2016
Common Stock Price $20.47 $22.35 $22.04
Estimated Book Value(2) $26.23 $27.17 $27.50
Common Shares Outstanding 36,758,291 36,758,291 36,758,291
Preferred A Shares Outstanding 2,180,572 2,180,572 2,180,572
Preferred B Shares Outstanding 5,650,000 5,650,000 5,650,000
Asset Balance Sheet Duration 3.15 3.08 3.08
Hedge Balance Sheet Duration -2.41 -2.32 -2.30
Net Balance Sheet Duration 0.75 0.76 0.79
Leverage(3) 6.9 6.5 6.3
Rates DV01 781,000 817,000 828,000
Spread DV01 5,008,000 5,124,000 5,067,000
FNCL 3.5 Price 105.3 105.36 105.20
FNCI 3.0 Price 104.67 104.98 104.69
10 Yr Treasury Yield 1.58% 1.51% 1.69%
5 Year OIS Swap Rate 0.76% 0.73% 0.85%
10 Year OIS Swap Rate 1.06% 1.00% 1.14%
Quarter AssetYield
Cost of
Funds
Net Interest
Margin
Q1 2014 3.20 1.37 1.82
Q2 2014 2.85 1.40 1.46
Q3 2014 2.68 1.25 1.43
Q4 2014 2.71 1.44 1.27
Q1 2015 2.72 1.52 1.20
Q2 2015 2.61 1.24 1.36
Q3 2015 2.56 1.12 1.44
Q4 2015 2.70 1.13 1.58
Q1 2016 2.73 1.36 1.37
Q2 2016 2.68 1.33 1.35
(1) Some of the data may be based on information preceding the date of the report (i.e., closing prices).
(2) A portion of the dividend payable has been subtracted from the *estimated* book value based on accrual throughout the month.
(3) Leverage does not include TBA dollar rolls or forward settling transactions. Leverage is based on current equity.
ARMOUR Capitalization, Dividend Policy, Transparency and Manager
Transparency
and
Governance
4
ARMOUR REIT
Manager
Common Stock
Dividend Policy
Capitalization
Information as of September 20, 2016.
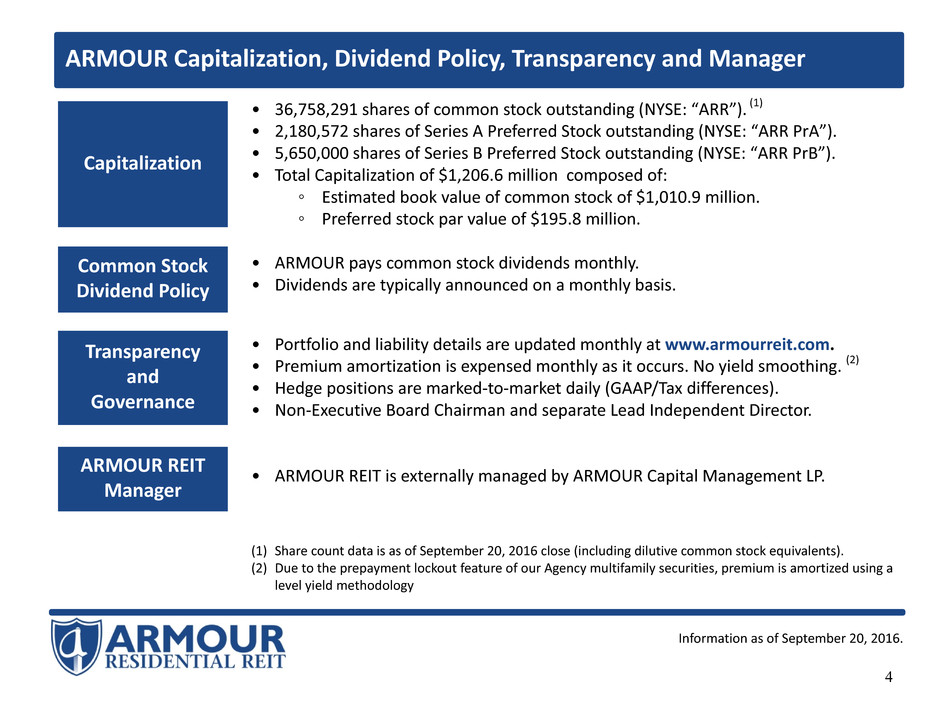
• 36,758,291 shares of common stock outstanding (NYSE: “ARR”). (1)
• 2,180,572 shares of Series A Preferred Stock outstanding (NYSE: “ARR PrA”).
• 5,650,000 shares of Series B Preferred Stock outstanding (NYSE: “ARR PrB”).
• Total Capitalization of $1,206.6 million composed of:
◦ Estimated book value of common stock of $1,010.9 million.
◦ Preferred stock par value of $195.8 million.
• ARMOUR pays common stock dividends monthly.
• Dividends are typically announced on a monthly basis.
• Portfolio and liability details are updated monthly at www.armourreit.com.
• Premium amortization is expensed monthly as it occurs. No yield smoothing. (2)
• Hedge positions are marked-to-market daily (GAAP/Tax differences).
• Non-Executive Board Chairman and separate Lead Independent Director.
• ARMOUR REIT is externally managed by ARMOUR Capital Management LP.
(1) Share count data is as of September 20, 2016 close (including dilutive common stock equivalents).
(2) Due to the prepayment lockout feature of our Agency multifamily securities, premium is amortized using a
level yield methodology
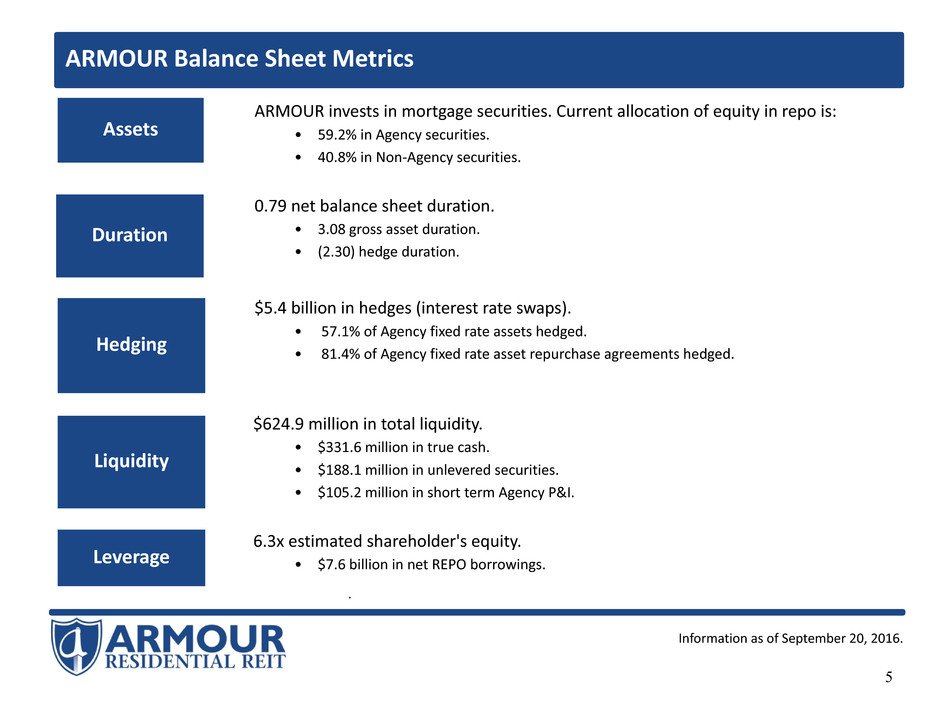
ARMOUR Balance Sheet Metrics
ARMOUR invests in mortgage securities. Current allocation of equity in repo is:
• 59.2% in Agency securities.
• 40.8% in Non-Agency securities.
0.79 net balance sheet duration.
• 3.08 gross asset duration.
• (2.30) hedge duration.
$5.4 billion in hedges (interest rate swaps).
• 57.1% of Agency fixed rate assets hedged.
• 81.4% of Agency fixed rate asset repurchase agreements hedged.
$624.9 million in total liquidity.
• $331.6 million in true cash.
• $188.1 million in unlevered securities.
• $105.2 million in short term Agency P&I.
6.3x estimated shareholder's equity.
• $7.6 billion in net REPO borrowings.
•
5
Assets
Duration
Hedging
Liquidity
Leverage
Information as of September 20, 2016.
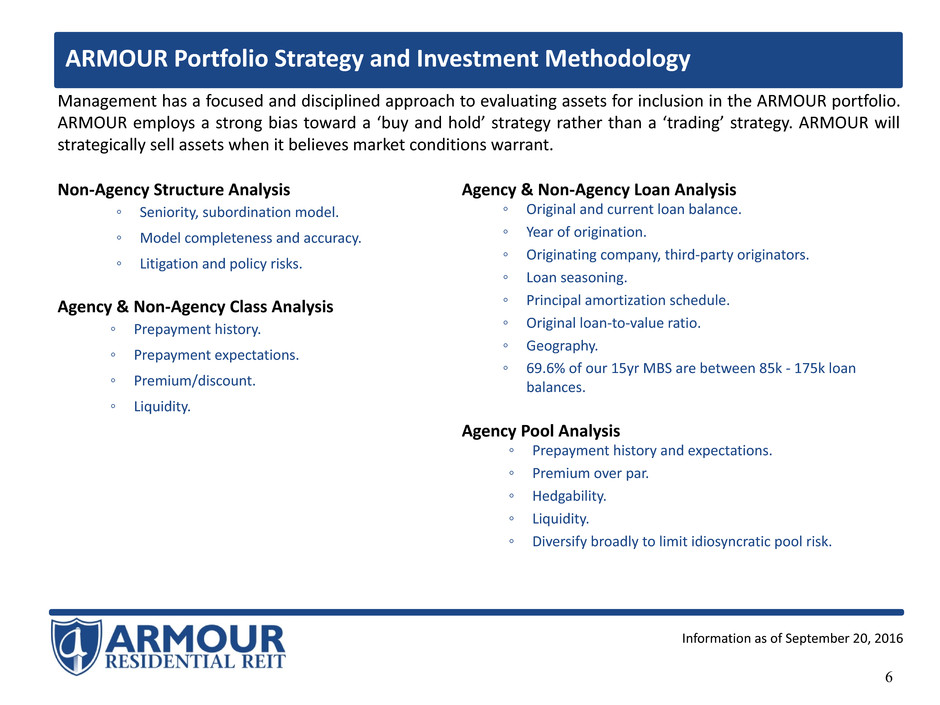
ARMOUR Portfolio Strategy and Investment Methodology
6
Non-Agency Structure Analysis
◦ Seniority, subordination model.
◦ Model completeness and accuracy.
◦ Litigation and policy risks.
Agency & Non-Agency Class Analysis
◦ Prepayment history.
◦ Prepayment expectations.
◦ Premium/discount.
◦ Liquidity.
Agency & Non-Agency Loan Analysis
◦ Original and current loan balance.
◦ Year of origination.
◦ Originating company, third-party originators.
◦ Loan seasoning.
◦ Principal amortization schedule.
◦ Original loan-to-value ratio.
◦ Geography.
◦ 69.6% of our 15yr MBS are between 85k - 175k loan
balances.
Agency Pool Analysis
◦ Prepayment history and expectations.
◦ Premium over par.
◦ Hedgability.
◦ Liquidity.
◦ Diversify broadly to limit idiosyncratic pool risk.
Management has a focused and disciplined approach to evaluating assets for inclusion in the ARMOUR portfolio.
ARMOUR employs a strong bias toward a ‘buy and hold’ strategy rather than a ‘trading’ strategy. ARMOUR will
strategically sell assets when it believes market conditions warrant.
Information as of September 20, 2016
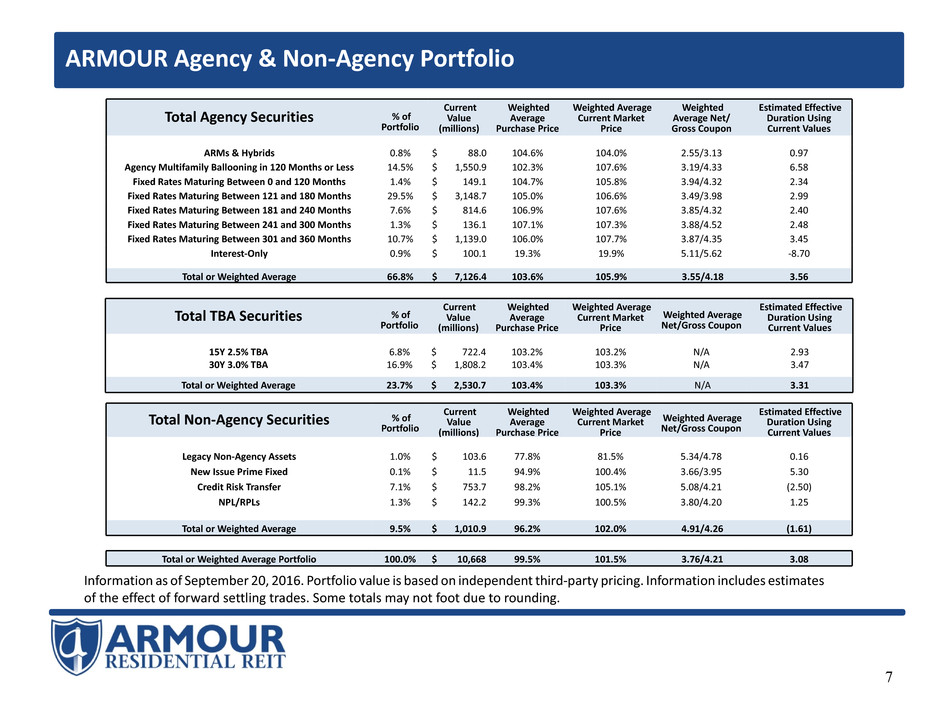
ARMOUR Agency & Non-Agency Portfolio
7
Information as of September 20, 2016. Portfolio value is based on independent third-party pricing. Information includes estimates
of the effect of forward settling trades. Some totals may not foot due to rounding.
Total Agency Securities % of
Portfolio
Current
Value
(millions)
Weighted
Average
Purchase Price
Weighted Average
Current Market
Price
Weighted
Average Net/
Gross Coupon
Estimated Effective
Duration Using
Current Values
ARMs & Hybrids 0.8% $ 88.0 104.6% 104.0% 2.55/3.13 0.97
Agency Multifamily Ballooning in 120 Months or Less 14.5% $ 1,550.9 102.3% 107.6% 3.19/4.33 6.58
Fixed Rates Maturing Between 0 and 120 Months 1.4% $ 149.1 104.7% 105.8% 3.94/4.32 2.34
Fixed Rates Maturing Between 121 and 180 Months 29.5% $ 3,148.7 105.0% 106.6% 3.49/3.98 2.99
Fixed Rates Maturing Between 181 and 240 Months 7.6% $ 814.6 106.9% 107.6% 3.85/4.32 2.40
Fixed Rates Maturing Between 241 and 300 Months 1.3% $ 136.1 107.1% 107.3% 3.88/4.52 2.48
Fixed Rates Maturing Between 301 and 360 Months 10.7% $ 1,139.0 106.0% 107.7% 3.87/4.35 3.45
Interest-Only 0.9% $ 100.1 19.3% 19.9% 5.11/5.62 -8.70
Total or Weighted Average 66.8% $ 7,126.4 103.6% 105.9% 3.55/4.18 3.56
Total Non-Agency Securities % of
Portfolio
Current
Value
(millions)
Weighted
Average
Purchase Price
Weighted Average
Current Market
Price
Weighted Average
Net/Gross Coupon
Estimated Effective
Duration Using
Current Values
Legacy Non-Agency Assets 1.0% $ 103.6 77.8% 81.5% 5.34/4.78 0.16
New Issue Prime Fixed 0.1% $ 11.5 94.9% 100.4% 3.66/3.95 5.30
Credit Risk Transfer 7.1% $ 753.7 98.2% 105.1% 5.08/4.21 (2.50)
NPL/RPLs 1.3% $ 142.2 99.3% 100.5% 3.80/4.20 1.25
Total or Weighted Average 9.5% $ 1,010.9 96.2% 102.0% 4.91/4.26 (1.61)
Total or Weighted Average Portfolio 100.0% $ 10,668 99.5% 101.5% 3.76/4.21 3.08
Total TBA Securities % of
Portfolio
Current
Value
(millions)
Weighted
Average
Purchase Price
Weighted Average
Current Market
Price
Weighted Average
Net/Gross Coupon
Estimated Effective
Duration Using
Current Values
15Y 2.5% TBA 6.8% $ 722.4 103.2% 103.2% N/A 2.93
30Y 3.0% TBA 16.9% $ 1,808.2 103.4% 103.3% N/A 3.47
Total or Weighted Average 23.7% $ 2,530.7 103.4% 103.3% N/A 3.31
8
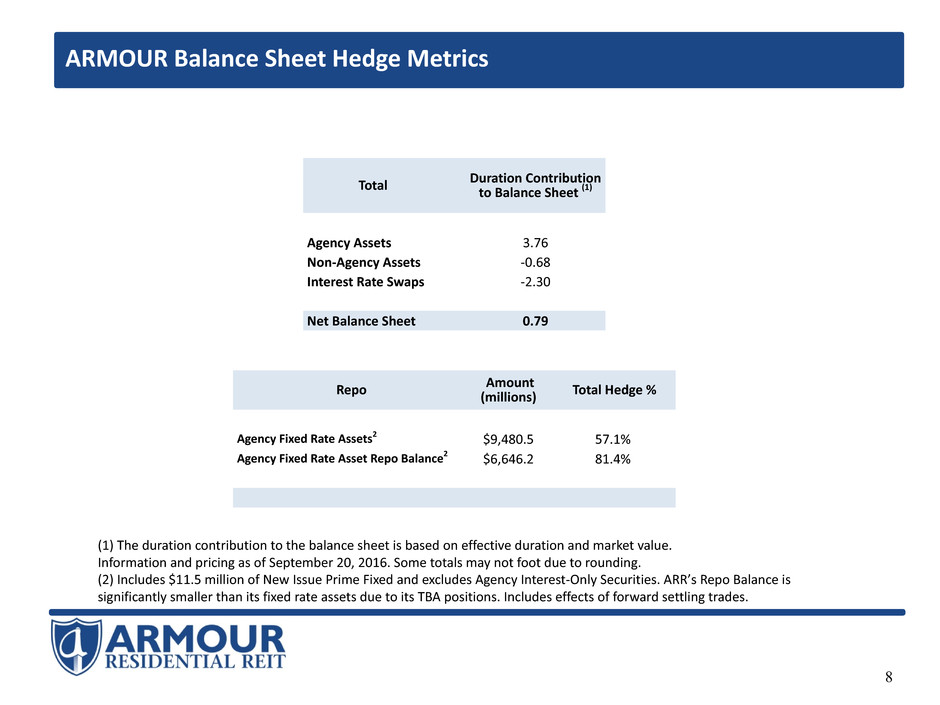
ARMOUR Balance Sheet Hedge Metrics
Repo Amount (millions) Total Hedge %
Agency Fixed Rate Assets2 $9,480.5 57.1%
Agency Fixed Rate Asset Repo Balance2 $6,646.2 81.4%
Total Duration Contributionto Balance Sheet (1)
Agency Assets 3.76
Non-Agency Assets -0.68
Interest Rate Swaps -2.30
Net Balance Sheet 0.79
(1) The duration contribution to the balance sheet is based on effective duration and market value.
Information and pricing as of September 20, 2016. Some totals may not foot due to rounding.
(2) Includes $11.5 million of New Issue Prime Fixed and excludes Agency Interest-Only Securities. ARR’s Repo Balance is
significantly smaller than its fixed rate assets due to its TBA positions. Includes effects of forward settling trades.
ARMOUR Hedge Portfolio
9
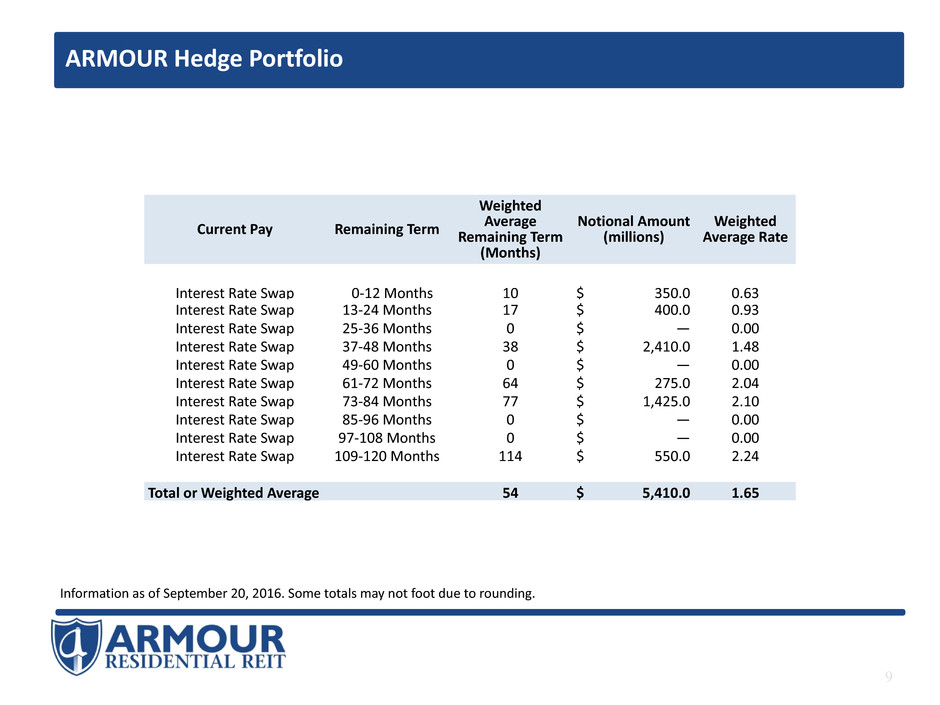
Information as of September 20, 2016. Some totals may not foot due to rounding.
Current Pay Remaining Term
Weighted
Average
Remaining Term
(Months)
Notional Amount
(millions)
Weighted
Average Rate
Interest Rate Swap 0-12 Months 10 $ 350.0 0.63
Interest Rate Swap 13-24 Months 17 $ 400.0 0.93
Interest Rate Swap 25-36 Months 0 $ — 0.00
Interest Rate Swap 37-48 Months 38 $ 2,410.0 1.48
Interest Rate Swap 49-60 Months 0 $ — 0.00
Interest Rate Swap 61-72 Months 64 $ 275.0 2.04
Interest Rate Swap 73-84 Months 77 $ 1,425.0 2.10
Interest Rate Swap 85-96 Months 0 $ — 0.00
Interest Rate Swap 97-108 Months 0 $ — 0.00
Interest Rate Swap 109-120 Months 114 $ 550.0 2.24
Total or Weighted Average 54 $ 5,410.0 1.65
10
Monthly Portfolio Constant Prepayment Rate
14
13
12
11
10
9
8
7
6
Jan
ua
ry
20
16
Fe
br
ua
ry
20
16
M
arc
h 2
01
6
Ap
ril
20
16
M
ay
20
16
Ju
ne
20
16
Ju
ly
20
16
Au
gu
st
20
16
Se
pt
em
be
r 2
01
6
8.2
6.5
7.2
10.0
9.6 9.9 10.6 9.6
12.6
September 2016 Agency Asset CPR
35
30
25
20
15
10
5
0
AR
Ms
&
Hy
bri
ds
10
Ye
ar
Pa
ss-
Th
rou
gh
s
15
Ye
ar
Pa
ss-
Th
rou
gh
s
20
Ye
ar
Pa
ss-
Th
rou
gh
s
25
Ye
ar
Pa
ss-
Th
rou
gh
s
30
Ye
ar
Pa
ss-
Th
rou
gh
s
Ag
en
cy
Mu
ltif
am
ily
Ag
en
cy
IO
Po
rtf
oli
o A
ve
rag
e
10.2
12.1
14.0
17.0
28.8
19.5
—
21.1
12.6
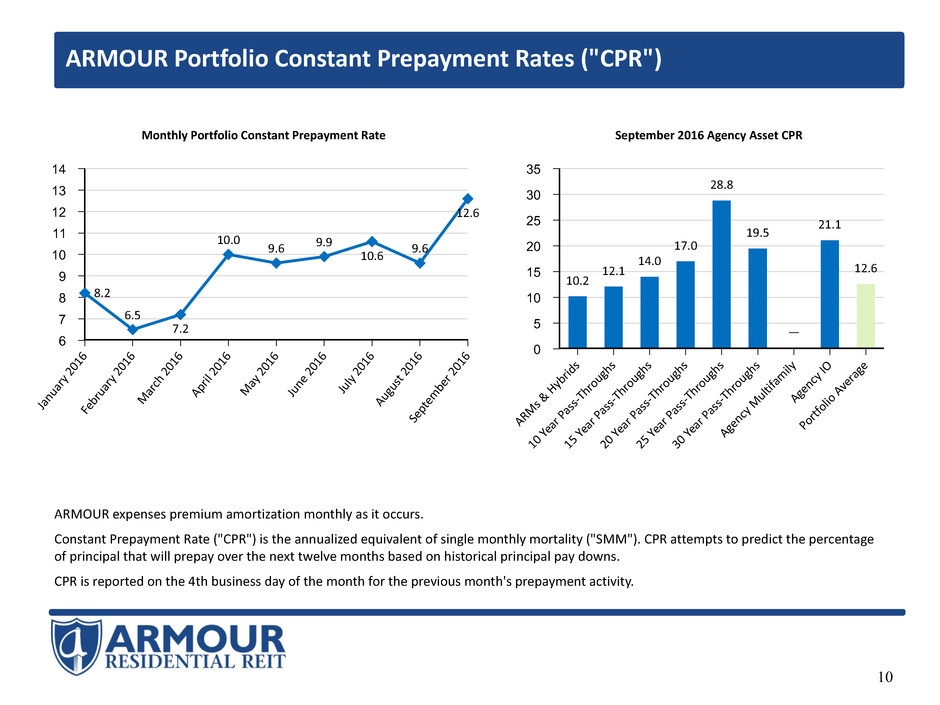
ARMOUR expenses premium amortization monthly as it occurs.
Constant Prepayment Rate ("CPR") is the annualized equivalent of single monthly mortality ("SMM"). CPR attempts to predict the percentage
of principal that will prepay over the next twelve months based on historical principal pay downs.
CPR is reported on the 4th business day of the month for the previous month's prepayment activity.
ARMOUR Portfolio Constant Prepayment Rates ("CPR")
ARMOUR REPO Composition
11
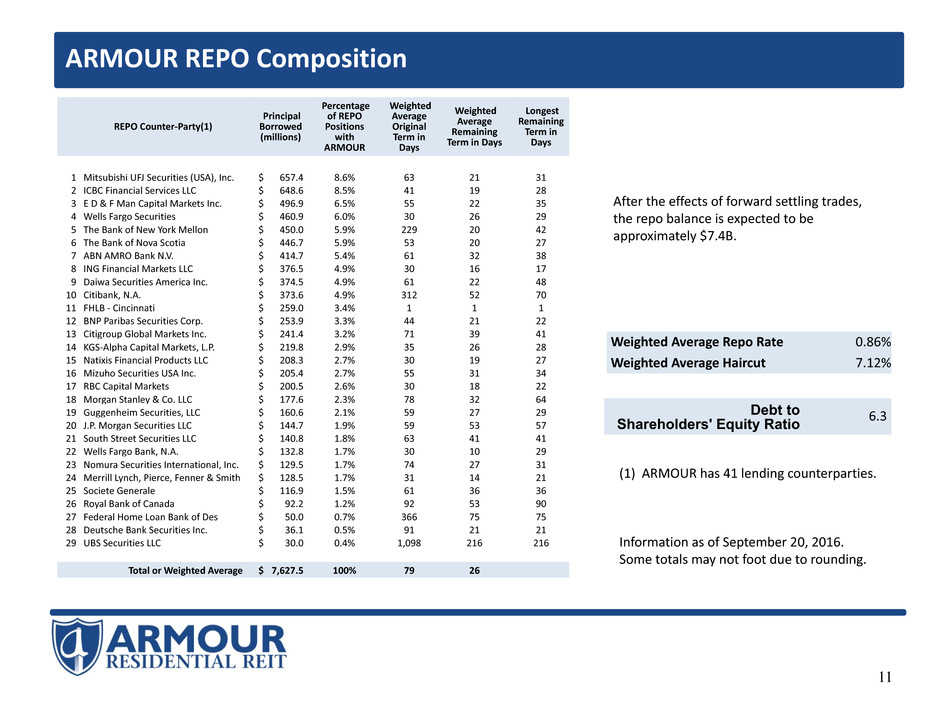
(1) ARMOUR has 41 lending counterparties.
Information as of September 20, 2016.
Some totals may not foot due to rounding.
REPO Counter-Party(1)
Principal
Borrowed
(millions)
Percentage
of REPO
Positions
with
ARMOUR
Weighted
Average
Original
Term in
Days
Weighted
Average
Remaining
Term in Days
Longest
Remaining
Term in
Days
1 Mitsubishi UFJ Securities (USA), Inc. $ 657.4 8.6% 63 21 31
2 ICBC Financial Services LLC $ 648.6 8.5% 41 19 28
3 E D & F Man Capital Markets Inc. $ 496.9 6.5% 55 22 35
4 Wells Fargo Securities $ 460.9 6.0% 30 26 29
5 The Bank of New York Mellon $ 450.0 5.9% 229 20 42
6 The Bank of Nova Scotia $ 446.7 5.9% 53 20 27
7 ABN AMRO Bank N.V. $ 414.7 5.4% 61 32 38
8 ING Financial Markets LLC $ 376.5 4.9% 30 16 17
9 Daiwa Securities America Inc. $ 374.5 4.9% 61 22 48
10 Citibank, N.A. $ 373.6 4.9% 312 52 70
11 FHLB - Cincinnati $ 259.0 3.4% 1 1 1
12 BNP Paribas Securities Corp. $ 253.9 3.3% 44 21 22
13 Citigroup Global Markets Inc. $ 241.4 3.2% 71 39 41
14 KGS-Alpha Capital Markets, L.P. $ 219.8 2.9% 35 26 28
15 Natixis Financial Products LLC $ 208.3 2.7% 30 19 27
16 Mizuho Securities USA Inc. $ 205.4 2.7% 55 31 34
17 RBC Capital Markets $ 200.5 2.6% 30 18 22
18 Morgan Stanley & Co. LLC $ 177.6 2.3% 78 32 64
19 Guggenheim Securities, LLC $ 160.6 2.1% 59 27 29
20 J.P. Morgan Securities LLC $ 144.7 1.9% 59 53 57
21 South Street Securities LLC $ 140.8 1.8% 63 41 41
22 Wells Fargo Bank, N.A. $ 132.8 1.7% 30 10 29
23 Nomura Securities International, Inc. $ 129.5 1.7% 74 27 31
24 Merrill Lynch, Pierce, Fenner & Smith $ 128.5 1.7% 31 14 21
25 Societe Generale $ 116.9 1.5% 61 36 36
26 Royal Bank of Canada $ 92.2 1.2% 92 53 90
27 Federal Home Loan Bank of Des $ 50.0 0.7% 366 75 75
28 Deutsche Bank Securities Inc. $ 36.1 0.5% 91 21 21
29 UBS Securities LLC $ 30.0 0.4% 1,098 216 216
Total or Weighted Average $ 7,627.5 100% 79 26
Weighted Average Repo Rate 0.86%
Weighted Average Haircut 7.12%
Debt to
Shareholders' Equity Ratio 6.3
After the effects of forward settling trades,
the repo balance is expected to be
approximately $7.4B.
www.armourreit.com
ARMOUR Residential REIT, Inc.
3001 Ocean Drive
Suite 201
Vero Beach, FL 32963
772-617-4340
