Attached files
| file | filename |
|---|---|
| 8-K - CALGON CARBON CORP. 8-K - CALGON CARBON Corp | a51424406.htm |
Exhibit 99.1

Calgon Carbon CorporationInvestor PresentationSeptember 22, 2016

Safe Harbor Statement Today’s presentation contains historical information and forward-looking statements. Forward-looking statements typically contain words such as “expect,” “believe,” “estimate,” “anticipate,” or similar words indicating that future outcomes are uncertain. Statements looking forward in time, including statements regarding the planned acquisition of the assets and business of the wood-based activated carbon, reactivation and mineral-based filter aid business of CECA, a subsidiary of Arkema Group (the Activated Carbon and Filter Aid Business), future growth and profitability, price increases, cost savings, broader product lines and enhanced competitive posture, are included herein pursuant to the “safe harbor” provision of the Private Securities Litigation Reform Act of 1995. They involve known and unknown risks and uncertainties that may cause the Company’s actual results in future periods to be materially different from any future performance suggested herein, including, without limitation, the Company’s ability to successfully complete the acquisition of the Activated Carbon and Filter Aid Business, including satisfying the various closing conditions and the Company’s ability to successfully integrate the Activated Carbon and Filter Aid Business and achieve the expected results of the acquisition, including any expected synergies and the expected accretion to earnings. Further, the Company operates in an industry sector where securities values may be volatile and may be influenced by economic and other factors beyond the Company’s control. Some of the factors that could affect future performance of the Company are changes in, or delays in the implementation of, regulations that cause a market for our products, acquisitions, higher energy and raw material costs, costs of imports and related tariffs, unfavorable weather conditions and changes in market prices of natural gas relative to prices of coal, labor relations, availability of capital and environmental requirements as they relate both to our operations and to our customers, changes in foreign currency exchange rates, borrowing restrictions, validity of patents and other intellectual property, and pension costs. In the context of the forward-looking information provided in this news release, please refer to the discussions of risk factors and other information detailed in, as well as the other information contained in the Company’s most recent Annual Report. Any forward-looking statement speaks only as of the date on which such statement is made, and the Company does not intend to correct or update any forward-looking statements, whether as a result of new information, future events or otherwise, unless required to do so by the Federal securities laws of the United States.

Agenda Company ProfileFinancial PerformanceValue Creation DriversAreas of FocusWood-based Activated Carbon and Filter Aid Business AcquisitionNorth American Drinking Water OpportunitiesDBPsPFCsMercury RemovalBallast Water TreatmentSummary DBP – Disinfection By-products; PFC – Perfluorinated Compounds

Company Profile

Who We Are We are the world’s largest producer of granular activated carbon We solve customer purification and separation problems with a variety of technologiesCarbon technology is our core competency with a diverse product portfolio complemented by ultraviolet light and ION exchange 15 FACILITIESMANUFACTURING, REACTIVATION, EQUIPMENT 70+ YEARS EXPERIENCE 1100+ EMPLOYEES 240 PATENTS 34 CITIES ,15 COUNTRIESGLOBAL SALES REPRESENTATION $535 million2015 Net Sales

What We Do Develop, manufacture and supply activated carbon, other media and treatment systems to: Reduce environmental impact and allow waste water reuse or disposal Remove and recover contaminants from air emissions Purify food products Protect your personal environment Provide clean, safe drinking water Enhance critical stages in chemical manufacture

GRANULAR EXTRUDED POWDER Activated Carbon CLOTH

Equipment Carbon Adsorption Systems Ultraviolet Technology Ion Exchange Systems Ballast Water Treatment

Columbus, OH North Tonawanda, NY Pittsburgh, PA (HQ) Catlettsburg, KY Pearlington, MS Neville Island, PA Gila Bend, AZ Columbus, OH Blue Lake, CA Mexico City, Mexico São Paulo, Brazil Houghton-le-Spring, UK Ashton-in-Makerfield, UK Tipton, UK Grays, UK Suzhou, Jiangsu Province, China Fukui, Fukui Prefecture, Japan Singapore (HQ) Global Presence Findlay Twp. PA US Sales Representation:San Francisco, CAChicago, ILBaton Rouge, LALake Charles, LALouisville, KYNew York, NYPortland, ORCleveland, OHHarrisburg, PAPhiladelphia, PAPittsburgh, PAHouston, TXCharlottesville, VASeattle, WAAppleton, WI Global Sales Representation Manufacturing Locations Regional Offices / HQ Feluy, Belgium (HQ)

Activated Carbon Reactivation Equipment Technologies Consumer $487MM(91%) $39MM(7%) $9MM(2%) Market Applications Products & Services 2015 Revenue Profile Source: Annual report, Management analysis * Includes FLUEPAC® mercury removal product sales.

Financial Highlights (In millions except per share data) 2012 2013 2014 2015 Net Sales $562.3 $547.9 $555.1 $535.0 Gross Margin %* 30.2% 33.0% 34.6% 35.8% Operating Expense %** 16.6% 15.1% 15.7% 17.1% Income from Operations $39.9 $68.9 $74.6 $64.8 Net Income $23.3 $45.7 $49.4 $43.5 Net Income Per Common Share (Diluted) $0.41 $0.84 $0.92 $0.82 Wgt’d Avg Shares O/S (Diluted) 56.8 54.7 53.9 52.7 EBITDA %*** 11.3% 17.6% 18.6% 18.6% * Net sales less the cost of products sold as a percentage of sales (excluding depreciation & amortization expense)** Absent SAP reimplementation costs, the performance was 15% in 2014 and 16.2% in 2015.*** Earnings before interest, taxes, depreciation, and amortization as a percentage of sales
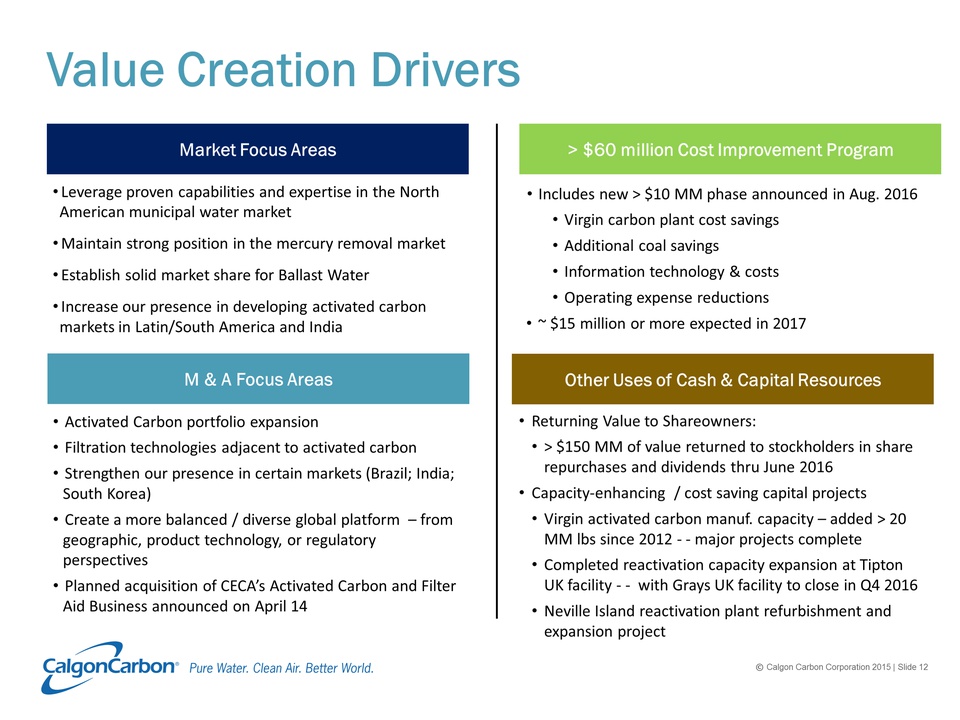
Value Creation Drivers > $60 million Cost Improvement Program Market Focus Areas Leverage proven capabilities and expertise in the North American municipal water marketMaintain strong position in the mercury removal marketEstablish solid market share for Ballast WaterIncrease our presence in developing activated carbon markets in Latin/South America and India M & A Focus Areas Includes new > $10 MM phase announced in Aug. 2016Virgin carbon plant cost savingsAdditional coal savingsInformation technology & costsOperating expense reductions~ $15 million or more expected in 2017 Other Uses of Cash & Capital Resources Returning Value to Shareowners:> $150 MM of value returned to stockholders in share repurchases and dividends thru June 2016Capacity-enhancing / cost saving capital projectsVirgin activated carbon manuf. capacity – added > 20 MM lbs since 2012 - - major projects completeCompleted reactivation capacity expansion at Tipton UK facility - - with Grays UK facility to close in Q4 2016Neville Island reactivation plant refurbishment and expansion project Activated Carbon portfolio expansionFiltration technologies adjacent to activated carbonStrengthen our presence in certain markets (Brazil; India; South Korea)Create a more balanced / diverse global platform – from geographic, product technology, or regulatory perspectivesPlanned acquisition of CECA’s Activated Carbon and Filter Aid Business announced on April 14
Areas of FocusAcquisition – Wood-based Activated Carbon and Filter Aid BusinessNorth American Drinking WaterMercury RemovalBallast Water Treatment
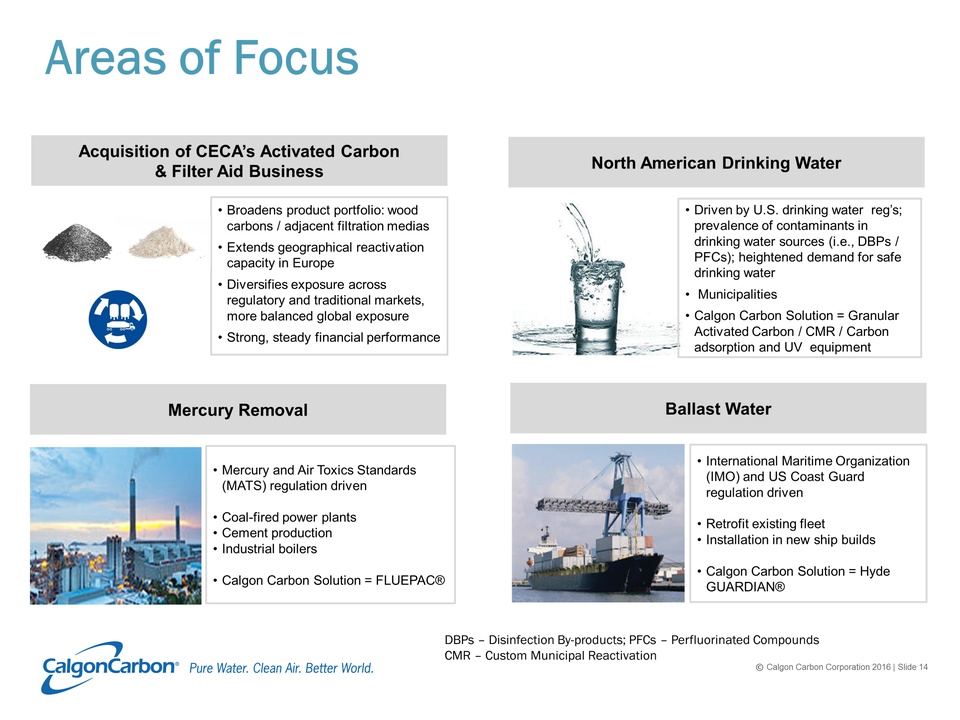
Areas of Focus Mercury Removal North American Drinking Water Ballast Water Mercury and Air Toxics Standards (MATS) regulation driven Coal-fired power plantsCement productionIndustrial boilersCalgon Carbon Solution = FLUEPAC® Driven by U.S. drinking water reg’s; prevalence of contaminants in drinking water sources (i.e., DBPs / PFCs); heightened demand for safe drinking water MunicipalitiesCalgon Carbon Solution = Granular Activated Carbon / CMR / Carbon adsorption and UV equipment International Maritime Organization (IMO) and US Coast Guard regulation drivenRetrofit existing fleetInstallation in new ship builds Calgon Carbon Solution = Hyde GUARDIAN® Acquisition of CECA’s Activated Carbon & Filter Aid Business Broadens product portfolio: wood carbons / adjacent filtration mediasExtends geographical reactivation capacity in EuropeDiversifies exposure across regulatory and traditional markets, more balanced global exposureStrong, steady financial performance DBPs – Disinfection By-products; PFCs – Perfluorinated Compounds CMR – Custom Municipal Reactivation

Manufacturing / commercial capabilities Virgin wood-based activated carbonCarbon reactivation servicesDiatomaceous earth (DE) and perlite filtration mediaPerliting/cryogenic insulationStrong end market customer relationshipsBeverage, Food, Industrial, Pharmaceutical40% of customer base uses both carbon and filtration media products Stable financial performance Solid market positions in EMEA region~ 300 employees Virgin activated carbon Diatomaceous earth Perlite Business Description Operating Locations 2015 Financial Performance(1) Year Ended December 31, 2015 Revenue(2) $102.5 million EBITDA(2) $16.7 million EBITDA Margin 16.3% Parentis, France Legnago, Italy Riom Es Montagnes, France Saint-Bauzile, France Abidos, France Foggia, Italy Planned AcquisitionCECA's Activated Carbon and Filter Aid Business (1) Stand-alone unaudited non-U.S. GAAP FY2015 financial results(2) Using an exchange rate of €1.00 = $1.10 Carbon reactivation Perliting/cryogenic insulation Highlights Great strategic fitExpect transaction to close in Q4 2016 Provides 15% to 20% increase in annual sales and EBITDA2015 EBITDA margin of 16.3%Current DE / perlite EBITDA margin ~ 20%Current activated carbon EBITDA margin ~13%Synergies / capital investment projects expected to improve EBITDA by > $6M by 2019Post-close leverage expected to approximate 2.25x combined pro forma EBITDA (purchase price ~ $152MM cash + assumed liabilities)Expected to be accretive to 2017 EPS by $0.08 to $0.11 – excluding impact of purchase accounting.
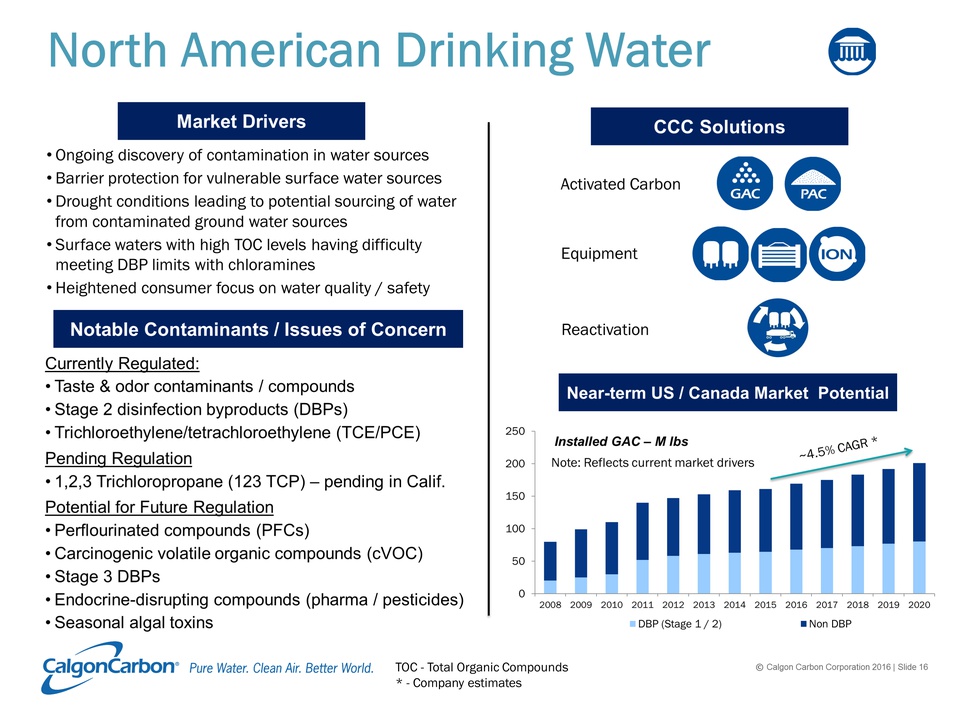
North American Drinking Water Market Drivers Ongoing discovery of contamination in water sourcesBarrier protection for vulnerable surface water sourcesDrought conditions leading to potential sourcing of water from contaminated ground water sourcesSurface waters with high TOC levels having difficulty meeting DBP limits with chloraminesHeightened consumer focus on water quality / safety CCC Solutions Currently Regulated:Taste & odor contaminants / compoundsStage 2 disinfection byproducts (DBPs)Trichloroethylene/tetrachloroethylene (TCE/PCE)Pending Regulation1,2,3 Trichloropropane (123 TCP) – pending in Calif.Potential for Future RegulationPerflourinated compounds (PFCs)Carcinogenic volatile organic compounds (cVOC)Stage 3 DBPsEndocrine-disrupting compounds (pharma / pesticides)Seasonal algal toxins Notable Contaminants / Issues of Concern TOC - Total Organic Compounds* - Company estimates Activated Carbon Reactivation Equipment Near-term US / Canada Market Potential Installed GAC – M lbs Note: Reflects current market drivers ~4.5% CAGR *
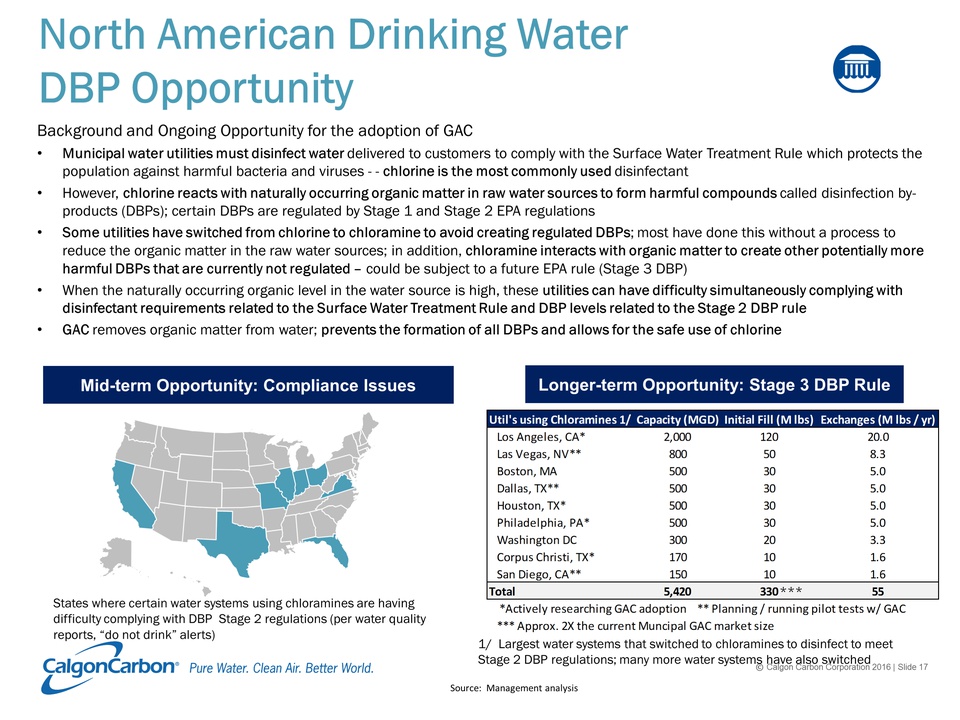
North American Drinking WaterDBP Opportunity Background and Ongoing Opportunity for the adoption of GAC Municipal water utilities must disinfect water delivered to customers to comply with the Surface Water Treatment Rule which protects the population against harmful bacteria and viruses - - chlorine is the most commonly used disinfectantHowever, chlorine reacts with naturally occurring organic matter in raw water sources to form harmful compounds called disinfection by-products (DBPs); certain DBPs are regulated by Stage 1 and Stage 2 EPA regulationsSome utilities have switched from chlorine to chloramine to avoid creating regulated DBPs; most have done this without a process to reduce the organic matter in the raw water sources; in addition, chloramine interacts with organic matter to create other potentially more harmful DBPs that are currently not regulated – could be subject to a future EPA rule (Stage 3 DBP)When the naturally occurring organic level in the water source is high, these utilities can have difficulty simultaneously complying with disinfectant requirements related to the Surface Water Treatment Rule and DBP levels related to the Stage 2 DBP ruleGAC removes organic matter from water; prevents the formation of all DBPs and allows for the safe use of chlorine Longer-term Opportunity: Stage 3 DBP Rule Source: Management analysis Mid-term Opportunity: Compliance Issues 1/ Largest water systems that switched to chloramines to disinfect to meet Stage 2 DBP regulations; many more water systems have also switched States where certain water systems using chloramines are having difficulty complying with DBP Stage 2 regulations (per water quality reports, “do not drink” alerts) ***
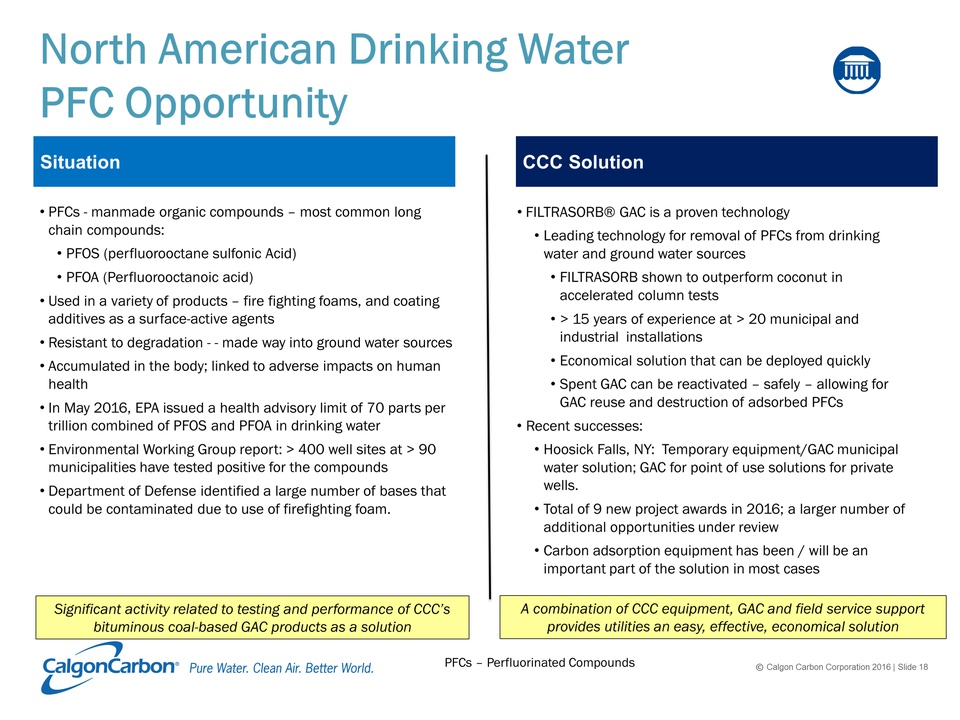
North American Drinking WaterPFC Opportunity Situation CCC Solution PFCs - manmade organic compounds – most common long chain compounds:PFOS (perfluorooctane sulfonic Acid) PFOA (Perfluorooctanoic acid)Used in a variety of products – fire fighting foams, and coating additives as a surface-active agentsResistant to degradation - - made way into ground water sourcesAccumulated in the body; linked to adverse impacts on human healthIn May 2016, EPA issued a health advisory limit of 70 parts per trillion combined of PFOS and PFOA in drinking waterEnvironmental Working Group report: > 400 well sites at > 90 municipalities have tested positive for the compoundsDepartment of Defense identified a large number of bases that could be contaminated due to use of firefighting foam. FILTRASORB® GAC is a proven technologyLeading technology for removal of PFCs from drinking water and ground water sourcesFILTRASORB shown to outperform coconut in accelerated column tests> 15 years of experience at > 20 municipal and industrial installationsEconomical solution that can be deployed quicklySpent GAC can be reactivated – safely – allowing for GAC reuse and destruction of adsorbed PFCsRecent successes:Hoosick Falls, NY: Temporary equipment/GAC municipal water solution; GAC for point of use solutions for private wells.Total of 9 new project awards in 2016; a larger number of additional opportunities under reviewCarbon adsorption equipment has been / will be an important part of the solution in most cases PFCs – Perfluorinated Compounds Significant activity related to testing and performance of CCC’s bituminous coal-based GAC products as a solution A combination of CCC equipment, GAC and field service support provides utilities an easy, effective, economical solution
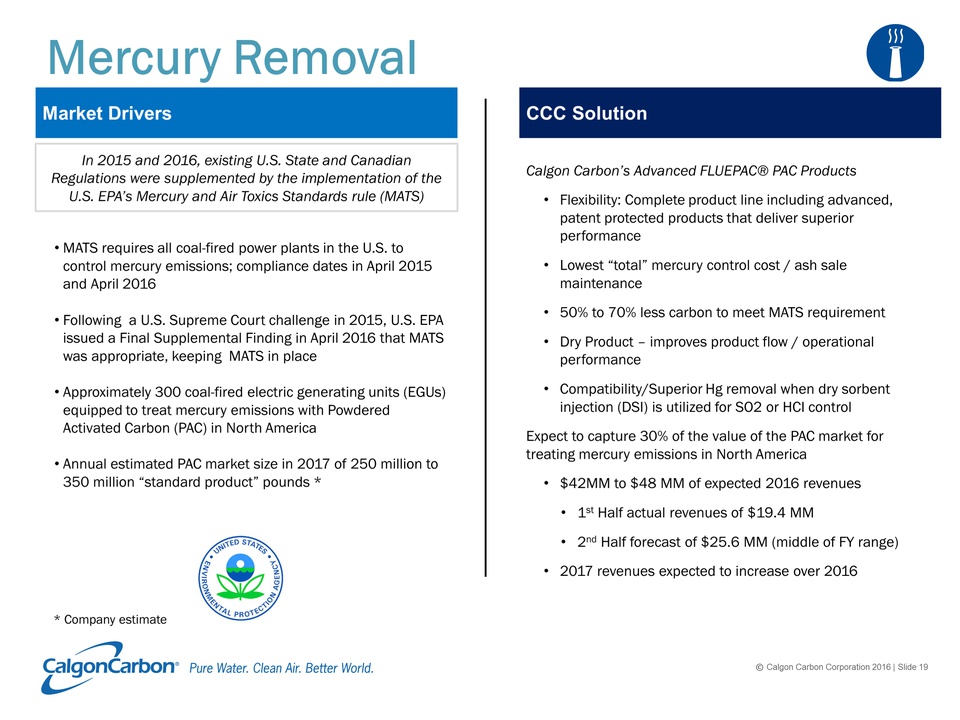
Mercury Removal In 2015 and 2016, existing U.S. State and Canadian Regulations were supplemented by the implementation of the U.S. EPA’s Mercury and Air Toxics Standards rule (MATS) MATS requires all coal-fired power plants in the U.S. to control mercury emissions; compliance dates in April 2015 and April 2016Following a U.S. Supreme Court challenge in 2015, U.S. EPA issued a Final Supplemental Finding in April 2016 that MATS was appropriate, keeping MATS in placeApproximately 300 coal-fired electric generating units (EGUs) equipped to treat mercury emissions with Powdered Activated Carbon (PAC) in North AmericaAnnual estimated PAC market size in 2017 of 250 million to 350 million “standard product” pounds * Calgon Carbon’s Advanced FLUEPAC® PAC Products Flexibility: Complete product line including advanced, patent protected products that deliver superior performanceLowest “total” mercury control cost / ash sale maintenance50% to 70% less carbon to meet MATS requirementDry Product – improves product flow / operational performanceCompatibility/Superior Hg removal when dry sorbent injection (DSI) is utilized for SO2 or HCI controlExpect to capture 30% of the value of the PAC market for treating mercury emissions in North America$42MM to $48 MM of expected 2016 revenues1st Half actual revenues of $19.4 MM2nd Half forecast of $25.6 MM (middle of FY range)2017 revenues expected to increase over 2016 Market Drivers CCC Solution * Company estimate

Ballast Water Treatment Prevent spread of invasive species (e.g. zebra mussels) Expected market size $18B to $28B – 64,000 ships * Regulations IMO ConventionRatified on September 8, 2017 – 52 countries representing 35.14% of world shipping tonnage have signed.Enters into force Sept 8, 2017Estimate that 66% to 90% of total expected market size to be impacted by IMO Convention with no impact from USCG regulation.* United States Coast Guard (USCG)Final Ballast Rule enacted June 2012All vessels subject to compliance as of Jan 1, 2016 – no systems Type ApprovedJuly 2016 - Denied industry appeals to allow testing of UV systems using MPN test method> 10,500 vessel compliance extensions granted as of Aug 26 2016 Situation Hyde Marine Addresses the LARGE retrofit market with a SMALL systemEffective reliable solution based on filtration and ultraviolet (UV) disinfection; simple, automatic operationSkid-mounted or modular-component system allows for optimal integration into new-build or existing vessels Can serve flow rates from 60 m3/h to 6000 m3/h in either a standard of multi-reactor system configuration.Over 450 Hyde systems sold since 2010 acquisitionSystem Type Approved for complying with IMO ConventionCompleted land-based testing toward gaining updated IMO certificationIntend to repeat land-based testing using currently required USCG test method to pursue USCG Type Approval commencing Feb 2017 * Company estimates
Summary
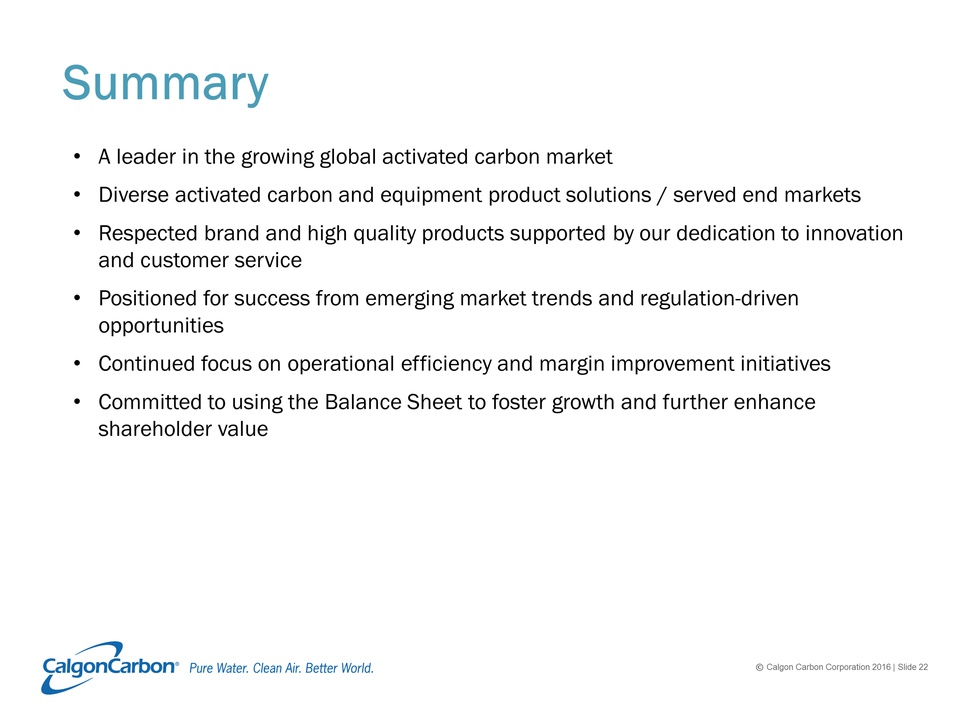
Summary A leader in the growing global activated carbon market Diverse activated carbon and equipment product solutions / served end marketsRespected brand and high quality products supported by our dedication to innovation and customer servicePositioned for success from emerging market trends and regulation-driven opportunitiesContinued focus on operational efficiency and margin improvement initiativesCommitted to using the Balance Sheet to foster growth and further enhance shareholder value

Thank You
Appendix

North American Drinking Water Market Community Water Systems (Size and Population Served) Large* Very Large* Small Medium* Very Small ~400 systems ~3,700 systems ~4,800 systems ~29,000 systems ~14,000 systems * Calgon Carbon Primary Target Market Segments Size of Primary Market: ~8,900 systemsSystems using GAC: ~900 systemsCCC Accounts: ~450 systemsCCC CMR Act’s: ~158 systemsAdd’l CMR Opportunity > 200 systems

Reactivation Lower costs than using virgin carbonCertified destruction of the adsorbed materials (which may be classified as hazardous)No landfill liabilitiesLower cost than incinerationSustainability benefitsGenerates only 20% of the CO2 vs. the production of virgin carbonAssured supply of carbonExpert Field Service support and logistics Benefits Reactivation Sites Fukui, Japan Municipal, Industrial Suzhou, China Industrial, Municipal (conversion of muni kiln to industrial in process) Tipton, UK Municipal Feluy, Belgium Municipal, Industrial North Tonawanda, NY Municipal Pittsburgh, PA Industrial RCRA Columbus, OHMunicipal, Industrial Catlettsburg, KY Industrial RCRA Gila Bend, AZ Municipal Blue Lake, CA (idle) Municipal Approximately 160 municipal water systems use Custom Municipal Reactivation (CMR) in North America Grays, UK Municipal * To be shut and disposed of in 2016 * *

Pro Forma Employees: ~1,125 Production Facilities: - USA:8; Europe:5; Asia:2 Revenue: $535.0M EBITDA: $99.6M EBITDA Margin: 18.6% Employees: ~300 Production Facilities: Europe: 5 Revenue: $102.5M EBITDA: $16.7M EBITDA Margin: 16.3% Employees: ~1,425Production Facilities: - USA:8; Europe:10; Asia:2 Revenue: $637.5MEBITDA: $116.3M EBITDA Margin: 18.2% Overview Revenue by Geography Revenue by End Market Activated Carbon & Filter Aid Business(2) (3) Pro forma information based on summation of Calgon Carbon audited results and stand-alone unaudited non-U.S. GAAP results for Activated Carbon & Filter Aid Business. CECA Acquisition: A More Balanced & Global Platform (3) (1) Audited FY2015 financial results (1) (2) Stand-alone unaudited non-U.S. GAAP FY2015 financial results; financials based on an exchange rate of €1.00 = $1.10
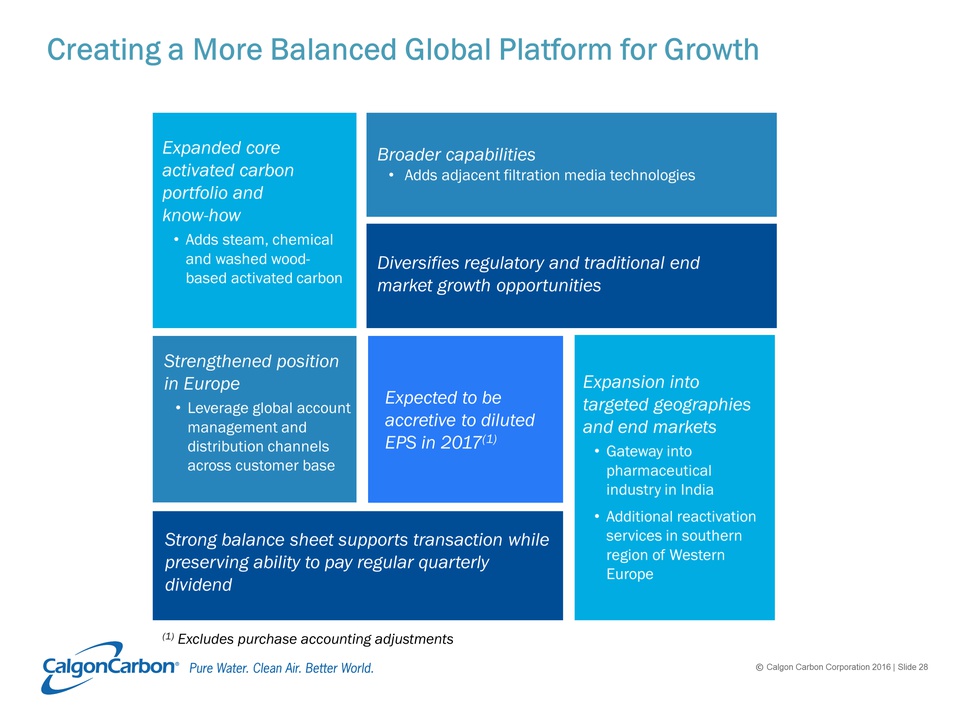
Expanded core activated carbon portfolio and know-howAdds steam, chemical and washed wood-based activated carbon Broader capabilities Adds adjacent filtration media technologies Diversifies regulatory and traditional end market growth opportunities Strengthened position in EuropeLeverage global account management and distribution channels across customer base Strong balance sheet supports transaction while preserving ability to pay regular quarterly dividend Expansion into targeted geographies and end marketsGateway into pharmaceutical industry in IndiaAdditional reactivation services in southern region of Western Europe (1) Excludes purchase accounting adjustments Expected to be accretive to diluted EPS in 2017(1) Creating a More Balanced Global Platform for Growth
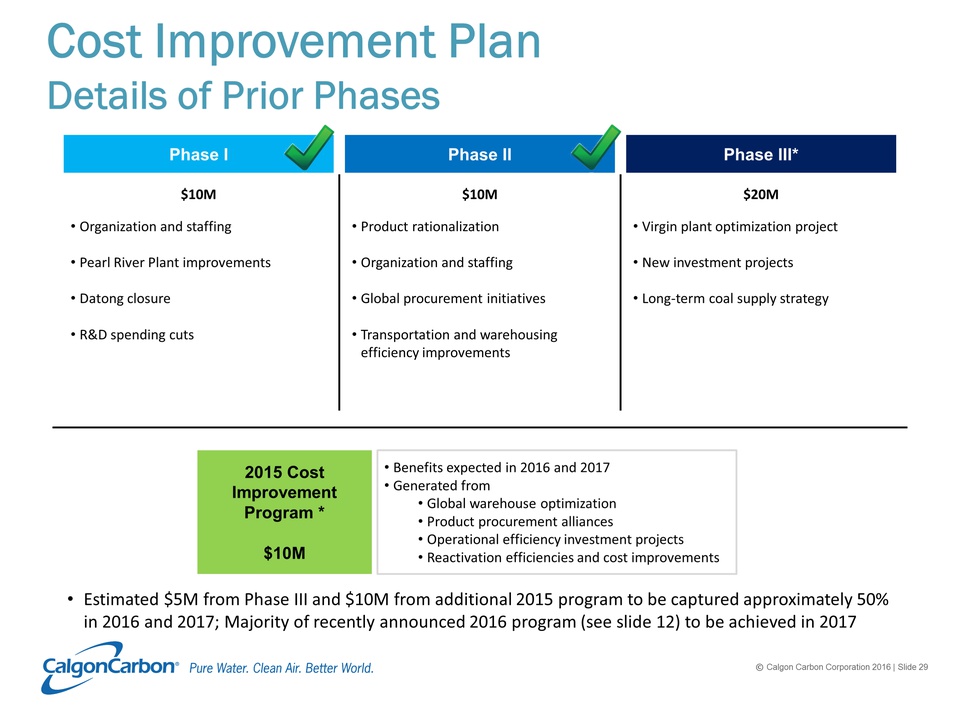
Cost Improvement PlanDetails of Prior Phases Phase I Phase II Phase III* Organization and staffingPearl River Plant improvementsDatong closureR&D spending cuts Product rationalizationOrganization and staffingGlobal procurement initiativesTransportation and warehousing efficiency improvements Virgin plant optimization projectNew investment projectsLong-term coal supply strategy $10M $10M $20M 2015 Cost Improvement Program *$10M Benefits expected in 2016 and 2017Generated fromGlobal warehouse optimizationProduct procurement alliancesOperational efficiency investment projectsReactivation efficiencies and cost improvements Estimated $5M from Phase III and $10M from additional 2015 program to be captured approximately 50% in 2016 and 2017; Majority of recently announced 2016 program (see slide 12) to be achieved in 2017