Attached files
| file | filename |
|---|---|
| 8-K - CURRENT REPORT - SITO MOBILE, LTD. | f8k091216_sitomobile.htm |
Exhibit 99.1

I 1 INVESTOR PRESENTATION | SEPTEMBER 2016
SAFE HARBOR STATEMENT Matters discussed in this presentation contain forward - looking statements that involve risks and uncertainties and reflect SITO Mobile’s judgement as of the date of this presentation. Forward - looking statements generally relate to future events and include, without limitation, pro jections, forecasts and estimates about possible or assumed future results of the Company’s business, financial condition, liquidity, results of oper ati ons, plans and objectives. In some cases, you can identify forward - looking statements because they contain words such as “may,” “might,” “will,” “would,” “sho uld,” “expect,” “plan,” “anticipate,” “could,” “intend,” “target,” “project,” “contemplate,” “believe,” “estimate,” “predict,” “likely,” “potential” or “continue” or the negative of these words or other similar terms or expressions that concern our expectations, strategy, plans or intentions. These forward - looking statements are necessarily based upon estimates and assumptions that, while considered reasonable by the Company and its management, are inherently unce rta in. Actual events or results may differ from SITO Mobile’s expectations include, but are not limited to, the risks and uncertainties relating to reliance on brand owners and wireless carriers, the possible need for additional capital, as well as other risks identified in SITO Mobile’s filings with the SEC, and those factors identified in the SITO Mobile’s prospectus in the sections titled “Risk factors” and “Forward - Looking Information.” New risks and uncertai nties arise over time, and it is not possible for us to predict all such factors or how they may affect us. Nothing in this presentation should be regarded as a representation by any person that the forward - looking statements set forth herein will be achieved or that any of the contemplated results of such for ward - looking statements will be achieved. You should not place undue reliance on forward - looking statements, which speak only as of the date they are ma de. SITO Mobile disclaims any intent or obligation to update these forward - looking statements beyond the date of this presentation, except as ma y be required by law. This presentation includes certain non - GAAP financial measures, including Adjusted EBITDA. These non - GAAP financial measures sho uld be considered only as supplemental to, and not as superior to, financial measures prepared in accordance with GAAP. This presentation is confidential and may not be reproduced or otherwise distributed or disseminated, in whole or part, witho ut the prior written consent of the Company, which consent may be withheld in its sole and absolute discretion. Any investment in the SITO Mobile will be subject to certain risks related to the nature of the Company’s business and the st ruc ture and operations of the Company. Any investment in the Company should be made only with an appreciation of the applicable risks, which are described in the Company’s filings with the SEC. SITO Mobile is traded on the NASDAQ under the ticker symbol “SITO” 2
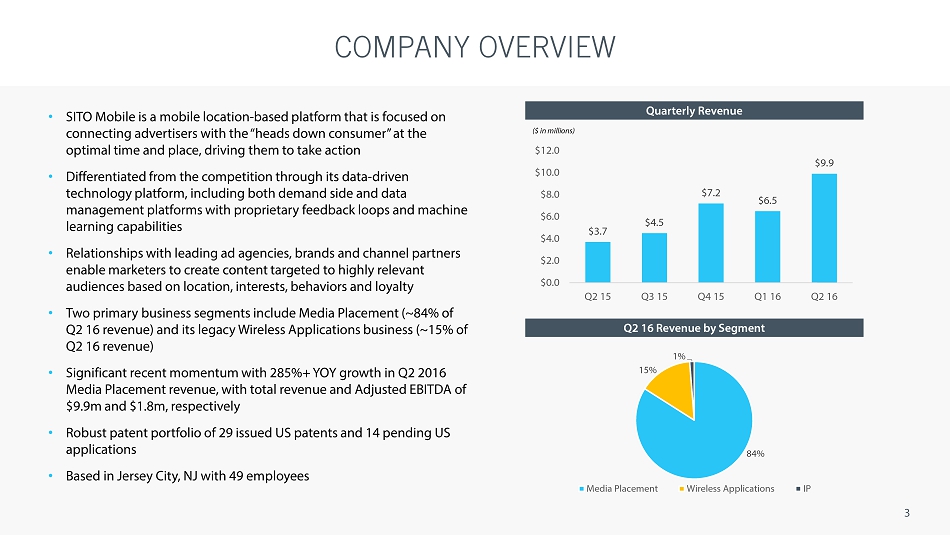
COMPANY OVERVIEW 3 • SITO Mobile is a mobile location - based platform that is focused on connecting advertisers with the “heads down consumer” at the optimal time and place, driving them to take action • Differentiated from the competition through its data - driven technology platform, including both demand side and data management platforms with proprietary feedback loops and machine learning capabilities • Relationships with leading ad agencies, brands and channel partners enable marketers to create content targeted to highly relevant audiences based on location, interests, behaviors and loyalty • Two primary business segments include Media P lacement (~84% of Q2 16 revenue) and its legacy Wireless Applications business (~15% of Q2 16 revenue) • Significant recent momentum with 285%+ YOY growth in Q2 2016 Media Placement revenue, with total revenue and Adjusted EBITDA of $9.9m and $1.8m, respectively • Robust patent portfolio of 29 issued US patents and 14 pending US applications • Based in Jersey City, NJ with 49 employees Quarterly Revenue Q2 16 Revenue by Segment $3.7 $4.5 $7.2 $6.5 $9.9 $0.0 $2.0 $4.0 $6.0 $8.0 $10.0 $12.0 Q2 15 Q3 15 Q4 15 Q1 16 Q2 16 84% 15% 1% Media Placement Wireless Applications IP ($ in millions)
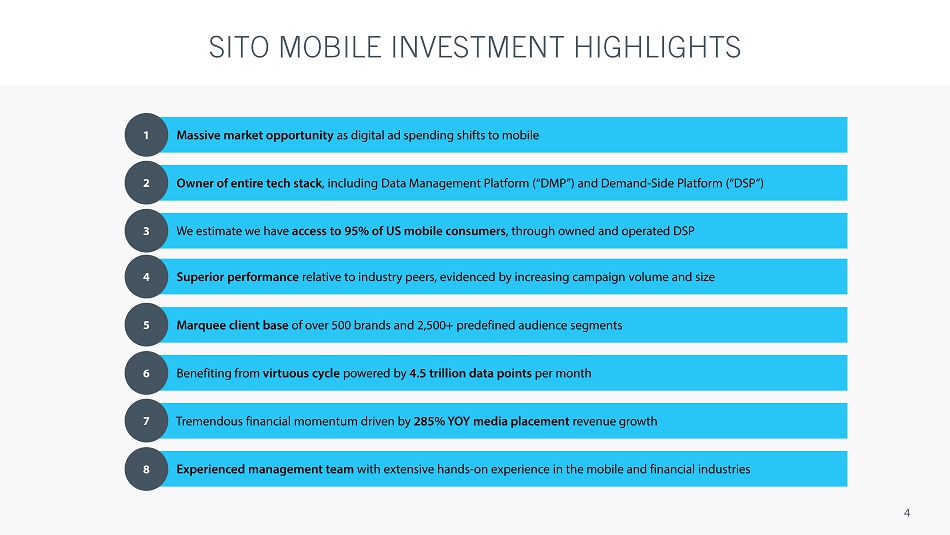
SITO MOBILE INVESTMENT HIGHLIGHTS 4 Massive market opportunity as digital ad spending shifts to mobile Owner of entire tech stack , including Data Management Platform (“DMP”) and Demand - Side Platform (“DSP”) Marquee client base of over 500 brands and 2,500+ predefined audience segments Tremendous financial momentum driven by 285 % YOY media placement revenue growth Experienced management team with extensive hands - on experience in the mobile and financial industries We estimate we have access to 95% of US mobile consumers , through owned and operated DSP Benefiting from virtuous cycle powered by 4.5 t rillion data points per month 1 2 3 5 6 7 8 Superior performance relative to industry peers, evidenced by increasing campaign volume and size 4
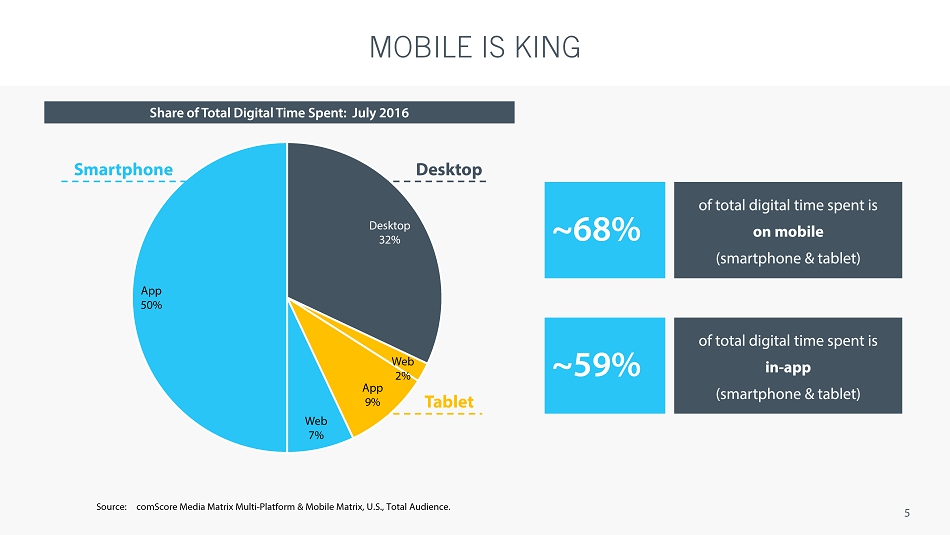
MOBILE IS KING 5 Desktop 32% Web 2% App 9% Web 7% App 50% Smartphone Desktop Tablet Share of Total Digital Time Spent: July 2016 Source: comScore Media Matrix Multi - Platform & Mobile Matrix, U.S., Total Audience. ~68% of total digital time spent is on mobile (smartphone & tablet) ~59% of total digital time spent is in - app (smartphone & tablet)
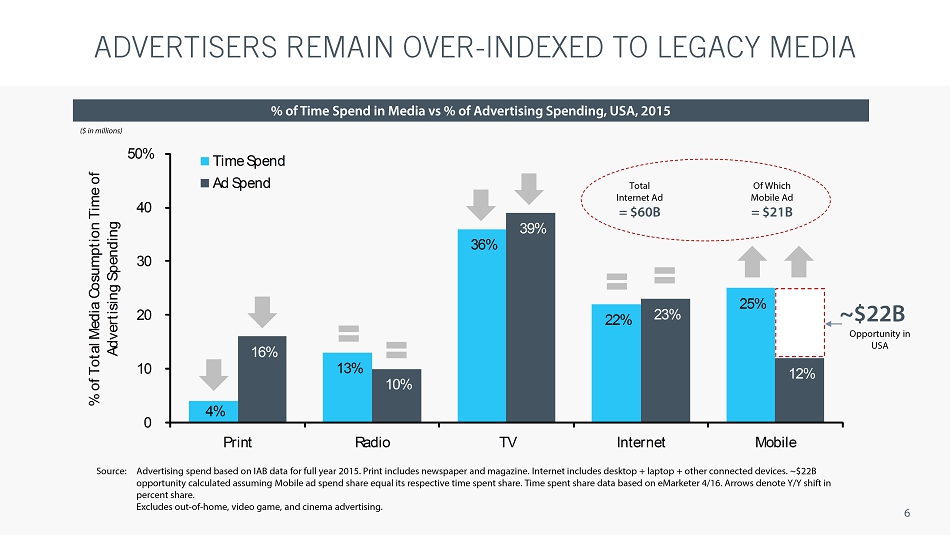
ADVERTISERS REMAIN OVER - INDEXED TO LEGACY MEDIA 6 4% 13% 36% 22% 25% 16% 10% 39% 23% 12% 0 10 20 30 40 50% Print Radio TV Internet Mobile % of Total Media Cosumption Time of Advertising Spending Time Spend Ad Spend Source: Advertising spend based on IAB data for full year 2015. Print includes newspaper and magazine. Internet includes desktop + laptop + other connected devices. ~$22B opportunity calculated assuming Mobile ad spend share equal its respective time spent share. Time spent share data based on eMarketer 4/16. Arrows denote Y/Y shift in percent share. Excludes out - of - home, video game, and cinema advertising. Total Internet Ad = $60B Of Which Mobile Ad = $21B Opportunity in USA ~$ 22B % of Time Spend in Media vs % of Advertising Spending, USA, 2015 ($ in millions)
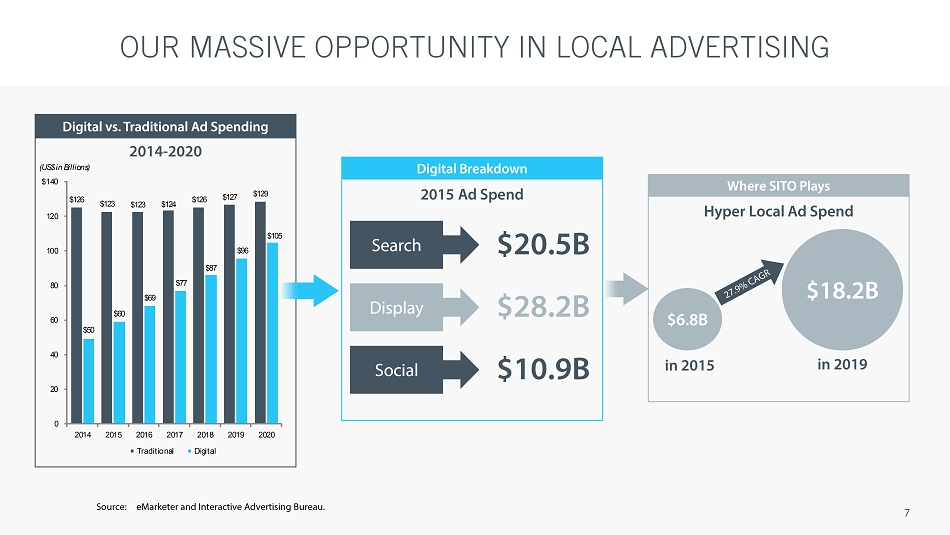
OUR MASSIVE OPPORTUNITY IN LOCAL ADVERTISING 2014 - 2020 7 Search $20.5B Display $ 2 8.2B Social $10.9B $126 $123 $123 $124 $126 $127 $129 $50 $60 $69 $77 $87 $96 $105 0 20 40 60 80 100 120 $140 2014 2015 2016 2017 2018 2019 2020 Traditional Digital (US $ in Billions ) Digital vs. Traditional Ad Spending Digital Breakdown 2015 Ad Spend Where SITO Plays Hyper Local Ad Spend $6.8B $18.2B in 2015 in 2019 Source: eMarketer and Interactive Advertising Bureau.
8
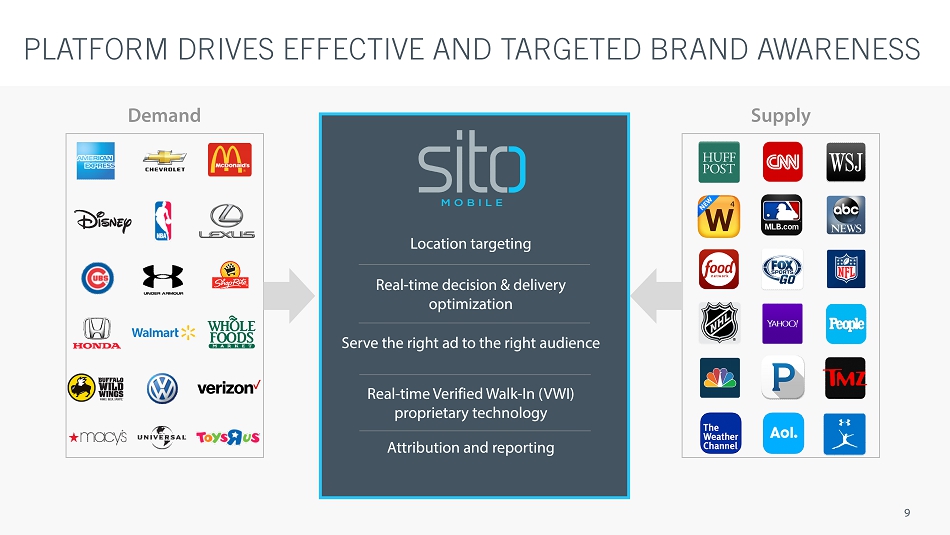
PLATFORM DRIVES EFFECTIVE AND TARGETED BRAND AWARENESS 9 Demand Supply Location targeting Real - time decision & delivery optimization Serve the right ad to the right audience Real - time Verified Walk - In (VWI) proprietary technology Attribution and reporting

FOLLOW THE DIGITAL BREADCRUMBS 10 DEVICE ID: 786541 GEO : 42.546785 , - 83.320175 TIME: 7:52 AM Coffee Shop DEVICE ID: 786541 GEO : 42.543738, - 83.286753 TIME: 7:35 AM Home DEVICE ID: 786541 GEO : 42.542217 , - 83.358921 TIME: 8:11 AM School DEVICE ID: 786541 GEO: 42.525688, - 83.323282 TIME: 9:28 AM Grocery Capture data at location Enrich data with 1st & 3rd party data via DMP Location Frequency Income Age Purchase Education Household
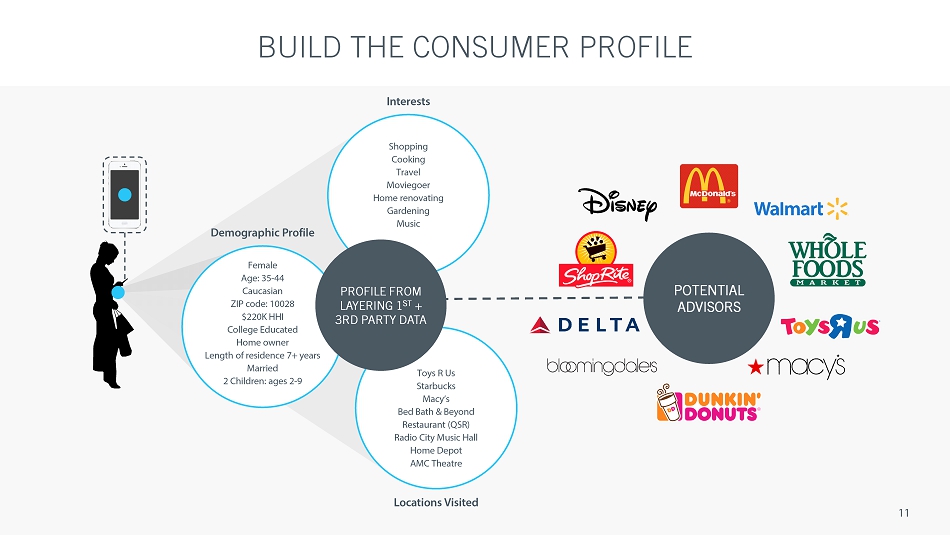
BUILD THE CONSUMER PROFILE 11 Interests Shopping Cooking Travel Moviegoer Home renovating Gardening Music Demographic Profile Female Age: 35 - 44 Caucasian ZIP code: 10028 $220K HHI College Educated Home owner Length of residence 7+ years Married 2 Children: ages 2 - 9 Toys R Us Starbucks Macy’s Bed Bath & Beyond Restaurant (QSR) Radio City Music Hall Home Depot AMC Theatre POTENTIAL ADVISORS Locations Visited P ROFILE FROM LAYERING 1 ST + 3RD PARTY DATA
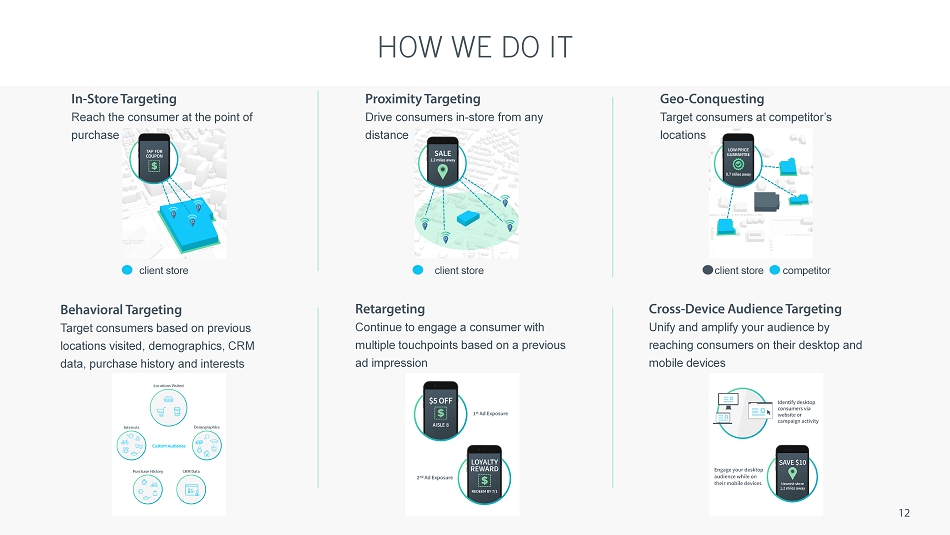
HOW WE DO IT 12 In - Store Targeting Reach the consumer at the point of purchase c lient store Proximity Targeting Drive consumers in - store from any distance Geo - C onquesting Target consumers at competitor’s locations c lient store competitor Behavioral Targeting Target consumers based on previous locations visited, demographics, CRM data, purchase history and interests Retargeting Continue to engage a consumer with multiple touchpoints based on a previous ad impression Cross - Device Audience Targeting Unify and amplify your audience by reaching consumers on their desktop and mobile devices c lient store
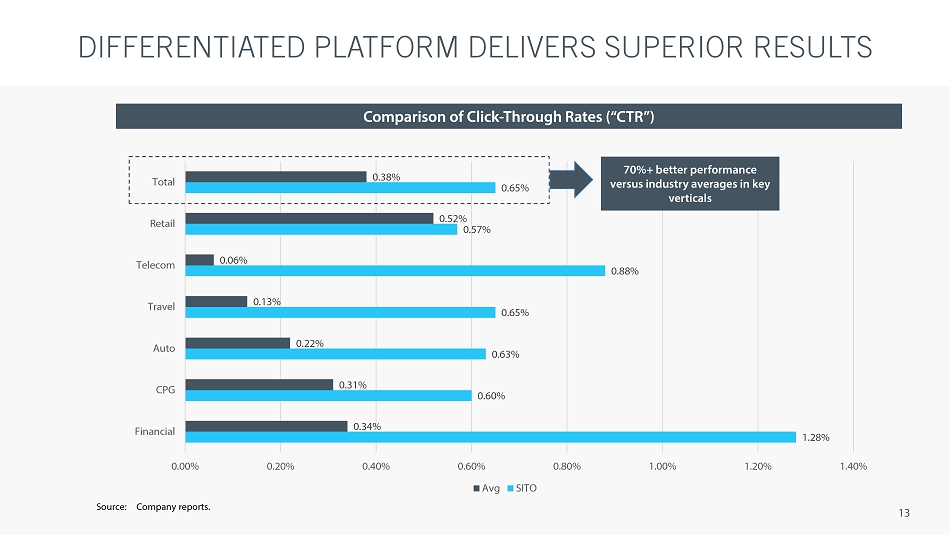
DIFFERENTIATED PLATFORM DELIVERS SUPERIOR RESULTS 13 1.28% 0.60% 0.63% 0.65% 0.88% 0.57% 0.65% 0.34% 0.31% 0.22% 0.13% 0.06% 0.52% 0.38% 0.00% 0.20% 0.40% 0.60% 0.80% 1.00% 1.20% 1.40% Financial CPG Auto Travel Telecom Retail Total Avg SITO 70%+ better performance versus industry averages in key verticals Comparison of Click - Through Rates (“CTR”) Source: Company reports.
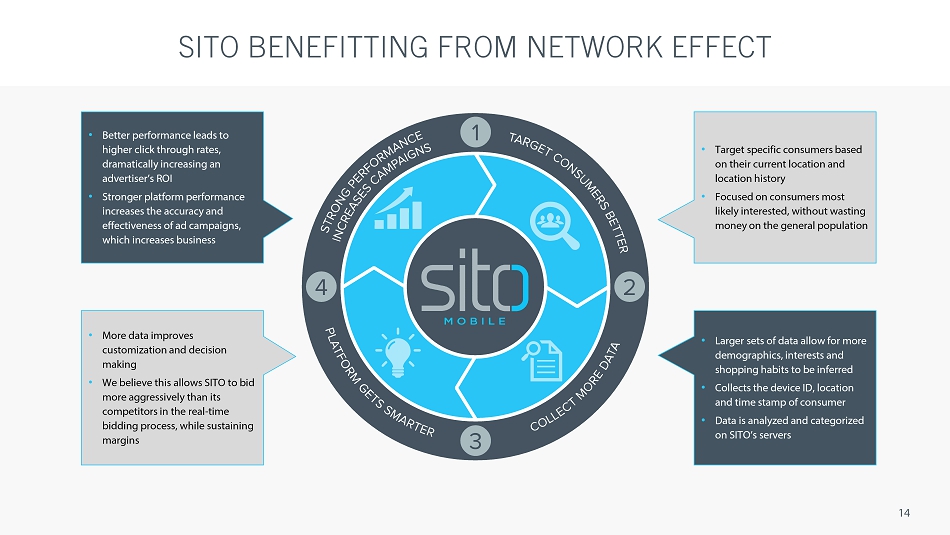
SITO BENEFITTING FROM NETWORK EFFECT 14 • Better performance leads to higher click through rates, dramatically increasing an advertiser’s ROI • Stronger platform performance increases the accuracy and effectiveness of ad campaigns, which increases business • More data improves customization and decision making • We believe this allows SITO to bid more aggressively than its competitors in the real - time bidding process, while sustaining margins • Target specific consumers based on their current location and location history • Focused on consumers most likely interested, without wasting money on the general population • Larger sets of data allow for more demographics, interests and shopping habits to be inferred • Collects the device ID, location and time stamp of consumer • Data is analyzed and categorized on SITO’s servers
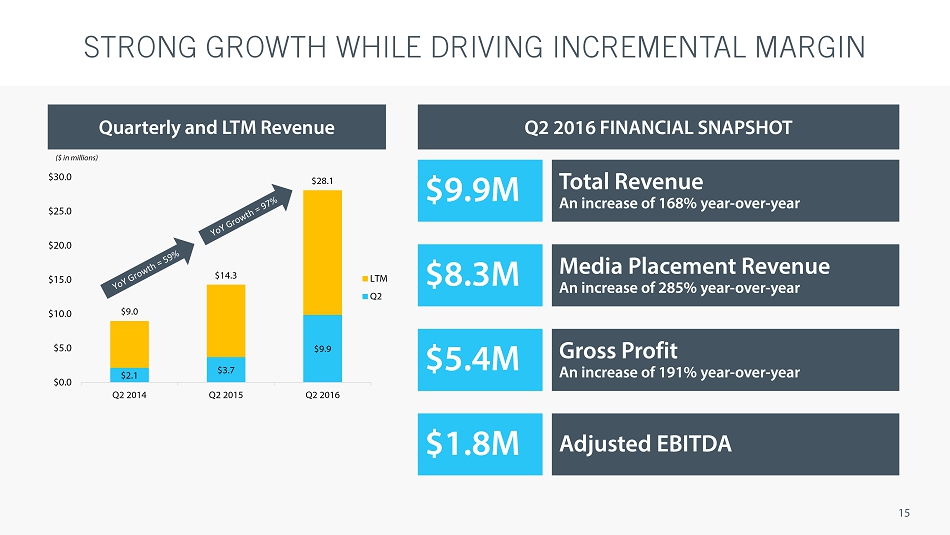
STRONG GROWTH WHILE DRIVING INCREMENTAL MARGIN 15 Quarterly and LTM Revenue $9.9M Total Revenue An increase of 168% year - over - year $8.3M Media Placement Revenue An increase of 285% year - over - year $5.4M Gross Profit An increase of 191% year - over - year $1.8M Adjusted EBITDA Q2 2016 FINANCIAL SNAPSHOT $2.1 $3.7 $9.9 $9.0 $14.3 $28.1 $0.0 $5.0 $10.0 $15.0 $20.0 $25.0 $30.0 Q2 2014 Q2 2015 Q2 2016 LTM Q2 ($ in millions)
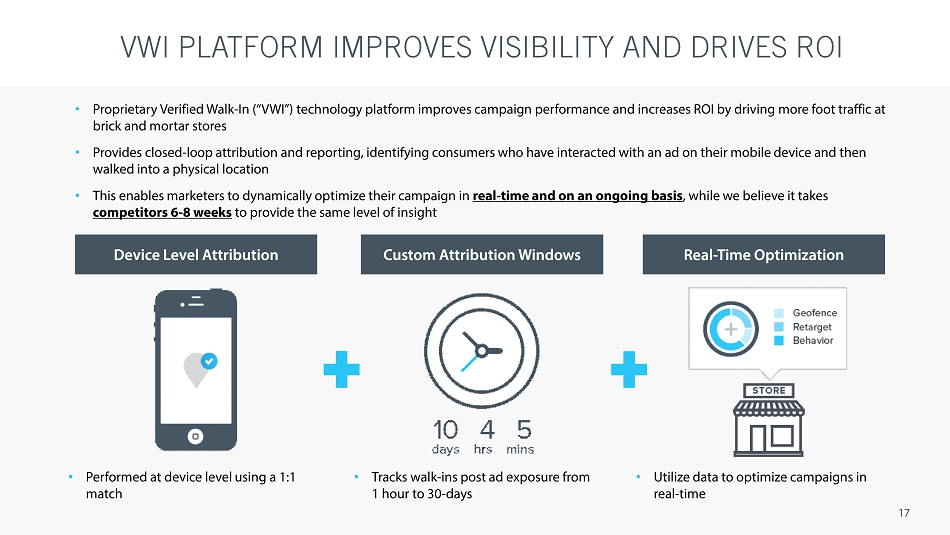
VWI PLATFORM IMPROVES VISIBILITY AND DRIVES ROI 17 Device Level Attribution • Performed at device level using a 1:1 match Custom Attribution Windows • Tracks walk - ins post ad exposure from 1 hour to 30 - days Real - Time Optimization • Utilize data to optimize campaigns in real - time • Proprietary Verified Walk - In (“VWI”) technology platform improves campaign performance and increases ROI by driving more foot traffic at brick and mortar stores • Provides closed - loop attribution and reporting, identifying consumers who have interacted with an ad on their mobile device and then walked into a physical location • This enables marketers to dynamically optimize their campaign in real - time and on an ongoing basis , while we believe it takes competitors 6 - 8 weeks to provide the same level of insight
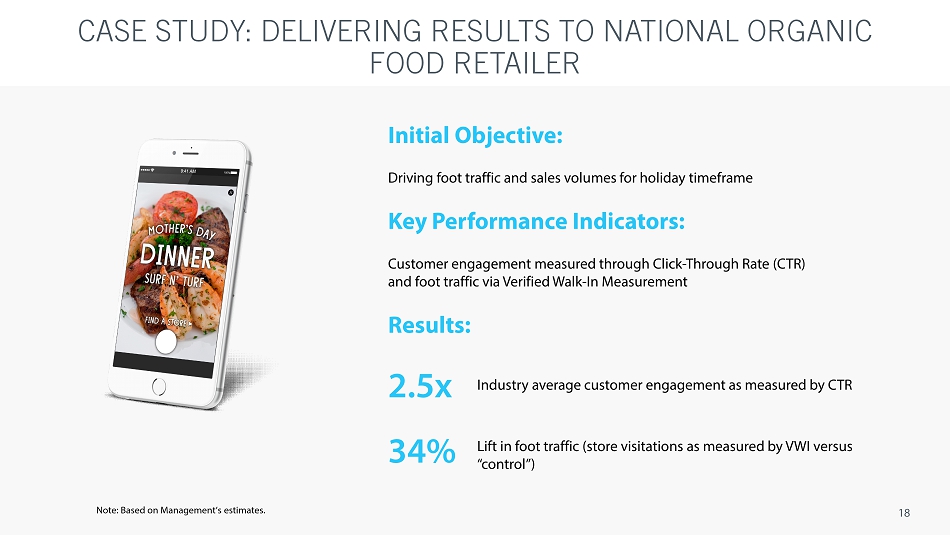
CASE STUDY: DELIVERING RESULTS TO NATIONAL ORGANIC FOOD RETAILER 18 Initial Objective: Driving foot traffic and sales volumes for holiday timeframe Key Performance Indicators: Customer engagement measured through Click - Through Rate (CTR) and foot traffic via Verified Walk - In Measurement Results: Industry average customer engagement as measured by CTR Lift in foot traffic (store visitations as measured by VWI versus “control”) 2.5x 34 % Note: Based on Management’s estimates.
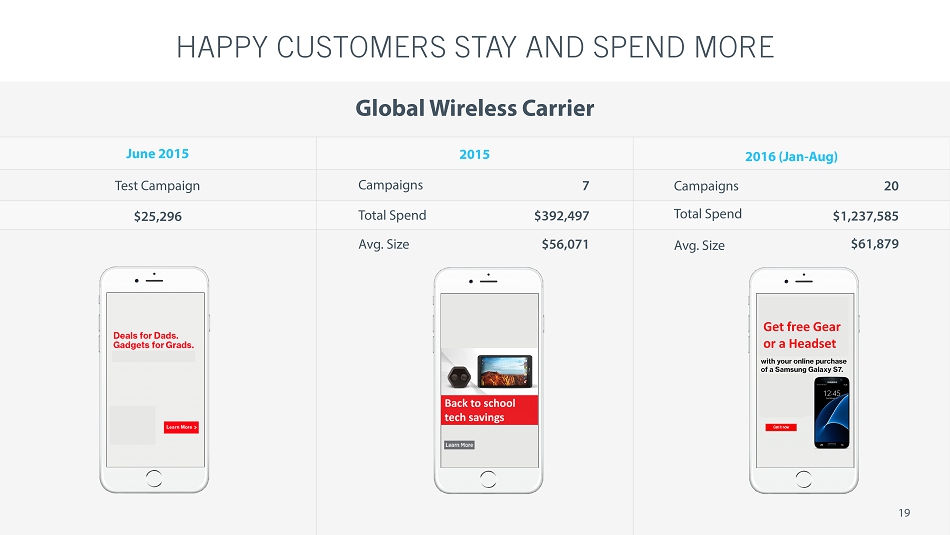
2015 2016 (Jan - Aug) C ampaigns T otal S pend Avg. Size 7 $392,497 $56,071 Campaigns Total Spend Avg. Size 20 $1,237,585 $61,879 June 2015 T est Campaign $25,296 HAPPY CUSTOMERS STAY AND SPEND MORE 19 Back to school tech savings Get free Gear or a Headset Global Wireless Carrier
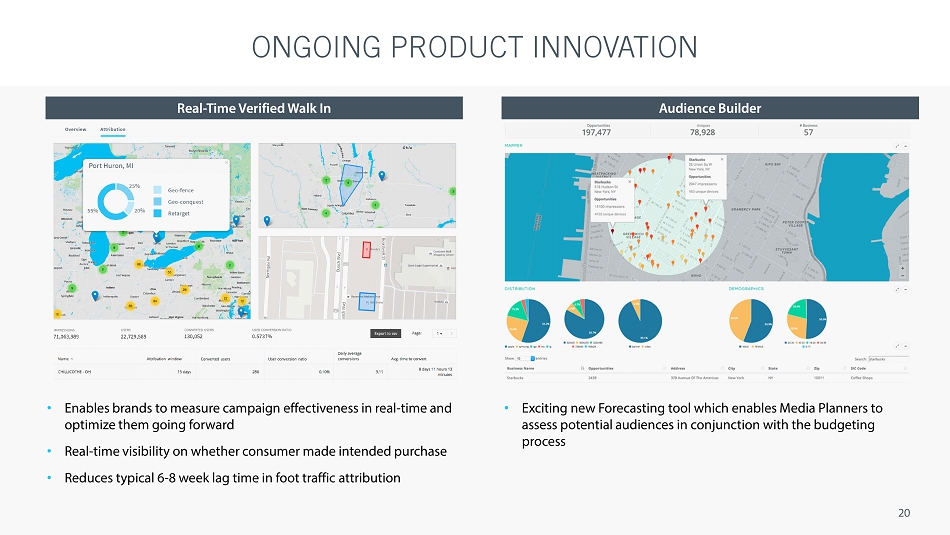
ONGOING PRODUCT INNOVATION 20 • Enables brands to measure campaign effectiveness in real - time and optimize them going forward • Real - time visibility on whether consumer made intended purchase • Reduces typical 6 - 8 week lag time in foot traffic attribution Real - Time Verified Walk In • Exciting new Forecasting tool which enables Media Planners to assess potential audiences in conjunction with the budgeting process Audience Builder
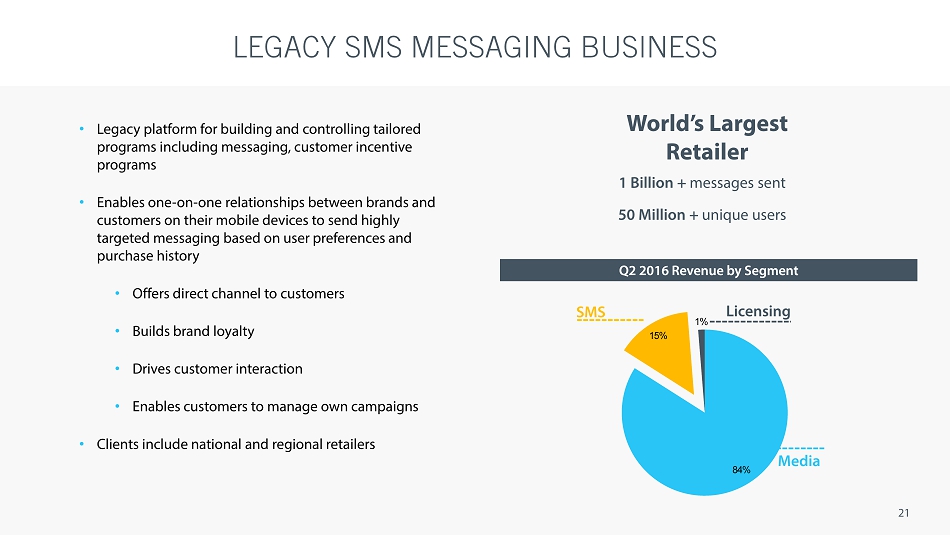
84% 15% 1% LEGACY SMS MESSAGING BUSINESS 21 SMS Licensing Media 1 Billion + messages sent 50 Million + unique users Q2 2016 Revenue by Segment • Legacy platform for building and controlling tailored programs including messaging, customer incentive programs • Enables one - on - one relationships between brands and customers on their mobile devices to send highly targeted messaging based on user preferences and purchase history • Offers direct channel to customers • Builds brand loyalty • Drives customer interaction • Enables customers to manage own campaigns • Clients include national and regional retailers World’s Largest Retailer
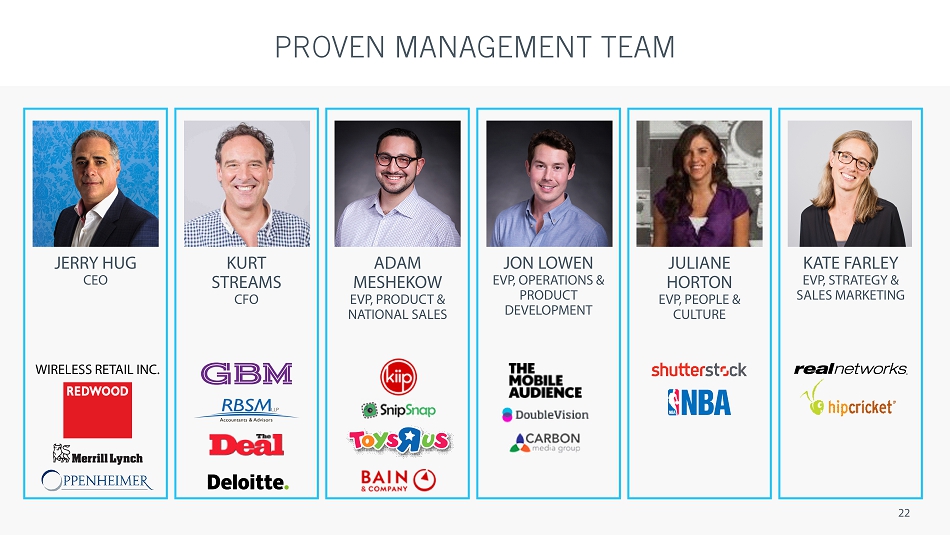
PROVEN MANAGEMENT TEAM 22 JERRY HUG CEO KURT STREAMS CFO ADAM MESHEKOW EVP, PRODUCT & NATIONAL SALES JON LOWEN EVP, OPERATIONS & PRODUCT DEVELOPMENT WIRELESS RETAIL INC. JULIANE HORTON EVP , PEOPLE & CULTURE KATE FARLEY EVP , STRATEGY & SALES MARKETING
FINANCIAL AND OPERATIONAL HIGHLIGHTS 23 Exceptionally strong, capital efficient, top line growth Diversified and growing customer base which is increasing campaign spend Significant operating leverage Scalable, technology driven business model 1 2 4 5 Superior technology driving growth in campaign volumes and average size 3
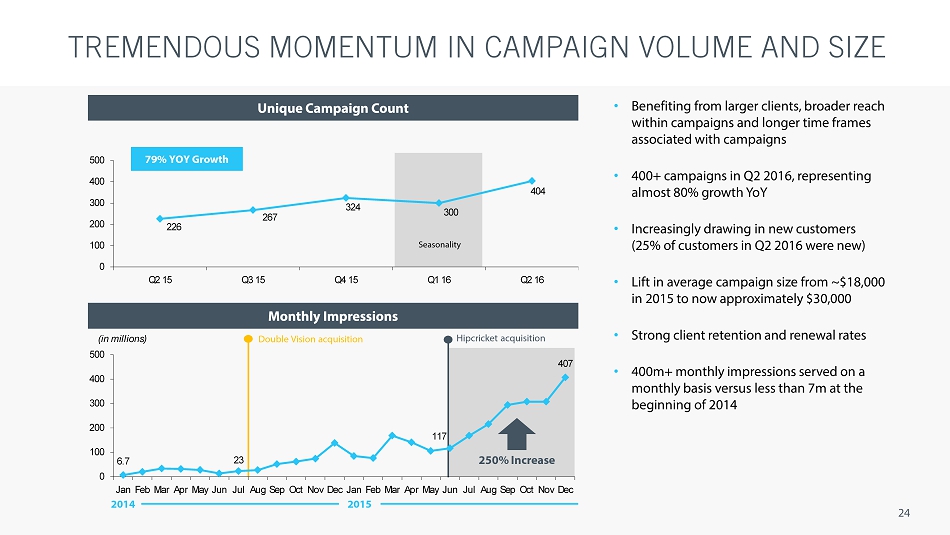
Double Vision acquisition Seasonality Monthly Impressions Unique Campaign Count TREMENDOUS MOMENTUM IN CAMPAIGN VOLUME AND SIZE 24 79% YOY Growth • Benefiting from larger clients, broader reach within campaigns and longer time frames associated with campaigns • 400+ campaigns in Q2 2016, representing almost 80% growth YoY • Increasingly drawing in new customers (25% of customers in Q2 2016 were new) • Lift in average campaign size from ~$18,000 in 2015 to now approximately $30,000 • Strong client retention and renewal rates • 400m+ monthly impressions served on a monthly basis versus less than 7m at the beginning of 2014 2014 2015 250% Increase Hipcricket acquisition 226 267 324 300 404 0 100 200 300 400 500 Q2 15 Q3 15 Q4 15 Q1 16 Q2 16 6.7 23 117 407 0 100 200 300 400 500 Jan Feb Mar Apr May Jun Jul Aug Sep Oct Nov Dec Jan Feb Mar Apr May Jun Jul Aug Sep Oct Nov Dec (in millions)
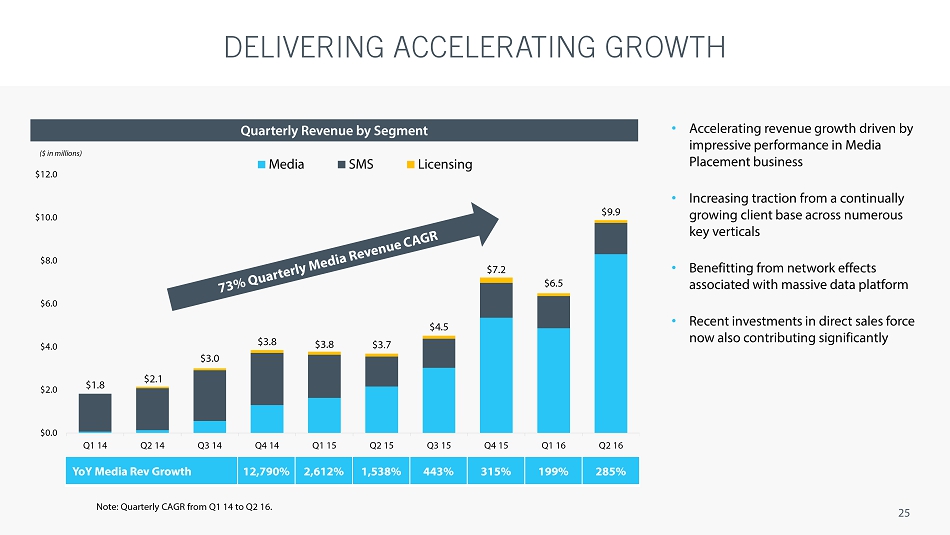
$1.8 $2.1 $3.0 $3.8 $3.8 $3.7 $4.5 $7.2 $6.5 $9.9 $0.0 $2.0 $4.0 $6.0 $8.0 $10.0 $12.0 Q1 14 Q2 14 Q3 14 Q4 14 Q1 15 Q2 15 Q3 15 Q4 15 Q1 16 Q2 16 Media SMS Licensing Quarterly Revenue by Segment DELIVERING ACCELERATING GROWTH 25 • Accelerating revenue growth driven by impressive performance in Media Placement business • Increasing traction from a continually growing client base across numerous key verticals • Benefitting from network effects associated with massive data platform • Recent investments in direct sales force now also contributing significantly YoY Media Rev Growth 12,790% 2,612% 1,538% 443% 315% 199% 285% Note: Quarterly CAGR from Q1 14 to Q2 16. ($ in millions)
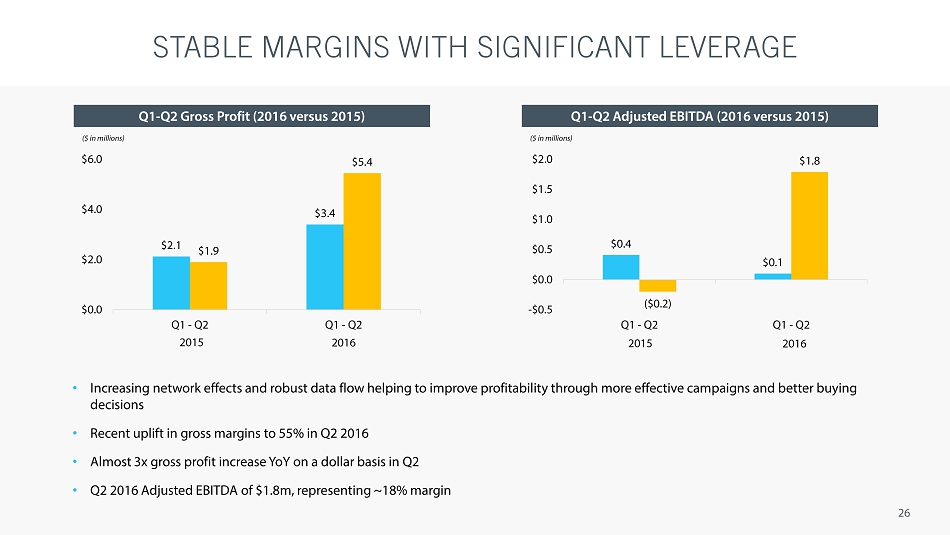
Q1 - Q2 Adjusted EBITDA (2016 versus 2015) Q1 - Q2 Gross Profit (2016 versus 2015) STABLE MARGINS WITH SIGNIFICANT LEVERAGE 26 • Increasing network effects and robust data flow helping to improve profitability through more effective campaigns and better buy ing decisions • Recent uplift in gross margins to 55% in Q2 2016 • Almost 3x gross profit increase YoY on a dollar basis in Q2 • Q2 2016 Adjusted EBITDA of $1.8m, representing ~18% margin ($ in millions) ($ in millions) $2.1 $3.4 $1.9 $5.4 $0.0 $2.0 $4.0 $6.0 Q1 - Q2 Q1 - Q2 2015 2016 $0.4 $0.1 ($0.2) $1.8 -$0.5 $0.0 $0.5 $1.0 $1.5 $2.0 Q1 - Q2 Q1 - Q2 2015 2016
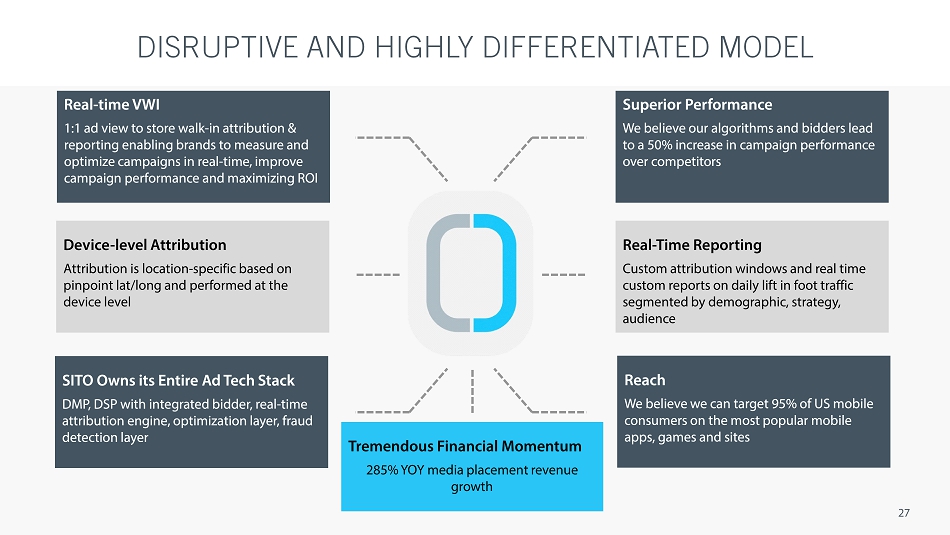
DISRUPTIVE AND HIGHLY DIFFERENTIATED MODEL 27 Real - time VWI 1:1 ad view to store walk - in attribution & reporting enabling brands to measure and optimize campaigns in real - time, improve campaign performance and maximizing ROI Device - level Attribution Attribution is location - specific based on pinpoint lat /long and performed at the device level SITO Owns its Entire Ad Tech Stack DMP, DSP with integrated bidder, real - time attribution engine, optimization layer, fraud detection layer Superior Performance We believe our algorithms and bidders lead to a 50% increase in campaign performance over competitors Reach We believe we can target 95% of US mobile consumers on the most popular mobile apps, games and sites Real - Time Reporting Custom attribution windows and real time custom reports on daily lift in foot traffic segmented by demographic, strategy, audience Tremendous Financial Momentum 285% YOY media placement revenue growth

28 APPENDIX
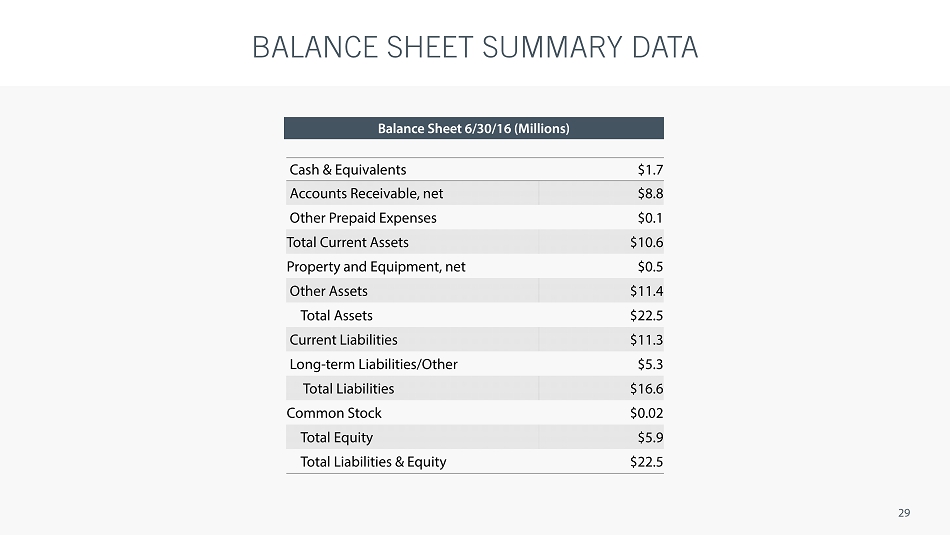
Cash & Equivalents $1.7 Accounts Receivable, net $8.8 Other Prepaid Expenses $0.1 Total Current Assets $10.6 Property and Equipment, net $0.5 Other Assets $11.4 Total Assets $22.5 Current Liabilities $11.3 Long - term Liabilities/Other $5.3 Total Liabilities $16.6 Common Stock $0.02 Total Equity $5.9 Total Liabilities & Equity $22.5 BALANCE SHEET SUMMARY DATA 29 Balance Sheet 6/30/16 (Millions)