Attached files
| file | filename |
|---|---|
| 8-K - HGR II ANNUAL SHAREHOLDER MEETING - HINES GLOBAL INCOME TRUST, INC. | hinesglobalreitii2016proxy.htm |
2016 Shareholder Meeting
Hines Global REIT II, Inc.
Sherri Schugart
President and CEO

Hines Global REIT II 2016 Shareholder Meeting
Company Overview
The offering commenced in August 2014
• Hines contributed $2 million on September 26, 2014
to break escrow
• $206.2 million of gross offering proceeds raised1
• The Advisor agreed to subsidize a portion of the Dealer Manager
Fee equal to 1.5% of gross offering proceeds in August 2016
Investment Strategy & Objectives
• Invest in a diversified portfolio of high-quality commercial real
estate
• U.S. & international for geographic diversification
• Multiple asset classes for sector diversification
• Currencies provide an additional level of diversification
• Moderate leverage
• Provide regular cash distributions
• Achieve attractive total returns upon the ultimate sale of our
investments or another liquidity event
2
Hines Interests Limited Partnership (“Hines”) is the sponsor of Hines Global REIT II, Inc. (“Hines Global REIT II”). Hines
Global REIT II Advisors LP (the “Advisor”) is the external advisor to Hines Global REIT II.
1As of September 13, 2016.
Hines Global REIT II 2016 Shareholder Meeting
Company Overview
Portfolio Summary1
5 properties totaling 1,956,331 square feet
Estimated aggregate value of $393.6 million2
98% occupied
Leverage of 50% loan-to-value with weighted average
interest rate of 2.24%1
$75 million line of credit from Hines has allowed for early
acquisitions
3
1 Data as of June 30, 2016, but includes Cottonwood Corporate Center and Goodyear Crossing II, which were acquired subsequent to June
30, 2016.
2 The estimated aggregate value of the properties was based on appraised values as of February 29, 2016 or net purchase prices for
properties acquired subsequent to February 2016.
Hines Global REIT II 2016 Shareholder Meeting
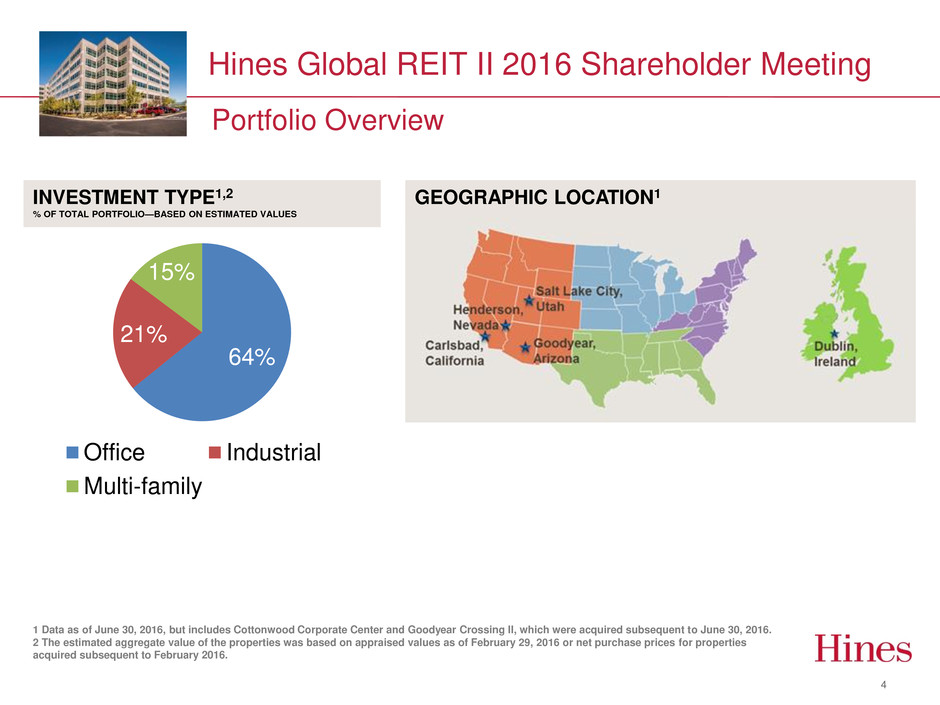
Portfolio Overview
4
64%
21%
15%
Office Industrial
Multi-family
INVESTMENT TYPE1,2
% OF TOTAL PORTFOLIO—BASED ON ESTIMATED VALUES
GEOGRAPHIC LOCATION1
1 Data as of June 30, 2016, but includes Cottonwood Corporate Center and Goodyear Crossing II, which were acquired subsequent to June 30, 2016.
2 The estimated aggregate value of the properties was based on appraised values as of February 29, 2016 or net purchase prices for properties
acquired subsequent to February 2016.
Hines Global REIT II 2016 Shareholder Meeting
Distribution Rates
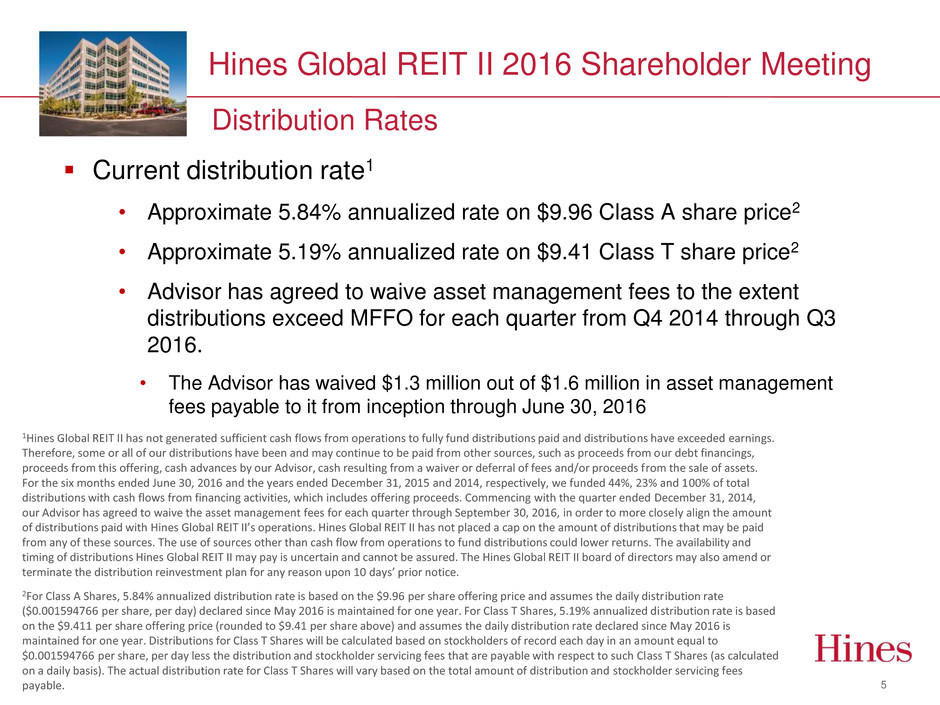
Current distribution rate1
• Approximate 5.84% annualized rate on $9.96 Class A share price2
• Approximate 5.19% annualized rate on $9.41 Class T share price2
• Advisor has agreed to waive asset management fees to the extent
distributions exceed MFFO for each quarter from Q4 2014 through Q3
2016.
• The Advisor has waived $1.3 million out of $1.6 million in asset management
fees payable to it from inception through June 30, 2016
5
1Hines Global REIT II has not generated sufficient cash flows from operations to fully fund distributions paid and distributions have exceeded earnings.
Therefore, some or all of our distributions have been and may continue to be paid from other sources, such as proceeds from our debt financings,
proceeds from this offering, cash advances by our Advisor, cash resulting from a waiver or deferral of fees and/or proceeds from the sale of assets.
For the six months ended June 30, 2016 and the years ended December 31, 2015 and 2014, respectively, we funded 44%, 23% and 100% of total
distributions with cash flows from financing activities, which includes offering proceeds. Commencing with the quarter ended December 31, 2014,
our Advisor has agreed to waive the asset management fees for each quarter through September 30, 2016, in order to more closely align the amount
of distributions paid with Hines Global REIT II’s operations. Hines Global REIT II has not placed a cap on the amount of distributions that may be paid
from any of these sources. The use of sources other than cash flow from operations to fund distributions could lower returns. The availability and
timing of distributions Hines Global REIT II may pay is uncertain and cannot be assured. The Hines Global REIT II board of directors may also amend or
terminate the distribution reinvestment plan for any reason upon 10 days’ prior notice.
2For Class A Shares, 5.84% annualized distribution rate is based on the $9.96 per share offering price and assumes the daily distribution rate
($0.001594766 per share, per day) declared since May 2016 is maintained for one year. For Class T Shares, 5.19% annualized distribution rate is based
on the $9.411 per share offering price (rounded to $9.41 per share above) and assumes the daily distribution rate declared since May 2016 is
maintained for one year. Distributions for Class T Shares will be calculated based on stockholders of record each day in an amount equal to
$0.001594766 per share, per day less the distribution and stockholder servicing fees that are payable with respect to such Class T Shares (as calculated
on a daily basis). The actual distribution rate for Class T Shares will vary based on the total amount of distribution and stockholder servicing fees
payable.
Hines Global REIT II 2016 Shareholder Meeting
Property Information – Carlsbad, CA
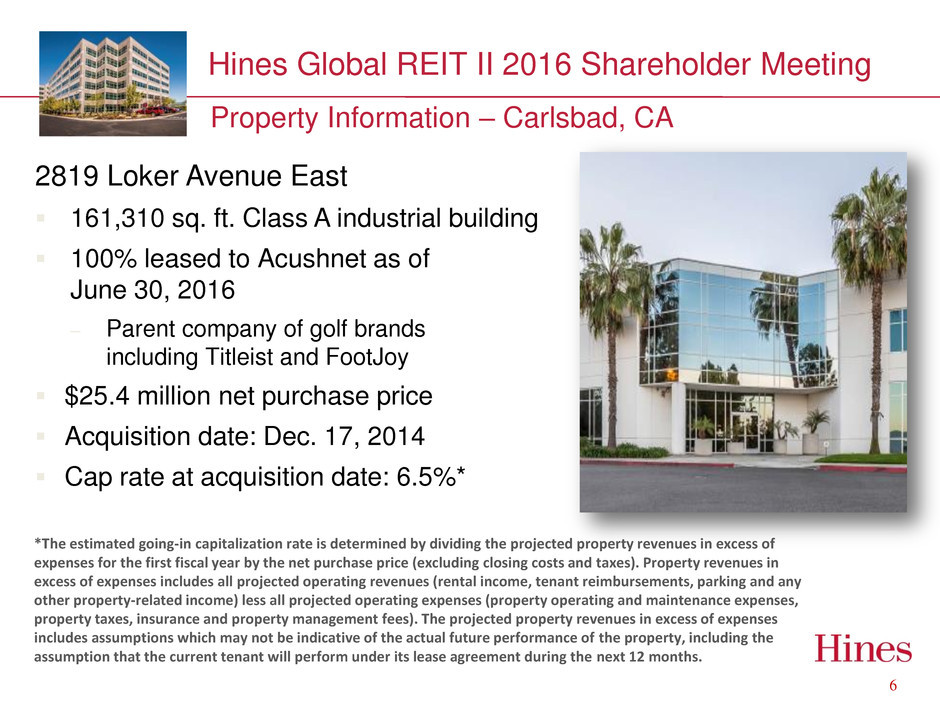
2819 Loker Avenue East
161,310 sq. ft. Class A industrial building
100% leased to Acushnet as of
June 30, 2016
– Parent company of golf brands
including Titleist and FootJoy
$25.4 million net purchase price
Acquisition date: Dec. 17, 2014
Cap rate at acquisition date: 6.5%*
*The estimated going-in capitalization rate is determined by dividing the projected property revenues in excess of
expenses for the first fiscal year by the net purchase price (excluding closing costs and taxes). Property revenues in
excess of expenses includes all projected operating revenues (rental income, tenant reimbursements, parking and any
other property-related income) less all projected operating expenses (property operating and maintenance expenses,
property taxes, insurance and property management fees). The projected property revenues in excess of expenses
includes assumptions which may not be indicative of the actual future performance of the property, including the
assumption that the current tenant will perform under its lease agreement during the next 12 months.
6
Hines Global REIT II 2016 Shareholder Meeting
Property Information – Dublin, Ireland
7
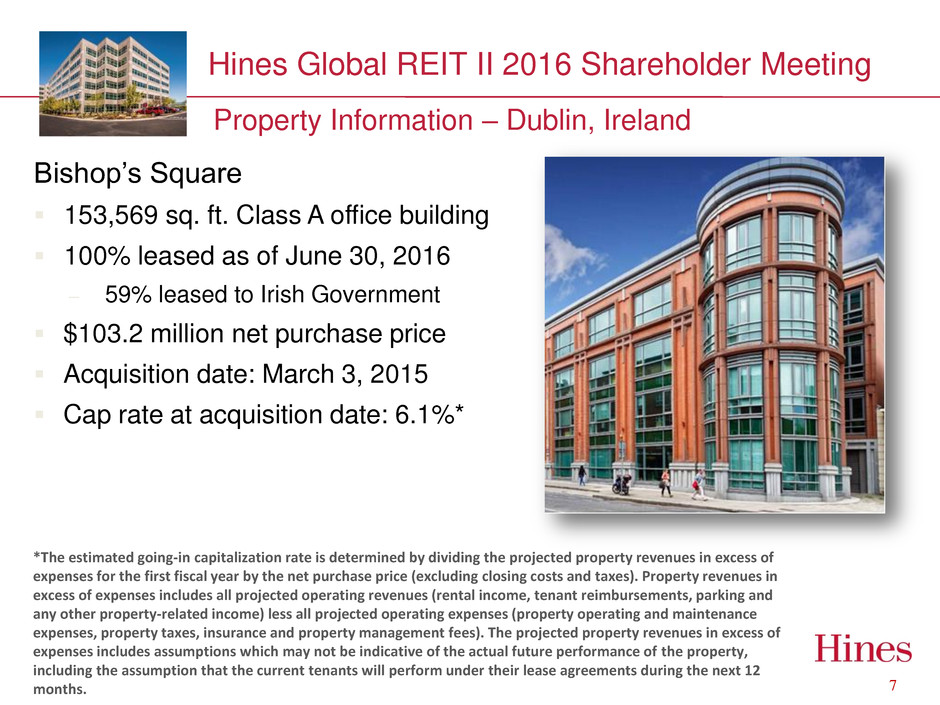
Bishop’s Square
153,569 sq. ft. Class A office building
100% leased as of June 30, 2016
– 59% leased to Irish Government
$103.2 million net purchase price
Acquisition date: March 3, 2015
Cap rate at acquisition date: 6.1%*
*The estimated going-in capitalization rate is determined by dividing the projected property revenues in excess of
expenses for the first fiscal year by the net purchase price (excluding closing costs and taxes). Property revenues in
excess of expenses includes all projected operating revenues (rental income, tenant reimbursements, parking and
any other property-related income) less all projected operating expenses (property operating and maintenance
expenses, property taxes, insurance and property management fees). The projected property revenues in excess of
expenses includes assumptions which may not be indicative of the actual future performance of the property,
including the assumption that the current tenants will perform under their lease agreements during the next 12
months.
Hines Global REIT II 2016 Shareholder Meeting
Recent Acquisition – Henderson, NV
8
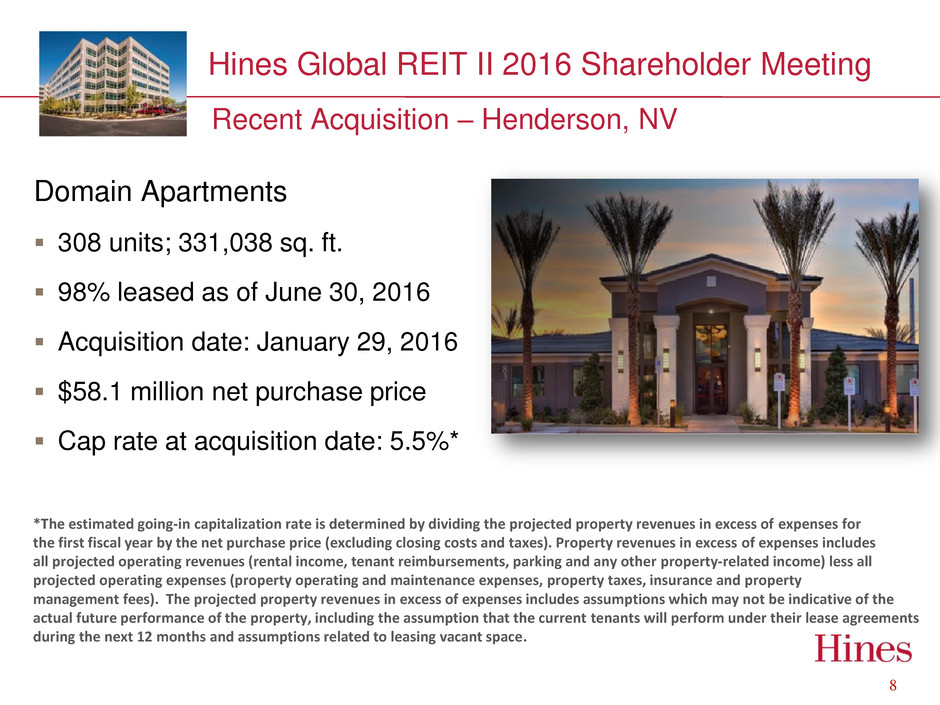
Domain Apartments
308 units; 331,038 sq. ft.
98% leased as of June 30, 2016
Acquisition date: January 29, 2016
$58.1 million net purchase price
Cap rate at acquisition date: 5.5%*
*The estimated going-in capitalization rate is determined by dividing the projected property revenues in excess of expenses for
the first fiscal year by the net purchase price (excluding closing costs and taxes). Property revenues in excess of expenses includes
all projected operating revenues (rental income, tenant reimbursements, parking and any other property-related income) less all
projected operating expenses (property operating and maintenance expenses, property taxes, insurance and property
management fees). The projected property revenues in excess of expenses includes assumptions which may not be indicative of the
actual future performance of the property, including the assumption that the current tenants will perform under their lease agreements
during the next 12 months and assumptions related to leasing vacant space.
Hines Global REIT II 2016 Shareholder Meeting
Recent Acquisition – Cottonwood Heights, UT
9
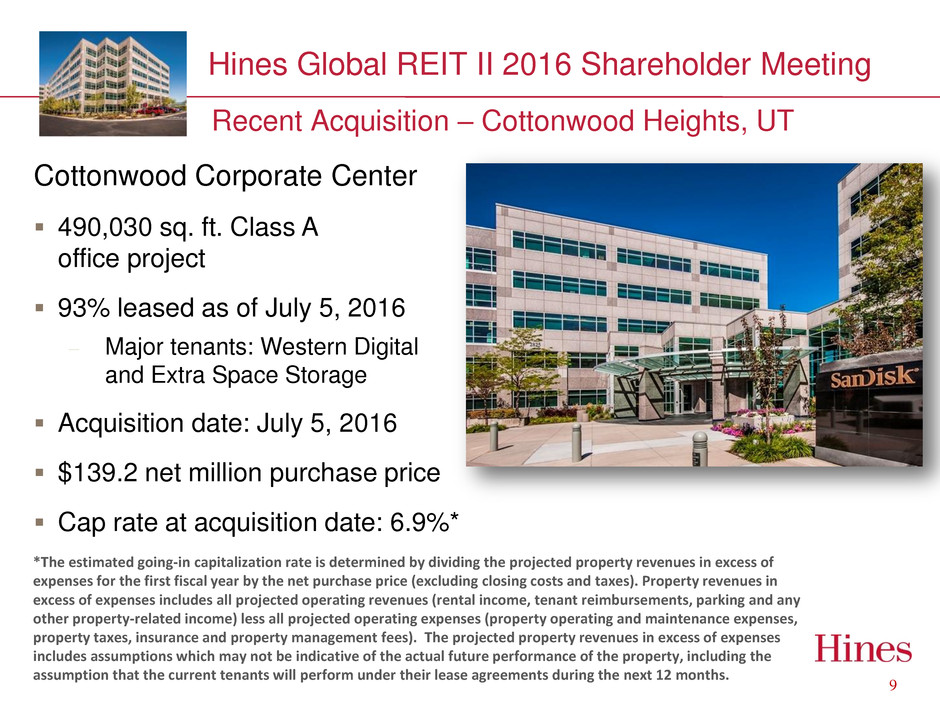
Cottonwood Corporate Center
490,030 sq. ft. Class A
office project
93% leased as of July 5, 2016
– Major tenants: Western Digital
and Extra Space Storage
Acquisition date: July 5, 2016
$139.2 net million purchase price
Cap rate at acquisition date: 6.9%*
*The estimated going-in capitalization rate is determined by dividing the projected property revenues in excess of
expenses for the first fiscal year by the net purchase price (excluding closing costs and taxes). Property revenues in
excess of expenses includes all projected operating revenues (rental income, tenant reimbursements, parking and any
other property-related income) less all projected operating expenses (property operating and maintenance expenses,
property taxes, insurance and property management fees). The projected property revenues in excess of expenses
includes assumptions which may not be indicative of the actual future performance of the property, including the
assumption that the current tenants will perform under their lease agreements during the next 12 months.
Hines Global REIT II 2016 Shareholder Meeting
Recent Acquisition – Goodyear, AZ
10
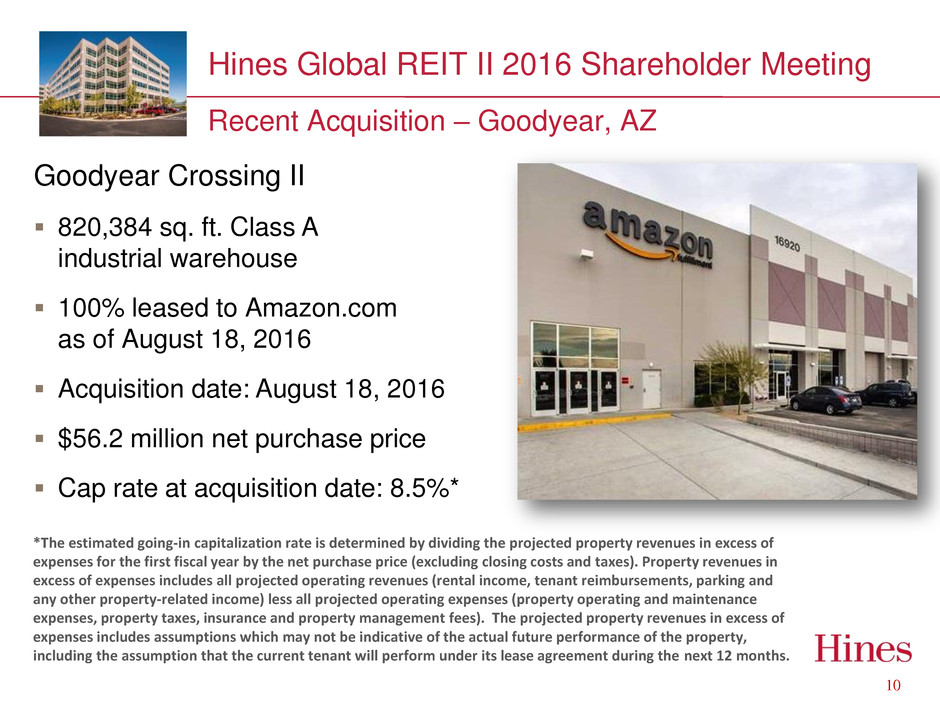
Goodyear Crossing II
820,384 sq. ft. Class A
industrial warehouse
100% leased to Amazon.com
as of August 18, 2016
Acquisition date: August 18, 2016
$56.2 million net purchase price
Cap rate at acquisition date: 8.5%*
*The estimated going-in capitalization rate is determined by dividing the projected property revenues in excess of
expenses for the first fiscal year by the net purchase price (excluding closing costs and taxes). Property revenues in
excess of expenses includes all projected operating revenues (rental income, tenant reimbursements, parking and
any other property-related income) less all projected operating expenses (property operating and maintenance
expenses, property taxes, insurance and property management fees). The projected property revenues in excess of
expenses includes assumptions which may not be indicative of the actual future performance of the property,
including the assumption that the current tenant will perform under its lease agreement during the next 12 months.
Hines Global REIT II 2016 Shareholder Meeting
11
Looking Forward
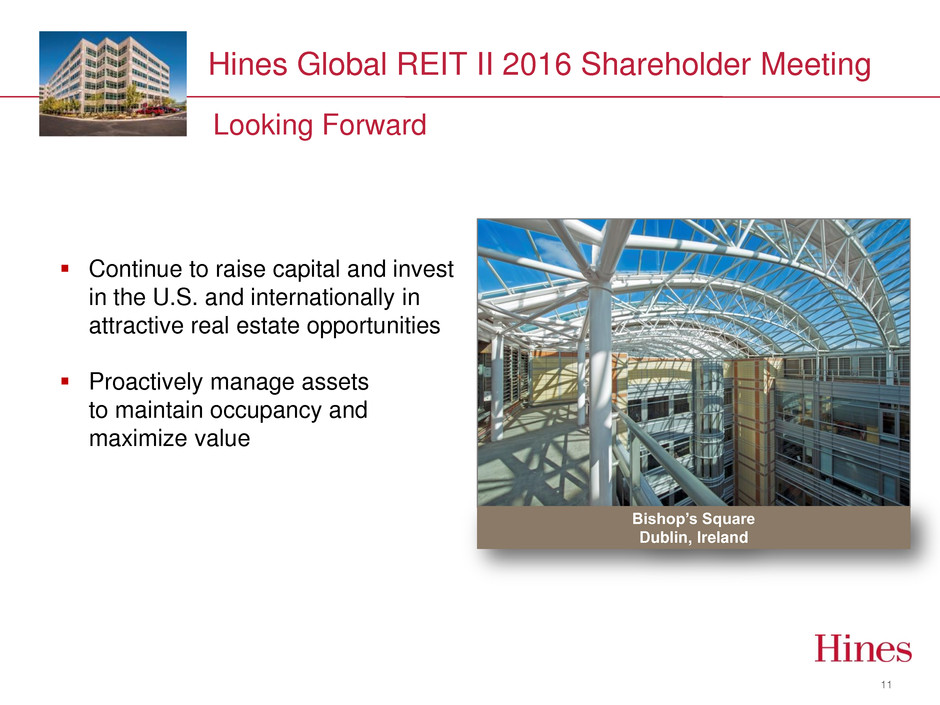
Continue to raise capital and invest
in the U.S. and internationally in
attractive real estate opportunities
Proactively manage assets
to maintain occupancy and
maximize value
Bishop’s Square
Dublin, Ireland
Hines Global REIT II 2016 Shareholder Meeting
Statements in this presentation, including but not limited to intentions, beliefs, expectations or
projections relating to distributions, occupancy levels at Hines Global REIT II’s properties, a liquidity
event, and Hines Global REIT II’s investment strategies and objectives, are forward-looking statements
within the meaning of Section 27A of the Securities Act of 1933, as amended, and Section 21E of the
Securities Exchange Act of 1934, as amended. Such statements are based on current expectations and
assumptions with respect to, among other things, future economic, competitive and market conditions
and future business decisions that may prove incorrect or inaccurate. Important factors that could cause
actual results to differ materially from those in the forward-looking statements include the risk that Hines
Global REIT II is unable to maintain the current level of distributions, the risk that Hines Global REIT II is
unable to attract new tenants or existing tenants vacate or fail to renew their leases, the risk that Hines
Global REIT II is unable to identify an exit strategy and other risks described in the “Risk Factors” section
of Hines Global REIT II’s Annual Report on Form 10-K for the year ended December 31, 2015, as amended
and supplemented by Hines Global REIT II’s other filings with the Securities and Exchange Commission.
You are cautioned not to place undue reliance on any forward-looking statements included in this
presentation.
12
