Attached files
| file | filename |
|---|---|
| EX-99.4 - EX-99.4 - Vantage Energy Inc. | a2229675zex-99_4.htm |
| EX-99.7 - EX-99.7 - Vantage Energy Inc. | a2229675zex-99_7.htm |
| EX-99.6 - EX-99.6 - Vantage Energy Inc. | a2229675zex-99_6.htm |
| EX-99.5 - EX-99.5 - Vantage Energy Inc. | a2229675zex-99_5.htm |
| EX-99.3 - EX-99.3 - Vantage Energy Inc. | a2229675zex-99_3.htm |
| EX-99.2 - EX-99.2 - Vantage Energy Inc. | a2229675zex-99_2.htm |
| EX-99.1 - EX-99.1 - Vantage Energy Inc. | a2229675zex-99_1.htm |
| EX-23.5 - EX-23.5 - Vantage Energy Inc. | a2229675zex-23_5.htm |
| EX-23.4 - EX-23.4 - Vantage Energy Inc. | a2229675zex-23_4.htm |
| EX-23.3 - EX-23.3 - Vantage Energy Inc. | a2229675zex-23_3.htm |
| EX-23.2 - EX-23.2 - Vantage Energy Inc. | a2229675zex-23_2.htm |
| EX-23.1 - EX-23.1 - Vantage Energy Inc. | a2229675zex-23_1.htm |
| EX-2.2 - EX-2.2 - Vantage Energy Inc. | a2229675zex-2_2.htm |
Use these links to rapidly review the document
TABLE OF CONTENTS
INDEX TO CONSOLIDATED FINANCIAL STATEMENTS
As filed with the Securities and Exchange Commission on September 13, 2016
Registration No. 333-
UNITED STATES SECURITIES AND EXCHANGE COMMISSION
Washington, D.C. 20549
Form S-1
REGISTRATION STATEMENT
UNDER
THE SECURITIES ACT OF 1933
VANTAGE ENERGY INC.
(Exact name of registrant as specified in its charter)
| Delaware (State or other jurisdiction of incorporation or organization) |
| 1311 (Primary Standard Industrial Classification Code Number) |
| 46-5608050 (I.R.S. Employer Identification No.) |
116 Inverness Drive East, Suite 107
Englewood, Colorado 80112
(303) 386-8600
(Address, including zip code, and telephone number, including area code, of registrant's principal executive offices)
Thomas B. Tyree, Jr.
President and Chief Financial Officer
116 Inverness Drive East, Suite 107
Englewood, Colorado 80112
(303) 386-8600
(Name, address, including zip code, and telephone number, including area code, of agent for service)
| Copies to: | ||
Douglas E. McWilliams Julian J. Seiguer Vinson & Elkins L.L.P. 1001 Fannin, Suite 2500 Houston, Texas 77002 (713) 758-2222 |
|
Matthew R. Pacey Eric M. Willis Kirkland & Ellis LLP 600 Travis Street, Suite 3300 Houston, Texas 77002 (713) 835-3600 |
Approximate date of commencement of proposed sale of the securities to the public:
As soon as practicable after the effective date of this Registration Statement.
If any of the securities being registered on this Form are to be offered on a delayed or continuous basis pursuant to Rule 415 under the Securities Act of 1933, check the following box: o
If this Form is filed to register additional securities for an offering pursuant to Rule 462(b) under the Securities Act, check the following box and list the Securities Act registration statement number of the earlier effective registration statement for the same offering. o
If this Form is a post-effective amendment filed pursuant to Rule 462(c) under the Securities Act, check the following box and list the Securities Act registration statement number of the earlier effective registration statement for the same offering. o
If this Form is a post-effective amendment filed pursuant to Rule 462(d) under the Securities Act, check the following box and list the Securities Act registration statement number of the earlier effective registration statement for the same offering. o
Indicate by check mark whether the registrant is a large accelerated filer, an accelerated filer, a non-accelerated filer, or a smaller reporting company. See the definitions of "large accelerated filer", "accelerated filer" and "smaller reporting company" in Rule 12b-2 of the Exchange Act.
| Large accelerated filer o | | Accelerated filer o | | Non-accelerated filer ý (Do not check if a smaller reporting company) |
| Smaller reporting company o |
CALCULATION OF REGISTRATION FEE
|
| | ||
| Title of Each Class of Securities to be Registered |
| Proposed Maximum Offering Price(1)(2) |
| Amount of Registration Fee(3)(4) |
|---|---|---|---|---|
Common Stock, par value $0.01 per share |
| $100,000,000 | | $10,070 |
|
||||
- (1)
- Includes
common stock issuable upon exercise of the underwriters' option to purchase additional common stock.
- (2)
- Estimated
solely for the purpose of calculating the registration fee pursuant to Rule 457(o) under the Securities Act of 1933, as
amended (the "Securities Act").
- (3)
- To
be paid in connection with the initial filing of the registration statement.
- (4)
- A registration fee of $94,182.10 for 27,082,500 shares of common stock was previously paid in connection with the filing of a registration statement on Form S-1 (File No. 333-197265) on September 15, 2014. Pursuant to Rule 457(p) under the Securities Act, such previously paid registration fee is being used to offset the total registration fee due hereunder.
The registrant hereby amends this registration statement on such date or dates as may be necessary to delay its effective date until the registrant shall file a further amendment which specifically states that this registration statement shall thereafter become effective in accordance with Section 8(a) of the Securities Act of 1933, as amended, or until this registration statement shall become effective on such date as the Securities and Exchange Commission, acting pursuant to said Section 8(a), may determine.
The information in this prospectus is not complete and may be changed. We may not sell these securities until the registration statement filed with the Securities and Exchange Commission is effective. This prospectus is not an offer to sell these securities and it is not soliciting an offer to buy these securities in any state or jurisdiction where the offer or sale is not permitted.
Subject to Completion, dated September 13, 2016
PROSPECTUS
Shares

Vantage Energy Inc.
Common Stock
This is the initial public offering of the common stock of Vantage Energy Inc., a Delaware corporation. We are offering shares of our common stock. No public market currently exists for our common stock. We are an "emerging growth company" and are eligible for reduced reporting requirements. Please see "Prospectus Summary — Emerging Growth Company Status".
We have applied to list our common stock on the New York Stock Exchange under the symbol "VEI".
We anticipate that the initial public offering price will be between $ and $ per share.
Investing in our common stock involves risks. Please see "Risk Factors" beginning on page 22 of this prospectus.
|
| Per share | | Total |
| |
| | | | | | | |
Price to the public |
| $ | | | $ | |
Underwriting discounts and commissions(1) |
| $ | | | $ | |
Proceeds to us (before expenses) |
| $ | | | $ | |
- (1)
- Please see "Underwriting" for a description of all underwriting compensation payable in connection with this offering.
We have granted the underwriters the option to purchase up to additional shares of common stock on the same terms and conditions set forth above if the underwriters sell more than shares of common stock in this offering.
Neither the Securities and Exchange Commission nor any state securities commission has approved or disapproved of these securities or passed on the adequacy or accuracy of this prospectus. Any representation to the contrary is a criminal offense.
The underwriters expect to deliver the shares on or about , 2016.
Joint Book-Running Managers
| Goldman, Sachs & Co. | | Barclays | | Credit Suisse |
| Citigroup | | J.P. Morgan | | Wells Fargo Securities |
| Senior Co-Managers | ||
BofA Merrill Lynch |
|
Capital One Securities |
| Deutsche Bank Securities | | KeyBanc Capital Markets |
| SunTrust Robinson Humphrey | | Tudor, Pickering, Holt & Co. |
| Co-Managers | ||||
ABN AMRO |
|
Baird |
|
BOK Financial Securities, Inc. |
| Fifth Third Securities | | Heikkinen Energy Advisors | | Williams Trading, LLC |
Prospectus dated , 2016
You should rely only on the information contained in this prospectus and any free writing prospectus prepared by us or on behalf of us or to the information which we have referred you. Neither we nor the underwriters have authorized anyone to provide you with information different from that contained in this prospectus and any free writing prospectus. We take no responsibility for, and can provide no assurance as to the reliability of, any other information that others may give you. We and the underwriters are offering to sell shares of common stock and seeking offers to buy shares of common stock only in jurisdictions where offers and sales are permitted. The information in this prospectus is accurate only as of the date of this prospectus, regardless of the time of delivery of this prospectus or any sale of the common stock. Our business, financial condition, results of operations and prospects may have changed since that date.
This prospectus contains forward-looking statements that are subject to a number of risks and uncertainties, many of which are beyond our control. Please see "Risk Factors" and "Cautionary Statement Regarding Forward-Looking Statements".
i
As used in this prospectus, unless the context indicates or otherwise requires, the terms listed below have the following meanings:
- •
- "Vantage", "we", "our", "us" or like terms refer collectively to our predecessor and Vantage I, together with their
consolidated subsidiaries before the completion of our corporate reorganization described in "Corporate Reorganization" (except as otherwise disclosed) and to Vantage Energy Inc. and its
consolidated subsidiaries, including Vantage I and Vantage II, as of and following the completion of our corporate reorganization;
- •
- "Vantage I" refers to Vantage Energy, LLC;
- •
- "Vantage II" refers to Vantage Energy II, LLC;
- •
- "Vantage II Alpha" refers to Vantage Energy II Alpha, LLC;
- •
- "Vantage II Consolidation" refers to the merger of Vantage II Alpha with and into Vantage II or its direct or indirect wholly owned
subsidiary that will be completed prior to our corporate reorganization;
- •
- "Vantage Investment I" refers to Vantage Energy Investment LLC;
- •
- "Vantage Investment II" refers to Vantage Energy Investment II LLC;
- •
- "Alpha Acquisition" refers to Vantage II Alpha's June 2016 acquisition of certain natural gas properties located in Greene County,
Pennsylvania from a wholly owned subsidiary of Alpha Natural Resources, Inc. ("Alpha Natural Resources");
- •
- "Existing Owners" refers, collectively, to the Sponsors and the Management Members that own equity interests in Vantage I, Vantage II
and Vantage II Alpha prior to the completion of our corporate reorganization and in Vantage Investment I, Vantage Investment II and us directly as of and following the completion of our corporate
reorganization;
- •
- "Management Members" refers, collectively, to our individual officers and employees and other individuals who, together with the
Sponsors, initially formed Vantage I, Vantage II and Vantage II Alpha;
- •
- "our predecessor" or "Predecessor" refer, collectively, to (a) Vantage II and its consolidated subsidiaries and (b) for
the periods after the closing of the Alpha Acquisition and prior to the completion of the Vantage II Consolidation, Vantage II Alpha; and
- •
- "Sponsors" refers, collectively, to investment funds affiliated with or managed by Quantum Energy Partners ("Quantum"), Riverstone Holdings LLC ("Riverstone") and Lime Rock Partners ("Lime Rock").
We have also included a glossary of some of the oil and natural gas industry terms used in this prospectus in Annex A to this prospectus.
Presentation of Financial and Operating Data
Unless otherwise indicated, the summary historical consolidated financial information presented in this prospectus is that of our predecessor. The financial information of our predecessor presented in this prospectus treats the Vantage II Consolidation as a reorganization of entities under common control. The pro forma financial information presented in this prospectus treats the combination of Vantage I and Vantage II in connection with our corporate reorganization as an acquisition in a business combination of Vantage I by our predecessor. Please see "Corporate
ii
Reorganization" and the unaudited pro forma financial statements included elsewhere in this prospectus.
In addition, unless otherwise indicated, the reserve and operational data presented in this prospectus is that of our predecessor and Vantage I on a combined basis as of the dates and for the periods presented. Unless another date is specified, (a) all acreage, well count, hedging and drilling location data presented in this prospectus is as of June 30, 2016 and (b) all other financial, reserve and operational data presented in this prospectus in respect of dates or periods occurring prior to the consummation of the Alpha Acquisition does not include the assets or operations acquired in the Alpha Acquisition. Unless otherwise noted, references to production volumes refer to sales volumes net to our interests.
Certain amounts and percentages included in this prospectus have been rounded. Accordingly, in certain instances, the sum of the numbers in a column of a table may not exactly equal the total figure for that column.
The market data and certain other statistical information used throughout this prospectus are based on independent industry publications, government publications and other published independent sources. Although we believe these third-party sources are reliable as of their respective dates, neither we nor the underwriters have independently verified the accuracy or completeness of this information. The industry in which we operate is subject to a high degree of uncertainty and risk due to a variety of factors, including those described in the section entitled "Risk Factors". These and other factors could cause results to differ materially from those expressed in these publications.
We own or have rights to various trademarks, service marks and trade names that we use in connection with the operation of our business. This prospectus may also contain trademarks, service marks and trade names of third parties, which are the property of their respective owners. Our use or display of third parties' trademarks, service marks, trade names or products in this prospectus is not intended to, and does not imply a relationship with, or endorsement or sponsorship by us. Solely for convenience, the trademarks, service marks and trade names referred to in this prospectus may appear without the ®, TM or SM symbols, but such references are not intended to indicate, in any way, that we will not assert, to the fullest extent under applicable law, our rights or the rights of the applicable licensor to these trademarks, service marks and trade names.
iii
This summary provides a brief overview of information contained elsewhere in this prospectus. You should read this entire prospectus and the documents to which we refer you before making an investment decision. You should carefully consider the information set forth under "Risk Factors", "Cautionary Statement Regarding Forward-Looking Statements" and "Management's Discussion and Analysis of Financial Condition and Results of Operations" and the historical and pro forma financial statements and the related notes to those financial statements included elsewhere in this prospectus. Where applicable, we have assumed an initial public offering price of $ per share (the midpoint of the price range set forth on the cover page of this prospectus). Unless otherwise indicated, the information presented in this prospectus assumes that the underwriters' option to purchase additional shares of common stock is not exercised. Unless otherwise indicated, the estimated reserve volumes, estimated reserve values and EURs presented in this prospectus were prepared by our independent reserve engineers based on the Securities and Exchange Commission ("SEC") pricing at December 31, 2015, as described in "— Reserve and Operating Data". Certain operational terms used in this prospectus are defined in the "Glossary of Oil and Natural Gas Terms" set forth in Annex A hereto.
Our Company
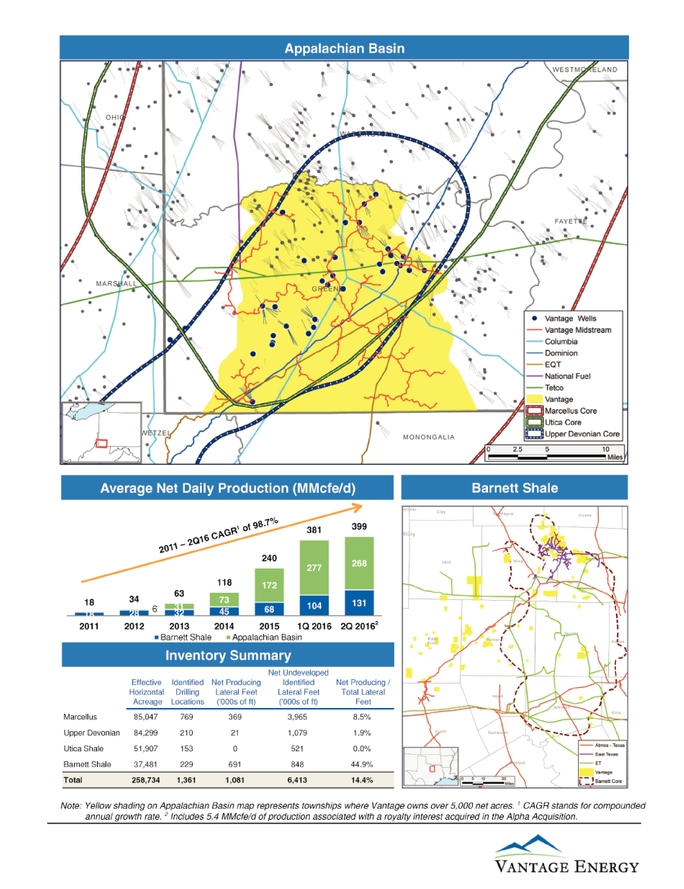
We are a growth-oriented, independent oil and natural gas company engaged in the acquisition, development, exploitation and exploration of oil and natural gas properties in the United States, with a focus on the Appalachian Basin. We are the largest leaseholder in Greene County, Pennsylvania, an area with significant dry natural gas resources and stacked reservoirs. We hold a largely contiguous acreage position in what we believe to be the core of the Marcellus, Upper Devonian and Utica Shales. Additionally, we have a sizeable position in what we believe to be the core of the Barnett Shale in Texas. We believe these areas are among the most prolific unconventional resource plays in North America, and are generally characterized by high well recoveries relative to drilling and completion costs, predictable production profiles, significant hydrocarbons in place and constructive operating environments.
We own interests in 88,634 net acres in Greene County, of which 13,642 acres are held in fee and 5,027 of such fee acres are leased to third parties. We believe that substantially all of this acreage is prospective for the Marcellus, Upper Devonian and Utica Shales. The Marcellus Shale is the largest unconventional natural gas field in the U.S. and the Upper Devonian and Utica Shales are stacked reservoirs above and below the Marcellus Shale, respectively. Based on our drilling results, as well as drilling results publicly released by other operators, we believe that the Marcellus Shale in Greene County offers some of the most attractive single-well rates of return in North America.
We own and operate midstream infrastructure in Greene County, including a natural gas gathering system with complementary water sourcing and distribution assets (see "— Midstream"). We gather all of our operated natural gas production in Greene County and believe that our system will support our future production growth. We believe that Greene County is among the best-served areas in the Appalachian Basin by current and planned infrastructure, and due to this access has the greatest potential for natural gas production growth in the Appalachian Basin. In addition to our midstream system, a number of long-haul transmission pipelines converge in Greene County, including Spectra Energy Partners' TETCo system, Dominion Resources' DTI system, Columbia Gas Transmission's T system, National Fuel Gas' Line N system and EQT Midstream's Equitrans system. The energy content of our Appalachian Basin dry natural gas production, which ranges from 1,000 to 1,060 MBtu/Mcf, enables us to capture incremental revenue on a volumetric basis, while also meeting the specifications of these long-haul transmission pipelines, thereby allowing us to avoid additional processing and blending expenses.
1
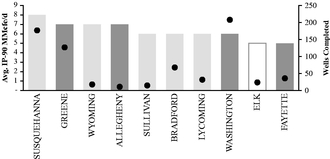
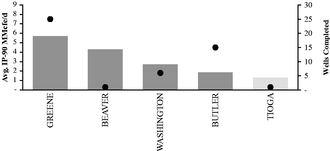
Marcellus and Upper Devonian Shale wells drilled in Greene County have on average the second highest and highest initial production ("IP") rates, respectively, of any county in Pennsylvania. Additionally, operators in Greene County recently completed multiple wells in the Utica Shale in close proximity to our acreage and disclosed 24-hour IP rates as high as 72.9 MMcfe/d. The following charts show the 90-day IP rates for wells drilled in 2015 in the Marcellus and Upper Devonian Shales by county in Pennsylvania.
| Marcellus Shale 90-Day Initial Production |
| Upper Devonian Shale 90-Day Initial Production |
|
|
|
Source: Drillinginfo
In addition to our Appalachian Basin acreage, we have 37,481 net acres in the Barnett Shale, of which 22,623 net acres are located in what we believe to be the core of the Barnett Shale in Tarrant, Denton and Wise Counties in Texas. Covering over 5,000 square miles and 18 counties in North Texas, the Barnett Shale was the first shale reservoir to be successfully exploited using horizontal drilling and fracture stimulation techniques. The Barnett Shale remains one of the most productive shale plays in North America and produced 4.4 Bcf/d of natural gas in 2015 according to the Texas Railroad Commission.
Our management team has a proven track record of implementing technically driven growth strategies to target best-in-class returns in some of the most prominent unconventional plays across the United States. Roger Biemans, our Chairman and Chief Executive Officer, and Tom Tyree, our President and Chief Financial Officer, founded our company with investments from affiliates of Quantum Energy Partners, Riverstone Holdings LLC and Lime Rock Partners. We made our initial entry into the Barnett Shale in 2007 and the Appalachian Basin in 2010. Since then, we have been committed to a strategy of disciplined growth through acquisitions and development drilling in the highest quality areas of these plays.
We efficiently exploit our resource base by applying and integrating micro-seismic technology, 3D seismic interpretation and petro-physical core analysis to define the reservoir and optimize formation targeting. This subsurface expertise translates to value maximizing inter-well spacing and highly economic development realized through best-in-class drilling, completion and operational strategies, including multi-well pad drilling, fit for purpose rig utilization, advanced down hole steering, targeted reservoir stimulation and optimized flow back practices. In addition, we have significant experience in our operating areas. We operate 80 gross horizontal wells in the Marcellus Shale, four gross horizontal wells in the Upper Devonian Shale and 185 gross horizontal wells in the Barnett Shale. We believe that our horizontal drilling and completion expertise, coupled with the favorable geologic characteristics of our Appalachian Basin and Barnett Shale acreage, positions us for continued strong well economics and growth. We have organically grown our net daily
2
production from 18 MMcfe/d for the year ended December 31, 2011 to 398.5 MMcfe/d for the three months ended June 30, 2016, representing a compounded annual growth rate of 98.7%.
The following chart shows the growth in our average net daily production in the Appalachian Basin and Barnett Shale since 2011.
Average Net Daily
Production (MMcfe/d)
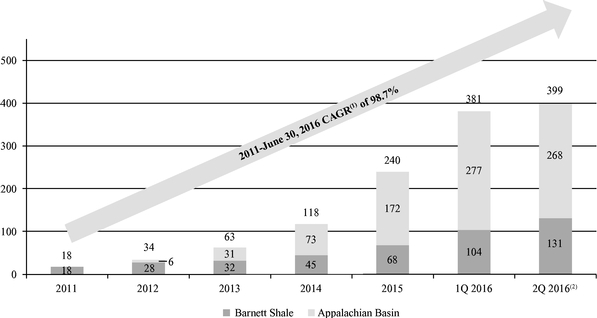
- (1)
- CAGR stands for compounded annual growth rate.
- (2)
- Includes 5.4 MMcfe/d of average daily production for the three months ended June 30, 2016 associated with a royalty interest acquired in the Alpha Acquisition.
During 2015, we ran a two rig drilling program with one rig operating in the Appalachian Basin and one rig operating in the Barnett Shale. In 2015, we completed 73 wells on our acreage, including 31 wells in the Appalachian Basin and 42 wells in the Barnett Shale. After temporarily reducing the pace of our drilling and completions activities in the first half of 2016 due to depressed commodity prices, we are currently running two rigs in the Marcellus Shale with the intention of adding a third rig in the Marcellus Shale by year end. Due to our temporary reduction in the pace of our drilling and completion activities in the first half of 2016, our average daily production in the second half of 2016 is anticipated to be lower than our average daily production in the first half of 2016. As a result of our increased drilling and completion activities in the second half of 2016, we anticipate that our average daily production in the first half of 2017 will be materially higher than our average daily production in the second half of 2016. We retain the flexibility to adjust our rig count based on the commodity price environment and other factors. As of June 30, 2016, we had 1,361 identified drilling locations, including 769 in the Marcellus Shale, 210 in the Upper Devonian Shale, 153 in the Utica Shale and 229 in the Barnett Shale.
3
Reserve and Operating Data
The following table provides information regarding our proved reserves as of December 31, 2015 and our average net daily production for the three months ended June 30, 2016.
|
| Estimated Proved Reserves(1)(2) | | Average Net Daily |
| ||||||||||||||||||||||||||
| | | | | | | | | | | | | | | | | ||||||||||||||||
|
| Natural Gas (Bcf) |
| NGLs (MMBbls) |
| Oil (MMBbls) |
| Total (Bcfe) |
| % Proved Developed |
| Production (MMcfe/d)(3) |
| ||||||||||||||||||
| | | | | | | | | | | | | | | ||||||||||||||||||
Marcellus Shale |
| | 1,220 | | | | — | | | | — | | | | 1,220 | | | | 38 | % | | | 259.8 | | | ||||||
Upper Devonian Shale |
| | 63 | | | | — | | | | — | | | | 63 | | | | 26 | % | | | 8.2 | | | ||||||
| | | | | | | | | | | | | | | ||||||||||||||||||
Total Appalachian Basin |
| | 1,283 | | | | — | | | | — | | | | 1,283 | | | | 38 | % | | | 268.0 | | | ||||||
Barnett Shale(4) |
| | 472 | | | | 24 | | | | 1 | | | | 622 | | | | 46 | % | | | 130.5 | | | ||||||
| | | | | | | | | | | | | | | ||||||||||||||||||
Total |
| | 1,755 | | | | 24 | | | | 1 | | | | 1,905 | | | | 40 | % | | | 398.5 | | | ||||||
| | | | | | | | | | | | | | | ||||||||||||||||||
| | | | | | | | | | | | | | | | | | | | | | | | | | | ||||||
| | | | | | | | | | | | | | | ||||||||||||||||||
- (1)
- Our
estimated proved reserves were determined using average first-day-of-the-month prices for the prior 12 months in accordance with
SEC guidance. As of December 31, 2015, the unweighted arithmetic average first-day-of-the-month prices for the prior 12 months (the "SEC Price Deck") were $2.59/Mcf for natural gas,
$16.22/Bbl for NGLs and $50.28/Bbl for oil, representing the prices for Henry Hub natural gas, Mont Belvieu NGLs, and WTI oil, respectively. In determining our reserves, the SEC Price Deck was
adjusted by field or lease for quality, transportation fees, regional price differentials and other factors affecting the price received at the wellhead. The corresponding natural gas prices proximate
to our operating areas were $1.39/Mcf and $2.47/Mcf for Dominion South Point and WAHA, respectively. There were no proved reserves associated with our Utica Shale acreage as of December 31,
2015.
- (2)
- The
reserve data presented is that of Vantage II and Vantage I on a combined basis as of December 31, 2015, assuming a
30-year reserve life.
- (3)
- Includes
5.4 MMcfe/d of average daily production for the three months ended June 30, 2016 associated with a royalty interest
acquired in the Alpha Acquisition.
- (4)
- Includes de minimis reserves and production attributable to our other properties.
The following table provides certain information regarding our Appalachian Basin and Barnett Shale assets and operations as of June 30, 2016 except as otherwise noted.
|
| Effective Horizontal Acreage(1) |
| Identified Drilling Locations(2) |
| Net Producing Lateral Feet(3) (in thousands) |
| Net Undeveloped Identified Lateral Feet(4) (in thousands) |
| Net Producing/ Total Lateral Feet(3)(5) |
| Weighted Average Working Interest |
| Weighted Average Net Revenue Interest(6) |
| Average PUD EUR per 1,000 Feet(7) (Bcfe) |
| Average PUD D&C per 1,000 Feet(8) (in thousands) |
| |||||||||||||||||||||||||||
| | | | | | | | | | | | | | | | | | | | | |||||||||||||||||||||||||||
Appalachian Basin |
| | | | | | | | | | | | | | | | | | | | | | | | | | | | ||||||||||||||||||
Marcellus Shale |
| | 85,047 | | | | 769 | | | | 369 | | | | 3,965 | | | | 8.5 | % | | | 81.7 | % | | | 68.7 | % | | | 1.93 | | | | $ | 834 | | | ||||||||
Upper Devonian Shale |
| | 84,299 | | | | 210 | | | | 21 | | | | 1,079 | | | | 1.9 | % | | | 80.4 | % | | | 67.5 | % | | | 1.58 | | | | 738 | | | |||||||||
Utica Shale |
| | 51,907 | | | | 153 | | | | — | | | | 521 | | | | 0.0 | % | | | 58.8 | % | | | 50.9 | % | | | — | | | | — | | | |||||||||
Barnett Shale |
| | 37,481 | | | | 229 | | | | 691 | | | | 848 | | | | 44.9 | % | | | 68.0 | % | | | 52.8 | % | | | 1.03 | | | | 428 | | | |||||||||
| | | | | | | | | | | | | | | | | | | | | | | | | | | | | | | |||||||||||||||||
Total |
| | 258,734 | (9) | | | 1,361 | | | | 1,081 | | | | 6,413 | | | | 14.4 | % | | | 76.6 | %(10) | | | 63.9 | %(10) | | | | | | | | |||||||||||
| | | | | | | | | | | | | | | | | | | | | | | | | | | | | | | |||||||||||||||||
| | | | | | | | | | | | | | | | | | | | | | | | | | | | | | | | | | | | | | | |||||||||
| | | | | | | | | | | | | | | | | | | | | | | | | | | | | | | |||||||||||||||||
- (1)
- We
refer to the summation of our horizontal acreage across the multiple target formations as our "Effective Horizontal Acreage". We believe
this acreage metric more accurately conveys our horizontal drilling opportunities in our target formations than our total surface acreage, and we believe our analysis of engineering, geological,
geochemical and seismic data to estimate our horizontal drilling opportunities is based on industry standards. Our calculation of our Effective Horizontal Acreage is an inexact estimate. We cannot
represent that the Effective Horizontal Acreage in each of our target formations is prospective for such formation. Additionally, we cannot represent what portion of our Effective Horizontal Acreage
will ultimately be drilled. See "Risk Factors — Risks Related to Our Business — Our Effective Horizontal Acreage is based on our and other operators' current
drilling results and our interpretation of available geologic and engineering data and therefore is an inexact estimate subject to various uncertainties". In the Appalachian Basin, 13,642 net acres
are held in fee and 5,027 of such fee acres are leased to third parties.
- (2)
- Includes
84, 6 and 112 identified drilling locations associated with proved undeveloped reserves as of December 31, 2015 on our
Marcellus Shale, Upper Devonian Shale and Barnett Shale acreage, respectively. For a discussion of how we identify drilling locations, a portion of which constitute estimated locations based on our
acreage and spacing assumptions, please see "Business — Our Operations — Reserve Data — Determination of Identified Drilling Locations".
- (3)
- Net
Producing Lateral Feet is calculated by multiplying the working interest for each of our producing wells in a reservoir by the lateral
length of such well.
- (4)
- Net undeveloped identified lateral feet is calculated by multiplying the working interest for each of our identified drilling locations in a reservoir by the expected lateral length of such identified drilling location. The average lateral length for our identified drilling locations is 6,345, 6,447, 5,777 and 5,448 feet for the Marcellus, Upper Devonian, Utica and Barnett Shales, respectively.
4
- (5)
- Total
Lateral Feet is calculated by adding Net Producing Lateral Feet and Net Undeveloped Identified Lateral Feet in a reservoir. Management
believes that the ratio of Net Producing Lateral Feet to Total Lateral Feet is useful because it provides investors a method for evaluating the estimated future production associated with our
identified drilling locations.
- (6)
- Represents
the average net revenue interest associated with our weighted average working interest in our drilling locations. Our average net
revenue interest equals our working interest percentage multiplied by the net revenue interest.
- (7)
- Represents
the average EUR per 1,000 feet of horizontal lateral associated with the proved undeveloped reserves reflected in our
reserve reports as of December 31, 2015, which assumed a 30-year reserve life.
- (8)
- Represents
the expected average drilling and completion cost per 1,000 feet of horizontal lateral (in thousands), as reviewed by our
third-party auditors, associated with the proved undeveloped reserves reflected in our reserve report as of December 31, 2015, which assumed a 30-year reserve life.
- (9)
- Effective
Horizontal Acreage is represented in multiple stacked reservoirs and therefore represents a multiple of our total acreage. This
acreage metric represents what we believe to be our combined horizontal acreage position that is prospective for hydrocarbon production underneath our total surface acreage. Our total net surface
acreage in the Appalachian Basin and the Barnett Shale as of June 30, 2016, was 88,634 acres and 37,481 acres, respectively.
- (10)
- Represents a weighted average calculated using the number of identified drilling locations in the respective reservoir.
Midstream
We own and operate midstream infrastructure in Greene County, including a natural gas gathering system with complementary water sourcing and distribution assets. We believe our ownership of this midstream infrastructure allows us to reduce our costs, promote overall efficiency of operations and increase our rates of return. We gather all of our operated natural gas production in Greene County and believe that our system will support our future production growth. We also intend to seek out commercial third-party gathering and water opportunities on our system.
Our natural gas gathering infrastructure currently has a demonstrated throughput capacity of over 400 MMcf/d and includes approximately 30 miles of gathering pipeline and 7,100 horsepower of compression. For the six months ended June 30, 2016, gross throughput on our midstream system was 325 MMcf/d, 59 MMcf/d of which was attributable to our joint venture partner's interest in the system, representing a 63% increase from the corresponding period in 2015. Our midstream segment generated pro forma Midstream Segment Adjusted EBITDA of $22.4 million for the six months ended June 30, 2016, compared to $12.5 million for the corresponding period in 2015.
Our natural gas gathering system is designed to grow to an ultimate total throughput capacity of approximately 1,800 MMcf/d with 147 miles of pipeline and 145,000 horsepower of compression. We intend to expand our existing system over time to meet our expected production growth, including increasing our throughput capacity to approximately 600 MMcf/d by 2018 and approximately 1,000 MMcf/d by 2022. Our water sourcing and distribution system is designed for a total supply of 118,000 Bbls/d. We expect the buildout of our water sourcing and distribution system to accommodate the expected future growth of our development activities.
We do not currently own or operate midstream infrastructure in the Barnett Shale and rely on third-party service providers for the gathering of our production in that basin.
Marketing
We routinely manage our commodity and regional price risk through hedging arrangements, firm marketing agreements and active analysis of primary and secondary firm transportation opportunities. As part of our marketing activities, we continually review regional supply and demand fundamentals with a focus on current and forecasted long-haul pipeline utilization. In addition to the numerous takeaway capacity alternatives currently available to producers in Greene County, we believe that planned takeaway capacity additions of approximately 17 Bcf/d expected to come online by December 2018 will be sufficient to meet expected supply growth from producers in and around Greene County for the foreseeable future. Significant new takeaway projects include Tallgrass Energy's Rockies Express Zone 3 Capacity Enhancement, Energy Transfer's Rover Pipeline, Nexus Gas Transmission, Spectra Energy Partners' TETCo Gulf Markets Expansion, multiple Columbia Pipeline Group projects, Dominion Resources' Atlantic Coast Project and EQT's Mountain Valley Pipeline. See "Business — Our Properties — Midstream — Marketing".
5
The following table provides a summary of our hedge position as of July 31, 2016:
Commodity Swaps |
| Aug. – Dec. 2016 |
| 2017 |
| 2018 |
| 2019 |
| ||||||
Natural Gas |
| | | | | | | ||||||||
Waha Fixed Price (MMBtu/d) |
| | 85,000 | | | 56,507 | | 22,397 | | 9,137 | | ||||
Waha Fixed Price ($/MMBtu) |
| | $2.97 | | | $3.07 | | $3.01 | | $3.29 | | ||||
Dominion South Point Fixed Price (MMBtu/d) |
| | 215,209 | | | 200,000 | | 147,260 | | 27,260 | | ||||
Dominion South Point Fixed Price ($/MMBtu) |
| | $2.10 | | | $2.26 | | $2.30 | | $2.58 | | ||||
NGLs (bbl/d) |
| | 1,499 | | | 500 | | — | | — | | ||||
Mt. Belvieu ($/bbl) |
| | $16.78 | | | $15.13 | | $0.00 | | $0.00 | | ||||
Oil (bbl/d) |
| | 85 | | | 50 | | — | | — | | ||||
NYMEX WTI ($/bbl) |
| | $45.66 | | | $44.60 | | $0.00 | | $0.00 | | ||||
- (1)
- Represents the average daily volume of such commodity swaps during the indicated periods. These hedged volumes are not allocated evenly over the periods presented.
Capital Program
Our 2016 capital program is primarily focused on developing low-cost, high-return drilling and midstream opportunities in order to grow production and cash flow.
We are currently running two rigs in the Marcellus Shale with the intention of adding a third rig in the Marcellus Shale by year end, and we retain the flexibility to adjust our rig count based on the commodity price environment and other factors.
For the months ended December 31, 2017, we plan to invest up to $ million in capital expenditures as follows:
|
| Base(1) |
| |
Drilling and Completion |
| $ | | |
Number of Wells Drilled and Cased |
| | ||
Leasehold Acquisitions |
| $ | | |
Midstream |
| $ | | |
| | | | | |
Total |
| $ | | |
| | | | | |
| | | | | |
| | | | | |
- (1)
- Assumes a third rig will be added in the Appalachian Basin during the three months ended .
By operating the substantial majority of our acreage, the amount and timing of these capital expenditures is largely discretionary and within our control. We could choose to defer a portion of these planned capital expenditures depending on a variety of factors, including but not limited to the success of our drilling activities, prevailing and anticipated prices for natural gas, NGLs and oil, the availability of necessary equipment, infrastructure and capital, the receipt and timing of required regulatory permits and approvals, seasonal conditions and drilling and acquisition costs. Any reduction in our capital expenditure budget could have the effect of delaying or limiting our development program, which would negatively impact our ability to grow production and could materially and adversely affect our future business, financial condition, results of operations or liquidity.
6
Business Strategy
Our strategy is to leverage our management team's experience in identifying, acquiring and developing economic natural gas and oil resources to cost efficiently grow our reserves, production and cash flow and thus maximize the value of our assets. Our strategy has the following principal elements:
- •
- Growing shareholder value through optimizing development of our extensive drilling
inventory. We began our Barnett Shale development program in 2008 and our Appalachian Basin development program in 2011, and we have
increased production from 18 MMcfe/d for the year ended December 31, 2011 to approximately 398.5 MMcfe/d for the three months ended June 30, 2016. We intend to continue to
drill and develop our portfolio of 1,361 identified drilling locations with the goal of growing production, cash flow and reserves in an economically efficient manner in order to maximize shareholder
value. We are currently running two rigs in the Marcellus Shale with the intention of adding a third rig in the Marcellus Shale by year end, and we retain the flexibility to adjust our rig count based
on the commodity price environment and other factors.
- •
- Enhancing returns by focusing on capital and operating cost
efficiencies. We target best-in-class returns in the Appalachian Basin and Barnett Shale. As the operator of the substantial majority of
our acreage, we are able to manage the timing and level of our capital spending, our exploration and development strategies and our operating costs. We aim to maximize well production and recoveries
relative to drilling and completion costs through optimizing lateral length, the number and distribution of frac stages, perforation cluster spacing and the type of fracture stimulation employed. We
believe we have distinctive competencies in managing costs, and as a result, we believe we will continue to capture incremental capital and operating cost efficiencies.
- •
- Continue growing our acreage position in the core of the Appalachian Basin through opportunistic leasing and
acquisitions. We have selectively built our Appalachian Basin position from less than 200 net acres as of December 31, 2010 to
approximately 88,634 net acres, of which 13,642 acres are held in fee and 5,027 of such fee acres are leased to third parties. We believe that the Appalachian Basin continues to have
significant expansion and consolidation opportunities, and we intend to pursue transactions that meet our strategic and financial objectives, such as our recent 31,323 net acre acquisition from Alpha
Natural Resources. We are currently focused on acreage swaps and infill lease acquisitions that we believe will further consolidate our acreage, increase net lateral lengths and result in operational
efficiencies.
- •
- Utilizing our midstream infrastructure to support upstream operations and enhance access to markets for our natural gas
production. The midstream infrastructure we own and operate in Greene County gathers all of our operated natural gas production in the
Appalachian Basin. Going forward, we expect to continue to invest in our Greene County gas gathering and water systems to (i) optimize our gathering and takeaway capacity, including access to
interstate pipelines, (ii) support our expected production growth, (iii) provide greater control over the direction and planning of our drilling schedule, (iv) achieve lower
capital and operating costs and generate overall efficiencies and (v) provide gathering and water services to third parties.
- •
- Managing commodity price exposure through an active hedging and marketing program to protect our expected future cash flows. We maintain an active commodity price risk management program through hedging, firm marketing arrangements and continuing analysis of primary and secondary firm transportation opportunities. We have historically hedged through basis using primarily fixed price swap contracts at liquid pricing
7
benchmarks to reduce our exposure to price volatility in the underlying commodity as well as regional pricing differentials.
Business Strengths
We have a number of strengths that we believe will help us successfully execute our business strategy and grow stockholder value, including:
- •
- Large and highly contiguous land position in the core of the Appalachian
Basin. Since 2010, we have built a largely contiguous acreage position of 88,634 net acres in the Appalachian Basin through a
disciplined and focused leasing and acquisition program. We are the largest leaseholder in Greene County, which we believe to be the dry natural gas core of the Marcellus, Upper Devonian and Utica
Shales. We benefit from our concentrated, core position through our high net revenue interest and operational efficiencies. We believe our Marcellus Shale acreage offers some of the most attractive
single-well rates of return in North America.
- •
- Multi-year, low-risk drilling inventory. We believe our
concentrated acreage positions in the Appalachian Basin and Barnett Shale are well delineated, characterized by low geological risk and possess repeatable drilling opportunities that we expect will
result in a predictable production growth profile. As of June 30, 2016, we had 1,361 identified drilling locations, including 769 in the Marcellus Shale, 210 in the Upper Devonian Shale, 153 in
the Utica Shale and 229 in the Barnett Shale. Assuming a two rig program, our drilling inventory is approximately 22 years based on our Marcellus Shale locations and approximately
32 years when including our Upper Devonian and Utica Shale locations. We believe that we and other operators in the area have substantially delineated and de-risked our acreage position in the
Marcellus and Barnett Shales. Likewise, we believe the drilling activity and well results of other operators in the area have substantially reduced the risk associated with our drilling locations in
the Upper Devonian and Utica Shales.
- •
- Efficient operations drive low drilling and completion costs resulting in higher
returns. We have historically had an intense focus on managing costs which has translated into meaningful reductions in our overall
drilling and completion costs. We have implemented operational efficiencies to continue lowering our costs, such as pad drilling and the use of less expensive, shallow vertical drilling rigs to drill
to the kick-off point of the horizontal wellbore, and optimized well spacing and completion designs. Our average drilling and completion cost, normalized for each 1,000 feet of horizontal
lateral, decreased by 38% for the first half of 2016 compared to the three months ended December 31, 2014.
- •
- Exceptionally low operating cost structure with significant control across our acreage position. Our acreage position in the Appalachian Basin and Barnett Shale is generally in contiguous blocks which allows us to conduct our operations more cost effectively and develop this acreage more efficiently. Additionally, our operational control allows us to more efficiently manage the pace of development activities, the gathering and marketing of our production and operating costs. We are continually looking to increase efficiencies and decrease our operating cost structure and were able to achieve a lease operating expense per Mcfe of $0.13 for the three months ended June 30, 2016, a reduction of 66% compared to the three months ended December 31, 2014. This reduction was largely attributable to a shift toward recycling substantially all of our produced water in Greene County. Our company, which was comprised of just 63 employees at December 31, 2015, managed total production of 398.5 MMcfe/d for the three months ended June 30, 2016 and deployed $354 million in capital expenditures during the year ended December 31, 2015. Our general and
8
- •
- Strategic, efficient midstream infrastructure supports production growth and access to
markets. We gather all of our operated natural gas production in Greene County, and the concentrated nature of our stacked pay acreage
in that area allows us to build out and operate our midstream infrastructure in a manner that captures significant capital and operating cost efficiencies. For the three months ended
December 31, 2014 and June 30, 2016, our midstream operating expense was approximately $0.04 per Mcf based on our Appalachian Basin throughput volumes. Additionally, our natural gas
gathering system is strategically located with interconnections to multiple downstream pipeline systems including TETCo and Dominion interstate pipelines.
- •
- Complementary position in the core of the Barnett
Shale. We have assembled a large and attractive leasehold position of approximately 37,481 net acres in the Barnett Shale, including
approximately 22,623 net acres in Tarrant, Denton, and Wise Counties in Texas, which we believe constitute the core of the Barnett Shale. Our Barnett Shale acreage position is characterized by mature,
long-lived production profiles that provides us with access to multiple markets and favorable WAHA-based pricing.
- •
- Strong commodity price risk management protects capital
investment. Our focus on commodity price risk management through hedging, firm marketing agreements and firm transportation
opportunities protects our capital investment and future cash flows by reducing exposure to commodity prices. As of July 31, 2016, we had entered into hedging contracts through
December 31, 2019 covering approximately 219 TBtu of future natural gas, NGLs and oil production. Substantially all of the natural gas hedges are linked to Dominion South Point and WAHA
price indices, consistent with the pricing we receive for our natural gas production. The weighted average prices of our WAHA and Dominion South Point natural gas hedges are $3.04 and $2.26 per MMbtu,
respectively. Inclusive of our NGLs and oil hedges, the weighted average price of our hedging contracts was $2.43 per MMbtu.
- •
- Significant liquidity and financial
flexibility. Following the completion of this offering, we estimate that we will have availability under our new revolving credit
facility of approximately $ million and $ million of cash on hand. After giving
effect to this offering, we expect that our capital expenditures through
2017 will be fully funded with proceeds from this offering, cash flows from operations and available capacity under our new revolving credit facility, consistent with our overall financial strategy of
maintaining a strong and stable capitalization profile.
- •
- Proven, experienced and incentivized management and technical teams. We believe our management team's experience and expertise across multiple resource plays provides a distinct competitive advantage. Our management team has an average of over 25 years of industry experience including executive officer positions at public exploration and production companies and key members with significant experience operating in the Appalachian Basin and Barnett Shale. We have assembled a strong technical staff of engineers, geoscientists and field operations managers with extensive experience in horizontal development and operating multi-rig development programs. We have been early adopters of new oilfield service technologies and techniques for drilling and completions. Our management and technical teams have a significant economic interest in us through their interests in our controlling stockholders, Vantage Investment I and Vantage Investment II.
administrative expense per Mcfe was $0.12 for the three months ended June 30, 2016, a reduction of 52% compared to $0.25 for the three months ended December 31, 2014.
9
Recent Developments
Alpha Acquisition
On May 16, 2016, we entered into a purchase and sale agreement with a wholly owned subsidiary of Alpha Natural Resources to purchase certain natural gas properties located in Greene County (the "Alpha Properties") for cash consideration of $339.5 million, subject to post-closing adjustment (the "Alpha Acquisition"). The Alpha Properties consist of approximately 31,323 net acres, of which 5,027 acres are held in fee and leased to third parties, along with non-operating royalty interests in 42 producing Marcellus horizontal wells and certain related midstream and other assets. The Alpha Acquisition was completed in June 2016, with an effective date of April 1, 2016. The Alpha Acquisition added 330 identified drilling locations, including 226 in the Marcellus Shale, 72 in the Upper Devonian Shale and 32 in the Utica Shale.
Midstream Acquisition
We entered into two purchase and sale agreements (the "AMS Purchase Agreements") with Appalachia Midstream Services, L.L.C. ("Seller") to purchase certain midstream assets in Greene County (the "AMS Acquisition"). The AMS Acquisition consists of the remaining 62% interest not currently owned in the Rogersville Gas System and a 67.5% interest in the Wind Ridge Gathering System.
The aggregate purchase price was $50.0 million in cash and the AMS Purchase Agreement contains customary representations and warranties, covenants and indemnification provisions, and has an effective date of April 1, 2016. We and the Seller expect to close the AMS Acquisition in the third quarter of 2016.
Risk Factors
An investment in our common stock involves a number of risks that include the speculative nature of oil and natural gas exploration, competition, volatile commodity prices and other material factors. You should carefully consider, in addition to the other information contained in this prospectus, the risks described in "Risk Factors" before investing in our common stock. These risks could materially affect our business, financial condition and results of operations and cause the trading price of our common stock to decline. You could lose part or all of your investment. You should bear in mind, in reviewing this prospectus, that past experience is no indication of future performance. You should read "Cautionary Statement Regarding Forward-Looking Statements" for a discussion of what types of statements are forward-looking statements, as well as the significance of such statements in the context of this prospectus.
Corporate Reorganization
We have incorporated under the laws of the State of Delaware to become a holding company for Vantage's assets and operations. Vantage I was founded in December 2006 with equity commitments from affiliates of Quantum, Riverstone and Lime Rock, as well the Management Members. Subsequently, Vantage II was founded in July 2012 with equity commitments from affiliates of those same Sponsors and the Management Members. The Vantage II Consolidation will occur prior to our corporate reorganization described below.
Pursuant to the terms of a corporate reorganization that will be completed simultaneously with the closing of this offering, (i) Vantage I and Vantage II will merge into subsidiaries of newly-formed holding companies, Vantage Investment I and Vantage Investment II, that will be owned by the Existing Owners in equal proportions to their current ownership of Vantage I and Vantage II and (ii) Vantage Investment I and Vantage Investment II will contribute all of the interests in Vantage I
10
and Vantage II to us in exchange for all of our issued and outstanding shares of common stock (prior to the issuance of shares of common stock in this offering). Following this offering, Vantage Investment I and Vantage Investment II will distribute to the Management Members a portion of the shares of common stock associated with such Management Members' initial investments in Vantage I and Vantage II, who will then hold the shares of common stock directly. As a result of the reorganization, Vantage I and Vantage II will become direct, wholly owned subsidiaries of Vantage Energy Inc.
We were incorporated to serve as the issuer in this offering and have no previous operations, assets or liabilities. As a result, we do not qualify as the accounting acquirer. Accordingly, in the corporate reorganization, the combination of our predecessor into us will be accounted for at historical cost, and the combination of Vantage I into us will be accounted for at fair value as a business combination by applying the acquisition method. For more information on our reorganization and the ownership of our common stock by our principal stockholders, please see "Corporate Reorganization", "Security Ownership of Certain Beneficial Owners and Management" and the unaudited pro forma financial statements included elsewhere in this prospectus.
The following diagram indicates our simplified ownership structure after giving effect to our corporate reorganization and this offering (assuming that the underwriters' option to purchase additional shares is not exercised).
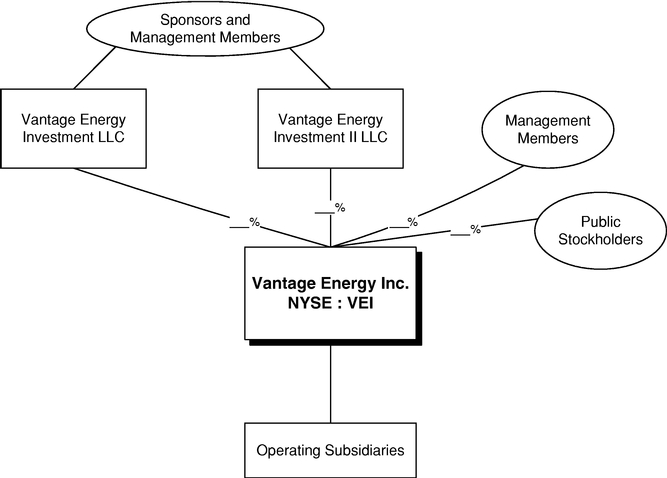
Our Principal Stockholders
Following the completion of this offering and our corporate reorganization, Vantage Investment I, Vantage Investment II and the Management Members will directly own %, %
11
and %, respectively, of our common stock, or %, % and %, respectively, if the underwriters' option to purchase additional shares is exercised in full. Vantage Investment I and Vantage Investment II are controlled by Quantum, Riverstone and Lime Rock. Please see "Corporate Reorganization".
Quantum is a Houston-based private investment firm founded in 1998. Focused exclusively on the energy sector, Quantum has built one of the leading energy private equity franchises and has managed more than $11 billion of equity commitments since its inception. Quantum has invested in and built over 70 companies in the upstream, midstream, oil field service and power sectors, both domestically and globally.
Riverstone is an energy and power-focused private investment firm founded in 2000 with approximately $34 billion of capital raised. Riverstone conducts buyout and growth capital investments in the exploration and production, midstream, oilfield services, power, and renewable sectors of the energy industry. With offices in New York, London, Houston and Mexico City, as of June 30, 2016, the firm has committed approximately $30 billion to 120 investments in North America, Latin America, Europe, Africa and Asia.
Established in 1998, Lime Rock Management LP ("Lime Rock Management") has raised approximately $6.8 billion in private equity funds for investment in the energy industry through Lime Rock Partners ("Lime Rock"), investors of growth capital in exploration and production and oilfield services companies worldwide, and Lime Rock Resources, acquirers and operators of oil and gas properties in the United States. Lime Rock has invested in 89 companies to date and has offices in Westport, Houston, and London.
Emerging Growth Company Status
We are an "emerging growth company" as defined in the Jumpstart Our Business Startups Act (the "JOBS Act"). For as long as we are an emerging growth company, unlike other public companies that are not emerging growth companies under the JOBS Act, we are not required to:
- •
- provide an auditor's attestation report on management's assessment of the effectiveness of our system of internal control over
financial reporting pursuant to Section 404(b) of the Sarbanes-Oxley Act of 2002;
- •
- provide more than two years of audited financial statements and related management's discussion and analysis of financial condition
and results of operations nor more than two years of selected financial data;
- •
- comply with any new requirements adopted by the Public Company Accounting Oversight Board (the "PCAOB") requiring mandatory audit firm
rotation or a supplement to the auditor's report in which the auditor would be required to provide additional information about the audit and the financial statements of the issuer;
- •
- provide certain disclosure regarding executive compensation required of larger public companies or hold shareholder advisory votes on
executive compensation required by the Dodd-Frank Wall Street Reform and Consumer Protection Act (the "Dodd-Frank Act"); or
- •
- obtain shareholder approval of any golden parachute payments not previously approved.
We will cease to be an "emerging growth company" upon the earliest of:
- •
- the last day of the fiscal year in which we have $1.0 billion or more in annual revenues;
- •
- the date on which we become a "large accelerated filer" (the fiscal year-end on which the total market value of our common equity securities held by non-affiliates is $700 million or more as of June 30);
12
- •
- the date on which we issue more than $1.0 billion of non-convertible debt over a three-year period; or
- •
- the last day of the fiscal year following the fifth anniversary of our initial public offering.
In addition, Section 107 of the JOBS Act provides that an emerging growth company can take advantage of the extended transition period provided in Section 7(a)(2)(B) of the Securities Act of 1933, as amended (the "Securities Act") for complying with new or revised accounting standards, but we have irrevocably opted out of the extended transition period and, as a result, we will adopt new or revised accounting standards on the relevant dates in which adoption of such standards is required for other public companies.
Corporate Information
Our principal executive offices are located at 116 Inverness Drive East, Suite 107, Englewood, Colorado 80112, and our telephone number at that address is (303) 386-8600. Our website is located at www.vantageenergy.com. We expect to make our periodic reports and other information filed with or furnished to the SEC available free of charge through our website as soon as reasonably practicable after those reports and other information are electronically filed with or furnished to the SEC. Information on, or otherwise accessible through, our website or any other website is not incorporated by reference herein and does not constitute a part of this prospectus.
13
Common stock offered by us |
| shares (or shares, if the underwriters exercise in full their option to purchase additional shares). |
Common stock to be outstanding after the offering |
| shares (or shares, if the underwriters exercise in full their option to purchase additional shares). |
Option to purchase additional shares |
| We have granted the underwriters a 30 day option to purchase up to an aggregate of additional shares of our common stock. |
Use of proceeds |
| We expect to receive approximately $ million of net proceeds (assuming the midpoint of the price range set forth on the cover of this prospectus) from the sale of the common stock offered by us (or approximately $ million, if the underwriters exercise in full their option to purchase additional shares) after deducting underwriting discounts and commissions and estimated offering expenses payable by us. |
|
| We intend to use the net proceeds from this offering, together with cash on hand and borrowings under our new revolving credit facility, to repay and retire the Vantage I revolving credit facility, the Vantage I second lien term loan and the Vantage II revolving credit facility. We intend to use the remaining net proceeds for general corporate purposes, including funding our drilling program and expanding our midstream infrastructure. Please see "Use of Proceeds". |
Dividend policy |
| We do not anticipate paying any cash dividends on our common stock. In addition, our new revolving credit facility will place certain restrictions on our ability to pay cash dividends. |
Directed share program |
| At our request, the underwriters have reserved for sale at the initial public offering price up to % of the shares offered by this prospectus for our officers, directors, employees and certain other persons associated with us. We do not know if these persons will choose to purchase all or any portion of these reserved shares, but any purchases they do make will reduce the number of shares available to the general public. Please read "Underwriting". |
Risk factors |
| You should carefully read and consider the information set forth under the heading "Risk Factors" and all other information set forth in this prospectus before deciding to invest in our common stock. |
Listing and trading symbol |
| We have applied to list our common stock on the New York Stock Exchange (the "NYSE") under the symbol "VEI". |
14
The information above excludes shares of common stock reserved for issuance under our long-term incentive plan (the "LTIP") that we intend to adopt in connection with the completion of this offering.
In addition, it does not give effect to the grant of an aggregate of approximately shares of restricted stock (based on the midpoint of the price range set forth on the cover page of this prospectus) that our board of directors intends to make to certain of our directors, officers and employees in connection with the completion of this offering.
15
Summary Historical Consolidated and Unaudited Pro Forma Financial Data
The following table shows summary historical consolidated financial data of our predecessor, and summary unaudited pro forma financial data for the periods and as of the dates indicated.
The summary historical consolidated financial data as of and for the years ended December 31, 2015 and 2014 were derived from the audited historical consolidated financial statements of our predecessor included elsewhere in this prospectus.
The summary historical consolidated financial data as of and for the six months ended June 30, 2016 and 2015 were derived from the unaudited historical consolidated financial statements of our predecessor included elsewhere in this prospectus. The summary unaudited historical consolidated financial data has been prepared on a consistent basis with the audited consolidated financial statements of our predecessor. In the opinion of management, such summary unaudited historical consolidated interim financial data reflects all adjustments (consisting of normal and recurring accruals) considered necessary to present our financial position for the periods presented. The results of operations for the interim periods are not necessarily indicative of the results that may be expected for the full year because of the impact of fluctuations in prices received from oil and natural gas, natural production declines, the uncertainty of exploration and development drilling results and other factors.
The summary unaudited pro forma statements of operations data for the year ended December 31, 2015 and the six months ended June 30, 2016 has been prepared to give pro forma effect to (i) the reorganization transactions described under "Corporate Reorganization" and (ii) this offering and the application of the net proceeds from this offering as if they had been completed as of January 1, 2015. The summary unaudited pro forma balance sheet data has been prepared to give pro forma effect to those transactions as if they had been completed as of June 30, 2016. These data are subject to and give effect to the assumptions and adjustments described in the notes accompanying the unaudited pro forma financial statements included elsewhere in this prospectus. The summary unaudited pro forma financial data are presented for informational purposes only and should not be considered indicative of actual results of operations that would have been achieved had the reorganization transactions and this offering been consummated on the dates indicated, and do not purport to be indicative of statements of financial position or results of operations as of any future date or for any future period.
You should read the following table in conjunction with "Use of Proceeds", "Management's Discussion and Analysis of Financial Condition and Results of Operations", "Corporate Reorganization", the historical consolidated financial statements of our predecessor and the unaudited pro forma financial statements included elsewhere in this prospectus. Among other
16
things, those historical and unaudited pro forma financial statements include more detailed information regarding the basis of presentation for the following information.
|
| Predecessor | | Vantage Energy Inc. Pro Forma |
| ||||||||||||||||||
| | | | | | | | | | | | | | | ||||||||||
|
| Six Months Ended June 30, |
| Year Ended December 31, |
| Six Months Ended June 30, |
| Year Ended December 31, |
| ||||||||||||||
| | | | | | | | | | | | | | | | | | | ||||||
(in thousands, except per share data) |
| 2016 | | 2015 | | 2015 | | 2014 | | 2016 | | 2015 |
| ||||||||||
| | | | | | | | | | | | | | | ||||||||||
Statement of operations data: |
| | | | | | | | | | | ||||||||||||
Operating revenues: |
| | | | | | | | | | | ||||||||||||
Natural gas |
| $ | 46,829 | | $ | 40,375 | | $ | 65,252 | | $ | 43,622 | | | $ | | | | $ | | | ||
Midstream revenues(1) |
| 2,895 | | 2,524 | | 4,054 | | 2,990 | | | | | | | | ||||||||
Gain (loss) on commodity derivatives |
| (22,599 | ) | 14,921 | | 51,793 | | 14,434 | | | | | | | | ||||||||
| | | | | | | | | | | | | | | ||||||||||
Total operating revenues |
| 27,125 | | 57,820 | | 121,099 | | 61,046 | | | | | | | | ||||||||
Operating expenses: |
| | | | | | | | | | | ||||||||||||
Production and ad valorem taxes(2) |
| 1,025 | | 512 | | 1,911 | | 1,723 | | | | | | | | ||||||||
Marketing and gathering |
| 7,961 | | 6,063 | | 9,745 | | 5,333 | | | | | | | | ||||||||
Lease operating and workover(3) |
| 1,590 | | 4,451 | | 4,934 | | 2,517 | | | | | | | | ||||||||
Midstream operating expenses |
| 1,428 | | 831 | | 1,834 | | 891 | | | | | | | | ||||||||
General and administrative(3) |
| 4,336 | | 5,487 | | 7,308 | | 5,423 | | | | | | | | ||||||||
Depreciation, depletion, amortization and accretion |
| 19,490 | | 23,357 | | 39,698 | | 18,302 | | | | | | | | ||||||||
Impairment of proved oil and gas properties |
| 81,673 | | — | | 172,673 | | — | | | | | | | | ||||||||
| | | | | | | | | | | | | | | ||||||||||
Total operating expenses |
| 117,503 | | 40,701 | | 238,103 | | 34,189 | | | | | | | | ||||||||
| | | | | | | | | | | | | | | ||||||||||
Operating (loss) income |
| (90,378 | ) | 17,119 | | (117,004 | ) | 26,857 | | | | | | | | ||||||||
Other income (expense) |
| 3 | | (180 | ) | (180 | ) | — | | | | | | | | ||||||||
Interest income, net |
| — | | — | | — | | — | | | | | | | | ||||||||
Interest expense, net of capitalized interest(4) |
| (5,264 | ) | (4,229 | ) | (8,778 | ) | (4,027 | ) | | | | | | | ||||||||
| | | | | | | | | | | | | | | ||||||||||
Income (loss) before income taxes |
| (5,261 | ) | (4,409 | ) | (125,962 | ) | 22,830 | | | | | | | | ||||||||
Income tax expense (benefit) |
| — | | — | | — | | — | | | | | | | | ||||||||
| | | | | | | | | | | | | | | ||||||||||
Net income (loss) |
| $ | (95,639 | ) | $ | 12,710 | | $ | (125,962 | ) | $ | 22,830 | | | $ | | | | $ | | | ||
| | | | | | | | | | | | | | | ||||||||||
| | | | | | | | | | | | | | | | | | | ||||||
| | | | | | | | | | | | | | | ||||||||||
Balance sheet data (at period end): |
| | | | | | | | | | | ||||||||||||
Cash |
| $ | 15,085 | | $ | 8,726 | | $ | 2,439 | | $ | 21,185 | | | $ | | | | $ | | | ||
Total oil and gas properties, net |
| 687,495 | | 486,043 | | 373,786 | | 439,076 | | | | | | | | ||||||||
Total midstream system, net |
| 59,764 | | 56,458 | | 59,970 | | 53,116 | | | | | | | | ||||||||
Total assets |
| 780,421 | | 588,640 | | 488,739 | | 551,345 | | | | | | | | ||||||||
Total debt |
| 244,993 | | 225,087 | | 247,041 | | 197,663 | | | | | | | | ||||||||
Total members'/stockholders' capital |
| 474,866 | | 339,263 | | 200,093 | | 326,055 | | | | | | | | ||||||||
Net cash provided by (used in): |
| | | | | | | | | | | ||||||||||||
Operating activities |
| $ | 72,209 | | $ | 39,792 | | $ | 81,633 | | $ | 21,100 | | | $ | | | | $ | | | ||
Investing activities |
| (427,740 | ) | (78,804 | ) | (148,852 | ) | (212,615 | ) | | | | | | | ||||||||
Financing activities |
| 368,177 | | 26,553 | | 48,473 | | 206,921 | | | | | | | | ||||||||
Other financial data (unaudited): |
| | | | | | | | | | | ||||||||||||
E&P Segment Adjusted EBITDA(5) |
| 48,348 | | 28,994 | | 57,229 | | 26,207 | | | 107,566 | | | | 182,020 | | | ||||||
Midstream Segment Adjusted EBITDA(6) |
| 11,195 | | 6,345 | | 14,056 | | 5,317 | | | 22,393 | | | | 28,112 | | | ||||||
Adjusted EBITDA(7) |
| $ | 59,007 | | $ | 40,656 | | $ | 69,983 | | $ | 31,660 | | | $ | 128,872 | | | | $ | 207,528 | | |
Earnings (loss) per share — basic |
| | | | | | | | | | | ||||||||||||
Earnings (loss) per share — diluted |
| | | | | | | | | | | ||||||||||||
- (1)
- Midstream revenues are net of gathering, compression and water fees paid by Vantage II for historical periods and by Vantage I and Vantage II on a pro forma basis. See "Management's Discussion and Analysis of Financial Condition and Results of Operation — Sources of Revenues — Gathering Revenues".
17
- (2)
- Production
and ad valorem taxes include expenses recorded for Pennsylvania impact fees, which are annual fees imposed by the state of
Pennsylvania on natural gas and oil operators in Pennsylvania for each well drilled for a period of fifteen years.
- (3)
- Lease
operating and workover expense includes Council of Petroleum Accountants Society ("COPAS") overhead booked as a reclassification from
general and administrative expense on our operated properties and any COPAS charged to us by other operators on our non-operated properties. On a pro forma basis for the six months ended
June 30, 2016 and for the year ended December 31, 2015, we recorded allocated COPAS overhead charges of $1.1 million and $2.1 million, respectively. General and
administrative expenses are net of overhead recorded to lease operating and workover expenses and the capitalization of certain internal costs. On a pro forma basis for the six months ended
June 30, 2016 and the year ended December 31, 2015, we recorded $7.6 million and $13.3 million, respectively, of general and administrative expense, net of allocated COPAS
overhead of $1.1 million and $2.1 million, respectively and capitalized general and administrative expenses of $5.1 million and $9.8 million, respectively.
- (4)
- On
a pro forma basis for the six months ended June 30, 2016 and for the year ended December 31, 2015, we recorded capitalized interest
of $2.9 million and $5.8 million, respectively.
- (5)
- We
define E&P Segment Adjusted EBITDA as total revenues from our E&P Segment (including net cash from settlement from commodity derivatives)
less E&P Segment operating costs and allocated general and administrative expenses. E&P Segment Adjusted EBITDA for Vantage I was $59.2 million and $124.8 million for the six
months ended June 30, 2016 and the year ended December 31, 2015, respectively. Pro forma E&P Segment Adjusted EBITDA represents the sum of the E&P Segment Adjusted EBITDA for our
predecessor and Vantage I for such period. See Note 11 and Note 13 to the audited consolidated financial statements of our predecessor and Vantage I, respectively, included
elsewhere in this prospectus for a discussion of our segment reporting.
- (6)
- We
define Midstream Segment Adjusted EBITDA as total revenues from our Midstream Segment less Midstream Segment operating costs and allocated
general and administrative expenses. Midstream Segment Adjusted EBITDA for Vantage I was $11.2 million and $14.1 million for the six months ended June 30, 2016 and the year
ended December 31, 2015, respectively. Pro forma Midstream Segment Adjusted EBITDA represents the sum of the Midstream Segment Adjusted EBITDA for our predecessor and Vantage I for such
period. See Note 11 and Note 13 to the audited consolidated financial statements of our predecessor and Vantage I, respectively, included elsewhere in this prospectus for a
discussion of our segment reporting.
- (7)
- Adjusted EBITDA is a non-GAAP financial measure. For a definition of Adjusted EBITDA and a reconciliation of Adjusted EBITDA to net income (loss), please see "— Non-GAAP Financial Measure" below.
Non-GAAP Financial Measure
Adjusted EBITDA is a supplemental non-GAAP financial measure that is used by management and external users of our consolidated financial statements, such as industry analysts, investors, lenders and rating agencies.
We define Adjusted EBITDA as net income (loss) before interest, income taxes, impairment of proved oil and gas properties, depreciation, depletion, amortization and accretion and derivative fair value (gain) loss, excluding net cash receipts on settled derivative instruments. Adjusted EBITDA is not a measure of net income as determined by United States generally accepted accounting principles ("GAAP").
Management believes Adjusted EBITDA is a commonly used metric and is useful because it allows investors a consistent method of evaluating our operating performance and compare the results of our operations from period to period and against our peers without regard to our accounting methods or capital structure. We exclude the items listed above from net income in arriving at Adjusted EBITDA because these amounts can vary substantially from company to company within our industry depending upon accounting methods and book values of assets, capital structures and the method by which the assets were acquired. Adjusted EBITDA should not be considered an alternative to, or more meaningful than, net income as determined in accordance with GAAP or as an indicator of our operating performance or liquidity. Certain items excluded from Adjusted EBITDA are significant components in understanding and assessing a company's financial performance, such as a company's cost of capital and tax structure, as well as the historic costs of
18
depreciable assets, none of which are components of Adjusted EBITDA. Our computations of Adjusted EBITDA may not be comparable to other similarly titled measures of other companies.
The following table presents a reconciliation of the non-GAAP financial measure of Adjusted EBITDA to the GAAP financial measure of net income (loss).
|
| Predecessor | | Vantage I | | Vantage Energy Inc. Pro Forma |
| ||||||||||||||||||||||||||
| | | | | | | | | | | | | | | | | | | ||||||||||||||||
|
| Six Months Ended June 30, |
| Year Ended December 31, |
| Six Months Ended June 30, |
| Year Ended December 31, |
| Six Months Ended June 30, |
| Year Ended December 31, |
| ||||||||||||||||||||
| | | | | | | | | | | | | | | | | | | ||||||||||||||||
(in thousands) |
| 2016 | | 2015 | | 2015 | | 2014 | | 2016 | | 2015 | | 2016 | | 2015 |
| ||||||||||||||||
| | | | | | | | | | | | | | | | | | | ||||||||||||||||
Adjusted EBITDA reconciliation to net income (loss): |
| | | | | | | | | | | | | | | | | ||||||||||||||||
Net income (loss) |
| $ | (95,639 | ) | $ | 12,710 | | $ | (125,962 | ) | $ | 22,830 | | | $ | (181,568 | ) | | | $ | (292,938 | ) | | | $ | | | | $ | | | ||
Interest income, net |
| — | | — | | — | | — | | | — | | | | — | | | | | | | | | ||||||||||
Interest expense, net of capitalized interest |
| 5,264 | | 4,229 | | 8,778 | | 4,027 | | | 12,371 | | | | 22,058 | | | | | | | | | ||||||||||
Depreciation, depletion, amortization and accretion |
| 19,490 | | 23,357 | | 39,698 | | 18,302 | | | 26,476 | | | | 50,162 | | | | | | | | | ||||||||||
Impairment of proved oil & gas properties |
| 81,673 | | — | | 172,673 | | — | | | 155,994 | | | | 344,401 | | | | | | | | | ||||||||||
Total (gains) losses on derivatives, net, less net cash from settlement of commodity derivatives(1) |
| 48,219 | | (4,957 | ) | (25,204 | ) | (13,499 | ) | | 56,592 | | | | 13,862 | | | | | | | | | ||||||||||
Income tax expense (benefit) |
| — | | — | | — | | — | | | — | | | | — | | | | | | | | | ||||||||||
| | | | | | | | | | | | | | | | | | | ||||||||||||||||
Adjusted EBITDA |
| $ | 59,007 | | $ | 35,339 | | $ | 69,983 | | $ | 31,660 | | | $ | 69,865 | | | | $ | 137,545 | | | | $ | | | | $ | | | ||
| | | | | | | | | | | | | | | | | | | ||||||||||||||||
| | | | | | | | | | | | | | | | | | | | | | | | | | | ||||||||
| | | | | | | | | | | | | | | | | | | ||||||||||||||||
- (1)
- The adjustments for the total (gains) losses on derivatives, net, less net cash from settlement of commodity derivatives have the effect of adjusting net income (loss) for changes in the fair value of derivative instruments, which are recognized at the end of each accounting period because we do not designate commodity derivative instruments as accounting hedges.
19
Summary Reserve, Production and Operating Data
Summary Reserve Data
The following table summarizes estimated proved reserves as of December 31, 2015 based on reports prepared by Netherland, Sewell & Associates, Inc. ("NSAI") and Wright & Company, our independent reserve engineers. All of these reserve estimates were prepared in accordance with the SEC's rules regarding reserve reporting that are currently in effect.
The information in the following table does not give any effect to or reflect our commodity hedges. Please see "Business — Our Operations — Reserve Data" for more information about our reserves.
|
| At December 31, 2015(1)(2) |
| |||
| | | | | |||
Estimated proved reserves: |
| | | | ||
Natural gas (Bcf) |
| | 1,755 | | | |
NGLs (MMBbl) |
| | 23.8 | | | |
Oil (MMBbl) |
| | 1.2 | | | |
Total equivalent proved reserves (Bcfe) |
| | 1,905 | | | |
Total equivalent proved developed reserves (Bcfe) |
| | 768 | | | |
Percent proved developed |
| | 40.3 | % | | |
Total equivalent proved undeveloped reserves (Bcfe) |
| | 1,137 | | | |
- (1)
- Our
estimated proved reserves were determined using average first-day-of-the-month prices for the prior 12 months in accordance with
SEC guidance. As of December 31, 2015, the SEC Price Deck was $2.59/Mcf for natural gas, $16.22/Bbl for NGLs and $50.28/Bbl for oil, representing the prices for Henry Hub natural gas, Mont
Belvieu NGLs, and WTI oil, respectively. In determining our reserves, the SEC Price Deck was adjusted by field or lease for quality, transportation fees, regional price differentials and other factors
affecting the price received at the wellhead. The corresponding natural gas basis prices proximate to our operating areas were $1.39/Mcf and $2.47/Mcf for Dominion South Point and WAHA, respectively.
There were no proved reserves associated with our Utica Shale acreage as of December 31, 2015.
- (2)
- The reserve data presented is that of Vantage II and Vantage I on a combined basis as of December 31, 2015, assuming a 30-year reserve life.
20
Production and Operating Data
The following table sets forth information regarding production, revenues and realized prices, and production costs and other operating data for the six months ended June 30, 2016 and the year ended December 31, 2015. For additional information on price calculations, please see "Management's Discussion and Analysis of Financial Condition and Results of Operations".
|
| Six Months Ended June 30, 2016(1) |
| Year Ended December 31, 2015(1) |
| ||||||
| | | | | | | ||||||
Production data: |
| | | | | | | ||||
Natural gas (MMcf) |
| | 66,986 | | | | 82,391 | | | ||
NGLs (MBbl) |
| | 525 | | | | 796 | | | ||
Oil (MBbl) |
| | 43 | | | | 74 | | | ||
| | | | | | | ||||||
Total combined production (MMcfe) |
| | 70,394 | | | | 87,612 | | | ||
Average net daily combined production (MMcfe/d) |
| | 387 | | | | 240 | | | ||
Average sales prices: |
| | | | | | | ||||
Natural gas (per Mcf) |
| | $ | 1.35 | | | | $ | 1.68 | | |
NGLs (per Bbl) |
| | 11.09 | | | | 10.45 | | | ||
Oil (per Bbl) |
| | 34.09 | | | | 41.00 | | | ||
Combined average sales prices before effects of cash settled derivatives (per Mcfe)(2) |
| | 1.39 | | | | 1.71 | | | ||
Combined average sales prices after effects of cash settled derivatives (per Mcfe)(1) |
| | 2.26 | | | | 2.97 | | | ||
Average costs per Mcfe: |
| | | | | | | ||||
Lease operating and workover expenses |
| | $ | 0.13 | | | | $ | 0.26 | | |
Marketing and gathering |
| | 0.20 | | | | 0.17 | | | ||
Production and ad valorem taxes |
| | 0.06 | | | | 0.08 | | | ||
Depreciation, depletion, amortization and accretion |
| | 0.65 | | | | 1.03 | | | ||
General and administrative |
| | 0.11 | | | | 0.15 | | | ||
Midstream Segment operating data(3): |
| | | | | | | ||||
Gas gathering throughput (Mcf/d) |
| | 265,538 | | | | 176,324 | | | ||
Gas gathering and compression revenues |
| | $ | 25,535 | | | | $ | 31,512 | | |
Gas gathering and compression expenses(4) |
| | 2,854 | | | | 3,676 | | | ||
Water volumes (Bbls/d) |
| | 12,054 | | | | 9,928 | | | ||
Water revenues |
| | $ | 7,889 | | | | $ | 10,974 | | |
Water system expenses(4) |
| | 6,913 | | | | 8,370 | | | ||
- (1)
- The
operational data presented is that of Vantage II and Vantage I on a combined basis for the periods presented.
- (2)
- Average
sales prices shown reflect both the before and after effects of our cash settled derivatives. Our calculation of such effects
includes realized gains or losses on cash settlements for commodity derivatives, which do not qualify for hedge accounting because we do not designate them as hedges.
- (3)
- Midstream
Segment operating revenues and expenses are presented prior to elimination entries. For more information on Midstream Segment
operating revenues and expenses, please see "Management's Discussion and Analysis of Financial Condition and Results of Operations — Sources of Revenues" and "Management's
Discussion and Analysis of Financial Condition and Results of Operations — Principal Components of our Cost Structure".
- (4)
- Gas gathering and compression expenses and water system expenses exclude allocated general and administrative expense.
21
Investing in our common stock involves risks. You should carefully consider the information in this prospectus, including the matters addressed under "Cautionary Statement Regarding Forward-Looking Statements", and the following risks before making an investment decision. The trading price of our common stock could decline due to any of these risks, and you may lose all or part of your investment.
Risks Related to Our Business
Natural gas, NGLs and oil prices are volatile. A further reduction or sustained decline in commodity prices may adversely affect our business, financial condition or results of operations and our ability to meet our capital expenditure obligations and financial commitments.
The prices we receive for our natural gas production heavily influence, and to the extent we produce oil and NGLs in the future, the prices we receive for oil and NGLs production will heavily influence, our revenue, operating results profitability, access to capital, future rate of growth and carrying value of our properties. Natural gas, NGLs and oil are commodities and, therefore, their prices are subject to wide fluctuations in response to relatively minor changes in supply and demand. Historically, the commodities market has been volatile. This market will likely continue to be volatile in the future. The prices we receive for our production, and the levels of our production, depend on numerous factors beyond our control. These factors include the following:
- •
- worldwide and regional economic conditions impacting the global supply of and demand for natural gas, NGLs and oil;
- •
- the price and quantity of imports of foreign natural gas, including liquefied natural gas;
- •
- political conditions in or affecting other producing countries, including conflicts in the Middle East, Africa, South America and
Russia;
- •
- the level of global exploration and production;
- •
- the level of global inventories;
- •
- prevailing prices on local price indexes in the areas in which we operate and expectations about future commodity prices;
- •
- increased associated natural gas production resulting from higher oil prices and the related increase in oil production;
- •
- the proximity, capacity, cost and availability of gathering and transportation facilities, and other factors that result in
differentials to benchmark prices;
- •
- localized and global supply and demand fundamentals and transportation availability;
- •
- the actions of the Organization of the Petroleum Exporting Countries;
- •
- weather conditions and other natural disasters;
- •
- technological advances affecting energy consumption;
- •
- speculative trading in natural gas and crude oil derivative contracts;
- •
- increased end-user conservation;
22
- •
- the price and availability of alternative fuels; and
- •
- domestic, local and foreign governmental regulation and taxes.
In late 2014, global energy commodity prices declined precipitously as a result of several factors, including an increase in worldwide commodity supplies, a stronger U.S. dollar, relatively mild weather in large portions of the U.S. during winter months, and strong competition among oil producing countries for market share. These events continued throughout 2015 and the first half of 2016 and, along with slower economic growth in China, have led to a further decline in commodity prices. Spot prices for Henry Hub natural gas declined from approximately $4.40 per MMBtu in January 2014 to $3.00 per MMBtu in January 2015, and declined further to less than $1.70 per MMBtu for a brief period in March 2016.
In addition, substantially all of our natural gas production is sold to purchasers under contracts with market-based prices. The actual prices realized from the sale of natural gas differ from the quoted NYMEX Henry Hub price as a result of location differentials. Location differentials to NYMEX Henry Hub prices, also known as basis differentials, result from variances in regional natural gas prices compared to NYMEX Henry Hub prices as a result of regional supply and demand factors.
If commodity prices decrease further or we experience negative basis differentials, our cash flows and borrowing ability will be reduced. We may be unable to obtain needed capital or financing on satisfactory terms, which could lead to a decline in our reserves as existing reserves are depleted. Lower commodity prices may also reduce the amount of natural gas, NGLs and oil that we can produce economically. Additionally, a significant portion of our development and exploration projects could become uneconomic and require us to re-evaluate or postpone such drilling. This may result in our having to make further downward adjustments to our estimated proved reserves. If we are required to curtail our drilling program, we may be unable to continue to hold leases that are scheduled to expire, which may further reduce our estimated proved reserves. As a result, a further reduction or sustained decline in commodity prices or negative basis differentials in the areas in which we operate may materially and adversely affect our future business, financial condition, results of operations, liquidity or ability to finance planned capital expenditures.
Our development and exploration projects require substantial capital expenditures. We may be unable to obtain required capital or financing on satisfactory terms, which could lead to a decline in our natural gas reserves.
The natural gas industry is capital intensive. We make and expect to continue to make substantial capital expenditures for the development and acquisition of natural gas reserves. See "Prospectus Summary — Capital Program". We have not allocated any capital spending to properties other than our primary Marcellus, Upper Devonian and Barnett Shale operations. Our capital budget excludes acquisitions, other than leasehold acquisitions.
The actual amount and timing of our future capital expenditures may differ materially from our estimates as a result of, among other things, natural gas prices, actual drilling results, the availability of drilling rigs and other services and equipment, and regulatory, technological and competitive developments. A further reduction or sustained decline in natural gas prices from current levels may result in a decrease in our actual capital expenditures, which would negatively impact our ability to grow production. We intend to finance our future capital expenditures primarily through cash flow from operations and through available capacity under our new revolving credit facility; however, our financing needs may require us to alter or increase our capitalization substantially through the issuance of debt or equity securities or the sale of assets. The issuance of
23
additional indebtedness would require that a portion of our cash flow from operations be used for the payment of interest and principal on our indebtedness, thereby reducing our ability to use cash flow from operations to fund working capital, capital expenditures and acquisitions.
Our cash flow from operations and access to capital are subject to a number of variables, including:
- •
- our proved reserves;
- •
- the level of hydrocarbons we are able to produce from existing wells;
- •
- the prices at which our production is sold;
- •
- our ability to acquire, locate and produce new reserves;
- •
- the levels of our operating expenses; and
- •
- our ability to borrow under our new revolving credit facility.
If our revenues or the borrowing base under our new revolving credit facility decrease as a result of lower natural gas prices, operating difficulties, declines in reserves or for any other reason, we may have limited ability to obtain the capital necessary to sustain our planned capital budget or operations at current levels. If additional capital is needed, we may not be able to obtain debt or equity financing on terms acceptable to us, if at all. If cash flow generated by our operations or available capacity under our new revolving credit facility are not sufficient to meet our capital requirements, the failure to obtain additional financing could result in a curtailment of our operations relating to development of our properties, which in turn could lead to a decline in our reserves and production, and could adversely affect our business, financial condition and results of operations.
We have been an early entrant into new or emerging plays. As a result, our drilling results in these areas are uncertain, and the value of our undeveloped acreage will decline if drilling results are unsuccessful.
In addition to our primary operations in the Appalachian Basin and the Barnett Shale, we hold additional acreage in the Uinta and Piceance plays in Utah and Colorado, respectively. Due to the limited operational history with horizontal development, each of the Upper Devonian Shale, Utica Shale, Uinta and Piceance plays may be considered a new or emerging play.
Drilling results in these areas are more uncertain than drilling results in areas that are developed and producing. Since new or emerging plays have limited production history and since we have limited experience drilling in these plays, we are unable to use past drilling results in those areas to help predict our future drilling results. As a result, our cost of drilling, completing and operating wells in these areas may be higher than initially expected, and the value of our undeveloped acreage will decline if drilling results are unsuccessful. Additionally, we cannot assure you that all prospects will be economically viable or that we will not abandon our investments. We cannot assure you that unproved property acquired by us or undeveloped acreage leased by us will be profitably developed, that wells drilled by us in prospects that we pursue will be productive or that we will recover all or any portion of our investment in such unproved property or wells.
24
Part of our strategy involves using some of the latest available horizontal drilling and completion techniques, which involve risks and uncertainties in their application.
Our operations involve utilizing some of the latest drilling and completion techniques as developed by us and our service providers. Risks that we face while drilling include, but are not limited to, the following:
- •
- effectively controlling the level of pressure flowing from particular wells;
- •
- landing our wellbore in the desired drilling zone;
- •
- staying in the desired drilling zone while drilling horizontally through the formation;
- •
- running our casing the entire length of the wellbore; and
- •
- being able to run tools and other equipment consistently through the horizontal wellbore.
Risks that we face while completing our wells include, but are not limited to, the following:
- •
- the ability to fracture stimulate the planned number of stages;
- •
- the ability to run tools the entire length of the wellbore during completion operations; and
- •
- the ability to successfully clean out the wellbore after completion of the final fracture stimulation stage.
The results of our drilling in new or emerging formations are more uncertain initially than drilling results in areas that are more developed and have a longer history of established production. Newer or emerging formations and areas have limited or no production history and, consequently, we are more limited in assessing future drilling results in these areas. If our drilling results are less than anticipated, the return on our investment for a particular project may not be as attractive as we anticipated and we could incur material write-downs of unevaluated properties and the value of our undeveloped acreage could decline in the future.
Drilling for and producing natural gas are high-risk activities with many uncertainties that could result in a total loss of investment or otherwise adversely affect our business, financial condition or results of operations.
Our future financial condition and results of operations will depend on the success of our development and acquisition activities, which are subject to numerous risks beyond our control, including the risk that drilling will not result in commercially viable natural gas production, that we will not recover all or any portion of our investment in such wells or that various characteristics of the well will cause us to plug or abandon the well prior to producing in commercially viable quantities.
Our decisions to purchase, explore or develop prospects or properties will depend in part on the evaluation of data obtained through geophysical and geological analyses, production data and engineering studies, the results of which are often inconclusive or subject to varying interpretations. For a discussion of the uncertainty involved in these processes, please see "— Reserve estimates depend on many assumptions that may turn out to be inaccurate. Any material inaccuracies in reserve estimates or underlying assumptions will materially affect the quantities and present value of our reserves". In addition, our cost of drilling, completing and operating wells is often uncertain before drilling commences.
25
Further, many factors may curtail, delay or cancel our scheduled drilling projects, including the following:
- •
- reductions or sustained declines in natural gas prices;
- •
- delays imposed by or resulting from compliance with regulatory requirements, including limitations resulting from wastewater disposal,
discharge of greenhouse gases and limitations on hydraulic fracturing;
- •
- pressure or irregularities in geological formations;
- •
- shortages of or delays in obtaining equipment and qualified personnel or in obtaining water for hydraulic fracturing activities;
- •
- equipment failures, accidents or other unexpected operational events;
- •
- lack of available gathering facilities or delays in construction of gathering facilities;
- •
- lack of available capacity on interconnecting transmission pipelines or the failure of our product to meet quality specifications for
such pipeline;
- •
- lack of available processing facilities on economic terms;
- •
- adverse weather conditions, such as blizzards and ice storms;
- •
- issues related to compliance with environmental regulations;
- •
- environmental hazards, such as natural gas leaks, oil spills, pipeline and tank ruptures, encountering naturally occurring radioactive
materials, and unauthorized discharges of brine, well stimulation and completion fluids, toxic gases or other pollutants into the surface and subsurface environment;
- •
- limited availability of financing at acceptable terms;
- •
- title problems; and
- •
- limitations in the market for natural gas.
Any of these risks can cause substantial losses, including personal injury or loss of life, damage to or destruction of property, natural resources and equipment, pollution, environmental contamination or loss of wells and other regulatory penalties.
We may not be able to generate sufficient cash to service all of our indebtedness and may be forced to take other actions to satisfy our obligations under applicable debt instruments, which may not be successful.
Our ability to make scheduled payments on or to refinance our indebtedness obligations, including the new revolving credit facility that we expect to enter into in connection with the completion of this offering and the $100 million Vantage II second lien term loan, depends on our financial condition and operating performance, which are subject to prevailing economic and competitive conditions and certain financial, business and other factors beyond our control. We may not be able to maintain a level of cash flows from operating activities sufficient to permit us to pay the principal, premium, if any, and interest on our indebtedness.
If our cash flows and capital resources are insufficient to fund debt service obligations, we may be forced to reduce or delay investments and capital expenditures, sell assets, seek additional capital or restructure or refinance indebtedness. Our ability to restructure or refinance indebtedness
26
will depend on the condition of the capital markets and our financial condition at such time. Any refinancing of indebtedness could be at higher interest rates and may require us to comply with more onerous covenants, which could further restrict business operations. The terms of existing or future debt instruments may restrict us from adopting some of these alternatives. In addition, any failure to make payments of interest and principal on outstanding indebtedness on a timely basis would likely result in a reduction of our credit rating, which could harm our ability to incur additional indebtedness. In the absence of sufficient cash flows and capital resources, we could face substantial liquidity problems and might be required to dispose of material assets or operations to meet debt service and other obligations. Our new revolving credit facility and the Vantage II second lien term loan will restrict our ability to dispose of assets and our use of the proceeds from such disposition. We may not be able to consummate those dispositions, and the proceeds of any such disposition may not be adequate to meet any debt service obligations then due. These alternative measures may not be successful and may not permit us to meet scheduled debt service obligations.
In the future, we may not be able to access adequate funding under our new revolving credit facility as a result of a decrease in borrowing base due to the issuance of new indebtedness, the outcome of a subsequent borrowing base redetermination or an unwillingness or inability on the part of lending counterparties to meet their funding obligations and the inability of other lenders to provide additional funding to cover the defaulting lender's portion. The lenders will be able to unilaterally adjust the borrowing base and the borrowings permitted to be outstanding under the facility. Declines in commodity prices could result in a determination to lower the borrowing base in the future and, in such a case, we could be required to repay any indebtedness in excess of the redetermined borrowing base. As a result, we may be unable to implement our drilling and development plan, make acquisitions or otherwise carry out business plans, which would have a material adverse effect on our financial condition and results of operations and impair our ability to service our indebtedness.
Substantially all of our producing properties are located in the Appalachian Basin and Barnett Shale, making us vulnerable to risks associated with operating in only two geographic areas.
Substantially all of our producing properties are located in the Appalachian Basin and in the Barnett Shale. As a result of this geographic concentration, an adverse development in the oil and natural gas business in our operating areas could have a greater impact on our financial condition and results of operations than if we were more geographically diverse. Due to the concentrated nature of our properties, we may be disproportionately exposed to the impact of regional supply and demand factors, delays or interruptions of production from wells in this area caused by governmental regulation, processing or transportation capacity constraints, market limitations, water shortages or other drought related conditions or interruption of the processing or transportation of oil, natural gas or NGLs. Such delays or interruptions could have a material adverse effect on our financial condition and results of operations.
In addition, a number of areas within the Appalachian Basin have historically been subject to mining operations. For example, third parties may engage in subsurface mining operations near or under our properties, which could cause subsidence or other damage to our properties, adversely impact our drilling or adversely impact our midstream activities or those on which we rely. In such event, our operations may be impaired or interrupted, and we may not be able to recover the costs incurred as a result of temporary shut-ins, the plugging and abandonment of any of our wells or the repair of our midstream facilities. Furthermore, the existence of mining operations near our properties could require coordination to avoid adverse impacts as a result of drilling and mining in close proximity. These restrictions on our operations, and any similar restrictions, can cause delays
27
or interruptions or can prevent us from executing our business strategy, which could have a material adverse effect on our financial condition and results of operations.
Insufficient takeaway capacity in the Appalachian Basin could cause significant fluctuations in our realized natural gas prices.
The Appalachian Basin natural gas business environment has been characterized by periods in which production has surpassed local takeaway capacity, sometimes resulting in curtailment of production or substantial discounts in the price received by producers. Although additional Appalachian Basin takeaway capacity has been added in recent years, the existing and expected capacity may not be sufficient to keep pace with the increased production caused by accelerated drilling in the area in the short term. Should production growth in the Appalachian Basin continue to outpace the increases in takeaway capacity, or if we are unable to secure firm takeaway capacity to accommodate our growing production, it could result in substantial discounts in the price we receive for our production, may limit our ability to market our production and could have a material adverse effect on our financial condition and results of operations. Moreover, if there is an extended interruption of access to or service from our or third-party midstream infrastructure for any reason, including cyber-attacks on such midstream infrastructure or service interruptions due to natural gas quality, we may experience these same adverse consequences.
Our investment in midstream infrastructure is intended to address a lack of capacity on, and access to, existing gathering pipelines in the Appalachian Basin as well as curtailments on such pipelines. Building and operating our midstream infrastructure involves significant risks, including those related to timing, cost overruns and operational efficiency. These risks can be affected by the availability of capital, materials and qualified personnel, as well as weather conditions, commodity price volatility, delays in obtaining permits and other government approvals, title and property access problems, geology, compliance by third parties with their contractual obligations to us and other factors.
Restrictions in our existing and future debt agreements could limit our growth and our ability to engage in certain activities.
The Vantage II second lien term loan contains, and our new revolving credit facility will contain, a number of significant covenants (in addition to covenants restricting the incurrence of additional indebtedness), including restrictive covenants that may limit our ability to, among other things:
- •
- sell assets;
- •
- make loans to others;
- •
- make investments;
- •
- enter into mergers;
- •
- make certain payments;
- •
- hedge future production or interest rates;
- •
- incur liens;
- •
- engage in certain other transactions without the prior consent of the lenders; and
- •
- pay dividends.
28
In addition, these debt agreements require us to maintain certain financial ratios or to reduce our indebtedness if we are unable to comply with such ratios. We may also be prevented from taking advantage of business opportunities that arise because of the limitations that the restrictive covenants impose on us. Please see "Management's Discussion and Analysis of Financial Condition and Results of Operations — Pro Forma Capital Resources and Liquidity — Debt Agreements — New Revolving Credit Facility" and "— Vantage II Second Lien Term Loan".
Any significant reduction in our borrowing base under our new revolving credit facility as a result of the periodic borrowing base redeterminations or otherwise may negatively impact our ability to fund our operations.
Our new revolving credit facility that we expect to enter into in connection with the completion of this offering will limit the amounts we can borrow up to a borrowing base amount, which the lenders, in their sole discretion, determine on a semi-annual basis based upon projected revenues from the natural gas and oil properties securing our loan. The lenders will be able to unilaterally adjust the borrowing base and the borrowings permitted to be outstanding under our revolving credit facilities. Any increase in the borrowing base requires the consent of the lenders holding 100% of the commitments. If the requisite number of lenders do not agree to an increase, then the borrowing base will be the lowest borrowing base acceptable to such lenders. Outstanding borrowings in excess of the borrowing base must be repaid, or we must pledge other natural gas and oil properties as additional collateral after applicable grace periods. We do not currently have any substantial unpledged properties, and we may not have the financial resources in the future to make mandatory principal prepayments required under our revolving credit facilities.
If we are unable to comply with the restrictions and covenants in the agreements governing our indebtedness, there could be an event of default under the terms of such agreements, which could result in an acceleration of repayment.
A breach of any covenant in any of our agreements governing our indebtedness would result in a default under the applicable agreement after any applicable grace periods. A default, if not waived, could result in acceleration of the indebtedness outstanding under the relevant facility and in a default with respect to, and an acceleration of, the indebtedness outstanding under other debt agreements, which would have a material adverse effect on us. The accelerated indebtedness would become immediately due and payable. If that occurs, we may not be able to make all of the required payments or borrow sufficient funds to refinance such indebtedness. Even if new financing were available at that time, it may not be on terms that are acceptable to us. As of December 31, 2015, Vantage II and Vantage I were not in compliance with the minimum current ratio covenant under their revolving credit facilities but obtained a waiver of compliance from the lenders and were compliant with their financial covenants as of June 30, 2016. There is, however, no assurance that we will be successful in obtaining a waiver or amendment if we are unable to comply with the restrictions and covenants in the agreements governing our indebtedness in the future.
Should we no longer be able to hedge at pricing we view as attractive, it could have a material adverse effect on our financial condition. Additionally, if development drilling costs increase significantly in the future, our hedged revenues may not be sufficient to cover our costs. Finally, in certain circumstances we may have to purchase commodities on the open market or make cash payments under our hedging arrangements and these payments could be significant.
In the past, we have received significant benefit from these hedge positions. For example, for the year ended December 31, 2015 we received approximately $110.0 million in revenues pursuant to our hedges, which represented approximately 39.2% of our total revenues for such periods. If we
29
are unable to enter into new hedge contracts in the future at favorable pricing, our financial condition and results of operations could be materially adversely affected. Additionally, to the extent our development drilling costs are not fixed under contract and increase significantly in the future, our hedged revenues may not be sufficient to cover the increased development drilling costs as well as our operating costs.
As of July 31, 2016, we had entered into hedging contracts through 2019 covering a total of approximately 219 TBtu of our projected natural gas, NGLs and oil production at a weighted average price of $3.04 per MMBtu. For the period from January 1, 2017 to December 31, 2017, we have hedged approximately 2.26 Bcfe of our projected natural gas, NGLs and oil production at a weighted average price of $2.43 per MMBtu. If we have to purchase additional commodities on the open market or post cash collateral to meet obligations under such arrangements, our cash otherwise available for use in our operations would be reduced.
Reserve estimates depend on many assumptions that may turn out to be inaccurate. Any material inaccuracies in reserve estimates or underlying assumptions will materially affect the quantities and present value of our reserves.
The process of estimating natural gas reserves is complex. It requires interpretations of available technical data and many assumptions, including assumptions relating to current and future economic conditions and commodity prices. Any significant inaccuracies in these interpretations or assumptions could materially affect the estimated quantities and present value of our reserves.
In order to prepare reserve estimates, we must project production rates and timing of development expenditures. We must also analyze available geological, geophysical, production and engineering data. The extent, quality and reliability of this data can vary. The process also requires economic assumptions about matters such as natural gas prices, drilling and operating expenses, production and ad valorem taxes and availability of funds.
Actual future production, natural gas, oil and NGLs prices, revenues, taxes, development expenditures, operating expenses and quantities of recoverable natural gas reserves will vary from our estimates. As a substantial portion of our reserve estimates are made without the benefit of a lengthy production history, any significant variance from the above assumption could materially affect the estimated quantities and present value of our reserves. In addition, we may adjust reserve estimates to reflect production history, results of exploration and development, changes in existing commodity prices and other factors, many of which are beyond our control.
You should not assume that the present value of future net revenues from our reserves is the current market value of our estimated natural gas, oil and NGLs reserves. We generally base the estimated discounted future net cash flows from reserves on prices and costs on the date of the estimate. Actual future prices and costs may differ materially from those used in the present value estimate.
Reserve estimates for fields that do not have a lengthy production history are less reliable than estimates for fields with lengthy production histories. Less production history may contribute to less accurate estimates of reserves, future production rates and the timing of development expenditures. Most of our producing wells have been operational for less than three years and estimated reserves vary substantially from well to well and are not directly correlated to perforated lateral length or completion technique. A material and adverse variance of actual production, revenues and expenditures from those underlying reserve estimates would have a material adverse effect on our business, financial condition, results of operations and cash flows.
30
Our Effective Horizontal Acreage is based on our and other operators' current drilling results and our interpretation of available geologic and engineering data and therefore is an inexact estimate subject to various uncertainties.
Our Effective Horizontal Acreage is equal to what we believe to be our combined horizontal acreage position that is prospective for hydrocarbon production across our target formations underneath our total acreage of 258,734 net acres. Our belief is based upon our evaluation of our initial horizontal drilling results and results publicly released by other operators in our area to date, combined with our interpretation of available geologic and engineering data. Although we believe this acreage metric more accurately conveys our horizontal drilling opportunities in our target formations, and we believe our analysis of engineering, geological, geochemical and seismic data is based on industry standards, our calculation of our Effective Horizontal Acreage is an inexact estimate. We cannot assure you that all or any portion of our Effective Horizontal Acreage is prospective for our target formations, that any portion of our Effective Horizontal Acreage will ever be drilled or that, if drilled, will result in commercially productive wells.
Our identified drilling locations are scheduled out over many years, making them susceptible to uncertainties that could materially alter the occurrence or timing of their drilling. In addition, we may not be able to raise the substantial amount of capital that would be necessary to drill our identified drilling locations.
Our management team has specifically identified and scheduled certain well locations as an estimation of our future multi-year drilling activities on our existing acreage. These well locations represent a significant part of our growth strategy. Our identified drilling locations are made up of drillable and estimated locations. Drillable locations are mapped locations that our reserve engineers have deemed to have a high likelihood of being drilled or are currently in development but have not yet commenced production. Drillable locations are subject to change, and their determination is based on many of the same assumptions and projections as with determining our reserve estimates. Estimated locations are calculated assuming 115 acre spacing for the Marcellus Shale. Our reserve engineers have deemed further de-risking of our Upper Devonian and Utica Shale acreage is required before including estimated well locations on this acreage in our identified drilling locations. Estimated locations are not mapped locations and are highly dependent on the interpretations of available technical data and assumptions that we use in determining our drillable locations. As a result, changes in our determination of drillable locations may have an effect on our calculation of estimated locations. For example, changes to our well spacing assumptions with respect to our drillable locations could have a significant impact on our estimated locations.
Our ability to drill and develop these locations depends on a number of uncertainties, including natural gas and oil prices, the availability and cost of capital, drilling and production costs, availability of drilling services and equipment, drilling results, lease expirations, gathering system and pipeline transportation constraints, access to and availability of water sourcing and distribution systems, regulatory approvals and other factors. Because of these uncertain factors, we do not know if the numerous drilling locations we have identified will ever be drilled or if we will be able to produce natural gas or oil from these or any other identified drilling locations. In addition, unless production is established within the spacing units covering the undeveloped acres on which some of the potential locations are obtained, the leases for such acreage will expire. Further, certain of the horizontal wells we intend to drill in the future may require unitization with adjacent leaseholds controlled by third parties. If these third parties are unwilling to unitize such leaseholds with ours, this may limit the total locations we can drill. As such, our actual drilling activities may materially differ from those presently identified.
As of June 30, 2016, we had 1,361 identified drilling locations. As a result of the limitations described above, we may be unable to drill many of our identified drilling locations. In addition, we
31
will require significant additional capital over a prolonged period in order to pursue the development of these locations, and we may not be able to raise or generate the capital required to do so. Any drilling activities we are able to conduct on these potential locations may not be successful or result in our ability to add additional proved reserves to our overall proved reserves or may result in a downward revision of our estimated proved reserves, which could have a material adverse effect on our future business and results of operations. For more information on our identified drilling locations, please see "Business — Our Operations — Reserve Data — Determination of Identified Drilling Locations".
The development of our estimated proved undeveloped reserves may take longer and may require higher levels of capital expenditures than we currently anticipate. Therefore, our estimated proved undeveloped reserves may not be ultimately developed or produced.
At December 31, 2015, 60% of our total estimated proved reserves were classified as proved undeveloped. Our approximately 1,137.4 Bcfe of estimated proved undeveloped reserves as of that date will require an estimated $575.2 million of development capital over the next five years. Development of these undeveloped reserves may take longer and require higher levels of capital expenditures than we currently anticipate. Delays in the development of our reserves, increases in costs to drill and develop such reserves, or decreases in commodity prices will reduce the value of our estimated proved undeveloped reserves and future net revenues estimated for such reserves and may result in some projects becoming uneconomic. In addition, delays in the development of reserves could cause us to have to reclassify our proved undeveloped reserves as unproved reserves.
Our acreage must be drilled before lease expiration, generally within three to five years, in order to hold the acreage by production. In a highly competitive market for acreage, failure to drill sufficient wells to hold acreage may result in a substantial lease renewal cost, or if renewal is not feasible, loss of our lease and prospective drilling opportunities.
Leases on our oil and natural gas properties typically have a term of three to five years, after which they expire unless, prior to expiration, production is established within the spacing units covering the undeveloped acres. As of June 30, 2016, approximately 66%, 93% and 17% of our net acreage was held in the Appalachian Basin, Barnett Shale and other areas, respectively, please see "Business — Our Operations — Undeveloped Acreage Expirations". The cost to renew such leases may increase significantly, and we may not be able to renew such leases on commercially reasonable terms or at all. Moreover, many of our leases require lessor consent to unitize, which may make it more difficult to hold our leases by production. Any reduction in our current drilling program, either through a reduction in capital expenditures or the unavailability of drilling rigs, could result in the loss of acreage through lease expirations. We cannot assure you that we will have the liquidity to deploy rigs when needed, or that commodity prices will warrant operating such a drilling program. Our reserves and future production and, therefore, our future cash flow and income are highly dependent on successfully developing our undeveloped leasehold acreage and the loss of any leases could materially and adversely affect our ability to so develop such acreage.
The standardized measure of discounted future net cash flows from our proved reserves will not be the same as the current market value of our estimated oil and natural gas reserves.
You should not assume that the standardized measure of discounted future net cash flows from our proved reserves is the current market value of our estimated oil and natural gas reserves. In accordance with SEC requirements in effect at December 31, 2015, we based the discounted future net cash flows from our proved reserves on the 12-month first-day-of-the-month oil and
32
natural gas average prices without giving effect to derivative transactions. Actual future net cash flows from our oil and natural gas properties will be affected by factors such as:
- •
- actual prices we receive for oil and natural gas;
- •
- actual cost of development and production expenditures;
- •
- the amount and timing of actual production; and
- •
- changes in governmental regulations or taxation.
The timing of both our production and our incurrence of expenses in connection with the development and production of oil and natural gas properties will affect the timing and amount of actual future net revenues from proved reserves, and thus their actual present value. In addition, the 10% discount factor we use when calculating standardized measure may not be the most appropriate discount factor based on interest rates in effect from time to time and risks associated with us or the oil and natural gas industry in general. As a limited liability company treated as a partnership for U.S. federal income tax purposes, our predecessor was not subject to federal taxation. Accordingly, our standardized measure does not provide for federal corporate income taxes because taxable income was passed through to the predecessor members. As a corporation, we will be treated as a taxable entity for federal income tax purposes and our future income taxes will be dependent on our future taxable income. Actual future prices and costs may differ materially from those used in the present value estimates included in this prospectus which could have a material effect on the value of our reserves.
We may incur losses as a result of title defects in the properties in which we invest.
Leases in the Appalachian Basin are particularly vulnerable to title deficiencies due to the long history of land ownership in the area, resulting in extensive and complex chains of title. In the course of acquiring the rights to develop oil and natural gas, it is standard procedure for us and the lessor to execute a lease agreement with payment subject to title verification. In most cases, we incur the expense of retaining lawyers to verify the rightful owners of the oil and gas interests prior to payment of such lease bonus to the lessor. There is no certainty, however, that a lessor has valid title to their lease's oil and gas interests. In those cases, such leases are generally voided and payment is not remitted to the lessor. As such, title failures may result in fewer net acres to us. Prior to the drilling of an oil or natural gas well, however, it is the normal practice in our industry for the person or company acting as the operator of the well to obtain a preliminary title review to ensure there are no obvious defects in title to the well. Frequently, as a result of such examinations, certain curative work must be done to correct defects in the marketability of the title, and such curative work entails expense. Our failure to cure any title defects may delay or prevent us from utilizing the associated mineral interest, which may adversely impact our ability in the future to increase production and reserves. Accordingly, undeveloped acreage has greater risk of title defects than developed acreage. If there are any title defects or defects in assignment of leasehold rights in properties in which we hold an interest, we will suffer a financial loss.
Unless we replace our reserves with new reserves and develop those reserves, our reserves and production will decline, which would adversely affect our future cash flows and results of operations.
Producing natural gas reservoirs generally are characterized by declining production rates that vary depending upon reservoir characteristics and other factors. Unless we conduct successful ongoing development and exploration activities or continually acquire properties containing proved reserves, our proved reserves will decline as those reserves are produced. Our future natural gas reserves and production, and therefore our future cash flow and results of operations, are highly
33
dependent on our success in efficiently developing and exploiting our current reserves and economically finding or acquiring additional recoverable reserves. We may not be able to develop, find or acquire sufficient additional reserves to replace our current and future production. If we are unable to replace our current and future production, the value of our reserves will decrease, and our business, financial condition and results of operations would be adversely affected.
Conservation measures and technological advances could reduce demand for oil and natural gas.
Fuel conservation measures, alternative fuel requirements, increasing consumer demand for alternatives to oil and natural gas, technological advances in fuel economy and energy generation devices could reduce demand for oil and natural gas. The impact of the changing demand for oil and gas services and products may have a material adverse effect on our business, financial condition, results of operations and cash flows.
Our derivative activities could result in financial losses or could reduce our earnings.
To achieve more predictable cash flows and reduce our exposure to adverse fluctuations in the prices of natural gas, we enter into derivative instrument contracts for a significant portion of our natural gas production, including fixed-price swaps. As of July 31, 2016, we had entered into hedging contracts through 2019 covering a total of approximately 219 TBtu of our projected natural gas, NGLs and oil production at a weighted average price of $3.04 per MMBtu. For the period from January 1, 2017 to December 31, 2017, we have hedged approximately 2.26 Bcfe of our projected natural gas, NGLs and oil production at a weighted average price of $2.43 per MMBtu. Accordingly, earnings may fluctuate significantly as a result of changes in fair value of our derivative instruments.
Derivative instruments also expose us to the risk of financial loss in some circumstances, including when:
- •
- production is less than the volume covered by the derivative instruments;
- •
- the counterparty to the derivative instrument defaults on its contractual obligations;
- •
- there is an increase in the differential between the underlying price in the derivative instrument and actual prices received; or
- •
- there are issues with regard to legal enforceability of such instruments.
The use of derivatives may, in some cases, require the posting of cash collateral with counterparties. If we enter into derivative instruments that require cash collateral and commodity prices or interest rates change in a manner adverse to us, our cash otherwise available for use in our operations would be reduced which could limit our ability to make future capital expenditures and make payments on our indebtedness, and which could also limit the size of our borrowing base. Future collateral requirements will depend on arrangements with our counterparties, highly volatile oil and natural gas prices and interest rates.
Our hedging transactions expose us to risk of financial loss if a counterparty fails to perform under a derivative contract. Disruptions in the financial markets could lead to sudden decreases in a counterparty's liquidity, which could make them unable to perform under the terms of the derivative contract and we may not be able to realize the benefit of the derivative contract. As of June 30, 2016, the estimated fair value of our commodity derivative contracts was a liability of approximately $9.5 million. Any default by the counterparty to these derivative contracts when they become due would have a material adverse effect on our financial condition and results of operations.
34
In addition, derivative arrangements could limit the benefit we would receive from increases in the prices for natural gas, NGLs and oil which could also have an adverse effect on our financial condition. If natural gas or oil prices upon settlement of our derivative contracts exceed the price at which we have hedged our commodities, we will be obligated to make cash payments to our hedge counterparties, which could, in certain circumstances, be significant.
The inability of our significant customers or working interest holders to meet their obligations to us may adversely affect our financial results.
In addition to credit risk related to receivables from commodity derivative contracts, our combined principal exposures to credit risk are through joint interest receivables ($4.4 million at June 30, 2016) and the sale of our natural gas production ($24.1 million in receivables at June 30, 2016), which we primarily market to four natural gas marketing companies. Joint interest receivables arise from billing entities who own partial interest in the wells we operate. These entities participate in our wells primarily based on their ownership in leased properties on which we wish to drill. We can do very little to choose who participates in our wells. We are also subject to credit risk due to concentration of our natural gas receivables with several significant customers. We do not require our customers to post collateral. The inability or failure of our significant customers or working interest holders to meet their obligations to us or their insolvency or liquidation may adversely affect our financial results.
Our operations are subject to governmental laws and regulations relating to the protection of the environment, which may expose us to significant costs and liabilities that could exceed current expectations.
Our operations are subject to stringent and complex federal, state and local laws and regulations governing the discharge of materials into the environment, health and safety aspects of our operations, or otherwise relating to environmental protection. These laws and regulations may impose numerous obligations applicable to our operations including the acquisition of a permit before conducting regulated drilling activities; the restriction of types, quantities and concentration of materials that can be released into the environment; the limitation or prohibition of drilling activities on certain lands lying within wilderness, wetlands and other protected areas; the application of specific health and safety criteria addressing worker protection; and the imposition of substantial liabilities for pollution resulting from our operations. Numerous governmental authorities, such as the U.S. Environmental Protection Agency ("EPA"), and analogous state agencies have the power to enforce compliance with these laws and regulations and the permits issued under them. Such enforcement actions often involve taking difficult and costly compliance measures or corrective actions. Failure to comply with these laws and regulations may result in the assessment of sanctions, including administrative, civil or criminal penalties, the imposition of investigatory or remedial obligations, and the issuance of orders limiting or prohibiting some or all of our operations. In addition, we may experience delays in obtaining or be unable to obtain required permits, which may delay or interrupt our operations and limit our growth and revenue.
Certain environmental laws impose strict as well as joint and several liability for costs required to remediate and restore sites where hazardous substances, hydrocarbons, or solid wastes have been stored or released. We may be required to remediate contaminated properties currently or formerly operated by us or facilities of third parties that received waste generated by our operations regardless of whether such contamination resulted from the conduct of others or from consequences of our own actions that were in compliance with all applicable laws at the time those actions were taken. In connection with certain acquisitions, we could acquire, or be required to provide indemnification against, environmental liabilities that could expose us to material losses. In addition, claims for damages to persons or property, including natural resources, may result from
35
the environmental, health and safety impacts of our operations. Our insurance may not cover all environmental risks and costs or may not provide sufficient coverage if an environmental claim is made against us. Moreover, public interest in the protection of the environment has increased dramatically in recent years. The trend of more expansive and stringent environmental legislation and regulations applied to the crude oil and natural gas industry could continue, resulting in increased costs of doing business and consequently affecting profitability. For example, the EPA has designated energy extraction as one of six national enforcement initiatives for FY 2014-2016 and FY 2017-2019, and has indicated that the agency will direct resources towards addressing incidences of noncompliance from natural gas extraction and production activities. Also, in May 2016, the EPA finalized rules regarding criteria for aggregating multiple small surface sites into a single source for air-quality permitting purposes applicable to the oil and gas industry. This rule could cause small facilities, on an aggregate basis, to be deemed a major source, thereby triggering more stringent air permitting requirements. To the extent laws are enacted or other governmental action is taken that restricts drilling or imposes more stringent and costly operating, waste handling, disposal and cleanup requirements, our business, prospects, financial condition or results of operations could be materially adversely affected.
Changes in laws or government regulations regarding hydraulic fracturing could increase our costs of doing business, limit the areas in which we can operate and reduce our oil and natural gas production, which could adversely impact our business.
Hydraulic fracturing is an important and common practice that is used to stimulate production of natural gas and/or oil from dense subsurface rock formations. Hydraulic fracturing involves the injection of water, sand or alternative proppant and chemicals under pressure into target geological formations to fracture the surrounding rock and stimulate production. We regularly use hydraulic fracturing as part of our operations. Recently, there has been increased public concern regarding an alleged potential for hydraulic fracturing to adversely affect drinking water supplies, and proposals have been made to enact separate federal, state and local legislation that would increase the regulatory burden imposed on hydraulic fracturing.
In addition, EPA has asserted federal regulatory authority pursuant to the Safe Drinking Water Act over certain hydraulic fracturing activities involving the use of diesel fuels and published permitting guidance in February 2014 addressing the performance of such activities using diesel fuels in those states where EPA is the permitting authority. In May 2014, the EPA issued an Advance Notice of Proposed Rulemaking to collect data on chemicals used in hydraulic fracturing operations under Section 8 of the Toxic Substances Control Act; the EPA has indicated that it intends to publish a final notice of proposed rulemaking in December 2016. Further, the EPA finalized regulations under the federal Clean Water Act ("CWA") in June 2016 prohibiting wastewater discharges from hydraulic fracturing and certain other natural gas operations to publicly-owned wastewater treatment plants. Also, in June 2015, the EPA released its draft report on the potential impacts of hydraulic fracturing on drinking water resources. The EPA report concluded that hydraulic fracturing activities have not led to widespread, systemic impacts on drinking water resources in the United States, although there are above and below ground mechanisms by which hydraulic fracturing activities have the potential to impact drinking water resources. The draft report is expected to be finalized in 2016 after a public comment period and a formal review by the EPA's Science Advisory Board. In addition, the federal Bureau of Land Management finalized rules in March 2015 that impose new or more stringent standards for performing hydraulic fracturing on federal and American Indian lands; however, the U.S. District Court of Wyoming struck down this rule in June 2016. An appeal of this decision is pending.
Presently, hydraulic fracturing is regulated primarily at the state level, typically by state oil and natural gas commissions and similar agencies. Along with several other states, Pennsylvania, Texas,
36
Colorado and Utah (where we conduct operations) have adopted laws and proposed regulations that require oil and natural gas operators to disclose chemical ingredients and water volumes used to hydraulically fracture wells, in addition to more stringent well construction and monitoring requirements. In addition, local governments may also adopt ordinances within their jurisdictions regulating the time, place and manner of drilling activities in general or hydraulic fracturing activities in particular or prohibit the performance of well drilling in general or hydraulic fracturing in particular. For example, the Pennsylvania Supreme Court has limited the state's ability to limit such ordinances at and strengthened the ability of municipalities to enact local ordinances regulating drilling activities. There are also numerous ballot measures being considered in Colorado, including measures granting greater autonomy to local governments to impose setback requirements for oil and gas facilities or ban certain businesses from operating in their jurisdictions. If new or more stringent federal, state, or local legal restrictions relating to the hydraulic fracturing process are adopted in areas where we operate, we could incur potentially significant added costs to comply with such requirements, experience delays or curtailment in the pursuit of exploration, development, or production activities, and perhaps even be precluded from drilling wells.
In light of concerns about seismic activity being triggered by the injection of produced waters into underground wells, certain regulators are also considering additional requirements related to seismic safety for hydraulic fracturing activities. A 2015 U.S. Geological Survey report identified eight states, including Texas, with areas of increased rates of induced seismicity that could be attributed to fluid injection or oil and gas extraction. In 2014, Texas adopted new oil and gas permit rules for wells used to dispose of saltwater and other fluids resulting from the production of oil and natural gas in order to address these seismic activity concerns within the state. Among other things, the rules require companies seeking permits for disposal wells to provide seismic activity data in permit applications, provide for more frequent monitoring and reporting for certain wells, and allow the state to modify, suspend, or terminate permits on grounds that a disposal well is likely to be, or determined to be, causing seismic activity.
Federal and state legislative and regulatory initiatives relating to pipeline safety that require the use of new or more stringent safety controls or result in more stringent enforcement of applicable legal requirements could subject us to increased capital costs, operational delays and costs of operation.
Pursuant to the authority under the Natural Gas Pipeline Safety Act ("NGPSA") and the Hazardous Liquid Pipeline Safety Act ("HLPSA"), as amended by the Pipeline Safety Improvement Act of 2002, the Pipeline Inspection, Protection, Enforcement and Safety Act of 2006 and the Pipeline Safety, Regulatory Certainty, and Job Creation Act of 2011 ("2011 Pipeline Safety Act"), the Pipeline and Hazardous Materials Safety Administration ("PHMSA") has promulgated regulations requiring pipeline operators to develop and implement integrity management programs for certain gas and hazardous liquid pipelines that, in the event of a pipeline leak or rupture could affect "high consequence areas", which are areas where a release could have the most significant adverse consequences, including high-population areas, certain drinking water sources and unusually sensitive ecological areas. These regulations require operators of covered pipelines to:
- •
- perform ongoing assessments of pipeline integrity;
- •
- identify and characterize applicable threats to pipeline segments that could impact a high consequence area;
- •
- improve data collection, integration and analysis;
- •
- repair and remediate the pipeline as necessary; and
- •
- implement preventive and mitigating actions.
37
In addition, states have adopted regulations similar to existing PHMSA regulations for certain intrastate gas and hazardous liquid pipelines. At this time, we cannot predict the ultimate cost of compliance with applicable pipeline integrity management regulations, as the cost will vary significantly depending on the number and extent of any repairs found to be necessary as a result of pipeline integrity testing, but the results of these tests could cause us to incur significant and unanticipated capital and operating expenditures for repairs or upgrades deemed necessary to ensure the safe and reliable operation of our pipelines.
The 2011 Pipeline Safety Act is the most recent federal legislation to amend the NGPSA and HLPSA pipeline safety laws, requiring increased safety measures for gas and hazardous liquids pipelines. Among other things, the 2011 Pipeline Safety Act directs the Secretary of Transportation to promulgate regulations relating to expanded integrity management requirements, automatic or remote-controlled valve use, excess flow valve use, leak detection system installation, testing to confirm the material strength of certain pipelines, and operator verification of records confirming the maximum allowable pressure of certain intrastate gas transmission pipelines. Changes to pipeline safety laws by Congress and regulations by PHMSA or states that result in more stringent or costly safety standards could have a significant adverse effect on us and similarly situated midstream operators.
For example, in March of 2015, PHMSA finalized new rules applicable to gas and hazardous liquid pipelines that, among other changes, impose new post-construction inspections, welding, gas component pressure testing requirements, as well as requirements for calculating pressure reductions for immediate repairs on liquid pipelines. Also, in October 2015, PHMSA proposed new regulations for hazardous liquid pipelines that would significantly extend and expand the reach of certain PHMSA integrity management requirements (i.e., periodic assessments, repairs and leak detection), regardless of the pipeline's proximity to a high consequence area. The proposal also requires new reporting requirements for certain unregulated pipelines, including all gathering lines. More recently, in March 2016, pursuant to one of the requirements in 2011 Pipeline Safety Act, PHMSA published a proposed rulemaking that would expand integrity management requirements and impose new pressure testing requirements on currently regulated pipelines. The proposal would also significantly expand the regulation of gathering lines, subjecting previously unregulated pipelines to requirements regarding damage prevention, corrosion control, public education programs, maximum allowable operating pressure limits, and other requirements. The safety enhancement requirements and other provisions of the 2011 Pipeline Safety Act as well as any implementation of PHMSA, rules thereunder could require us to install new or modified safety controls, pursue additional capital projects, or conduct maintenance programs on an accelerated basis, any or all of which tasks could result in our incurring increased operating costs that could have a material adverse effect on our results of operations or financial position.
Moreover, effective October 2013, PHMSA adopted new rules increasing the maximum administrative civil penalties for violation of the pipeline safety laws and regulations that occur after January 3, 2012 to $200,000 per violation per day and up to $2 million for a related series of violations. Federal and state legislative and regulatory initiatives relating to pipeline safety that require the use of new or more stringent safety controls or result in more stringent enforcement of applicable legal requirements could subject us to increased capital costs, operational delays and costs of operation.
38
Oil and natural gas producers' operations, especially those using hydraulic fracturing, are substantially dependent on the availability of water. Restrictions on the ability to obtain water for exploration and production activities and the disposal of produced water may impact our operations.
Water is an essential component of oil and natural gas production during the drilling and, in particular, hydraulic fracturing, process. Our inability to locate sufficient amounts of water, or dispose of or recycle water used in our exploration and production operations, could adversely impact our operations.
Moreover, the imposition of new environmental initiatives and regulations could include restrictions on our ability to conduct certain operations such as hydraulic fracturing or disposal of waste, including, but not limited to, produced water, drilling fluids and other wastes associated with the exploration, development or production of natural gas. The CWA imposes restrictions and strict controls regarding the discharge of pollutants into navigable waters. Permits must be obtained to discharge pollutants to waters and to conduct construction activities in waters and wetlands. The CWA and similar state laws provide for civil, criminal and administrative penalties for any unauthorized discharges of pollutants and unauthorized discharges of reportable quantities of oil and other hazardous substances. State and federal discharge regulations prohibit the discharge of produced water and sand, drilling fluids, drill cuttings and certain other substances related to the natural gas and oil industry into coastal waters. Specific to Pennsylvania, sending wastewater to publicly owned treatment works requires certain levels of pretreatment that may effectively prohibit this method as a disposal option, leaving disposal via saltwater disposal injection well as our primary option. Our continued ability to use injection wells as a disposal option on economic terms not only will depend on federal or state regulations but also on the cost and availability of wells with sufficient storage capacities. The EPA has also adopted regulations requiring certain natural gas and oil exploration and production facilities to obtain permits for storm water discharges. Compliance with current and future environmental regulations and permit requirements governing the withdrawal, storage and use of surface water or groundwater necessary for hydraulic fracturing of wells and any inability to secure transportation and access to disposal wells with sufficient capacity to accept all our produced water on economic terms may increase our operating costs and cause delays, interruptions or termination of our operations, the extent of which cannot be predicted.
We are subject to risks associated with climate change.
In response to findings that emissions of carbon dioxide, methane and other GHGs present an endangerment to public health and the environment, the EPA has adopted regulations under existing provisions of the federal Clean Air Act that, among other things, establish PSD, construction and Title V operating permit reviews for certain large stationary sources. Facilities required to obtain PSD permits for their GHG emissions also will be required to meet "best available control technology" standards that will be established on a case-by-case basis. EPA rulemakings related to GHG emissions could adversely affect our operations and restrict or delay our ability to obtain air permits for new or modified sources. In addition, the EPA has adopted rules requiring the monitoring and reporting of GHG emissions from specified onshore and offshore oil and gas production sources in the United States on an annual basis, which include certain of our operations. Recently, in December 2015, the EPA finalized rules that added new sources to the scope of the greenhouse gases monitoring and reporting rule. These new sources include gathering and boosting facilities as well as completions and workovers from hydraulically fractured oil wells. The revisions also include the addition of well identification reporting requirements for certain facilities. Furthermore, in May 2016, the EPA finalized rules that establish new controls for emissions of methane from new, modified or reconstructed sources in the oil and natural gas source category, including production, processing, transmission and storage activities. The rule
39
includes first-time standards to address emissions of methane from equipment and processes across the source category, including hydraulically fractured oil and natural gas well completions. The EPA has also announced that it intends to impose methane emission standards for existing sources as well but, to date, has not yet issued a proposal. The BLM has also proposed rules to reduce methane emissions from venting, flaring, and leaking on public lands. As a result of this continued regulatory focus, future federal GHG regulations of the oil and gas industry remain a possibility.
Several states, including Colorado and Pennsylvania, are pursuing similar measures to regulate emissions of methane from new and existing sources within the oil and natural gas source category. Compliance with these rules will require enhanced record-keeping practices, the purchase of new equipment, such as optical gas imaging instruments to detect leaks, and increased frequency of maintenance and repair activities to address emissions leakage. These rules will also likely require additional personnel time to support these activities or the engagement of third party contractors to assist with and verify compliance. These new and proposed rules could result in increased compliance costs on our operations.
While Congress has from time to time considered legislation to reduce emissions of GHGs, there has not been significant activity in the form of adopted legislation to reduce GHG emissions at the federal level in recent years. In the absence of federal climate legislation, a number of state and regional efforts have emerged that are aimed at tracking and/or reducing GHG emissions by means of cap and trade programs that typically require major sources of GHG emissions to acquire and surrender emission allowances in return for emitting those GHGs. Although it is not possible at this time to estimate how potential future laws or regulations addressing GHG emissions would impact our business, either directly or indirectly, any future federal, state or local laws or implementing regulations that may be adopted to address GHG emissions in areas where we operate could require us to incur increased operating costs. Regulation of GHGs could also result in a reduction in demand for and production of oil and natural gas, which would result in a decrease in demand for our services and adversely affect our financial position and results of operations. Finally, it should be noted that some scientists have concluded that increasing concentrations of GHGs in the Earth's atmosphere may produce climate changes that have significant physical effects, such as increased frequency and severity of storms, floods and other climatic events. If any such effects were to occur, they could adversely affect or delay demand for the oil or natural gas produced by our customers or otherwise cause us to incur significant costs in preparing for or responding to those effects.
We may incur substantial losses and be subject to substantial liability claims as a result of our operations. Additionally, we may not be insured for, or our insurance may be inadequate to protect us against, these risks.
Our exploration and production activities are subject to all of the operating risks associated with drilling for and producing natural gas, including the possibility of:
- •
- environmental hazards, such as uncontrollable releases of oil, natural gas, brine, well fluids, toxic gas or other pollution into the
environment, including groundwater, air and shoreline contamination;
- •
- abnormally pressured formations;
- •
- mechanical difficulties, such as stuck oilfield drilling and service tools and casing collapse;
- •
- fires, explosions and ruptures of pipelines;
- •
- personal injuries and death;
- •
- natural disasters; and
- •
- terrorist attacks targeting natural gas and oil related facilities and infrastructure.
40
Any of these risks could adversely affect our ability to conduct operations or result in substantial loss to us as a result of claims for:
- •
- injury or loss of life;
- •
- damage to and destruction of property, natural resources and equipment;
- •
- pollution and other environmental damage;
- •
- regulatory investigations and penalties;
- •
- suspension of our operations; and
- •
- repair and remediation costs.
In accordance with what we believe to be customary industry practice, we maintain insurance against some, but not all, of our business risks. Our insurance may not be adequate to cover any losses or liabilities we may suffer. Also, insurance may no longer be available to us or, if it is, its availability may be at premium levels that do not justify its purchase. The occurrence of a significant uninsured claim, a claim in excess of the insurance coverage limits maintained by us or a claim at a time when we are not able to obtain liability insurance could have a material adverse effect on our ability to conduct normal business operations and on our financial condition, results of operations or cash flows. In addition, we may not be able to secure additional insurance or bonding that might be required by new governmental regulations. This may cause us to restrict our operations, which might severely impact our financial condition. We may also be liable for environmental damage caused by previous owners of properties purchased by us, which liabilities may not be covered by insurance.
Since hydraulic fracturing activities are a large part of our operations, they are covered by our insurance against claims made for bodily injury, property damage and clean-up costs stemming from a sudden and accidental pollution event. However, we may not have coverage if we are unaware of the pollution event and unable to report the "occurrence" to our insurance company within the time frame required under our insurance policy. We have no coverage for gradual, long-term pollution events. In addition, these policies do not provide coverage for all liabilities, and we cannot assure you that the insurance coverage will be adequate to cover claims that may arise, or that we will be able to maintain adequate insurance at rates we consider reasonable. A loss not fully covered by insurance could have a material adverse effect on our financial condition, results of operations and cash flows.
We may elect not to obtain insurance for any or all of these risks if we believe that the cost of available insurance is excessive relative to the risks presented. In addition, pollution and environmental risks generally are not fully insurable. The occurrence of an event that is not fully covered by insurance could have a material adverse effect on our business, financial condition and results of operations.
Properties that we decide to drill may not yield natural gas, NGLs or oil in commercially viable quantities.
Properties that we decide to drill that do not yield natural gas, NGLs or oil in commercially viable quantities will adversely affect our results of operations and financial condition. Our project areas are in various stages of development, ranging from project areas with current drilling or production activity to project areas that consist of recently acquired leasehold acreage or that have limited drilling or production history. If the wells in the process of being completed do not produce sufficient revenues to return a profit or if we drill dry holes in the future, our business may be materially affected. In addition, there is no way to predict in advance of drilling and testing whether any particular prospect will yield natural gas, NGLs or oil in sufficient quantities to recover drilling or
41
completion costs or to be economically viable. The use of micro-seismic data and other technologies and the study of producing fields in the same area will not enable us to know conclusively prior to drilling whether natural gas, NGLs or oil will be present or, if present, whether natural gas, NGLs or oil will be present in commercial quantities. We cannot assure you that the analogies we draw from available data from other wells, more fully explored prospects or producing fields will be applicable to our drilling prospects. Further, our drilling operations may be curtailed, delayed or cancelled as a result of numerous factors, including:
- •
- unexpected drilling conditions;
- •
- title problems;
- •
- pressure or lost circulation in formations;
- •
- equipment failure or accidents;
- •
- adverse weather conditions;
- •
- compliance with environmental and other governmental or contractual requirements; and
- •
- increase in the cost of, or shortages or delays in the availability of, electricity, supplies, materials, drilling or workover rigs, equipment and services.
We may be unable to make attractive acquisitions or successfully integrate acquired businesses, and any inability to do so may disrupt our business and hinder our ability to grow.
In the future we may make acquisitions of businesses that complement or expand our current business. We may not be able to identify attractive acquisition opportunities. Even if we do identify attractive acquisition opportunities, we may not be able to complete the acquisition or do so on commercially acceptable terms.
The success of any completed acquisition will depend on our ability to integrate effectively the acquired business into our existing operations. The process of integrating acquired businesses may involve unforeseen difficulties and may require a disproportionate amount of our managerial and financial resources. In addition, possible future acquisitions may be larger and for purchase prices significantly higher than those paid for earlier acquisitions. No assurance can be given that we will be able to identify additional suitable acquisition opportunities, negotiate acceptable terms, obtain financing for acquisitions on acceptable terms or successfully acquire identified targets. Our failure to achieve consolidation savings, to integrate the acquired businesses and assets into our existing operations successfully or to minimize any unforeseen operational difficulties could have a material adverse effect on our financial condition and results of operations.
In addition, our new revolving credit facility will impose certain limitations on our ability to enter into mergers or combination transactions. Our new revolving credit facility will also limit our ability to incur certain indebtedness, which could indirectly limit our ability to engage in acquisitions of businesses.
We depend upon a limited number of significant purchasers for the sale of most of our production. The loss of one or more of these purchasers could, among other factors, limit our access to suitable markets for the hydrocarbons we produce.
The availability of a ready market for any hydrocarbons we produce depends on numerous factors beyond the control of our management, including but not limited to the extent of domestic production and imports of oil, the proximity and capacity of natural gas pipelines, the availability of skilled labor, materials and equipment, the effect of state and federal regulation of oil and natural gas production and federal regulation of natural gas sold in interstate commerce. In addition, we
42
depend upon a limited number of significant purchasers for the sale of most of our production, and our contracts with those customers typically are on a month-to-month basis. The loss of these customers could adversely affect our revenues and have a material and adverse effect on our financial condition and results of operations. We cannot assure you that any of our customers will continue to do business with us or that we will continue to have ready access to suitable markets for our future production.
Market conditions or the availability and capacity of gathering systems, transportation and processing facilities may hinder our access to natural gas, NGLs or oil markets or delay our production.
Market conditions or the unavailability of satisfactory natural gas, NGLs or oil gathering, transportation or processing arrangements may hinder our access to markets or delay our production. The availability of a ready market for our production depends on a number of factors, including the demand for and supply of natural gas, NGLs or oil and the proximity of reserves to pipelines and terminal facilities. Our ability to market our production depends in substantial part on the operation, availability, proximity, capacity and expansion of gathering systems, pipelines and processing facilities owned and operated by third parties. Our failure to obtain such services on acceptable terms could materially harm our business. We may be required to shut in wells due to lack of a market or inadequacy or unavailability of natural gas, NGLs or oil pipeline or gathering system capacity. In addition, if quality specifications for the third-party pipelines with which we connect change so as to restrict our ability to transport product, our access to markets could be impeded. Our access to transportation options, including trucks owned by third parties, may also be affected by U.S. federal and state regulation of natural gas, NGLs and oil production and transportation. If our production becomes shut in for any of these or other reasons, we would be unable to realize revenue from those wells until other arrangements were made to gather, process and deliver the products to market. In addition, we have entered into contracts for firm transportation and any failure to renew those contracts on the same or better commercial terms could increase our costs and our exposure to the risks described above.
The unavailability or high cost of additional drilling rigs, equipment, supplies, personnel and oilfield services could adversely affect our ability to execute our exploration and development plans within our budget and on a timely basis.
The demand for qualified and experienced field personnel to drill wells and conduct field operations, geologists, geophysicists, engineers and other professionals in the oil and natural gas industry can fluctuate significantly, often in correlation with natural gas and oil prices, causing periodic shortages. We intend to continue our one-rig drilling program in the Marcellus Shale; however, certain of the rigs performing work for us do so on a well-by-well basis and can refuse to provide such services at the conclusion of drilling on the current well. Historically, there have been shortages of drilling and workover rigs, pipe and other equipment as demand for rigs and equipment has increased along with the number of wells being drilled. We cannot predict whether these conditions will exist in the future and, if so, what their timing and duration will be. Such shortages could delay or cause us to incur significant expenditures that are not provided for in our capital budget, which could have a material adverse effect on our business, financial condition or results of operations.
43
A change in the jurisdictional characterization of some of our assets by federal, state or local regulatory agencies or a change in policy by those agencies may result in increased regulation of our assets, which may cause our revenues to decline and operating expenses to increase.
Section 1(b) of the Natural Gas Act of 1938 ("NGA") exempts natural gas gathering facilities from regulation by the Federal Energy Regulatory Commission ("FERC"), as a natural gas company under the NGA. We believe that the natural gas pipelines in our gathering systems meet the traditional tests FERC has used to establish a pipeline's status as a gatherer not subject to regulation as a natural gas company. However, the distinction between FERC-regulated transmission services and federally unregulated gathering services is the subject of ongoing litigation, so the classification and regulation of our gathering facilities are subject to change based on future determinations by FERC, the courts or Congress. If the FERC were to consider the status of an individual facility and determine that the facility or services provided by it are not exempt from FERC regulation, the rates for, and terms and conditions of services provided by such facility would be subject to regulation by the FERC. Such regulation could decrease revenues, increase operating costs, and depending upon the facility in question, could adversely affect our results of operations and cash flows. In addition, if any of our facilities were found to have provided services or otherwise operated in violation of the NGA, this could result in the imposition of civil penalties as well as a requirement to disgorge charges collected for such service in excess of the cost-based rate established by the FERC.
State regulation of gathering facilities generally includes various safety, environmental and, in some circumstances, nondiscriminatory take requirements and complaint-based rate regulation. We cannot predict what new or different regulations federal and state regulatory agencies may adopt, or what effect subsequent regulation may have on our activities. Such regulations may have a material adverse effect on our financial condition, result of operations and cash flows.
Should we fail to comply with all applicable FERC administered statutes, rules, regulations and orders, we could be subject to substantial penalties and fines.
Under the Energy Policy Act of 2005 ("EPAct 2005"), FERC has civil penalty authority under the NGA to impose penalties for current violations of up to $1 million per day for each violation and disgorgement of profits associated with any violation. While our systems have not been regulated by FERC as a natural gas company under the NGA, we are required to report aggregate volumes of natural gas purchased or sold at wholesale to the extent such transactions utilize, contribute to, or may contribute to the formation of price indices. In addition, Congress may enact legislation or FERC may adopt regulations that may subject certain of our otherwise non-FERC jurisdictional facilities to further regulation. Failure to comply with those regulations in the future could subject us to civil penalty liability.
Competition in the natural gas industry is intense, making it more difficult for us to acquire properties, market natural gas and secure trained personnel.
Our ability to acquire additional prospects and to find and develop reserves in the future will depend on our ability to evaluate and select suitable properties and to consummate transactions in a highly competitive environment for acquiring properties, marketing natural gas and securing trained personnel. Also, there is substantial competition for capital available for investment in the oil and natural gas industry. Many of our competitors possess and employ financial, technical and personnel resources substantially greater than ours. Those companies may be able to pay more for productive natural gas properties and exploratory prospects and to evaluate, bid for and purchase a greater number of properties and prospects than our financial or personnel resources permit. In addition, other companies may be able to offer better compensation packages to attract and retain
44
qualified personnel than we are able to offer. The cost to attract and retain qualified personnel has increased may increase substantially in the future. We may not be able to compete successfully in the future in acquiring prospective reserves, developing reserves, marketing hydrocarbons, attracting and retaining quality personnel and raising additional capital, which could have a material adverse effect on our business.
The loss of senior management or technical personnel could adversely affect operations.
We depend on the services of our senior management and technical personnel. We do not maintain, nor do we plan to obtain, any insurance against the loss of any of these individuals. The loss of the services of our senior management or technical personnel could have a material adverse effect on our business, financial condition and results of operations.
We are susceptible to the potential difficulties associated with rapid growth and expansion.
We have grown rapidly over the last several years. Our management believes that our future success depends on our ability to manage the rapid growth that we have experienced and the demands from increased responsibility on management personnel. The following factors could present difficulties:
- •
- increased responsibilities for our executive level personnel;
- •
- increased administrative burden;
- •
- increased capital requirements; and
- •
- increased organizational challenges common to large, expansive operations.
Our operating results could be adversely affected if we do not successfully manage these potential difficulties. The historical financial information incorporated herein is not necessarily indicative of the results that may be realized in the future.
Seasonal weather conditions and regulations adversely affect our ability to conduct drilling activities in some of the areas where we operate.
Operations in our operating areas can be adversely affected by seasonal weather conditions and regulations designed to protect various wildlife. This limits our ability to operate in those areas and can intensify competition during those months for drilling rigs, oilfield equipment, services, supplies and qualified personnel, which may lead to periodic shortages. These constraints and the resulting shortages or high costs could delay our operations and materially increase our operating and capital costs.
Increases in interest rates could adversely affect our business.
Our business and operating results can be harmed by factors such as the availability, terms of and cost of capital, increases in interest rates or a reduction in credit rating. These changes could cause our cost of doing business to increase, limit our ability to pursue acquisition opportunities, reduce cash flow used for drilling and place us at a competitive disadvantage. Recent and continuing disruptions and volatility in the global energy capital markets may lead to a contraction in credit availability impacting our ability to finance our operations. We require continued access to capital. A significant reduction in cash flows from operations or the availability of credit could materially and adversely affect our ability to achieve our planned growth and operating results.
45
We may be subject to risks in connection with acquisitions of properties.
The successful acquisition of producing properties requires an assessment of several factors, including:
- •
- recoverable reserves;
- •
- future natural gas, NGLs or oil prices and their applicable differentials;
- •
- operating costs; and
- •
- potential environmental and other liabilities.
The accuracy of these assessments is inherently uncertain. In connection with these assessments, we perform a review of the subject properties that we believe to be generally consistent with industry practices. Our review will not reveal all existing or potential problems nor will it permit us to become sufficiently familiar with the properties to fully assess their deficiencies and capabilities. Inspections may not always be performed on every well, and environmental problems, such as groundwater contamination, are not necessarily observable even when an inspection is undertaken. Even when problems are identified, the seller may be unwilling or unable to provide effective contractual protection against all or part of the problems. We often are not entitled to contractual indemnification for environmental liabilities and acquire properties on an "as is" basis.
The enactment of derivatives legislation, and the promulgation of regulations pursuant thereto, could have an adverse effect on our ability to use derivative instruments to hedge risks associated with our business.
The Dodd-Frank Act, enacted on July 21, 2010, establishes federal oversight and regulation of the over-the-counter derivatives market and entities, such as us, that participate in that market. The Dodd-Frank Act requires the Commodity Futures Trading Commission ("CFTC") and the SEC to promulgate rules and regulations implementing the Dodd-Frank Act. Although the CFTC has finalized some regulations, including critical rulemakings on the definition of "swap", "swap dealer", and "major swap participant", others remain to be finalized and it is not possible at this time to predict when this will be accomplished.
The Dodd-Frank Act authorized the CFTC to establish rules and regulations setting position limits for certain futures and option contracts in the major energy markets and for swaps that are their economic equivalents. The CFTC's initial position limits rules were vacated by the U.S. District Court for the District of Columbia in September 2012. However, on November 5, 2013, the CFTC proposed new rules that would place limits on positions in certain core futures and equivalent swaps contracts for or linked to certain physical commodities, subject to exceptions for certain bona fide hedging transactions. As these new position limit rules are not yet final, the impact of those provisions on us is uncertain at this time.
The CFTC has designated certain interest rate swaps and credit default swaps for mandatory clearing. The CFTC has not yet proposed rules designating any other classes of swaps, including physical commodity swaps, for mandatory clearing. In addition, certain banking regulators and the CFTC have recently adopted final rules establishing minimum margin requirements for uncleared swaps. Although we expect to qualify for the end-user exception from the mandatory clearing, trade execution and margin requirements for swaps entered to hedge our commercial risks, the application of such requirements to other market participants, such as swap dealers, may change the cost and availability of the swaps that we use for hedging. If any of our swaps do not qualify for the commercial end-user exception, posting of collateral could impact liquidity and reduce our cash
46
available for capital expenditures, therefore reducing our ability to execute hedges to reduce risk and protect cash flows.
The Dodd-Frank Act and regulations could significantly increase the cost of derivative contracts, materially alter the terms of derivative contracts, reduce the availability of derivatives to protect against risks we encounter, and reduce our ability to monetize or restructure our existing derivative contracts. If we reduce our use of derivatives as a result of the Dodd-Frank Act and regulations, our results of operations may become more volatile and our cash flows may be less predictable, which could adversely affect our ability to plan for and fund capital expenditures.
Finally, the Dodd-Frank Act was intended, in part, to reduce the volatility of oil and natural gas prices, which some legislators attributed to speculative trading in derivatives and commodity instruments related to oil and natural gas. Our revenues could therefore be adversely affected if a consequence of the Dodd-Frank Act and regulations is lower commodity prices.
In addition, the European Union and other non-U.S. jurisdictions are implementing regulations with respect to the derivatives market. To the extent we transact with counterparties in foreign jurisdictions, we may become subject to such regulations, the impact of which is not clear at this time.
Future legislation may result in the elimination of certain U.S. federal income tax deductions currently available with respect to oil and natural gas exploration and production. Additionally, future federal or state legislation may impose new or increased taxes or fees on oil and natural gas extraction.
Potential legislation, if enacted into law, could make significant changes to U.S. federal and state income tax laws, including the elimination of certain key U.S. federal income tax incentives currently available to oil and gas exploration and production companies. These changes include, but are not limited to, (i) the repeal of the percentage depletion allowance for oil and natural gas properties; (ii) the elimination of current deductions for intangible drilling and development costs; (iii) the elimination of the deduction for certain U.S. production activities; and (iv) an extension of the amortization period for certain geological and geophysical expenditures. It is unclear whether these or similar changes will be enacted and, if enacted, how soon any such changes could become effective. The passage of this legislation or any other similar changes in U.S. federal and state income tax laws could eliminate or postpone certain tax deductions that are currently available with respect to oil and natural gas exploration and development, and any such change could negatively affect our financial condition and results of operations. Moreover, President Obama has proposed, as part of the Budget of the United States Government for Fiscal Year 2017, to impose an "oil fee" of $10.25 on a per barrel equivalent of crude oil. This fee would be collected on domestically produced and imported petroleum products. The fee would be phased in evenly over five years, beginning October 1, 2016. The adoption of this, or similar proposals, could result in increased operating costs and/or reduced consumer demand for petroleum products, which in turn could affect the prices we receive for our oil.
Pennsylvania imposes an annual natural gas impact fee on natural gas and oil operators in Pennsylvania for each well drilled for a period of fifteen years. The fee is on a sliding scale set by the Public Utility Commission and is based on two factors: changes in the Consumer Price Index and the average NYMEX natural gas prices from the last day of each month. There can be no assurance that the impact fee will remain as currently structured or that new or additional taxes will not be imposed.
47
Ohio has previously considered, and its legislature continues to consider, proposals to increase the current severance tax imposed on natural gas or oil in Ohio. There is currently no severance tax imposed on natural gas or oil in Pennsylvania. However, it is possible that each of these states could propose and implement a new or increased severance tax in the coming years, which would negatively affect our future cash flows and financial condition.
Our method of accounting for investments in oil and natural gas properties may result in ceiling test write-downs, which could negatively impact our results of operations.
We account for our oil and natural gas producing activities using the full cost method of accounting. Accordingly, all costs incurred in the acquisition, exploration and development of proved oil and natural gas properties, including the costs of abandoned properties, dry holes, geophysical costs and annual lease rentals are capitalized. We also capitalize direct operating costs for services performed with internally owned drilling and well servicing equipment. All general and administrative corporate costs unrelated to drilling activities are expensed as incurred. Sales or other dispositions of oil and natural gas properties are generally accounted for as adjustments to capitalized costs, with no gain or loss recorded unless the ratio of cost to proved reserves would significantly change. Depletion of evaluated oil and natural gas properties is computed on the units of production method based on proved reserves. The average depletion rate per MMcfe of production for our predecessor and Vantage I was $0.88 and $0.99 for 2015, respectively, and $1.13 and $1.24 for 2014, respectively. Total depletion expense for oil and natural gas properties for our predecessor and Vantage I was $36.3 million and $45.7 million for 2015, respectively, and $16.5 million and $35.1 million for 2014, respectively. The net capitalized costs of proved oil and natural gas properties are subject to a full cost ceiling limitation in which the costs are not allowed to exceed their related estimated future net revenues discounted at 10%. To the extent capitalized costs of evaluated oil and natural gas properties, net of accumulated depreciation, depletion, amortization, accretion and impairment exceed the discounted future net revenues of proved reserves plus the cost of properties not being amortized, the lower of cost or estimated fair value of unproven properties included in the costs being amortized, and all related income tax effects, the excess capitalized costs are charged to expense.
Accounting rules require that we review the net capitalized costs of our properties quarterly, using a single price based on the beginning-of-the-month average of oil and natural gas prices for the preceding 12 months. We also assess investments in unproved properties periodically to determine whether impairment has occurred. The risk that we will be required to further write down the carrying value of our oil and gas properties increases when oil and natural gas prices are low or volatile. In addition, write-downs may occur if we experience substantial downward adjustments to our estimated proved reserves or our unproved property values, or if estimated future development costs increase. Our predecessor and Vantage I incurred approximately $172.7 million and $344.4 million of impairment charges during 2015, respectively, and $81.7 million and $156.0 million of impairment charges during the six months ended June 30, 2016, respectively. Recently, commodity prices have declined significantly and have remained depressed thus far in 2016. For example, the NYMEX Henry Hub spot market price declined from a high of approximately $6.00 per MMBtu in 2014 to below $1.70 per MMBtu in March 2016. Natural gas and oil prices have remained depressed thus far in 2016, and lower commodity prices in the future could result in further impairments of our properties, which could have a material adverse effect on our results of operations for the periods in which such charges are taken. Please read "Management's Discussion and Analysis of Financial Condition and Results of Operations — Critical Accounting Policies and Estimates" for a more detailed description of our method of accounting.
48
Risks Related to the Offering and our Common Stock
The requirements of being a public company, including compliance with the reporting requirements of the Securities Exchange Act of 1934, as amended (the "Exchange Act"), and the requirements of the Sarbanes-Oxley Act, may strain our resources, increase our costs and distract management, and we may be unable to comply with these requirements in a timely or cost-effective manner.
As a public company, we will need to comply with new laws, regulations and requirements, certain corporate governance provisions of the Sarbanes-Oxley Act of 2002, related regulations of the SEC and the requirements of the NYSE, with which we are not required to comply as a private company. Complying with these statutes, regulations and requirements will occupy a significant amount of time of our board of directors and management and will significantly increase our costs and expenses. We will need to:
- •
- institute a more comprehensive compliance function;
- •
- comply with rules promulgated by the NYSE;
- •
- continue to prepare and distribute periodic public reports in compliance with our obligations under the federal securities laws;
- •
- establish new internal policies, such as those relating to insider trading; and
- •
- involve and retain to a greater degree outside counsel and accountants in the above activities.
Furthermore, while we generally must comply with Section 404 of the Sarbanes Oxley Act of 2002 for our fiscal year ended December 31, 2016, we are not required to have our independent registered public accounting firm attest to the effectiveness of our internal controls until our first annual report subsequent to our ceasing to be an "emerging growth company" within the meaning of Section 2(a)(19) of the Securities Act. Accordingly, we may not be required to have our independent registered public accounting firm attest to the effectiveness of our internal controls until as late as our annual report for the fiscal year ending December 31, 2022. Once it is required to do so, our independent registered public accounting firm may issue a report that is adverse in the event it is not satisfied with the level at which our controls are documented, designed, operated or reviewed. Compliance with these requirements may strain our resources, increase our costs and distract management; and we may be unable to comply with these requirements in a timely or cost-effective manner.
In addition, we expect that being a public company subject to these rules and regulations may make it more difficult and more expensive for us to obtain director and officer liability insurance and we may be required to accept reduced policy limits and coverage or incur substantially higher costs to obtain the same or similar coverage. As a result, it may be more difficult for us to attract and retain qualified individuals to serve on our board of directors or as executive officers. We are currently evaluating these rules, and we cannot predict or estimate the amount of additional costs we may incur or the timing of such costs.
There is no existing market for our common stock, and we do not know if one will develop to provide you with adequate liquidity to sell our common stock at prices equal to or greater than the price you paid in this offering.
Prior to this offering, there has not been a public market for our common stock. We cannot predict the extent to which investor interest in our company will lead to the development of an active trading market on the stock exchange on which we list our common stock or otherwise or how liquid that market might become. If an active trading market does not develop, you may have
49
difficulty selling any of our common stock that you buy. The initial public offering price for the common stock was determined by negotiations between us and the representatives of the underwriters and may not be indicative of prices that will prevail in the open market following this offering. Consequently, you may not be able to sell our common stock at prices equal to or greater than the price you paid in this offering, or at all.
The initial public offering price of our common stock may not be indicative of the market price of our common stock after this offering. In addition, an active, liquid and orderly trading market for our common stock may not develop or be maintained, and our stock price may be volatile.
Prior to this offering, our common stock was not traded on any market. An active, liquid and orderly trading market for our common stock may not develop or be maintained after this offering. Active, liquid and orderly trading markets usually result in less price volatility and more efficiency in carrying out investors' purchase and sale orders. The market price of our common stock could vary significantly as a result of a number of factors, some of which are beyond our control. In the event of a drop in the market price of our common stock, you could lose a substantial part or all of your investment in our common stock. The initial public offering price was determined by negotiations between us and representatives of the underwriters, based on numerous factors which we discuss in "Underwriting", and may not be indicative of the market price of our common stock after this offering. Consequently, you may not be able to sell shares of our common stock at prices equal to or greater than the price paid by you in this offering.
The following factors could affect our stock price:
- •
- our operating and financial performance and drilling locations, including reserve estimates;
- •
- the public reaction to our press releases, our other public announcements and our filings with the SEC;
- •
- strategic actions by our competitors;
- •
- our failure to meet revenue, reserves, production or earnings estimates by research analysts or other investors;
- •
- changes in revenue or earnings estimates, or changes in recommendations or withdrawal of research coverage, by equity research
analysts;
- •
- speculation in the press or investment community;
- •
- the failure of research analysts to cover our common stock;
- •
- sales of our common stock by us or other stockholders, or the perception that such sales may occur;
- •
- changes in accounting principles, policies, guidance, interpretations or standards;
- •
- additions or departures of key management personnel;
- •
- actions by our stockholders;
- •
- general market conditions, including fluctuations in commodity prices;
- •
- domestic and international economic, legal and regulatory factors unrelated to our performance; and
- •
- the realization of any risks describes under this "Risk Factors" section.
50
The stock markets in general have experienced extreme volatility that has often been unrelated to the operating performance of particular companies. These broad market fluctuations may adversely affect the trading price of our common stock. Securities class action litigation has often been instituted against companies following periods of volatility in the overall market and in the market price of a company's securities. Such litigation, if instituted against us, could result in very substantial costs, divert our management's attention and resources and harm our business, operating results and financial condition.
Vantage Investment I, Vantage Investment II and the Management Members will collectively hold a substantial majority of our common stock.
Immediately following the completion of this offering, Vantage Investment I, Vantage Investment II and the Management Members will hold approximately %, % and %, respectively, of our common stock. Vantage Investment I and Vantage Investment II (and indirectly, our Sponsors) will have the collective voting power to elect all of the members of our board of directors and thereby control our management and affairs. In addition, they will be able to determine the outcome of all matters requiring stockholder approval, including mergers and other material transactions, and will be able to cause or prevent a change in the composition of our board of directors or a change in control of our company that could deprive our stockholders of an opportunity to receive a premium for their common stock as part of a sale of our company. The existence of significant stockholders may also have the effect of deterring hostile takeovers, delaying or preventing changes in control or changes in management, or limiting the ability of our other stockholders to approve transactions that they may deem to be in the best interests of our company.
So long as our Sponsors continue to control a significant amount of our common stock, they will continue to be able to strongly influence all matters requiring stockholder approval, regardless of whether or not other stockholders believe that a potential transaction is in their own best interests. In any of these matters, the interests of our Sponsors may differ or conflict with the interests of our other stockholders. Moreover, this concentration of stock ownership may also adversely affect the trading price of our common stock to the extent investors perceive a disadvantage in owning stock of a company with a controlling stockholder.
Conflicts of interest could arise in the future between us, on the one hand, and our Sponsors and their affiliates, including their portfolio companies, and our other Existing Owners, on the other hand, concerning among other things, potential competitive business activities or business opportunities.
Our Sponsors are each families of private equity investment funds in the business of making investments in entities primarily in the U.S. energy industry. As a result, our Sponsors may, from time to time, acquire interests in businesses that directly or indirectly compete with our business, as well as businesses that are significant existing or potential customers. Our Sponsors may acquire or seek to acquire assets that we seek to acquire and, as a result, those acquisition opportunities may not be available to us or may be more expensive for us to pursue. Under our certificate of incorporation, our Sponsors and/or one or more of their respective affiliates are permitted to engage in business activities or invest in or acquire businesses which may compete with our business or do business with any client of ours.
Any actual or perceived conflicts of interest with respect to the foregoing could have an adverse impact on the trading price of our common stock.
51
Our amended and restated certificate of incorporation and amended and restated bylaws, as well as Delaware law, contain provisions that could discourage acquisition bids or merger proposals, which may adversely affect the market price of our common stock.
Our amended and restated certificate of incorporation authorizes our board of directors to issue preferred stock without stockholder approval. If our board of directors elects to issue preferred stock, it could be more difficult for a third party to acquire us. In addition, some provisions of our amended and restated certificate of incorporation and amended and restated bylaws could make it more difficult for a third party to acquire control of us, even if the change of control would be beneficial to our stockholders, including:
- •
- limitations on the removal of directors;
- •
- limitations on the ability of our stockholders to call special meetings;
- •
- establishing advance notice provisions for stockholder proposals and nominations for elections to the board of directors to be acted
upon at meetings of stockholders;
- •
- the requirement that the affirmative vote of holders representing at least 66 2/3% of the voting power of all outstanding shares of
capital stock (or a majority of the voting power of all outstanding shares of capital stock if the Sponsors beneficially own at least 50% of the voting power of all such outstanding shares) be
obtained to amend our amended and restated bylaws, to remove directors or to amend our certificate of incorporation;
- •
- providing that the Board of Directors is expressly authorized to adopt, or to alter or repeal our bylaws;
and
- •
- establishing advance notice and certain information requirements for nominations for election to our Board of Directors or for proposing matters that can be acted upon by stockholders at stockholder meetings.
Investors in this offering will experience immediate and substantial dilution of $ per share.
Based on an assumed initial public offering price of $ per share (the midpoint of the range set forth on the cover of this prospectus), purchasers of our common stock in this offering will experience an immediate and substantial dilution of $ per share in the as adjusted net tangible book value per share of common stock from the initial public offering price, and our as adjusted net tangible book value as of June 30, 2016 on a pro forma basis would be $ per share. This dilution is due in large part to earlier investors having paid substantially less than the initial public offering price when they purchased their shares. Please see "Dilution".
We do not intend to pay dividends on our common stock, and our debt instruments place certain restrictions on our ability to do so. Consequently, your only opportunity to achieve a return on your investment is if the price of our common stock appreciates.
We do not plan to declare dividends on shares of our common stock in the foreseeable future. Additionally, our new revolving credit facility will place certain restrictions on our ability to pay cash dividends. Consequently, your only opportunity to achieve a return on your investment in us will be if you sell your common stock at a price greater than you paid for it. There is no guarantee that the price of our common stock that will prevail in the market will ever exceed the price that you pay in this offering.
52
Future sales of our common stock in the public market could reduce our stock price, and any additional capital raised by us through the sale of equity or convertible securities may dilute your ownership in us.
We may sell additional shares of common stock in subsequent public offerings. We may also issue additional shares of common stock or convertible securities. After the completion of this offering, we will have outstanding shares of common stock. This number includes shares that we are selling in this offering and shares if the underwriters' option to purchase additional shares is fully exercised. Following the completion of this offering, assuming no exercise of the underwriters' option to purchase additional shares, Vantage Investment I, Vantage Investment II and the Management Members will collectively own shares of our common stock, or approximately % of our total outstanding shares, all of which are restricted from immediate resale under the federal securities laws and are subject to the lock-up agreements with the underwriters described in "Underwriting", but may be sold into the market in the future. Vantage Investment I and Vantage Investment II will be party to a stockholders' agreement with us which will require us to effect the registration of their shares (and shares of certain of their affiliates) in certain circumstances no earlier than the expiration of the lock-up period contained in the underwriting agreement entered into in connection with this offering. Please see "Shares Eligible for Future Sale" and "Certain Relationships and Related Party Transactions — Stockholders' Agreement".
In connection with this offering, we intend to file a registration statement with the SEC on Form S-8 providing for the registration of shares of our common stock issued or reserved for issuance under our equity incentive plan. Subject to the satisfaction of vesting conditions, the expiration of lock-up agreements and the requirements of Rule 144, shares registered under the registration statement on Form S-8 will be available for resale immediately in the public market without restriction.
We cannot predict the size of future issuances of our common stock or securities convertible into common stock or the effect, if any, that future issuances and sales of shares of our common stock will have on the market price of our common stock. Sales of substantial amounts of our common stock (including shares issued in connection with an acquisition), or the perception that such sales could occur, may adversely affect prevailing market prices of our common stock.
The underwriters of this offering may waive or release parties to the lock-up agreements entered into in connection with this offering, which could adversely affect the price of our common stock.
We, Vantage Investment I, Vantage Investment II, and all of our directors and executive officers have entered into lock-up agreements with respect to their common stock, pursuant to which we and they are subject to certain resale restrictions for a period of 180 days following the effectiveness date of the registration statement of which this prospectus forms a part. Goldman, Sachs & Co., at any time and without notice, may release all or any portion of the common stock subject to the foregoing lock-up agreements. If the restrictions under the lock-up agreements are waived, then common stock will be available for sale into the public markets, which could cause the market price of our common stock to decline and impair our ability to raise capital.
We expect to be a "controlled company" within the meaning of the NYSE rules and, as a result, will qualify for and could rely on exemptions from certain corporate governance requirements.
Upon completion of this offering, Vantage Investment I and Vantage Investment II will collectively beneficially control a majority of the combined voting power of all classes of our
53
outstanding voting stock. In connection with the completion of this offering, Vantage I and Vantage II will enter into a stockholders' agreement, pursuant to which they will agree to vote their shares of common stock in accordance with the stockholders' agreement, including as it relates to the election of directors. For additional information regarding the stockholders' agreement, please see "Certain Relationships and Related Party Transactions — Stockholders' Agreement". As a result, we expect to be a controlled company within the meaning of the NYSE corporate governance standards. Under the NYSE rules, a company of which more than 50% of the voting power is held by another person or group of persons acting together is a controlled company and may elect not to comply with certain NYSE corporate governance requirements, including the requirements that:
- •
- a majority of the board of directors consist of independent directors;
- •
- the nominating and governance committee be composed entirely of independent directors with a written charter addressing the
committee's purpose and responsibilities;
- •
- the compensation committee be composed entirely of independent directors with a written charter addressing the committee's purpose and
responsibilities; and
- •
- there be an annual performance evaluation of the nominating and governance and compensation committees.
These requirements will not apply to us as long as we remain a controlled company. Following this offering, we may utilize some or all of these exemptions. Accordingly, you may not have the same protections afforded to stockholders of companies that are subject to all of the corporate governance requirements of the NYSE. Please see "Management".
For as long as we are an emerging growth company, we will not be required to comply with certain reporting requirements, including those relating to accounting standards and disclosure about our executive compensation, that apply to other public companies.
We are classified as an "emerging growth company" under the JOBS Act. For as long as we are an emerging growth company, which may be up to five full fiscal years, unlike other public companies, we will not be required to, among other things, (1) provide an auditor's attestation report on management's assessment of the effectiveness of our system of internal control over financial reporting pursuant to Section 404(b) of the Sarbanes-Oxley Act, (2) comply with any new requirements adopted by the PCAOB requiring mandatory audit firm rotation or a supplement to the auditor's report in which the auditor would be required to provide additional information about the audit and the financial statements of the issuer, (3) provide certain disclosure regarding executive compensation required of larger public companies or (4) hold nonbinding advisory votes on executive compensation. We will remain an emerging growth company for up to five years, although we will lose that status sooner if we have more than $1.0 billion of revenues in a fiscal year, have more than $700 million in market value of our common stock held by non-affiliates, or issue more than $1.0 billion of non-convertible debt over a three-year period.
We may issue preferred stock whose terms could adversely affect the voting power or value of our common stock.
Our certificate of incorporation authorizes us to issue, without the approval of our stockholders, one or more classes or series of preferred stock having such designations, preferences, limitations and relative rights, including preferences over our common stock respecting dividends and distributions, as our board of directors may determine. The terms of one or more classes or series of preferred stock could adversely impact the voting power or value of our
54
common stock. For example, we might grant holders of preferred stock the right to elect some number of our directors in all events or on the happening of specified events or the right to veto specified transactions. Similarly, the repurchase or redemption rights or liquidation preferences we might assign to holders of preferred stock could affect the residual value of the common stock.
If securities or industry analysts do not publish research or reports about our business, if they adversely change their recommendations regarding our common stock or if our operating results do not meet their expectations, our stock price could decline.
The trading market for our common stock will be influenced by the research and reports that industry or securities analysts publish about us or our business. If one or more of these analysts cease coverage of our company or fail to publish reports on us regularly, we could lose visibility in the financial markets, which in turn could cause our stock price or trading volume to decline. Moreover, if one or more of the analysts who cover our company downgrades our common stock or if our operating results do not meet their expectations, our stock price could decline.
Our amended and restated certificate of incorporation will designate the Court of Chancery of the State of Delaware as the sole and exclusive forum for certain types of actions and proceedings that may be initiated by our stockholders, which could limit our stockholders' ability to obtain a favorable judicial forum for disputes with us or our directors, officers, employees or agents.
Our amended and restated certificate of incorporation will provide that unless we consent in writing to the selection of an alternative forum, the Court of Chancery of the State of Delaware will, to the fullest extent permitted by applicable law, be the sole and exclusive forum for (i) any derivative action or proceeding brought on our behalf, (ii) any action asserting a claim of breach of a fiduciary duty owed by any of our directors, officers, employees or agents to us or our stockholders, (iii) any action asserting a claim arising pursuant to any provision of the Delaware General Corporation Law (the "DGCL"), our amended and restated certificate of incorporation or our bylaws, or (iv) any action asserting a claim against us that is governed by the internal affairs doctrine, in each such case subject to such Court of Chancery having personal jurisdiction over the indispensable parties named as defendants therein. This choice of forum provision may limit a stockholder's ability to bring a claim in a judicial forum that it finds favorable for disputes with us or our directors, officers, employees or agents, which may discourage such lawsuits against us and such persons. Alternatively, if a court were to find these provisions of our amended and restated certificate of incorporation inapplicable to, or unenforceable in respect of, one or more of the specified types of actions or proceedings, we may incur additional costs associated with resolving such matters in other jurisdictions, which could adversely affect our business, financial condition or results of operations.
55
CAUTIONARY STATEMENT REGARDING FORWARD-LOOKING STATEMENTS
The information in this prospectus includes "forward-looking statements". All statements, other than statements of historical fact included in this prospectus, regarding our strategy, future operations, financial position, estimated revenues and losses, projected costs, prospects, plans and objectives of management are forward-looking statements. When used in this prospectus, the words "could", "believe", "anticipate", "intend", "estimate", "expect", "project" and similar expressions are intended to identify forward-looking statements, although not all forward-looking statements contain such identifying words. These forward-looking statements are based on our current expectations and assumptions about future events and are based on currently available information as to the outcome and timing of future events. When considering forward-looking statements, you should keep in mind the risk factors and other cautionary statements described under "Risk Factors". These forward-looking statements are based on management's current belief, based on currently available information, as to the outcome and timing of future events.
Forward-looking statements may include statements about our:
- •
- business strategy;
- •
- reserves;
- •
- financial strategy, liquidity and capital required for our development program;
- •
- realized natural gas, NGLs and oil prices;
- •
- timing and amount of future production of natural gas, NGLs and oil;
- •
- hedging strategy and results;
- •
- future drilling plans;
- •
- competition and government regulations;
- •
- pending legal or environmental matters;
- •
- marketing of natural gas, NGLs and oil;
- •
- leasehold or business acquisitions;
- •
- costs of developing our properties and conducting our gathering and other midstream operations;
- •
- expectations with respect to the cost of expansion of our midstream infrastructure and the expected timing of such expansion;
- •
- general economic conditions;
- •
- credit markets;
- •
- uncertainty regarding our future operating results; and
- •
- plans, objectives, expectations and intentions contained in this prospectus that are not historical.
We caution you that these forward-looking statements are subject to all of the risks and uncertainties, most of which are difficult to predict and many of which are beyond our control, incident to the exploration for and development, production, gathering and sale of natural gas, NGLs and oil. These risks include, but are not limited to, commodity price volatility, inflation, lack of availability of drilling and production equipment and services, environmental risks, drilling and other operating risks, regulatory changes, the uncertainty inherent in estimating natural gas, NGLs and oil
56
reserves and in projecting future rates of production, cash flow and access to capital, the timing of development expenditures, and the other risks described under "Risk Factors".
Reserve engineering is a process of estimating underground accumulations of natural gas, NGLs and oil that cannot be measured in an exact way. The accuracy of any reserve estimate depends on the quality of available data, the interpretation of such data and price and cost assumptions made by reserve engineers. In addition, the results of drilling, testing and production activities may justify revisions of estimates that were made previously. If significant, such revisions would change the schedule of any further production and development drilling. Accordingly, reserve estimates may differ significantly from the quantities of natural gas, and NGLs and oil that are ultimately recovered.
Should one or more of the risks or uncertainties described in this prospectus occur, or should underlying assumptions prove incorrect, our actual results and plans could differ materially from those expressed in any forward-looking statements.
All forward-looking statements, expressed or implied, included in this prospectus are expressly qualified in their entirety by this cautionary statement. This cautionary statement should also be considered in connection with any subsequent written or oral forward-looking statements that we or persons acting on our behalf may issue.
Except as otherwise required by applicable law, we disclaim any duty to update any forward-looking statements, all of which are expressly qualified by the statements in this section, to reflect events or circumstances after the date of this prospectus.
57
We expect to receive approximately $ million of net proceeds (assuming the midpoint of the price range set forth on the cover of this prospectus) from the sale of the common stock offered by us after deducting underwriting discounts and commissions and estimated offering expenses payable by us.
We intend to use the net proceeds from this offering, together with cash on hand and borrowings under our new revolving credit facility, to repay and retire the Vantage I revolving credit facility, the Vantage I second lien term loan and the Vantage II revolving credit facility. We intend to use the remaining net proceeds for general corporate purposes, including funding our drilling program and expanding our midstream infrastructure. In connection with the repayment of the term loan and credit facility borrowings, we expect to record a $ million earnings charge for the extinguishment of debt; however, this charge is not reflected in our pro forma financial statements included elsewhere in this prospectus.
The following table illustrates our anticipated use of the proceeds of this offering:
Sources of Funds (in millions) |
| | Uses of Funds (in millions) |
| | ||||
Gross proceeds from this offering |
| $ | | Repayment of Vantage I revolving credit facility |
| $ | | ||
Cash on hand |
| | Repayment of Vantage I second lien term loan |
| | ||||
Borrowings under the new revolving credit facility |
| | Repayment of Vantage II revolving credit facility |
| | ||||
|
| | General corporate purposes |
| | ||||
|
| | Underwriting discounts, fees and expenses |
| | ||||
| | | | | | | | | ||
Total |
| $ | | Total |
| $ | | ||
| | | | | | | | | ||
| | | | | | | | | ||
| | | | | | | | | ||
As of June 30, 2016, we had $270.0 million of outstanding borrowings under the Vantage I revolving credit facility. The Vantage I revolving credit facility matures on January 1, 2017 and bears interest at a variable rate, which was 3.96% per annum at June 30, 2016. As of June 30, 2016, we had $147.0 million of outstanding borrowings under the Vantage II revolving credit facility. The Vantage II revolving credit facility matures on January 1, 2017 and bears interest at a variable rate, which was 3.71% per annum at June 30, 2016.
The $200 million Vantage I second lien term loan matures on December 20, 2018 and bears interest at a variable rate, which was 8.5% per annum at June 30, 2016.
The outstanding borrowings under our revolving credit facilities and term loans were incurred to fund our development program. We may at any time borrow amounts under our new revolving credit facility, and we expect to do so to fund our development program.
A $1.00 increase or decrease in the assumed initial public offering price of $ per share would cause the net proceeds from this offering, after deducting the underwriting discounts and commissions and estimated offering expenses, received by us to increase or decrease, respectively, by approximately $ million, assuming the number of shares offered by us, as set forth on the cover page of this prospectus, remains the same. If the proceeds increase for any reason, we would use the additional net proceeds to reduce the amount we borrow under our new revolving credit facility or for general corporate purposes, including to fund a portion of our development program. If the proceeds decrease for any reason, then we would increase by a corresponding amount the amount of borrowings under our new revolving credit facility, but not to exceed the then in effect borrowing base.
58
We do not anticipate declaring or paying any cash dividends to holders of our common stock in the foreseeable future. We currently intend to retain future earnings, if any, to finance the growth of our business. Our future dividend policy is within the discretion of our board of directors and will depend upon then-existing conditions, including our results of operations, financial condition, capital requirements, investment opportunities, statutory restrictions on our ability to pay dividends and other factors our board of directors may deem relevant. Additionally, our new revolving credit facility will place certain restrictions on our ability to pay cash dividends.
59
The following table sets forth our cash and cash equivalents and capitalization as of June 30, 2016:
- •
- on an actual basis for our predecessor;
- •
- on an as adjusted basis to give effect to the transactions described under "Corporate Reorganization"; and
- •
- on a pro forma basis to give further effect to (i) the sale of shares of our common stock by us in this offering at an assumed initial public offering price of $ per share (the midpoint of the range set forth on the cover of this prospectus) and the application of the net proceeds as set forth under "Use of Proceeds" and (ii) our entrance into and incurrence of borrowings under our new revolving credit facility.
The information set forth in the table below is illustrative only and will be adjusted based on the actual initial public offering price and other final terms of this offering. This table should be read in conjunction with, and is qualified in its entirety by reference to, "Use of Proceeds" and our predecessor's historical audited consolidated financial statements and the unaudited pro forma financial statements and the accompanying notes appearing elsewhere in this prospectus.
|
| As of June 30, 2016 |
| |||||||
| | | | | | | | | |||
|
| Actual | | As Adjusted | | Pro Forma |
| |||
| | | | | | | | | |||
|
| (In thousands, except share counts and par value) | | |||||||
Cash and cash equivalents(1) |
| $ | 15,085 | | $ | | $ | | ||
| | | | | | | | | |||
| | | | | | | | | |||
| | | | | | | | | |||
Long-term debt, including current maturities, net of unamortized deferred financing costs: |
| | | | ||||||
Vantage I revolving credit facility(2) |
| | | | ||||||
Vantage II revolving credit facility(2) |
| 146,239 | | | | |||||
Vantage I second lien term loan |
| | | | ||||||
Vantage II second lien term loan(3) |
| 98,754 | | | | |||||
New revolving credit facility(1) |
| — | | | | |||||
| | | | | | | | | |||
Total indebtedness |
| $ | 244,993 | | $ | | $ | | ||
| | | | | | | | | |||
Contingently redeemable Founders' units(4) |
| $ | 1,125 | | $ | | $ | | ||
Members'/Stockholders' equity: |
| | | | ||||||
Members' equity |
| 670,074 | | | | |||||
Preferred stock — $0.01 par value; no shares authorized, issued or outstanding, actual; shares authorized, no shares issued or outstanding, as adjusted and pro forma |
| — | | | | |||||
Common stock — $0.01 par value; no shares authorized, issued or outstanding, actual; shares authorized, shares issued and outstanding, as adjusted; shares authorized, shares issued and outstanding, pro forma |
| — | | | | |||||
Additional paid in capital(5) |
| — | | | | |||||
Accumulated deficits |
| (195,208 | ) | | | |||||
| | | | | | | | | |||
Total Members'/Stockholders' equity |
| $ | 474,866 | | $ | | $ | | ||
| | | | | | | | | |||
Total capitalization |
| $ | 720,984 | | $ | | $ | | ||
| | | | | | | | | |||
| | | | | | | | | |||
| | | | | | | | | |||
- (1)
- As of , 2016, we had combined cash and cash equivalents of $ million. We intend to use the net proceeds of this offering, together with $ million of borrowings under our new revolving credit facility and
60
$ million of cash on hand, to repay the Vantage I revolving credit facility, the Vantage I second lien term loan and the Vantage II revolving credit facility. Please see "Use of Proceeds".
- (2)
- As
of June 30, 2016, the outstanding amount under the Vantage I and Vantage II revolving credit facilities totaled
$417.0 million, and we had $53.9 million of aggregate undrawn borrowing capacity. After giving effect to the consummation of the reorganization transactions described under "Corporate
Reorganization", our entrance into and incurrence of borrowings under our new revolving credit facility and the application of the net proceeds of this offering, we expect to have
$ million of available borrowing capacity under our new revolving credit facility. As of June 30, 2016, $0.1 million of letters of credit were outstanding
under our
revolving credit facilities. The Vantage II revolving credit facility is presented net of $0.8 million of net unamortized debt issuance costs.
- (3)
- Net
of approximately $1.0 million of issue discount and $0.3 million of debt issuance costs, which will be amortized over the
term of the loan.
- (4)
- Please
see Note 9 to the audited consolidated financial statements of each of our predecessor and Vantage I included elsewhere in this
prospectus for a description of the contingently redeemable Founders' units.
- (5)
- In connection with our corporate reorganization, we expect to recognize non-cash stock compensation expense of approximately $ million at the time of the offering. The stock compensation expense recognized in the statement of operations will be offset by capital contributions from Vantage Investment II; therefore, the stock compensation charge will have no effect on total equity. The estimated stock compensation charge that we will recognize at the time of the offering is not reflected in the pro forma amounts as the charge is considered non-recurring. See "Management's Discussion and Analysis of Financial Condition and Results of Operations — Corporate Reorganization".
61
Purchasers of the common stock in this offering will experience immediate and substantial dilution in the net tangible book value per share of the common stock for accounting purposes. Our net tangible book value as of June 30, 2016, after giving effect to the transactions described under "Corporate Reorganization", was $ , or $ per share. Pro forma net tangible book value per share is determined by dividing our pro forma tangible net worth (tangible assets less total liabilities) by the total number of outstanding shares of common stock that will be outstanding immediately prior to the closing of this offering after giving effect to our corporate reorganization. Assuming an initial public offering price of $ per share (which is the midpoint of the price range set forth on the cover page of this prospectus), after giving effect to the sale of the shares in this offering and further assuming the receipt of the estimated net proceeds (after deducting estimated underwriting discounts and commissions and estimated offering expenses), our adjusted pro forma net tangible book value as June 30, 2016 would have been approximately $ million, or $ per share. This represents an immediate increase in the net tangible book value of $ per share to our existing stockholders and an immediate dilution (i.e., the difference between the offering price and the adjusted pro forma net tangible book value after this offering) to new investors purchasing shares in this offering of $ per share. The following table illustrates the per share dilution to new investors purchasing shares in this offering:
Initial public offering price per share |
| | $ | | |||
Pro forma net tangible book value per share as of June 30, 2016 (after giving effect to our corporate reorganization) |
| $ | | | |||
Increase per share attributable to new investors in this offering |
| | | ||||
| | | | | | | ||
As adjusted pro forma net tangible book value per share after giving effect to our corporate reorganization and this offering |
| | | ||||
| | | | | | | ||
Dilution in pro forma net tangible book value per share to new investors in this offering |
| | $ | | |||
| | | | | | | ||
| | | | | | | ||
| | | | | | | ||
A $1.00 increase (decrease) in the assumed initial public offering price of $ per share, which is the midpoint of the price range set forth on the cover page of this prospectus, would increase (decrease) our as adjusted pro forma net tangible book value per share after the offering by $ and increase (decrease) the dilution to new investors in this offering by $ per share, assuming the number of shares offered by us, as set forth on the cover page of this prospectus, remains the same, after deducting the estimated underwriting discounts and commissions and estimated offering expenses payable by us. The following table summarizes, on an adjusted pro forma basis as of June 30, 2016, the total number of shares of common stock owned by existing stockholders and to be owned by new investors, the total consideration paid, and the average price per share paid by our existing stockholders and to be paid by new investors in this offering at our initial public offering price of $ per share, calculated before deduction of estimated underwriting discounts and commissions:
|
| | | Total Consideration | | Average | | |||||||||||||||||||
| | | | | | | | | | | | | | | | | | | |||||||||
|
| Shares Acquired | | Amount | | | Price Per | | ||||||||||||||||||
| | | | | | | | | | | | | | | | | | | |||||||||
|
| Number | | Percent | | (in thousands) | | Percent | | Share |
| |||||||||||||||
| | | | | | | | | | | | | |||||||||||||||
Existing owners |
| | | | | % | | | $ | | | | % | | | $ | | | ||||||||
New investors in this offering |
| | | | | % | | | $ | | | | % | | | $ | | | ||||||||
Total |
| | | | | % | | | $ | | | | % | | | $ | | | ||||||||
62
The above tables and discussion are based on the number of shares of our common stock to be outstanding as of the closing of this offering. The table does not reflect shares of common stock reserved for issuance under our long-term incentive plan, which we plan to adopt in connection with this offering. If the underwriters' option to purchase additional shares is exercised in full, the number of shares held by new investors will be increased to , or approximately % of the total number of shares of common stock.
63
SELECTED HISTORICAL CONSOLIDATED AND UNAUDITED PRO FORMA FINANCIAL DATA
The following table shows selected historical consolidated financial data of our predecessor, and selected unaudited pro forma financial data for the periods and as of the dates indicated.
The selected historical consolidated financial data as of and for the years ended December 31, 2015 and 2014 were derived from the audited historical consolidated financial statements of our predecessor included elsewhere in this prospectus.
The selected historical consolidated financial data as of and for the six months ended June 30, 2016 and 2015 were derived from the unaudited historical consolidated financial statements of our predecessor included elsewhere in this prospectus. The selected unaudited historical consolidated financial data has been prepared on a consistent basis with the audited consolidated financial statements of our predecessor. In the opinion of management, such selected unaudited historical consolidated interim financial data reflects all adjustments (consisting of normal and recurring accruals) considered necessary to present our financial position for the periods presented. The results of operations for the interim periods are not necessarily indicative of the results that may be expected for the full year because of the impact of fluctuations in prices received from oil and natural gas, natural production declines, the uncertainty of exploration and development drilling results and other factors.
The selected unaudited pro forma statements of operations data for the year ended December 31, 2015 and the six months ended June 30, 2016 has been prepared to give pro forma effect to (i) the reorganization transactions described under "Corporate Reorganization" and (ii) this offering and the application of the net proceeds from this offering as if they had been completed as of January 1, 2015. The selected unaudited pro forma balance sheet data has been prepared to give pro forma effect to those transactions as if they had been completed as of June 30, 2016. These data are subject to and give effect to the assumptions and adjustments described in the notes accompanying the unaudited pro forma financial statements included elsewhere in this prospectus. The selected unaudited pro forma financial data are presented for informational purposes only and should not be considered indicative of actual results of operations that would have been achieved had the reorganization transactions and this offering been consummated on the dates indicated, and do not purport to be indicative of statements of financial position or results of operations as of any future date or for any future period.
You should read the following table in conjunction with "Use of Proceeds", "Management's Discussion and Analysis of Financial Condition and Results of Operations", "Corporate Reorganization", the historical consolidated financial statements of our predecessor and the unaudited pro forma financial statements included elsewhere in this prospectus. Among other
64
things, those historical and unaudited pro forma financial statements include more detailed information regarding the basis of presentation for the following information.
|
| Predecessor | | Vantage Energy Inc. Pro Forma |
| ||||||||||||||||||
| | | | | | | | | | | | | | | ||||||||||
|
| Six Months Ended June 30, |
| Year Ended December 31, |
| Six Months Ended June 30, |
| Year Ended December 31, |
| ||||||||||||||
| | | | | | | | | | | | | | | | | | | ||||||
(in thousands, except per share data) |
| 2016 | | 2015 | | 2015 | | 2014 | | 2016 | | 2015 |
| ||||||||||
| | | | | | | | | | | | | | | ||||||||||
Statement of operations data: |
| | | | | | | | | | | ||||||||||||
Operating revenues: |
| | | | | | | | | | | ||||||||||||
Natural gas |
| $ | 46,829 | | $ | 40,375 | | $ | 65,252 | | $ | 43,622 | | | $ | | | | $ | | | ||
Midstream revenues(1) |
| 2,895 | | 2,524 | | 4,054 | | 2,990 | | | | | | | | ||||||||
Gain (loss) on commodity derivatives |
| (22,599 | ) | 14,921 | | 51,793 | | 14,434 | | | | | | | | ||||||||
| | | | | | | | | | | | | | | ||||||||||
Total operating revenues |
| 27,125 | | 57,820 | | 121,099 | | 61,046 | | | | | | | | ||||||||
Operating expenses: |
| | | | | | | | | | | ||||||||||||
Production and ad valorem taxes(2) |
| 1,025 | | 512 | | 1,911 | | 1,723 | | | | | | | | ||||||||
Marketing and gathering |
| 7,961 | | 6,063 | | 9,745 | | 5,333 | | | | | | | | ||||||||
Lease operating and workover(3) |
| 1,590 | | 4,451 | | 4,934 | | 2,517 | | | | | | | | ||||||||
Midstream operating expenses |
| 1,428 | | 831 | | 1,834 | | 891 | | | | | | | | ||||||||
General and administrative(3) |
| 4,336 | | 5,487 | | 7,308 | | 5,423 | | | | | | | | ||||||||
Depreciation, depletion, amortization and accretion |
| 19,490 | | 23,357 | | 39,698 | | 18,302 | | | | | | | | ||||||||
Impairment of proved oil and gas properties |
| 81,673 | | — | | 172,673 | | — | | | | | | | | ||||||||
| | | | | | | | | | | | | | | ||||||||||
Total operating expenses |
| 117,503 | | 40,701 | | 238,103 | | 34,189 | | | | | | | | ||||||||
| | | | | | | | | | | | | | | ||||||||||
Operating (loss) income |
| (90,378 | ) | 17,119 | | (117,004 | ) | 26,857 | | | | | | | | ||||||||
Other income (expense) |
| 3 | | (180 | ) | (180 | ) | — | | | | | | | | ||||||||
Interest income, net |
| — | | — | | — | | — | | | | | | | | ||||||||
Interest expense, net of capitalized interest(4) |
| (5,264 | ) | (4,229 | ) | (8,778 | ) | (4,027 | ) | | | | | | | ||||||||
| | | | | | | | | | | | | | | ||||||||||
Income (loss) before income taxes |
| (5,261 | ) | (4,409 | ) | (125,962 | ) | 22,830 | | | | | | | | ||||||||
Income tax expense (benefit) |
| — | | — | | — | | — | | | | | | | | ||||||||
| | | | | | | | | | | | | | | ||||||||||
Net income (loss) |
| $ | (95,639 | ) | $ | 12,710 | | $ | (125,962 | ) | $ | 22,830 | | | $ | | | | $ | | | ||
| | | | | | | | | | | | | | | ||||||||||
| | | | | | | | | | | | | | | | | | | ||||||
| | | | | | | | | | | | | | | ||||||||||
Balance sheet data (at period end): |
| | | | | | | | | | | ||||||||||||
Cash |
| $ | 15,085 | | $ | 8,726 | | $ | 2,439 | | $ | 21,185 | | | $ | | | | $ | | | ||
Total oil and gas properties, net |
| 687,495 | | 486,043 | | 373,786 | | 439,076 | | | | | | | | ||||||||
Total midstream system, net |
| 59,764 | | 56,458 | | 59,970 | | 53,116 | | | | | | | | ||||||||
Total assets |
| 780,421 | | 588,640 | | 488,739 | | 551,345 | | | | | | | | ||||||||
Total debt |
| 244,993 | | 225,087 | | 247,041 | | 197,663 | | | | | | | | ||||||||
Total members'/stockholders' capital |
| 474,866 | | 339,263 | | 200,093 | | 326,055 | | | | | | | | ||||||||
Net cash provided by (used in): |
| | | | | | | | | | | ||||||||||||
Operating activities |
| $ | 72,209 | | $ | 39,729 | | $ | 81,633 | | $ | 21,100 | | | $ | | | | $ | | | ||
Investing activities |
| (427,740 | ) | (78,804 | ) | (148,852 | ) | (212,615 | ) | | | | | | | ||||||||
Financing activities |
| 368,177 | | 26,553 | | 48,473 | | 206,921 | | | | | | | | ||||||||
Other financial data (unaudited): |
| | | | | | | | | | | ||||||||||||
E&P Segment Adjusted EBITDA(5) |
| 48,348 | | 28,994 | | 57,229 | | 26,207 | | | 107,566 | | | | 182,020 | | | ||||||
Midstream Segment Adjusted EBITDA(6) |
| 11,195 | | 6,345 | | 14,056 | | 5,317 | | | 22,393 | | | | 28,112 | | | ||||||
Adjusted EBITDA(7) |
| $ | 59,007 | | $ | 40,656 | | $ | 69,983 | | $ | 31,660 | | | $ | 128,872 | | | | $ | 207,528 | | |
Earnings (loss) per share — basic |
| | | | | | | | | | | ||||||||||||
Earnings (loss) per share — diluted |
| | | | | | | | | | | ||||||||||||
- (1)
- Midstream revenues are net of gathering, compression and water fees paid to by Vantage II for historical periods and by Vantage I and Vantage II on a pro forma basis. See "Management's Discussion and Analysis of Financial Condition and Results of Operations — Sources of Revenues — Gathering Revenues".
65
- (2)
- Production
and ad valorem taxes include expenses recorded for Pennsylvania impact fees, which are annual fees imposed by the state of
Pennsylvania on natural gas and oil operators in Pennsylvania for each well drilled for a period of fifteen years.
- (3)
- Lease
operating and workover expense includes Council of Petroleum Accountants Society ("COPAS") overhead booked as a reclassification from
general and administrative expense on our operated properties and any COPAS charged to us by other operators on our non-operated properties. On a pro forma basis for the six months ended
June 30, 2016 and for the year ended December 31, 2015, we recorded allocated COPAS overhead charges of $1.1 million and $2.1 million, respectively. General and
administrative expenses are net of overhead recorded to lease operating and workover expenses and the capitalization of certain internal costs. On a pro forma basis for the six months ended
June 30, 2016 and the year ended December 31, 2015, we recorded $7.6 million and $13.3 million, respectively, of general and administrative expense, net of allocated COPAS
overhead of $1.1 million and $2.1 million, respectively and capitalized general and administrative expenses of $5.1 million and $9.8 million, respectively.
- (4)
- On
a pro forma basis for the six months ended June 30, 2016 and for the year ended December 31, 2015, we recorded capitalized interest of
$2.9 million and $5.8 million, respectively.
- (5)
- We
define E&P Segment Adjusted EBITDA as total revenues from our E&P Segment (including net cash from settlement from commodity derivatives)
less E&P Segment operating costs and allocated general and administrative expenses. E&P Segment Adjusted EBITDA for Vantage I was $59.2 million and $124.8 million for the six months
ended June 30, 2016 and the year ended December 31, 2015, respectively. Pro forma E&P Segment Adjusted EBITDA represents the sum of the E&P Segment Adjusted EBITDA for our
predecessor and Vantage I for such period. See Note 11 and Note 13 to the audited consolidated financial statements of our predecessor and Vantage I, respectively, included elsewhere in
this prospectus for a discussion of our segment reporting.
- (6)
- We
define Midstream Segment Adjusted EBITDA as total revenues from our Midstream Segment less Midstream Segment operating costs and allocated
general and administrative expenses. Midstream Segment Adjusted EBITDA for Vantage I was $11.2 million and $14.1 million for the six months ended June 30, 2016 and the year ended
December 31, 2015, respectively. Pro forma Midstream Segment Adjusted EBITDA represents the sum of the Midstream Segment Adjusted EBITDA for our predecessor and Vantage I for such period. See
Note 11 and Note 13 to the audited consolidated financial statements of our predecessor and Vantage I, respectively, included elsewhere in this prospectus for a discussion of our segment
reporting.
- (7)
- Adjusted EBITDA is a non-GAAP financial measure. For a definition of Adjusted EBITDA and a reconciliation of Adjusted EBITDA to net income (loss), please see "Prospectus Summary — Non-GAAP Financial Measure".
66
MANAGEMENT'S DISCUSSION AND ANALYSIS OF FINANCIAL CONDITION AND RESULTS OF OPERATIONS
The following discussion and analysis of our financial condition and results of operations should be read in conjunction with our consolidated financial statements and related notes appearing elsewhere in this prospectus. The following discussion contains "forward-looking statements" that reflect our future plans, estimates, beliefs and expected performance. We caution that assumptions, expectations, projections, intentions, or beliefs about future events may, and often do, vary from actual results and the differences can be material. Some of the key factors which could cause actual results to vary from our expectations include changes in natural gas prices, the timing of planned capital expenditures, availability of acquisitions, uncertainties in estimating proved reserves and forecasting production results, operational factors affecting the commencement or maintenance of producing wells, the condition of the capital markets generally, as well as our ability to access them, and uncertainties regarding environmental regulations or litigation and other legal or regulatory developments affecting our business, as well as those factors discussed below and elsewhere in this prospectus, all of which are difficult to predict. In light of these risks, uncertainties and assumptions, the forward-looking events discussed may not occur. Please see "Cautionary Statement Regarding Forward-Looking Statements". Also, please see the risk factors and other cautionary statements described under the heading "Risk Factors" included elsewhere in this prospectus. We do not undertake any obligation to publicly update any forward-looking statements except as otherwise required by applicable law. Unless otherwise indicated, the historical financial information presented in "Management's Discussion and Analysis of Financial Condition and Results of Operations" speaks with respect to the combined results of our predecessor and Vantage I, with exception of the select operating results where we have presented the results of each entity individually.
Overview
We are a growth-oriented, independent oil and natural gas company engaged in the acquisition, development, exploitation and exploration of oil and natural gas properties in the United States, with a focus on the Appalachian Basin. We are the largest leaseholder in Greene County, Pennsylvania, an area with significant dry natural gas resources and stacked reservoirs. We hold a largely contiguous acreage position in what we believe to be the core of the Marcellus, Upper Devonian and Utica Shales. Additionally, we have a sizeable position in what we believe to be the core of the Barnett Shale in Texas. We believe these areas are among the most prolific unconventional resource plays in North America, and are generally characterized by high well recoveries relative to drilling and completion costs, predictable production profiles, significant hydrocarbons in place and constructive operating environments.
We conduct our business through two primary reportable segments:
- •
- Exploration and Production — We explore for and produce oil, natural gas, and NGLs.
- •
- Midstream — We engage in natural gas gathering and water distribution services for our operations and for third parties.
Exploration and Production
We efficiently exploit our resource base by applying and integrating micro-seismic technology, 3D seismic interpretation and petro-physical core analysis to define the reservoir and optimize formation targeting. This subsurface expertise translates to value maximizing inter-well spacing and highly economic development realized through best-in-class drilling, completion and operational strategies, including multi-well pad drilling, fit for purpose rig utilization, advanced down hole steering, targeted reservoir stimulation and optimized flow back practices. In addition, we have
67
significant experience in our operating areas. We operate 80 gross horizontal wells in the Marcellus Shale, four gross horizontal wells in the Upper Devonian Shale and 185 gross horizontal wells in the Barnett Shale. We believe that our horizontal drilling and completion expertise, coupled with the favorable geologic characteristics of our Appalachian Basin and Barnett Shale acreage, positions us for continued strong well economics and growth. We have organically grown our net daily production from 18 MMcfe/d for the year ended December 31, 2011 to 398.5 MMcfe/d for the three months ended June 30, 2016, representing a compounded annual growth rate of 98.7%.
Midstream
We own and operate midstream infrastructure in Greene County, including a natural gas gathering system with complementary water sourcing and distribution assets. We believe our ownership of this midstream infrastructure allows us to reduce our costs, promote overall efficiency of operations and increase our rates of return. We gather all of our operated natural gas production in Greene County and believe that our system will support our future production growth. We also intend to seek out commercial third-party gathering and water opportunities on our system.
Our natural gas gathering infrastructure currently has a demonstrated throughput capacity of over 400 MMcf/d and includes approximately 30 miles of gathering pipeline and 7,100 horsepower of compression. For the six months ended June 30, 2016, gross throughput on our midstream system was 325 MMcf/d, 59 MMcf/d of which was attributable to our joint venture partner's interest in the system, representing a 63% increase from the corresponding period in 2015. Our midstream segment generated pro forma Midstream Segment Adjusted EBITDA of $22.4 million for the six months ended June 30, 2016, compared to $12.5 million for the corresponding period in 2015.
We do not currently own or operate midstream infrastructure in the Barnett Shale and rely on third-party service providers for the gathering of our production in that basin.
Factors That Significantly Affect Our Financial Condition and Results of Operations
Our revenues are primarily derived from the sale of our natural gas and oil production, as well as the sale of NGLs that are extracted from our natural gas during processing. Our production revenues derive entirely from the continental United States. For the year ended December 31, 2015, our production revenues were comprised of approximately 92% from the production and sale of natural gas, approximately 6% from NGLs and approximately 2% from oil. Commodity prices are inherently volatile and are influenced by many factors outside of our control.
We use commodity derivative instruments, such as swaps and collars, to manage and reduce price volatility and other market risks associated with our natural gas production. These arrangements are structured to reduce our exposure to commodity price decreases, but they can also limit the benefit we might otherwise receive from commodity price increases. Our risk management activity is generally accomplished through over-the-counter commodity derivative contracts with large financial institutions. We currently use fixed price natural gas swaps for which we receive a fixed swap price for future production in exchange for a payment of the variable market price received at the time future production is sold. The prices contained in natural gas derivative contracts are based on Dominion South Point and WAHA. The prices contained in NGLs and oil derivative contracts are based on OPIS Mont Belvieu and NYMEX West Texas Intermediate ("WTI") prices, respectively. The NYMEX Henry Hub, Inside FERC Dominion and WAHA prices of natural gas, OPIS Mont Belvieu price of NGLs and NYMEX WTI price of oil are widely used benchmarks for the pricing of natural gas, NGLs and oil, respectively, in the United States. The actual prices realized from the sale of natural gas, NGLs and oil differ from the quoted index prices as a result of basis differentials, which result from variances in regional natural gas, NGLs and oil prices compared to index prices as a result of regional supply and demand factors. We are focused
68
on maintaining an active hedging program to minimize volatility in cash flows and commodity prices and regional basis differential exposure in an effort to protect our capital investment program as well as expected future cash flows. Although we have at times been able to hedge our natural gas, NGLs and oil production at prices that are higher than current strip prices, in the current commodity price environment, our ability to enter into commodity derivative arrangements at prices higher than current strip prices may be limited, which has the potential to impact the extent to which we can protect our future cash flows. To mitigate the potential negative impact of lower hedge prices, we regularly test available hedge pricing against the economics of our drilling program and limit our hedging activity to contracts with pricing at which our drilling program is economic. Due to changes in drilling and completion costs, operating costs, commodity prices and other factors, this assessment process is dynamic and ongoing.
The following tables provide additional information about our historical hedging activities and results.
Our open positions as of December 31, 2015, covering the period of January 1, 2016 to June 30, 2016, were as follows:
|
| Predecessor | | Vantage Energy I |
| ||||||||||||||||
| | | | | | | | | | | ||||||||||||
Commodity |
| Notional Quantity 1/1/2016 - 6/30/2016 |
| Weighted Average Price |
| Notional Quantity 1/1/2016 - 6/30/2016 |
| Weighted Average Price |
| ||||||||||||
| | | | | | | | | | | ||||||||||||
Crude oil swaps (Bbls) |
| | — | | | | $ | — | | | | 15,558 | | | | $ | 45.66 | | | ||
Natural gas swaps (MMBtu) |
| | | | | | | | | | | | | ||||||||
Dominion |
| | 28,678,000 | | | | 2.14 | | | | 15,420,100 | | | | 2.27 | | | ||||
WAHA |
| | — | | | | — | | | | 15,091,700 | | | | 3.04 | | | ||||
NYMEX Henry Hub |
| | — | | | | — | | | | — | | | | — | | | ||||
| | | | | | | | | | | | | | | ||||||||
Total |
| | 28,678,000 | | | | 2.14 | | | | 30,511,800 | | | | 2.65 | | | ||||
NGLs swaps (Gal) |
| | | | | | | | | | | | | ||||||||
Ethane |
| | — | | | | — | | | | 6,946,225 | | | | 0.21 | | | ||||
Propane |
| | — | | | | — | | | | — | | | | — | | | ||||
TetPropane |
| | — | | | | — | | | | 2,517,396 | | | | 0.55 | | | ||||
IsoButane |
| | — | | | | — | | | | 827,305 | | | | 0.68 | | | ||||
Normal butane |
| | — | | | | — | | | | 343,895 | | | | 0.69 | | | ||||
Natural gasoline |
| | — | | | | — | | | | 849,407 | | | | 1.12 | | | ||||
| | | | | | | | | | | | | | | ||||||||
Total |
| | — | | | | — | | | | 11,484,228 | | | | 0.40 | | | ||||
The following table summarizes the historical results of our hedging activities for the six months ended June 30, 2016:
|
| For the six months ended June 30, 2016 |
| ||||||||
| | | | | | | ||||||
|
| Predecessor | | Vantage I |
| ||||||
| | | | | | | ||||||
Average prices before effects of hedges: |
| | | | | | | ||||
Natural gas (Mcf) |
| | $ | 1.35 | | | | $ | 1.36 | | |
Oil (Bbl) |
| | | | | 34.09 | | | |||
NGL (Bbl) |
| | | | | 11.09 | | | |||
Average prices after effects of hedges: |
| | | | | | | ||||
Natural gas (Mcf) |
| | $ | 2.08 | | | | $ | 2.43 | | |
Oil (Bbl) |
| | | | | 35.93 | | | |||
NGL (Bbl) |
| | | | | 12.65 | | | |||
69
Our open positions as of December 31, 2014, covering the period of January 1, 2015 to December 31, 2015, were as follows:
|
| Predecessor | | Vantage Energy I |
| ||||||||||||||||
| | | | | | | | | | | ||||||||||||
Commodity |
| Notional Quantity 1/1/2015 - 12/31/2015 |
| Weighted Average Price |
| Notional Quantity 1/1/2015 - 12/31/2015 |
| Weighted Average Price |
| ||||||||||||
| | | | | | | | | | | ||||||||||||
Crude oil swaps (Bbls) |
| | — | | | | $ | — | | | | 95,230 | | | | $ | 90.26 | | | ||
Natural gas swaps (MMBtu) |
| | | | | | | | | | | | | ||||||||
Dominion |
| | 5,475,000 | | | | 3.13 | | | | 830,500 | | | | 3.56 | | | ||||
WAHA |
| | — | | | | — | | | | 24,086,870 | | | | 4.10 | | | ||||
NYMEX Henry Hub |
| | 709,000 | | | | 4.28 | | | | 17,988,780 | | | | 4.25 | | | ||||
TETCO M1 |
| | — | | | | — | | | | 223,000 | | | | 3.52 | | | ||||
TETCO M2 |
| | 3,582,000 | | | | 2.12 | | | | — | | | | — | | | ||||
| | | | | | | | | | | | | | | ||||||||
Total |
| | 9,766,000 | | | | 2.84 | | | | 43,129,150 | | | | 4.15 | | | ||||
Henry Hub basis swaps (MMBtu) |
| | | | | | | | | | | | | ||||||||
Dominion South |
| | — | | | | — | | | | 9,125,000 | | | | 1.01 | | | ||||
TETCO M2 |
| | — | | | | — | | | | 11,230,000 | | | | 1.28 | | | ||||
| | | | | | | | | | | | | | | | | ||||||
Total |
| | — | | | | — | | | | 20,355,000 | | | | 1.16 | | | ||||
NGLs swaps (Gal) |
| | | | | | | | | | | | | ||||||||
Ethane |
| | — | | | | — | | | | 1,556,010 | | | | 0.65 | | | ||||
Propane |
| | — | | | | — | | | | 7,368,165 | | | | 0.88 | | | ||||
TetPropane |
| | — | | | | — | | | | — | | | | — | | | ||||
IsoButane |
| | — | | | | — | | | | 1,273,795 | | | | 1.44 | | | ||||
Normal butane |
| | — | | | | — | | | | 2,267,080 | | | | 1.38 | | | ||||
Natural gasoline |
| | — | | | | — | | | | 2,692,160 | | | | 1.79 | | | ||||
| | | | | | | | | | | | | | | ||||||||
Total |
| | — | | | | | | | 15,157,210 | | | | 1.14 | | | |||||
The following table summarizes the historical results of our hedging activities for the year ended December 31, 2015:
|
| For the year ended December 31, 2015 |
| ||||||||
| | | | | | | ||||||
|
| Predecessor | | Vantage I |
| ||||||
| | | | | | | ||||||
Average prices before effects of hedges: |
| | | | | | | ||||
Natural gas (Mcf) |
| | $ | 1.58 | | | | $ | 1.78 | | |
Oil (Bbl) |
| | | | | 41.00 | | | |||
NGL (Bbl) |
| | | | | 10.45 | | | |||
Average prices after effects of hedges: |
| | | | | | | ||||
Natural gas (Mcf) |
| | $ | 2.23 | | | | $ | 3.43 | | |
Oil (Bbl) |
| | | | | 130.06 | | | |||
NGL (Bbl) |
| | | | | 21.43 | | | |||
70
Our open positions as of December 31, 2013, covering the period of January 1, 2014 to December 31, 2014, were as follows:
|
| Predecessor | | Vantage Energy |
| ||||||||||||||||
| | | | | | | | | | | ||||||||||||
Commodity |
| Notional Quantity 1/1/2014 - 12/31/2014 |
| Weighted Average Price |
| Notional Quantity 1/1/2014 - 12/31/2014 |
| Weighted Average Price |
| ||||||||||||
| | | | | | | | | | | ||||||||||||
Crude oil swaps (Bbls) |
| | — | | | | $ | — | | | | 86,399 | | | | $ | 90.15 | | | ||
Natural gas swaps (MMBtu) |
| | | | | | | | | | | | | ||||||||
Dominion |
| | 2,023,082 | | | | 4.27 | | | | 948,911 | | | | 3.56 | | | ||||
WAHA |
| | 180,000 | | | | 3.60 | | | | 11,839,000 | | | | 4.00 | | | ||||
NYMEX Henry Hub |
| | 176,918 | | | | 3.89 | | | | 9,221,821 | | | | 4.22 | | | ||||
TETCO M1 |
| | 500,000 | | | | 4.29 | | | | 280,500 | | | | 3.52 | | | ||||
| | | | | | | | | | | | | | | ||||||||
Total |
| | 2,880,000 | | | | 4.21 | | | | 22,290,232 | | | | 4.07 | | | ||||
NGLs swaps (Gal) |
| | | | | — | | | | | | | | | |||||||
Ethane |
| | — | | | | — | | | | 1,734,750 | | | | 0.65 | | | ||||
Propane |
| | — | | | | — | | | | 5,275,211 | | | | 0.88 | | | ||||
TetPropane |
| | — | | | | — | | | | — | | | | — | | | ||||
IsoButane |
| | — | | | | — | | | | 913,783 | | | | 1.37 | | | ||||
Normal butane |
| | — | | | | — | | | | 1,622,818 | | | | 1.32 | | | ||||
Natural gasoline |
| | — | | | | — | | | | 1,931,238 | | | | 1.74 | | | ||||
| | | | | | | | | | | | | | | ||||||||
Total |
| | — | | | | | | | 11,477,800 | | | | 1.09 | | | |||||
The following table summarizes the historical results of our hedging activities for the year ended December 31, 2014:
|
| For the year ended December 31, 2014 |
| ||||||||
| | | | | | | ||||||
|
| Predecessor | | Vantage I |
| ||||||
| | | | | | | ||||||
Average prices before effects of hedges: |
| | | | | | | ||||
Natural gas (Mcf) |
| | $ | 2.97 | | | | $ | 3.16 | | |
Oil (Bbl) |
| | | | | 87.35 | | | |||
NGL (Bbl) |
| | | | | 24.56 | | | |||
Average prices after effects of hedges: |
| | | | | | | ||||
Natural gas (Mcf) |
| | 3.05 | | | | 3.19 | | | ||
Oil (Bbl) |
| | | | | 83.34 | | | |||
NGL (Bbl) |
| | | | | 23.85 | | | |||
As of July 31, 2016, we had entered into hedging contracts through 2019 covering a total of approximately 219 TBtu of our projected natural gas, NGLs and oil production at a weighted average price of $2.43 per MMBtu. We elected not to designate our current portfolio of commodity derivative contracts as hedges for accounting purposes. Therefore, changes in fair value of these derivative instruments are recognized in earnings. Please see "— Quantitative and Qualitative Disclosure About Market Risk" for additional discussion of our commodity derivative contracts.
Like other businesses engaged in the exploration and production of natural gas, NGLs and oil, we face the challenge of natural production declines. As initial reservoir pressures are depleted, natural gas, NGLs and oil production from a given well naturally decreases. Thus, a natural gas, NGLs and oil exploration and production company depletes part of its asset base with each unit of natural gas, NGLs and oil it produces. We attempt to overcome this natural decline by drilling to find additional reserves and acquiring more reserves than we produce. Our future growth will
71
depend on our ability to enhance production levels from our existing reserves and to continue to add reserves in excess of production in a cost effective manner. Our ability to make capital expenditures to increase production from our existing reserves and to add reserves through drilling is dependent on our capital resources and can be limited by many factors, including our ability to access capital in a cost effective manner and to timely obtain drilling permits and regulatory approvals.
Our financial condition and results of operations, including the growth of production, cash flows and reserves, are driven by several factors, including:
- •
- success in drilling new wells;
- •
- natural gas, NGLs and oil prices;
- •
- the availability of attractive acquisition opportunities and our ability to execute them;
- •
- the amount of capital we invest in the leasing and development of our properties;
- •
- facility or equipment availability and unexpected downtime;
- •
- delays imposed by or resulting from compliance with regulatory requirements; and
- •
- the rate at which production volumes on our wells naturally decline.
Market Conditions
The oil and gas industry is cyclical and commodity prices are highly volatile. Since the second half of 2014, commodity prices have declined precipitously and have remained depressed thus far in 2016. Specifically, spot prices for Henry Hub natural gas declined from approximately $4.40 per MMBtu in January 2014 to $3.00 per MMBtu in January 2015, and declined further to less than $1.70 per MMBtu for a brief period in March 2016. Our revenue, profitability and future growth are highly dependent on the prices we receive for our natural gas, NGLs and oil production. Compared to 2014, our realized natural gas price for 2015 dropped 45.6% to $1.68 per Mcf, our realized price for NGLs dropped 57.5% to $10.45 per Bbl and our realized oil price dropped 53.1% to $41.00 per Bbl. Similarly, for the six months ended June 30, 2016, our realized price for natural gas was $1.35 per Mcf, our realized price for NGLs was $11.09 per Bbl and our realized price for oil was $34.09 per Bbl.
Lower commodity prices not only may decrease our revenues, but also may reduce the amount of natural gas, NGLs and oil that we can produce economically and therefore potentially lower our natural gas, NGLs and oil reserves. For example, during 2015, we ran a two rig drilling program with one rig operating in the Appalachian Basin and one rig operating in the Barnett Shale. After temporarily reducing the pace of our drilling and completions activities in the first half of 2016 due to depressed commodity prices, we are currently running two rigs in the Marcellus Shale with the intention of adding a third rig in the Marcellus Shale by year end. Due to our temporary reduction in the pace of our drilling and completion activities in the first half of 2016, our average daily production in the second half of 2016 is anticipated to be lower than our average daily production in the first half of 2016. As a result of our increased drilling and completion activities in the second half of 2016, we anticipate that our average daily production in the first half of 2017 will be materially higher than our average daily production in the second half of 2016. We retain the flexibility to adjust our rig count based on the commodity price environment and other factors.
Our predecessor and Vantage I incurred approximately $81.7 million and $156.0 million of impairment charges during the six months ended June 30, 2016, respectively, and $172.7 million and $344.4 million of impairment charges during 2015, respectively, and lower commodity prices in the future could result in further impairments of our properties, which could have a material adverse
72
effect on our results of operations for the periods in which such charges are taken. Lower natural gas, NGLs and oil prices may also reduce the borrowing base under our new revolving credit agreement, which is determined at the discretion of the lenders and is based on the collateral value of our proved reserves that have been mortgaged to the lenders. Alternatively, higher natural gas and oil prices may result in significant non-cash fair value losses being incurred on our derivatives, which could cause us to experience net losses when natural gas and oil prices rise.
Recent declines in oil and natural gas prices have had a negative impact on our estimated proved reserves. In the future, a prolonged period of depressed commodity prices may have a significant impact on the value and volumes of our proved reserve portfolio, assuming no other changes in our development plans or costs. If the SEC pricing as of December 31, 2015 (based on average first-of-month prices for the preceding twelve months) for our December 31, 2015 reserve report were replaced with SEC pricing as of June 30, 2016, the estimated future net volumes of our proved reserves on a combined basis would have decreased by 21.1 Bcfe. However, if SEC pricing as of December 31, 2015, which was used for our December 31, 2015 reserve report, had been replaced with forward NYMEX strip prices as of June 30, 2016 for the period through December 2020 and flat thereafter, the estimated future net volumes of our proved reserves on a combined basis would have increased by 87.4 Bcfe. Commodity prices are inherently volatile, and we are unable to predict future commodity prices with any level of certainty.
Factors That Significantly Affect Comparability of Our Financial Condition and Results of Operations
Our predecessor's historical financial condition and results of operations for the periods presented may not be comparable, either from period to period or going forward, for the following reasons:
Level of Development Activity. During 2015, we ran a two rig drilling program with one rig operating in the Appalachian Basin and one rig operating in the Barnett Shale. After temporarily reducing the pace of our drilling and completions activities in the first half of 2016 due to commodity prices, we are currently running two rigs in the Marcellus Shale with the intention of adding a third rig in the Marcellus Shale by year end, and we retain the flexibility to adjust our rig count based on the commodity price environment and other factors. Reductions in drilling and completion activity may result in declining levels or natural gas, NGLs and oil production.
Alpha Acquisition. On May 16, 2016, we entered into a purchase and sale agreement with a wholly owned subsidiary of Alpha Natural Resources to purchase certain natural gas properties located in Greene County (the "Alpha Properties") for cash consideration of $339.5 million, subject to post-closing adjustment (the "Alpha Acquisition"). The Alpha Properties consist of approximately 31,323 net acres, of which 5,027 acres are held in fee and leased to third parties, along with non-operating royalty interests in 42 producing Marcellus horizontal wells and certain related midstream and other assets. The Alpha Acquisition was completed in June 2016, with an effective date of April 1, 2016. The Alpha Acquisition added 330 identified drilling locations, including 226 in the Marcellus Shale, 72 in the Upper Devonian Shale and 32 in the Utica Shale. The Alpha Acquisition is shown on a combined basis with our predecessor since the acquisition date.
Corporate Reorganization. The historical consolidated financial statements included in this prospectus are based on the financial statements of our predecessor, Vantage II, prior to our corporate reorganization to be completed in connection with the completion of this offering. In our corporate reorganization, the combination of Vantage I into us will be accounted for at fair value as a business combination by applying the acquisition method, which is expected to significantly alter our full cost pool and increase future depletion costs, among other changes. In addition, we expect to record a significant amount of goodwill in connection with the acquisition of Vantage I for the
73
excess of the consideration over the net assets received, representing the future economic benefits arising from assets acquired that could not be individually identified and separately recognized. The fair value of the purchase consideration will be based upon the fair value of the common stock issued in the corporate reorganization. Factors which will impact the allocation of the purchase consideration include the estimated fair value of proved and unproved reserves, the expected timing and amount of future development and operating costs, projections of future rates of production, expected recovery rates and risk adjusted discount rates. Finally, we will also be a taxable entity in future periods. Because Vantage II and Vantage I have assets that substantially overlap and have been operated as a single business under a single management and operational team, we do not expect that the corporate reorganization will have any significant impacts on the manner in which our operations are managed going forward. Please see "Corporate Reorganization". The historical financial data does not include the results of Vantage I and may not give you an accurate indication of what our actual results would have been if the transactions described in "Corporate Reorganization" had been completed at the beginning of the periods presented or of what our future results of operations are likely to be. For more information, please see the audited historical financial statements of Vantage I and the unaudited pro forma financial statements included elsewhere in this prospectus.
Impairment Charges. The natural gas price used in Vantage II's June 30, 2016 ceiling test for impairment, based on the required trailing 12-month average price, was $1.23 per Mcf for Dominion South Point prices proximate to Vantage II's Appalachian Basin operating area. The commodity prices used in Vantage I's June 30, 2016 ceiling test for impairment, based on the required trailing 12-month average price, was $1.23 per Mcf of natural gas for Dominion South Point prices proximate to Vantage I's Appalachian Basin operating area, $2.16 per Mcf of natural gas for WAHA prices proximate to Vantage I's Barnett Shale operating area, $43.00 per Bbl of oil and $15.88 per Bbl of NGLs. To demonstrate the impact of commodity prices on the ceiling calculation, had average prices of $1.29 per Mcf for Dominion South Point prices, $2.19 per Mcf for WAHA prices, $41.30 per Bbl of oil and $15.44 per Bbl of NGLs been used instead, each of Vantage II and Vantage I would not have incurred additional impairment for the six months ended June 30, 2016. The commodity prices for this assumption were calculated based on a 12-month simple average of the commodity prices on the first day of the month for the 11 months ended August 2016 and the price for August 2016 was used for the remaining month in the 12-month average. If prices remain unchanged from this assumption, no impairment will be recognized in the three months ended September 30, 2016.
The above calculation of the impact of lower commodity prices was prepared based on the assumption that all other inputs and assumptions are held constant with the exception of natural gas, NGLs and oil prices. Therefore, this calculation strictly isolates the potential impact of commodity prices on our ceiling test limitation. An amount of any future impairment is difficult to reasonably predict and will depend upon not only commodity prices but also other factors that include, but are not limited to, incremental proved reserves that may be added each period, revisions to previous reserve estimates, capital expenditures, operating costs, and all related tax effects. There are numerous uncertainties inherent in the estimation of proved reserves and accounting for oil and natural gas properties in future periods and the estimate described above should not be construed as indicative of our development plans or future results.
The ceiling limitation calculation is not intended to be indicative of the fair market value of our proved reserves or future results. Impairment charges do not affect cash flow from operating activities, but do adversely affect our net income (loss) and various components of our balance sheet. Any recorded impairment of oil and gas properties is not reversible at a later date.
Public Company Expenses. Upon completion of this offering, we expect to incur direct, incremental general and administrative ("G&A") expenses as a result of being a publicly traded
74
company, including, but not limited to, costs associated with annual and quarterly reports to stockholders, tax return preparation, independent auditor fees, SOX compliance fees, investor relations activities, registrar and transfer agent fees, incremental director and officer liability insurance costs and independent director compensation.
Income Taxes. Vantage II is a multi-member limited liability company treated as a partnership for U.S. federal income tax purposes and is not subject to federal income taxes. Accordingly, no provision for federal income taxes has been provided for in our historical results of operations because taxable income was passed through to the members of each entity. Although we are a corporation under the Internal Revenue Code, subject to federal income taxes at a statutory rate of 35% of pretax earnings, we do not expect to report any income tax benefit or expense until the consummation of this offering. Based on our deductions primarily related to intangible drilling costs ("IDCs") that are expected to exceed 2016 earnings, we expect to generate significant net operating loss assets and deferred tax liabilities.
Sources of Revenues
Our revenues are derived from the sale of natural gas, NGLs and oil, (including the effects of derivatives), gathering and compression fees collected by our natural gas gathering system and revenues for providing water services. Our revenues may vary significantly from period to period as a result of changes in volumes of production sold or changes in commodity prices.
Natural gas, NGL, and oil sales. We normally sell a large portion of our production to a relatively small number of customers. For the year ended December 31, 2015, sales to Asset Risk Management, South Jersey Industries, Targa Resources and ETC Marketing represented 29%, 20%, 12% and 12% of our total sales, respectively. For the year ended December 31, 2014, sales to Sequent Energy Services, Targa Resources, ETC Marketing and EQT represented 34%, 17%, 12%, and 10% of our total sales, respectively. Although a substantial portion of production is purchased by these major customers, we do not believe the loss of one or several of these customers would have a material adverse effect on our business, as oil and natural gas are fungible products with well-established markets and numerous purchasers.
Midstream revenues. Midstream revenues are generated from gathering, compression and water fees paid by Vantage I, Vantage II and certain third-party working and revenue interest owners. Vantage I and Vantage II both have a 50% working interest in Vantage's midstream assets and, as a result, gathering revenues from midstream assets are allocated 50% to Vantage I and 50% to Vantage II. Gathering revenues received by both Vantage I and Vantage II with regards to their working interest in Vantage's midstream assets are offset in consolidation with the gathering fees paid by Vantage I and Vantage II. As a result, gathering revenues are presented in the statements of operations of Vantage I and Vantage II and are net of the gathering fees paid by Vantage I and Vantage II on their shared midstream infrastructure.
Gains (losses) from commodity derivatives. To achieve more predictable cash flows and to reduce our exposure to downward price fluctuations, we use derivative instruments to hedge future sales prices on a significant portion of our natural gas, NGLs and oil production. We currently use fixed price natural gas swaps in which we receive a fixed price for future production in exchange for a payment of the variable market price received at the time future production is sold. At the end of each period we estimate the fair value of these swaps and, because we have not elected hedge accounting, we recognize the changes in the fair value of unsettled commodity derivative instruments in earnings at the end of each accounting period. We expect continued volatility in the fair value of these swaps.
75
Principal Components of our Cost Structure
- •
- Production and ad valorem taxes. Production taxes are
paid on produced natural gas, oil and NGLs based on a percentage of revenues from production sold at fixed rates established by federal, state or local taxing authorities. In general, the production
taxes we pay correlate to the changes in natural gas, oil and NGLs revenues. We are also subject to ad valorem taxes in the counties where our production is located. Ad valorem taxes are generally
based on the valuation of our natural gas and oil properties. Where available, we benefit from tax credits and exemptions in our various taxing jurisdictions. The state of Pennsylvania imposes an
impact fee on oil and gas production based on a formula applied towards individual wells. We also record these impact fees in production and ad valorem taxes in the consolidated statement of
operations.
- •
- Midstream. These are costs incurred to bring natural gas
to the market. Such costs include the costs to operate and maintain our low- and high-pressure gathering and compression systems as well as fees paid to third parties who operate low- and
high-pressure gathering systems that transport our natural gas.
- •
- Lease operating and workover expenses. These are the day
to day operating costs incurred to maintain production of our natural gas and oil producing wells. Such costs include produced water disposal, maintenance and repairs. Cost levels for these expenses
can vary based on supply and demand for oilfield services.
- •
- General and administrative expense. We expect that we
will incur additional general and administrative expenses as a result of being a publicly-traded company. Please see "— Factors That Significantly Affect Our Financial Condition and
Results of Operations". These costs include overhead, including payroll and benefits for our corporate staff, costs of maintaining our headquarters, costs of managing our production and development
operations, franchise taxes, audit and other professional fees and legal compliance expenses. General and administrative expenses are reported net of recoveries from other owners in properties
operated by us and amounts capitalized pursuant to the full cost method.
- •
- Depreciation, depletion, amortization and
accretion. Depreciation, depletion, amortization and accretion ("DD&A") includes the systematic expensing of the capitalized costs
incurred to acquire, explore and develop natural gas, oil and NGLs. As a "full cost" company, all costs incurred in the acquisition, exploration and development of properties (including costs of
surrendered and abandoned leaseholds, delay lease rentals, dry holes and overhead related to exploration and development activities) are capitalized. Capitalized costs are depleted using the units of
production method.
- •
- Impairment of proved oil and gas properties. Under the
full cost method we are required to perform a ceiling test for each cost center. If the net book value of our oil and gas properties exceeds the ceiling, a non-cash impairment is required. See
"— Critical Accounting Policies and Estimates" for further discussion.
- •
- Interest expense. We have financed a portion of our working capital requirements and drilling activities with borrowings under our revolving credit facilities and term loan. As a result, we incur interest expense that is affected by the level of drilling, completion and acquisition activities, as well as fluctuations in interest rates and our financing decisions. We will likely continue to incur significant interest expense as we continue to grow. Additionally, we capitalized $5.8 million of interest expense for the year ended December 31, 2015.
76
Corporate Reorganization
The limited liability company agreements of Vantage Investment I and Vantage Investment II to be adopted in connection with the closing of this offering provide a mechanism by which the shares of our common stock to be allocated amongst the members of Vantage Investment I and Vantage Investment II will be determined. As a result, the satisfaction of all performance, market, and service conditions relative to the incentive unit awards held by certain Management Members will be probable. Accordingly, we will recognize approximately $ million in a non-cash charge for incentive compensation expense for the estimated fair value of those awards at the closing of this offering. The charge will not have a dilutive effect on the pro forma net tangible book value per share to new investors in this offering.
Because consideration for the membership interests awards will be deemed given by Vantage Investment II, the charge to expense will be accounted for as capital contributions by Vantage Investment II to us and credited to additional paid-in capital.
Vantage II (Predecessor) Results of Operations
Three Months Ended June 30, 2016 Compared to Three Months Ended June 30, 2015
Below are some highlights of our financial and operating results for the three months ended June 30, 2016:
- •
- Our production volumes increased 79.1% to 18,932 MMcfe for the three months ended June 30, 2016 compared to
10,573 MMcfe for the three months ended June 30, 2015.
- •
- Natural gas sales revenues increased 84.1% to $26.1 million for the three months ended June 30, 2016 compared to $14.2 million for the three months ended June 30, 2015.
The following table sets forth selected operating data for the three months ended June 30, 2016 compared to the three months ended June 30, 2015:
|
| Predecessor | | | ||||||||
| | | | | | | | | | | |||
|
| For the Three Months Ended June 30, |
| Amount of |
| |||||||
| | | | | | | | | | | |||
(in thousands) |
| 2016 | | 2015 | | Change |
| |||||
| | | | | | | | | |||||
Revenues: |
| | | | | | ||||||
Natural gas sales |
| $ | 26,055 | | $ | 14,152 | | | $ | 11,903 | | |
Midstream revenues |
| 1,732 | | 1,142 | | | 590 | | | |||
Gain (loss) on commodity derivatives |
| (34,507 | ) | 6,725 | | | (41,232 | ) | | |||
| | | | | | | | | |||||
Total revenues |
| (6,720 | ) | 22,019 | | | (28,739 | ) | | |||
Operating expenses: |
| | | | | | ||||||
Production and ad valorem taxes |
| 574 | | 288 | | | 286 | | | |||
Marketing and gathering |
| 5,237 | | 2,758 | | | 2,479 | | | |||
Lease operating and workover |
| 1,242 | | 1,814 | | | (572 | ) | | |||
Midstream operating |
| 416 | | 416 | | | — | | | |||
General and administrative |
| 2,432 | | 2,260 | | | 172 | | | |||
Depreciation, depletion, amortization and accretion |
| 10,150 | | 9,481 | | | 669 | | | |||
Impairment of proved oil and gas properties |
| 15,952 | | — | | | 15,952 | | | |||
| | | | | | | | | |||||
Total operating expenses |
| 36,003 | | 17,017 | | | 18,986 | | | |||
| | | | | | | | | |||||
Operating (loss) income |
| (42,723 | ) | 5,002 | | | (47,725 | ) | | |||
77
|
| Predecessor | | | ||||||||
| | | | | | | | | | | |||
|
| For the Three Months Ended June 30, |
| Amount of | | |||||||
| | | | | | | | | | | |||
(in thousands) |
| 2016 | | 2015 | | Change | | |||||
| | | | | | | | | |||||
Other expenses: |
| | | | | | ||||||
Other income (expense) |
| 3 | | (180 | ) | | 183 | | | |||
Interest expense, net of capitalized income |
| (2,844 | ) | (2,766 | ) | | (78 | ) | | |||
| | | | | | | | | |||||
Total other expenses |
| (2,841 | ) | (2,946 | ) | | 105 | | | |||
Net income (loss) |
| $ | (45,564 | ) | $ | 2,056 | | | $ | (47,620 | ) | |
| | | | | | | | | |||||
| | | | | | | | | | | |||
| | | | | | | | | |||||
SEGMENT FINANCIAL DATA — E&P |
| | | | | | ||||||
Natural gas, NGL and oil sales |
| $ | 26,055 | | $ | 14,152 | | | $ | 11,903 | | |
Gain (loss) on commodity derivatives |
| (34,507 | ) | 6,725 | | | (41,232 | ) | | |||
| | | | | | | | | |||||
Total realized revenues |
| (8,452 | ) | 20,877 | | | (29,329 | ) | | |||
Operating expenses |
| 11,328 | | 7,685 | | | 3,643 | | | |||
Gathering and compression expenses |
| — | | (45 | ) | | 45 | | | |||
Allocated general and administrative expenses |
| 2,131 | | 1,946 | | | 186 | | | |||
Other income (expense) |
| 3 | | (180 | ) | | 183 | | | |||
Total (gains) losses on derivative, net, less net cash from settlement of commodity derivatives |
| 44,681 | | (109 | ) | | 44,790 | | | |||
| | | | | | | | | |||||
Adjusted EBITDA |
| $ | 22,773 | | $ | 11,002 | | | $ | 11,771 | | |
SEGMENT FINANCIAL DATA — Midstream |
| | | | | | ||||||
Gathering and compression revenues |
| $ | 6,055 | | $ | 3,967 | | | $ | 2,088 | | |
Water revenues |
| 1,353 | | — | | | 1,353 | | | |||
| | | | | | | | | |||||
Total realized revenues |
| 7,408 | | 3,967 | | | 3,441 | | | |||
Gathering and compression operating expenses |
| 416 | | 461 | | | (45 | ) | | |||
Water system expenses |
| 1,649 | | — | | | 1,649 | | | |||
Allocated general and administrative expenses |
| 301 | | 314 | | | (13 | ) | | |||
| | | | | | | | | |||||
Adjusted EBITDA |
| $ | 5,042 | | $ | 3,192 | | | $ | 1,850 | | |
OPERATIONAL DATA |
| | | | | | ||||||
Production Data: |
| | | | | | ||||||
Natural gas (MMcf) |
| 18,932 | | 10,573 | | | 8,359 | | | |||
Midstream Data: |
| | | | | | ||||||
Throughput (MMcf) |
| 11,742 | | 8,087 | | | 3,655 | | | |||
Water volumes (MBbl) |
| 348 | | — | | | 348 | | | |||
Average prices before effects of hedges per Mcf: |
| | | | | | ||||||
Natural gas |
| $ | 1.38 | | $ | 1.34 | | | $ | 0.04 | | |
Average prices after effects of hedges per Mcf(1): |
| | | | | | ||||||
Natural gas |
| $ | 1.91 | | $ | 1.96 | | | $ | (0.05 | ) | |
Average cost per Mcf: |
| | | | | | ||||||
Production and ad valorem taxes |
| $ | 0.03 | | $ | 0.03 | | | $ | 0.00 | | |
Marketing and gathering |
| 0.28 | | 0.26 | | | $ | 0.02 | | | ||
Lease operating and workover expenses |
| 0.07 | | 0.17 | | | $ | (0.10 | ) | | ||
General and administrative |
| 0.13 | | 0.21 | | | $ | (0.08 | ) | | ||
Depreciation, depletion, amortization and accretion |
| 0.54 | | 0.90 | | | $ | (0.36 | ) | | ||
- (1)
- The effect of hedges includes realized gains and losses on commodity derivative transactions.
Natural gas sales revenues. Natural gas revenue increased $11.9 million, or 84.1%, from $14.2 million during the three months ended June 30, 2015 to $26.1 million during the three months ended June 30, 2016. The increase is primarily attributable an increase in production volumes of 79.1% and to a lesser extent due to a 3.0% increase in realized natural gas prices from $1.34 per Mcf for the three months ended June 30, 2015 to $1.38 per Mcf for the three months ended June 30, 2016.
78
Midstream revenues. Midstream revenue increased $0.6 million, or 51.7%, to $1.7 million during the three months ended June 30, 2016 from $1.1 million during the three months ended June 30, 2015 due to the higher production from new wells, partially offset by production declines on certain pads.
Gain (loss) on commodity derivatives. Gains on commodity derivatives decreased 613%, to a loss of $34.5 million during the three months ended June 30, 2016 from a gain of $6.7 million during the three months ended June 30, 2015. The $34.5 million loss on commodity derivatives during the three months ended June 30, 2016 was comprised of $44.7 million in losses due to the change in fair value of the derivative contracts and $10.2 million of cash received upon contract settlements. The $6.7 million gain during the three months ended June 30, 2015 was comprised of $0.1 million in gains due to the change in fair value of the derivative contracts and $6.6 million of cash received upon contract settlements. The decrease in unrealized fair value is primarily attributable to an increase in commodity prices. Commodity derivative fair value gains or losses will vary on future commodity prices and have no cash flow impact until the derivative contracts are settled. We expect continued volatility in the fair value of our derivative instruments.
Production and ad valorem taxes. Production and ad valorem taxes increased $0.3 million to $0.6 million during the three months ended June 30, 2016 from $0.3 million during the three months ended June 30, 2015. The increase in impact fees is primarily due to increased drilling during the three months ended June 30, 2016 compared to the three months ended June 30, 2015. These fees are accrued when a well is spud.
Marketing and gathering. Marketing and gathering expenses for the three months ended June 30, 2016 were $5.2 million, compared to $2.8 million for the three months ended June 30, 2015 due to higher production from new wells, partially offset by production declines on certain pads.
Midstream operating. Midstream operating expenses were virtually unchanged for the three months ended June 30, 2016 as compared to the three months ended June 30, 2015 at $0.4 million.
Lease operating and workover expenses. Lease operating and workover expenses decreased to $1.2 million during the three months ended June 30, 2016 from $1.8 million during the three months ended June 30, 2015. The decrease is primarily due to reduced salt water disposal costs arising from the re-use of water in drilling and completion operations as opposed to incurring disposal costs of the water at commercial facilities. As a result, salt water disposal costs decreased to $0.5 million for the three months ended June 30, 2016 from $1.1 million for the three months ended June 30, 2015, representing a decrease from $0.11 per Mcf to $0.02 per Mcf.
General and administrative expense. General and administrative expenses increased to $2.4 million during the three months ended June 30, 2016 from $2.3 million during the three months ended June 30, 2015 as a result of higher labor costs partially offset by increased capitalized general and administrative expenses. General and administrative expenses are net of overhead recoveries from third parties and capitalized general and administrative expenses of $1.2 million and $0.6 million for the three months ended June 30, 2016 and 2015, respectively. The increase in overhead recoveries and capitalized general and administrative expense is primarily related to increased acquisition, drilling and completion activities during the three months ended June 30, 2016 compared to the three months ended June 30, 2015. The increase in labor related expenses is primarily the result of an increase in salaries and wages from a higher headcount. We expect general and administrative expenses to increase in future periods as a result of additional public company expenses.
79
Depreciation, depletion, amortization and accretion. Depreciation, depletion, amortization and accretion expenses increased to $10.2 million during the three months ended June 30, 2016 from $9.5 million during the three months ended June 30, 2015. The increase is primarily the result of a 79.1% increase in production, partially offset by a 42.1% decrease in the depletion rate from $0.82 per MMcfe for the three months ended June 30, 2015 to $0.47 per MMcfe for the three months ended June 30, 2016. The decrease in the depletion rate was primarily due to $238.4 million in impairment charges incurred after the second quarter of 2015.
Impairment of proved oil and gas properties. Impairment for the three months ended June 30, 2016 was $16.0 million, compared to zero for the three months ended June 30, 2015. The impairment is primarily the result of decreases in the trailing 12-month average prices for natural gas. If pricing conditions decline further, we will incur full cost ceiling impairments in future quarters, the magnitude of which will be affected by one or more of the other components of the ceiling test calculations, until prices stabilize or improve over a twelve-month period. For a discussion of the Vantage II asset impairments, see Note 1 to the unaudited condensed consolidated financial statements of Vantage II included elsewhere in this prospectus.
Interest expense, net of capitalized interest. Interest expense was comparable between periods at $2.8 million in each of the three months ended June 30, 2016 and 2015.
Six Months Ended June 30, 2016 Compared to Six Months Ended June 30, 2015
Below are some highlights of our financial and operating results for the six months ended June 30, 2016:
- •
- Our production volumes increased 57.6% to 34,759 MMcfe for the six months ended June 30, 2016 compared to
22,054 MMcfe for the six months ended June 30, 2015.
- •
- Natural gas sales revenues increased 16.0% to $46.8 million for the six months ended June 30, 2016 compared to $40.4 million for the six months ended June 30, 2015.
The following table sets forth selected operating data for the six months ended June 30, 2016 compared to the six months ended June 30, 2015:
|
| Predecessor | | | ||||||||
| | | | | | | | | | | |||
|
| For the Six Months Ended June 30, |
| Amount of | | |||||||
| | | | | | | | | | | |||
(in thousands) |
| 2016 | | 2015 | | Change |
| |||||
| | | | | | | | | |||||
Revenues: |
| | | | | | ||||||
Natural gas sales |
| $ | 46,829 | | $ | 40,375 | | | $ | 6,454 | | |
Midstream revenues |
| 2,895 | | 2,524 | | | 371 | | | |||
Gain (loss) on commodity derivatives |
| (22,599 | ) | 14,921 | | | (37,520 | ) | | |||
| | | | | | | | | |||||
Total revenues |
| 27,125 | | 57,820 | | | (30,695 | ) | | |||
Operating expenses: |
| | | | | | ||||||
Production and ad valorem taxes |
| 1,025 | | 512 | | | 513 | | | |||
Marketing and gathering |
| 7,961 | | 6,063 | | | 1,898 | | | |||
Lease operating and workover |
| 1,590 | | 4,451 | | | (2,861 | ) | | |||
Midstream operating |
| 1,428 | | 831 | | | 597 | | | |||
General and administrative |
| 4,336 | | 5,487 | | | (1,151 | ) | | |||
Depreciation, depletion, amortization and accretion |
| 19,490 | | 23,357 | | | (3,867 | ) | | |||
Impairment of proved oil and gas properties |
| 81,673 | | — | | | 81,673 | | | |||
| | | | | | | | | |||||
Total operating expenses |
| 117,503 | | 40,701 | | | 76,802 | | | |||
| | | | | | | | | |||||
Operating (loss) income |
| (90,378 | ) | 17,119 | | | (107,497 | ) | | |||
80
|
| Predecessor | | | ||||||||
| | | | | | | | | | | |||
|
| For the Six Months Ended June 30, |
| Amount of | | |||||||
| | | | | | | | | | | |||
(in thousands) |
| 2016 | | 2015 | | Change | | |||||
| | | | | | | | | |||||
Other expenses: |
| | | | | | ||||||
Other income (expense) |
| 3 | | (180 | ) | | 183 | | | |||
Interest expense, net of capitalized income |
| (5,264 | ) | (4,229 | ) | | (1,035 | ) | | |||
| | | | | | | | | |||||
Total other expenses |
| (5,261 | ) | (4,409 | ) | | (852 | ) | | |||
Net income (loss) |
| $ | (95,639 | ) | $ | 12,710 | | | $ | (108,349 | ) | |
| | | | | | | | | |||||
| | | | | | | | | | | |||
| | | | | | | | | |||||
SEGMENT FINANCIAL DATA — E&P |
| | | | | | ||||||
Natural gas, NGL and oil sales |
| $ | 46,829 | | $ | 40,375 | | | $ | 6,454 | | |
Gain (loss) on commodity derivatives |
| (22,599 | ) | 14,921 | | | (37,520 | ) | | |||
| | | | | | | | | |||||
Total realized revenues |
| 24,230 | | 55,296 | | | (31,066 | ) | | |||
Operating expenses |
| 20,399 | | 16,321 | | | 4,078 | | | |||
Gathering and compression expenses |
| — | | (45 | ) | | 45 | | | |||
Allocated general and administrative expenses |
| 3,705 | | 4,889 | | | (1,184 | ) | | |||
Other income (expense) |
| 3 | | (180 | ) | | 183 | | | |||
Total (gain) losses on derivative, net, less net cash from settlement of commodity derivatives |
| 48,219 | | (4,957 | ) | | 53,176 | | | |||
| | | | | | | | | |||||
Adjusted EBITDA |
| $ | 48,348 | | $ | 28,994 | | | $ | 19,354 | | |
Other |
| | | | | | ||||||
Total assets |
| $ | 720,116 | | $ | 531,830 | | | $ | 188,286 | | |
Capital expenditures |
| $ | 426,086 | | $ | 70,809 | | | $ | 355,277 | | |
SEGMENT FINANCIAL DATA — Midstream |
| | | | | | ||||||
Gathering and compression revenues |
| $ | 12,767 | | $ | 7,819 | | | $ | 4,948 | | |
Water revenues |
| 3,944 | | — | | | 3,944 | | | |||
| | | | | | | | | |||||
Total realized revenues |
| 16,711 | | 7,819 | | | 8,892 | | | |||
Gathering and compression operating expenses |
| 1,428 | | 876 | | | 552 | | | |||
Water system expenses |
| 3,457 | | — | | | 3,457 | | | |||
Allocated general and administrative expenses |
| 631 | | 598 | | | 33 | | | |||
| | | | | | | | | |||||
Adjusted EBITDA |
| $ | 11,195 | | $ | 6,345 | | | $ | 4,850 | | |
Other |
| | | | | | ||||||
Total assets |
| $ | 63,703 | | $ | 57,664 | | | $ | 6,039 | | |
Capital expenditures |
| $ | 2,427 | | $ | 7,995 | | | $ | (5,568 | ) | |
OPERATIONAL DATA |
| | | | | | ||||||
Production Data: |
| | | | | | ||||||
Natural gas (MMcf) |
| 34,759 | | 22,054 | | | 12,705 | | | |||
Midstream Data: |
| | | | | | ||||||
Throughput (MMcf) |
| 24,164 | | 15,709 | | | 8,455 | | | |||
Water volumes (MBbl) |
| 1,097 | | — | | | 1,097 | | | |||
Average prices before effects of hedges per Mcf: |
| | | | | | ||||||
Natural gas |
| $ | 1.35 | | $ | 1.83 | | | $ | (0.48 | ) | |
Average prices after effects of hedges per Mcf(1): |
| | | | | | ||||||
Natural gas |
| $ | 2.08 | | $ | 2.28 | | | $ | (0.20 | ) | |
Average cost per Mcf: |
| | | | | | ||||||
Production and ad valorem taxes |
| $ | 0.03 | | $ | 0.02 | | | $ | 0.01 | | |
Marketing and gathering |
| 0.23 | | 0.27 | | | $ | (0.04 | ) | | ||
Lease operating and workover expenses |
| 0.05 | | 0.20 | | | $ | (0.15 | ) | | ||
General and administrative |
| 0.12 | | 0.25 | | | $ | (0.13 | ) | | ||
Depreciation, depletion, amortization and accretion |
| 0.56 | | 1.06 | | | $ | (0.50 | ) | | ||
- (1)
- The effect of hedges includes realized gains and losses on commodity derivative transactions.
81
Natural gas sales revenues. Natural gas revenue increased $6.5 million, or 16.0%, from $40.4 million during the six months ended June 30, 2015 to $46.8 million during the six months ended June 30, 2016. The increase is primarily attributable to a 57.6% increase in production volumes, partially offset by a 26.4% decrease in realized natural gas prices from $1.83 per Mcf for the six months ended June 30, 2015 to $1.35 per Mcf for the six months ended June 30, 2016.
Midstream revenues. Midstream revenue increased $0.4 million, or 14.7%, to $2.9 million during the six months ended June 30, 2016 from $2.5 million during the six months ended June 30, 2015 due to the higher production from new wells, partially offset by production declines on certain pads.
Gain (loss) on commodity derivatives. Gains on commodity derivatives decreased 251%, to a loss of $22.6 million, during the six months ended June 30, 2016 from a gain of $14.9 million during the six months ended June 30, 2015. The $22.6 million loss on commodity derivatives during the six months ended June 30, 2016 was comprised of $48.2 million in losses due to the change in fair value of the derivative contracts and $25.6 million of cash received upon contract settlements. The $14.9 million gain during the six months ended June 30, 2015 was comprised of $4.9 million in gains due to the change in fair value of the derivative contracts and $10.0 million of cash received upon contract settlements. The decrease in unrealized fair value is primarily attributable to an increase in commodity prices. Commodity derivative fair value gains or losses will vary on future commodity prices and have no cash flow impact until the derivative contracts are settled. We expect continued volatility in the fair value of our derivative instruments.
Production and ad valorem taxes. Production and ad valorem taxes increased $0.5 million to $1.0 million during the six months ended June 30, 2016 from $0.5 million during the six months ended June 30, 2015. The increase in impact fees is primarily due to increased drilling during the six months ended June 30, 2016 compared to the six months ended June 30, 2015. These fees are accrued when a well is spud.
Marketing and gathering. Marketing and gathering expenses for the six months ended June 30, 2016 increased $1.9 million, or 31.3%, to $8.0 million from $6.1 million for the six months ended June 30, 2015 due to higher production from new wells, partially offset by production declines on certain pads.
Midstream operating. Midstream operating expenses for the six months ended June 30, 2016 were $1.4 million, compared to $0.8 million for the six months ended June 30, 2015. The increase is due to additional compression and other operating costs related to increased system throughput.
Lease operating and workover expenses. Lease operating and workover expenses decreased to $1.6 million during the six months ended June 30, 2016 from $4.5 million during the six months ended June 30, 2015. The decrease is primarily due to reduced salt water disposal costs arising from the re-use of water in drilling and completion operations as opposed to disposal of the water at commercial facilities. As a result, salt water disposal costs decreased to $0.6 million for the six months ended June 30, 2016 from $3.0 million for the six months ended June 30, 2015, representing a decrease from $0.14 per Mcf to $0.02 per Mcf.
General and administrative expense. General and administrative expenses decreased to $4.3 million during the six months ended June 30, 2016 from $5.5 million during the six months ended June 30, 2015 primarily due to increased capitalized general and administrative expenses and lower labor costs. General and administrative expenses are net of overhead recoveries from third parties and capitalized general and administrative expenses of $2.7 million and $1.9 million for the six months ended June 30, 2016 and 2015, respectively. The increase in overhead recoveries and capitalized general and administrative expenses is primarily related to increased acquisition,
82
drilling and completion activities during the six months ended June 30, 2016 compared to the six months ended June 30, 2015. The decrease in labor related expenses is primarily the result of a $0.7 million reduction in compensation expense related to bonuses partially offset by an increase in salaries and wages from a higher headcount. We expect general and administrative expenses to increase in future periods as a result of additional public company expenses.
Depreciation, depletion, amortization and accretion. Depreciation, depletion, amortization and accretion expenses decreased to $19.5 million during the six months ended June 30, 2016 from $23.4 million during the six months ended June 30, 2015. The decrease is primarily the result of $238.4 million in impairment charges incurred after the first quarter 2015, which contributed to a decrease in the depletion rate to $0.50 per MMcf for the six months ended June 30, 2016 from $0.98 per MMcfe for the six months ended June 30, 2015. The decrease was partially offset by an increase in production to 34,759 MMcf from 22,054 MMcf for the respective periods.
Impairment of proved oil and gas properties. Impairment for the six months ended June 30, 2016 was $81.7 million, compared to zero for the six months ended June 30, 2015. The impairment is primarily the result of decreases in the trailing 12-month average prices for natural gas. If pricing conditions decline further, we will incur full cost ceiling impairments in future quarters, the magnitude of which will be affected by one or more of the other components of the ceiling test calculations, until prices stabilize or improve over a twelve-month period. For a discussion of the Vantage II asset impairments, see Note 1 to the unaudited condensed combined financial statements of Vantage II included elsewhere in this prospectus.
Interest expense, net of capitalized interest. The increase of $1.0 million is primarily attributable to an increase in outstanding revolving credit facility balances from $127.0 million at June 30, 2015 to $146.2 million at June 30, 2016, as well as an increase in the average interest rate on the revolving credit facility from 2.68% for the six months ended June 30, 2015 to 3.41% for the six months ended June 30, 2016.
Year Ended December 31, 2015 Compared to Year Ended December 31, 2014
Below are some highlights of our financial and operating results for the year ended December 31, 2015:
- •
- Our production volumes increased 180.7% to 41,216 MMcf in the year ended December 31, 2015 compared to
14,683 MMcf in the year ended December 31, 2014.
- •
- Our natural gas sales increased 49.6% to $65.3 million in the year ended December 31, 2015 compared to
$43.6 million in the year ended December 31, 2014.
- •
- Our per unit lease operating and workover expenses decreased 30.2% to $0.12 per Mcf in the year ended December 31, 2015 compared to $0.17 per Mcf in the year ended December 31, 2014.
83
The following table sets forth selected operating data for the year ended December 31, 2015 compared to the year ended December 31, 2014:
|
| Predecessor | | | ||||||||
| | | | | | | | | | | |||
|
| For the Year Ended December 31, |
| Amount of |
| |||||||
| | | | | | | | | | | |||
(in thousands) |
| 2015 | | 2014 | | Change |
| |||||
| | | | | | | | | |||||
Revenues: |
| | | | | | ||||||
Natural gas sales |
| $ | 65,252 | | $ | 43,622 | | | $ | 21,630 | | |
Midstream revenues |
| 4,054 | | 2,990 | | | 1,064 | | | |||
Gain (loss) on commodity derivatives |
| 51,793 | | 14,434 | | | 37,359 | | | |||
| | | | | | | | | |||||
Total revenues |
| 121,099 | | 61,046 | | | 60,053 | | | |||
Operating expenses: |
| | | | | | ||||||
Production and ad valorem taxes |
| 1,911 | | 1,723 | | | 188 | | | |||
Marketing and gathering |
| 9,745 | | 5,333 | | | 4,412 | | | |||
Lease operating and workover |
| 4,934 | | 2,517 | | | 2,417 | | | |||
Midstream operating |
| 1,834 | | 891 | | | 943 | | | |||
General and administrative |
| 7,308 | | 5,423 | | | 1,885 | | | |||
Depreciation, depletion, amortization and accretion |
| 39,698 | | 18,302 | | | 21,396 | | | |||
Impairment of proved oil and gas properties |
| 172,673 | | — | | | 172,673 | | | |||
| | | | | | | | | |||||
Total operating expenses |
| 238,103 | | 34,189 | | | 203,914 | | | |||
| | | | | | | | | |||||
Operating (loss) income |
| (117,004 | ) | 26,857 | | | (143,861 | ) | | |||
Other expenses: |
| | | | | | ||||||
Other income (expense) |
| (180 | ) | — | | | (180 | ) | | |||
Interest expense, net of capitalized income |
| (8,778 | ) | (4,027 | ) | | (4,751 | ) | | |||
| | | | | | | | | |||||
Total other expenses |
| (8,958 | ) | (4,027 | ) | | (4,931 | ) | | |||
Income tax expense (benefit) |
| — | | — | | | — | | | |||
Net income (loss) |
| $ | (125,962 | ) | $ | 22,830 | | | $ | (148,792 | ) | |
| | | | | | | | | |||||
| | | | | | | | | | | |||
| | | | | | | | | |||||
SEGMENT FINANCIAL DATA — E&P |
| | | | | | ||||||
Natural gas, NGL and oil sales |
| $ | 65,252 | | $ | 43,622 | | | $ | 21,630 | | |
Gain (loss) on commodity derivatives |
| 51,793 | | 14,434 | | | 37,359 | | | |||
| | | | | | | | | |||||
Total realized revenues |
| 117,045 | | 58,056 | | | 58,989 | | | |||
Operating expenses |
| 28,292 | | 13,804 | | | 14,488 | | | |||
Allocated general and administrative expenses |
| 6,140 | | 4,546 | | | 1,594 | | | |||
Other income (expense) |
| (180 | ) | — | | | (180 | ) | | |||
Total (gains) losses on derivative, net, less net cash from settlement of commodity derivatives |
| (25,204 | ) | (13,499 | ) | | (11,705 | ) | | |||
| | | | | | | | | |||||
Adjusted EBITDA |
| $ | 57,229 | | $ | 26,207 | | | $ | 31,022 | | |
Other |
| | | | | | ||||||
Total assets |
| $ | 429,321 | | $ | 497,806 | | | $ | (68,485 | ) | |
Capital expenditures |
| $ | 135,524 | | $ | 176,799 | | | $ | (41,275 | ) | |
SEGMENT FINANCIAL DATA — Midstream |
| | | | | | ||||||
Gathering and compression revenues |
| $ | 15,756 | | $ | 7,085 | | | $ | 8,671 | | |
Water revenues |
| 5,487 | | — | | | 5,487 | | | |||
| | | | | | | | | |||||
Total realized revenues |
| 21,243 | | 7,085 | | | 14,158 | | | |||
Gathering and compression operating expenses |
| 1,834 | | 891 | | | 943 | | | |||
Water system expenses |
| 4,185 | | — | | | 4,185 | | | |||
Allocated general and administrative expenses |
| 1,168 | | 877 | | | 291 | | | |||
| | | | | | | | | |||||
Adjusted EBITDA |
| $ | 14,056 | | $ | 5,317 | | | $ | 8,739 | | |
84
|
| Predecessor | | | ||||||||
| | | | | | | | | | | |||
|
| For the Year Ended December 31, |
| Amount of | | |||||||
| | | | | | | | | | | |||
(in thousands) |
| 2015 | | 2014 | | Change | | |||||
| | | | | | | | | |||||
Other |
| | | | | | ||||||
Total assets |
| $ | 62,678 | | $ | 54,464 | | | $ | 8,214 | | |
Capital expenditures |
| $ | 14,629 | | $ | 34,442 | | | $ | (19,813 | ) | |
OPERATIONAL DATA |
| | | | | | ||||||
Production Data: |
| | | | | | ||||||
Natural gas (MMcf) |
| 41,216 | | 14,683 | | | 26,533 | | | |||
Midstream Data: |
| | | | | | ||||||
Gas gathering throughput (MMcf) |
| 32,179 | | 13,887 | | | 18,292 | | | |||
Water volumes (MBbl) |
| 1,812 | | — | | | 1,812 | | | |||
Average prices before effects of hedges per Mcf: |
| | | | | | ||||||
Natural gas |
| $ | 1.58 | | $ | 2.97 | | | $ | (1.39 | ) | |
Average prices after effects of hedges per Mcf(1): |
| | | | | | ||||||
Natural gas |
| $ | 2.23 | | $ | 3.05 | | | $ | (0.82 | ) | |
Average cost per Mcf: |
| | | | | | ||||||
Production and ad valorem taxes |
| $ | 0.05 | | $ | 0.12 | | | $ | (0.07 | ) | |
Marketing and gathering |
| $ | 0.24 | | $ | 0.36 | | | $ | (0.12 | ) | |
Lease operating and workover expenses |
| $ | 0.12 | | $ | 0.17 | | | $ | (0.05 | ) | |
General and administrative |
| $ | 0.18 | | $ | 0.37 | | | $ | (0.19 | ) | |
Depreciation, depletion, amortization and accretion |
| $ | 0.96 | | $ | 1.25 | | | $ | (0.29 | ) | |
- (1)
- The effect of hedges includes realized gains and losses on commodity derivative transactions.
Natural gas sales revenues. Natural gas revenue was $65.3 million for the year ended December 31, 2015 as compared to $43.6 million for the year ended December 31, 2014. The increase in revenue from 2014 to 2015 is primarily attributable to increased production. In 2015, production increased by 180.7%, or 26,533 MMcf, from 14,683 MMcf in 2014 to 41,216 MMcf in 2015. The increase in production was partially offset by a decrease in price. Our average sales price prior to the effects of cash settled derivatives per Mcf in 2015 were $1.58, compared to $2.97 in 2014.
Midstream revenues. Midstream revenue was $4.1 million for the year ended December 31, 2015 as compared to $3.0 million for the year ended December 31, 2014. Gathering revenues increased over the prior year primarily due to an increase of 21 net wells added during 2015.
Gain on commodity derivatives. The $51.8 million gain on derivative contracts in 2015 was comprised of $25.2 million in gains due to the change in fair value of the derivative investment and $26.6 million of settlements received on contracts. In 2014, the $14.4 million gain was comprised of $13.5 million in gains due to the change in fair value of the derivative investment and $0.9 million of settlements received on contracts. Commodity derivative fair value gains or losses will vary based on future commodity prices and have no cash flow impact until the derivative contracts are settled. We expect continued volatility in the fair value of our derivative instruments.
Production and ad valorem taxes. Production and ad valorem taxes increased $0.2 million over the prior year primarily due to an increase of 21 net wells added during 2015.
Marketing and gathering. Marketing and gathering expenses increased $4.4 million over the prior year primarily due to higher production volumes. Average cost per Mcf decreased to $0.24 in 2015, from $0.36 in 2014, as a result of a higher percentage of production volumes from the James Rice pad, which has a lower cost per Mcf relative to our other wells.
85
Lease operating and workover expenses. Lease operating and workover expenses increased to $4.9 million for the year ended December 31, 2015 from $2.5 million for the year ended December 31, 2014. The increase is primarily due to higher salt water disposal costs in the first few months of 2015, compared to 2014 and an increase in producing wells in 2015. Salt water disposal costs were higher from January through April of 2015 compared to the same period in 2014 due to increased production in general; however, starting in April 2015 salt water disposal costs decreased significantly as recycling of the water for drilling and completion operations commenced.
Midstream operating expense. Midstream operating expenses for the year ended December 31, 2015 were $1.8 million, compared to $0.9 million for the year ended December 31, 2014. The increase is primarily due to a rise in repair and compressor rental charges associated with our overall growth in production and operated wells.
General and administrative expense. General and administrative expenses increased $1.9 million to $7.3 million in 2015 from $5.4 million in 2014. General and administrative expenses are net of operating and capital recoveries of $3.5 million and $4.4 million, respectively. The increase is primarily due to an increase in compensation expense of $2.5 million, which is partially offset by decreases in accounting and legal fees of $0.5 million.
Depreciation, depletion, amortization and accretion. Depreciation, depletion, and amortization expenses increased to $39.7 million for the year ended December 31, 2015 from $18.3 million for the year ended December 31, 2014. The increase is primarily the result of increased production of 41,216 MMcf in 2015, compared to 14,683 MMcf in 2014.
Impairment of proved oil and gas properties. The impairment expense of $172.7 million for the year ended December 31, 2015 is the result of a writedown of the net capitalized costs of our oil and gas properties in excess the full cost ceiling. For discussion on asset impairments, see Note 1 to "Notes to the Consolidated Financial Statements" of the Vantage Energy II, LLC audited financial statements included herein.
Interest expense, net of capitalized interest. The increase of $4.8 million is primarily attributable to an increase of our revolving credit line to $149 million as of December 31, 2015 from $100 million as of December 31, 2014 as well as an increase in the average interest rate to 2.73% for the year ended December 31, 2015 from 2.51% for the year ended December 31, 2014. Additionally, 2014 reflects lower interest expense related to the Vantage II second lien note payable, which was not outstanding until May 2014.
Vantage I Results of Operations
Three Months Ended June 30, 2016 Compared to Three Months Ended June 30, 2015
Below are some highlights of Vantage I's financial and operating results for the three months ended June 30, 2016:
- •
- Vantage I's production volumes increased 45.4% to 16,839 MMcfe for the three months ended June 30, 2016 compared to 11,578
MMcfe for the three months ended June 30, 2015.
- •
- Sales revenues increased 12.3% to $23.8 million for the three months ended June 30, 2016 compared to $21.2 million for the three months ended June 30, 2015.
86
The following table sets forth selected operating data for the three months ended June 30, 2016 compared to the three months ended June 30, 2015:
|
| Vantage I | | | ||||||||
| | | | | | | | | | | |||
|
| For the Three Months Ended June 30, |
| Amount of |
| |||||||
| | | | | | | | | | | |||
(in thousands) |
| 2016 | | 2015 | | Change |
| |||||
| | | | | | | | | |||||
Revenues: |
| | | | | | ||||||
Natural gas sales |
| $ | 19,527 | | $ | 16,813 | | | $ | 2,714 | | |
Oil sales |
| 757 | | 1,591 | | | (834 | ) | | |||
NGL sales |
| 3,518 | | 2,794 | | | 724 | | | |||
Midstream revenues |
| 4,062 | | 1,097 | | | 2,965 | | | |||
Gain (loss) on commodity derivatives |
| (38,973 | ) | 1,120 | | | (40,093 | ) | | |||
| | | | | | | | | |||||
Total revenues |
| (11,109 | ) | 23,415 | | | (34,524 | ) | | |||
Operating expenses: |
| | | | | | ||||||
Production and ad valorem taxes |
| 1,268 | | 1,259 | | | 9 | | | |||
Marketing and gathering |
| 4,102 | | 537 | | | 3,565 | | | |||
Lease operating and workover |
| 3,494 | | 4,370 | | | (876 | ) | | |||
Midstream operating |
| 415 | | 416 | | | (1 | ) | | |||
General and administrative |
| 1,945 | | 2,082 | | | (137 | ) | | |||
Depreciation, depletion, amortization and accretion |
| 12,174 | | 13,320 | | | (1,146 | ) | | |||
Impairment of proved oil and gas properties |
| 63,397 | | — | | | 63,397 | | | |||
| | | | | | | | | |||||
Total operating expenses |
| 86,795 | | 21,984 | | | 64,811 | | | |||
Operating (loss) income |
| (97,904 | ) | 1,431 | | | (99,335 | ) | | |||
Other expenses: |
| | | | | | ||||||
Other income (expense) |
| 18 | | (76 | ) | | 94 | | | |||
Interest expense, net of capitalized income |
| (6,412 | ) | (5,543 | ) | | (869 | ) | | |||
| | | | | | | | | |||||
Total other expenses |
| (6,394 | ) | (5,619 | ) | | (775 | ) | | |||
| | | | | | | | | |||||
Net income (loss) |
| $ | (104,298 | ) | $ | (4,188 | ) | | $ | (100,110 | ) | |
| | | | | | | | | |||||
| | | | | | | | | | | |||
| | | | | | | | | |||||
Revenues (in thousands): |
| | | | | | ||||||
Natural Gas |
| $ | 19,527 | | $ | 16,813 | | | $ | 2,714 | | |
Oil sales |
| 757 | | 1,591 | | | (834 | ) | | |||
NGL Sales |
| 3,518 | | 2,794 | | | 724 | | | |||
| | | | | | | | | |||||
Total sales |
| $ | 23,802 | | $ | 21,198 | | | $ | 2,604 | | |
SEGMENT FINANCIAL DATA — E&P |
| | | | | | ||||||
Natural gas, NGL and oil sales |
| $ | 23,802 | | $ | 21,198 | | | $ | 2,604 | | |
Gain (loss) on commodity derivatives |
| (38,973 | ) | 1,120 | | | (40,093 | ) | | |||
| | | | | | | | | |||||
Total realized revenues |
| (15,171 | ) | 22,318 | | | (37,489 | ) | | |||
Operating expenses |
| 10,795 | | 8,867 | | | 1,928 | | | |||
Gathering and compression expenses |
| — | | (45 | ) | | 45 | | | |||
Allocated general and administrative expenses |
| 1,644 | | 1,767 | | | (123 | ) | | |||
Other income (expense) |
| 18 | | (76 | ) | | 94 | | | |||
Total (gain) losses on derivative, net, less net cash from settlement of commodity derivatives |
| 55,308 | | 27,301 | | | 28,007 | | | |||
| | | | | | | | | |||||
Adjusted EBITDA |
| $ | 27,716 | | $ | 38,954 | | | $ | (11,238 | ) | |
87
|
| Vantage I | | | ||||||||
| | | | | | | | | | | |||
|
| For the Three Months Ended June 30, |
| Amount of | | |||||||
| | | | | | | | | | | |||
(in thousands) |
| 2016 | | 2015 | | Change | | |||||
| | | | | | | | | |||||
SEGMENT FINANCIAL DATA — Midstream |
| | | | | | ||||||
Gathering and compression revenues |
| $ | 6,056 | | $ | 3,798 | | | $ | 2,258 | | |
Water revenues |
| 1,353 | | — | | | 1,353 | | | |||
| | | | | | | | | |||||
Total realized revenues |
| 7,409 | | 3,798 | | | 3,611 | | | |||
Gathering and compression operating expenses |
| 415 | | 461 | | | (46 | ) | | |||
Water system expenses |
| 1,649 | | — | | | 1,649 | | | |||
Allocated general and administrative expenses |
| 301 | | 315 | | | (14 | ) | | |||
| | | | | | | | | |||||
Adjusted EBITDA |
| $ | 5,044 | | $ | 3,022 | | | $ | 2,022 | | |
| | | | | | | | | |||||
OPERATIONAL DATA |
| | | | | | ||||||
Production Data: |
| | | | | | ||||||
Natural gas (MMcf) |
| 15,045 | | 9,999 | | | 5,046 | | | |||
Oil (MBbl) |
| 19 | | 30 | | | (11 | ) | | |||
NGLs (MBbl) |
| 280 | | 233 | | | 47 | | | |||
| | | | | | | | | |||||
Total (MMcfe) |
| 16,839 | | 11,577 | | | 5,262 | | | |||
Midstream Data: |
| | | | | | ||||||
Throughput (MMcf) |
| 11,742 | | 8,087 | | | 3,655 | | | |||
Water volumes (MBbl) |
| 348 | | — | | | 348 | | | |||
Average prices before effects of hedges : |
| | | | | | ||||||
Natural gas (Mcf) |
| $ | 1.30 | | $ | 1.68 | | | $ | (0.38 | ) | |
Oil (Bbl) |
| 40.78 | | 52.79 | | | (12.01 | ) | | |||
NGLs (Bbl) |
| 12.54 | | 11.99 | | | 0.55 | | | |||
Total per Mcfe |
| 1.41 | | 1.83 | | | (0.42 | ) | | |||
Average prices after effects of hedges(1): |
| | | | | | ||||||
Natural gas (Mcf) |
| $ | 2.37 | | $ | 3.87 | | | $ | (1.50 | ) | |
Oil (Bbl) |
| 41.37 | | 189.37 | | | (148.00 | ) | | |||
NGLs (Bbl) |
| 13.43 | | 22.44 | | | (9.01 | ) | | |||
Total per Mcfe |
| 2.38 | | 4.29 | | | (1.91 | ) | | |||
Average cost per Mcfe: |
| | | | | | ||||||
Production and ad valorem taxes |
| $ | 0.08 | | $ | 0.11 | | | $ | (0.03 | ) | |
Marketing and gathering |
| 0.24 | | 0.05 | | | 0.19 | | | |||
Lease operating and workover |
| 0.21 | | 0.38 | | | (0.17 | ) | | |||
General and administrative |
| 0.12 | | 0.18 | | | (0.06 | ) | | |||
Depreciation, depletion, amortization and accretion |
| 0.72 | | 1.15 | | | (0.43 | ) | | |||
- (1)
- The effect of hedges includes realized gains and losses on commodity derivative transactions.
Natural gas sales revenues. Natural gas revenue increased $2.7 million, or 16.1%, to $19.5 million during the three months ended June 30, 2016 from $16.8 million during the three months ended June 30, 2015. The increase is primarily attributable to an increase in production volumes of 50.5%, partially offset by a decrease in realized natural gas prices from $1.68 per Mcf for the three months ended June 30, 2015 to $1.30 per Mcf for the three months ended June 30, 2016, a 22.6% decrease.
Oil sales revenues. Oil revenue decreased $0.8 million, or 52.4%, to $0.8 million during the three months ended June 30, 2016 from $1.6 million during the three months ended June 30, 2015 due to a decrease in production from 30 MBbl to 19 MBbl, a 38.4% decrease compounded by a 12.0% decrease in price from $52.79 per Bbl to $40.78 per Bbl.
88
NGLs sales revenues. NGLs revenue increased $0.7 million, or 25.9%, to $3.5 million during the three months ended June 30, 2016 from $2.8 million during the three months ended June 30, 2015 due to a 20.4% increase in production from 233 MBbl to 280 MBbl as well as a 4.6% increase in realized NGLs prices from $11.99 per Bbl for the three months ended June 30, 2015 to $12.54 per Bbl for the three months ended June 30, 2016.
Midstream revenues. Midstream revenue increased $3.0 million, or 270.3%, to $4.1 million during the three months ended June 30, 2016 from $1.1 million during the three months ended June 30, 2015 primarily due to the higher production from new wells, partially offset by production declines on certain pads.
Gain (loss) on commodity derivatives. Gain on commodity derivatives decreased from a gain of $1.1 million during the three months ended June 30, 2015 to a loss of $39.0 million during the three months ended June 30, 2016. The $39.0 million loss on commodity derivatives during the three months ended June 30, 2016 was comprised of $55.3 million in losses due to the change in fair value of the derivative contracts and $16.3 million of cash received upon contract settlements. The $1.1 million gain during the three months ended June 30, 2015 was comprised of $27.3 million in losses due to the change in fair value of the derivative contracts and $28.4 million of cash received upon contract settlements. The decrease in fair value is primarily attributable to an increase in commodity prices. Commodity derivative fair value gains or losses will vary on future commodity prices and have no cash flow impact until the derivative contracts are settled. We expect continued volatility in the fair value of our derivative instruments.
Production and ad valorem taxes. Production and ad valorem taxes are virtually unchanged from the three months ended June 30, 2015 to the three months ended June 30, 2016 at $1.3 million.
Marketing and gathering. Marketing and gathering expenses for the three months ended June 30, 2016 increased $3.6 million, from $0.5 million for the three months ended June 30, 2015 to $4.1 million for the three months ended June 30, 2016, due to higher production from new wells, partially offset by decline on certain pads.
Midstream operating. Midstream operating expenses were virtually unchanged for the three months ended June 30, 2016 as compared to the three months ended June 30, 2015 at $0.4 million.
Lease operating and workover expenses. Lease operating and workover expenses decreased 20.0% to $3.5 million during the three months ended June 30, 2016, from $4.4 million during the three months ended June 30, 2015. The decrease is primarily due to reduction in salt water disposal costs period over period from the re-use of water in drilling and completion operations as opposed to disposal of the water at commercial facilities in our Appalachian Basin operations. As a result, salt water disposal costs decreased to $0.8 million for the three months ended June 30, 2016 from $1.7 million for the three months ended June 30, 2015, representing a decrease from $0.14 per Mcfe to $0.05 per Mcfe.
General and administrative expense. General and administrative expenses decreased to $1.9 million during the three months ended June 30, 2016 from $2.1 million during the three months ended June 30, 2015 primarily due to increased capitalized general and administrative expenses partially offset by higher labor costs. General and administrative expenses are net of overhead recoveries from third parties and capitalized general and administrative expenses of $1.6 million and $1.1 million for the three months ended June 30, 2016 and 2015, respectively. The increase in overhead recoveries and capitalized general and administrative expense is primarily related to increased acquisition, drilling and completion activities during the three months ended
89
June 30, 2016 compared to the three months ended June 30, 2015. The increase in labor related expenses is due to increased salaries and wages from higher headcount.
Depreciation, depletion, amortization and accretion. Depreciation, depletion, amortization and accretion expenses decreased 8.6% to $12.2 million during the three months ended June 30, 2016 from $13.3 million during the three months ended June 30, 2015. The decrease was primarily due to the decrease in the depletion rate per Mcfe as a result of $437.0 million in impairment charges incurred after the second quarter of 2015. The decrease was partially offset by an increase in production from 11,578 MMcfe during the three months ended June 30, 2015 to 16,839 MMcfe during the three months ended June 30, 2016.
Impairment of proved oil and gas properties. Impairment for the three months ended June 30, 2016 was $63.4 million, compared to zero for the three months ended June 30, 2015. The impairment is primarily the result of decreases in the trailing 12-month average prices for oil, natural gas and NGLs. If pricing conditions stay at current levels or decline further, we will incur full cost ceiling impairments in future quarters, the magnitude of which will be affected by one or more of the other components of the ceiling test calculations, until prices stabilize or improve over a twelve-month period. For a discussion of the asset impairments, see Note 1 to the unaudited condensed consolidated financial statements of Vantage I included elsewhere in this prospectus.
The ceiling limitation calculation is not intended to be indicative of the fair market value of our proved reserves or future results. Impairment charges do not affect cash flow from operating activities, but do adversely affect our net income (loss) and various components of our balance sheet. Any recorded impairment of oil and gas properties is not reversible at a later date.
Interest expense, net of capitalized interest. Interest expense for the three months ended June 30, 2016 was $6.4 million, compared to $5.5 million during the three months ended June 30, 2015. The 15.7% increase is primarily attributable to an increase in outstanding revolving credit facility balances from $226.0 million at June 30, 2015 to $268.9 million at June 30, 2016 and an increase in the average interest rate on the Vantage I revolving credit facility from 2.69% for the three months ended June 30, 2015 to 3.78% for the three months ended June 30, 2016.
Six Months Ended June 30, 2016 Compared to Six Months Ended June 30, 2015
Below are some highlights of Vantage I's financial and operating results for the six months ended June 30, 2016:
- •
- Vantage I's production volumes increased 54.7% to 35,636 MMcfe for the six months ended June 30, 2016 compared to 23,036 MMcfe
for the six months ended June 30, 2015.
- •
- Oil, gas and NGL sales revenues increased 10.3% to $51.1 million for the six months ended June 30, 2016 compared to $46.3 million for the six months ended June 30, 2015.
90
The following table sets forth selected operating data for the six months ended June 30, 2016 compared to the six months ended June 30, 2015:
|
| Vantage I | | | ||||||||
| | | | | | | | | | | |||
|
| For the Six Months Ended June 30, |
| Amount of |
| |||||||
| | | | | | | | | | | |||
(in thousands) |
| 2016 | | 2015 | | Change |
| |||||
| | | | | | | | | |||||
Revenues: |
| | | | | | ||||||
Natural gas sales |
| $ | 43,806 | | $ | 38,946 | | | $ | 4,860 | | |
Oil sales |
| 1,477 | | 1,883 | | | (406 | ) | | |||
NGL sales |
| 5,822 | | 5,495 | | | 327 | | | |||
Midstream revenues |
| 4,966 | | 2,728 | | | 2,238 | | | |||
Gain (loss) on commodity derivatives |
| (21,155 | ) | 15,921 | | | (37,076 | ) | | |||
| | | | | | | | | |||||
Total revenues |
| 34,916 | | 64,973 | | | (30,057 | ) | | |||
Operating expenses: |
| | | | | | ||||||
Production and ad valorem taxes |
| 2,928 | | 2,115 | | | 813 | | | |||
Marketing and gathering |
| 6,333 | | 1,266 | | | 5,067 | | | |||
Lease operating and workover |
| 7,581 | | 9,280 | | | (1,699 | ) | | |||
Midstream operating |
| 1,427 | | 831 | | | 596 | | | |||
General and administrative |
| 3,222 | | 3,888 | | | (666 | ) | | |||
Depreciation, depletion, amortization and accretion |
| 26,476 | | 28,459 | | | (1,983 | ) | | |||
Impairment of proved oil and gas properties |
| 155,994 | | — | | | 155,994 | | | |||
| | | | | | | | | |||||
Total operating expenses |
| 203,961 | | 45,839 | | | 158,122 | | | |||
Operating (loss) income |
| (169,045 | ) | 19,134 | | | (188,179 | ) | | |||
Other expenses: |
| | | | | | ||||||
Other income (expense) |
| (152 | ) | (2 | ) | | (150 | ) | | |||
Interest expense, net of capitalized income |
| (12,371 | ) | (10,569 | ) | | (1,802 | ) | | |||
| | | | | | | | | |||||
Total other expenses |
| (12,523 | ) | (10,571 | ) | | (1,952 | ) | | |||
| | | | | | | | | |||||
Net income (loss) |
| $ | (181,568 | ) | $ | 8,563 | | | $ | (190,131 | ) | |
| | | | | | | | | |||||
| | | | | | | | | | | |||
| | | | | | | | | |||||
Revenues (in thousands): |
| | | | | | ||||||
Natural Gas |
| $ | 43,806 | | $ | 38,946 | | | $ | 4,860 | | |
Oil sales |
| 1,477 | | 1,883 | | | (406 | ) | | |||
NGL Sales |
| 5,822 | | 5,495 | | | 327 | | | |||
| | | | | | | | | |||||
Total sales |
| $ | 51,105 | | $ | 46,324 | | | $ | 4,781 | | |
SEGMENT FINANCIAL DATA — E&P |
| | | | | | ||||||
Natural gas, NGL and oil sales |
| $ | 51,105 | | $ | 46,324 | | | $ | 4,781 | | |
Gain (loss) on commodity derivatives |
| (21,155 | ) | 15,921 | | | (37,076 | ) | | |||
| | | | | | | | | |||||
Total realized revenues |
| 29,950 | | 62,245 | | | (32,295 | ) | | |||
Operating expenses |
| 24,581 | | 17,582 | | | 6,999 | | | |||
Gathering and compression expenses |
| — | | (45 | ) | | 45 | | | |||
Allocated general and administrative expenses |
| 2,591 | | 3,290 | | | (699 | ) | | |||
Other income (expense) |
| (152 | ) | (2 | ) | | (150 | ) | | |||
Total (gain) losses on derivative, net, less net cash from settlement of commodity derivatives |
| 56,592 | | 24,973 | | | $ | 31,619 | | | ||
| | | | | | | | | |||||
Adjusted EBITDA |
| $ | 59,218 | | $ | 66,389 | | | $ | (7,171 | ) | |
Other |
| | | | | | ||||||
Total assets |
| $ | 389,432 | | $ | 826,383 | | | $ | (436,951 | ) | |
Capital expenditures |
| $ | 53,517 | | $ | 106,158 | | | $ | (52,641 | ) | |
91
|
| Vantage I | | | ||||||||
| | | | | | | | | | | |||
|
| For the Six Months Ended June 30, |
| Amount of | | |||||||
| | | | | | | | | | | |||
(in thousands) |
| 2016 | | 2015 | | Change | | |||||
| | | | | | | | | |||||
SEGMENT FINANCIAL DATA — Midstream |
| | | | | | ||||||
Gathering and compression revenues |
| $ | 12,768 | | $ | 7,649 | | | $ | 5,119 | | |
Water revenues |
| 3,945 | | — | | | 3,945 | | | |||
| | | | | | | | | |||||
Total realized revenues |
| 16,713 | | 7,649 | | | 9,064 | | | |||
Gathering and compression operating expenses |
| 1,427 | | 876 | | | 551 | | | |||
Water system expenses |
| 3,457 | | — | | | 3,457 | | | |||
Allocated general and administrative expenses |
| 631 | | 598 | | | 33 | | | |||
| | | | | | | | | |||||
Adjusted EBITDA |
| $ | 11,198 | | $ | 6,175 | | | $ | 5,023 | | |
| | | | | | | | | |||||
Other |
| | | | | | ||||||
Total assets |
| $ | 64,412 | | $ | 56,729 | | | $ | 7,683 | | |
Capital expenditures |
| $ | 4,252 | | $ | 7,994 | | | $ | (3,742 | ) | |
OPERATIONAL DATA |
| | | | | | ||||||
Production Data: |
| | | | | | ||||||
Natural gas (MMcf) |
| 32,228 | | 19,940 | | | 12,288 | | | |||
Oil (MBbl) |
| 43 | | 44 | | | (1 | ) | | |||
NGLs (MBbl) |
| 525 | | 472 | | | 53 | | | |||
| | | | | | | | | |||||
Total (MMcfe) |
| 35,636 | | 23,036 | | | 12,600 | | | |||
Midstream Data: |
| | | | | | ||||||
Throughput (MMcf) |
| 24,164 | | 15,709 | | | 8,455 | | | |||
Water volumes (MBbl) |
| 1,097 | | — | | | 1,097 | | | |||
Average prices before effects of hedges : |
| | | | | | ||||||
Natural gas (Mcf) |
| $ | 1.36 | | $ | 1.95 | | | $ | (0.59 | ) | |
Oil (Bbl) |
| 34.09 | | 42.54 | | | (8.45 | ) | | |||
NGLs (Bbl) |
| 11.09 | | 11.63 | | | (0.54 | ) | | |||
Total per Mcfe |
| 1.43 | | 2.01 | | | (0.58 | ) | | |||
Average prices after effects of hedges(1): |
| | | | | | ||||||
Natural gas (Mcf) |
| $ | 2.43 | | $ | 3.56 | | | $ | (1.13 | ) | |
Oil (Bbl) |
| 35.93 | | 156.27 | | | (120.34 | ) | | |||
NGLs (Bbl) |
| 12.65 | | 19.91 | | | (7.26 | ) | | |||
Total per Mcfe |
| 2.43 | | 3.79 | | | (1.36 | ) | | |||
Average cost per Mcfe: |
| | | | | | ||||||
Production and ad valorem taxes |
| $ | 0.08 | | $ | 0.09 | | | $ | (0.01 | ) | |
Marketing and gathering |
| 0.18 | | 0.05 | | | 0.13 | | | |||
Lease operating and workover |
| 0.21 | | 0.40 | | | (0.19 | ) | | |||
General and administrative |
| 0.09 | | 0.17 | | | (0.08 | ) | | |||
Depreciation, depletion, amortization and accretion |
| 0.74 | | 1.24 | | | (0.50 | ) | | |||
- (1)
- The effect of hedges includes realized gains and losses on commodity derivative transactions.
Natural gas sales revenues. Natural gas revenue increased $4.9 million, or 12.5%, to $43.8 million during the six months ended June 30, 2016 from $38.9 million during the six months ended June 30, 2015. The increase is primarily attributable to an increase in production volumes of 61.6%, partially offset by a decrease in realized natural gas prices from $1.95 per Mcf for the six months ended June 30, 2015 to $1.36 per Mcf for the six months ended June 30, 2016, a 30.3% decrease.
Oil sales revenues. Oil revenue decreased $0.4 million, or 21.6%, to $1.5 million during the six months ended June 30, 2016 from $1.9 million during the six months ended June 30, 2015 due
92
to a decrease in production from 44 MBbl to 43 MBbl compounded by a 19.9% decrease in price from $42.54 per Bbl to $34.09 per Bbl.
NGLs sales revenues. NGLs revenue increased $0.3 million, or 6.0%, to $5.8 million during the six months ended June 30, 2016 compared to $5.5 million in the six months ended June 30, 2015 due to an 11.1% increase in production offset by a 4.6% decrease in realized NGLs prices.
Midstream revenues. Midstream revenue increased $2.2 million, or 82.0%, to $5.0 million during the six months ended June 30, 2016 from $2.7 million during the six months ended June 30, 2015 primarily due to the higher production from new wells, partially offset by production declines on certain pads.
Gain (loss) on commodity derivatives. Gain (loss) on commodity derivatives decreased from a gain of $15.9 million during the six months ended June 30, 2015 to a loss of $21.2 million during the six months ended June 30, 2016. The $21.2 million loss on commodity derivatives during the six months ended June 30, 2016 was comprised of $56.6 million in losses due to the change in fair value of the derivative contracts and $35.4 million of cash received upon contract settlements. The $15.9 million gain during the six months ended June 30, 2015 was comprised of $25.0 million in losses due to the change in fair value of the derivative contracts and $40.9 million of cash received upon contract settlements. The decrease in unrealized fair value is primarily attributable to an increase in commodity prices. Commodity derivative fair value gains or losses will vary on future commodity prices and have no cash flow impact until the derivative contracts are settled. We expect continued volatility in the fair value of our derivative instruments.
Production and ad valorem taxes. Production and ad valorem taxes increased $0.8 million to $2.9 million during the six months ended June 30, 2016 from $2.1 million during the six months ended June 30, 2015. The increase is primarily due to an increase in net wells added from drilling in 2015.
Marketing and gathering. Marketing and gathering expenses for the six months ended June 30, 2016 were $6.3 million, compared to $1.3 million for the six months ended June 30, 2015, due to higher production from new wells, partially offset by production declines on certain pads.
Midstream operating. Midstream operating expenses for the six months ended June 30, 2016 were $1.4 million, compared to $0.8 million for the six months ended June 30, 2015. The increase is due to additional compression and other operating costs related to increased system throughput.
Lease operating and workover expenses. Lease operating and workover expenses decreased to $7.6 million during the six months ended June 30, 2016, from $9.3 million during the six months ended June 30, 2015. The decrease is primarily due to reduced salt water disposal costs arising from the re-use of water in drilling and completion operations as opposed to disposal of the water at commercial facilities in our Appalachian Basin operations. As a result, salt water disposal costs decreased to $2.4 million for the six months ended June 30, 2016 from $3.9 million for the six months ended June 30, 2015, representing a decrease from $0.17 per Mcfe to $0.07 per Mcfe.
General and administrative expense. General and administrative expenses decreased to $3.2 million during the six months ended June 30, 2016 from $3.9 million during the six months ended June 30, 2015 as a result of increased capitalized general and administrative expenses. General and administrative expenses are net of overhead recoveries from third parties and capitalized general and administrative expenses of $3.5 million and $2.9 million for the six months ended June 30, 2016 and 2015, respectively. The increase in overhead recoveries and capitalized general and administrative expense is primarily related to increased acquisition, drilling and completion activities during the six months ended June 30, 2016 compared to the six months ended June 30, 2015.
93
Depreciation, depletion, amortization and accretion. Depreciation, depletion, amortization and accretion expenses decreased to $26.5 million during the six months ended June 30, 2016 from $28.5 million during the six months ended June 30, 2015. The decrease was primarily due to the decrease in the depletion rate per Mcfe as a result of $437.0 million in impairment charges incurred after the second quarter of 2015.
Impairment of proved oil and gas properties. Impairment for the six months ended June 30, 2016 was $156.0 million, compared to zero for the six months ended June 30, 2015. The impairment is primarily the result of decreases in the trailing 12-month average prices for oil, natural gas and NGLs. If pricing conditions decline further, we will incur full cost ceiling impairments in future quarters, the magnitude of which will be affected by one or more of the other components of the ceiling test calculations, until prices stabilize or improve over a twelve-month period. For a discussion of the asset impairments, see Note 1 to the unaudited condensed consolidated financial statements of Vantage I included elsewhere in this prospectus.
Interest expense, net of capitalized interest. Interest expense for the six months ended June 30, 2016 was $12.4 million, compared to $10.6 million during the six months ended June 30, 2015. The 17% increase is primarily attributable to an increase in the average outstanding interest rate on the Vantage I revolving credit facility from 2.69% for the six months ended June 30, 2015 to 3.47% for the six months ended June 30, 2016.
Year Ended December 31, 2015 Compared to Year Ended December 31, 2014
Below are some highlights of Vantage I's financial and operating results for the year ended December 31, 2015:
- •
- Vantage I's production volumes increased 64.1% to 46,395 MMcfe in the year ended December 31, 2015 compared to 28,270 MMcfe in
the year ended December 31, 2014.
- •
- Vantage I's sales decreased 15.4% to $84.6 million in the year ended December 31, 2015 compared to $100.0 million
in the year ended December 31, 2014.
- •
- Vantage I's per unit lease operating and workover expenses decreased 29.1% to $0.39 per Mcfe in the year ended December 31, 2015 compared to $0.55 per Mcfe in the year ended December 31, 2014.
94
The following table sets forth selected operating data for the year ended December 31, 2015 compared to the year ended December 31, 2014:
|
| Vantage I | | | ||||||||
| | | | | | | | | | | |||
|
| For the Year Ended December 31, |
| Amount of |
| |||||||
| | | | | | | | | | | |||
(in thousands) |
| 2015 | | 2014 | | Change |
| |||||
| | | | | | | | | |||||
Revenues: |
| | | | | | ||||||
Natural gas sales |
| $ | 73,209 | | $ | 76,693 | | | $ | (3,484 | ) | |
Oil sales |
| 3,053 | | 9,438 | | | (6,385 | ) | | |||
NGL Sales |
| 8,313 | | 13,833 | | | (5,520 | ) | | |||
Midstream revenues |
| 5,679 | | 1,995 | | | 3,684 | | | |||
Gain (loss) on commodity derivatives |
| 69,569 | | 66,615 | | | 2,954 | | | |||
| | | | | | | | | |||||
Total revenues |
| 159,823 | | 168,574 | | | (8,751 | ) | | |||
Operating expenses: |
| | | | | | ||||||
Production and ad valorem taxes |
| 4,843 | | 6,718 | | | (1,875 | ) | | |||
Marketing and gathering |
| 5,352 | | 7,262 | | | (1,910 | ) | | |||
Lease operating and workover |
| 18,092 | | 15,636 | | | 2,456 | | | |||
Midstream operating |
| 1,834 | | 892 | | | 942 | | | |||
General and administrative |
| 6,019 | | 8,838 | | | (2,819 | ) | | |||
Depreciation, depletion, amortization and accretion |
| 50,162 | | 37,908 | | | 12,254 | | | |||
Impairment of proved oil and gas properties |
| 344,401 | | — | | | 344,401 | | | |||
| | | | | | | | | |||||
Total operating expenses |
| 430,703 | | 77,254 | | | 353,449 | | | |||
| | | | | | | | | |||||
Operating (loss) income |
| (270,880 | ) | 91,320 | | | (362,200 | ) | | |||
| | | | | | | | | |||||
Other expenses: |
| | | | | | ||||||
Other income (expense) |
| — | | — | | | — | | | |||
Interest expense, net of capitalized income |
| (22,058 | ) | (17,575 | ) | | (4,483 | ) | | |||
| | | | | | | | | |||||
Total other expenses |
| (22,058 | ) | (17,575 | ) | | (4,483 | ) | | |||
| | | | | | | | | |||||
Income tax expense (benefit) |
| — | | — | | | — | | | |||
| | | | | | | | | |||||
Net income (loss) |
| $ | (292,938 | ) | $ | 73,745 | | | $ | (366,683 | ) | |
| | | | | | | | | |||||
| | | | | | | | | | | |||
| | | | | | | | | |||||
Revenues (in thousands): |
| | | | | | ||||||
Natural Gas |
| $ | 73,209 | | $ | 76,693 | | | $ | (3,484 | ) | |
Oil sales |
| 3,053 | | 9,438 | | | (6,385 | ) | | |||
NGL Sales |
| 8,313 | | 13,833 | | | (5,520 | ) | | |||
| | | | | | | | | |||||
Total sales |
| $ | 84,575 | | $ | 99,964 | | | $ | (15,389 | ) | |
SEGMENT FINANCIAL DATA — E&P |
| | | | | | ||||||
Natural gas, NGL and oil sales |
| $ | 84,575 | | $ | 99,964 | | | $ | (15,389 | ) | |
Gain (loss) on commodity derivatives |
| 69,569 | | 66,615 | | | 2,954 | | | |||
| | | | | | | | | |||||
Total realized revenues |
| 154,144 | | $ | 166,579 | | | (12,435 | ) | | ||
Operating expenses |
| 38,364 | | 34,571 | | | 3,793 | | | |||
Allocated general and administrative expenses |
| 4,851 | | 7,961 | | | (3,110 | ) | | |||
Total (gains) losses on derivative, net, less net cash from settlement of commodity derivatives |
| 13,862 | | (66,819 | ) | | 80,681 | | | |||
| | | | | | | | | |||||
Adjusted EBITDA |
| $ | 124,791 | | $ | 57,228 | | | $ | 67,563 | | |
Other |
| | | | | | ||||||
Total assets |
| $ | 562,376 | | $ | 800,171 | | | $ | (237,795 | ) | |
Capital expenditures |
| $ | 191,136 | | $ | 259,431 | | | $ | (68,295 | ) | |
95
|
| Vantage I | | | ||||||||
| | | | | | | | | | | |||
|
| For the Year Ended December 31, |
| Amount of | | |||||||
| | | | | | | | | | | |||
(in thousands) |
| 2015 | | 2014 | | Change | | |||||
| | | | | | | | | |||||
SEGMENT FINANCIAL DATA — Midstream |
| | | | | | ||||||
Gathering and compression revenues |
| $ | 15,756 | | $ | 7,086 | | | $ | 8,670 | | |
Water revenues |
| 5,487 | | — | | | 5,487 | | | |||
| | | | | | | | | |||||
Total realized revenues |
| 21,243 | | 7,086 | | | 14,157 | | | |||
Gathering and compression operating expenses |
| 1,834 | | 892 | | | 942 | | | |||
Water system expenses |
| 4,185 | | — | | | 4,185 | | | |||
Allocated general and administrative expenses |
| 1,168 | | 877 | | | 291 | | | |||
| | | | | | | | | |||||
Adjusted EBITDA |
| $ | 14,056 | | $ | 5,317 | | | $ | 8,739 | | |
Other |
| | | | | | ||||||
Total assets |
| $ | 61,523 | | $ | 53,495 | | | $ | 8,028 | | |
Capital expenditures |
| $ | 14,379 | | $ | 33,969 | | | $ | (19,590 | ) | |
OPERATIONAL DATA |
| | | | | | ||||||
Production Data: |
| | | | | | ||||||
Natural gas (MMcf) |
| 41,175 | | 24,242 | | | 16,933 | | | |||
Oil (MBbl) |
| 74 | | 108 | | | (34 | ) | | |||
NGLs (MBbl) |
| 796 | | 563 | | | 233 | | | |||
| | | | | | | | | |||||
Total (MMcfe) |
| 46,395 | | 28,270 | | | 18,125 | | | |||
Midstream Data: |
| | | | | | ||||||
Gas gathering throughput (MMcf) |
| 32,179 | | 13,887 | | | 18,292 | | | |||
Water volumes (MBbl) |
| 1,812 | | — | | | 1,812 | | | |||
Average prices before effects of hedges: |
| | | | | | ||||||
Natural gas (Mcf) |
| $ | 1.78 | | $ | 3.16 | | | $ | (1.38 | ) | |
Oil (Bbl) |
| 41.00 | | 87.35 | | | (46.35 | ) | | |||
NGLs (Bbl) |
| 10.45 | | 24.56 | | | (14.11 | ) | | |||
Total per Mcfe |
| 1.82 | | 3.54 | | | (1.72 | ) | | |||
Average prices after effects of hedges(1): |
| | | | | | ||||||
Natural gas (Mcf) |
| $ | 3.43 | | $ | 3.19 | | | $ | 0.24 | | |
Oil (Bbl) |
| 130.06 | | 83.34 | | | 46.72 | | | |||
NGLs (Bbl) |
| 21.43 | | 23.85 | | | (2.15 | ) | | |||
Total per Mcfe |
| 3.62 | | 3.53 | | | 0.09 | | | |||
Average cost per Mcfe: |
| | | | | | ||||||
Production and ad valorem taxes |
| $ | 0.10 | | $ | 0.24 | | | $ | (0.14 | ) | |
Marketing and gathering |
| 0.12 | | 0.26 | | | (0.14 | ) | | |||
Lease operating and workover |
| 0.39 | | 0.55 | | | (0.16 | ) | | |||
General and administrative |
| 0.13 | | 0.31 | | | (0.18 | ) | | |||
Depreciation, depletion, amortization and accretion |
| 1.08 | | 1.34 | | | (0.26 | ) | | |||
- (1)
- The effect of hedges includes realized gains and losses on commodity derivative transactions.
Natural gas sales revenues. Natural gas revenue was $73.2 million for the year ended December 31, 2015, as compared to $76.7 million for the year ended December 31, 2014. This decrease is primarily attributable to realized natural gas prices falling from $3.16 per Mcf for the year ended December 31, 2014 to $1.78 per Mcf for the year ended December 31, 2015 and partially offset by a 16,933 MMcf increase in production volumes.
Oil sales revenues. Oil revenue decreased $6.3 million, or 67.7%, to $3.1 million during the year ended December 31, 2015 from $9.4 million during the year ended December 31, 2014 primarily due to a decrease in realized oil prices from $87.35 for the year ended December 31, 2014 to $41.00 for the year ended December 31, 2015.
96
NGLs sales revenues. NGLs revenue decreased $5.5 million, or 39.9%, to $8.3 million during the year ended December 31, 2015 from $13.8 million during the year ended December 31, 2014 primarily due to a decrease in realized NGLs prices from $24.56 for the year ended December 31, 2014 to $10.45 for the year ended December 31, 2015, partially offset by a 41.4% increase in production.
Midstream revenues. Midstream revenue was $5.7 million for the year ended December 31, 2015, compared to $2.0 million for the year ended December 31, 2014. Gathering revenues increased over the prior year primarily due to a rise in producing wells on several pads.
Gain on commodity derivatives. The $69.6 million gain on derivative contracts in 2015 resulted from $83.4 million in gains from commodity contract settlements and $13.8 million in losses due to the change in the fair value of commodity derivatives. In 2014, the $66.6 million gain was comprised of $66.8 million in gains due to changes in the fair value of commodity derivatives and $0.2 million in losses from settlements paid on contracts. Commodity derivative fair value gains or losses will vary based on future commodity prices and have no cash flow impact until the derivative contracts are settled. We expect continued volatility in the fair value of our derivative instruments.
Production and ad valorem taxes. Production and ad valorem taxes decreased $1.9 million over the prior year primarily due reductions in Texas severance tax rates reflecting declines in older wells and refunds of severance taxes on high cost gas wells.
Marketing and gathering. Marketing and gathering expenses decreased $1.9 million over the prior year primarily due to a $1.5 million decrease in minimum volume commitment fees related to Vantage I's Barnett Shale operations.
Lease operating and workover expenses. Lease operating and workover expenses increased to $18.1 million for the year ended December 31, 2015 from $15.6 million for the year ended December 31, 2014. The increase is primarily due to higher compressor rental charges and salt water disposal costs in 2015, compared to 2014 and an increase in producing wells in 2015.
Midstream operating expense. Midstream operating expenses for the year ended December 31, 2015 were $1.8 million, compared to $0.9 million for the year ended December 31, 2014. The increase is primarily due to a rise in our overall growth in production and operated wells.
General and administrative expense. General and administrative expenses decreased $2.8 million to $6.0 million in 2015 from $8.8 million in 2014. General and administrative expense are net of operating and capital recoveries of $7.2 million and $5.4 million, respectively. The decrease is primarily due to $1.6 million less in legal and accounting fees and $1.8 million more of operating and capital recoveries, partially offset by a $0.6 million increase in compensation expense.
Depreciation, depletion, amortization and accretion. Depreciation, depletion, and amortization expenses increased to $50.2 million for the year ended December 31, 2015 from $37.9 million for the year ended December 31, 2014. The increase is primarily the result of increased production of 46,395 MMcfe in 2015, compared to 28,270 MMcfe in 2014.
Impairment of proved oil and gas properties. The impairment expense of $344.4 million for the year ended December 31, 2015 is the result of a write-down of the net capitalized costs of our oil and gas properties in excess the full cost ceiling. For a discussion on asset impairments, see Note 1 to the audited consolidated financial statements of Vantage I included elsewhere in this prospectus.
97
Interest expense, net of capitalized interest. The increase of $4.5 million is primarily attributable to an increase of our revolving credit line to $271.0 million as of December 31, 2015 from $192.0 million as of December 31, 2014 as well as an increase in the average interest rate to 2.77% for the year ended December 31, 2015 from 2.28% for the year ended December 31, 2014.
Pro Forma Capital Resources and Liquidity
Our primary sources of liquidity have been equity contributions from our Existing Owners, cash generated by our operations, borrowings under our revolving credit facilities and proceeds from our second lien term loans. Our primary use of capital has been the acquisition and development of natural gas, NGLs and oil properties. As we pursue reserve and production growth, we monitor which capital resources, including equity and debt financings, are available to us to meet our future financial obligations, planned capital expenditure activities and liquidity requirements. We also expect to fund a portion of these requirements with cash flow from operations as we continue to bring additional production online.
We are currently running two rigs in the Marcellus Shale with the intention of adding a third rig in the Marcellus Shale by year end, and retain the flexibility to adjust our rig count based on the commodity price environment and other factors.
Our future success in growing proved reserves and production will be highly dependent on the capital resources available to us. For the months ended , we plan to invest up to $ million for drilling and completion, $ million for leasehold acquisitions, and $ million for midstream infrastructure development. This represents a % decrease over our $354 million 2015 combined capital expenditures. We have not allocated any capital spending to properties other than our primary Marcellus and Barnett Shale operations. As of June 30, 2016, we had incurred approximately $485 million out of our aggregate $ million 2016 capital expenditure budget.
After giving effect to this offering, we expect to fund our capital expenditures through the months ended December 31, 2017 with cash generated by operations, cash on hand and available capacity under our new revolving credit facility. Specifically, on a pro forma basis for our corporate reorganization and this offering as of June 30, 2016, we would have had approximately $ of cash on hand and availability under our new revolving credit facility of $ million. Similarly, following the completion of this offering, we estimate that we will have cash on hand of $ million and availability under our new revolving credit facility of approximately $ million. Our cash flow from operations has historically contributed less than external financing to funding our capital requirements, specifically with respect to our capital expenditure budget. We believe that the lag time between initial investment and cash flow from such investment is typical of the oil and gas industry. Our capital budget may be further adjusted as business conditions warrant. The amount, timing and allocation of capital expenditures is largely discretionary and within our control. Recently, commodity prices have declined significantly and have remained depressed thus far in 2016. If natural gas prices remain depressed or decline to levels below our acceptable levels, or costs increase to levels above our acceptable levels, we could choose to defer a significant portion of our budgeted capital expenditures until later periods to achieve the desired balance between sources and uses of liquidity and prioritize capital projects that we believe will have the highest expected rates of return and potential to generate near-term cash flow. We routinely monitor and adjust our capital expenditures in response to changes in commodity prices, availability of financing, drilling and acquisition costs, industry conditions, the timing of regulatory approvals, the availability of rigs, success or lack of success in drilling activities, contractual obligations, internally generated cash flow and other factors both within and outside our control. Any reduction in our capital expenditure budget could have the effect of delaying or limiting our development program, which would negatively impact our ability to grow production and could
98
materially and adversely affect our future business, financial condition, results of operations or liquidity.
Following the completion of this offering, we expect that our overall borrowing costs will be lower, with the retirement of the Vantage I second lien term loan, which bears interest at rates greater than what we expect to pay under our new revolving credit facility. Specifically, the Vantage I second lien term loan bears interest at a rate of LIBOR plus 7.5%, while our new revolving credit facility will bear interest at a rate of LIBOR plus % to %, depending on borrowing base utilization. To the extent we are required to rely on borrowings under our new revolving credit facility to a greater degree to fund our capital expenditures, we may have less availability and flexibility to provide for working capital and other operational expenses. However, even though we believe lower borrowing costs will give us greater flexibility in funding our capital expenditures going forward, we do not expect to rely on borrowings to fund such expenditures in a meaningfully more significant way following this offering than we have historically.
After giving effect to this offering, we believe that operating cash flows and available capacity under our new revolving credit facility should be sufficient to fully fund our capital expenditure budget for the months ended December 31, 2017 and meet our cash requirements, including normal operating needs, debt service obligations and commitments and contingencies. However, to the extent that we consider market conditions favorable, we may access the capital markets to raise capital from time to time to fund acquisitions, pay down our new revolving credit facility and for general working capital purposes.
Please see "— Debt Agreements" for additional details on our outstanding borrowings and available liquidity under our various financing arrangements.
Predecessor Cash Flow Provided by Operating Activities
Net cash provided by operating activities was $72.2 million for the six months ended June 30, 2016, compared to $39.8 million of net cash provided by operating activities for the six months ended June 30, 2015. The change in operating cash flow was primarily the result of an increase in gas and midstream revenues of $6.8 million, a $15.7 million increase in commodity derivative settlements and a $9.7 million increase in cash due to the changes in operating assets and liabilities over the same period.
Net cash provided by operating activities was $81.6 million for the year ended December 31, 2015, compared to $21.1 million of net cash provided by operating activities for the year ended December 31, 2014. The change in operating cash flow was primarily the result of an increase of gas and gas gathering revenues of $22.7 million, driven by increased production from 14,683 MMcfe to 41,216 MMcfe from the year ended 2014 to the year ended 2015 as well as a $25.7 million increase in commodity derivative settlements and a $26.8 million increase in cash due to the changes in operating assets and liabilities over the same period.
Predecessor Cash Flow Used In Investing Activities
During the six months ended June 30, 2016 and 2015, cash flows used in investing activities were $427.7 million and $78.8 million, respectively. The increase is primarily related to the purchase of assets from a wholly owned subsidiary of Alpha Natural Resources, which closed on June 2, 2016, for $342.6 million. In addition, oil and gas property acquisition and development spending increased by $11.9 million, while gathering system expenditures decreased by $6.0 million.
During the years ended December 31, 2015 and 2014, cash flows used in investing activities were $148.9 million and $212.6 million, respectively. The decrease is primarily related to a
99
$42.5 million decrease in capital expenditures in oil and gas properties, as well as a $21.3 million reduction in gathering system capital spending.
Predecessor Cash Flow Provided By Financing Activities
Net cash provided by financing activities of $368.2 million during the six months ended June 30, 2016 was primarily attributable to Member contributions of $371.0 million which was partially offset by net repayments under our revolving credit facility of $2.0 million. Net cash provided by financing activities of $26.6 million during the six months ended June 30, 2015 was primarily the result of net borrowings under our revolving credit facility of $27.0 million.
Net cash provided by financing activities of $48.5 million during the year ended December 31, 2015 was primarily attributable to borrowing under our revolving credit facility. Net cash provided by financing activities of $206.9 million during the year ended December 31, 2014 was the result of net borrowings under our revolving credit facility of $100 million, borrowings under the our second lien note of $98 million and Member contributions of $10 million.
Vantage I Cash Flow Provided by Operating Activities
Net cash provided by operating activities was $40.8 million for the six months ended June 30, 2016, compared to $64.4 million for the six months ended June 30, 2015. The decrease was primarily the result of an increase in natural gas, oil, NGL and midstream revenues of $7.0 million, offset by a $5.5 million decrease in commodity derivative settlements, $4.1 million higher operating expenses, and a $19.0 million decrease in cash due to the changes in operating assets and liabilities over the same period.
Net cash provided by operating activities was $110.8 million for the year ended December 31, 2015, compared to $45.6 million for the year ended December 31, 2014. This increase was due to a rise in commodity derivative settlements of $83.5 million, partially offset by decreases in net income (loss) adjusted for non-cash items of $13.0 million.
Vantage I Cash Flow Used In Investing Activities
During the six months ended June 30, 2016 and 2015, cash flows used in investing activities were $57.1 million and $114.2 million, respectively. This decrease is primarily related to a $53.4 million decrease in capital expenditures for oil and gas properties and a $4.1 million decrease in gathering system additions.
During the years ended December 31, 2015 and 2014, cash flows used in investing activities were $204.7 million and $295.0 million, respectively. This decrease is primarily related to a $69.6 million decrease in capital expenditures for oil and gas properties, as well as a $21.1 million reduction in capital expenditures for Vantage I's midstream infrastructure.
Vantage I Cash Flow Provided By Financing Activities
Net cash provided by financing activities was $16.9 million during the six months ended June 30, 2016 compared to $31.6 million during the six months ended June 30, 2015. This decrease is primarily attributable to a $35.0 million change in net borrowings or repayments of debt, partially offset by an increase in Members' contributions of $20.0 million.
Net cash provided by financing activities was $75.6 million during the year ended December 31, 2015 compared to $189.7 million during the year ended December 31, 2014. This decrease is primarily the result of a $113 million reduction in the net borrowings under the Vantage I revolving credit facility during these periods.
100
Debt Agreements
New Revolving Credit Facility
In connection with the closing of this offering, we expect to enter into a new revolving credit facility with a syndicate of lenders with a maximum credit amount of $ and a sublimit for letters of credit of the lesser of $ or the borrowing base. The amount available to be borrowed under the new revolving credit facility will be subject to a borrowing base that will be redetermined semiannually and will depend on the volumes of our proved oil and gas reserves and estimated cash flows from these reserves and commodity derivative positions. We expect the borrowing base to initially be approximately $ million. In addition, the borrowing base will be reduced by % of the principal amount of any senior notes we issue in the future in excess of an aggregate of $ million.
The new revolving credit facility will be secured by liens on substantially all of our properties and guarantees from our subsidiaries other than any subsidiary that it has designated as an unrestricted subsidiary. The new revolving credit facility will contain restrictive covenants that may limit our ability to, among other things:
- •
- incur additional indebtedness;
- •
- sell assets;
- •
- make investments;
- •
- make or declare dividends;
- •
- hedge future production or interest rates;
- •
- incur liens; and
- •
- engage in certain other transactions without the prior consent of the lenders.
The effectiveness of the new revolving credit facility will be conditioned on our receiving gross proceeds of at least $ million in this offering and our repayment and retirement of the Vantage I revolving credit facility, the Vantage I second lien term loan and the Vantage II revolving credit facility, which we intend to do with the net proceeds of this offering together with cash on hand and borrowings under the new revolving credit facility.
Vantage II Second Lien Term Loan
On May 8, 2014, Vantage II entered into a second lien term loan credit facility with affiliates of GSO Capital Partners LP in an aggregate principal amount of $100 million. Vantage II has a choice of borrowing in Eurodollars or at the base rate. Eurodollar loans bear interest at a rate per annum equal to LIBOR plus 7.5% (subject to a minimum LIBOR rate of 1.0%). Base rate loans bear interest at a rate per annum equal to the greatest of (i) the agent bank's reference rate, (ii) the federal funds effective rate plus 50 basis points and (iii) the rate for one month Eurodollar loans plus 100 basis points, plus a margin of 6.5%. The facility matures May 8, 2017. As of June 30, 2016, the effective interest rate was 8.5% and $100 million remained outstanding under the term loan facility. The term loan facility contains an optional prepayment provision that allows Vantage II to prepay the amount outstanding under the term loan facility at par.
As of June 30, 2016, the term loan facility was collateralized by a second lien interest in all of Vantage II's assets and contains certain financial covenants. These covenants include maintenance of a maximum leverage ratio of 4.0 to 1.0 (calculated on a quarterly basis). As of June 30, 2016, Vantage II was in compliance with these financial covenants.
101
We intend that the Vantage II second lien term loan will remain outstanding following the completion of this offering.
Vantage II Revolving Credit Facility
On November 29, 2012, Vantage II entered into a revolving credit facility with Wells Fargo Bank, N.A., as administrative agent and lender, with a maximum credit amount of $500 million and a sublimit for letters of credit of the lesser of $50 million or the borrowing base. As of May 10, 2016, the sublimit for the letters of credit was $25 million. Effective December 4, 2014, Vantage II amended its revolving credit facility to add a lien on its gas gathering system and add a midstream borrowing base. The amount available to be borrowed under the revolving credit facility is subject to a borrowing base that is redetermined semiannually each May and November and depends on the volumes of Vantage II's proved oil and gas reserves and estimated cash flows from these reserves, commodity derivative positions and the earnings from midstream assets. The next redetermination is scheduled to occur in November 2016. As of June 30, 2016, the revolving credit facility had a borrowing base of $186.0 million. As of June 30, 2016, Vantage II had $147.0 million of outstanding borrowings and no letters of credit outstanding under its revolving credit facility. The revolving credit facility matures on January 1, 2017.
Eurodollar loans bear interest at a rate per annum equal to LIBOR plus an applicable margin ranging from 250 to 350 basis points, depending on the percentage of the borrowing base utilized. Base rate loans bear interest at a rate per annum equal to the greatest of (i) the agent bank's reference rate, (ii) the federal funds effective rate plus 50 basis points and (iii) the rate for one month Eurodollar loans plus 100 basis points, plus an applicable margin ranging from 150 to 250 basis points, depending on the percentage of the borrowing base utilized. Vantage II may repay any amounts borrowed prior to the maturity date without any premium or penalty other than customary LIBOR breakage costs.
The credit facility is secured by liens on substantially all of Vantage II's properties and guarantees from its subsidiaries other than any subsidiary that it has designated as an unrestricted subsidiary. The credit facility contains restrictive covenants that may limit Vantage II's ability to, among other things:
- •
- incur additional indebtedness;
- •
- sell assets;
- •
- make loans to others;
- •
- make investments;
- •
- enter into mergers;
- •
- make or declare dividends;
- •
- hedge future production or interest rates;
- •
- incur liens; and
- •
- engage in certain other transactions without the prior consent of the lenders.
The credit facility also requires Vantage II to maintain the following two financial ratios, which are measured at the end of each calendar quarter:
- •
- a current ratio, which is the ratio of its consolidated current assets (includes unused commitment under the credit facility and excludes derivative assets) to its consolidated
102
- •
- a leverage ratio, which is the ratio of its Consolidated Debt (as defined in the Vantage II amended revolving credit facility) to Annualized Adjusted Consolidated EBITDA (as defined in the Vantage II amended revolving credit facility) for such quarter multiplied by four minus certain non-recurring extraordinary charges, of not greater than 4.0 to 1.0.
current liabilities (excludes current maturities under the credit facility), of not less than 1.0 to 1.0; and
As of December 31, 2015, Vantage II was not in compliance with the minimum current ratio covenant under its revolving credit facility but has obtained a waiver of compliance for the minimum current ratio covenant from the lenders and was in compliance with all its financial covenants as of June 30, 2016. Please see Note 7 to the audited consolidated financial statements of Vantage II included elsewhere in this prospectus for more information.
In connection with the completion of this offering, we will repay and retire the Vantage II revolving credit facility using a portion of the proceeds of this offering, cash on hand and borrowings under our new revolving credit facility.
Vantage I Second Lien Term Loan
On December 20, 2013, Vantage I entered into a second lien term loan credit facility with Credit Suisse AG, Cayman Islands Branch, as administrative agent, and a syndicate of lenders in an aggregate principal amount of $200 million. As of June 30, 2016, the effective interest rate was 8.5% and approximately $195.5 million remained outstanding under the term loan facility. The term loan facility matures on December 20, 2018.
We intend to use a portion of the proceeds of this offering, cash on hand and borrowings under our new revolving credit facility to repay and retire the Vantage I second lien term loan facility.
Vantage I Revolving Credit Facility
On December 20, 2013, Vantage I entered into a second amended and restated revolving credit facility with Wells Fargo Bank, N.A., as administrative agent, and a syndicate of lenders with a maximum credit amount of $750 million and a sublimit for letters of credit of the lesser of $50 million or the borrowing base. As of May 10, 2016, the sublimit for the letters of credit was $25 million. Effective December 4, 2014, Vantage I amended its revolving credit facility to add a lien on its gas gathering system and add a midstream borrowing base. The amount available to be borrowed under the revolving credit facility is subject to a borrowing base that is redetermined semiannually each May and November and depends on the value of Vantage I's proved oil and gas reserves and estimated cash flows from these reserves and commodity derivative positions and the earnings from midstream assets. The next redetermination is scheduled to occur in November 2016. As of June 30, 2016, the borrowing base was $285.0 million. As of June 30, 2016, Vantage I had $270.0 million of outstanding borrowings and letters of credit of $0.1 million outstanding under its revolving credit facility. The revolving credit facility matures on January 1, 2017 and is classified as current as of June 30, 2016.
Principal amounts borrowed are payable on the maturity date, and interest is payable quarterly for base rate loans and at the end of the applicable interest period for Eurodollar loans. Vantage I has a choice of borrowing in Eurodollars or at the base rate. Eurodollar loans bear interest at a rate per annum equal to LIBOR plus an applicable margin ranging from 250 to 350 basis points, depending on the percentage of the borrowing base utilized. Base rate loans bear interest at a rate per annum equal to the greatest of (i) the agent bank's reference rate, (ii) the federal funds effective rate plus 50 basis points and (iii) the rate for one month Eurodollar loans plus 100 basis points,
103
plus an applicable margin ranging from 150 to 250 basis points, depending on the percentage of the borrowing base utilized. Vantage I may repay any amounts borrowed prior to the maturity date without any premium or penalty other than customary LIBOR breakage costs.
The credit facility is secured by liens on substantially all of Vantage I's properties and guarantees from its subsidiaries other than any subsidiary that it has designated as an unrestricted subsidiary. The credit facility contains restrictive covenants that may limit Vantage I's ability to, among other things:
- •
- incur additional indebtedness;
- •
- sell assets;
- •
- make loans to others;
- •
- make investments;
- •
- enter into mergers;
- •
- make or declare dividends;
- •
- hedge future production or interest rates;
- •
- incur liens; and
- •
- engage in certain other transactions without the prior consent of the lenders.
The credit facility also requires Vantage I to maintain the following three financial ratios, which are measured at the end of each calendar quarter:
- •
- a current ratio, which is the ratio of its consolidated current assets (includes unused commitment under the credit facility and
excludes derivative assets) to its consolidated current liabilities (excludes current maturities under the credit facility), of not less than 1.0 to 1.0;
- •
- a leverage ratio, which is the ratio of its Consolidated Debt (as defined in the Vantage I amended revolving credit facility)
to Annualized Adjusted Consolidated EBITDAX (as defined in the Vantage I amended revolving credit facility) for such quarter multiplied by four minus certain non-recurring extraordinary
charges, of not greater than 4.0 to 1.0;
- •
- a minimum asset coverage ratio, which is the ratio of the present value of Vantage I's oil and gas reserves (discounted at 10% per annum) to Consolidated Debt (excluding cash and cash equivalents) of not less than 1.5 to 1.0, and the present value of its oil and gas reserves (discounted at 10% per annum), but excluding its proved undeveloped reserves, of not less than $140 million.
As of December 31, 2015, Vantage I was not in compliance with the minimum current ratio covenant under its revolving credit facility but has obtained a waiver of compliance for the minimum current ratio covenant from the lenders and was in compliance with all its financial covenants as of June 30, 2016. Please see Note 3 to the audited financial statements of Vantage I included elsewhere in this prospectus for more information.
In connection with the completion of this offering, we expect to repay and retire the Vantage I revolving credit facility using a portion of the proceeds of this offering, cash on hand and borrowings under our new revolving credit facility.
104
Commodity Derivative Activities
Our primary market risk exposure is in the prices we receive for our natural gas, NGLs and oil production. Realized pricing is primarily driven by the spot regional market prices applicable to our U.S. natural gas, NGLs and oil production. Pricing for natural gas and oil production has been volatile and unpredictable for several years, and we expect this volatility to continue in the future. The prices we receive for production depend on many factors outside of our control, including volatility in the differences between product prices at sales points and the applicable index price.
To mitigate the potential negative impact on our cash flow caused by changes in natural gas, NGLs and oil prices, we have entered into financial commodity derivative contracts such as swaps to ensure that we receive minimum prices for a portion of our future natural gas, NGLs and oil production when management believes that favorable future prices can be secured. We have historically hedged through basis using primarily fixed swap contracts at liquid pricing benchmarks to reduce our exposure to price volatility in the underlying commodity as well as regional pricing differentials. We typically hedge the Inside FERC Dominion South Point or Inside FERC WAHA price for natural gas, NYMEX WTI price for oil and OPIS prices for NGLs.
Our hedging activities are intended to support natural gas, oil and NGLs prices at targeted levels and to manage our exposure to natural gas, NGLs and oil price fluctuations. Under swap contracts, the counterparty is required to make a payment to us for the difference between the swap price specified in the contract and the settlement price, which is based on market prices on the settlement date, if the settlement price is below the swap price. We are required to make a payment to the counterparty for the difference between the swap price and the settlement price if the swap price is below the settlement price. For a description of our commodity derivative contracts, please see Note 5 to the audited consolidated financial statements of our predecessor as of and for the year ended December 31, 2015 and Note 6 to the unaudited consolidated financial statements of our predecessor as of and for the six months ended June 30, 2016 included elsewhere in this prospectus.
By using derivative instruments to hedge exposures to changes in commodity prices, we expose ourselves to the credit risk of our counterparties. Credit risk is the potential failure of the counterparty to perform under the terms of the derivative contract. When the fair value of a derivative contract is positive, the counterparty is expected to owe us, which creates credit risk. To minimize the credit risk in derivative instruments, it is our policy to enter into derivative contracts only with counterparties that are creditworthy financial institutions deemed by management as competent and competitive market makers. The creditworthiness of our counterparties is subject to periodic review. We have derivative instruments in place with six different counterparties. As of December 31, 2015, the fair value of our derivative contracts with all six counterparties was positive, and no one counterparty accounted for more than 29% of the fair market value of our derivative assets. However, at June 30, 2016, the fair value of our derivative contracts was positive, with only two of our six counterparties, one of which accounted for 90% of our contracts in a net gain position and is expected to owe us $11.2 million based on our estimated fair value. We believe our counterparties currently are acceptable credit risks. We are not required to provide credit support or collateral to our counterparties under current contracts, nor are they required to provide credit support or collateral to us. As of June 30, 2016 and December 31, 2015 and 2014, we did not have any past due receivables from counterparties.
105
Contractual Obligations
A summary of contractual obligations as of December 31, 2015 for our predecessor, Vantage I and on a combined basis is provided in the following table. The table does not reflect this offering or the use of proceeds therefrom.
|
| For the Year Ended December 31, |
| |||||||||||||||||||||
| | | | | | | | | | | | | | | | | |||||||||
|
| 2016 | | 2017 | | 2018 | | 2019 | | 2020 | | Thereafter | | Total |
| |||||||||
| | | | | | | | | | | | | | | | | |||||||||
|
| (Thousands of dollars) | | |||||||||||||||||||||
Contractual Obligations |
| | | | | | | | | | ||||||||||||||
Vantage II |
| | | | | | | | | | ||||||||||||||
Vantage II revolving credit facility(1) |
| $ | — | | $ | 149,000 | | $ | — | | $ | — | | $ | — | | | $ | — | | | $ | 149,000 | |
Vantage II second lien term loan facility |
| 8,500 | | 102,958 | | | — | | — | | | — | | | 111,458 | | ||||||||
Drilling rig commitments(2) |
| 450 | | — | | — | | — | | — | | | — | | | 450 | | |||||||
Gas gathering purchase obligations(3) |
| — | | — | | — | | — | | — | | | — | | | — | | |||||||
Asset retirement obligations(4) |
| — | | — | | — | | — | | — | | | 2,091 | | | 2,091 | | |||||||
Other(5) |
| 664 | | 405 | | — | | — | | — | | | — | | | 1,069 | | |||||||
| | | | | | | | | | | | | | | | | |||||||||
Vantage II Total |
| $ | 9,614 | | $ | 252,363 | | $ | — | | $ | — | | $ | — | | | $ | 2,091 | | | $ | 264,068 | |
| | | | | | | | | | | | | | | | | |||||||||
| | | | | | | | | | | | | | | | | | | |||||||
| | | | | | | | | | | | | | | | | |||||||||
Vantage I |
| | | | | | | | | | ||||||||||||||
Vantage I revolving credit facility(1) |
| $ | — | | $ | 271,000 | | $ | — | | $ | — | | $ | — | | | $ | — | | | $ | 271,000 | |
Vantage I second lien term loan facility |
| 18,490 | | 18,320 | | 207,828 | | — | | — | | | — | | | 244,638 | | |||||||
Drilling rig commitments(2) |
| 2,325 | | — | | — | | — | | — | | | — | | | 2,325 | | |||||||
Gas gathering purchase obligations(3) |
| 12,007 | | 8,533 | | 1,625 | | 10,703 | | — | | | — | | | 32,868 | | |||||||
Asset retirement obligations(4) |
| — | | 35 | | 50 | | 38 | | 55 | | | 8,288 | | | 8,466 | | |||||||
Other(5) |
| 1,659 | | 689 | | — | | — | | — | | | — | | | 2,348 | | |||||||
| | | | | | | | | | | | | | | | | |||||||||
Vantage I Total |
| $ | 34,481 | | $ | 298,577 | | $ | 209,503 | | $ | 10,741 | | $ | 55 | | | $ | 8,288 | | | $ | 561,645 | |
| | | | | | | | | | | | | | | | | |||||||||
| | | | | | | | | | | | | | | | | | | |||||||
| | | | | | | | | | | | | | | | | |||||||||
Combined |
| | | | | | | | | | ||||||||||||||
Revolving credit facilities(1) |
| $ | — | | $ | 420,000 | | $ | — | | $ | — | | $ | — | | | $ | — | | | $ | 420,000 | |
Vantage II second lien term loan facility |
| 8,500 | | 102,958 | | — | | — | | — | | | — | | | 111,458 | | |||||||
Vantage I second lien term loan facility |
| 18,490 | | 18,320 | | 207,828 | | — | | — | | | — | | | 244,638 | | |||||||
Drilling rig commitments(2) |
| 2,775 | | — | | — | | — | | — | | | — | | | 2,775 | | |||||||
Gas gathering purchase obligations(3) |
| 12,007 | | 8,533 | | 1,625 | | 10,703 | | — | | | — | | | 32,868 | | |||||||
Asset retirement obligations(4) |
| — | | 35 | | 50 | | 38 | | 55 | | | 10,379 | | | 10,557 | | |||||||
Other(5) |
| 2,323 | | 1,094 | | — | | — | | — | | | — | | | 3,417 | | |||||||
| | | | | | | | | | | | | | | | | |||||||||
Combined Total |
| $ | 44,095 | | $ | 550,940 | | $ | 209,503 | | $ | 10,741 | | $ | 55 | | | $ | 10,379 | | | $ | 825,713 | |
| | | | | | | | | | | | | | | | | |||||||||
| | | | | | | | | | | | | | | | | | | |||||||
| | | | | | | | | | | | | | | | | |||||||||
- (1)
- Includes outstanding principal amounts on December 31, 2015. This table does not include future commitment fees, amortization of deferred financing costs, interest expense or other fees on these facilities because they are floating rate instruments and we cannot determine with accuracy the timing of future loan advances, repayments or future interest rates to be charged.
106
- (2)
- As
of December 31, 2015, we had contracts for rig services which expire at various dates in 2016. The values in the table represent
the gross amounts that we are committed to pay; however, we will record in our financial statements our proportionate share of costs based on our working interest.
- (3)
- Purchase
obligations include minimum volume and revenue commitments under gas gathering agreements in Tarrant County, Texas. The Company
currently expects to produce volumes and generate revenues in excess of these minimum commitments.
- (4)
- Amount
represents estimates of our future asset retirement obligation. Because these costs typically extend many years into the future,
estimating these future costs requires management to make estimates and judgments that are subject to future revisions based upon numerous factors, including the rate of inflation, changing technology
and the political and regulatory environment.
- (5)
- Represents operating leases associated with office rental and field compression.
Critical Accounting Policies and Estimates
The discussion and analysis of our financial condition and results of operations are based upon the consolidated financial statements of our predecessor, which have been prepared in accordance with accounting principles generally accepted in the United States. The preparation of our financial statements requires us to make estimates and assumptions that affect the reported amounts of assets, liabilities, revenues and expenses and related disclosure of contingent assets and liabilities. Certain accounting policies involve judgments and uncertainties to such an extent that there is reasonable likelihood that materially different amounts could have been reported under different conditions, or if different assumptions had been used. We evaluate our estimates and assumptions on a regular basis. We base our estimates on historical experience and various other assumptions that are believed to be reasonable under the circumstances, the results of which form the basis for making judgments about the carrying values of assets and liabilities that are not readily apparent from other sources. Actual results may differ from these estimates and assumptions used in preparation of our consolidated financial statements. See Note 1 of the notes to the audited consolidated financial statements of Vantage II for an expanded discussion of our significant accounting policies and estimates made by management.
Revenue Recognition
Natural gas, NGLs and crude oil revenues are recognized when delivery has occurred, title has transferred and collection is probable. We account for crude oil, natural gas and NGLs sales using the "entitlements method". Under the entitlements method, revenue is recorded based upon our ownership share of volumes sold, regardless of whether we have taken our ownership share of such volumes. We record a receivable or a liability to the extent we receive less or more than our share of the volumes and related revenue. Any amount received in excess of our share is treated as a liability. If we receive less than our entitled share, the underproduction is recorded as a receivable. We sell the majority of our products soon after production at various locations, including the wellhead, at which time title and risk of loss pass to the buyer.
Our gathering revenues are generated from gathering and compressing natural gas. We provide gathering services and compression services under fee-based arrangements.
Oil and Gas Properties
We follow the full-cost method of accounting for natural gas and crude oil properties.
All costs associated with property acquisition, exploration, and development activities are capitalized. Exploration and development costs include dry hole costs, geological and geophysical costs, direct overhead related to exploration and development activities, and other costs incurred for the purpose of finding oil and gas reserves. Salaries and benefits paid to employees directly involved in the exploration and development of properties, as well as other internal costs that can
107
be directly identified with acquisition, exploration, and development activities, are also capitalized. Our predecessor and Vantage I capitalized certain internal costs of approximately $4.5 million and $5.3 million, respectively, during the year ended December 31, 2015 and $3.6 million and $4.0 million, respectively, during the year ended December 31, 2014.
Costs of acquiring unproved oil and gas properties are initially excluded from the depletable base and are assessed at each reporting period to ascertain whether impairment has occurred. When proved reserves are assigned to the property or the property is considered to be impaired, the costs of the property or the amount of impairment is added to the depletable base.
Capitalized costs, as adjusted for estimated future development costs and estimated asset retirement costs, less estimated salvage values, are depreciated, depleted, and amortized using the units-of-production method based on estimated proved reserves as determined by petroleum engineers. The costs of wells-in-progress and unevaluated properties, including any related capitalized interest and internal costs, are not amortized. For the purposes of this calculation, crude oil and natural gas liquid reserves and production are converted to equivalent volumes of natural gas based on the relative energy content of one barrel to six thousand cubic feet of gas. Proceeds from the disposal of properties are normally deducted from the full-cost pool without recognition of gains or losses, except under circumstances where the deduction would significantly alter the relationship between capitalized costs and proved reserves of the cost center, in which case a gain or loss is recorded.
Full cost accounting rules require us to perform a "ceiling test" calculation to test our oil and gas properties for possible impairment. The primary components impacting the calculation are commodity prices, reserve quantities added and produced, overall exploration and development costs and depletion expense. If the net capitalized cost of our oil and gas properties subject to amortization (the "carrying value") exceeds the ceiling limitation, the excess would be charged to expense. The ceiling limitation is equal to the sum of the present value discounted at 10% of estimated future net cash flows from proved reserves, the cost of properties not being amortized, the lower of cost or estimated fair value of unproven properties included in the costs being amortized, and all related income tax effects. The present value of estimated future net revenues is computed by applying the average first-day-of-the-month oil and gas price during the 12-month period ended December 31, 2015 to estimated future production of proved oil and gas reserves as of period-end, less estimated future expenditures to be incurred in developing and producing the proved reserves, assuming the continuation of existing economic conditions. As of December 31, 2015, our predecessor's and Vantage I's full-cost pool exceeded the ceiling limitation by $172.7 million and $344.4 million, respectively, and was recorded as an impairment of proved oil and gas properties in the respective accompanying consolidated statements of operations. As of June 30, 2016, our predecessor's and Vantage I's full-cost pool exceeded the ceiling limitation by $81.7 million and $156.0 million, respectively, which was also recorded as an impairment of proved oil and gas properties in the respective accompanying consolidated statements of operations. Natural gas prices remained depressed thus far in 2016, and lower commodity prices in the future could result in further impairments of our properties, which could have a material adverse effect on our results of operations for the periods in which such charges are taken.
Natural Gas, NGLs and Oil Reserve Quantities and Standardized Measure of Future Cash Flows
Our independent reserve engineers and internal technical staff prepare the estimates of natural gas, NGLs, and oil reserves and associated future net cash flows. Current accounting guidance allows only proved natural gas, NGLs, and oil reserves to be included in our financial statement disclosures. The SEC has defined proved reserves as the estimated quantities of natural gas, NGLs, and oil which geological and engineering data demonstrate with reasonable certainty to be recoverable in future years from known reservoirs under existing economic and operating
108
conditions. Our independent reserve engineers and internal technical staff must make a number of subjective assumptions based on their professional judgment in developing reserve estimates. Reserve estimates are updated annually and consider recent production levels and other technical information about each field. Natural gas, NGLs, and oil reserve engineering is a subjective process of estimating underground accumulations of natural gas, NGLs, and oil that cannot be precisely measured. The accuracy of any reserve estimate is a function of the quality of available data and of engineering and geological interpretation and judgment. Periodic revisions to the estimated reserves and future cash flows may be necessary as a result of a number of factors, including reservoir performance, new drilling, natural gas, NGLs, and oil prices, cost changes, technological advances, new geological or geophysical data, or other economic factors. Accordingly, reserve estimates are generally different from the quantities of natural gas, NGLs, and oil that are ultimately recovered. We cannot predict the amounts or timing of future reserve revisions. If such revisions are significant, they could significantly affect future amortization of capitalized costs and result in impairment of assets that may be material.
Asset Retirement Obligations
Asset retirement obligations relate to future costs associated with the plugging and abandonment of oil and gas wells, removal of equipment and facilities from leased acreage and returning such land to its original condition. The fair value of a liability for an asset retirement obligation is recorded in the period in which it is incurred and the cost of such liability is recorded as an increase in the carrying amount of the related long-lived asset by the same amount. The liability is accreted each period and the capitalized cost is depleted as part of the full cost pool. Revisions to estimated asset retirement obligations result in adjustments to the related capitalized asset and corresponding liability.
Equity Incentives
Certain of the Management Members hold incentive membership interests in Vantage I and Vantage II that currently have rights to participate in certain distribution events of Vantage I and Vantage II if sufficient valuation thresholds are met. Historically, we have accounted for these incentive membership interests as a profits interests plan and did not record stock compensation expense because the satisfaction of all performance, market and service conditions, which would only occur upon a liquidating event, was not probable.
In connection with the completion of this offering, it is possible that all performance, market and service conditions relative to the incentive membership interests held by certain of the Management Members in Vantage Investment I and Vantage Investment II would be probable. If that happens, we will recognize a non-cash charge for stock compensation expense.
The limited liability company agreements of Vantage Investment I and Vantage Investment II to be adopted in connection with the closing of this offering provide a mechanism by which the shares of our common stock to be allocated amongst the members of Vantage Investment I and Vantage Investment II will be determined. As a result, the satisfaction of all performance, market, and service conditions relative to the membership interests awards held by certain Management Members will be probable. Accordingly, we will recognize approximately $ million in a non-cash charge for stock compensation expense for the estimated fair value of the prospective distributions in respect of those awards at the closing of this offering. The charge will not have a dilutive effect on the pro forma net tangible book value per share to new investors in this offering.
Because consideration for the membership interests awards will be deemed given by Vantage Investment I and Vantage Investment II, the charge to expense will be accounted for as capital
109
contributions by Vantage Investment I and Vantage Investment II to us and credited to additional paid-in capital.
Income Taxes
Vantage II is a multi-member limited liability company treated as a partnership for U.S. federal income tax purposes and is not subject to federal income taxes. Accordingly, no provision for federal income taxes has been provided for in our historical results of operations because taxable income was passed through to the members of each entity. Although we are a corporation under the Internal Revenue Code subject to federal income taxes at a statutory rate of 35% of pretax earnings, we do not expect to report any income tax benefit or expense until the consummation of this offering. Based on our deductions primarily related to IDCs that are expected to exceed 2016 earnings, we expect to generate significant net operating loss assets and deferred tax liabilities.
We account for uncertainty in income taxes in accordance with generally accepted accounting principles, which prescribes a comprehensive model for recognizing, measuring, presenting, and disclosing in the consolidated financial statements tax positions taken or expected to be taken on a tax return, including a decision on whether or not to file in a particular jurisdiction. Only tax positions that meet a more-likely-than-not recognition threshold at the effective date may be recognized or continue to be recognized.
Interest and penalties associated with tax positions are recorded in the period assessed as general and administrative expenses. No interest or penalties have been assessed as of December 31, 2015. Vantage II's information returns for tax years subject to examination by tax authorities include 2012 through the current year for state and federal tax reporting purposes, respectively.
Jumpstart Our Business Startups Act of 2012
The JOBS Act permits us, as an "emerging growth company", to take advantage of an extended transition period to comply with new or revised accounting standards applicable to public companies. However, we have irrevocably opted out of the extended transition period.
Internal Controls and Procedures
We are not currently required to comply with the SEC's rules implementing Section 404 of the Sarbanes Oxley Act of 2002, and are therefore not required to make a formal assessment of the effectiveness of our internal control over financial reporting for that purpose. Upon becoming a public company, we will be required to comply with the SEC's rules implementing Section 302 of the Sarbanes-Oxley Act of 2002, which will require our management to certify financial and other information in our quarterly and annual reports and provide an annual management report on the effectiveness of our internal control over financial reporting. We will not be required to make our first assessment of our internal control over financial reporting under Section 404 until our first annual report subsequent to our ceasing to be an "emerging growth company" within the meaning of Section 2(a)(19) of the Securities Act.
Quantitative and Qualitative Disclosure about Market Risk
The primary objective of the following information is to provide forward-looking quantitative and qualitative information about our potential exposure to market risk. The term "market risk" refers to the risk of loss arising from adverse changes in oil and natural gas prices and interest rates. The disclosures are not meant to be precise indicators of expected future losses, but rather indicators of reasonably possible losses. This forward-looking information provides indicators of
110
how we view and manage our ongoing market risk exposures. All of our market risk sensitive instruments were entered into for hedging purposes, rather than for speculative trading.
Commodity Price Risk and Hedges
Our major market risk exposure is in the pricing that we receive for our natural gas, NGLs and oil production. Natural gas, NGLs and oil are commodities and, therefore, their prices are subject to wide fluctuations in response to relatively minor changes in supply and demand. Historically, the commodities market has been volatile. For example, the NYMEX Henry Hub spot market price had declined from a high of approximately $6.00 per MMBtu in 2014 to below $1.70 per MMBtu in March 2016. Natural gas prices have remained depressed thus far in 2016, and the commodities market will likely continue to be volatile in the future. The prices we receive for our oil, natural gas and NGLs production depend on numerous factors beyond our control, some of which are discussed in "Risk Factors — Risks Related to Our Business — Natural gas, NGLs and oil prices are volatile. A further reduction or sustained decline in commodity prices may adversely affect our business, financial condition or results of operations and our ability to meet our capital expenditure obligations and financial commitments".
A $0.10 per Mcf change in our realized natural gas price would have resulted in an $8.2 million change in our natural gas revenues for 2015. A $1.00 per barrel change in our realized oil price would have resulted in an immaterial change in oil revenues for 2015. A $1.00 per barrel change in NGLs prices would have changed NGLs revenue by $0.8 million for 2015. Natural gas sales contributed 92%, oil sales contributed 2% and NGLs sales contributed 6% of our total natural gas, oil and NGLs revenues for 2015, which do not include the effects of derivatives.
Due to this volatility, we have historically used, and we expect to continue to use, commodity derivative instruments, such as swaps, to hedge price risk associated with a portion of our anticipated production. Our hedging instruments allow us to reduce, but not eliminate, the potential effects of the variability in cash flow from operations due to fluctuations in oil and natural gas prices and provide increased certainty of cash flows for our drilling program and debt service requirements. These instruments provide only partial price protection against declines in oil and natural gas prices and may partially limit our potential gains from future increases in prices.
111
The following tables detail the financial derivative contracts that our predecessor and Vantage I had in place as of June 30, 2016:
|
| Quantity | | | | Contract | | Estimated |
| ||||||||||
| | | | | | | | | | | | | | | | | ||||
Commodity |
| Remaining | | Units | | Prices | | Price Index | | Period | | Fair Value |
| ||||||
| | | | | | | | | | | | | | | ||||||
Crude oil swaps |
| 33,808 | | Bbl | | $ | 44.60 - $47.00 | | NYMEX WTI | | 7/16 - 12/17 | | | $ | (209 | ) | | ||
Natural gas swaps |
| | | | | | | | | ||||||||||
Dominion |
| 162,635,000 | | MMBtu | | $ | 1.40 - $3.13 | | Dominion South Point | | 7/16 - 12/19 | | | (9,010 | ) | | |||
WAHA |
| 47,775,000 | | MMBtu | | $ | 2.36 - $3.88 | | WAHA | | 7/16 - 12/19 | | | 750 | | | |||
NYMEX Henry Hub |
| — | | MMBtu | | — | | NYMEX Henry Hub | | — | | | — | | | ||||
| | | | | | | | | | | | | | | ||||||
Total |
| 210,410,000 | | | | | | | (8,260 | ) | | ||||||||
| | | | | | | | | | | | | | | ||||||
NGLs swaps |
| | | | | | | | | ||||||||||
Ethane |
| 11,295,073 | | Gal | | $ | 0.18 - $0.22 | | OPIS MB Ethane | | 7/16 - 12/17 | | | (760 | ) | | |||
Propane |
| — | | Gal | | — | | OPIS MB Propane | | — | | | — | | | ||||
TetPropane |
| 4,452,168 | | Gal | | $ | 0.40 - $0.62 | | OPIS MB TetPropane | | 7/16 - 12/17 | | | (202 | ) | | |||
IsoButane |
| 1,369,777 | | Gal | | $ | 0.52 - $0.76 | | OPIS MB IsoButane | | 7/16 - 12/17 | | | (74 | ) | | |||
Normal butane |
| 653,183 | | Gal | | $ | 0.52 - $0.75 | | OPIS MB NButane | | 7/16 - 12/17 | | | (34 | ) | | |||
Natural gasoline |
| 1,469,159 | | Gal | | $ | 0.83 - $1.22 | | OPIS MB Nat Gasoline | | 7/16 - 12/17 | | | 45 | | | |||
| | | | | | | | | | | | | | | ||||||
Total |
| 19,239,360 | | | | | | | (1,025 | ) | | ||||||||
| | | | | | | | | | | | | | | ||||||
|
| | | | Total commodity derivatives | | | | $ | (9,494 | ) | | |||||||
| | | | | | | | | | | | | | | ||||||
| | | | | | | | | | | | | | | | | ||||
| | | | | | | | | | | | | | | ||||||
For a discussion of how we use financial commodity derivative contracts to mitigate some of the potential negative impact on our cash flow caused by changes in natural gas, NGLs and oil prices, please see "— Pro Forma Capital Resources and Liquidity — Commodity Derivative Activities".
Interest Rate Risk
At June 30, 2016, we had $712.0 million of debt outstanding which bears interest at a floating rate, with an assumed weighted average interest rate of 6.7%. Such outstanding debt consists of $270.0 million under the Vantage I revolving credit facility, $147.0 million under the Vantage II revolving credit facility, $195.0 million under the Vantage I second lien term loan and $100.0 million under the Vantage II second lien term loan, with an assumed weighted average interest rate of 3.96%, 3.71%, 8.5% and 8.5%, respectively.
Interest is based on the same rates for each of the Vantage I and Vantage II revolving credit facilities. We have a choice of borrowing in Eurodollars or at the base rate. Under the Vantage I revolving credit facility, Eurodollar loans bear interest at a rate per annum equal to LIBOR plus an applicable margin ranging from 250 to 350 basis points, depending on the percentage of the borrowing base utilized. Base rate loans bear interest at a rate per annum equal to the greatest of (i) the agent bank's reference rate, (ii) the federal funds effective rate plus 50 basis points and (iii) the rate for one month Eurodollar loans plus 100 basis points, plus an applicable margin ranging from 150 to 250 basis points, depending on the percentage of the borrowing base utilized.
Interest is based on the same rates for each of the Vantage I and Vantage II second lien term loans. We have a choice of borrowing in Eurodollars or at the base rate. Eurodollar loans bear interest at a rate per annum equal to the Adjusted LIBOR rate plus 750 basis points with a minimum Adjusted LIBOR rate of 1.00%. Base rate loans bear interest at a rate per annum equal to
112
the greatest of (i) the agent bank's reference rate, (ii) the federal funds effective rate plus 50 basis points and (iii) the rate for one month Eurodollar loans plus 100 basis points, plus 650 basis points
Assuming no change in the amount outstanding, the impact on interest expense of a 1% increase or decrease in the assumed weighted average interest rate would be approximately $7.1 million per year. We do not currently have or intend to enter into any derivative arrangements to protect against fluctuations in interest rates applicable to our outstanding indebtedness.
Counterparty and Customer Credit Risk
Our cash and cash equivalents are exposed to concentrations of credit risk. We manage and control this risk by investing these funds with major financial institutions. We often have balances in excess of the federally insured limits.
Our natural gas and oil derivative contracts expose us to credit risk in the event of nonperformance by counterparties. While our predecessor does not require our counterparties to our derivative contracts to post collateral, our predecessor does evaluate the credit standing of such counterparties as it deems appropriate. We plan to continue to evaluate the credit standings of our counterparties in a similar manner. The counterparties to our predecessor's derivative contracts currently in place have investment grade ratings.
Our principal exposures to credit risk are through receivables resulting from joint interest receivables ($4.4 million pro forma at June 30, 2016) and receivables from the sale of our natural gas, oil and NGLs production ($24.1 million pro forma at June 30, 2016) due to the concentration of our natural gas, oil and NGLs receivables with several significant customers. The inability or failure of our significant customers to meet their obligations to us or their insolvency or liquidation may adversely affect our financial results. However, we believe the credit quality of our customers is high.
We sell natural gas, NGLs and oil to various types of customers, including pipelines and refineries. Credit is extended based on an evaluation of the customer's financial conditions and historical payment record. The future availability of a ready market for natural gas, NGLs and oil depends on numerous factors outside of our control, none of which can be predicted with certainty. For the year ended December 31, 2015, we had certain major customers that exceeded 10% of total natural gas, NGLs and oil revenues. See "Business — Major Customers". We do not believe the loss of any single purchaser would materially impact our operating results because natural gas, NGLs and oil are fungible products with well-established markets and numerous purchasers.
Joint operations receivables arise from billings to entities that own partial interests in the wells we operate. These entities participate in our wells primarily based on their ownership in leases on which we intend to drill. We have little ability to control whether these entities will participate in our wells.
Off-Balance Sheet Arrangements
Currently, neither we, our predecessor nor Vantage I have off-balance sheet arrangements.
113
Our Company
We are a growth-oriented, independent oil and natural gas company engaged in the acquisition, development, exploitation and exploration of oil and natural gas properties in the United States, with a focus on the Appalachian Basin. We are the largest leaseholder in Greene County, Pennsylvania, an area with significant dry natural gas resources and stacked reservoirs. We hold a largely contiguous acreage position in what we believe to be the core of the Marcellus, Upper Devonian and Utica Shales. Additionally, we have a sizeable position in what we believe to be the core of the Barnett Shale in Texas. We believe these areas are among the most prolific unconventional resource plays in North America, and are generally characterized by high well recoveries relative to drilling and completion costs, predictable production profiles, significant hydrocarbons in place and constructive operating environments.
We own interests in 88,634 net acres in Greene County, of which 13,642 acres are held in fee and 5,027 of such fee acres are leased to third parties. We believe that substantially all of this acreage is prospective for the Marcellus, Upper Devonian and Utica Shales. The Marcellus Shale is the largest unconventional natural gas field in the U.S. and the Upper Devonian and Utica Shales are stacked reservoirs above and below the Marcellus Shale, respectively. Based on our drilling results, as well as drilling results publicly released by other operators, we believe that the Marcellus Shale in Greene County offers some of the most attractive single-well rates of return in North America.
We own and operate midstream infrastructure in Greene County, including a natural gas gathering system with complementary water sourcing and distribution assets (see "— Midstream"). We gather all of our operated natural gas production in Greene County and believe that our system will support our future production growth. We believe that Greene County is among the best-served areas in the Appalachian Basin by current and planned infrastructure, and due to this access has the greatest potential for natural gas production growth in the Appalachian Basin. In addition to our midstream system, a number of long-haul transmission pipelines converge in Greene County, including Spectra Energy Partners' TETCo system, Dominion Resources' DTI system, Columbia Gas Transmission's T system, National Fuel Gas' Line N system and EQT Midstream's Equitrans system. The energy content of our Appalachian Basin dry natural gas production, which ranges from 1,000 to 1,060 MBtu/Mcf, enables us to capture incremental revenue on a volumetric basis, while also meeting the specifications of these long-haul transmission pipelines, thereby allowing us to avoid additional processing and blending expenses.
In addition to our Appalachian Basin acreage, we have 37,481 net acres in the Barnett Shale, of which 22,623 net acres are located in what we believe to be the core of the Barnett Shale in Tarrant, Denton and Wise Counties in Texas. Covering over 5,000 square miles and 18 counties in North Texas, the Barnett Shale was the first shale reservoir to be successfully exploited using horizontal drilling and fracture stimulation techniques. The Barnett Shale remains one of the most productive shale plays in North America and produced 4.4 Bcf/d of natural gas in 2015 according to the Texas Railroad Commission.
Our management team has a proven track record of implementing technically driven growth strategies to target best-in-class returns in some of the most prominent unconventional plays across the United States. Roger Biemans, our Chairman and Chief Executive Officer, and Tom Tyree, our President and Chief Financial Officer, founded our company with investments from affiliates of Quantum Energy Partners, Riverstone Holdings LLC and Lime Rock Partners. We made our initial entry into the Barnett Shale in 2007 and the Appalachian Basin in 2010. Since then, we have been committed to a strategy of disciplined growth through acquisitions and development drilling in the highest quality areas of these plays.
114
We efficiently exploit our resource base by applying and integrating micro-seismic technology, 3D seismic interpretation and petro-physical core analysis, to define the reservoir and optimize formation targeting. This subsurface expertise translates to value maximizing inter-well spacing and highly economic development realized through best-in-class drilling, completion and operational strategies, including multi-well pad drilling, fit for purpose rig utilization, advanced down hole steering, targeted reservoir stimulation and optimized flow back practices. In addition, we have significant experience in our operating areas. We operate 80 gross horizontal wells in the Marcellus Shale, four gross horizontal wells in the Upper Devonian Shale and 185 gross horizontal wells in the Barnett Shale. We believe that our horizontal drilling and completion expertise, coupled with the favorable geologic characteristics of our Appalachian Basin and Barnett Shale acreage, positions us for continued strong well economics and growth. We have organically grown our net daily production from 18 MMcfe/d for the year ended December 31, 2011 to 398.5 MMcfe/d for the six months ended June 30, 2016, representing a compounded annual growth rate of 98.7%.
During 2015, we ran a two rig drilling program with one rig operating in the Appalachian Basin and one rig operating in the Barnett Shale. In 2015, we completed 73 wells on our acreage, including 31 wells in the Appalachian Basin and 42 wells in the Barnett Shale. After temporarily reducing the pace of our drilling and completions activities in the first half of 2016 due to depressed commodity prices, we are currently running two rigs in the Marcellus Shale with the intention of adding a third rig in the Marcellus Shale by year end. Due to our temporary reduction in the pace of our drilling and completion activities in the first half of 2016, our average daily production in the second half of 2016 is anticipated to be lower than our average daily production in the first half of 2016. As a result of our increased drilling and completion activities in the second half of 2016, we anticipate that our average daily production in the first half of 2017 will be materially higher than our average daily production in the second half of 2016. We retain the flexibility to adjust our rig count based on the commodity price environment and other factors. As of June 30, 2016, we had 1,361 identified drilling locations, including 769 in the Marcellus Shale, 210 in the Upper Devonian Shale, 153 in the Utica Shale and 229 in the Barnett Shale.
Our Properties
Appalachian Basin
The Appalachian Basin is an attractive operating area due to its multiple target horizons, long-lived reserves with consistent reservoir quality and historically high drilling success rates, established operating environment, substantial existing infrastructure and well-developed network of oilfield service providers. Operators in the Appalachian Basin have produced more than 38 Tcf of natural gas and 413 Mbls of oil over the past 50 years. With natural gas production of over 21 Bcf/d from over 122,000 wells during the year ended December 31, 2015, production from the Appalachian Basin represented 27% of the natural gas produced onshore in the continental United States during such period.
Our concentrated, largely contiguous acreage position in Greene County, Pennsylvania is located within a stacked pay region in what we believe is the core of the Marcellus, Upper Devonian and Utica Shales. We believe this concentrated acreage position provides us with a multi-decade inventory of high-return, low-cost development opportunities across the three reservoirs, which can share surface facilities and infrastructure to enhance utilization and reduce infrastructure capital requirements.
Based on our drilling results, as well as drilling results publicly released by other operators, we believe that Greene County offers some of the most attractive single-well rates of return in North America. We are focused on acreage swaps and infill lease acquisitions that will consolidate our acreage, increase net lateral lengths and result in operational efficiencies.
115
While our near term drilling program will be focused primarily on the Marcellus Shale, based on our and other operators' well results and our analysis of geologic and engineering data, we believe our Appalachian Basin acreage is prospective for the Upper Devonian and Utica Shales and expect they will be integrated into our future drilling program. We believe our large, contiguous acreage position allows us to optimize our development programs to maximize our resource recovery, and thus our returns.
In addition, we believe that Greene County is among the best-served in the Appalachian Basin by current and planned midstream infrastructure that will support our future production growth. We support our exploration and development activities in Greene County with our gathering lines, compression facilities and water pipeline systems. Please see "— Midstream".
Marcellus Shale
According to the U.S. Energy Information Administration, natural gas production in the Marcellus Shale in June 2016 was 17.5 Bcf/d, making it the largest unconventional natural gas field in the U.S. The Marcellus Shale is a black, organic-rich shale deposit generally productive at depths between 5,500 and 10,000 feet. Production from this brittle, gas-charged shale reservoir is best derived from hydraulically fractured horizontal wellbores that exceed 2,000 feet in lateral length and involve multistage fracture stimulations. The productive limits of the Marcellus Shale cover over 90,000 square miles within Pennsylvania, West Virginia, Ohio and New York. We believe that the Marcellus Shale is a premier North American shale play due to its high well recoveries relative to drilling and completion costs, broad aerial extent, high-quality reservoir characteristics and significant hydrocarbon resources.
Within the Marcellus Shale, all of our approximately 85,047 net acres, of which 13,642 acres are held in fee and 5,027 of such fee acres are leased to third parties, are located in Greene County, Pennsylvania, which we believe constitutes the core of the play. As of June 30, 2016, we operated 92% of our developed horizontal wells and 99% of our acreage in the Marcellus Shale. Our net daily production in the Marcellus Shale has grown from 1.9 MMcf/d in the three months ended December 31, 2011 to 259.8 MMcf/d in the three months ended June 30, 2016.
As of June 30, 2016, we had 87 gross horizontal wells drilled in the Marcellus Shale, 80 of which are operated by us. Of those 87 wells, 73 were on production, two were temporarily shut-in for drilling and completion operations, six were awaiting completion, four were in the process of being completed and two were completed and awaiting pipeline. As of June 30, 2016, we had 769 identified drilling locations in the Marcellus Shale and a total of 3,949,611 net identified lateral feet associated with such locations.
Since we began our current operational focus on the core of the Marcellus Shale in 2012, normalized for each 1,000 feet of horizontal lateral, the EURs from our Marcellus Shale wells brought on-line and currently producing range from 0.91 Bcf per 1,000 feet to 3.31 Bcf per 1,000 feet, averaging 1.93 Bcf per 1,000 feet, as evaluated by our third party reserve engineers. These wells had lateral lengths ranging from 2,337 feet to 9,084 feet, averaging 5,602 feet. We believe all of our Marcellus Shale acreage is prospective for dry natural gas with energy content of 1,000 to 1,060 MBtu/Mcf, averaging 1,043 MBtu/Mcf across our inventory.
Upper Devonian Shale
The Upper Devonian Shale is a stacked interval of several organic shale formations above our Marcellus Shale acreage. As of 2015, there were 43 Upper Devonian Shale wells in Greene County producing 195 MMcf/d as compared to 73 Upper Devonian Shale wells outside of Greene County producing 165 MMcf/d. Based on these well results and geologic data, we believe that the Upper Devonian's high well recoveries relative to drilling and completion costs, high-quality reservoir
116
characteristics and significant hydrocarbon resources in place provide opportunities to generate attractive single well rates of return.
Our acreage position within the Upper Devonian Shale consists of approximately 84,299 net acres, of which 13,586 acres are held in fee and 721 of such fee acres are leased to third parties, all of which are located in Greene County, which we believe constitutes the core of the play.
As of June 30, 2016, we operated 100% of our acreage in the Upper Devonian Shale, and we have drilled four gross horizontal Upper Devonian Shale wells, all of which are currently producing. Our net daily production in the Upper Devonian Shale was 8.2 MMcf/d for the three months ended June 30, 2016 and we have 210 identified drilling locations in this area with a total of 1,078,799 net identified lateral feet associated with such locations. Normalized for each 1,000 feet of horizontal lateral, the EURs from our four gross horizontal Upper Devonian Shale wells range from 0.92 Bcf per 1,000 feet to 1.58 Bcf per 1,000 feet, averaging 1.34 Bcf per 1,000 feet, as evaluated by our third party reserve engineers. These wells had lateral lengths ranging from 3,712 feet to 6,407 feet, averaging 5,274 feet. We believe all of our upper Devonian acreage is prospective for dry natural gas with energy content of 1,000 to 1,060 MBtu/Mcf, averaging 1,046 MBtu/Mcf across our inventory.
Utica Shale
The Ordovician age Utica Shale, which includes the Point Pleasant formation, is a stacked interval of calcareous black organic shales below our Marcellus Shale acreage. The productive limits of the Utica Shale cover over 80,000 square miles within Ohio, Pennsylvania, West Virginia and New York. The Utica Shale was initially developed in Ohio in the liquids rich gas focused area of the play. Since 2015, operators have drilled 10 Utica shale wells targeting the dry gas region of the play in Southwest Pennsylvania, including 4 wells in Greene County, with 24-hour IP rates as high as 72.9 MMcfe/d. We believe all of our Utica Shale acreage is prospective for dry natural gas with expected energy content ranging from 1,000 to 1,020 MBtu/Mcf, averaging 1,011 MBtu/Mcf across our inventory.
Our acreage position within the Utica Shale consists of approximately 51,907 net acres, of which 13,219 acres are held in fee and 718 of such fee acres are leased to third parties and all of which are located in Greene County, which we believe is within the core of the dry natural gas area of the play. We believe that our acreage is highly prospective for the Utica Shale. As of June 30, 2016, we had 153 identified drilling locations in the Utica Shale and a total of 520,642 net identified lateral feet associated with such locations.
Barnett Shale
The Fort Worth Basin is a mature hydrocarbon basin covering more than ten counties in North Texas and extending into Southern Oklahoma. Production began with the exploitation of Bend Conglomerate and Strawn Sandstone reservoirs in the early 1900s. Today, the Fort Worth basin is mainly known as the location of the Barnett Shale, which covers approximately 3,400 square miles and was the first resource play to exploit blanket horizontal drilling in an area previously thought to be unproductive. The Barnett Shale is one of the largest and most mature natural gas fields in North America. Located primarily in the Fort Worth Basin of North Texas, the "core" region of the Barnett Shale has produced a total of over 18.4 Tcf of natural gas.
Covering over 5,000 square miles and 18 counties in North Texas, the Barnett Shale was the first shale reservoir to be successfully exploited using horizontal drilling and fracture stimulation techniques. The Barnett Shale remains one of the most productive shale plays in North America and produced 4.4 Bcf/d of natural gas in 2015 according to the Texas Railroad Commission.
117
The successful development of the Barnett Shale in the core area of the Fort Worth Basin can be attributed to its unique reservoir characteristics that include a thick (up to 800 feet), highly organic formation that contains free gas in the fractures and pore spaces throughout the reservoir. In addition, the presence of effective bottom and top seals act as effective frac barriers which limit the production of water from other formations and enhance the recovery of the gas in place. As is typical of all resource plays, the Barnett Shale is laterally continuous over a very large area which allows for the mechanical exploitation of the resource without the traditional risks of structural or stratigraphic variations within the defined limits of the reservoir.
Of our 37,481 net acres in the Barnett Shale, approximately 22,623 are located in our primary development areas of Tarrant, Denton and Wise Counties in Texas, which we believe to constitute the core of the Barnett Shale. As of June 30, 2016, we had drilled and cased a total of nine wells, of which three have been completed and are currently producing and six are expected to be completed in 2016. As of June 30, 2016, we operated 99% of our acreage in the Barnett Shale. Our net daily production in the Barnett Shale has grown from 23.2 MMcfe/d in the three months ended December 31, 2011 to 131 MMcfe/d in the three months ended June 30, 2016.
As of June 30, 2016, in our core operating areas of the Barnett Shale, we had 177 gross horizontal wells drilled, excluding those that have been plugged or shut-in, 171 of which are operated by us. Of those 177, 165 were on production and six were temporarily shut-in for artificial lift and workover evaluation and six were awaiting completion. We have a 100% success rate in our core operating areas of the Barnett Shale. As of June 30, 2016, we had 229 identified drilling locations in the Barnett Shale and a total of 916,506 net identified lateral feet associated with such locations. Our Barnett Shale acreage is divided between the dry and wet natural gas windows with heat contents ranging from 980 to 1,300 MBtu/Mcf.
Other Properties
We also hold approximately 58,467 net acres in other project areas, primarily comprised of our Uinta Basin properties in Utah. The Uinta Basin is a mature hydrocarbon basin located in Duchesne and Uintah Counties of Utah. This basin covers more than 9,000 square miles with development beginning in the 1950s. Formed during the late Cretaceous to Eocene periods, the Uinta Basin is an active oil and gas development basin with focus on development within three main petroleum systems: Mesaverde gas, Wasatch oil and Green River oil. Today, development is focused primarily on Wasatch and Green River black wax crude, aided by advanced completion technologies tied to both vertical and horizontal development. Recovery from these petroleum systems is often aided by secondary water flood, in conjunction with new well development. The Uinta Basin targets are mature with over 28,678 wells drilled to date, according to Drillinginfo. In addition, the Uinta Basin has produced 654 million barrels of oil and over 5.42 Tcf of natural gas during its productive history, according to Drillinginfo production data for Duchesne and Uintah counties.
Although we are not currently developing our other properties, we believe that they provide significant upside potential to our primary operations.
118
Operating Data
The following chart provides a summary of our EUR per PUD well and the identified PUD drilling locations based on our December 31, 2015 reserve estimates, delineated by each of our operating regions:
|
| Average EUR Per PUD Well | | Identified | | |||||||||||||||||||||
| | | | | | | | | | | | | | | |||||||||||||
|
| Natural Gas | | NGLs | | Oil | | Total | | PUD Drilling | | |||||||||||||||
|
| (Bcf) | | (MBbls) | | (MBbls) | | (Bcfe) | | Locations |
| |||||||||||||||
| | | | | | | | | | | | | |||||||||||||||
Marcellus Shale |
| | 11.4 | | | | — | | | | — | | | | 11.4 | | | | 84.0 | | | |||||
Upper Devonian Shale |
| | 9.9 | | | | — | | | | — | | | | 9.9 | | | | 6.0 | | | |||||
Barnett Shale |
| | | | | | | | | | | | | | | | ||||||||||
Denton / Wise |
| | 2.5 | | | | 458.7 | | | | 26.1 | | | | 5.5 | | | | 66.0 | | | |||||
Tarrant |
| | 5.5 | | | | — | | | | — | | | | 5.5 | | | | 46.0 | | | |||||
Midstream
We own and operate midstream infrastructure in Greene County, including a natural gas gathering system with complementary water sourcing and distribution assets. We believe our ownership of this midstream infrastructure allows us to reduce our costs, promote overall efficiency of operations and increase our rates of return. We gather all of our operated natural gas production in Greene County and believe that our system will support our future production growth. We also intend to seek out commercial third-party gathering and water opportunities on our system.
Our natural gas gathering infrastructure currently has a demonstrated throughput capacity of over 400 MMcf/d and includes approximately 30 miles of gathering pipeline and 7,100 horsepower of compression. For the six months ended June 30, 2016, gross throughput on our midstream system was 325 MMcf/d, 59 MMcf/d of which was attributable to our joint venture partner's interest in the system, representing a 63% increase from the corresponding period in 2015. Our midstream segment generated pro forma Midstream Segment Adjusted EBITDA of $22.4 million for the six months ended June 30, 2016, compared to $12.5 million for the corresponding period in 2015.
Our natural gas gathering system is designed to grow to an ultimate total throughput capacity of approximately 1,800 MMcf/d with 147 miles of pipeline and 145,000 horsepower of compression. We intend to expand our existing system over time to meet our expected production growth, including increasing our throughput capacity to approximately 600 MMcf/d by 2018 and approximately 1,000 MMcf/d by 2022. Our water sourcing and distribution system is designed for a total supply of 118,000 Bbls/d. We expect the buildout of our water sourcing and distribution system to accommodate the expected future growth of our development activities.
We also own a 38% non-operated interest in Appalachia Midstream Services, a gas gathering joint venture with Williams Partners, L.P. which includes the North and South Rogersville systems. We are the contracted anchor shipper for the joint venture and have dedicated approximately 8,000 net acres in Greene County (the "Midstream AMI"). Williams Partners, L.P. has a right of first offer if we decide to sell any assets within the Midstream AMI.
We do not currently own or operate midstream infrastructure in the Barnett Shale and rely on third-party service providers for the gathering of our production in that basin.
Transportation and Takeaway Capacity
We benefit from numerous takeaway capacity alternatives relative to other regions in the Appalachian Basin as a number of long-haul transmission pipelines converge in Greene County, where all of our Appalachian Basin production and acreage are located. Our current natural gas
119
production in the Appalachian Basin is gathered and subsequently delivered to Spectra Energy Partners' TETCo system and Dominion Resources' DTI system for long-haul delivery. Columbia Gas Transmission's T System, National Fuel Gas' Line N and EQT Midstream's Equitrans system are also in close proximity to our acreage. Our Barnett Shale acreage is in proximity to some of the most extensive midstream infrastructure in North America.
We have entered into firm marketing agreements covering 70,000 MMBtu/d of our Appalachian Basin production through October 2019 and an additional 40,000 MMBtu/d of our Appalachian Basin production through October 2020. Under the firm marketing agreements, our production will be sold at prices tied to certain Appalachian Basin indices and we are obligated to sell these daily volumes or purchase replacement gas for any deficiencies in deliveries.
We continue to actively identify and evaluate additional takeaway capacity to facilitate production growth in our Appalachian Basin positions.
Gathering Arrangements
We have entered into gathering agreements with midstream operators in our Barnett Shale and Appalachian Basin areas of operation. We have agreed to gather all of our production in Greene County. Certain of our gathering agreements in the Barnett Shale include minimum volume commitments, which could require us to pay minimum gathering fees to the provider if we were unable to deliver sufficient production volumes. Based on our operations and expected production growth, we do not believe that we will face any material liabilities as a result of the failure to meet minimum volume commitments.
Marketing
We routinely manage our commodity and regional price risk through hedging arrangements, firm marketing agreements and active analysis of primary and secondary firm transportation opportunities. As part of our marketing activities, we continually review regional supply and demand fundamentals with a focus on current and forecasted long-haul pipeline utilization. In addition to the numerous takeaway capacity alternatives currently available to producers in Greene County, we believe that planned takeaway capacity additions of approximately 17 Bcf/d expected to come online by December 2018 will be sufficient to meet expected supply growth from producers in and
120
around Greene County for the foreseeable future. Significant new takeaway projects include the following:
|
| | Planned Capacity | | ||||
In-Service Schedule |
| Project | | (MMcf/d) |
| |||
Q4 2016 |
| Rockies Express Zone 3 Capacity Enhancement | | | 800 | | | |
Q4 2016 |
| Texas Eastern Transmission Company Gulf Markets Expansion Phase I | | | 250 | | | |
Q3 2017 |
| Energy Transfer Rover Pipeline | | | 3,250 | | | |
Q4 2017 |
| Spectra/DTE Nexus Gas Transmission | | | 1,500 | | | |
Q4 2017 |
| Tennessee Gas Pipeline Broad Run Expansion Project | | | 200 | | | |
Q4 2017 |
| Texas Eastern Transmission Company Access South Project | | | 320 | | | |
Q4 2017 |
| Texas Eastern Transmission Company Adair Southwest Project | | | 200 | | | |
Q4 2017 |
| Texas Eastern Transmission Company Gulf Markets Expansion Phase II | | | 400 | | | |
Q4 2017 |
| Texas Eastern Transmission Company Lebanon Extension | | | 180 | | | |
Q4 2017 |
| Columbia Pipeline Group Leach Xpress | | | 1,500 | | | |
Q4 2018 |
| Columbia Pipeline Group WB Xpress | | | 1,300 | | | |
Q4 2018 |
| Columbia Pipeline Group Mountaineer Xpress | | | 2,700 | | | |
Q4 2018 |
| Columbia Pipeline Group Gulf Xpress | | | 860 | | | |
Q4 2018 |
| Dominion Transmission Atlantic Coast Pipeline | | | 1,500 | | | |
Q4 2018 |
| EQT Mountain Valley Pipeline | | | 2,000 | | | |
| | | | | | | |||
Total |
| | | 16,960 | | | ||
| | | | | | | |||
| | | | | | | | | |
| | | | | | | |||
Business Strategy
Our strategy is to leverage our management team's experience in identifying, acquiring and developing economic natural gas and oil resources to cost efficiently grow our reserves, production and cash flow and thus maximize the value of our assets. Our strategy has the following principal elements:
- •
- Growing shareholder value through optimizing development of our extensive drilling
inventory. We began our Barnett Shale development program in 2008 and our Appalachian Basin development program in 2011, and we have
increased production from 18 MMcfe/d for the year ended December 31, 2011 to approximately 398.5 MMcfe/d for the three months ended June 30, 2016. We intend to continue to
drill and develop our portfolio of 1,361 identified drilling locations with the goal of growing production, cash flow and reserves in an economically efficient manner in order to maximize shareholder
value. We are currently running two rigs in the Marcellus Shale with the intention of adding a third rig in the Marcellus Shale by year end, and we retain the flexibility to adjust our rig count based
on the commodity price environment and other factors.
- •
- Enhancing returns by focusing on capital and operating cost efficiencies. We target best-in-class returns in the Appalachian Basin and Barnett Shale. As the operator of the substantial majority of our acreage, we are able to manage the timing and level of our capital spending, our exploration and development strategies and our operating costs. We aim to maximize well production and recoveries relative to drilling and completion costs through optimizing lateral length, the number and distribution of frac stages, perforation
121
- •
- Continue growing our acreage position in the core of the Appalachian Basin through opportunistic leasing and
acquisitions. We have selectively built our Appalachian Basin position from less than 200 net acres as of December 31, 2010 to
approximately 88,634 net acres, of which 13,642 acres are held in fee and 5,027 of such fee acres are leased to third parties. We believe that the Appalachian Basin continues to have
significant expansion and consolidation opportunities, and we intend to pursue transactions that meet our strategic and financial objectives, such as our recent 31,323 net acre acquisition from Alpha
Natural Resources. We are currently focused on acreage swaps and infill lease acquisitions that we believe will further consolidate our acreage, increase net lateral lengths and result in operational
efficiencies.
- •
- Utilizing our midstream infrastructure to support upstream operations and enhance access to markets for our natural gas
production. The midstream infrastructure we own and operate in Greene County gathers all of our operated natural gas production in the
Appalachian Basin. Going forward, we expect to continue to invest in our Greene County gas gathering and water systems to (i) optimize our gathering and takeaway capacity, including access to
interstate pipelines, (ii) support our expected production growth, (iii) provide greater control over the direction and planning of our drilling schedule, (iv) achieve lower
capital and operating costs and generate overall efficiencies and (v) provide gathering and water services to third parties.
- •
- Managing commodity price exposure through an active hedging and marketing program to protect our expected future cash flows. We maintain an active commodity price risk management program through hedging, firm marketing arrangements and continuing analysis of primary and secondary firm transportation opportunities. We have historically hedged through basis using primarily fixed price swap contracts at liquid pricing benchmarks to reduce our exposure to price volatility in the underlying commodity as well as regional pricing differentials.
cluster spacing and the type of fracture stimulation employed. We believe we have distinctive competencies in managing costs, and as a result, we believe we will continue to capture incremental capital and operating cost efficiencies.
Business Strengths
We have a number of strengths that we believe will help us successfully execute our business strategy and grow stockholder value, including:
- •
- Large and highly contiguous land position in the core of the Appalachian
Basin. Since 2010, we have built a largely contiguous acreage position of 88,634 net acres in the Appalachian Basin through a
disciplined and focused leasing and acquisition program. We are the largest leaseholder in Greene County, which we believe to be the dry natural gas core of the Marcellus, Upper Devonian and Utica
Shales. We benefit from our concentrated, core position through our high net revenue interest and operational efficiencies. We believe our Marcellus Shale acreage offers some of the most attractive
single-well rates of return in North America.
- •
- Multi-year, low-risk drilling inventory. We believe our concentrated acreage positions in the Appalachian Basin and Barnett Shale are well delineated, characterized by low geological risk and possess repeatable drilling opportunities that we expect will result in a predictable production growth profile. As of June 30, 2016, we had 1,361 identified drilling locations, including 769 in the Marcellus Shale, 210 in the Upper Devonian Shale, 153 in the Utica Shale and 229 in the Barnett Shale. Assuming a two rig program, our drilling inventory is approximately 22 years based on our Marcellus Shale locations and approximately 32 years
122
- •
- Efficient operations drive low drilling and completion costs resulting in higher
returns. We have historically had an intense focus on managing costs which has translated into meaningful reductions in our overall
drilling and completion costs. We have implemented operational efficiencies to continue lowering our costs, such as pad drilling and the use of less expensive, shallow vertical drilling rigs to drill
to the kick-off point of the horizontal wellbore, and optimized well spacing and completion designs. Our average drilling and completion cost, normalized for each 1,000 feet of horizontal
lateral, decreased by 38% for the first half of 2016 compared to the three months ended December 31, 2014.
- •
- Exceptionally low operating cost structure with significant control across our acreage
position. Our acreage position in the Appalachian Basin and Barnett Shale is generally in contiguous blocks which allows us to conduct
our operations more cost effectively and develop this acreage more efficiently. Additionally, our operational control allows us to more efficiently manage the pace of development activities, the
gathering and marketing of our production and operating costs. We are continually looking to increase efficiencies and decrease our operating cost structure and were able to achieve a lease operating
expense per Mcfe of $0.13 for the three months ended June 30, 2016, a reduction of 66% compared to the three months ended December 31, 2014. This reduction was largely attributable to a
shift toward recycling substantially all of our produced water in Greene County. Our company, which was comprised of just 63 employees at December 31, 2015, managed total production of 398.5
MMcfe/d for the three months ended June 30, 2016 and deployed $354 million in capital expenditures during the year ended December 31, 2015. Our general and administrative expense per
Mcfe was $0.12 for the three months ended June 30, 2016, a reduction of 52% compared to $0.25 for the three months ended December 31, 2014.
- •
- Strategic, efficient midstream infrastructure supports production growth and access to
markets. We gather all of our operated natural gas production in Greene County, and the concentrated nature of our stacked pay acreage
in that area allows us to build out and operate our midstream infrastructure in a manner that captures significant capital and operating cost efficiencies. For the three months ended
December 31, 2014 and June 30, 2016, our midstream operating expense was approximately $0.04 per Mcf based on our Appalachian Basin throughput volumes. Additionally, our natural gas
gathering system is strategically located with interconnections to multiple downstream pipeline systems including TETCo and Dominion interstate pipelines.
- •
- Complementary position in the core of the Barnett
Shale. We have assembled a large and attractive leasehold position of approximately 37,481 net acres in the Barnett Shale, including
approximately 22,623 net acres in Tarrant, Denton, and Wise Counties in Texas, which we believe constitute the core of the Barnett Shale. Our Barnett Shale acreage position is characterized by mature,
long-lived production profiles that provides us with access to multiple markets and favorable WAHA-based pricing.
- •
- Strong commodity price risk management protects capital investment. Our focus on commodity price risk management through hedging, firm marketing agreements and firm transportation opportunities protects our capital investment and future cash flows by reducing exposure to commodity prices. As of July 31, 2016, we had entered into hedging contracts through December 31, 2019 covering approximately 219 TBtu of future natural
when including our Upper Devonian and Utica Shale locations. We believe that we and other operators in the area have substantially delineated and de-risked our acreage position in the Marcellus and Barnett Shales. Likewise, we believe the drilling activity and well results of other operators in the area have substantially reduced the risk associated with our drilling locations in the Upper Devonian and Utica Shales.
123
- •
- Significant liquidity and financial
flexibility. Following the completion of this offering, we estimate that we will have availability under our new revolving credit
facility of approximately $ million and $ million of cash on hand. After giving
effect to this offering, we expect that our capital expenditures through
2017 will be fully funded with proceeds from this offering, cash flows from operations and available capacity under our new revolving credit facility, consistent with our overall financial strategy of
maintaining a strong and stable capitalization profile.
- •
- Proven, experienced and incentivized management and technical teams. We believe our management team's experience and expertise across multiple resource plays provides a distinct competitive advantage. Our management team has an average of over 25 years of industry experience including executive officer positions at public exploration and production companies and key members with significant experience operating in the Appalachian Basin and Barnett Shale. We have assembled a strong technical staff of engineers, geoscientists and field operations managers with extensive experience in horizontal development and operating multi-rig development programs. We have been early adopters of new oilfield service technologies and techniques for drilling and completions. Our management and technical teams have a significant economic interest in us through their interests in our controlling stockholders, Vantage Investment I and Vantage Investment II.
gas, NGLs and oil production. Substantially all of the natural gas hedges are linked to Dominion South Point and WAHA price indices, consistent with the pricing we receive for our natural gas production. The weighted average prices of our WAHA and Dominion South Point natural gas hedges are $3.04 and $2.26 per MMbtu, respectively. Inclusive of our NGLs and oil hedges, the weighted average price of our hedging contracts was $2.43 per MMbtu.
Recent Developments
Alpha Acquisition
On May 16, 2016, we entered into a purchase and sale agreement with a wholly owned subsidiary of Alpha Natural Resources to purchase certain natural gas properties located in Greene County (the "Alpha Properties") for cash consideration of $339.5 million, subject to post-closing adjustment (the "Alpha Acquisition"). The Alpha Properties consist of approximately 31,323 net acres, of which 5,027 acres are held in fee and leased to third parties, along with non-operating royalty interests in 42 producing Marcellus horizontal wells and certain related midstream and other assets. The Alpha Acquisition was completed in June 2016, with an effective date of April 1, 2016. The Alpha Acquisition added 330 identified drilling locations, including 226 in the Marcellus Shale, 72 in the Upper Devonian Shale and 32 in the Utica Shale.
Midstream Acquisition
We entered into two purchase and sale agreements (the "AMS Purchase Agreements") with Appalachia Midstream Services, L.L.C. ("Seller") to purchase certain midstream assets in Greene County (the "AMS Acquisition"). The AMS Acquisition consists of the remaining 62% interest not currently owned in the Rogersville Gas System and a 67.5% interest in the Wind Ridge Gathering System.
The aggregate purchase price was $50.0 million in cash and the AMS Purchase Agreement contains customary representations and warranties, covenants and indemnification provisions, and has an effective date of April 1, 2016. We and the Seller expect to close the AMS Acquisition in the third quarter of 2016.
124
Our Operations
Reserve Data
The information with respect to our estimated reserves presented below has been prepared in accordance with the rules and regulations of the SEC.
Reserves Presentation
Our estimated proved reserves of Vantage II and Vantage I on a combined basis as of December 31, 2015 are based on valuations prepared by our independent reserve engineers assuming a 30-year reserve life. Copies of the summary reports of our reserve engineers with respect to our reserves as of December 31, 2015 are filed as exhibits to the registration statement of which this prospectus forms a part. Please see "— Preparation of Reserve Estimates" for definitions of proved reserves and the technologies and economic data used in their estimation.
125
The following table summarizes the estimated proved reserves of our predecessor, Vantage I and the two entities on a combined basis at December 31, 2015 based on SEC pricing.
|
| At December 31, 2015(1) |
| |||
Predecessor: |
| | | | ||
Estimated Proved Reserves: |
| | | | ||
Total natural gas proved reserves (Bcf) |
| | 852.9 | | | |
Total natural gas proved developed reserves (Bcf) |
| | 318.2 | | | |
Percent proved developed |
| | 37.3 | % | | |
Total natural gas proved undeveloped reserves (Bcf) |
| | 534.7 | | | |
Percent proved undeveloped |
| | 62.7 | % | | |
Vantage I: |
| | | | ||
Estimated Proved Reserves: |
| | | | ||
Total equivalent proved reserves |
| | 1,052.1 | | | |
Natural gas (Bcf) |
| | 902.1 | | | |
NGLs (MMBbl) |
| | 23.8 | | | |
Oil (MMBbl) |
| | 1.2 | | | |
| | | | | |||
Total equivalent proved developed reserves |
| | 450.0 | | | |
Natural gas (Bcf) |
| | 398.4 | | | |
NGLs (MMBbl) |
| | 8.2 | | | |
Oil (MMBbl) |
| | 0.4 | | | |
Percent proved developed |
| | 42.8 | % | | |
Total equivalent proved undeveloped reserves |
| | 602.7 | | | |
Natural gas (Bcf) |
| | 503.8 | | | |
NGLs (MMBbl) |
| | 15.6 | | | |
Oil (MMBbl) |
| | 0.9 | | | |
Percent proved undeveloped |
| | 57.2 | % | | |
Combined: |
| | | | ||
Estimated Proved Reserves: |
| | | | ||
Total equivalent proved reserves (Bcfe) |
| | 1,905.0 | | | |
Natural gas (Bcf) |
| | 1,755.0 | | | |
NGLs (MMBbl) |
| | 23.8 | | | |
Oil (MMBbl) |
| | 1.2 | | | |
| | | | | |||
Total equivalent proved developed reserves (Bcfe) |
| | 768.2 | | | |
Natural gas (Bcf) |
| | 716.6 | | | |
NGLs (MMBbl) |
| | 8.2 | | | |
Oil (MMBbl) |
| | 0.4 | | | |
Percent proved developed |
| | 40.3 | % | | |
Total equivalent proved undeveloped reserves (Bcfe) |
| | 1,137.4 | | | |
Natural gas (Bcf) |
| | 503.8 | | | |
NGLs (MMBbl) |
| | 15.6 | | | |
Oil (MMBbl) |
| | 0.9 | | | |
Percent proved undeveloped |
| | 59.7 | % | | |
- (1)
- Volumes were determined using average product prices of $1.07/Mcf for natural gas in the Marcellus Shale, $1.07/Mcf for natural gas in the Upper Devonian Shale and $1.91/Mcf for natural gas, $11.64/Bbl for NGLs and $45.88/Bbl for oil in the Barnett Shale. There were no proved reserves associated with our Utica Shale acreage as of December 31, 2015.
126
Proved Undeveloped Reserves
The following table summarizes the changes in the combined proved undeveloped reserves of our predecessor, Vantage I and the two entities on a combined basis during 2015 (in MMcfe):
Predecessor: |
| | ||
Proved undeveloped reserves at December 31, 2014 |
| 350,647 | | |
Conversions into proved developed reserves |
| (125,038 | ) | |
Extensions and discoveries |
| 281,852 | | |
Acquisitions |
| 31,438 | | |
Revisions |
| (4,172 | ) | |
| | | | | |
Proved undeveloped reserves at December 31, 2015 |
| 534,727 | | |
| | | | | |
| | | | | |
| | | | | |
Vantage I: |
| | ||
Proved undeveloped reserves at December 31, 2014 |
| 665,101 | | |
Conversions into proved developed reserves |
| (215,458 | ) | |
Extensions and discoveries |
| 135,024 | | |
Acquisitions |
| 31,437 | | |
Revisions |
| (13,400 | ) | |
| | | | | |
Proved undeveloped reserves at December 31, 2015 |
| 602,704 | | |
| | | | | |
| | | | | |
| | | | | |
Combined: |
| | ||
Proved undeveloped reserves at December 31, 2014 |
| 1,015,748 | | |
Conversions into proved developed reserves |
| (340,496 | ) | |
Extensions and discoveries |
| 416,876 | | |
Acquisitions |
| 62,875 | | |
Revisions |
| (17,572 | ) | |
| | | | | |
Proved undeveloped reserves at December 31, 2015 |
| 1,137,431 | | |
| | | | | |
| | | | | |
| | | | | |
During the year ended December 31, 2015, extensions were comprised of 332,468 MMcfe and 84,408 MMcfe from the Appalachian and Fort Worth Basins, respectively. The increases were the result of increased technical certainty in areas of existing leasehold ownership, tied to internal and external development activity.
During the year ended December 31, 2015, the increase due to acquisitions was primarily related to new leasehold acquisition from third parties allowing for higher certainty in inventory development.
During the year ended December 31, 2015, revisions were primarily attributable to technical revisions associated with proved undeveloped inventory performance after conversion to proved developed as well as the base proved developed being revised.
During the year ended December 31, 2015, we incurred costs of approximately $207 million to convert 340,496 MMcfe of proved undeveloped reserves to proved developed reserves.
As of December 31, 2015, we had no proved undeveloped reserves that had remained undeveloped for more than five year since initial booking.
Estimated future development costs relating to the development of our proved undeveloped reserves at December 31, 2015 are approximately $575.2 million over the next five years, which we expect to finance through cash flow from operations, available capacity under our new revolving credit facility and other sources of capital financing. Based on our reserve reports as of December 31, 2015, we had 84, 6 and 112 identified drilling locations in the Marcellus Shale, Upper Devonian Shale and Barnett Shale, respectively, associated with proved undeveloped reserves and 8 and 23 identified drilling locations in the Marcellus Shale and Barnett Shale, respectively,
127
associated with proved developed not producing reserves. All of our proved undeveloped reserves are expected to be developed within five years of initial booking. Please see "Risk Factors — Risks Related to Our Business — The development of our estimated proved undeveloped reserves may take longer and may require higher levels of capital expenditures than we currently anticipate. Therefore, our estimated proved undeveloped reserves may not be ultimately developed or produced".
Preparation of Reserve Estimates
Our reserve estimates as of December 31, 2015 included in this prospectus are based on evaluations prepared by the independent petroleum engineering firms of Netherland, Sewell & Associates, Inc. and Wright & Company in accordance with Standards Pertaining to the Estimating and Auditing of Oil and Gas Reserves Information promulgated by the Society of Petroleum Evaluation Engineers and definitions and guidelines established by the SEC. Our independent reserve engineers were selected for their historical experience and geographic expertise in engineering unconventional resources.
Proved reserves are reserves which, by analysis of geoscience and engineering data, can be estimated with reasonable certainty to be economically producible from a given date forward from known reservoirs under existing economic conditions, operating methods and government regulations prior to the time at which contracts providing the right to operate expires, unless evidence indicates that renewal is reasonably certain. Our proved reserves were estimated assuming a 30-year reserve life. The term "reasonable certainty" implies a high degree of confidence that the quantities of oil or natural gas actually recovered will equal or exceed the estimate. The technical and economic data used in the estimation of our proved reserves include, but are not limited to, well logs, geologic maps, well-test data, production data (including flow rates), well data (including lateral lengths), historical price and cost information, and property ownership interests. Our independent reserve engineers use this technical data, together with standard engineering and geoscience methods, or a combination of methods, including performance analysis, volumetric analysis, and analogy. The proved developed reserves and EURs per well are estimated using performance analysis and volumetric analysis. The estimates of the proved developed reserves and EURs for each developed well are used to estimate the proved undeveloped reserves for each proved undeveloped location (utilizing type curves, statistical analysis, and analogy). Proved undeveloped locations that are more than one offset from a proved developed well utilized reliable technologies to confirm reasonable certainty. The reliable technologies that were utilized in estimating these reserves include log data, performance data, log cross sections, seismic data, core data, and statistical analysis.
Internal Controls
Our internal staff of petroleum engineers and geoscience professionals work closely with our independent reserve engineers to ensure the integrity, accuracy and timeliness of data furnished to our independent reserve engineers in their reserve auditing process. Periodically, our technical team meets with the independent reserve engineers to review properties and discuss methods and assumptions used by us to prepare reserve estimates.
For all properties, our internally prepared reserve estimates and related reports are reviewed and approved by our Vice President — Development/A&D, Seth Urruty. Mr. Urruty has been with Vantage since November 2007. Mr. Urruty has 10 years of experience in oil and gas operations, reservoir engineering, reserve management, unconventional reservoir characterization and strategic planning. From 2006 to November 2007 Mr. Urruty was a Reservoir and Operations Engineer for Petro-Canada Resources. Mr. Urruty holds a BS in Mechanical Engineering and a minor in Business Administration with a Leadership Concentration from Gonzaga University.
128
Our proved reserve estimates shown herein at December 31, 2015 have been independently prepared by NSAI for our Barnett Basin properties and Wright & Company for our Appalachian Basin properties. NSAI was founded in 1961 and performs consulting petroleum engineering services under Texas Board of Professional Engineers Registration No. F-2699. Within NSAI, the technical persons primarily responsible for preparing the estimates set forth in the NSAI reserves report incorporated herein are Mr. Randolph K. Green and Mr. William J. Knights. Mr. Green has been practicing consulting petroleum engineering at NSAI since 1983. Mr. Green is a Licensed Professional Engineer in the State of Texas (No. 72951) and has over 30 years of practical experience in petroleum engineering, with over 30 years' experience in the estimation and evaluation of reserves. He graduated from Texas Tech University in 1982 with a Bachelor of Science Degree in Petroleum Engineering. Mr. Knights has been practicing consulting petroleum geology at NSAI since 1991. Mr. Knights is a Licensed Professional Geoscientist in the State of Texas, Geology (No. 1532) and has over 30 years of practical experience in petroleum geosciences, with over 30 years' experience in the estimation and evaluation of reserves. He graduated from Texas Christian University in 1981 with a Bachelor of Science Degree in Geology and from Texas Christian University in 1984 with a Master of Science Degree in Geology. Both technical principals meet or exceed the education, training, and experience requirements set forth in the Standards Pertaining to the Estimating and Auditing of Oil and Gas Reserves Information promulgated by the Society of Petroleum Engineers; both are proficient in judiciously applying industry standard practices to engineering and geoscience evaluations as well as applying SEC and other industry reserves definitions and guidelines.
Wright & Company was founded in 1988 and performs independent consulting petroleum engineering services. Within Wright & Company, the technical person primarily responsible for preparing the estimates set forth in the Wright & Company letter, which is filed as an exhibit to the registration statement of which this prospectus forms a part, was D. Randall Wright. Mr. Wright has been a practicing consulting petroleum engineer at Wright & Company since its founding in 1988. Mr. Wright is a Registered Professional Engineer in the State of Texas (License No. 43291) and has over 42 years of practical experience in the estimation and evaluation of petroleum reserves. He graduated from Tennessee Technological University with a Master of Science degree in Mechanical Engineering. Mr. Wright meets or exceeds the education, training, and experience requirements set forth in the Standards Pertaining to the Estimating and Auditing of Oil and Gas Reserves Information promulgated by the Society of Petroleum Engineers; he is proficient in judiciously applying industry standard practices to engineering and geoscience evaluations as well as applying SEC and other industry reserves definitions and guidelines.
Reserve engineering is and must be recognized as a subjective process of estimating volumes of economically recoverable oil and natural gas that cannot be measured in an exact manner. The accuracy of any reserve estimate is a function of the quality of available data and of engineering and geological interpretation. As a result, the estimates of different engineers often vary. In addition, the results of drilling, testing and production may justify revisions of such estimates. Accordingly, reserve estimates often differ from the quantities of oil and natural gas, NGLs and oil that are ultimately recovered. Estimates of economically recoverable natural gas, NGLs and oil and of future net revenues are based on a number of variables and assumptions, all of which may vary from actual results, including geologic interpretation, prices and future production rates and costs. Please read "Risk Factors" appearing elsewhere in this prospectus.
129
Determination of Identified Drilling Locations
Our identified drilling locations, which include both drillable and estimated locations, are those drilling locations identified by management based on the following criteria:
Drillable locations — These are mapped locations that our reserve engineers have deemed to have a high likelihood of being drilled or are currently in development but have not yet commenced production. As of June 30, 2016, we had 646, 210, 153 and 229 drillable locations associated with our Marcellus Shale, Upper Devonian Shale, Utica Shale and Barnett Shale acreage, respectively.
Estimated locations — For our Appalachian Basin acreage, we currently anticipate full development at approximately 115 gross acre spacing for the Marcellus Shale. Assuming this spacing, the remaining acreage yields 123 additional gross Marcellus Shale locations. While we believe that our Appalachian Basin acreage is prospective for the Upper Devonian Shale and Utica Shales, our reserve engineers have deemed further de-risking is necessary to include estimated locations for these reservoirs. The acreage totals outside of our mapped drillable inventory areas are 40,798 and 28,709 gross acres for the Upper Devonian and Utica Shales, respectively.
Production, Revenues and Price History
The following table sets forth information regarding our production, revenues and realized prices, and production costs for the years ended December 31, 2015 and 2014, for our predecessor, Vantage I and the two entities on a combined basis giving effect to the reorganization transactions described under "Corporate Reorganization". For additional information on price calculations, please see information set forth in "Management's Discussion and Analysis of Financial Condition and Results of Operations".
|
| Year Ended December 31, |
| ||||
| | | | | | | ||
|
| 2015 | | 2014 |
| ||
| | | | | | | ||
Predecessor: |
| | | ||||
Production data: |
| | | ||||
Natural gas (Bcf) |
| 41 | | 15 | | ||
Average daily combined production (MMcfe/d) |
| 113 | | 40 | | ||
Average sales prices: |
| | | ||||
Average natural gas sales prices before effects of cash settled derivatives (per Mcfe)(1) |
| $ | 1.58 | | $ | 2.97 | |
Average natural gas sales prices after effects of cash settled derivatives (per Mcfe)(1) |
| $ | 2.23 | | $ | 3.05 | |
Average costs per Mcf: |
| | | ||||
Lease operating and workover expenses |
| $ | 0.12 | | $ | 0.17 | |
Marketing and gathering |
| $ | 0.24 | | $ | 0.36 | |
Production and ad valorem taxes |
| $ | 0.05 | | $ | 0.12 | |
Depreciation, depletion, amortization and accretion |
| $ | 0.96 | | $ | 1.25 | |
General and administrative |
| $ | 0.18 | | $ | 0.37 | |
130
Vantage I: |
| | | ||||
Production data: |
| | | ||||
Marcellus Shale: |
| | | ||||
Natural gas (Bcf) |
| 21 | | 12 | | ||
NGLs (MBbl) |
| — | | — | | ||
Oil (MBbl) |
| — | | — | | ||
Total combined production (Bcfe) |
| 21 | | 12 | | ||
Average daily combined production (MMcfe/d) |
| 59 | | 32 | | ||
Barnett Shale: |
| | | ||||
Natural gas (Bcf) |
| 20 | | 12 | | ||
NGLs (MBbl) |
| 796 | | 563 | | ||
Oil (MBbl) |
| 73 | | 106 | | ||
Total combined production (Bcfe) |
| 25 | | 16 | | ||
Average daily combined production (MMcfe/d) |
| 68 | | 45 | | ||
Total: |
| | | ||||
Natural gas (Bcf) |
| 41 | | 24 | | ||
NGLs (MBbl) |
| 796 | | 563 | | ||
Oil (MBbl) |
| 74 | | 108 | | ||
Total combined production (Bcfe) |
| 46 | | 28 | | ||
Average daily combined production (MMcfe/d) |
| 127 | | 77 | | ||
Average sales prices: |
| | | ||||
Natural gas (per Mcf) |
| $ | 1.78 | | $ | 3.16 | |
NGLs (per Bbl) |
| $ | 10.45 | | $ | 24.56 | |
Oil (per Bbl) |
| $ | 41.00 | | $ | 87.35 | |
Combined average sales prices before effects of cash settled derivatives (per Mcfe)(1) |
| $ | 1.82 | | $ | 3.54 | |
Combined average sales prices after effects of cash settled derivatives (per Mcfe)(1) |
| $ | 3.62 | | $ | 3.53 | |
Average costs per Mcfe: |
| | | ||||
Lease operating and workover expenses |
| $ | 0.39 | | $ | 0.55 | |
Marketing and gathering |
| $ | 0.12 | | $ | 0.26 | |
Production and ad valorem taxes |
| $ | 0.10 | | $ | 0.24 | |
Depreciation, depletion, amortization and accretion |
| $ | 1.08 | | $ | 1.34 | |
General and administrative |
| $ | 0.13 | | $ | 0.31 | |
Combined: |
| | | ||||
Production data: |
| | | ||||
Marcellus Shale: |
| | | ||||
Natural gas (Bcf) |
| 63 | | 26 | | ||
NGLs (MBbl) |
| — | | — | | ||
Oil (MBbl) |
| — | | — | | ||
Total combined production (Bcfe) |
| 63 | | 26 | | ||
Average daily combined production (MMcfe/d) |
| 172 | | 73 | | ||
Barnett Shale: |
| | | ||||
Natural gas (Bcf) |
| 20 | | 12 | | ||
NGLs (MBbl) |
| 796 | | 563 | | ||
Oil (MBbl) |
| 73 | | 106 | | ||
Total combined production (Bcfe) |
| 25 | | 16 | | ||
Average daily combined production (MMcfe/d) |
| 68 | | 45 | | ||
Total: |
| | | ||||
Natural gas (Bcf) |
| 82 | | 39 | | ||
NGLs (MBbl) |
| 796 | | 563 | | ||
Oil (MBbl) |
| 74 | | 108 | | ||
Total combined production (Bcfe) |
| 88 | | 43 | | ||
Average daily combined production (MMcfe/d) |
| 240 | | 118 | | ||
131
Average sales prices: |
| | | ||||
Natural gas (per Mcf) |
| $ | 1.68 | | $ | 3.09 | |
NGLs (per Bbl) |
| $ | 10.45 | | $ | 24.56 | |
Oil (per Bbl) |
| $ | 41.00 | | $ | 87.35 | |
Combined average sales prices before effects of cash settled derivatives (per Mcfe)(1) |
| $ | 1.71 | | $ | 3.34 | |
Combined average sales prices after effects of cash settled derivatives (per Mcfe)(1) |
| $ | 2.97 | | $ | 3.36 | |
Average costs per Mcfe: |
| | | ||||
Lease operating and workover expenses |
| $ | 0.26 | | $ | 0.42 | |
Marketing and gathering |
| $ | 0.17 | | $ | 0.29 | |
Production and ad valorem taxes |
| $ | 0.08 | | $ | 0.20 | |
Depreciation, depletion, amortization and accretion |
| $ | 1.03 | | $ | 1.31 | |
General and administrative |
| $ | 0.15 | | $ | 0.33 | |
- (1)
- Average sales prices shown reflect both the before and after effects of our cash settled derivatives. Our calculation of such effects includes realized gains or losses on cash settlements for commodity derivatives, which do not qualify for hedge accounting because we do not designate them as hedges.
Productive Wells
The following table sets forth information regarding productive wells as of June 30, 2016 for our predecessor, Vantage I and on a combined basis:
|
| Productive Wells |
| Average Working |
| |||||||||
| | | | | | | | | | | |||||
|
| Gross | | Net | | Interest |
| |||||||
| | | | | | | | | |||||||
Predecessor: |
| | | | | | | | ||||||
Natural gas |
| | 82.0 | | | 47.7 | | | 58.2 | % | | |||
Vantage I: |
| | | | | | | | ||||||
Oil |
| | 6.0 | | | 4.0 | | | 66.3 | % | | |||
Natural gas |
| | 324.0 | | | 251.7 | | | 77.7 | % | | |||
Total |
| | 330.0 | | | 255.6 | | | 77.5 | % | | |||
Combined: |
| | | | | | | | ||||||
Oil |
| | 6.0 | | | 4.0 | | | 66.3 | % | | |||
Natural gas |
| | 363.0 | | | 299.4 | | | 82.5 | % | | |||
Total |
| | 369.0 | | | 303.4 | | | 82.2 | % | | |||
132
Acreage
The following table sets forth certain information regarding the total developed and undeveloped surface acreage in which we owned an interest as of June 30, 2016 at our predecessor, Vantage I and on a combined basis.
|
| Developed Acres |
| Undeveloped Acres |
| Total Acres |
| ||||||||||||
| | | | | | | | | | | | | | | ||||||
|
| Gross | | Net | | Gross | | Net | | Gross | | Net |
| ||||||
| | | | | | | | | | | | | | | ||||||
Predecessor: |
| | | | | | | ||||||||||||
Appalachian Basin(1) |
| 10,036 | | 6,942 | | 85,648 | | 63,689 | | 95,684 | | 70,631 | | ||||||
Vantage I: |
| | | | | | | ||||||||||||
Appalachian Basin |
| 6,198 | | 3,018 | | 30,637 | | 14,985 | | 36,835 | | 18,003 | | ||||||
Barnett Shale |
| 11,996 | | 10,124 | | 32,918 | | 27,357 | | 44,914 | | 37,481 | | ||||||
Uinta, Piceance and other |
| 126 | | 126 | | 79,698 | | 58,341 | | 79,824 | | 58,467 | | ||||||
| | | | | | | | | | | | | | | ||||||
Combined: |
| | | | | | | ||||||||||||
Appalachian Basin(1) |
| 16,234 | | 9,960 | | 116,285 | | 78,674 | | 132,519 | | 88,634 | | ||||||
Barnett Shale |
| 11,996 | | 10,124 | | 32,918 | | 27,357 | | 44,914 | | 37,481 | | ||||||
Uinta, Piceance and other |
| 126 | | 126 | | 79,698 | | 58,341 | | 79,824 | | 58,467 | | ||||||
| | | | | | | | | | | | | | | ||||||
Total |
| 28,356 | | 20,210 | | 228,901 | | 164,372 | | 257,257 | | 184,582 | | ||||||
| | | | | | | | | | | | | | | ||||||
| | | | | | | | | | | | | | | ||||||
| | | | | | | | | | | | | | | ||||||
- (1)
- Includes 1,554 developed fee acres leased to third parties.
Certain of our undeveloped acreage is held by production ("HBP"), ongoing operations ("HBO") or through fee mineral ownership. Approximately 31% of our Appalachian Basin acreage and 93% of our Barnett Shale acreage was held by production at June 30, 2016. The following table sets forth the amount of our net acreage that is held as of June 30, 2016 by our predecessor, Vantage I and on a combined basis.
| |
| HBP |
| HBO |
| Fee Minerals |
| Total Held |
| ||||||||||||||||
|---|---|---|---|---|---|---|---|---|---|---|---|---|---|---|---|---|---|---|---|---|---|---|---|---|---|
| | | | | | | | | | | | | | | | | | | ||||||||
|
| Net Acres |
| % | | Net Acres |
| % | | Net Acres |
| % | | Net Acres |
| % |
| ||||||||
| | | | | | | | | | | | | | | | | | | ||||||||
Predecessor: |
| | | | | | | | | ||||||||||||||||
Appalachian Basin |
| 16,341 | | 23 | % | 15,837 | | 22 | % | 12,549 | | 18 | % | 44,727 | | 63 | % | ||||||||
Vantage I: |
| | | | | | | | | ||||||||||||||||
Appalachian Basin |
| 10,800 | | 60 | % | 2,233 | | 12 | % | 1,093 | | 6 | % | 14,126 | | 78 | % | ||||||||
Barnett Shale |
| 35,024 | | 93 | % | — | | — | | — | | — | | 35,024 | | 93 | % | ||||||||
Uinta, Piceance and other |
| 10,023 | | 17 | % | — | | — | | — | | — | | 10,023 | | 17 | % | ||||||||
| | | | | | | | | | | | | | | | | | | ||||||||
Combined: |
| | | | | | | | | ||||||||||||||||
Appalachian Basin |
| 27,141 | | 31 | % | 18,070 | | 20 | % | 13,642 | | 15 | % | 58,853 | | 66 | % | ||||||||
Barnett Shale |
| 35,024 | | 93 | % | — | | — | | — | | — | | 35,024 | | 93 | % | ||||||||
Uinta, Piceance and other |
| 10,023 | | 17 | % | — | | — | | — | | — | | 10,023 | | 17 | % | ||||||||
| | | | | | | | | | | | | | | | | | | ||||||||
Total |
| 72,188 | | 39 | % | 18,070 | | 10 | % | 13,642 | | 7 | % | 103,900 | | 56 | % | ||||||||
| | | | | | | | | | | | | | | | | | | ||||||||
| | | | | | | | | | | | | | | | | | | ||||||||
| | | | | | | | | | | | | | | | | | | ||||||||
Undeveloped Acreage Expirations
The following table sets forth the number of total net undeveloped acres as of June 30, 2016 at our predecessor, Vantage I and on a combined basis that will expire in 2016, 2017, 2018, 2019 and 2020 unless production is established within the spacing units covering the acreage prior to the expiration dates or unless such leasehold rights are extended or renewed. We have not
133
attributed any PUD reserves to acreage for which the expiration date precedes the scheduled date for PUD drilling. In addition, we do not anticipate material delay rental or lease extension payments in connection with such acreage.
|
| 2016 | | 2017 | | 2018 | | 2019 | | 2020+ | | |||||||
Predecessor: |
| | | | | | | | ||||||||||
Appalachian Basin |
| 2,705 | | 4,673 | | 5,344 | | 6,277 | | | 6,905 | | | |||||
Vantage I: |
| | | | | | | | ||||||||||
Appalachian Basin |
| 473 | | 1,587 | | 1,157 | | 470 | | | 190 | | | |||||
Barnett Shale |
| 666 | | 663 | | 464 | | 217 | | | 447 | | | |||||
Uinta, Piceance and other |
| 541 | | 5,280 | | 41,446 | | 511 | | | 666 | | | |||||
| | | | | | | | | | | | | |||||||
Total |
| 1,680 | | 7,530 | | 43,067 | | 1,198 | | | 1,303 | | | |||||
| | | | | | | | | | | | | |||||||
| | | | | | | | | | | | | | | |||||
| | | | | | | | | | | | | |||||||
Combined: |
| | | | | | | | ||||||||||
Appalachian Basin |
| 3,178 | | 6,260 | | 6,501 | | 6,747 | | | 7,095 | | | |||||
Barnett Shale |
| 666 | | 663 | | 464 | | 217 | | | 447 | | | |||||
Uinta, Piceance and other |
| 541 | | 5,280 | | 41,446 | | 511 | | | 666 | | | |||||
| | | | | | | | | | | | | |||||||
Total |
| 4,385 | | 12,203 | | 48,411 | | 7,475 | | | 8,208 | | | |||||
| | | | | | | | | | | | | |||||||
| | | | | | | | | | | | | | | |||||
| | | | | | | | | | | | | |||||||
Drilling Activity
The following table describes the development and exploratory wells drilled on our acreage by our predecessor, Vantage I and on a combined basis during the years ended December 31, 2014 and 2015:
|
| 2014 | | 2015 |
| ||||||||||||
| | | | | | | | | | | ||||||||
|
| Productive Wells |
| Productive Wells |
| ||||||||||||
| | | | | | | | | | | ||||||||
|
| Gross | | Net | | Gross | | Net |
| ||||||||
| | | | | | | | | | | ||||||||
Predecessor: |
| | | | | | | | | ||||||||
Appalachian Basin: |
| | | | | | | | | ||||||||
Development |
| | 23.0 | | | 16.1 | | | 18.0 | | | 11.2 | | ||||
Exploratory |
| | — | | | — | | | — | | | — | | ||||
| | | | | | | | | | | ||||||||
Total |
| | 23.0 | | | 16.1 | | | 18.0 | | | 11.2 | | ||||
| | | | | | | | | | | ||||||||
| | | | | | | | | | | | | | | ||||
| | | | | | | | | | | ||||||||
Vantage I: |
| | | | | | | | | ||||||||
Total Vantage I: |
| | | | | | | | | ||||||||
Development |
| | 68.0 | | | 51.4 | | | 50.0 | | | 39.4 | | ||||
Exploratory |
| | — | | | — | | | — | | | — | | ||||
| | | | | | | | | | | ||||||||
Total |
| | 68.0 | | | 51.4 | | | 50.0 | | | 39.4 | | ||||
| | | | | | | | | | | ||||||||
| | | | | | | | | | | | | | | ||||
| | | | | | | | | | | ||||||||
Appalachian Basin: |
| | | | | | | | | ||||||||
Development |
| | 15.0 | | | 8.0 | | | 16.0 | | | 6.4 | | ||||
Exploratory |
| | — | | | — | | | — | | | — | | ||||
| | | | | | | | | | | ||||||||
Total |
| | 15.0 | | | 8.0 | | | 16.0 | | | 6.4 | | ||||
| | | | | | | | | | | ||||||||
| | | | | | | | | | | | | | | ||||
| | | | | | | | | | | ||||||||
Barnett Shale: |
| | | | | | | | | ||||||||
Development |
| | 53.0 | | | 43.5 | | | 34.0 | | | 33.0 | | ||||
Exploratory |
| | — | | | — | | | — | | | — | | ||||
| | | | | | | | | | | ||||||||
Total |
| | 53.0 | | | 43.5 | | | 34.0 | | | 33.0 | | ||||
| | | | | | | | | | | ||||||||
| | | | | | | | | | | | | | | ||||
| | | | | | | | | | | ||||||||
Combined: |
| | | | | | | | | ||||||||
Development |
| | 77.0 | | | 67.5 | | | 52.0 | | | 50.7 | | ||||
Exploratory |
| | — | | | — | | | — | | | — | | ||||
| | | | | | | | | | | ||||||||
Total |
| | 77.0 | | | 67.5 | | | 52.0 | | | 50.7 | | ||||
| | | | | | | | | | | ||||||||
| | | | | | | | | | | | | | | ||||
| | | | | | | | | | | ||||||||
134
In 2015 we drilled 52 gross (50.7 net) horizontal shale wells, all of which are currently producing. We did not drill any dry holes during 2014 or 2015.
Major Customers
For the year ended December 31, 2015, Asset Risk Management, South Jersey Industries, Targa Resources and ETC Marketing represented 29%, 20%, 12%, and 12% of our total sales, respectively. For the year ended December 31, 2014, sales to Sequent Energy Services, Targa Resources, ETC Marketing and EQT represented 34%, 17%, 12% and 10% of our total sales, respectively. During such years, no other purchaser accounted for 10% or more of our revenue. Although a substantial portion of production is purchased by these major customers, we do not believe the loss of one or several customers would have a material adverse effect on our business, as other customers or markets would be accessible to us. However, if we lose one or several of these customers, there is no guarantee that we will be able to enter into an agreement with a new customer which is as favorable as our current agreements.
Title to Properties
In the course of acquiring the rights to develop oil and natural gas, it is standard procedure for us and the lessor to execute a lease agreement with payment subject to title verification. In most cases, we incur the expense of retaining lawyers to verify the rightful owners of the oil and gas interests prior to payment of such lease bonus to the lessor. There is no certainty, however, that a lessor has valid title to their lease's oil and gas interests. In those cases, such leases are generally voided and payment is not remitted to the lessor. As such, title failures may result in fewer net acres to us. As is customary in the industry, in the case of undeveloped properties, often cursory investigation of record title is made at the time of lease acquisition. Investigations are made before the consummation of an acquisition of producing properties and before commencement of drilling operations on undeveloped properties. Individual properties may be subject to burdens that we believe do not materially interfere with the use or affect the value of the properties. Burdens on properties may include:
- •
- customary royalty interests;
- •
- liens incident to operating agreements and for current taxes;
- •
- obligations or duties under applicable laws;
- •
- development obligations under natural gas leases; or
- •
- net profits interests.
Seasonality
Demand for natural gas generally decreases during the spring and fall months and increases during the summer and winter months. However, seasonal anomalies such as mild winters or mild summers sometimes lessen this fluctuation. In addition, certain natural gas users utilize natural gas storage facilities and purchase some of their anticipated winter requirements during the summer. This can also lessen seasonal demand fluctuations. These seasonal anomalies can increase competition for equipment, supplies and personnel during the spring and summer months, which could lead to shortages and increase costs or delay our operations.
Competition
The oil and natural gas industry is intensely competitive, and we compete with other companies in our industry that have greater resources than we do. Many of these companies not
135
only explore for and produce natural gas, but also carry on refining operations and market petroleum and other products on a regional, national or worldwide basis. These companies may be able to pay more for productive natural gas properties and exploratory prospects or define, evaluate, bid for and purchase a greater number of properties and prospects than our financial or human resources permit and may be able to expend greater resources to attract and maintain industry personnel. In addition, these companies may have a greater ability to continue exploration activities during periods of low natural gas market prices. Our larger competitors may be able to absorb the burden of existing, and any changes to, federal, state and local laws and regulations more easily than we can, which would adversely affect our competitive position. Our ability to acquire additional properties and to discover reserves in the future will be dependent upon our ability to evaluate and select suitable properties and to consummate transactions in a highly competitive environment. In addition, because we have fewer financial and human resources than many companies in our industry, we may be at a disadvantage in bidding for exploratory prospects and producing natural gas properties.
There is also competition between natural gas producers and other industries producing energy and fuel. Furthermore, competitive conditions may be substantially affected by various forms of energy legislation and/or regulation considered from time to time by the governments of the United States and the jurisdictions in which we operate. It is not possible to predict the nature of any such legislation or regulation which may ultimately be adopted or its effects upon our future operations. Such laws and regulations may substantially increase the costs of developing oil and natural gas and may prevent or delay the commencement or continuation of a given operation. Our larger competitors may be able to absorb the burden of existing, and any changes to, federal, state and local laws and regulations more easily than we can, which would adversely affect our competitive position.
Regulation of the Oil and Natural Gas Industry
Our operations are substantially affected by federal, state and local laws and regulations. In particular, natural gas production and related operations are, or have been, subject to price controls, taxes and numerous other laws and regulations. All of the jurisdictions in which we own or operate producing natural gas and oil properties have statutory provisions regulating the exploration for and production of natural gas and oil, including provisions related to permits for the drilling of wells, bonding requirements to drill or operate wells, the location of wells, the method of drilling and casing wells, the surface use and restoration of properties upon which wells are drilled, sourcing and disposal of water used in the drilling and completion process, and the abandonment of wells. Our operations are also subject to various conservation laws and regulations. These include the regulation of the size of drilling and spacing units or proration units, the number of wells which may be drilled in an area, and the unitization or pooling of crude oil or natural gas wells, as well as regulations that generally prohibit the venting or flaring of natural gas, and impose certain requirements regarding the ratability or fair apportionment of production from fields and individual wells.
Failure to comply with applicable laws and regulations can result in substantial penalties. The regulatory burden on the industry increases the cost of doing business and affects profitability. Although we believe we are in substantial compliance with all applicable laws and regulations, such laws and regulations are frequently amended or reinterpreted. Therefore, we are unable to predict the future costs or impact of compliance. Additional proposals and proceedings that affect the natural gas industry are regularly considered by Congress, the states, the FERC, and the courts. We cannot predict when or whether any such proposals may become effective.
We believe we are in substantial compliance with currently applicable laws and regulations and that continued substantial compliance with existing requirements will not have a material
136
adverse effect on our financial position, cash flows or results of operations. However, current regulatory requirements may change, currently unforeseen environmental incidents may occur or past non-compliance with environmental laws or regulations may be discovered.
Regulation of Production of Natural Gas and Oil
The production of natural gas and oil is subject to regulation under a wide range of local, state and federal statutes, rules, orders and regulations. Federal, state and local statutes and regulations require permits for drilling operations, drilling bonds and reports concerning operations. All of the states in which we own and operate properties have regulations governing conservation matters, including provisions for the unitization or pooling of natural gas and oil properties, the establishment of maximum allowable rates of production from natural gas and oil wells, the regulation of well spacing or density, and plugging and abandonment of wells. The effect of these regulations is to limit the amount of natural gas and oil that we can produce from our wells and to limit the number of wells or the locations at which we can drill, although we can apply for exceptions to such regulations or to have reductions in well spacing or density. Moreover, each state generally imposes a production or severance tax with respect to the production and sale of oil, natural gas and NGLs within its jurisdiction.
We own interests in properties located onshore in seven U.S. states. These states regulate drilling and operating activities by requiring, among other things, permits for the drilling of wells, maintaining bonding requirements in order to drill or operate wells, and regulating the location of wells, the method of drilling and casing wells, the surface use and restoration of properties upon which wells are drilled and the plugging and abandonment of wells. The laws of these states also govern a number of environmental and conservation matters, including the handling and disposing or discharge of waste materials, the size of drilling and spacing units or proration units and the density of wells that may be drilled, unitization and pooling of oil and gas properties and establishment of maximum rates of production from oil and gas wells. Some states have the power to prorate production to the market demand for oil and gas.
The failure to comply with these rules and regulations can result in substantial penalties. Our competitors in the oil and natural gas industry are subject to the same regulatory requirements and restrictions that affect our operations.
Regulation of Transportation and Sales of Natural Gas
Historically, the transportation and sale for resale of natural gas in interstate commerce have been regulated by agencies of the U.S. federal government, primarily FERC. FERC regulates interstate natural gas transportation rates and service conditions, which affects the marketing of natural gas that we produce, as well as the revenues we receive for sales of our natural gas. Since 1985, FERC has endeavored to make natural gas transportation more accessible to natural gas buyers and sellers on an open and non-discriminatory basis. FERC has stated that open access policies are necessary to improve the competitive structure of the interstate natural gas pipeline industry and to create a regulatory framework that will put natural gas sellers into more direct contractual relations with natural gas buyers by, among other things, unbundling the sale of natural gas from the sale of transportation and storage services.
In the past, the federal government has regulated the prices at which natural gas could be sold. While sales by producers of natural gas can currently be made at uncontrolled market prices, Congress could reenact price controls in the future. Deregulation of wellhead natural gas sales began with the enactment of the Natural Gas Policy Act ("NGPA"), and culminated in adoption of the Natural Gas Wellhead Decontrol Act which removed controls affecting wellhead sales of natural gas effective January 1, 1993. The transportation and sale for resale of natural gas in interstate
137
commerce is regulated primarily under the NGA, and by regulations and orders promulgated under the NGA by FERC. In certain limited circumstances, intrastate transportation and wholesale sales of natural gas may also be affected directly or indirectly by laws enacted by Congress and by FERC regulations.
Beginning in 1992, FERC issued a series of orders to implement its open access policies. As a result, the interstate pipelines' traditional role as wholesalers of natural gas has been greatly reduced and replaced by a structure under which pipelines provide transportation and storage service on an open access basis to others who buy and sell natural gas. Although FERC's orders do not directly regulate natural gas producers, they are intended to foster increased competition within all phases of the natural gas industry.
The EPAct 2005, is a comprehensive compilation of tax incentives, authorized appropriations for grants and guaranteed loans, and significant changes to the statutory policy that affects all segments of the energy industry. Among other matters, the EPAct 2005 amends the NGA to add an anti-market manipulation provision which makes it unlawful for any entity to engage in prohibited behavior to be prescribed by FERC, and furthermore provides FERC with additional civil penalty authority. The EPAct 2005 provides FERC with the power to assess civil penalties of up to $1,000,000 per day for violations of the NGA and increases FERC's civil penalty authority under the NGPA from $5,000 per violation per day to $1,000,000 per violation per day. The civil penalty provisions are applicable to entities that engage in the sale of natural gas for resale in interstate commerce. On January 19, 2006, FERC issued Order No. 670, a rule implementing the anti-market manipulation provision of the EPAct 2005. The rules make it unlawful: (1) in connection with the purchase or sale of natural gas subject to the jurisdiction of FERC, or the purchase or sale of transportation services subject to the jurisdiction of FERC, for any entity, directly or indirectly, to use or employ any device, scheme or artifice to defraud; (2) to make any untrue statement of material fact or omit to make any such statement necessary to make the statements made not misleading; or (3) to engage in any act or practice that operates as a fraud or deceit upon any person. The anti-market manipulation rule does not apply to activities that relate only to intrastate or other non-jurisdictional sales or gathering, but does apply to activities of gas pipelines and storage companies that provide interstate services, as well as otherwise non-jurisdictional entities to the extent the activities are conducted "in connection with" gas sales, purchases or transportation subject to FERC jurisdiction, which now includes the annual reporting requirements under Order 704.
On December 26, 2007, FERC issued Order 704, a final rule on the annual natural gas transaction reporting requirements, as amended by subsequent orders on rehearing. Under Order 704, wholesale buyers and sellers of more than 2.2 million MMBtus of physical natural gas in the previous calendar year, including natural gas gatherers and marketers, are now required to report, on May 1 of each year, aggregate volumes of natural gas purchased or sold at wholesale in the prior calendar year to the extent such transactions utilize, contribute to, or may contribute to the formation of price indices. It is the responsibility of the reporting entity to determine which individual transactions should be reported based on the guidance of Order 704. Order 704 also requires market participants to indicate whether they report prices to any index publishers, and if so, whether their reporting complies with FERC's policy statement on price reporting.
We cannot accurately predict whether FERC's actions will achieve the goal of increasing competition in markets in which our natural gas is sold. Additional proposals and proceedings that might affect the natural gas industry are pending before FERC and the courts. The natural gas industry historically has been very heavily regulated. Therefore, we cannot provide any assurance that the less stringent regulatory approach recently established by FERC will continue. However, we do not believe that any action taken will affect us in a way that materially differs from the way it affects other natural gas producers.
138
Gathering service, which occurs upstream of jurisdictional transmission services, is regulated by the states onshore and in state waters. Although its policy is still in flux, FERC has reclassified certain jurisdictional transmission facilities as non-jurisdictional gathering facilities, which has the tendency to increase our costs of getting gas to point of sale locations. State regulation of natural gas gathering facilities generally include various safety, environmental and, in some circumstances, nondiscriminatory-take requirements. Although such regulation has not generally been affirmatively applied by state agencies, natural gas gathering may receive greater regulatory scrutiny in the future.
Section 1(b) of the NGA exempts natural gas gathering facilities from regulation by FERC as a natural gas company under the NGA. We believe that the natural gas pipelines in our gathering systems meet the traditional tests FERC has used to establish a pipeline's status as a gatherer not subject to regulation as a natural gas company. However, the distinction between FERC-regulated transmission services and federally unregulated gathering services is the subject of ongoing litigation, so the classification and regulation of our gathering facilities are subject to change based on future determinations by FERC, the courts or Congress.
Our sales of natural gas are also subject to requirements under the Commodity Exchange Act ("CEA"), and regulations promulgated thereunder by the Commodity Futures Trading Commission ("CFTC"). The CEA prohibits any person from manipulating or attempting to manipulate the price of any commodity in interstate commerce or futures on such commodity. The CEA also prohibits knowingly delivering or causing to be delivered false or misleading or knowingly inaccurate reports concerning market information or conditions that affect or tend to affect the price of a commodity.
Intrastate natural gas transportation is also subject to regulation by state regulatory agencies. The basis for intrastate regulation of natural gas transportation and the degree of regulatory oversight and scrutiny given to intrastate natural gas pipeline rates and services varies from state to state. Insofar as such regulation within a particular state will generally affect all intrastate natural gas shippers within the state on a comparable basis, we believe that the regulation of similarly situated intrastate natural gas transportation in any states in which we operate and ship natural gas on an intrastate basis will not affect our operations in any way that is of material difference from those of our competitors. Like the regulation of interstate transportation rates, the regulation of intrastate transportation rates affects the marketing of natural gas that we produce, as well as the revenues we receive for sales of our natural gas.
Changes in law and to FERC policies and regulations may adversely affect the availability and reliability of firm and/or interruptible transportation service on interstate pipelines, and we cannot predict what future action FERC will take. We do not believe, however, that any regulatory changes will affect us in a way that materially differs from the way they will affect other natural gas producers, gatherers and marketers with which we compete.
Regulation of Pipeline Safety and Maintenance
Some of our pipelines are subject to regulation by the Pipeline and Hazardous Materials Safety Administration ("PHMSA") under the Natural Gas Pipeline Safety Act ("NGPSA") with respect to natural gas, and the Hazardous Liquids Pipeline Safety Act ("HLPSA") with respect to natural gas liquids ("NGLs") and condensates. The NGPSA and HLPSA, as amended, govern the design, installation, testing, construction, operation, replacement and management of natural gas as well as crude oil, NGLs and condensate pipeline facilities. Pursuant to these acts, PHMSA has promulgated regulations governing pipeline wall thickness, design pressures, maximum operating pressures, pipeline patrols and leak surveys, minimum depth requirements, and emergency procedures, as well as other matters intended to ensure adequate protection for the public and to prevent accidents and failures. Additionally, PHMSA has established a series of rules requiring pipeline
139
operators to develop and implement integrity management programs for gas transmission and hazardous liquid pipelines that, in the event of a pipeline leak or rupture, could affect "high consequence areas", which are areas where a release could have the most significant adverse consequences, including high-population areas, certain drinking water sources and unusually sensitive ecological areas. Compliance with these laws and regulations could result in increased costs.
The passage of the Pipeline Safety, Regulatory Certainty, and Job Creation Act of 2011 ("2011 Pipeline Safety Act") requires PHMSA to promulgate rules or standards relating to expanded integrity management requirements, automatic or remote-controlled valve use, excess flow valve use, leak detection system installation, testing to confirm that the material strength of certain pipelines are above 30% of specified minimum yield strength, and operator verification of records confirming the maximum allowable pressure of certain intrastate gas transmission pipelines. Failure to comply with pipeline safety regulations can result in fines of up to $200,000 per violation per day of violation and up to $2 million for a related series of violations. The safety enhancement requirements and other provisions of the 2011 Pipeline Safety Act as well as any implementation of PHMSA rules thereunder or any issuance or reinterpretation of PHMSA guidance with respect thereto could require us to install new or modified safety controls, pursue additional capital projects or conduct maintenance programs on an accelerated basis, any or all of which tasks could result in increased operating costs that could be significant and have a material adverse effect on our results of operations or financial position.
In March 2016, pursuant to one of the requirements in 2011 Pipeline Safety Act, PHMSA published a proposed rulemaking that would expand integrity management requirements and impose new pressure testing requirements on currently regulated pipelines. The proposal would also significantly expand the regulation of gathering lines, subjecting previously unregulated pipelines to requirements regarding damage prevention, corrosion control, public education programs, maximum allowable operating pressure limits, and other requirements. The safety enhancement requirements and other provisions of the 2011 Pipeline Safety Act as well as any implementation of PHMSA, rules thereunder could require us to install new or modified safety controls, pursue additional capital projects, or conduct maintenance programs on an accelerated basis, any or all of which tasks could result in our incurring increased operating costs that could have a material adverse effect on our results of operations or financial position.
States are largely preempted by federal law from regulating pipeline safety for interstate lines but most are certified by the DOT to assume responsibility for enforcing federal intrastate pipeline regulations and inspection of intrastate pipelines. In practice, because states can adopt stricter standards for intrastate pipelines that those imposed by the federal government for interstate lines, states vary considerably in their authority and capacity to address pipeline safety. We do not anticipate any significant difficulty in complying with applicable state laws and regulations, but we cannot guarantee that future compliance with new laws and regulations will not have an adverse effect on our operations.
Regulation of Environmental and Occupational Safety and Health Matters
General
Our operations are subject to numerous federal, regional, state, local, and other laws and regulations governing the discharge of materials into the environment or otherwise relating to environmental protection. Applicable U.S. federal environmental laws include, but are not limited to, the Comprehensive Environmental Response, Compensation, and Liability Act ("CERCLA"), the Clean Water Act ("CWA") and the Clean Air Act ("CAA"). These laws and regulations govern environmental cleanup standards, require permits for air, water, underground injection, solid and
140
hazardous waste disposal and set environmental compliance criteria. In addition, state and local laws and regulations set forth specific standards for drilling wells, the maintenance of bonding requirements in order to drill or operate wells, the spacing and location of wells, the method of drilling and casing wells, the surface use and restoration of properties upon which wells are drilled, the plugging and abandoning of wells, and the prevention and cleanup of pollutants and other matters. We maintain insurance against costs of clean-up operations, but we are not fully insured against all such risks. Additionally, Congress and federal and state agencies frequently revise environmental laws and regulations, and any changes that result in delay or more stringent and costly permitting, waste handling, disposal and clean-up requirements for the oil and gas industry could have a significant impact on our operating costs. Although future environmental obligations are not expected to have a material impact on the results of our operations or financial condition, there can be no assurance that future developments, such as increasingly stringent environmental laws or enforcement thereof, will not cause us to incur material environmental liabilities or costs.
Failure to comply with these laws and regulations may result in the assessment of administrative, civil and criminal fines and penalties and the imposition of injunctive relief. Accidental releases or spills may occur in the course of our operations, and we cannot be sure that we will not incur significant costs and liabilities as a result of such releases or spills, including any third-party claims for damage to property, natural resources or persons. Although we believe that we are in substantial compliance with applicable environmental laws and regulations and that continued compliance with existing requirements will not have a material adverse impact on us, there can be no assurance that this will continue in the future.
Hazardous Substances and Wastes
CERCLA, also known as the "Superfund law", imposes cleanup obligations, without regard to fault or the legality of the original conduct, on certain classes of persons that are considered to be responsible for the release of a "hazardous substance" into the environment. These persons include the owner or operator of the disposal site or sites where the release occurred and companies that transported or disposed or arranged for the transport or disposal of the hazardous substances found at the site. Persons who are or were responsible for releases of hazardous substances under CERCLA and any state analogs, such as Pennsylvania's Hazardous Sites Cleanup Act, may be subject to joint and several liability for the costs of cleaning up the hazardous substances that have been released into the environment and for damages to natural resources, and it is not uncommon for neighboring landowners and other third parties to file corresponding common law claims for personal injury and property damage allegedly caused by the hazardous substances released into the environment. While petroleum and crude oil fractions are not considered hazardous substances under CERCLA and its analog because of the so-called "petroleum exclusion", adulterated petroleum products containing other hazardous substances have been treated as hazardous substances in the past.
The Resource Conservation and Recovery Act ("RCRA") regulates the generation and disposal of wastes. RCRA specifically excludes from the definition of hazardous waste "drilling fluids, produced waters and other wastes associated with the exploration, development or production of crude oil, natural gas or geothermal energy". However, legislation has been proposed from time to time and environmental groups have filed lawsuits that, if successful, could result in the reclassification of certain natural gas and oil exploration and production wastes as "hazardous wastes", which would make such wastes subject to much more stringent handling, disposal and clean-up requirements. For example, in May 2016, several environmental groups filed a lawsuit in the U.S. District Court for the District of Columbia that seeks to compel the EPA to review and, if necessary, revise its regulations regarding existing exemptions for exploration and production related wastes. Any such changes in applicable laws and regulations could have a material adverse
141
effect on its capital expenditures and operating expenses. Moreover, some ordinary industrial wastes which we generate, such as paint wastes, waste solvents, laboratory wastes and waste oils, may be regulated as hazardous wastes if they are determined to have hazardous characteristics.
In addition, current and future regulations governing the handling and disposal of Naturally Occurring Radioactive Materials ("NORM") may affect our operations. For example, the Pennsylvania Department of Environmental Protection has asked operators to identify technologically enhanced NORM ("TENORM") in their processes, such as hydraulic fracturing sand. Local landfills only accept such waste when it meets their TENORM permit standards. As a result, we may have to locate out-of-state landfills to accept TENORM waste from time to time, potentially increasing our disposal costs.
Some of our leases may have had prior owners who commenced exploration and production of natural gas and oil operations on these sites. Although we have utilized operating and disposal practices that were standard in the industry at the time, hydrocarbons or other wastes may have been disposed of or released on or under the properties owned or leased by us on or under other locations where such wastes have been taken for disposal. In addition, a portion of these properties may have been operated by third parties whose treatment and disposal or release of wastes was not under our control. These properties and the wastes disposed thereon may be subject to CERCLA, RCRA, and/or analogous state laws. Under such laws, we could be required to remove or remediate previously disposed wastes (including waste disposed of or released by prior owners or operators) or property contamination (including groundwater contamination by prior owners or operators), or to perform remedial plugging or closure operations to prevent future contamination.
The Clean Water Act
The CWA and its state analogues impose restrictions and strict controls with respect to the discharge of pollutants, including spills and leaks of oil and other substances, into waters of the United States. The discharge of pollutants into regulated waters is prohibited, except in accordance with the terms of a permit issued by the EPA, the Army Corps of Engineers (the "Corps") or an analogous state agency. The CWA and regulations implemented thereunder also prohibit the discharge of dredge and fill material into regulated waters, including jurisdictional wetlands, unless authorized by an appropriately issued permit. In September 2015, EPA and the Corps issued new rules defining the scope of the EPA's and the Corps' jurisdiction over wetlands. To the extent the rule expands the scope of the CWA's jurisdiction, we could face increased costs and delays with respect to obtaining permits for dredge and fill activities in wetland areas. The rule has been challenged in court on the grounds that it unlawfully expands the reach of CWA programs, and implementation of the rule has been stayed pending resolution of the court challenge.
The process for obtaining permits has the potential to delay our operations. Spill prevention, control and countermeasure requirements of federal laws require appropriate containment berms and similar structures to help prevent the contamination of navigable waters by a petroleum hydrocarbon tank spill, rupture or leak. In addition, the CWA and analogous state laws require individual permits or coverage under general permits for discharges of storm water runoff from certain types of facilities. Federal and state regulatory agencies can impose administrative, civil and criminal penalties as well as other enforcement mechanisms for non-compliance with discharge permits or other requirements of the CWA and analogous state laws and regulations.
Hydraulic Fracturing
Hydraulic fracturing is an essential and common practice in the oil and gas industry used to stimulate production of natural gas and/or oil from low permeability subsurface rock formations. Hydraulic fracturing involves using water, sand, and certain chemicals to fracture the hydrocarbon-
142
bearing rock formation to allow flow of hydrocarbons into the wellbore. We regularly perform hydraulic fracturing as part of our operations. While hydraulic fracturing has historically been regulated by state oil and natural gas commissions, the practice has become increasingly controversial in certain parts of the country, resulting in increased scrutiny and regulation. For example, the EPA has asserted federal regulatory authority over certain hydraulic-fracturing activities under the SDWA involving the use of diesel fuels and published permitting guidance in February 2014 addressing the use of diesel in fracturing operations. Also, in May 2014 the EPA issued an Advanced Notice of Proposed Rulemaking to collect data on chemicals used in hydraulic fracturing operations under Section 8 of the Toxic Substances Control Act; the EPA has indicated that it intends to publish a final notice of proposed rulemaking in December 2016. Further, the EPA finalized regulations under the CWA in June 2016 prohibiting wastewater discharges from hydraulic fracturing and certain other natural gas operations to publicly owned wastewater treatment plants. Also, in June 2015, the EPA released its draft report on the potential impacts of hydraulic fracturing on drinking water resources. The EPA report concluded that hydraulic fracturing activities have not led to widespread, systemic impacts on drinking water resources in the United States, although there are above and below ground mechanisms by which hydraulic fracturing activities have the potential to impact drinking water resources. The draft report is expected to be finalized after a public comment period and a formal review by the EPA's Science Advisory Board. Finally, the U.S. Department of the Interior's Bureau of Land Management ("BLM") finalized rules in March 2015 that impose new or more stringent standards for performing hydraulic fracturing on federal and American Indian lands, though the U.S. District Court of Wyoming struck down this rule in June 2016. An appeal of this decision is pending.
Along with several other states, Pennsylvania, Texas, Colorado and Utah (where we conduct operations) have adopted laws and proposed regulations that require oil and natural gas operators to disclose chemical ingredients and water volumes used to hydraulically fracture wells, in addition to more stringent well construction and monitoring requirements. In addition, local governments may also adopt ordinances within their jurisdictions regulating the time, place and manner of drilling activities in general or hydraulic fracturing activities in particular or prohibit the performance of well drilling in general or hydraulic fracturing in particular. For example, the Pennsylvania Supreme Court has limited the state's ability to limit such ordinances at and strengthened the ability of municipalities to enact local ordinances regulating drilling activities. There are also numerous ballot measures being considered in Colorado, including measures granting greater autonomy to local governments to impose setback requirements for oil and gas facilities or ban certain businesses from operating in their jurisdictions. If new or more stringent federal, state, or local legal restrictions relating to the hydraulic fracturing process are adopted in areas where we operate, we could incur potentially significant added costs to comply with such requirements, experience delays or curtailment in the pursuit of exploration, development, or production activities, and perhaps even be precluded from drilling wells.
If hydraulic fracturing is further regulated at the federal state, or local level, our fracturing activities could become subject to additional permitting and financial assurance requirements, more stringent construction specifications, increased monitoring, reporting and recordkeeping obligations, plugging and abandonment requirements and also to attendant permitting delays and potential increases in costs. Such changes could cause us to incur substantial compliance costs, and compliance or the consequences of any failure to comply by us could have a material adverse effect on our financial condition and results of operations. At this time, it is not possible to estimate the impact on our business of newly enacted or potential legislation or regulation governing hydraulic fracturing, and any of the above risks could impair our ability to manage our business and have a material adverse effect on our operations, cash flows and financial position.
143
Waste Discharges
The CWA and its state analog impose restrictions and strict controls with respect to the discharge of pollutants, including spills and leaks of oil and other substances, into waters of the United States. The discharge of pollutants into regulated waters is prohibited, except in accordance with the terms of a permit issued by the EPA or an analogous state agency. The CWA and regulations implemented thereunder also prohibit the discharge of dredge and fill material into regulated waters, including jurisdictional wetlands, unless authorized by an appropriately issued permit. In September 2015, EPA and the Corps issued new rules defining the scope of the EPA's and the Corps' jurisdiction over wetlands. To the extent the rule expands the scope of the CWA's jurisdiction, we could face increased costs and delays with respect to obtaining permits for dredge and fill activities in wetland areas. The rule has been challenged in court on the grounds that it unlawfully expands the reach of CWA programs, and implementation of the rule has been stayed pending resolution of the court challenge. The process for obtaining permits has the potential to delay our operations. Spill prevention, control and countermeasure requirements of federal laws require appropriate containment berms and similar structures to help prevent the contamination of navigable waters by a petroleum hydrocarbon tank spill, rupture or leak. In addition, the CWA and analogous state laws require individual permits or coverage under general permits for discharges of storm water runoff from certain types of facilities. Federal and state regulatory agencies can impose administrative, civil and criminal penalties as well as other enforcement mechanisms for non-compliance with discharge permits or other requirements of the CWA and analogous state laws and regulations.
Air Emissions
The CAA and comparable state laws restrict the emission of air pollutants from many sources, including compressor stations, through the issuance of permits and the imposition of other requirements. These laws and regulations may require us to obtain pre-approval for the construction or modification of certain projects or facilities expected to produce or significantly increase air emissions, obtain and strictly comply with stringent air permit requirements or utilize specific equipment or technologies to control emissions of certain pollutants. The need to obtain permits has the potential to delay the development of oil and natural gas projects. Over the next several years, we may be required to incur certain capital expenditures for air pollution control equipment or other air emissions related issues. For example, For example, in May 2016, the EPA finalized rules regarding criteria for aggregating multiple small surface sites into a single source for air-quality permitting purposes applicable to the oil and gas industry. This rule could cause small facilities, on an aggregate basis, to be deemed a major source, thereby triggering more stringent air permitting requirements. In addition, in October 2015, the EPA lowered the National Ambient Air Quality Standard ("NAAQS") for ozone from 75 to 70 parts per billion. State implementation of the revised NAAQS could result in stricter permitting requirements, delay or prohibit our ability to obtain such permits, and result in increased expenditures for pollution control equipment, the costs of which could be significant. The EPA has also adopted new rules under the CAA that require the reduction of volatile organic compound emissions from certain fractured and refractured natural gas wells for which well completion operations are conducted and further require that most wells use reduced emission completions, also known as "green completions". These regulations also establish specific new requirements regarding emissions from production-related wet seal and reciprocating compressors, and from pneumatic controllers and storage vessels. Compliance with these and other air pollution control and permitting requirements has the potential to delay the development of oil and natural gas projects and increase our costs of development, which costs could be significant.
144
Climate Change
In response to findings that emissions of carbon dioxide, methane and other greenhouse gases ("GHGs") present an endangerment to public health and the environment, the EPA has adopted regulations under existing provisions of the CAA that, among other things, establish prevention of significant deterioration ("PSD") pre-construction and Title V operating permit reviews for certain large stationary sources. Facilities required to obtain PSD permits for their GHG emissions also will be required to meet "best available control technology" standards that will be established on a case-by-case basis. EPA rulemakings related to GHG emissions could adversely affect our operations and restrict or delay our ability to obtain air permits for new or modified sources. In addition, the EPA has adopted rules requiring the monitoring and reporting of GHG emissions from specified onshore and offshore oil and gas production sources in the United States on an annual basis, which include certain of our operations. Recently, in December 2015, the EPA finalized rules that added new sources to the scope of the greenhouse gases monitoring and reporting rule. These new sources include gathering and boosting facilities as well as completions and workovers from hydraulically fractured oil wells. The revisions also include the addition of well identification reporting requirements for certain facilities. Furthermore, in May 2016, the EPA finalized rules that establish new controls for emissions of methane from new, modified or reconstructed sources in the oil and natural gas source category, including production, processing, transmission and storage activities. The rule includes first-time standards to address emissions of methane from equipment and processes across the source category, including hydraulically fractured oil and natural gas well completions. The EPA has also announced that it intends to impose methane emission standards for existing sources as well but, to date, has not yet issued a proposal. The BLM has also proposed rules governing the emission of methane from oil and gas activities on federal lands. Several states, including Colorado and Pennsylvania, are pursuing similar measures to regulate emissions of methane from new and existing sources within the oil and natural gas source category. Compliance with these rules will require enhanced record-keeping practices, the purchase of new equipment, such as optical gas imaging instruments to detect leaks, and increased frequency of maintenance and repair activities to address emissions leakage. These rules will also likely require additional personnel time to support these activities or the engagement of third party contractors to assist with and verify compliance. These new and proposed rules could result in increased compliance costs on our operations.
While Congress has from time to time considered legislation to reduce emissions of GHGs, there has not been significant activity in the form of adopted legislation to reduce GHG emissions at the federal level in recent years. In the absence of such federal climate legislation, a number of state and regional efforts have emerged that are aimed at tracking and/or reducing GHG emissions by means of cap and trade programs that typically require major sources of GHG emissions, such as electric power plants, to acquire and surrender emission allowances in return for emitting those GHGs. Although it is not possible at this time to estimate how potential future laws or regulations addressing GHG emissions would impact our business, either directly or indirectly, any future federal, state or local laws or implementing regulations that may be adopted to address GHG emissions in areas where we operate could require us or our customers to incur increased operating costs. Regulation of GHGs could also result in a reduction in demand for and production of oil and natural gas, which would result in a decrease in demand for our services and adversely affect our financial position and results of operations. Finally, it should be noted that some scientists have concluded that increasing concentrations of GHGs in the Earth's atmosphere may produce climate changes that have significant physical effects, such as increased frequency and severity of storms, floods and other climatic events. If any such effects were to occur, they could adversely affect or delay demand for the oil or natural gas produced by our customers or otherwise cause us to incur significant costs in preparing for or responding to those effects.
145
National Environmental Policy Act
Oil and natural gas exploration and production activities on federal lands are subject to the National Environmental Policy Act ("NEPA"). NEPA requires federal agencies, including the Department of Interior, to evaluate major agency actions having the potential to significantly impact the environment. The process involves the preparation of either an environmental assessment or environmental impact statement depending on whether the specific circumstances surrounding the proposed federal action will have a significant impact on the human environment. The NEPA process involves public input through comments which can alter the nature of a proposed project either by limiting the scope of the project or requiring resource-specific mitigation. NEPA decisions can be appealed through the court system by process participants. This process may result in delaying the permitting and development of projects, increase the costs of permitting and developing some facilities and could result in certain instances in the cancellation of existing leases.
Endangered Species Act and Migratory Bird Treaty Act
The Endangered Species Act ("ESA") restricts activities that may affect endangered or threatened species of their habitats. Similar protections are offered to migratory birds under the Migratory Bird Treaty Act. While some of our operations may be located in areas that are designated as habitats for endangered or threatened species or that may attract migratory birds we believe that we are in substantial compliance with the ESA and the Migratory Bird Treaty Act, and we are not aware of any proposed ESA listings that will materially affect our operations. On February 11, 2016, the U.S. Fish and Wildlife Service published a final policy which alters how it identifies critical habitat for endangered and threatened species. A critical habitat designation could result in further material restrictions to federal and private land use and could delay or prohibit land access or development. Moreover, the U.S. Fish and Wildlife Service continues its six-year effort to make listing decisions and critical habitat designations where necessary for over 250 species before the end of the agency's 2017 fiscal year, as required under a 2011 settlement approved by the U.S. District Court for the District of Columbia, and many hundreds of additional anticipated listing decisions have already been identified beyond those recognized in the 2011 settlement. However, the designation of previously unidentified endangered or threatened species could cause us to incur additional costs or become subject to operating restrictions or bans in the affected states.
Worker Safety
OSHA and analogous state laws regulate the protection of the safety and health of workers. The OSHA hazard communication standard requires maintenance of information about hazardous materials used or produced in operations and provision of such information to employees. Other OSHA standards regulate specific worker safety aspects of our operations. Failure to comply with OSHA requirements can lead to the imposition of penalties. In December 2015, the U.S. Departments of Justice and Labor announced a plan to more frequently and effectively prosecute worker health and safety violations, including enhanced penalties.
Employees
As of December 31, 2015, we had 63 full-time employees. Our future success will depend partially on our ability to attract, retain and motivate qualified personnel. We are not a party to any collective bargaining agreements and have not experienced any strikes or work stoppages. We utilize the services of independent contractors to perform various field and other services.
Legal Proceedings
We are party to various legal proceedings and claims in the ordinary course of our business. We believe these matters will not have a material adverse effect on our consolidated financial position, results of operations or liquidity.
146
Directors and Executive Officers
The following table sets forth the names, ages and titles of our directors, director nominee and executive officers as of August 30, 2016:
Name |
| Age | | Title |
| | | | | |
Roger J. Biemans |
| 56 | | Chairman and Chief Executive Officer |
Thomas B. Tyree, Jr. |
| 55 | | President and Chief Financial Officer and Director |
S. Wil VanLoh, Jr. |
| 46 | | Director |
Blake A. Webster |
| 39 | | Director |
E. Bartow Jones |
| 40 | | Director |
Ralph Alexander |
| 61 | | Director |
Jonathan C. Farber |
| 48 | | Director |
Townes G. Pressler, Jr. |
| 52 | | Director |
Justin A. Gannon |
| 67 | | Director Nominee |
The following table sets forth information regarding our other key employees as of August 30, 2016:
Name |
| Age | | Title |
| | | | | |
John J. Moran, Jr. |
| 54 | | Senior Vice President — Operations |
W. Worth Carlin |
| 60 | | Senior Vice President — Land |
Seth Urruty |
| 34 | | Vice President — Development/A&D |
Mark Brown |
| 35 | | Vice President — Land and Business Development |
Christopher L. Valdez |
| 39 | | Vice President — Marketing and Midstream Business Development |
Richard Starkey |
| 58 | | Vice President — Subsurface Technology |
Mike Hopkins |
| 48 | | Vice President — Midstream |
Ryan T. Gosney |
| 43 | | Vice President — Controller and Chief Accounting Officer |
Set forth below is the description of the backgrounds of our directors, director nominee and executive officers and other key employees.
Roger J. Biemans has served as Chairman and CEO, and member of the boards of managers of Vantage I and Vantage II since their founding in 2006 and 2012, respectively. He was appointed as a member of our board of directors in May 2014. Prior to co-founding Vantage I, he was President of EnCana Oil & Gas (USA) Inc. from 2000 through 2006 and from 1996 through 2000 Vice-President & Team Lead for AEC Oil & Gas (EnCana Corp) in Alberta, Canada. Mr. Biemans began his career with AEC Oil & Gas in 1982 after which he spent five years with Saskoil (Wascana) in senior engineering positions and six years with the City of Medicine Hat responsible for the utility owned oil and gas upstream assets. Mr. Biemans holds a BSc in Mechanical Engineering from the University of Calgary.
We believe that Mr. Biemans' extensive knowledge of the energy industry and our operations developed through his role as co-founder of Vantage I and Vantage II, as well as his substantial business, leadership and management experience, bring important and valuable skills to the board of directors.
Thomas B. Tyree, Jr. has served as President, Chief Financial Officer, and member of the boards of managers of Vantage I and Vantage II since their founding in 2006 and 2012, respectively. He was appointed as a member of our board of directors in May 2014. Prior to
147
co-founding Vantage I, he was Chief Financial Officer of Bill Barrett Corporation from 2003 through 2006 with responsibility for finance, treasury, accounting, internal audit and other functions. From 1989 through 2003, Mr. Tyree served in various positions in the Investment Banking Division at Goldman, Sachs & Co. including as a Managing Director. Mr. Tyree began his career with Bankers Trust Company in 1983 as an Associate in Corporate Finance. Mr. Tyree holds an MBA from the Wharton School at the University of Pennsylvania in Finance and Entrepreneurial Management and a B.A. from Colgate University in Economics and Philosophy.
We believe that Mr. Tyree's extensive experience as a chief financial officer of oil and gas companies and an investment banker, together with his knowledge of both the energy industry and our operations developed through his role as co-founder of Vantage I and Vantage II, bring important and valuable skills to the board of directors.
S. Wil VanLoh, Jr. has served as a member of the boards of managers of Vantage I and Vantage II since their founding in 2006 and 2012, respectively. He was appointed as a member of our board of directors in May 2014. Mr. VanLoh is the President and Chief Executive Officer of Quantum Energy Partners, which he founded in 1998. Quantum Energy Partners manages a family of energy-focused private equity funds, which, together with its affiliates, has had more than $11 billion of capital under stewardship. Mr. VanLoh is responsible for the leadership and overall management of the firm. Additionally, he leads the firm's investment strategy and capital allocation process, working closely with the investment team to ensure its appropriate implementation and execution. Prior to co-founding Quantum Energy Partners, Mr. VanLoh co-founded Windrock Capital, Ltd., an energy investment banking firm specializing in providing merger, acquisition and divestiture advice to and raising private equity for energy companies. Prior to co-founding Windrock, Mr. VanLoh worked in the energy investment banking groups of Kidder, Peabody & Co. and NationsBank. Mr. VanLoh serves on the boards of a number of portfolio companies of Quantum Energy Partners, all of which are private energy companies.
We believe that Mr. VanLoh's extensive experience, both from investing in the energy industry since 1998 and serving as director for numerous private and public energy companies, brings important and valuable skills to the board of directors.
Blake A. Webster has served as a member of the boards of managers of Vantage I and Vantage II since their founding in 2006 and 2012, respectively. He was appointed as a member of our board of directors in August 2014. Mr. Webster is currently a Managing Director with Quantum Energy Partners and has been with the firm since 2006. Mr. Webster participates in Quantum's investment activities, including investment sourcing, transaction structuring and execution, and working closely with portfolio companies in developing and executing their business plans. Mr. Webster currently serves on the board of directors of several other Quantum portfolio companies, including Crump Energy Partners II, LLC, Intensity Midstream, LLC, Jagged Peak Energy, LLC, Oryx Midstream Services, LLC, and Xplorer Midstream, LLC. Prior to joining Quantum in 2006, Mr. Webster was an Associate with Morgan Stanley in its Global Energy and Utilities Equity Research group. Mr. Webster holds a B.A. from the University of Texas at Austin, an M.B.A. from Rice University and is a CFA charterholder.
We believe that Mr. Webster's extensive experience, both from his roles in the energy industry and as a director for several Quantum portfolio companies, brings important and valuable skills to the board of directors.
E. Bartow Jones has served as a member of the boards of managers of Vantage I since May 2010 and of Vantage II since its founding in 2012. He has been a member of our Board of Directors since May 2014. Mr. Jones is currently a Partner at Riverstone Holdings LLC where he served as a Managing Director from 2010 to 2014 and a Principal from 2007 to 2010. Mr. Jones has been with Riverstone since 2001. In addition to serving on the boards of a number of Riverstone portfolio
148
companies and their affiliates, Mr. Jones previously served on the boards of directors of Niska Gas Storage Partners LLC, Buckeye GP LLC, the general partner of Buckeye Partners, LP, and Mainline Management LLC, the general partner of Buckeye GP Holdings L.P. and PVR GP, LLC, the general partner of PVR Partners, L.P. Mr. Jones received his undergraduate degree in commerce with concentrations in both finance and accounting from the McIntire School of Commerce at the University of Virginia.
We believe that Mr. Jones's extensive experience and role with portfolio companies, significant understanding of the challenges facing public companies and involvement with a range of various energy companies brings important and valuable skills to the board of directors.
Ralph Alexander has served as a member of the boards of managers of Vantage I since May 2010 and Vantage II since its founding in 2012. He was appointed as a member of our board of directors in August 2014. Mr. Alexander is a Partner of Riverstone Holdings LLC. He is based in Houston. For nearly 25 years, Mr. Alexander served in various positions with subsidiaries and affiliates of BP plc, one of the world's largest oil and gas companies. From June 2004 until December 2006, he served as Chief Executive Officer of Innovene, BP's $20 billion olefins and derivatives subsidiary. From 2001 until June 2004, he served as Chief Executive Officer of BP's Gas, Power and Renewables and Solar segment and was a member of the BP group executive committee. Prior to that, Mr. Alexander served as a Group Vice President in BP's Exploration and Production segment and BP's Refinery and Marketing segment. He held responsibilities for various regions of the world, including North America, Russia, the Caspian, Africa, and Latin America. Prior to these positions, Mr. Alexander held various positions in the upstream, downstream and finance groups of BP. In addition to serving on the boards of a number of Riverstone portfolio companies and their affiliates, Mr. Alexander has served on the board of EP Energy Corporation since September 2013, the board of the general partner of Enviva Partners, LP since November 2013 and the board of Talen Energy Corporation since June 2015. In addition, Mr. Alexander is currently Chairman of the Board of Polytech Institute of New York University. He previously served on the boards of Niska Gas Storage Partners LLC, Stein Mart, Inc., KiOR, Inc. and Amyris, Inc. He received an M.S. in Nuclear Engineering from Brooklyn Polytech (now NYU Polytechnic) and holds an M.S. in Management Science from Stanford University. He is currently Chairman of the Board of Polytechnic Institute of NYU and a New York University Trustee.
We believe Mr. Alexander's extensive experience with the energy industry enables him to provide important insight and guidance to our management team and board of directors.
Jonathan C. Farber has served as a member of the boards of managers of Vantage I and Vantage II since their founding in 2006 and 2012, respectively. He was appointed as a member of our board of directors in May 2014. Mr. Farber serves as a Managing Director of Lime Rock Partners, a private equity firm he co-founded in 1998 to focus on investments of growth capital in energy companies worldwide. Mr. Farber began his career in 1990 in the Investment Research Department of Goldman, Sachs & Co., rising from a securities analyst to Vice President in the Investment Banking Division, where he was involved in private equity and large merger and acquisition transactions. Mr. Farber currently serves on the board of directors of Augustus Energy Partners II, CrownRock, and Imaginea Energy Corp. He previously served on the board of directors of Arena Exploration, RMP Energy, Coronado Resources, Deer Creek Energy, LMP Exploration Holdings, Torex Resources, Slate River Resources, U.S. Exploration Holdings, Black Shire Energy, LRR Energy, L.P., and Venture Production. Mr. Farber is a graduate of the School of Foreign Service of Georgetown University, with a Bachelor of Science in Foreign Service degree.
We believe that Mr. Farber's extensive financial, investment banking and private equity experience, as well as his experience on the boards of directors of public and numerous private energy companies, bring important and valuable skills to the board of directors.
149
Townes G. Pressler, Jr. has served as a member of the board of managers of Vantage II since August 2012 and was appointed as a member of our board of directors in August 2014. Mr. Pressler has been a Managing Director with Lime Rock Partners since 2007. Prior to joining Lime Rock, Mr. Pressler had over 20 years of experience as an energy entrepreneur and as a strategic advisor to energy companies. From 2004 to 2007, Mr. Pressler served as Principal of Peregrine Oil & Gas LP, a private equity-backed independent oil and gas producer he co-founded, focused in the Gulf of Mexico. From 1991 to 2004, Mr. Pressler was an energy investment banker. He served in various capacities at Kidder Peabody & Co, UBS, Harrison Lovegrove & Co, and Donaldson, Lufkin & Jenrette, becoming a Managing Director of the Global Energy Group of Credit Suisse after Credit Suisse's acquisition of DLJ in 2000. Mr. Pressler is a graduate of Washington and Lee University (B.A.) and the University of Texas (M.B.A.). Mr. Pressler currently serves on the board of directors of Battlecat Oil and Gas, Capstone Natural Resources II, Imaginea Energy, and San Jacinto Minerals. He previously served on the board of directors of Black Shire Energy, Braden Exploration, Braden Exploration II, Capstone Natural Resources, Chinook Energy Inc., Lafayette Workboat Holdings, LRR Energy, L.P, PDC Mountaineer, TAW Energy Services, and Chinook Energy Inc.
We believe that Mr. Pressler's extensive financial, investment banking and private equity experience, as well as his experience on the boards of directors of public and numerous private energy companies, bring important and valuable skills to the board of directors.
Justin A. Gannon will become a member of our board of directors and the chairman of our audit committee in connection with our listing on the NYSE. Since September 2013, Mr. Gannon has acted as an independent consultant, private investor and corporate director. From February 2003 through August 2013, Mr. Gannon served in various roles at Grant Thornton LLP, an independent audit, tax and advisory firm, including as National Leader of Merger and Acquisition Development from June 2011 through August 2013, Central Region Managing Partner from October 2009 through June 2011, Office Managing Partner in Houston, Texas from May 2007 through June 2011 and Office Managing Partner in Kansas City, Missouri from August 2004 to May 2007. From 1971 through 2002, Mr. Gannon worked at Arthur Andersen LLP, including as an Audit Partner for 21 years. Since October 1, 2014, Mr. Gannon has served as a Director, Chairman of the Audit Committee and Member of the Conflicts Committee of the general partner of CrossAmerica Partners LP, a publicly traded master limited partnership engaged in motor fuels distribution. Since December 1, 2014, he has also served as a Director, Audit Committee Chairman and Member of the Compensation Committee for California Resources Corporation, an upstream exploration and development company focused on California. He is a former chairman of the Board of Directors of American Red Cross chapters in the Tulsa, Oklahoma and San Antonio, Texas areas. Mr. Gannon received a Bachelor of Science degree in Accounting from Loyola Marymount University and is a Certified Public Accountant in Texas (active) and California (inactive).
We believe that Mr. Gannon's more than four decades in financial accounting practice and his private investment experience make him well suited to serve as a member of our board of directors.
John J. Moran, Jr. has been our Senior Vice President — Operations since September 2014 after serving as our Vice President of Operations since April 2011 and Senior Engineer since joining the company in March 2007. Prior to joining Vantage, Mr. Moran served as Drilling Lead for EnCana Oil & Gas from July 2000 to March 2007. Mr. Moran began his career with Marathon Oil Company in March 1987, where he served as Drilling Superintendent until December 1999. Mr. Moran holds a BS in Petroleum Engineering from Montana Tech University.
W. Worth Carlin has been our Senior Vice President — Land since September 2014 after serving as our Vice President of Land since October 2012. Prior to joining Vantage, he served as Vice President, Land for Range Resources-Appalachia from February 2009 until October 2012. Prior
150
to his service with Range, Mr. Carlin worked for various upstream exploration and production companies, including EnCana Oil & Gas, Kerr-McGee and Sun Oil/Oryx Energy. Mr. Carlin is a 1977 graduate from the University of Texas at Austin with a BBA in Petroleum Land Management.
Seth Urruty has been our Vice President — Development/A&D since March 2015. Mr. Urruty was previously our Vice President and GM-Texas/Utah and held various other roles since joining the company in November 2007. Mr. Urruty began his career as a reservoir and operations engineer for Petro-Canada Resources, where he served from January 2006 to November 2007. Mr. Urruty holds a BS in Mechanical Engineering and a minor in Business Administration with a Leadership Concentration from Gonzaga University.
Mark Brown has been our Vice President — Land and Business Development since June 2016. Mr. Brown was previously our Land and Business Development Manager and served in various other land roles since joining us in July 2007. Prior to joining Vantage, Mr. Brown served as Land Negotiator for EnCana Oil & Gas from May 2005 to July 2007. Mr. Brown is a 2005 graduate from the University of Oklahoma with a BBA in Energy Management.
Christopher L. Valdez has been our Vice President — Marketing and Midstream Business Development since September 2015. Prior to joining Vantage, Mr. Valdez served as Vice President of Planning for Encana Corporation and served in various operational, and marketing roles at Encana after joining the company in 2005. Mr. Valdez holds an MBA from the University of Denver, Daniels College of Business, and a BS in Engineering from the Colorado School of Mines.
Richard D. Starkey has been our Vice President — Subsurface Technology since April 2015. Mr. Starkey was previously our VP — PA Development and served in various other positions since joining us in July 2007. Prior to joining Vantage, Mr. Starkey served as Development Lead for DJ Basin and Jonah fields for EnCana Oil & Gas from August 2002 to July 2007. Prior to EnCana, Mr. Starkey worked in various reservoir engineering, acquisition, and development capacities for various companies including Ampolex (USA) Inc., Bridge Oil (USA) Inc. and Tenneco Oil Company. Mr. Starkey is a 1980 graduate from the Colorado School of Mines with a BS in Petroleum Engineering.
Michael L. Hopkins P.E., PMP has been our Vice President of Midstream since February 2013. Prior to joining Vantage, Mr. Hopkins served as Director of Engineering and Construction Onshore for Williams Midstream Company starting in 2009. He spent 23 years in total with the Williams Companies in various roles in management, engineering, construction and business development. Mr. Hopkins holds a BS in Mechanical Engineering from the Colorado School of Mines and Management Certifications from Case Western University — Weatherhead School of Management.
Ryan T. Gosney has been our Vice President — Controller and Chief Accounting Officer since July 2016. Prior to joining Vantage, Mr. Gosney served as Chief Financial Officer for Dorado E&P Partners, LLC from January 2012 to January 2016. Mr. Gosney began his career as an auditor with Arthur Andersen, LLP in September 1995 where he served in increasing roles of responsibility up to Audit Manager until June 2002. Mr. Gosney has also served as Controller for Patina Oil & Gas Corporation from October 2002 to October 2005 and Delta Petroleum Corporation from October 2005 to January 2012. Mr. Gosney graduated from Texas Christian University in 1995 with a BBA in Accounting.
Board of Directors
The board of managers of Vantage I currently consists of seven members, Messrs. Biemans, Tyree, Alexander, Farber, Jones, Webster and VanLoh. The board of managers of Vantage II currently consists of eight members, Messrs. Biemans, Tyree, Alexander, Farber, Jones, Pressler, VanLoh and Webster. In connection with the closing of this offering, Vantage Investment I and
151
Vantage Investment II will enter into a stockholders' agreement. Please see "Certain Relationships and Related Party Transactions — Stockholders' Agreement". Pursuant to the stockholders' agreement, Vantage Investment I and Vantage Investment II will agree to vote their shares of common stock in accordance with the stockholders' agreement. In addition, we and Vantage Investment I and Vantage Investment II will agree to appoint individuals designated by our Sponsors to our board of directors and nominate such persons for election at each annual meeting of our stockholders. We anticipate that our board will determine that each of Messrs. Alexander, Farber, Jones, Pressler, VanLoh and Webster are independent under the independence standards of the NYSE.
In evaluating director candidates, we will assess whether a candidate possesses the integrity, judgment, knowledge, experience, skills and expertise that are likely to enhance the board's ability to manage and direct our affairs and business, including, when applicable, to enhance the ability of the committees of the board to fulfill their duties. We currently are in the process of identifying individuals who meet these standards and the relevant independence requirements. Our directors hold office until the earlier of their death, resignation, retirement, disqualification or removal or until their successors have been duly elected and qualified.
In connection with the completion of this offering, we expect that our directors will be divided into three classes serving staggered three-year terms. Class I, Class II and Class III directors will serve until our annual meetings of stockholders in 2017, 2018 and 2019, respectively. At each annual meeting of stockholders held after the initial classification, directors will be elected to succeed the class of directors whose terms have expired. This classification of our board of directors could have the effect of increasing the length of time necessary to change the composition of a majority of the board of directors. In general, at least two annual meetings of stockholders will be necessary for stockholders to effect a change in a majority of the members of the board of directors.
Status as a Controlled Company
Because Vantage Investment I and Vantage Investment II will own a majority of our outstanding common stock following the completion of this offering, we expect to be a controlled company under NYSE corporate governance standards. A controlled company need not comply with NYSE corporate governance rules that require its board of directors to have a majority of independent directors and independent compensation and nominating and governance committees. Notwithstanding our status as a controlled company, we will remain subject to the NYSE corporate governance standard that requires us to have an audit committee composed entirely of independent directors. As a result, we must have at least one independent director on our audit committee by the date our common stock is listed on the NYSE, at least two independent directors within 90 days of the listing date and at least three independent directors within one year of the listing date.
While these exemptions will apply to us as long as we remain a controlled company, we expect that our board of directors will nonetheless consist of a majority of independent directors within the meaning of the NYSE listing standards currently in effect.
Committees of the Board of Directors
Upon the conclusion of this offering, we intend to have an audit committee of our board of directors, and may have such other committees as the board of directors shall determine from time to time. We anticipate that each of the standing committees of the board of directors will have the composition and responsibilities described below.
152
Audit Committee
We will establish an audit committee prior to the completion of this offering. Following completion of this offering, our audit committee will consist of Messrs. Gannon, Alexander and Webster, with Mr. Gannon serving as chairman. As required by the rules of the SEC and listing standards of the NYSE, the audit committee will consist solely of independent directors, subject to the phase-in exceptions. SEC rules also require that a public company disclose whether or not its audit committee has an "audit committee financial expert" as a member. An "audit committee financial expert" is defined as a person who, based on his or her experience, possesses the attributes outlined in such rules. We anticipate that our board will determine that Mr. Gannon satisfies the definition of "audit committee financial expert".
This committee will oversee, review, act on and report on various auditing and accounting matters to our board of directors, including: the selection of our independent accountants, the scope of our annual audits, fees to be paid to the independent accountants, the performance of our independent accountants and our accounting practices. In addition, the audit committee will oversee our compliance programs relating to legal and regulatory requirements. We expect to adopt an audit committee charter defining the committee's primary duties in a manner consistent with the rules of the SEC and applicable stock exchange or market standards.
Compensation Committee
Because we will be a "controlled company" within the meaning of the NYSE corporate governance standards, we will not be required to, and do not currently expect to, have a compensation committee.
If and when we are no longer a "controlled company" within the meaning of the NYSE corporate governance standards, we will be required to establish a compensation committee prior to the completion of this offering. We anticipate that such a compensation committee would consist of three directors who will be "independent" under the rules of the SEC. This committee would establish salaries, incentives and other forms of compensation for officers and other employees. Any compensation committee would also administer our incentive compensation and benefit plans. Upon formation of a compensation committee, we would expect to adopt a compensation committee charter defining the committee's primary duties in a manner consistent with the rules of the SEC, the PCAOB and applicable stock exchange or market standards.
Nominating and Corporate Governance Committee
Because we will be a "controlled company" within the meaning of the NYSE corporate governance standards, we will not be required to, and do not currently expect to, have a nominating and corporate governance committee.
If and when we are no longer a "controlled company" within the meaning of the NYSE corporate governance standards, we will be required to establish a compensation committee shortly after the completion of this offering. We anticipate that such a nominating and corporate governance committee would consist of three directors who will be "independent" under the rules of the SEC. This committee would identify, evaluate and recommend qualified nominees to serve on our board of directors, develop and oversee our internal corporate governance processes and maintain a management succession plan. Upon formation of a compensation committee, we would expect to adopt a nominating and corporate governance committee charter defining the committee's primary duties in a manner consistent with the rules of the SEC and applicable stock exchange or market standards.
153
Compensation Committee Interlocks and Insider Participation
Because we will be a "controlled company" within the meaning of the NYSE corporate governance standards, we will not be required to, and do not currently expect to, have a compensation committee. None of our executive officers serve on the board of directors or compensation committee of a company that has an executive officer that serves on our board or compensation committee. No member of our board is an executive officer of a company in which one of our executive officers serves as a member of the board of directors or compensation committee of that company.
Code of Business Conduct and Ethics
Prior to the completion of this offering, our board of directors will adopt a code of business conduct and ethics applicable to our employees, directors and officers, in accordance with applicable U.S. federal securities laws and the corporate governance rules of the NYSE. Any waiver of this code may be made only by our board of directors and will be promptly disclosed as required by applicable U.S. federal securities laws and the corporate governance rules of the NYSE.
Corporate Governance Guidelines
Prior to the completion of this offering, our board of directors will adopt corporate governance guidelines in accordance with the corporate governance rules of the NYSE.
154
We are providing compensation disclosure that satisfies the requirements applicable to emerging growth companies, as defined in the JOBS Act.
Summary Compensation Table
The table below sets forth the annual compensation paid by our predecessor during the fiscal year ended December 31, 2015 to our principal executive officer and our next most highly-compensated executive officer. No other individuals served as executive officers of the Company during the 2015 fiscal year. However, if John J. Moran, Jr., our most highly compensated key employee, was an executive officer, then he would have also been a named executive officer for the 2015 fiscal year. In this Executive Compensation section, we refer to Messrs. Biemans, Tyree and Moran collectively as our "Named Executive Officers".
|
| | | | All Other | | | |||||||||||||||||
Name and Principal Position |
| Year | | Salary ($) | | Bonus ($)(1) | | Compensation ($)(2) | | Total ($) |
| |||||||||||||
| | | | | | | | | | | | | |||||||||||||
Roger J. Biemans |
| 2015 | | | 490,000 | | | | 183,750 | | | | 20,838 | | | | 694,588 | | | |||||
Thomas B. Tyree, Jr. |
| 2015 | | | 350,000 | | | | 131,250 | | | | 20,100 | | | | 501,350 | | | |||||
John J. Moran, Jr. |
| 2015 | | | 340,000 | | | | 115,000 | | | | 20,100 | | | | 475,100 | | | |||||
- (1)
- Bonus
compensation for fiscal 2015 represents the aggregate amount of the annual discretionary cash bonuses fully earned by each Named
Executive Officer for the 2015 year. The potential 2015 bonus amount was determined at the beginning of the 2016 year and split into two equal 50% portions. The first half of the bonus
award was paid to the Named Executive Officers on February 25, 2016, and it is this first installment amount that is reflected in the table above. The second half of the bonus will be paid to
the Named Executive Officers on November 4, 2016 subject to their continued employment until the payment date, therefore it will be reflected in the Summary Compensation Table for the
2016 year when the remaining service condition is satisfied, if applicable.
- (2)
- Amounts reported in the "All Other Compensation" column reflect employer matching contributions to the Named Executive Officers' accounts under our 401(k) plan, transportation and fitness allowances and, with respect to Mr. Biemans, a medical stipend.
Narrative Disclosure to the Summary Compensation Table
For 2015, the principal elements of compensation provided to the Named Executive Officers were base salaries, annual cash bonuses, and retirement, health, welfare and additional benefits. In addition, although no formal determination has been made, we expect that our board of directors will increase base salaries, adjust our bonus program and make discretionary equity grants under the Long-Term Incentive Plan described below for our Named Executive Officers in connection with this offering.
Base Salary. Base salaries are generally set at levels deemed necessary to attract and retain individuals with superior talent commensurate with their relative expertise and experience.
Annual Cash Bonuses. Annual cash incentive awards are used to motivate and reward our executives. Annual cash incentive awards are determined on a discretionary basis and are generally based on individual and company performance. Unless otherwise determined, awards have
155
historically been subject to an individual's continued employment through the date of payment of the award.
Retirement Benefits. We have not maintained, and do not currently maintain, a defined benefit pension plan or a nonqualified deferred compensation plan providing for retirement benefits. Our Named Executive Officers currently participate in our 401(k) plan. The 401(k) plan permits all eligible employees, including the Named Executive Officers, to make voluntary pre-tax contributions to the plan. In addition, we make matching contributions to participants' accounts under the plan equal to 100% of their pre-tax contributions that do not exceed 6% of their eligible compensation. All contributions under the plan are subject to certain annual dollar limitations, which are periodically adjusted for changes in the cost of living.
Outstanding Equity Awards at 2015 Fiscal Year-End
The following table reflects information regarding outstanding management incentive awards held by our Named Executive Officers as of December 31, 2015.
|
| Unit Awards(1) |
| ||||||||||||||||||
| | | | | | | | | | | ||||||||||||
Name |
| Number of Units that Have Vested (#) |
| Number of Units that Have Not Vested (#) |
| Exercise Price ($)(5) |
| Expiration Date(5) |
| ||||||||||||
Roger J. Biemans |
| | 567,406 | | | | 693,497 | (2) | | | $ | 0.00 | | | | N/A | | | |||
Thomas B. Tyree, Jr. |
| | 238,703 | | | | 291,748 | (3) | | | $ | 0.00 | | | | N/A | | | |||
John J. Moran, Jr. |
| | 112,500 | | | | 137,500 | (4) | | | $ | 0.00 | | | | N/A | | | |||
- (1)
- The
applicable equity awards that are disclosed in this Outstanding Equity Awards at 2015 Fiscal Year-End table are Class C Management
Units in Vantage I ("Class C Units") and Class M Management Incentive Units in Vantage II ("Class M Units"), in each case, representing limited liability company membership
interests that are intended to constitute profits interests for federal tax purposes. In connection with our corporate reorganization, the Class C Units will be exchanged for Class C
Units in Vantage Investment I and the Class M Units will be exchanged for Class M Units in Vantage Investment II.
- (2)
- 363,497
of these units constitute Class C Units that will vest upon a "Monetization Event" (as defined in the Amended and Restated
Limited Liability Company Agreement of Vantage I (a "Vantage I Monetization Event")) so long as Mr. Biemans remains continuously employed on a full-time basis by us or one of our subsidiaries
on the date of such Vantage I Monetization Event. The remaining 330,000 of these units constitute Class M Units that will become vested upon a "Monetization Event" (as defined in the Amended
and Restated Limited Liability Company Agreement of Vantage II (a "Vantage II Monetization Event")) so long as Mr. Biemans remains continuously employed on a full-time basis by us or one of our
subsidiaries on the date of such Vantage II Monetization Event.
- (3)
- 181,748
of these units constitute Class C Units that will vest upon a Vantage I Monetization Event so long as Mr. Tyree remains
continuously employed on a full-time basis by us or one of our subsidiaries on the date of such Vantage I Monetization Event. The remaining 110,000 of these units constitute Class M Units that
will become vested upon a Vantage II Monetization Event so long as Mr. Tyree remains continuously employed on a full-time basis by us or one of our subsidiaries on the date of such Vantage II
Monetization Event.
- (4)
- 55,000
of these units constitute Class C Units that will vest upon a Vantage I Monetization Event so long as Mr. Moran
remains continuously employed on a full-time basis by us or one of our subsidiaries on the date of such Vantage I Monetization Event. The remaining 82,500 of these units constitute
Class M Units that will become vested upon a Vantage II Monetization Event so long as Mr. Moran remains continuously employed on a full-time basis by us or one of our subsidiaries on the
date of such Vantage II Monetization Event.
- (5)
- These equity awards are not traditional options and, therefore, there is no exercise price or option expiration date associated with them.
156
Potential Payments Upon Termination or a Change in Control
We do not currently maintain any employment, severance or change in control agreements with any of our Named Executive Officers. In addition, none of our Named Executive Officers are currently entitled to any payments or other benefits in connection with a termination of their employment or a change in control.
However, we anticipate that, prior to the closing of this offering, each of our Named Executive Officers will enter into employment agreements with us (collectively, the "Employment Agreements"). The description of the Employment Agreements set forth below is a summary of the expected material features of the agreements regarding potential payments upon a termination of employment or a change in control. This summary, however, does not purport to be a complete description of all the provisions of the Employment Agreements. Because the Employment Agreements have not yet been executed, the description below merely reflects current expectations with respect to the terms and conditions of the Employment Agreements.
We expect that each Employment Agreement will become effective upon the closing of this offering and will have an initial term of two years. We also expect that each Employment Agreement will provide that, upon the second anniversary of the closing of this offering and on each subsequent anniversary thereafter, the term of the Employment Agreement will automatically renew for 12 months unless either party delivers written notice of non-renewal to the other party at least 30 days prior to the expiration of the then-exiting initial term or renewal term. We anticipate that, under the Employment Agreements, each of our Named Executive Officers will be entitled to certain severance benefits upon a termination of their employment by us other than for "cause" (and not due to their death or "disability") or as a result of their resignation for "good reason" (each, a "qualifying termination"). Specifically, we expect the Employment Agreements will provide that if a Named Executive Officer incurs a qualifying termination prior to a "change in control" or more than 24 months after a change in control, (i) the Named Executive Officer will receive severance payments equal, in the aggregate, to 12 months' worth of his then-current annualized base salary plus an additional amount equal to his then-current target bonus (or, with respect to Mr. Biemans, 24 months' worth of his then-current annualized base salary plus an additional amount equal to two times his then-current target bonus), (ii) we will reimburse the Named Executive Officer for up to 12 months (or, with respect to Mr. Biemans, 18 months) for the amount by which the premiums he pays for continued coverage under our group health plans exceeds the employee contribution amount that we charge our active senior executives for similar coverage and (iii) with respect to unvested equity awards held by the Named Executive Officer (including Class C Units, Class M Units and awards under the LTIP), the portion of such awards that would have become vested if the Named Executive Officer remained employed by us for one year (or, with respect to Mr. Biemans, two years) following the qualifying termination will immediately become fully vested as of the date of the qualifying termination.
If, during the 24-month period beginning on the date on which a change in control occurs, a qualifying termination occurs or a Named Executive Officer's employment is terminated because we provide notice of non-renewal, we expect the Employment Agreements will provide that (i) the Named Executive Officer will receive severance payments equal, in the aggregate, to 24 months' worth of his then-current annualized base salary plus an additional amount equal to two times his then-current target bonus (or, with respect to Mr. Biemans, 36 months' worth of his then-current annualized base salary plus an additional amount equal to three times his then-current target bonus), (ii) we will reimburse the Named Executive Officer for up to 18 months (or, with respect to Mr. Biemans, 36 months, although any amounts that would be paid more than 18 months after the qualifying termination will be paid in a lump sum cash payment 18 months following the qualifying termination) for the amount by which the premiums he pays for continued coverage under our group health plans exceeds the employee contribution amount that we charge our active senior
157
executives for similar coverage and (iii) all unvested equity awards held by the Named Executive Officer (including Class C Units, Class M Units and awards under the LTIP) will immediately become fully vested as of the date of the qualifying termination.
We expect the Employment Agreements will provide that if the total amount of the payments to be provided by us in connection with a change in control would cause any of our Named Executive Officers to incur "golden parachute" excise tax liability, those payments will be reduced to the extent necessary to eliminate the application of the excise tax if that will leave our Named Executive Officers in a better after-tax position than if no such reduction had occurred. We do not anticipate that the Employment Agreements will provide for any tax "gross-up" payments.
We expect that for purposes of the Employment Agreements:
- •
- "Cause" will mean a Named Executive Officer's (i) gross negligence in performing, or failure or refusal to perform, his duties
(other than any such failure resulting from his disability); (ii) failure to comply with any valid and legal directive from us; (iii) engagement in dishonesty, illegal conduct or
misconduct that is, in each case, injurious to us or any of our affiliates; (iv) embezzlement, misappropriation or fraud, whether or not related to his employment with us; (v) conviction
of, or plea of guilty or nolo contendere to, a crime that constitutes a felony (or state law equivalent) or a crime that constitutes a misdemeanor involving moral turpitude, if such felony or other
crime is work-related, materially impairs his ability to perform services for us or results in harm to us or our affiliates; (vi) violation of one of our policies, including any code of conduct
applicable to him; (vii) willful, unauthorized disclosure of confidential information; (viii) breach of any obligation under the Employment Agreement or any other written agreement with
us; or (ix) material failure to comply with our written policies or rules, as they may be in effect from time to time, if such failure causes harm to us;
- •
- "Change in Control" will have the meaning set forth in the LTIP;
- •
- "Disability" will mean a good faith determination by our board of directors that the Named Executive Officer is unable to perform the
essential functions of his position, with reasonable accommodation, due to an illness or physical or mental impairment or other incapacity that continues, or can reasonably be expected to continue,
for a period in excess of 90 days, whether or not consecutive; and
- •
- "Good Reason" will mean (i) a material diminution in the Named Executive Officer's base salary to an amount that is at least 10% lower than his base salary in effect on the effective date of the Employment Agreement; (ii) a material breach by us of any of our covenants or obligations under the Employment Agreement; (iii) the relocation of the geographic location of the Named Executive Officer's principal place of employment by more than 75 miles from the location of the Named Executive Officer's principal place of employment as of the effective date of the Employment Agreement; or (iv) a material, adverse change in the Named Executive Officer's authority, duties or responsibilities (other than while he is physically or mentally incapacitated or as required by applicable law).
We also anticipate that each of the Employment Agreements will contain restrictive covenants under which the Named Executive Officers will recognize an obligation to comply with, among other things, certain confidentiality covenants as well as covenants not to: (i) within a defined market area, compete with us or (ii) solicit, hire or engage any of our employees, contractors, customers or suppliers. We expect that these restrictions will generally apply during the term of the Employment Agreements and continue for a period of 12 months following the termination of a Named Executive Officer's employment. In addition, we expect the Employment Agreements will include provisions calling for the forfeiture of all rights to receive severance payments as well as forfeiture of all
158
Class C Units, Class M Units and awards granted under the LTIP, in each case, regardless of whether those awards are vested or unvested, in the event of breaches of these restrictive covenants.
Long-Term Incentive Plan
Prior to the completion of this offering, our board of directors will have adopted, and our stockholders will have approved, a Long-Term Incentive Plan (the "LTIP"), to attract and retain employees and directors. The description of the LTIP set forth below is a summary of the material features of the LTIP. This summary, however, does not purport to be a complete description of all of the provisions of the LTIP and is qualified in its entirety by reference to the LTIP, a copy of which is filed as an exhibit to this registration statement. The LTIP provides for the grant of equity-based awards, including options to purchase shares of our common stock, stock appreciation rights, restricted stock, restricted stock units, bonus stock, dividend equivalents, other stock-based awards and performance awards.
Share Limits. Subject to adjustment in accordance with the LTIP, shares of our common stock representing approximately % of the pro forma shares outstanding, will initially be reserved for issuance pursuant to awards under the LTIP. However, no more than shares of our common stock in the aggregate may be issued pursuant to incentive stock options (which generally are stock options that meet the requirements of Section 422 of the Internal Revenue Code of 1986, as amended (the "Code")). The maximum aggregate grant date fair value of awards granted to a non-employee director during any calendar year shall be $ (or $ in the first year in which an individual becomes a non-employee director). Common stock subject to an award that expires or is canceled, forfeited, exchanged, settled in cash or otherwise terminated and shares withheld to pay the exercise price of, or to satisfy the withholding obligations with respect to, an award will again be available for delivery in connection with awards under the LTIP.
Administration. The LTIP will be administered by our board of directors or, if it so determines, the compensation committee thereof, which is referred to herein as the "board". Unless otherwise determined by our board of directors, any committee will be comprised of two or more individuals, each of whom qualifies as an "outside director" as defined in Section 162(m) of the Code and a "nonemployee director" as defined in Rule 16b-3 under the Exchange Act. Subject to the terms and conditions of the LTIP, the board has broad discretion to administer the LTIP, including the power to determine the employees and directors to whom awards will be granted, to determine the type of awards to be granted and the number of shares to be subject to awards and the terms and conditions of awards, to determine and interpret the terms and provisions of each award agreement, to accelerate the vesting or exercise of any award and to make all other determinations and to take all other actions necessary or advisable for the administration of the LTIP.
Eligibility. The board will determine the employees and members of our board of directors who are eligible to receive awards under the LTIP.
Stock Options. The board may grant incentive stock options and options that do not qualify as incentive stock options, except that incentive stock options may only be granted to persons who are our employees or employees of one of our subsidiaries, in accordance with Section 422 of the Code. Except as provided below, the exercise price of a stock option cannot be less than 100% of the fair market value of a share of our common stock on the date on which the option is granted and the option must not be exercisable more than ten years from the date of grant. In the case of an incentive stock option granted to an individual who owns (or is deemed to own) at least 10% of the total combined voting power of all classes of our capital stock, the exercise price of the stock
159
option must be at least 110% of the fair market value of a share of our common stock on the date of grant and the option must not be exercisable more than five years from the date of grant.
Stock Appreciation Rights. Stock Appreciation Rights, or SARs, may be granted in connection with, or independent of, a stock option. A SAR is the right to receive an amount equal to the excess of the fair market value of one share of our common stock on the date of exercise over the grant price of the SAR. SARs will be exercisable on such terms as the board determines. The term of a SAR will be for a period determined by the board but will not exceed ten years. SARs may be paid in cash, common stock or a combination of cash and common stock, as determined by the board in the relevant award agreement.
Restricted Stock. Restricted stock is a grant of shares of common stock subject to a substantial risk of forfeiture, restrictions on transferability and any other restrictions determined by the board. Except as otherwise provided in an award agreement, restricted stock will be forfeited and reacquired by us upon termination of a participant's employment or service relationship. Common stock distributed in connection with a stock split or stock dividend, and other property distributed as a dividend, may be subject to the same restrictions and risk of forfeiture as the restricted stock with respect to which the distribution was made.
Restricted Stock Units. Restricted stock units are rights to receive cash, common stock or a combination of cash and common stock at the end of a specified period. Restricted stock units may be subject to restrictions, including a risk of forfeiture, as determined by the board. Unless otherwise determined by the board, restricted stock units will be forfeited upon the termination of a participant's employment or service relationship. The committee may, in its sole discretion, grant dividend equivalents with respect to restricted stock units.
Other Awards. Subject to limitations under applicable law and the terms of the LTIP, the board may grant other awards related to our common stock. Such awards may include, without limitation, common stock awarded as a bonus, dividend equivalents, convertible or exchangeable debt securities, other rights convertible or exchangeable into common stock, purchase rights for common stock, awards with value and payment contingent upon our performance or any other factors designated by the board, and awards valued by reference to the book value of our common stock or the value of securities of, or the performance of, specified subsidiaries. The board will determine the terms and conditions of all such awards. Cash awards may be granted as an element of, or a supplement to, any awards permitted under the LTIP. Awards may also be granted in lieu of obligations to pay cash or deliver other property under the LTIP or under other plans or compensatory arrangements, subject to any applicable provision under Section 16 of the Exchange Act.
Performance Awards. The LTIP will also permit the board to designate certain awards as performance awards. Performance awards represent awards with respect to which a participant's right to receive cash, shares of our common stock, or a combination of both, is contingent upon the attainment of one or more specified performance measures within a specified period. The board will determine the applicable performance period, the performance goals and such other conditions that apply to each performance award. One or more of the following business criteria for the Company, on a consolidated basis, and/or for specified subsidiaries, divisions, businesses or geographical units of the company (except with respect to stock price and earnings per share criteria), will be used by the board in establishing performance goals: (1) earnings per share; (2) increase in revenues; (3) cash flow; (4) cash flow from operations; (5) return on cash flow; (6) return on net assets; (7) return on assets; (8) return on investment; (9) return on capital; (10) return on equity; (11) economic value added; (12) operating margin; (13) contribution margin; (14) net income; (15) net income per share; (16) pretax earnings; (17) earnings before or after either, or any combination of, interest, taxes, depreciation, depletion or amortization; (18) total
160
stockholder return; (19) debt reduction; (20) market share; (21) change in the Fair Market Value of the Stock; (22) cost or expense management goals; (23) operational measures such as changes in proved reserves, production goals, drilling costs, lifting costs, exploration costs, environmental compliance, safety and accident rates, mix of oil and natural gas production or reserves; (24) finding and development costs; (25) recycling ratios; (26) reserve growth, additions or revisions; (27) captured prospects; (28) lease operating expense; (29) captured net risked resource potential; (30) acquisition cost efficiency; (31) acquisitions of oil and gas interests; (32) drillable prospects, capabilities and critical path items established; (33) third-party capital sourcing; (34) acquisitions of oil and gas interests; (35) reserve replacement ratios; (36) reserve replacement costs; (37) exploration successes; (38) operational downtime; (39) rig utilization; and (40) any of the above goals determined on an absolute or relative basis or as compared to the performance of a published or special index deemed applicable by the board including, but not limited to, the Standard & Poor's 500 Stock Index or a group of comparable companies.
Change in Control. Subject to the terms of the applicable award agreement, upon a "change in control" (as defined in the LTIP), the board may, in its discretion, (i) accelerate the time of exercisability of an award, (ii) require awards to be surrendered in exchange for a cash payment or (iii) make other adjustments to awards as the board deems appropriate to reflect the applicable transaction or event.
Amendment and Termination. The LTIP will automatically expire on the tenth anniversary of its effective date. Our board of directors may amend or terminate the LTIP at any time, subject to any requirement of stockholder approval required by applicable law, rule or regulation. The board may generally amend the terms of any outstanding award under the LTIP at any time. However, no action may be taken by our board of directors or the board under the LTIP that would materially and adversely affect the rights of a participant under a previously granted award without the participant's consent.
Offering Grants and 2016 Annual Grants. We expect our board of directors will approve (i) "IPO awards" for our executive officers consisting, in the aggregate, of shares of restricted stock (based on the midpoint of the price range set forth on the cover page of this prospectus) and (ii) 2016 annual grants for our executive officers consisting, in the aggregate, of shares of restricted stock (based on the midpoint of the price range set forth on the cover page of this prospectus). These awards will be granted to our executive officers upon the filing of the registration statement on Form S-8 registering the shares of common stock issuable under the LTIP. The number of shares subject to each award will be rounded to the nearest whole share. Each award will be subject to the terms and conditions of the LTIP and a restricted stock agreement that we will enter into with the applicable executive officer.
Director Compensation
We did not pay any compensation to the non-employee directors of Vantage I or Vantage II during 2015. Going forward, our board of directors believes that attracting and retaining qualified non-employee directors will be critical to the future value growth and governance of our company. Our board of directors also believes that the compensation package for our non-employee directors should require a significant portion of the total compensation package to be equity-based to align the interest of these directors with our stockholders.
Directors who are also our employees or employees of our Sponsors will not receive any additional compensation for their service on our board of directors.
161
It is expected that following this offering (i) our directors who are not our employees or employees of our Sponsors will receive an annual cash retainer of $70,000 per year; and (ii) the chair of the audit committee will receive an additional $15,000 annual cash retainer.
In addition, each such non-employee director is expected to receive an annual grant of restricted stock with a value equal to $140,000 (based on the average of the high and low reported prices of our common stock on the date the award is granted). Each restricted stock award will generally vest on the first anniversary of the grant date so long as the director continues to serve on our board of directors through such anniversary date.
Directors will not receive meeting fees, but we expect that each director will be reimbursed for: (i) travel and miscellaneous expenses to attend meetings and activities of our board of directors or its committees and (ii) travel and miscellaneous expenses related to such director's participation in general education and orientation program for directors. Each director will also be fully indemnified by us for actions associated with serving as a director to the fullest extent permitted under Delaware law.
162
SECURITY OWNERSHIP OF CERTAIN BENEFICIAL OWNERS AND MANAGEMENT
The following table sets forth the beneficial ownership of our common stock that, upon the consummation of our corporate reorganization in connection with the completion of this offering, will be owned by:
- •
- each person known to us to beneficially own more than 5% of any class of our outstanding common stock;
- •
- each of our Named Executive Officers;
- •
- each member of our board of directors and our director nominee; and
- •
- all of our directors and executive officers as a group.
Except as otherwise noted, the person or entities listed below have sole voting and investment power with respect to all shares of our common stock beneficially owned by them, except to the extent this power may be shared with a spouse. All information with respect to beneficial ownership has been furnished by the directors or Named Executive Officers, as the case may be. Unless otherwise noted, the mailing address of each listed beneficial owner is c/o Vantage Energy Inc., 116 Inverness Drive East, Suite 107, Englewood, Colorado 80112.
Vantage Investment I and Vantage Investment II were newly created to serve as holding companies for the interests of the Existing Owners following our corporate reorganization. Though neither we nor the Existing Owners have engaged in any transactions with Vantage Investment I or Vantage Investment II, they may be viewed as successors in interest to Vantage I and Vantage II. For a description of transactions involving Vantage I and Vantage II, please see "Certain Relationships and Related Party Transactions — Historical Transactions with Affiliates". Each of Vantage Investment I and Vantage Investment II is deemed under federal securities laws to be an underwriter with respect to the common stock it may sell in connection with this offering. In addition, each of the members of Vantage Investment I and Vantage Investment II, including our executive officers, will have an indirect interest in the shares of common stock sold by Vantage Investment I and Vantage Investment II.
Prior to the completion of our corporate reorganization (which will occur in connection with the completion of this offering), the ownership interests of our directors and executive officers are represented by limited liability company interests in Vantage I and Vantage II.
163
To the extent that the underwriters sell more than shares of common stock, the underwriters have the option to purchase up to an additional shares from us.
|
| Shares Beneficially Owned Before this Offering |
| Shares Offered |
| Shares Beneficially Owned After this Offering (Assuming No Exercise of the Underwriters' Option to Purchase Additional Shares) |
| Shares Beneficially Owned After this Offering (Assuming the Underwriters' Option to Purchase Additional Shares |
||||||
| | | | | | | | | | | | | | | |
Name of Beneficial Owner(1) |
| Number | | Percentage | | Hereby | | Number | | Percentage | | Number | | Percentage |
5% Shareholders: |
| | | | | | | |||||||
Vantage Energy Investment LLC(2) |
| | | | | | | |||||||
Vantage Energy Investment II LLC(2) |
| | | | | | | |||||||
Named Executive Officers, Directors and Director Nominees: |
| | | | | | | |||||||
Roger J. Biemans |
| | | | | | | |||||||
Thomas B. Tyree, Jr. |
| | | | | | | |||||||
S. Wil VanLoh, Jr. |
| | | | | | | |||||||
Blake A. Webster |
| | | | | | | |||||||
E. Bartow Jones |
| | | | | | | |||||||
Ralph Alexander |
| | | | | | | |||||||
Jonathan C. Farber |
| | | | | | | |||||||
Townes G. Pressler, Jr. |
| | | | | | | |||||||
Justin A. Gannon |
| | | | | | | |||||||
Executive Officers, Directors and Director Nominees as a Group ( persons) |
| | | | | | | |||||||
- *
- Less
than 1%.
- (1)
- Does
not include common stock that may be purchased in the directed share program. Please see "Underwriting — Directed
Share Program". In addition, does not include an aggregate of shares of restricted stock (based on the midpoint of the price range set forth on the cover page of this
prospectus) that
our board of directors intends to grant to our executive officers and directors in connection with the completion of this offering. Finally, the shares beneficially owned reflect the distribution of
common stock by the selling stockholders to the Management Members. Please see "Corporate Reorganization".
- (2)
- Under the limited liability company agreement of each of Vantage Investment I and Vantage Investment II, the voting and disposition of any of our shares of common stock held by Vantage Investment I or Vantage Investment II will be controlled by their respective boards of directors. Each of Messrs. , and , who are expected to be the members of the board of directors of Vantage Investment I, disclaims beneficial ownership of any of our common stock held by Vantage Investment I. Each of Messrs. , and , who are expected to be the members of the board of directors of Vantage Investment II, disclaims beneficial ownership of any of our common stock held by Vantage Investment II.
164
We have incorporated under the laws of the State of Delaware to become a holding company for Vantage's assets and operations. Vantage I was founded in December 2006 with equity commitments from affiliates of Quantum, Riverstone and Lime Rock, as well the Management Members. Subsequently, Vantage II was founded in July 2012 with equity commitments from affiliates of those same Sponsors and the Management Members. The Vantage II Consolidation will occur prior to our corporate reorganization described below.
Pursuant to the terms of a corporate reorganization that will be completed simultaneously with the closing of this offering, (i) Vantage I and Vantage II will merge into subsidiaries of newly formed holding companies, Vantage Investment I and Vantage Investment II, that will be owned by the Existing Owners in equal proportions to their current ownership of Vantage I and Vantage II and (ii) Vantage Investment I and Vantage Investment II will contribute all of the interests in Vantage I and Vantage II to us in exchange for all of our issued and outstanding shares of common stock (prior to the issuance of shares of common stock in this offering). Following this offering, Vantage Investment I and Vantage Investment II will distribute to the Management Members a portion of the shares of common stock associated with such Management Members' initial investments in Vantage I and Vantage II, who will then hold the shares of common stock directly. As a result of the reorganization, Vantage I and Vantage II will become direct, wholly owned subsidiaries of Vantage Energy Inc.
We were incorporated to serve as the issuer in this offering and have no previous operations, assets or liabilities. As a result, we do not qualify as the accounting acquirer. Accordingly, in the corporate reorganization, the combination of our predecessor into us will be accounted for at historical cost and the combination of Vantage I into us will be accounted for at fair value as a business combination by applying the acquisition method. For more information on the ownership of our common stock by our principal stockholders, please see "Security Ownership of Certain Beneficial Owners and Management" and the unaudited pro forma financial statements included elsewhere in this prospectus.
165
The following diagram indicates the current ownership structure of Vantage.
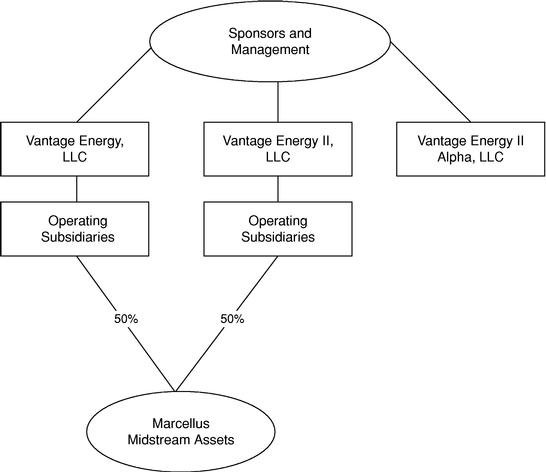
166
The following diagram indicates our simplified ownership structure after giving effect to our corporate reorganization and this offering (assuming that the underwriters' option to purchase additional shares is not exercised).
Please see "Description of Capital Stock" for additional information regarding the terms of our certificate of incorporation and bylaws as will be in effect upon the closing of this offering.
167
CERTAIN RELATIONSHIPS AND RELATED PARTY TRANSACTIONS
Corporate Reorganization
In connection with our corporate reorganization, we will engage in transactions with certain affiliates and our existing equity holders. Please see "Corporate Reorganization" for a description of these transactions.
Historical Transactions with Affiliates
Management Services Agreement
In August 2012, Vantage I and Vantage II entered into a Management Services Agreement ("MSA") whereby a subsidiary of Vantage I provides certain executive management, administrative, accounting, finance, engineering, land, and information technology assistance ("Management Services") to Vantage II. In exchange for receiving these services, Vantage II pays Vantage I a fee (the "MSA Fee"). The MSA Fee is based upon the gross general and administrative expenses incurred by Vantage I multiplied by a ratio of the relative capital expenditures and oil and natural gas production volumes of Vantage I and Vantage II. For the years ended December 31, 2015 and 2014, Vantage II recorded approximately $12.0 million and $8.7 million, respectively, of gross general and administrative expenses incurred under the MSA. As of December 31, 2015 and 2014, Vantage I had a net payable to Vantage II of approximately $1.1 million and $12.5 million, respectively, related to its interests in wells operated by Vantage II. In connection with the Alpha Acquisition, in June 2016, the MSA was amended and restated to provide Management Services to Vantage II Alpha and any other assets Vantage II operates pursuant to the Contract Operations Agreement discussed below. Following the completion of this offering and our corporate reorganization, however, we will manage both Vantage I and Vantage II.
MIU Notes Receivable
In December 2014, Vantage I and Vantage II made loans to Roger Biemans, our chief executive officer and director, and Thomas B. Tyree, Jr., our chief financial officer and director, in the form of notes receivable. Interest accrues on these notes at 0.34% per annum, and they mature upon the occurrence of specified events. As of December 31, 2015, the notes had a balance of $1.4 million. The notes are collateralized by a first lien interest in Messrs. Bieman's and Tyree's interest in their respective management incentive units and all potential dividends and distributions and a second lien on all other personal assets. Interest income was deemed de minimus for the year ended December 31, 2015.
On September 13, 2016, Vantage I and Vantage II each assigned the notes described above to entities controlled by the Sponsors. As a result, all repayment obligations of Messrs. Biemans or Tyree to either of Vantage I or Vantage II pursuant to the notes described above were terminated.
Derivative Novations
In January 2014, Vantage I entered into an agreement to sell certain derivative contracts to Vantage II, as approved by Wells Fargo Bank, N.A. Vantage I determined the total fair value of the derivative contracts on the date of transfer to be approximately $0.3 million.
Stockholders' Agreement
In connection with the closing of this offering, we expect Vantage Investment I and Vantage Investment II to enter into a voting agreement, pursuant to which they will agree to vote their shares of common stock in accordance with the terms thereof, including with respect to the election of directors.
168
Registration Rights Agreement
In connection with the closing of this offering, we expect to enter into a registration rights agreement with Vantage Investment I and Vantage Investment II. The registration rights agreement is expected to provide for customary rights for Vantage Investment I and Vantage Investment II to demand that we file a resale shelf registration statement or, in certain circumstances, conduct an underwritten offering of shares held by Vantage I and Vantage II. In addition, we expect that the agreement will grant Vantage Investment I and Vantage Investment II customary rights to participate in certain underwritten offerings of our common stock that we may conduct.
Procedures for Approval of Related Party Transactions
Prior to the closing of this offering, we have not maintained a policy for approval of Related Party Transactions. A "Related Party Transaction" is a transaction, arrangement or relationship in which we or any of our subsidiaries was, is or will be a participant, the amount of which involved exceeds $120,000, and in which any Related Person had, has or will have a direct or indirect material interest. A "Related Person" means:
- •
- any person who is, or at any time during the applicable period was, one of our executive officers or one of our directors;
- •
- any person who is known by us to be the beneficial owner of more than 5% of our common stock;
- •
- any immediate family member of any of the foregoing persons, which means any child, stepchild, parent, stepparent, spouse, sibling,
mother-in-law, father-in-law, son-in-law, daughter-in-law, brother-in-law or sister-in-law of a director, executive officer or a beneficial owner of more than 5% of our common stock, and any person
(other than a tenant or employee) sharing the household of such director, executive officer or beneficial owner of more than 5% of our common stock; and
- •
- any firm, corporation or other entity in which any of the foregoing persons is a partner or principal or in a similar position or in which such person has a 10% or greater beneficial ownership interest.
We anticipate that our board of directors will adopt a written related party transactions policy prior to the completion of this offering. Pursuant to this policy, we expect that our audit committee will review all material facts of all Related Party Transactions.
169
Upon completion of this offering the authorized capital stock of Vantage Energy Inc. will consist of shares of common stock, $0.01 par value per share, of which shares will be issued and outstanding, and shares of preferred stock, $0.01 par value per share, of which no shares will be issued and outstanding.
The following summary of the capital stock and amended and restated certificate of incorporation and amended and restated bylaws of Vantage Energy Inc. does not purport to be complete and is qualified in its entirety by reference to the provisions of applicable law and to our amended and restated certificate of incorporation and amended and restated bylaws, which are filed as exhibits to the registration statement of which this prospectus is a part.
Common Stock
Except as provided by law or in a preferred stock designation, holders of common stock are entitled to one vote for each share held of record on all matters submitted to a vote of the stockholders, will have the exclusive right to vote for the election of directors and do not have cumulative voting rights. Except as otherwise required by law, holders of common stock, are not entitled to vote on any amendment to the amended and restated certificate of incorporation (including any certificate of designations relating to any series of preferred stock) that relates solely to the terms of any outstanding series of preferred stock if the holders of such affected series are entitled, either separately or together with the holders of one or more other such series, to vote thereon pursuant to the amended and restated certificate of incorporation (including any certificate of designations relating to any series of preferred stock) or pursuant to the DGCL. Subject to prior rights and preferences that may be applicable to any outstanding shares or series of preferred stock, holders of common stock are entitled to receive ratably in proportion to the shares of common stock held by them such dividends (payable in cash, stock or otherwise), if any, as may be declared from time to time by our board of directors out of funds legally available for dividend payments. All outstanding shares of common stock are fully paid and non-assessable, and the shares of common stock to be issued upon completion of this offering will be fully paid and non-assessable. The holders of common stock have no preferences or rights of conversion, exchange, pre-emption or other subscription rights. There are no redemption or sinking fund provisions applicable to the common stock. In the event of any voluntary or involuntary liquidation, dissolution or winding-up of our affairs, holders of common stock will be entitled to share ratably in our assets in proportion to the shares of common stock held by then that are remaining after payment or provision for payment of all of our debts and obligations and after distribution in full of preferential amounts to be distributed to holders of outstanding shares of preferred stock, if any.
Preferred Stock
Our amended and restated certificate of incorporation authorizes our board of directors, subject to any limitations prescribed by law, without further stockholder approval, to establish and to issue from time to time one or more classes or series of preferred stock, par value $0.01 per share, covering up to an aggregate of shares of preferred stock. Each class or series of preferred stock will cover the number of shares and will have the powers, preferences, rights, qualifications, limitations and restrictions determined by the board of directors, which may include, among others, dividend rights, liquidation preferences, voting rights, conversion rights, preemptive rights and redemption rights. Except as provided by law or in a preferred stock designation, the holders of preferred stock will not be entitled to vote at or receive notice of any meeting of stockholders.
170
Anti-Takeover Effects of Provisions of Our Amended and Restated Certificate of Incorporation, our Amended and Restated Bylaws and Delaware Law
Some provisions of Delaware law, our amended and restated certificate of incorporation and our amended and restated bylaws will contain provisions that could make the following transactions more difficult: acquisitions of us by means of a tender offer, a proxy contest or otherwise; or removal of our incumbent officers and directors. These provisions may also have the effect of preventing changes in our management. It is possible that these provisions could make it more difficult to accomplish or could deter transactions that stockholders may otherwise consider to be in their best interest or in our best interests, including transactions that might result in a premium over the market price for our shares.
These provisions are expected to discourage coercive takeover practices and inadequate takeover bids. These provisions are also designed to encourage persons seeking to acquire control of us to first negotiate with us. We believe that the benefits of increased protection and our potential ability to negotiate with the proponent of an unfriendly or unsolicited proposal to acquire or restructure us outweigh the disadvantages of discouraging these proposals because, among other things, negotiation of these proposals could result in an improvement of their terms.
Delaware Law
Section 203 of the DGCL prohibits a Delaware corporation, including those whose securities are listed for trading on the NYSE, from engaging in any business combination with any interested stockholder for a period of three years following the date that the stockholder became an interested stockholder, unless:
- •
- the transaction is approved by the board of directors before the date the interested stockholder attained that status;
- •
- upon consummation of the transaction that resulted in the stockholder becoming an interested stockholder, the interested stockholder
owned at least 85% of the voting stock of the corporation outstanding at the time the transaction commenced; or
- •
- on or after such time the business combination is approved by the board of directors and authorized at a meeting of stockholders by at least two-thirds of the outstanding voting stock that is not owned by the interested stockholder.
We will elect to not be subject to the provisions of Section 203 of the DGCL.
Amended and Restated Certificate of Incorporation and Amended and Restated Bylaws
Provisions of our amended and restated certificate of incorporation and amended and restated bylaws, which will become effective upon the closing of this offering, may delay or discourage transactions involving an actual or potential change in control or change in our management, including transactions in which stockholders might otherwise receive a premium for their shares, or transactions that our stockholders might otherwise deem to be in their best interests. Therefore, these provisions could adversely affect the price of our common stock.
Among other things, upon the completion of this offering, our amended and restated certificate of incorporation and amended and restated bylaws will:
- •
- establish advance notice procedures with regard to stockholder proposals relating to the nomination of candidates for election as directors or new business to be brought before meetings of our stockholders. These procedures provide that notice of stockholder proposals must be timely given in writing to our corporate secretary prior to the meeting at which the action is to be taken. Generally, to be timely, notice must be received at our
171
- •
- provide our board of directors the ability to authorize undesignated preferred stock. This ability makes it possible for our board of
directors to issue, without stockholder approval, preferred stock with voting or other rights or preferences that could impede the success of any attempt to change control of us. These and other
provisions may have the effect of deferring hostile takeovers or delaying changes in control or management of our company;
- •
- provide that the authorized number of directors may be changed only by resolution of the board of directors;
- •
- provide that all vacancies, including newly created directorships, may, except as otherwise required by law or, if applicable, the
rights of holders of a series of preferred stock, be filled by the affirmative vote of a majority of directors then in office, even if less than a quorum;
- •
- at any time after the Sponsors and each of their respective affiliates no longer collectively beneficially own more than 50% of the
outstanding shares of our common stock,
- •
- provide that any action required or permitted to be taken by the stockholders must be effected at a duly called annual or
special meeting of stockholders and may not be effected by any consent in writing in lieu of a meeting of such stockholders, subject to the rights of the holders of any series of preferred stock with
respect to such series (prior to such time, such actions may be taken without a meeting by written consent of holders of common stock having not less than the minimum number of votes that would be
necessary to authorize such action at a meeting);
- •
- provide our certificate of incorporation and bylaws may be amended by the affirmative vote of the holders of at least
two-thirds of our then outstanding common stock (prior to such time, our certificate of incorporation and bylaws may be amended by the affirmative vote of the holders of a majority of our then
outstanding common stock); and
- •
- provide that special meetings of our stockholders may only be called by the board of directors, the chief executive
officer or the chairman of the board (prior to such time, a special meeting may also be called at the request of stockholders holding a majority of the outstanding shares entitled to vote);
- •
- provide for our board of directors to be divided into three classes of directors, with each class as nearly equal in number as
possible, serving staggered three year terms, other than directors which may be elected by holders of preferred stock, if any. This system of electing and removing directors may tend to discourage a
third party from making a tender offer or otherwise attempting to obtain control of us, because it generally makes it more difficult for stockholders to replace a majority of the directors;
- •
- provide that we renounce any interest in the business opportunities of the Sponsors or any of their officers, directors, agents,
stockholders, members, partners, affiliates, employees and subsidiaries (other than our directors that are presented business opportunities in their capacity as our directors) and that they have no
obligation to offer us those investments or opportunities; and
- •
- provide that our bylaws can be amended or repealed at any regular or special meeting of stockholders or by the board of directors, including the requirement that any amendment by
principal executive offices not less than 90 days nor more than 120 days prior to the first anniversary date of the annual meeting for the preceding year. Our amended and restated bylaws specify the requirements as to form and content of all stockholders' notices. These requirements may preclude stockholders from bringing matters before the stockholders at an annual or special meeting;
172
the stockholders at a meeting, at any time after the Sponsors and their respective affiliates no longer collectively own more than 50% of the outstanding shares of our common stock, be upon the affirmative vote of at least 662/3% of the shares of common stock generally entitled to vote in the election of directors.
Forum Selection
Our amended and restated certificate of incorporation will provide that unless we consent in writing to the selection of an alternative forum, a state court located within the State of Delaware (or, if no state court located within the state of Delaware has jurisdiction, the federal district court for the District of Delaware) will, to the fullest extent permitted by applicable law, be the sole and exclusive forum for:
- •
- any derivative action or proceeding brought on our behalf;
- •
- any action asserting a claim of breach of a fiduciary duty owed by any of our directors, officers or other employees to us or our
stockholders;
- •
- any action asserting a claim against us or any of our directors, officers or other employees arising pursuant to any provision of the
DGCL, our amended and restated certificate of incorporation or our bylaws; or
- •
- any action asserting a claim against us or any of our directors, officers or other employees that is governed by the internal affairs doctrine, in each such case subject to such Court of Chancery having personal jurisdiction over the indispensable parties named as defendants therein.
It is possible that a court could find our forum selection provision to be inapplicable or unenforceable.
Limitation of Liability and Indemnification Matters
Our amended and restated certificate of incorporation limits the liability of our directors for monetary damages for breach of their fiduciary duty as directors, except for liability that cannot be eliminated under the DGCL. Delaware law provides that directors of a company will not be personally liable for monetary damages for breach of their fiduciary duty as directors, except for liabilities:
- •
- for any breach of their duty of loyalty to us or our stockholders;
- •
- for acts or omissions not in good faith or which involve intentional misconduct or a knowing violation of law;
- •
- for unlawful payment of dividend or unlawful stock repurchase or redemption, as provided under Section 174 of the DGCL; or
- •
- for any transaction from which the director derived an improper personal benefit.
Any amendment, repeal or modification of these provisions will be prospective only and would not affect any limitation on liability of a director for acts or omissions that occurred prior to any such amendment, repeal or modification.
Our amended and restated certificate of incorporation and amended and restated bylaws also provide that we will indemnify our directors and officers to the fullest extent permitted by Delaware law. Our amended and restated certificate of incorporation and amended and restated bylaws also permit us to purchase insurance on behalf of any officer, director, employee or other agent for any liability arising out of that person's actions as our officer, director, employee or agent, regardless of
173
whether Delaware law would permit indemnification. We intend to enter into indemnification agreements with each of our current and future directors and officers. These agreements will require us to indemnify these individuals to the fullest extent permitted under Delaware law against liability that may arise by reason of their service to us, and to advance expenses incurred as a result of any proceeding against them as to which they could be indemnified. We believe that the limitation of liability provision in our amended and restated certificate of incorporation and the indemnification agreements will facilitate our ability to continue to attract and retain qualified individuals to serve as directors and officers.
Transfer Agent and Registrar
The transfer agent and registrar for our common stock will be American Stock Transfer & Trust Company, LLC.
Listing
We have applied to list our common stock on the New York Stock Exchange under the symbol "VEI".
174
SHARES ELIGIBLE FOR FUTURE SALE
Prior to this offering, there has been no public market for our common stock. Future sales of our common stock in the public market, or the availability of such shares for sale in the public market, could adversely affect the market price of our common stock prevailing from time to time. As described below, only a limited number of shares will be available for sale shortly after this offering due to contractual and legal restrictions on resale. Nevertheless, sales of a substantial number of shares of our common stock in the public market after such restrictions lapse, or the perception that those sales may occur, could adversely affect the prevailing market price of our common stock at such time and our ability to raise equity-related capital at a time and price we deem appropriate.
Sales of Restricted Shares
Upon completion of this offering, we will have outstanding an aggregate of shares of common stock. Of these shares, all of the shares of common stock to be sold in this offering (or shares assuming the underwriters exercise the option to purchase additional shares in full) will be freely tradable without restriction or further registration under the Securities Act, unless the shares are held by any of our "affiliates" as such term is defined in Rule 144 under the Securities Act. All remaining shares of common stock will be deemed "restricted securities" as such term is defined under Rule 144. The restricted securities were, or will be, issued and sold by us in private transactions and are eligible for public sale only if registered under the Securities Act or if they qualify for an exemption from registration under Rule 144 or Rule 701 under the Securities Act, which rules are summarized below.
As a result of the lock-up agreements described below and the provisions of Rule 144 and Rule 701 under the Securities Act, the shares of our common stock (excluding the shares to be sold in this offering) that will be available for sale in the public market are as follows:
- •
- no shares will be eligible for sale on the date of this prospectus or prior to 180 days after the date of this prospectus; and
- •
- shares will be eligible for sale upon the expiration of the lock-up agreements beginning 180 days after the date of this prospectus and when permitted under Rule 144 or Rule 701.
Lock-up Agreements
We, Vantage Investment I, Vantage Investment II, and all of our directors and executive officers have agreed not to sell any common stock or securities convertible into or exchangeable for shares of common stock for a period of 180 days from the date of this prospectus, subject to certain exceptions. Please see "Underwriting" for a description of these lock-up provisions.
Rule 144
In general, under Rule 144 under the Securities Act as currently in effect, a person (or persons whose shares are aggregated) who is not deemed to have been an affiliate of ours at any time during the three months preceding a sale, and who has beneficially owned restricted securities within the meaning of Rule 144 for a least six months (including any period of consecutive ownership of preceding non-affiliated holders) would be entitled to sell those shares, subject only to the availability of current public information about us. A non-affiliated person who has beneficially owned restricted securities within the meaning of Rule 144 for at least one year would be entitled to sell those shares without regard to the provisions of Rule 144.
175
A person (or persons whose shares are aggregated) who is deemed to be an affiliate of ours and who has beneficially owned restricted securities within the meaning of Rule 144 for at least six months would be entitled to sell within any three-month period a number of shares that does not exceed the greater of one percent of the then outstanding shares of our common stock or the average weekly trading volume of our common stock reported through the NYSE during the four calendar weeks preceding the filing of notice of the sale. Such sales are also subject to certain manner of sale provisions, notice requirements and the availability of current public information about us.
Rule 701
In general, under Rule 701 under the Securities Act, any of our employees, directors, officers, consultants or advisors who purchases shares from us in connection with a compensatory stock or option plan or other written agreement before the effective date of this offering is entitled to sell such shares 90 days after the effective date of this offering in reliance on Rule 144, without having to comply with the holding period requirement of Rule 144 and, in the case of non-affiliates, without having to comply with the public information, volume limitation or notice filing provisions of Rule 144. The SEC has indicated that Rule 701 will apply to typical stock options granted by an issuer before it becomes subject to the reporting requirements of the Exchange Act, along with the shares acquired upon exercise of such options, including exercises after the date of this prospectus.
Stock Issued Under Employee Plans
We intend to file a registration statement on Form S-8 under the Securities Act to register shares of common stock issuable under our long-term incentive plan. This registration statement on Form S-8 is expected to be filed following the effective date of the registration statement of which this prospectus is a part and will be effective upon filing. Accordingly, shares registered under such registration statement will be available for sale in the open market following the effective date, unless such shares are subject to vesting restrictions with us, Rule 144 restrictions applicable to our affiliates or the lock-up restrictions described above.
Registration Rights
We expect to enter into a stockholders' rights agreement with Vantage Investment I and Vantage Investment II which will require us to file and effect the registration of our common stock held thereby (and by certain of their affiliates) in certain circumstances no earlier than the expiration of the lock-up period contained in the underwriting agreement entered into in connection with this offering. Please see "Certain Relationships and Related Party Transactions — Registration Rights".
176
MATERIAL U.S. FEDERAL INCOME TAX CONSIDERATIONS FOR NON-U.S. HOLDERS
The following is a summary of the material U.S. federal income tax considerations related to the purchase, ownership and disposition of our common stock by a non-U.S. holder (as defined below), that holds our common stock as a "capital asset" (generally property held for investment). This summary is based on the provisions of the Internal Revenue Code of 1986, as amended (the "Code"), U.S. Treasury regulations, administrative rulings and judicial decisions, all as in effect on the date hereof, and all of which are subject to change, possibly with retroactive effect. We have not sought any ruling from the Internal Revenue Service ("IRS") with respect to the statements made and the conclusions reached in the following summary, and there can be no assurance that the IRS or a court will agree with such statements and conclusions.
This summary does not address all aspects of U.S. federal income taxation that may be relevant to non-U.S. holders in light of their personal circumstances. In addition, this summary does not address the Medicare tax on certain investment income, U.S. federal estate or gift tax laws, any state, local or non-U.S. tax laws or any tax treaties. This summary also does not address tax considerations applicable to investors that may be subject to special treatment under the U.S. federal income tax laws, such as:
- •
- banks, insurance companies or other financial institutions;
- •
- tax-exempt or governmental organizations;
- •
- qualified foreign pension plans;
- •
- dealers in securities or foreign currencies;
- •
- traders in securities that use the mark-to-market method of accounting for U.S. federal income tax purposes;
- •
- persons subject to the alternative minimum tax;
- •
- partnerships or other pass-through entities for U.S. federal income tax purposes or holders of interests therein;
- •
- persons deemed to sell our common stock under the constructive sale provisions of the Code;
- •
- persons that acquired our common stock through the exercise of employee stock options or otherwise as compensation or through a
tax-qualified retirement plan;
- •
- certain former citizens or long-term residents of the United States; and
- •
- persons that hold our common stock as part of a straddle, appreciated financial position, synthetic security, hedge, conversion transaction, wash sale or other integrated investment or risk reduction transaction.
PROSPECTIVE INVESTORS ARE ENCOURAGED TO CONSULT THEIR TAX ADVISORS WITH RESPECT TO THE APPLICATION OF THE U.S. FEDERAL INCOME TAX LAWS TO THEIR PARTICULAR SITUATION, AS WELL AS ANY TAX CONSEQUENCES OF THE PURCHASE, OWNERSHIP AND DISPOSITION OF OUR COMMON STOCK ARISING UNDER THE U.S. FEDERAL ESTATE OR GIFT TAX LAWS OR UNDER THE LAWS OF ANY STATE, LOCAL, NON-U.S. OR OTHER TAXING JURISDICTION OR UNDER ANY APPLICABLE INCOME TAX TREATY.
177
Non-U.S. Holder Defined
For purposes of this discussion, a "non-U.S. holder" is a beneficial owner of our common stock that is not for U.S. federal income tax purposes a partnership or any of the following:
- •
- an individual who is a citizen or resident of the United States;
- •
- a corporation (or other entity treated as a corporation for U.S. federal income tax purposes) created or organized in or under the
laws of the United States, any state thereof or the District of Columbia;
- •
- an estate the income of which is subject to U.S. federal income tax regardless of its source; or
- •
- a trust (i) whose administration is subject to the primary supervision of a U.S. court and which has one or more United States persons who have the authority to control all substantial decisions of the trust or (ii) which has made a valid election under applicable U.S. Treasury regulations to be treated as a United States person.
If a partnership (including an entity or arrangement treated as a partnership for U.S. federal income tax purposes) holds our common stock, the tax treatment of a partner in the partnership generally will depend upon the status of the partner, upon the activities of the partnership and upon certain determinations made at the partner level. Accordingly, we urge partners in partnerships (including entities or arrangements treated as partnerships for U.S. federal income tax purposes) considering the purchase of our common stock to consult their tax advisors regarding the U.S. federal income tax considerations of the purchase, ownership and disposition of our common stock by such partnership.
Distributions
As described in the section entitled "Dividend Policy", we do not plan to make any distributions on our common stock for the foreseeable future. However, if we do make distributions of cash or property on our common stock, those distributions will constitute dividends for U.S. federal income tax purposes to the extent paid from our current or accumulated earnings and profits, as determined under U.S. federal income tax principles. To the extent those distributions exceed our current and accumulated earnings and profits, the distributions will be treated as a non-taxable return of capital reducing the non-U.S. holder's tax basis in our common stock (determined on a share-by-share basis), but not below zero, and thereafter as capital gain from the sale or exchange of such common stock. Please see "— Gain on Disposition of Common Stock". Subject to the withholding requirements under FATCA (as defined below) and with respect to effectively connected dividends, each of which is discussed below, any distribution made to a non-U.S. holder on our common stock generally will be subject to U.S. withholding tax at a rate of 30% of the gross amount of the distribution unless an applicable income tax treaty provides for a lower rate. To receive the benefit of a reduced treaty rate, a non-U.S. holder must (i) provide the applicable withholding agent with an IRS Form W-8BEN or IRS Form W-8BEN-E (or other applicable or successor form) certifying qualification for the reduced rate or (ii) if shares of our common stock are held through certain foreign intermediaries, satisfy the relevant certification requirements of applicable U.S. Treasury regulations.
178
Dividends paid to a non-U.S. holder that are effectively connected with a trade or business conducted by the non-U.S. holder in the United States (and, if required by an applicable income tax treaty, are treated as attributable to a permanent establishment maintained by the non-U.S. holder in the United States) generally will be taxed on a net income basis at the rates and in the manner generally applicable to United States persons (as defined under the Code). Such effectively connected dividends will not be subject to U.S. withholding tax if the non-U.S. holder satisfies certain certification requirements by providing the applicable withholding agent a properly executed IRS Form W-8ECI certifying eligibility for exemption. If the non-U.S. holder is a non-U.S. corporation, it may also be subject to a branch profits tax (at a 30% rate or such lower rate as specified by an applicable income tax treaty) on its effectively connected earnings and profits (as adjusted for certain items), which will include effectively connected dividends.
Gain on Disposition of Common Stock
Subject to the discussion below under "— Additional Withholding Requirements under FATCA", a non-U.S. holder generally will not be subject to U.S. federal income tax on any gain realized upon the sale or other disposition of our common stock (not including any proceeds attributable to declared and unpaid dividends, which will be treated as a taxable distribution to the non-U.S. holder, as described above in "Distributions" to non-U.S. holders of record who have not previously included such dividends in income) unless:
- •
- the non-U.S. holder is an individual who is present in the United States for a period or periods aggregating 183 days or more
during the calendar year in which the sale or disposition occurs and certain other conditions are met;
- •
- the gain is effectively connected with a trade or business conducted by the non-U.S. holder in the United States (and, if required by
an applicable income tax treaty, is attributable to a permanent establishment maintained by the non-U.S. holder in the United States); or
- •
- our common stock constitutes a United States real property interest by reason of our status as a United States real property holding corporation ("USRPHC") for U.S. federal income tax purposes during the shorter of the five-year period preceding the date of the disposition or the non-U.S. holders' holding period for our common stock.
A non-U.S. holder described in the first bullet point above will be subject to U.S. federal income tax at a rate of 30% (or such lower rate as specified by an applicable income tax treaty) on the amount of such gain, which generally may be offset by U.S. source capital losses.
A non-U.S. holder whose gain is described in the second bullet point above generally will be taxed on a net income basis at the rates and in the manner generally applicable to United States persons (as defined under the Code) unless an applicable income tax treaty provides otherwise. If the non-U.S. holder is a corporation, it may also be subject to a branch profits tax (at a 30% rate or such lower rate specified by an applicable income tax treaty) on its effectively connected earnings and profits (as adjusted for certain items), which will include such gain.
Generally, a corporation is a USRPHC if the fair market value of its United States real property interests equals or exceeds 50% of the sum of the fair market value of its worldwide real property interests and its other assets used or held for use in a trade or business. We believe that we currently are, and expect to remain for the foreseeable future, a USRPHC for U.S. federal income tax purposes. However, as long as our common stock continues to be regularly traded on an established securities market, only a non-U.S. holder that actually or constructively owns or owned at any time during the shorter of the five-year period ending on the date of the disposition or the non-U.S. holder's holding period for the common stock, more than 5% of our common stock will be
179
taxable on gain realized on the disposition of our common stock as a result of our status as a USRPHC. If our common stock were not considered to be regularly traded during the calendar year in which the relevant disposition by a non-U.S. holder occurs, such holder (regardless of the percentage of stock owned) would be subject to U.S. federal income tax on a taxable disposition of our common stock (as described in the preceding paragraph), and a 15% withholding tax would apply to the gross proceeds from such disposition.
Non-U.S. holders should consult their tax advisors with respect to the application of the foregoing rules to their ownership and disposition of our common stock.
Backup Withholding and Information Reporting
Any dividends paid to a non-U.S. holder must be reported annually to the IRS and to the non-U.S. holder. Copies of these information returns may be made available to the tax authorities in the country in which the non-U.S. holder resides or is established. Payments of dividends to a non-U.S. holder generally will not be subject to backup withholding if the non-U.S. holder establishes an exemption by properly certifying its non-U.S. status on an IRS Form W-8BEN, IRS Form W-8BEN-E or other appropriate version of IRS Form W-8.
Payments of the proceeds from a sale or other disposition by a non-U.S. holder of our common stock effected by or through a U.S. office of a broker generally will be subject to information reporting and backup withholding (currently imposed at a rate of 28%) unless the non-U.S. holder establishes an exemption by properly certifying its non-U.S. status on an IRS Form W-8BEN, IRS Form W-8BEN-E or other appropriate version of IRS Form W-8 and certain other conditions are met. Information reporting and backup withholding generally will not apply to any payment of the proceeds from a sale or other disposition of our common stock effected outside the United States by a non-U.S. office of a broker. However, unless such broker has documentary evidence in its records that the holder is not a United States person and certain other conditions are met, or the non-U.S. holder otherwise establishes an exemption, information reporting will apply to a payment of the proceeds of the disposition of our common stock effected outside the United States by such a broker if it has certain relationships within the United States.
Backup withholding is not an additional tax. Rather, the U.S. income tax liability (if any) of persons subject to backup withholding will be reduced by the amount of tax withheld. If backup withholding results in an overpayment of taxes, a refund may be obtained, provided that the required information is timely furnished to the IRS.
Additional Withholding Requirements under FATCA
Sections 1471 through 1474 of the Code, and the U.S. Treasury regulations and administrative guidance issued thereunder ("FATCA"), impose a 30% withholding tax on any dividends paid on our common stock and on the gross proceeds from a disposition of our common stock (if such disposition occurs after December 31, 2018), in each case if paid to a "foreign financial institution" or a "non-financial foreign entity" (each as defined in the Code) (including, in some cases, when such foreign financial institution or non-financial foreign entity is acting as an intermediary), unless (i) in the case of a foreign financial institution, such institution enters into an agreement with the U.S. government to withhold on certain payments, and to collect and provide to the U.S. tax authorities substantial information regarding U.S. account holders of such institution (which includes certain equity and debt holders of such institution, as well as certain account holders that are non-U.S. entities with U.S. owners); (ii) in the case of a non-financial foreign entity, such entity certifies that it does not have any "substantial United States owners" (as defined in the Code) or provides the applicable withholding agent with a certification identifying the direct and indirect
180
substantial United States owners of the entity (in either case, generally on an IRS Form W-8BEN-E); or (iii) the foreign financial institution or non-financial foreign entity otherwise qualifies for an exemption from these rules and provides appropriate documentation (such as an IRS Form W-8BEN-E). Foreign financial institutions located in jurisdictions that have an intergovernmental agreement with the United States governing these rules may be subject to different rules. Under certain circumstances, a holder might be eligible for refunds or credits of such taxes.
INVESTORS CONSIDERING THE PURCHASE OF OUR COMMON STOCK ARE URGED TO CONSULT THEIR OWN TAX ADVISORS REGARDING THE APPLICATION OF THE U.S. FEDERAL INCOME TAX LAWS TO THEIR PARTICULAR SITUATIONS AND THE APPLICABILITY AND EFFECT OF U.S. FEDERAL ESTATE AND GIFT TAX LAWS AND ANY STATE, LOCAL OR NON-U.S. TAX LAWS AND TAX TREATIES.
181
The company and the underwriters named below have entered into an underwriting agreement with respect to the shares being offered. Subject to certain conditions, each underwriter has severally agreed to purchase the number of shares indicated in the following table. Goldman, Sachs & Co., Barclays Capital Inc. and Credit Suisse Securities (USA) LLC are the representatives of the underwriters.
Underwriters |
| Number of Shares |
| |||
Goldman, Sachs & Co. |
| | | | ||
Barclays Capital Inc. |
| | | | ||
Credit Suisse Securities (USA) LLC |
| | | | ||
Citigroup Global Markets Inc. |
| | | | ||
J.P. Morgan Securities LLC |
| | | | ||
Wells Fargo Securities, LLC |
| | | | ||
Merrill Lynch, Pierce, Fenner & Smith |
| | | | ||
Capital One Securities, Inc. |
| | | | ||
Deutsche Bank Securities Inc. |
| | | | ||
KeyBanc Capital Markets Inc. |
| | | | ||
SunTrust Robinson Humphrey, Inc. |
| | | | ||
Tudor, Pickering, Holt & Co. Securities, Inc. |
| | | | ||
ABN AMRO Securities (USA) LLC |
| | | | ||
Robert W. Baird & Co. |
| | | | ||
BOK Financial Securities, Inc. |
| | | | ||
Fifth Third Securities, Inc. |
| | | | ||
Heikkinen Energy Securities, L.L.C. |
| | | | ||
Williams Trading, LLC |
| | | | ||
| | | | | |||
Total |
| | | | ||
| | | | | |||
| | | | | | | |
| | | | | |||
The underwriters are committed to take and pay for all of the shares being offered, if any are taken, other than the shares covered by the option described below unless and until this option is exercised.
The underwriters have an option to buy up to an additional shares from the company to cover sales by the underwriters of a greater number of shares than the total number set forth in the table above. They may exercise that option for 30 days. If any shares are purchased pursuant to this option, the underwriters will severally purchase shares in approximately the same proportion as set forth in the table above.
Commissions and Expenses
The following table shows the per share and total underwriting discounts and commissions to be paid to the underwriters by the company. Such amounts are shown assuming both no exercise and full exercise of the underwriters' option to purchase additional shares.
|
| No Exercise | | Full Exercise |
| ||||||
| | | | | | | ||||||
Per Share |
| | $ | | | | $ | | | ||
Total |
| | $ | | | | $ | | | ||
Shares sold by the underwriters to the public will initially be offered at the initial public offering price set forth on the cover of this prospectus. Any shares sold by the underwriters to securities dealers may be sold at a discount of up to $ per share from the initial public offering price.
182
After the initial offering of the shares, the representatives may change the offering price and the other selling terms. The offering of the shares by the underwriters is subject to receipt and acceptance and subject to the underwriters' right to reject any order in whole or in part.
The company estimates that their share of the total expenses of the offering, excluding underwriting discounts and commissions, will be approximately $ .
Lock-Up Agreements
The company and its officers, directors, and holders of substantially all of the company's common stock have agreed with the underwriters, subject to certain exceptions, not to dispose of or hedge any of their common stock or securities convertible into or exchangeable for shares of common stock during the period from the date of this prospectus continuing through the date 180 days after the date of this prospectus, except with the prior written consent of Goldman, Sachs & Co. This agreement does not apply to any existing employee benefit plans.
Offering Price Determination
Prior to the offering, there has been no public market for the shares. The initial public offering price has been negotiated among the company and the representatives. Among the factors to be considered in determining the initial public offering price of the shares, in addition to prevailing market conditions, will be the company's historical performance, estimates of the business potential and earnings prospects of the company, an assessment of the company's management and the consideration of the above factors in relation to market valuation of companies in related businesses.
Indemnification
The company has agreed to indemnify the several underwriters against certain liabilities, including liabilities under the Securities Act of 1933.
Directed Share Program
At our request, the underwriters have reserved for sale at the initial public offering price up to of the shares offered hereby (approximately %) for officers, directors, employees and certain other persons associated with us. The number of shares available for sale to the general public will be reduced to the extent such persons purchase such reserved shares. Any reserved shares not so purchased will be offered by the underwriters to the general public on the same basis as the other shares offered hereby. Any participants in this program shall be prohibited from selling, pledging or assigning any shares sold to them pursuant to this program for a period of 180 days after the date of this prospectus.
New York Stock Exchange
The company has applied to list the common stock on the NYSE under the symbol "VEI". In order to meet one of the requirements for listing the common stock on the NYSE, the underwriters will undertake to sell lots of 100 or more shares to a minimum of 400 beneficial holders.
Short Positions, Stabilization and Penalty Bids
In connection with the offering, the underwriters may purchase and sell shares of common stock in the open market. These transactions may include short sales, stabilizing transactions and purchases to cover positions created by short sales. Short sales involve the sale by the underwriters of a greater number of shares than they are required to purchase in the offering, and a short position represents the amount of such sales that have not been covered by subsequent purchases. A "covered short position" is a short position that is not greater than the amount of
183
additional shares for which the underwriters' option described above may be exercised. The underwriters may cover any covered short position by either exercising their option to purchase additional shares or purchasing shares in the open market. In determining the source of shares to cover the covered short position, the underwriters will consider, among other things, the price of shares available for purchase in the open market as compared to the price at which they may purchase additional shares pursuant to the option described above. "Naked" short sales are any short sales that create a short position greater than the amount of additional shares for which the option described above may be exercised. The underwriters must cover any such naked short position by purchasing shares in the open market. A naked short position is more likely to be created if the underwriters are concerned that there may be downward pressure on the price of the common stock in the open market after pricing that could adversely affect investors who purchase in the offering. Stabilizing transactions consist of various bids for or purchases of common stock made by the underwriters in the open market prior to the completion of the offering.
The underwriters may also impose a penalty bid. This occurs when a particular underwriter repays to the underwriters a portion of the underwriting discount received by it because the representatives have repurchased shares sold by or for the account of such underwriter in stabilizing or short covering transactions.
Purchases to cover a short position and stabilizing transactions, as well as other purchases by the underwriters for their own accounts, may have the effect of preventing or retarding a decline in the market price of the company's stock, and together with the imposition of the penalty bid, may stabilize, maintain or otherwise affect the market price of the common stock. As a result, the price of the common stock may be higher than the price that otherwise might exist in the open market. The underwriters are not required to engage in these activities and may end any of these activities at any time. These transactions may be effected on the NYSE, in the over-the-counter market or otherwise.
Electronic Distribution
A prospectus in electronic format may be made available on the Internet sites or through other online services maintained by one or more of the underwriters participating in this offering, or by their affiliates. In those cases, prospective investors may view offering terms online and, depending upon the particular underwriter, prospective investors may be allowed to place orders online. The underwriters may agree with us to allocate a specific number of shares for sale to online brokerage account holders. Any such allocation for online distributions will be made by the representative on the same basis as other allocations.
Other than the prospectus in electronic format, the information on any underwriter's website and any information contained in any other website maintained by an underwriter is not part of the prospectus or the registration statement of which this prospectus forms a part, has not been approved and/or endorsed by us or any underwriter in its capacity as underwriter and should not be relied upon by investors.
Relationships
The underwriters and their respective affiliates are full service financial institutions engaged in various activities, which may include sales and trading, commercial and investment banking, advisory, investment management, investment research, principal investment, hedging, market making, brokerage and other financial and non-financial activities and services. Certain of the underwriters and their respective affiliates have provided, and may in the future provide, a variety of these services to the issuer and to persons and entities with relationships with the company, for which they received or will receive customary fees and expenses. In particular, affiliates of Goldman, Sachs & Co. are counterparties to a significant amount of our existing hedging arrangements,
184
which were negotiated at an arms' length basis and contain customary terms for such arrangements, which may include customary payments to the hedge counterparty under certain circumstances.
In the ordinary course of their various business activities, the underwriters and their respective affiliates, officers, directors and employees may purchase, sell or hold a broad array of investments and actively trade securities, derivatives, loans, commodities, currencies, credit default swaps and other financial instruments for their own account and for the accounts of their customers, and such investment and trading activities may involve or relate to assets, securities and/or instruments of the issuer (directly, as collateral securing other obligations or otherwise) and/or persons and entities with relationships with the issuer. The underwriters and their respective affiliates may also communicate independent investment recommendations, market color or trading ideas and/or publish or express independent research views in respect of such assets, securities or instruments and may at any time hold, or recommend to clients that they should acquire, long and/or short positions in such assets, securities and instruments.
Selling Restrictions
European Economic Area
In relation to each Member State of the European Economic Area which has implemented the Prospectus Directive (each, a Relevant Member State), an offer of shares to the public may not be made in that Relevant Member State, except that an offer of shares to the public may be made at any time under the following exemptions under the Prospectus Directive, if they have been implemented in that Relevant Member State:
(a) to any legal entity which is a qualified investor as defined in the Prospectus Directive;
(b) to fewer than 100 or, if the Relevant Member State has implemented the relevant provisions of the 2010 Amending Directive, 150, natural or legal persons (other than qualified investors as defined in the Prospectus Directive) subject to obtaining the prior consent of the representatives for any such offer; or
(c) in any other circumstances falling within Article 3(2) of the Prospectus Directive,
provided that no such offer of shares shall result in a requirement for the publication of a prospectus pursuant to Article 3 of the Prospectus Directive or any measure implementing the Prospectus Directive in a Relevant Member State and each person who initially acquires any shares or to whom an offer is made will be deemed to have represented, warranted and agreed to and with the underwriters that it is a qualified investor within the meaning of the law in that Relevant Member State implementing Article 2(1)(e) of the Prospectus Directive.
For the purposes of this provision, the expression an "offer of shares to the public" in relation to any shares in any Relevant Member State means the communication in any form and by any means of sufficient information on the terms of the offer and the shares to be offered so as to enable an investor to decide to purchase or subscribe the shares, as the same may be varied in that Relevant Member State by any measure implementing the Prospectus Directive in that Relevant Member State, the expression Prospectus Directive means Directive 2003/71/EC (and amendments thereto, including the 2010 PD Amending Directive, to the extent implemented in the Relevant Member State) and includes any relevant implementing measure in each Relevant Member State.
In the case of any shares being offered to a financial intermediary as that term is used in Article 3(2) of the Prospectus Directive, such financial intermediary will also be deemed to have represented, acknowledged and agreed that the shares acquired by it in the offer have not been acquired on a non-discretionary basis on behalf of, nor have they been acquired with a view to their
185
offer or resale to, persons in circumstances which may give rise to an offer of shares to the public other than their offer or resale in a Relevant Member State to qualified investors as so defined or in circumstances in which the prior consent of the underwriters has been obtained to each such proposed offer or resale.
United Kingdom
In the United Kingdom, this prospectus is only addressed to and directed as qualified investors who are (i) investment professionals falling within Article 19(5) of the Financial Services and Markets Act 2000 (Financial Promotion) Order 2005 (the "Order"); or (ii) high net worth entities and other persons to whom it may lawfully be communicated, falling within Article 49(2)(a) to (d) of the Order (all such persons together being referred to as "relevant persons"). Any investment or investment activity to which this prospectus relates is available only to relevant persons and will only be engaged with relevant persons. Any person who is not a relevant person should not act or relay on this prospectus or any of its contents.
Hong Kong
The shares may not be offered or sold in Hong Kong by means of any document other than (i) in circumstances which do not constitute an offer to the public within the meaning of the Companies (Winding Up and Miscellaneous Provisions) Ordinance (Cap. 32 of the Laws of Hong Kong) ("Companies (Winding Up and Miscellaneous Provisions) Ordinance") or which do not constitute an invitation to the public within the meaning of the Securities and Futures Ordinance (Cap. 571 of the Laws of Hong Kong) ("Securities and Futures Ordinance"), or (ii) to "professional investors" as defined in the Securities and Futures Ordinance and any rules made thereunder, or (iii) in other circumstances which do not result in the document being a "prospectus" as defined in the Companies (Winding Up and Miscellaneous Provisions) Ordinance, and no advertisement, invitation or document relating to the shares may be issued or may be in the possession of any person for the purpose of issue (in each case whether in Hong Kong or elsewhere), which is directed at, or the contents of which are likely to be accessed or read by, the public in Hong Kong (except if permitted to do so under the securities laws of Hong Kong) other than with respect to shares which are or are intended to be disposed of only to persons outside Hong Kong or only to "professional investors" in Hong Kong as defined in the Securities and Futures Ordinance and any rules made thereunder.
Singapore
This prospectus has not been registered as a prospectus with the Monetary Authority of Singapore. Accordingly, this prospectus and any other document or material in connection with the offer or sale, or invitation for subscription or purchase, of the shares may not be circulated or distributed, nor may the shares be offered or sold, or be made the subject of an invitation for subscription or purchase, whether directly or indirectly, to persons in Singapore other than (i) to an institutional investor (as defined under Section 4A of the Securities and Futures Act, Chapter 289 of Singapore (the "SFA")) under Section 274 of the SFA, (ii) to a relevant person (as defined in Section 275(2) of the SFA) pursuant to Section 275(1) of the SFA, or any person pursuant to Section 275(1A) of the SFA, and in accordance with the conditions specified in Section 275 of the SFA or (iii) otherwise pursuant to, and in accordance with the conditions of, any other applicable provision of the SFA, in each case subject to conditions set forth in the SFA.
Where the shares are subscribed or purchased under Section 275 of the SFA by a relevant person which is a corporation (which is not an accredited investor (as defined in Section 4A of the SFA)) the sole business of which is to hold investments and the entire share capital of which is owned by one or more individuals, each of whom is an accredited investor, the securities (as defined in Section 239(1) of the SFA) of that corporation shall not be transferable for 6 months after
186
that corporation has acquired the shares under Section 275 of the SFA except: (1) to an institutional investor under Section 274 of the SFA or to a relevant person (as defined in Section 275(2) of the SFA), (2) where such transfer arises from an offer in that corporation's securities pursuant to Section 275(1A) of the SFA, (3) where no consideration is or will be given for the transfer, (4) where the transfer is by operation of law, (5) as specified in Section 276(7) of the SFA, or (6) as specified in Regulation 32 of the Securities and Futures (Offers of Investments) (Shares and Debentures) Regulations 2005 of Singapore ("Regulation 32")
Where the shares are subscribed or purchased under Section 275 of the SFA by a relevant person which is a trust (where the trustee is not an accredited investor (as defined in Section 4A of the SFA)) whose sole purpose is to hold investments and each beneficiary of the trust is an accredited investor, the beneficiaries' rights and interest (howsoever described) in that trust shall not be transferable for 6 months after that trust has acquired the shares under Section 275 of the SFA except: (1) to an institutional investor under Section 274 of the SFA or to a relevant person (as defined in Section 275(2) of the SFA), (2) where such transfer arises from an offer that is made on terms that such rights or interest are acquired at a consideration of not less than S$200,000 (or its equivalent in a foreign currency) for each transaction (whether such amount is to be paid for in cash or by exchange of securities or other assets), (3) where no consideration is or will be given for the transfer, (4) where the transfer is by operation of law, (5) as specified in Section 276(7) of the SFA, or (6) as specified in Regulation 32.
Japan
The securities have not been and will not be registered under the Financial Instruments and Exchange Act of Japan (Act No. 25 of 1948, as amended), or the FIEA. The securities may not be offered or sold, directly or indirectly, in Japan or to or for the benefit of any resident of Japan (including any person resident in Japan or any corporation or other entity organized under the laws of Japan) or to others for reoffering or resale, directly or indirectly, in Japan or to or for the benefit of any resident of Japan, except pursuant to an exemption from the registration requirements of the FIEA and otherwise in compliance with any relevant laws and regulations of Japan.
Canada
The securities may be sold in Canada only to purchasers purchasing, or deemed to be purchasing, as principal that are accredited investors, as defined in National Instrument 45-106 Prospectus Exemptions or subsection 73.3(1) of the Securities Act (Ontario), and are permitted clients, as defined in National Instrument 31-103 Registration Requirements, Exemptions and Ongoing Registrant Obligations. Any resale of the securities must be made in accordance with an exemption from, or in a transaction not subject to, the prospectus requirements of applicable securities laws.
Securities legislation in certain provinces or territories of Canada may provide a purchaser with remedies for rescission or damages if this prospectus (including any amendment thereto) contains a misrepresentation, provided that the remedies for rescission or damages are exercised by the purchaser within the time limit prescribed by the securities legislation of the purchaser's province or territory. The purchaser should refer to any applicable provisions of the securities legislation of the purchaser's province or territory for particulars of these rights or consult with a legal advisor.
Pursuant to section 3A.3 of National Instrument 33-105 Underwriting Conflicts (NI 33-105), the underwriters are not required to comply with the disclosure requirements of NI 33-105 regarding underwriter conflicts of interest in connection with this offering.
187
The validity of our common stock offered by this prospectus will be passed upon for us by Vinson & Elkins L.L.P., Houston, Texas. Certain legal matters in connection with this offering will be passed upon for the underwriters by Kirkland & Ellis LLP, Houston, Texas.
The consolidated financial statements of Vantage Energy II, LLC as of December 31, 2014 and 2015 and for each of the years in the two-year period ended December 31, 2015, have been included herein in reliance upon the report of KPMG LLP, independent registered public accounting firm, appearing elsewhere herein, and upon the authority of said firm as experts in accounting and auditing.
The consolidated financial statements of Vantage Energy, LLC as of December 31, 2014 and 2015 and for each of the years in the two-year period ended December 31, 2015, have been included herein in reliance upon the report of KPMG LLP, independent registered public accounting firm, appearing elsewhere herein, and upon the authority of said firm as experts in accounting and auditing.
The balance sheet of Vantage Energy Inc. as of June 30, 2016, has been included herein in reliance upon the report of KPMG LLP, independent registered public accounting firm, appearing elsewhere herein, and upon authority of said firm as experts in accounting and auditing.
Estimates of our oil and natural gas reserves, related future net cash flows and the present values thereof related to our properties as of December 31, 2015 included elsewhere in this prospectus were based upon reserve reports prepared by independent petroleum engineers Netherland, Sewell & Associates, Inc. and Wright & Company, Inc. We have included these estimates in reliance on the authority of such firms as experts in such matters.
WHERE YOU CAN FIND MORE INFORMATION
We have filed with the SEC a registration statement on Form S-1 (including the exhibits, schedules and amendments thereto) under the Securities Act, with respect to the shares of our common stock offered hereby. This prospectus does not contain all of the information set forth in the registration statement and the exhibits and schedules thereto. For further information with respect to the common stock offered hereby, we refer you to the registration statement and the exhibits and schedules filed therewith. Statements contained in this prospectus as to the contents of any contract, agreement or any other document are summaries of the material terms of such contract, agreement or other document and are not necessarily complete. With respect to each of these contracts, agreements or other documents filed as an exhibit to the registration statement, reference is made to the exhibits for a more complete description of the matter involved. A copy of the registration statement, and the exhibits and schedules thereto, may be inspected without charge at the public reference facilities maintained by the SEC at 100 F Street NE, Washington, D.C. 20549. Copies of these materials may be obtained, upon payment of a duplicating fee, from the Public Reference Room of the SEC at 100 F Street NE, Washington, D.C. 20549. Please call the SEC at 1-800-SEC-0330 for further information on the operation of the Public Reference Room. The SEC maintains a website that contains reports, proxy and information statements and other information regarding registrants that file electronically with the SEC. The address of the SEC's website is www.sec.gov.
As a result of the offering, we will become subject to full information requirements of the Exchange Act. We will fulfill our obligations with respect to such requirements by filing periodic reports and other information with the SEC. We intend to furnish our stockholders with annual reports containing financial statements certified by an independent public accounting firm.
188
INDEX TO CONSOLIDATED FINANCIAL STATEMENTS
F-1
VANTAGE ENERGY INC.
PRO FORMA CONDENSED COMBINED FINANCIAL STATEMENTS
(Unaudited)
The following unaudited pro forma combined statements of operations of Vantage Energy Inc. (the "Company") for the year ended December 31, 2015 and the six months ended June 30, 2016 and the unaudited pro forma combined balance sheet as of June 30, 2016 give effect to (i) the corporate reorganization transactions as described under "— Corporate Reorganization" and (ii) the issuance by the Company of shares of common stock in this initial public offering (the "Offering") for $ million of gross proceeds and the Company's application of such proceeds as described in "Use of Proceeds", included elsewhere in this prospectus.
The unaudited pro forma combined financial statements are derived from the audited historical financial statements of the Company, Vantage Energy, LLC ("Vantage I") and Vantage Energy II, LLC ("Vantage II") and should be read together with those financial statements and related notes contained therein, which are included elsewhere in this prospectus.
The unaudited pro forma combined balance sheet has been prepared as if the corporate reorganization and the Offering were completed on June 30, 2016. The unaudited pro forma combined statements of operations for the year ended December 31, 2015 and the six months ended June 30, 2016 were prepared as if the corporate reorganization and the Offering were completed on January 1, 2015. The adjustments made in these unaudited pro forma combined financial statements are based upon currently available information and certain estimates and assumptions primarily related to the fair value of acquired oil and gas properties. It is expected that the acquisition of Vantage I by Vantage II will result in a significant amount of goodwill for the excess of the consideration over the net assets received, representing the future economic benefits arising from assets acquired that could not be individually identified and separately recognized. The fair value of the purchase consideration will be based upon fair value of the common stock issued in the corporate reorganization. Factors which will impact the allocation of the purchase consideration include the estimated fair value of proved and unproved reserves, the expected timing and amount of future development and operating costs, projections of future rates of production, expected recovery rates and risk adjusted discount rates. Actual effects of the transactions may vary widely from the pro forma adjustments due to the current uncertainty of the fair value of the shares of common stock to be issued in this offering. Management believes, however, that the assumptions provide a reasonable basis for presenting the significant effects of the corporate reorganization and the Offering and that the pro forma adjustments are factually supportable, give appropriate effect to those assumptions and are properly applied. The unaudited pro forma condensed consolidated financial statements should be read in conjunction with the notes accompanying such unaudited pro forma condensed combined financial statements as well as "Use of Proceeds" and "Management's Discussion and Analysis of Financial Condition and Results of Operations", each included elsewhere in this prospectus.
The unaudited pro forma combined financial statements are presented for illustrative purposes only and do not purport to indicate the financial condition or results of operations of future periods or the financial condition or results of operations that actually would have been realized had the corporate reorganization and the Offering been consummated on the dates or for the periods presented. In addition, the unaudited pro forma condensed combined financial statements are not a projection of the results of operations or financial position for any future period or date.
F-2
VANTAGE ENERGY INC.
PRO FORMA CONDENSED COMBINED FINANCIAL STATEMENTS (Continued)
(Unaudited)
Corporate Reorganization
Pursuant to the terms of a corporate reorganization that will be completed simultaneously with the closing of the Offering, (i) Vantage I and Vantage II will merge into subsidiaries of newly-formed holding companies, Vantage Energy Investment I LLC ("Vantage Investment I") and Vantage Energy Investment II LLC ("Vantage Investment II"), that will be owned by investment funds affiliated with or managed by Quantum Energy Partners, Riverstone Holdings LLC and Lime Rock Partners (collectively, the "Sponsors") and the individual founders and employees and other individuals (the "Management Members") who, together with the Sponsors, initially formed Vantage I and Vantage II (collectively, the "Existing Owners") in equal proportions to their current ownership of Vantage I and Vantage II and (ii) Vantage Investment I and Vantage Investment II will contribute all of the limited liability company interests in Vantage I and Vantage II to the Company in exchange for all of the Company's issued and outstanding shares of common stock (prior to the issuance of shares of common stock in the Offering). Vantage Investment I and Vantage Investment II will distribute to the Management Members a portion of the shares of common stock associated with such Management Members' initial investments in Vantage I and Vantage II, who will then hold the shares of common stock directly. As a result of the reorganization, Vantage I and Vantage II will become direct, wholly owned subsidiaries of Vantage Energy Inc.
The Company was incorporated to serve as the issuer in the Offering and has no pre-combination operations, assets or liabilities. As a result, the Company does not qualify as the accounting acquirer in the corporate reorganization. Accordingly, in the corporate reorganization, the combination of Vantage II (the Company's accounting predecessor) into the Company will be accounted for at historical cost and the combination of Vantage I into the Company will be accounted for at fair value as a business combination by applying the acquisition method. Following the corporate reorganization, Vantage I and Vantage II will become subject to U.S. federal and state income taxes as disregarded subsidiaries of the Company. For more information regarding the corporate reorganization, please see "Corporate Reorganization" elsewhere in this prospectus.
The unaudited pro forma combined financial statements include forward-looking information and are subject to certain risks and uncertainties that could cause actual results to differ materially from those anticipated. Please see "Risk Factors" and "Cautionary Statement Regarding Forward-Looking Statements".
F-3
VANTAGE ENERGY INC.
Unaudited Pro Forma Combined Balance Sheet
As of June 30, 2016
(In Thousands) |
| Historical Vantage Energy II, LLC |
| Historical Vantage Energy, LLC |
| Reorganization Pro Forma Adjustments |
| Pro Forma Vantage I and Vantage II |
| Offering Pro Forma Adjustments |
| Pro Forma Vantage Energy Inc. |
| ||||||||||||||
| | | | | | | | | | | | | | | ||||||||||||||
Assets |
| | | | | | | | | | | | | | | ||||||||||||
Current assets |
| | | | | | | | | | | | | | | ||||||||||||
Cash and cash equivalents |
| $ | 15,085 | | $ | 2,821 | | | $ | | | | $ | | | | $ | | | | $ | | | ||||
Accounts receivable |
| 12,194 | | 16,010 | | | | | | | | | | | | | | ||||||||||
Accounts receivable — related party |
| — | | 20,685 | | | | | | | | | | | | | | ||||||||||
Inventory |
| 528 | | 882 | | | | | | | | | | | | | | ||||||||||
Prepayments and deposits |
| 95 | | 755 | | | | | | | | | | | | | | ||||||||||
Derivative Assets |
| 1,800 | | 6,928 | | | | | | | | | | | | | | ||||||||||
| | | | | | | | | | | | | | | ||||||||||||||
Total current assets |
| 29,702 | | 48,081 | | | | | | | | | | | | | | ||||||||||
| | | | | | | | | | | | | | | ||||||||||||||
Oil and gas properties, full-cost method of accounting |
| | | | | | | | | | | | | | | ||||||||||||
Proved |
| 483,202 | | 1,070,096 | | | | | | | | | | | | | | ||||||||||
Unproved |
| 537,234 | | 78,288 | | | | | | | | | | | | | | ||||||||||
| | | | | | | | | | | | | | | ||||||||||||||
Total oil and gas properties |
| 1,020,436 | | 1,148,384 | | | | | | | | | | | | | | ||||||||||
Accumulated depletion, depreciation and amortization |
| (332,941 | ) | (813,657 | ) | | | | | | | | | | | | | ||||||||||
| | | | | | | | | | | | | | | ||||||||||||||
Net oil and gas properties |
| 687,495 | | 334,727 | | | | | | | | | | | | | | ||||||||||
Gas gathering system (net) |
| 59,764 | | 60,473 | | | | | | | | | | | | | | ||||||||||
Other property, plant, and equipment (net) |
| — | | 723 | | | | | | | | | | | | | | ||||||||||
| | | | | | | | | | | | | | | ||||||||||||||
Net property, plant and equipment |
| 747,259 | | 395,923 | | | | | | | | | | | | | | ||||||||||
Derivative assets |
| 841 | | 5,702 | | | | | | | | | | | | | | ||||||||||
Other assets |
| 1,341 | | 1,347 | | | | | | | | | | | | | | ||||||||||
Water Investment (net) |
| 1,278 | | 1,278 | | | | | | | | | | | | | | ||||||||||
| | | | | | | | | | | | | | | ||||||||||||||
Total assets |
| $ | 780,421 | | $ | 452,331 | | | $ | | | | $ | | | | $ | | | | $ | | | ||||
| | | | | | | | | | | | | | | ||||||||||||||
| | | | | | | | | | | | | | | | | | | | | | | ||||||
| | | | | | | | | | | | | | | ||||||||||||||
Liabilities and Members' Equity |
| | | | | | | | | | | | | | | ||||||||||||
Current liabilities |
| | | | | | | | | | | | | | | ||||||||||||
Accounts payable and accrued liabilities |
| $ | 23,534 | | $ | 27,257 | | | $ | | | | $ | | | | $ | | | | $ | | | ||||
Accrued capital payable |
| | | | | | | | | | | | | | | ||||||||||||
Accounts payable — related party |
| 20,685 | | — | | | | | | | | | | | | | | ||||||||||
Commodity derivative liabilities |
| 4,808 | | 6,793 | | | | | | | | | | | | | | ||||||||||
Current portion of revolving credit facility |
| 146,239 | | 268,873 | | | | | | | | | | | | | | ||||||||||
Current portion of second lien note payable |
| 98,754 | | 2,000 | | | | | | | | | | | | | | ||||||||||
| | | | | | | | | | | | | | | ||||||||||||||
Total current liabilities |
| 294,020 | | 304,923 | | | | | | | | | | | | | | ||||||||||
Asset retirement obligations |
| 3,052 | | 8,818 | | | | | | | | | | | | | | ||||||||||
Commodity derivative liabilities |
| 7,358 | | 5,806 | | | | | | | | | | | | | | ||||||||||
Second lien note payable, net of original issue |
| — | | 189,407 | | | | | | | | | | | | | | ||||||||||
| | | | | | | | | | | | | | | ||||||||||||||
Total liabilities |
| 304,430 | | 508,954 | | | | | | | | | | | | | | ||||||||||
| | | | | | | | | | | | | | | ||||||||||||||
Contingently redeemable Founders' Units |
| 1,125 | | 5,960 | | | | | | | | | | | | | | ||||||||||
Commitments and contingencies |
| | | | | | | | | | | | | | | ||||||||||||
Common Stock Equity |
| | | | | | | | | | | | | | | ||||||||||||
Members' contributions (net of issuance costs) |
| 670,074 | | 448,059 | | | | | | | | | | | | | | ||||||||||
Retained earnings (deficit) |
| (195,208 | ) | (510,642 | ) | | | | | | | | | | | | | ||||||||||
Accumulated other comprehensive income (loss) |
| — | | — | | | | | | | | | | | | | | ||||||||||
| | | | | | | | | | | | | | | ||||||||||||||
Total Members' equity |
| 474,866 | | (62,583 | ) | | | | | | | | | | | | | ||||||||||
| | | | | | | | | | | | | | | ||||||||||||||
Total liabilities and Members' Equity |
| $ | 780,421 | | $ | 452,331 | | | $ | | | | $ | | | | $ | | | | $ | | | ||||
| | | | | | | | | | | | | | | ||||||||||||||
| | | | | | | | | | | | | | | | | | | | | | | ||||||
| | | | | | | | | | | | | | | ||||||||||||||
See notes to unaudited combined pro forma financial statements.
F-4
VANTAGE ENERGY INC.
Unaudited Pro Forma
Combined Statement of Operations
Year Ended December 31, 2015
(In thousands except per share data) |
| Historical Vantage Energy II, LLC |
| Historical Vantage Energy, LLC |
| Reorganization Pro Forma Adjustments |
| Pro Forma Vantage I and Vantage II |
| Offering Pro Forma Adjustments |
| Pro Forma Vantage Energy Inc. |
| ||||||||||||||||||
| | | | | | | | | | | | | | | ||||||||||||||||||
Operating revenues |
| | | | | | | | | | | | | | | | | | | ||||||||||||
Gas revenues |
| | $ | 65,252 | | | | $ | 73,209 | | | | $ | | | | $ | | | | $ | | | | $ | | | ||||
Oil revenues |
| | — | | | | 3,053 | | | | | | | | | | | | | | | ||||||||||
NGLs revenues |
| | — | | | | 8,313 | | | | | | | | | | | | | | | ||||||||||
Midstream revenues |
| | 4,054 | | | | 5,679 | | | | | | | | | | | | | | | ||||||||||
Gain on commodity derivatives |
| | 51,793 | | | | 69,569 | | | | | | | | | | | | | | | ||||||||||
| | | | | | | | | | | | | | | ||||||||||||||||||
Total operating revenues |
| | 121,099 | | | | 159,823 | | | | | | | | | | | | | | | ||||||||||
| | | | | | | | | | | | | | | ||||||||||||||||||
Operating expenses: |
| | | | | | | | | | | | | | | | | | | ||||||||||||
Production and ad valorem taxes |
| | 1,911 | | | | 4,843 | | | | | | | | | | | | | | | ||||||||||
Marketing and gathering |
| | 9,745 | | | | 5,352 | | | | | | | | | | | | | | | ||||||||||
Lease operating and workover |
| | 4,934 | | | | 18,092 | | | | | | | | | | | | | | | ||||||||||
Midstream operating |
| | 1,834 | | | | 1,834 | | | | | | | | | | | | | | | ||||||||||
General and administrative |
| | 7,308 | | | | 6,019 | | | | | | | | | | | | | | | ||||||||||
Depreciation, depletion, amortization and accretion |
| | 39,698 | | | | 50,162 | | | | | | | | | | | | | | | ||||||||||
Impairment of oil and gas properties |
| | 172,673 | | | | 344,401 | | | | | | | | | | | | | | | ||||||||||
| | | | | | | | | | | | | | | ||||||||||||||||||
Total operating expenses |
| | 238,103 | | | | 430,703 | | | | | | | | | | | | | | | ||||||||||
| | | | | | | | | | | | | | | ||||||||||||||||||
Operating income (loss) |
| | (117,004 | ) | | | (270,880 | ) | | | | | | | | | | | | | | ||||||||||
| | | | | | | | | | | | | | | ||||||||||||||||||
Other expense |
| | (180 | ) | | | — | | | | | | | | | | | | | | | ||||||||||
Interest expense, net of capitalized interest |
| | (8,778 | ) | | | (22,058 | ) | | | | | | | | | | | | | | ||||||||||
| | | | | | | | | | | | | | | ||||||||||||||||||
Net income (loss) |
| | $ | (125,962 | ) | | | $ | (292,938 | ) | | | $ | | | | $ | | | | $ | | | | $ | | | ||||
| | | | | | | | | | | | | | | ||||||||||||||||||
| | | | | | | | | | | | | | | | | | | | | | | | | | | ||||||
| | | | | | | | | | | | | | | ||||||||||||||||||
Earnings per share — basic |
| | | | | | | | | | | | | | | | | | | ||||||||||||
Earnings per share — diluted |
| | | | | | | | | | | | | | | | | | | ||||||||||||
See notes to unaudited combined pro forma financial statements.
F-5
VANTAGE ENERGY INC.
Unaudited Pro Forma
Combined Statement of Operations
Six Months Ended June 30, 2016
|
| Historical Vantage |
| Historical Vantage |
| Reorganization Pro Forma |
| Pro Forma Vantage I and |
| Offering Pro Forma |
| Pro Forma Vantage |
| ||||||||||||||||||
(In thousands except per share data) |
| Energy II, LLC | | Energy, LLC | | Adjustments | | Vantage II | | Adjustments | | Energy Inc. |
| ||||||||||||||||||
| | | | | | | | | | | | | | | ||||||||||||||||||
Operating revenues |
| | | | | | | | | | | | | | | | | | | ||||||||||||
Gas revenues |
| | $ | 46,829 | | | | $ | 43,806 | | | | $ | | | | $ | | | | $ | | | | $ | | | ||||
Oil revenues |
| | — | | | | 1,477 | | | | | | | | | | | | | | | ||||||||||
NGLs revenues |
| | — | | | | 5,822 | | | | | | | | | | | | | | | ||||||||||
Midstream revenues |
| | 2,895 | | | | 4,966 | | | | | | | | | | | | | | | ||||||||||
Gain (loss) on commodity derivatives |
| | (22,599 | ) | | | (21,155 | ) | | | | | | | | | | | | | | ||||||||||
| | | | | | | | | | | | | | | ||||||||||||||||||
Total operating revenues |
| | 27,125 | | | | 34,916 | | | | | | | | | | | | | | | ||||||||||
| | | | | | | | | | | | | | | ||||||||||||||||||
Operating expenses |
| | | | | | | | | | | | | | | | | | | ||||||||||||
Production and ad valorem taxes |
| | 1,025 | | | | 2,928 | | | | | | | | | | | | | | | ||||||||||
Marketing and gathering |
| | 7,961 | | | | 6,333 | | | | | | | | | | | | | | | ||||||||||
Lease operating and workover |
| | 1,590 | | | | 7,581 | | | | | | | | | | | | | | | ||||||||||
Midstream operating |
| | 1,428 | | | | 1,427 | | | | | | | | | | | | | | | ||||||||||
General and administrative |
| | 4,336 | | | | 3,222 | | | | | | | | | | | | | | | ||||||||||
Depreciation, depletion, amortization and accretion |
| | 19,490 | | | | 26,476 | | | | | | | | | | | | | | | ||||||||||
Impairment of oil and gas properties |
| | 81,673 | | | | 155,994 | | | | | | | | | | | | | | | ||||||||||
| | | | | | | | | | | | | | | ||||||||||||||||||
Total operating expenses |
| | 117,503 | | | | 203,961 | | | | | | | | | | | | | | | ||||||||||
| | | | | | | | | | | | | | | ||||||||||||||||||
Operating income (loss) |
| | (90,378 | ) | | | (169,045 | ) | | | | | | | | | | | | | | ||||||||||
| | | | | | | | | | | | | | | ||||||||||||||||||
Other expense |
| | | | | | | | | | | | | | | | | | | ||||||||||||
Other income (expense) |
| | 3 | | | | (152 | ) | | | | | | | | | | | | | | ||||||||||
Interest expense, net of capitalized interest |
| | (5,264 | ) | | | (12,371 | ) | | | | | | | | | | | | | | ||||||||||
| | | | | | | | | | | | | | | ||||||||||||||||||
Total other income (expense) |
| | (5,261 | ) | | | (12,523 | ) | | | | | | | | | | | | | | ||||||||||
| | | | | | | | | | | | | | | ||||||||||||||||||
Net income (loss) |
| | $ | (95,639 | ) | | | $ | (181,568 | ) | | | $ | | | | $ | | | | $ | | | | $ | | | ||||
| | | | | | | | | | | | | | | ||||||||||||||||||
| | | | | | | | | | | | | | | | | | | | | | | | | | | ||||||
| | | | | | | | | | | | | | | ||||||||||||||||||
Earnings per share — basic |
| | | | | | | | | | | | | | | | | | | ||||||||||||
Earnings per share — diluted |
| | | | | | | | | | | | | | | | | | | ||||||||||||
See notes to unaudited combined pro forma financial statements.
F-6
VANTAGE ENERGY INC.
Notes to Unaudited Combined Pro Forma Financial Statements
1. Basis of presentation, transactions and this offering
The historical financial information is based upon the historical financial statements of Vantage I and Vantage II. The pro forma adjustments have been prepared as if the corporate reorganization and the Offering had each taken place on June 30, 2016, in the case of the unaudited pro forma consolidated balance sheet, and on January 1, 2015, in the case of the unaudited pro forma combined statement of operations for the year ended December 31, 2015 and the six months ended June 30, 2016.
The Company was formed on May 7, 2013 and has no pre-combination operations, assets or liabilities. As a result, the Company does not qualify as the accounting acquirer in the corporate reorganization.
Vantage I was organized as a limited liability company on September 22, 2006 with approximately $486 million of equity commitments from the Existing Owners. Subsequently, Vantage II was formed in July 2012 with $402 million of equity commitments from the Existing Owners. Subsequently, Vantage II Alpha was formed in May 2016 with $375.6 million of equity commitments from Existing Owners. The operations of Vantage I and Vantage II are conducted by management of Vantage I under a Management Services Agreement, and the Appalachian Basin assets of Vantage I and Vantage II are operated under a Joint Development and Acquisition Agreement.
2. Unaudited pro forma adjustments and assumptions
The adjustments are based on currently available information and certain estimates and assumptions and therefore the actual effects of these transactions will differ from the pro forma adjustments. A description of these transactions and adjustments is provided as follows:
Reorganization Adjustments
Pursuant to the terms of a corporate reorganization that will be completed simultaneously with the closing of the Offering, (i) Vantage I and Vantage II will merge into subsidiaries of newly-formed holding companies, Vantage Investment I and Vantage Investment II that will be owned by the Existing Owners, and (ii) Vantage Investment I and Vantage Investment II will contribute all of the limited liability company interests in Vantage I and Vantage II to the Company in exchange for all of the Company's issued and outstanding shares of common stock (prior to the issuance of shares of common stock in the Offering). Vantage Investment I and Vantage Investment II will distribute to the Management Members a portion of the shares of common stock associated with such Management Members' initial investments in Vantage I and Vantage II, who will then hold the shares of common stock directly. As a result of the reorganization, Vantage I and Vantage II will become direct, wholly owned subsidiaries of Vantage Energy Inc.
The Company was incorporated to serve as the issuer in the Offering and has no pre-combination operations, assets or liabilities. As a result, the Company does not qualify as the accounting acquirer in the corporate reorganization. Accordingly, the corporate reorganization will be accounted for as if Vantage II (the Company's accounting predecessor) is acquiring Vantage I in a business combination.
- (a)
- Reflects the issuance of shares of common stock (prior to the issuance of shares of common stock in this offering) to Vantage Investment II in exchange for all of the
F-7
VANTAGE ENERGY INC.
Notes to Unaudited Combined Pro Forma Financial Statements (Continued)
2. Unaudited pro forma adjustments and assumptions (Continued)
- (b)
- Reflects the issuance of shares of common stock (prior to the issuance of shares of common stock in this offering) to Vantage Investment I in exchange for all of the interests in Vantage I accounted for as a business combination using the acquisition method. The total consideration transferred, the allocation of the consideration transferred to recognized assets and liabilities are summarized as follows:
interests in Vantage II. Vantage II has been identified as the accounting predecessor and therefore the exchange is being accounted for in a manner similar to a pooling of interests.
Fair Value of Common Stock Issued(1): |
| | ||
Allocated to: |
| | ||
Net working capital acquired |
| | ||
Proved Oil and Gas Properties |
| | ||
Gas Gathering System |
| | ||
Deferred Income Taxes |
| | ||
Excess of consideration transferred over the net amount of assets and liabilities recognized (goodwill) |
| | ||
- (1)
- Prior to the corporate reorganization, the Company and Vantage II are non-public, closely held entities. The fair value of the common stock issued is based on a relative fair value allocation between Vantage I and Vantage II at an assumed price equal to the midpoint of the range set forth on the cover of this prospectus. The actual fair value of common stock issued may vary widely from the pro forma adjustments as the actual accounting will be based upon the fair value of the stock issued in this Offering. Any increase or decrease in the fair value of consideration exchanged will result in an adjustment to goodwill. The Company currently estimates the range of the fair value of the stock issued in the Offering to be $ to $ , which would result in goodwill of $ to $ .
- (c)
- To
reflect the step-up in fair value of the full cost pool for proved oil and gas properties and the unproved properties to the preliminary acquisition-date
fair value.
- (d)
- To
reflect estimated net deferred income taxes arising from the acquisition of Vantage I. Following the acquisition, Vantage I will be treated as a
single-member limited liability company that is taxed as a disregarded entity by the Company.
- (e)
- To
reflect estimated goodwill arising with this transaction.
- (f)
- The Company is a Delaware corporation. Prior to the reorganization, Vantage I and Vantage II have been treated as a partnership for federal income tax purposes and therefore have not directly paid income taxes on their income nor benefitted from losses. Instead, their income and other tax attributes have been passed through to their owners for federal and, where applicable, state income tax purposes. Following the reorganization, Vantage I and Vantage II will be treated as single-member limited liability companies that are taxed as disregarded entities. Disregarded entities do not have individual tax status but rather are treated as a division of the single member for federal income tax purposes. The unaudited pro forma condensed combined balance sheet reflects this change in tax status for Vantage II by recognizing previously unrecorded deferred income taxes as of June 30, 2016. As required under generally accepted accounting principles ("GAAP"), upon completion of the reorganization, the impact of
F-8
VANTAGE ENERGY INC.
Notes to Unaudited Combined Pro Forma Financial Statements (Continued)
2. Unaudited pro forma adjustments and assumptions (Continued)
- (g)
- Reflects
the elimination of intercompany balances between Vantage I and Vantage II.
- (h)
- Reflects the estimated impact on historical depreciation, depletion, amortization and accretion expense to reflect accounting for the combined proved oil and gas properties as a single full cost pool based upon estimates of the combined proved reserves of Vantage I and Vantage II and historical production volumes.
recognizing deferred tax assets and liabilities will be charged to income tax expense from continuing operations in the fiscal quarter the conversion occurs. As of June 30, 2016, the amount of the charge would have been $ million. No adjustment is necessary for Vantage I as deferred income taxes are accounted for in the acquisition method of accounting discussed above.
The unaudited pro forma condensed combined statements of operations reflect the current and deferred tax expense we would have incurred had we been subject to tax as a corporation, assuming an effective tax rate of %. This rate is inclusive of federal, state and local income taxes.
Offering Adjustments
- (j)
- Reflects
the receipt of million of gross proceeds from the Offering from the issuance and sale of shares of common stock at the
initial public offering price of $ per share.
- (k)
- Reflects
the payment of estimated underwriting discounts totaling $ million and additional estimated expenses related to the Offering
of approximately $ million.
- (l)
- Reflects
the use of the net proceeds of the Offering and borrowings under the Company's new revolving credit facility to repay
$ million of borrowings outstanding under the Vantage I and Vantage II revolving credit facilities and the Vantage I second lien term loan. For further
discussion on the application of the net proceeds from the Offering, please read "Use of Proceeds".
- (m)
- Reflects
the elimination of interest expense associated with the repayment of the outstanding borrowings noted above.
- (n)
- Reflects basic and diluted income per common share giving effect to the issuance of shares of common stock in the Offering.
3. Supplemental information on oil and gas producing activities
The historical pro forma supplemental oil and gas disclosure as of December 31, 2014 and 2015 were derived from the financial statements of Vantage I and Vantage II included elsewhere in this prospectus and valuations prepared by the independent petroleum engineering firms of Netherland, Sewell & Associates, Inc. and Wright and Company. The unaudited pro forma combined supplemental oil and gas disclosures of the Company reflect the combined historical results of Vantage I and Vantage II, on a pro forma basis to give effect to the Offering and the corporate reorganization as if they had occurred on December 31, 2015 for pro forma supplemental natural gas disclosure purposes.
F-9
VANTAGE ENERGY INC.
Notes to Unaudited Combined Pro Forma Financial Statements (Continued)
3. Supplemental information on oil and gas producing activities (Continued)
In accordance with SEC regulations, reserves at December 31, 2014 and 2015 were estimated using the unweighted arithmetic average first-day-of-the-month price for the preceding 12-month period. Reserve estimates are inherently imprecise and estimates of new discoveries are more imprecise than those of producing natural gas properties. Accordingly, the estimates may change as future information becomes available.
Pro forma reserve quantity information for the year ended December 31, 2015 is as follows:
|
| Historical | | Historical | | Pro Forma | | |||||||||
|
| Vantage | | Vantage | | Vantage | | |||||||||
|
| Energy II, LLC(1) | | Energy, LLC(2) | | Energy Inc. |
| |||||||||
| | | | | | | | | |||||||||
Natural Gas (MMcf) |
| | | | | | | | | | ||||||
Beginning of year |
| | 506,321 | | | | 789,800 | | | | 1,296,121 | | | |||
Revisions |
| | 75,400 | | | | (16,585 | ) | | | 58,815 | | | |||
Extensions and discoveries |
| | 282,540 | | | | 136,658 | | | | 419,198 | | | |||
Divestitures |
| | (1,671 | ) | | | (9 | ) | | | (1,680 | ) | | |||
Acquisitions |
| | 31,437 | | | | 33,429 | | | | 64,866 | | | |||
Production |
| | (41,130 | ) | | | (41,175 | ) | | | (82,305 | ) | | |||
| | | | | | | | | |||||||||
End of year |
| | 852,897 | | | | 902,118 | | | | 1,755,015 | | | |||
| | | | | | | | | |||||||||
| | | | | | | | | | | | | | | |||
| | | | | | | | | |||||||||
Proved Developed reserves: |
| | | | | | | | | | ||||||
Beginning of year |
| | 155,674 | | | | 228,613 | | | | 384,287 | | | |||
End of year |
| | 318,170 | | | | 398,379 | | | | 716,549 | | | |||
Proved Undeveloped Reserves: |
| | | | | | | | | | ||||||
Beginning of year |
| | 350,647 | | | | 561,187 | | | | 911,834 | | | |||
End of year |
| | 534,727 | | | | 503,740 | | | | 1,038,467 | | | |||
NGLs (MMBbl) |
| | | | | | | | | | ||||||
Beginning of year |
| | — | | | | 22,885 | | | | 22,885 | | | |||
Revisions |
| | — | | | | 1,704 | | | | 1,704 | | | |||
Extensions and discoveries |
| | — | | | | | | | — | | | ||||
Divestitures |
| | — | | | | (1 | ) | | | (1 | ) | | |||
Acquisitions |
| | — | | | | | | | — | | | ||||
Production |
| | — | | | | (796 | ) | | | (796 | ) | | |||
| | | | | | | | | |||||||||
End of year |
| | — | | | | 23,792 | | | | 23,792 | | | |||
| | | | | | | | | |||||||||
| | | | | | | | | | | | | | | |||
| | | | | | | | | |||||||||
Proved Developed reserves: |
| | | | | | | | | | ||||||
Beginning of year |
| | — | | | | 6,476 | | | | 6,476 | | | |||
End of year |
| | — | | | | 8,185 | | | | 8,185 | | | |||
Proved Undeveloped Reserves: |
| | | | | | | | | | ||||||
Beginning of year |
| | — | | | | 16,409 | | | | 16,409 | | | |||
End of year |
| | — | | | | 15,607 | | | | 15,607 | | | |||
Oil (MMBbl) |
| | | | | | | | | | ||||||
Beginning of year |
| | | | | 1,150 | | | | 1,150 | | | ||||
Revisions |
| | | | | 134 | | | | 134 | | | ||||
Extensions and discoveries |
| | | | | — | | | | — | | | ||||
Divestitures |
| | | | | — | | | | — | | | ||||
F-10
VANTAGE ENERGY INC.
Notes to Unaudited Combined Pro Forma Financial Statements (Continued)
3. Supplemental information on oil and gas producing activities (Continued)
|
| Historical | | Historical | | Pro Forma | | |||||||||
|
| Vantage | | Vantage | | Vantage | | |||||||||
|
| Energy II, LLC(1) | | Energy, LLC(2) | | Energy Inc. | | |||||||||
| | | | | | | | | |||||||||
Acquisitions |
| | | | | — | | | | — | | | ||||
Production |
| | | | | (74 | ) | | | (74 | ) | | ||||
| | | | | | | | | |||||||||
End of year |
| | — | | | | 1,209 | | | | 1,210 | | | |||
| | | | | | | | | |||||||||
Proved Developed reserves: |
| | | | | | | | | | ||||||
Beginning of year |
| | — | | | | 240 | | | | 240 | | | |||
End of year |
| | — | | | | 323 | | | | 323 | | | |||
Proved Undeveloped Reserves: |
| | | | | | | | | | ||||||
Beginning of year |
| | — | | | | 910 | | | | 910 | | | |||
End of year |
| | — | | | | 887 | | | | 887 | | | |||
Total (MMcfe) |
| | | | | | | | | | ||||||
Beginning of year |
| | 506,321 | | | | 934,010 | | | | 1,440,331 | | | |||
Revisions |
| | 75,400 | | | | (5,557 | ) | | | 69,843 | | | |||
Extensions and discoveries |
| | 282,540 | | | | 136,658 | | | | 419,198 | | | |||
Divestitures |
| | (1,671 | ) | | | (15 | ) | | | (1,686 | ) | | |||
Acquisitions |
| | 31,437 | | | | 33,429 | | | | 64,866 | | | |||
Production |
| | (41,130 | ) | | | (46,395 | ) | | | (87,525 | ) | | |||
| | | | | | | | | |||||||||
End of year |
| | 852,897 | | | | 1,052,130 | | | | 1,905,027 | | | |||
| | | | | | | | | |||||||||
| | | | | | | | | | | | | | | |||
| | | | | | | | | |||||||||
Proved Developed reserves: |
| | | | | | | | | | ||||||
Beginning of year |
| | 155,674 | | | | 268,909 | | | | 424,583 | | | |||
End of year |
| | 318,170 | | | | 449,423 | | | | 767,593 | | | |||
Proved Undeveloped Reserves: |
| | | | | | | | | | ||||||
Beginning of year |
| | 350,647 | | | | 665,101 | | | | 1,015,748 | | | |||
End of year |
| | 534,727 | | | | 602,704 | | | | 1,137,431 | | | |||
- (1)
- All
of Vantage Energy II, LLC's reserves as of December 31, 2015 were located in the Appalachian Basin.
Total proved reserves increased 346,576 MMcf in 2015 primarily due to the following:
Revisions of previous estimates Previous estimates of proved reserves were revised upward primarily attributable to technical revisions associated with PUD inventory performance after conversion to PDP as well as the base PDP reserves being revised.
Extensions and discoveries Proved reserves increased primarily attributable to increased technical certainty in areas of existing leasehold ownership, ties to internal and external development activity.
Acquisitions Proved reserves increased primarily attributable to new leasehold acquisition from third parties allowing for higher certainty in inventory development.
- (2)
- Total
proved reserves increased 118,120 MMcfe in 2015 primarily due to the following:
Revisions of previous estimates. Reserves were revised upward primarily attributable to technical revisions associated with PUD inventory performance after conversion to PDP as well as the base PDP reserves being revised.
Extensions and discoveries. Reserves increased primarily attributable to increased technical certainty in areas of existing leasehold ownership, tied to internal and external development activity, additional extensions tied to successful regulatory efforts in urban leasehold areas of Tarrant County, Texas and an improved regulatory environment in Denton County, Texas.
F-11
VANTAGE ENERGY INC.
Notes to Unaudited Combined Pro Forma Financial Statements (Continued)
3. Supplemental information on oil and gas producing activities (Continued)
Acquisitions. Proved reserves increased due to new leasehold acquisition from third parties allowing for higher certainty in inventory development.
Information with respect to our pro forma estimated discounted future net cash flows related to proved reserves as of December 31, 2015 is as follows (in thousands):
|
| | | Corporate | | | |||||||||||||||
|
| Historical | | Historical | | Reorganization | | Pro Forma | | ||||||||||||
|
| Vantage | | Vantage | | Pro Forma | | Vantage | | ||||||||||||
|
| Energy II, LLC | | Energy, LLC | | Adjustments | | Energy Inc. |
| ||||||||||||
| | | | | | | | | | | ||||||||||||
Future cash inflows |
| | $ | 916,592 | | | | $ | 1,691,862 | | | | $ | | | | $ | | | ||
Future production costs |
| | (222,386 | ) | | | (471,148 | ) | | | | | | | | ||||||
Future development costs(1) |
| | (276,271 | ) | | | (321,563 | ) | | | | | | | | ||||||
Future income tax expenses(2) |
| | — | | | | (6,480 | ) | | | | | | | | ||||||
| | | | | | | | | | | ||||||||||||
Future net cash flows |
| | 417,935 | | | | 892,671 | | | | | | | | | ||||||
10% discount for estimated timing of cash flows |
| | (229,951 | ) | | | (497,151 | ) | | | | | | | | ||||||
| | | | | | | | | | | ||||||||||||
Standardized measure of discounted future net cash flows |
| | $ | 187,984 | | | | $ | 395,520 | | | | $ | | | | $ | | | ||
| | | | | | | | | | | ||||||||||||
| | | | | | | | | | | | | | | | | | | ||||
| | | | | | | | | | | ||||||||||||
- (1)
- The
Company believes that abandonment costs will have an immaterial impact on its future net cash flows and should be offset by salvage
value.
- (2)
- Future net cash flows do not include the effects of income taxes on future revenues because Vantage I and Vantage II are limited liability companies not subject to entity-level income taxation as of December 31, 2015. Accordingly, no provision for federal or state corporate income taxes has been provided because taxable income was passed through to the companies' members. Following the corporate reorganization, the Company will be subject to income taxes. See adjustment (f) in Note 2 for additional information.
F-12
VANTAGE ENERGY INC.
Notes to Unaudited Combined Pro Forma Financial Statements (Continued)
3. Supplemental information on oil and gas producing activities (Continued)
The following are the principal changes in our pro forma standardized measure of discounted net cash flows for the year ended December 31, 2015 (in thousands):
|
| Historical | | Historical | | Reorganization | | Pro Forma | | ||||||||||||
|
| Vantage | | Vantage | | Pro Forma | | Vantage | | ||||||||||||
|
| Energy II, LLC | | Energy, LLC | | Adjustments | | Energy Inc. |
| ||||||||||||
| | | | | | | | | | | ||||||||||||
Balance at beginning of period |
| | $ | 597,649 | | | | $ | 994,592 | | | | $ | | | | $ | | | ||
Net change in prices and production costs |
| | (563,534 | ) | | | (907,840 | ) | | | | | | | | ||||||
Net change in future development costs |
| | 76,285 | | | | 135,489 | | | | | | | | | ||||||
Sales, less production costs |
| | (58,282 | ) | | | (61,640 | ) | | | | | | | | ||||||
Extensions |
| | 20,397 | | | | 28,501 | | | | | | | | | ||||||
Acquisition of reserves |
| | 1,232 | | | | 2,755 | | | | | | | | | ||||||
Divestiture of reserves |
| | (2,789 | ) | | | (4 | ) | | | | | | | | ||||||
Revisions of previous quantity estimates |
| | 16,618 | | | | (21,794 | ) | | | | | | | | ||||||
Previously estimated development costs incurred |
| | 67,943 | | | | 139,064 | | | | | | | | | ||||||
Net change in taxes |
| | — | | | | 2,614 | | | | | | | | | ||||||
Accretion of discount |
| | 59,765 | | | | 100,038 | | | | | | | | | ||||||
Changes in timing and other |
| | (27,300 | ) | | | (16,255 | ) | | | | | | | | ||||||
| | | | | | | | | | | ||||||||||||
Balance at end of period |
| | $ | 187,984 | | | | $ | 395,520 | | | | $ | | | | $ | | | ||
| | | | | | | | | | | ||||||||||||
| | | | | | | | | | | | | | | | | | | ||||
| | | | | | | | | | | ||||||||||||
F-13
REPORT OF INDEPENDENT REGISTERED PUBLIC ACCOUNTING FIRM
The
Board of Managers and Members
Vantage Energy II, LLC:
We have audited the accompanying consolidated balance sheets of Vantage Energy II, LLC and subsidiaries (the Company) as of December 31, 2015 and 2014, and the related consolidated statements of operations, changes in members' equity, and cash flows for each of the years in the two-year period ended December 31, 2015. These consolidated financial statements are the responsibility of the Company's management. Our responsibility is to express an opinion on these consolidated financial statements based on our audits.
We conducted our audits in accordance with the standards of the Public Company Accounting Oversight Board (United States). Those standards require that we plan and perform the audit to obtain reasonable assurance about whether the financial statements are free of material misstatement. An audit includes examining, on a test basis, evidence supporting the amounts and disclosures in the financial statements. An audit also includes assessing the accounting principles used and significant estimates made by management, as well as evaluating the overall financial statement presentation. We believe that our audits provide a reasonable basis for our opinion.
In our opinion, the consolidated financial statements referred to above present fairly, in all material respects, the financial position of Vantage Energy II, LLC and subsidiaries as of December 31, 2015 and 2014, and the results of their operations and their cash flows for each of the years in the two-year period ended December 31, 2015, in conformity with U.S. generally accepted accounting principles.
| | /s/ KPMG LLP |
Denver,
Colorado
July 26, 2016
F-14
VANTAGE ENERGY II, LLC
Consolidated Balance Sheets
December 31, 2015 and 2014
(In thousands)
|
| 2015 | | 2014 |
| ||
| | | | | | | ||
Assets |
| | | ||||
Current assets: |
| | | ||||
Cash and cash equivalents |
| $ | 2,439 | | $ | 21,185 | |
Accounts receivable |
| 10,397 | | 10,123 | | ||
Accounts receivable — related party |
| 1,100 | | 12,524 | | ||
Inventory |
| 242 | | 171 | | ||
Prepayments and deposits |
| 70 | | 59 | | ||
Commodity derivative assets |
| 30,737 | | 10,254 | | ||
| | | | | | | ||
Total current assets |
| 44,985 | | 54,316 | | ||
| | | | | | | ||
Property, plant, and equipment: |
| | | ||||
Oil and gas properties, full-cost method of accounting: |
| | | ||||
Proved |
| 420,197 | | 313,695 | | ||
Unproved |
| 187,509 | | 150,310 | | ||
| | | | | | | ||
Total oil and gas properties |
| 607,706 | | 464,005 | | ||
Accumulated depletion, depreciation, and amortization |
| (233,920 | ) | (24,929 | ) | ||
| | | | | | | ||
Net oil and gas properties |
| 373,786 | | 439,076 | | ||
Gathering system, less accumulated depreciation of $5,551 and $2,510 |
| 59,970 | | 53,116 | | ||
| | | | | | | ||
Net property, plant, and equipment |
| 433,756 | | 492,192 | | ||
Commodity derivative assets |
| 7,957 | | 3,236 | | ||
Other assets |
| 1,877 | | 1,601 | | ||
Water investment, less accumulated amortization of $11 and $0 |
| 662 | | — | | ||
| | | | | | | ||
Total assets |
| $ | 489,237 | | $ | 551,345 | |
| | | | | | | ||
| | | | | | | ||
| | | | | | | ||
Liabilities and Members' Equity |
| | | ||||
Current liabilities: |
| | | ||||
Accounts payable and accrued liabilities |
| $ | 39,016 | | $ | 25,645 | |
| | | | | | | ||
Total current liabilities |
| 39,016 | | 25,645 | | ||
Revolving credit facility |
| 149,000 | | 100,000 | | ||
Second Lien note payable, net of original issue discount of $1,464 and $2,337 |
| 98,539 | | 97,663 | | ||
Commodity derivative liabilities |
| — | | — | | ||
Asset retirement obligations |
| 2,091 | | 1,484 | | ||
| | | | | | | ||
Total liabilities |
| 288,646 | | 224,792 | | ||
| | | | | | | ||
Contingently redeemable Founders' units |
| 498 | | 498 | | ||
Commitments and contingencies (note 8) |
| | | ||||
Members' equity: |
| | | ||||
Member contributions, net of issuance costs |
| 299,662 | | 299,662 | | ||
Retained earnings (accumulated deficit) |
| (99,569 | ) | 26,393 | | ||
| | | | | | | ||
Total members' equity |
| 200,093 | | 326,055 | | ||
| | | | | | | ||
Total liabilities and members' equity |
| $ | 489,237 | | $ | 551,345 | |
| | | | | | | ||
| | | | | | | ||
| | | | | | | ||
See accompanying notes to consolidated financial statements.
F-15
VANTAGE ENERGY II, LLC
Consolidated Statements of Operations
Years ended December 31, 2015 and 2014
(In thousands)
|
| 2015 | | 2014 |
| ||
| | | | | | | ||
Operating revenues: |
| | | ||||
Gas revenues |
| $ | 65,252 | | $ | 43,622 | |
Midstream revenues |
| 4,054 | | 2,990 | | ||
Gain on commodity derivatives |
| 51,793 | | 14,434 | | ||
| | | | | | | ||
Total operating revenues |
| 121,099 | | 61,046 | | ||
| | | | | | | ||
Operating expenses: |
| | | ||||
Production and ad valorem tax expense |
| 1,911 | | 1,723 | | ||
Marketing and gathering expense |
| 9,745 | | 5,333 | | ||
Lease operating and workover expense |
| 4,934 | | 2,517 | | ||
Midstream operating expense |
| 1,834 | | 891 | | ||
General and administrative expense |
| 7,308 | | 5,423 | | ||
Depreciation, depletion, amortization, and accretion expense |
| 39,698 | | 18,302 | | ||
Impairment of oil and gas properties |
| 172,673 | | — | | ||
| | | | | | | ||
Total operating expenses |
| 238,103 | | 34,189 | | ||
| | | | | | | ||
Operating income (loss) |
| (117,004 | ) | 26,857 | | ||
| | | | | | | ||
Other expense: |
| | | ||||
Other expense |
| (180 | ) | — | | ||
Interest expense, net of capitalized interest |
| (8,778 | ) | (4,027 | ) | ||
| | | | | | | ||
Total other expense |
| (8,958 | ) | (4,027 | ) | ||
| | | | | | | ||
Net income (loss) |
| $ | (125,962 | ) | $ | 22,830 | |
| | | | | | | ||
| | | | | | | ||
| | | | | | | ||
Pro forma information (in thousands except per share data) |
| | | ||||
Pro forma income tax (expense) benefit |
| | | ||||
Pro forma earnings (loss) |
| | | ||||
Pro forma earnings (loss) per common share — basic |
| | | ||||
Pro forma earnings (loss) per common share — diluted |
| | | ||||
Pro forma weighted average number of shares outstanding: |
| | | ||||
Basic |
| | | ||||
Diluted |
| | | ||||
See accompanying notes to consolidated financial statements.
F-16
VANTAGE ENERGY II, LLC
Consolidated Statements of Changes in Members' Equity
Years ended December 31, 2015 and 2014
(In thousands)
|
| Contingently | | Members' Equity |
| ||||||||||||||
| | | | | | | | | | | | | ||||||||
|
| Redeemable Founders' |
| Members' | | Accumulated Earnings |
| | |||||||||||
|
| Units | | Contributions | | (Deficit) | | Total |
| ||||||||||
| | | | | | | | | | | ||||||||||
Balance at December 31, 2013 |
| | $ | 498 | | | | $ | 289,699 | | | | 3,563 | | | 293,262 | | ||
Members' contributions |
| | — | | | | 9,963 | | | | — | | | 9,963 | | ||||
Net income |
| | — | | | | — | | | | 22,830 | | | 22,830 | | ||||
| | | | | | | | | | | ||||||||||
Balance at December 31, 2014 |
| | 498 | | | | 299,662 | | | | 26,393 | | | 326,055 | | ||||
Members' contributions |
| | — | | | | — | | | | — | | | — | | ||||
Net loss |
| | — | | | | — | | | | (125,962 | ) | | (125,962 | ) | ||||
| | | | | | | | | | | ||||||||||
Balance at December 31, 2015 |
| | $ | 498 | | | | $ | 299,662 | | | | (99,569 | ) | | 200,093 | | ||
| | | | | | | | | | | ||||||||||
| | | | | | | | | | | | | | | | | ||||
| | | | | | | | | | | ||||||||||
See accompanying notes to consolidated financial statements.
F-17
VANTAGE ENERGY II, LLC
Consolidated Statements of Cash Flows
Years ended December 31, 2015 and 2014
(In thousands)
|
| 2015 | | 2014 |
| ||
| | | | | | | ||
Cash flows from operating activities: |
| | | ||||
Net income (loss) |
| $ | (125,962 | ) | 22,830 | | |
Adjustments to reconcile net income (loss) to net cash provided by operating activities: |
| | | ||||
Depreciation, depletion, amortization, and accretion |
| 39,698 | | 18,302 | | ||
Accretion of original issue discount |
| 876 | | 417 | | ||
Impairment of proved oil and gas properties |
| 172,673 | | — | | ||
Gain on commodity derivatives |
| (51,793 | ) | (14,434 | ) | ||
Settlements on commodity derivatives |
| 26,589 | | 935 | | ||
Receipt from (payment for) novated commodity derivatives |
| — | | 300 | | ||
Changes in operating assets and liabilities: |
| | | ||||
Accounts receivable |
| (274 | ) | (7,088 | ) | ||
Accounts receivable — related party |
| 11,424 | | (3,231 | ) | ||
Inventory |
| (71 | ) | (171 | ) | ||
Prepayments and deposits |
| (11 | ) | (59 | ) | ||
Accounts payable and accrued liabilities |
| 8,484 | | 3,299 | | ||
| | | | | | | ||
Net cash provided by operating activities |
| 81,633 | | 21,100 | | ||
| | | | | | | ||
Cash flows from investing activities: |
| | | ||||
Oil and gas property exploration, acquisition, and development |
| (134,223 | ) | (176,799 | ) | ||
Gathering system additions |
| (13,117 | ) | (34,442 | ) | ||
Water investment additions |
| (1,512 | ) | — | | ||
Other assets |
| — | | (1,374 | ) | ||
| | | | | | | ||
Net cash used in investing activities |
| (148,852 | ) | (212,615 | ) | ||
| | | | | | | ||
Cash flows from financing activities: |
| | | ||||
Member contributions |
| — | | 9,963 | | ||
Borrowings under revolving credit facility |
| 49,000 | | 125,000 | | ||
Principal payments on revolving credit facility |
| — | | (25,000 | ) | ||
Borrowings under second lien note payable |
| — | | 97,250 | | ||
Deferred financing costs |
| (527 | ) | (292 | ) | ||
| | | | | | | ||
Net cash provided by financing activities |
| 48,473 | | 206,921 | | ||
| | | | | | | ||
Net change in cash and cash equivalents |
| (18,746 | ) | 15,406 | | ||
Cash and cash equivalents — beginning of year |
| 21,185 | | 5,779 | | ||
| | | | | | | ||
Cash and cash equivalents — end of year |
| $ | 2,439 | | 21,185 | | |
| | | | | | | ||
| | | | | | | ||
| | | | | | | ||
Supplemental disclosure of cash flow information: |
| | | ||||
Cash paid for interest |
| $ | 12,204 | | 5,297 | | |
Supplemental disclosure of selected non cash accounts: |
| | | ||||
Accrued capital additions |
| $ | 20,366 | | 15,484 | | |
Capitalized asset retirement obligations |
| 534 | | 887 | | ||
See accompanying notes to consolidated financial statements.
F-18
VANTAGE ENERGY II, LLC
Notes to Consolidated Financial Statements
December 31, 2015 and 2014
(1) Description of Business and Summary of Significant Accounting Policies
(a) Nature of Operations and Principles of Consolidation
Vantage Energy II, LLC (the Company) was organized as a limited liability company under the laws of the state of Delaware in 2012. The consolidated financial statements include the accounts of Vantage Energy II, LLC and its two wholly owned subsidiaries. All intercompany balances have been eliminated in consolidation.
The Company is engaged in the exploration and exploitation of petroleum and natural gas, as well as natural gas acquisition, development, and gathering, with a focus in unconventional resources in the Appalachian Basin of the United States.
(b) Use of Estimates
The preparation of these consolidated financial statements, in conformity with generally accepted accounting principles in the United States of America, requires management to make estimates and assumptions that affect the amounts reported in the consolidated financial statements and accompanying notes. As a result, actual amounts could differ from estimated amounts. By their nature, these estimates are subject to measurement uncertainty, and the effect on the consolidated financial statements of changes in such estimates in future periods could be significant. Significant estimates with regard to the Company's consolidated financial statements include the estimate of proved oil and gas reserve volumes and the related present value of estimated future net cash flows, the recoverability of unproved oil and gas properties, the calculation of depletion of oil and gas reserves, the estimated cost and timing related to asset retirement obligations, and the estimated fair value of derivative assets and liabilities.
Reserve estimates are, by their nature, inherently imprecise. The process of estimating quantities of oil and gas reserves is complex, requiring significant decisions in the evaluation of all available geological, geophysical, engineering, and economic data. The data for a given field may also change substantially over time as a result of numerous factors including, but not limited to, additional development activity, evolving production history and continual reassessment of the viability of production under varying economic conditions. As a result, material revisions to existing reserve estimates may occur from time to time. Although every reasonable effort is made to ensure that the reserve estimates represent the most accurate assessments possible, subjective decisions, and available data for our various fields make these estimates generally less precise than other estimates included in financial statement disclosures,
(c) Cash and Cash Equivalents
The Company considers all highly liquid investments with original maturities of three months or less to be cash equivalents. The Company continually monitors its positions with, and the credit quality of, the financial institutions with which it invests. As of the balance sheet date, and throughout the year, the Company has maintained balances in various operating accounts in excess of federally insured limits.
(d) Oil and Gas Properties
The Company follows the full-cost method of accounting for natural gas and crude oil properties. All costs associated with property acquisition, exploration, and development activities
F-19
VANTAGE ENERGY II, LLC
Notes to Consolidated Financial Statements (Continued)
December 31, 2015 and 2014
(1) Description of Business and Summary of Significant Accounting Policies (Continued)
are capitalized. Exploration and development costs include dry hole costs, geological and geophysical costs, direct overhead related to exploration and development activities, and other costs incurred for the purpose of finding oil and gas reserves. Salaries and benefits paid to employees directly involved in the exploration and development of properties, as well as other internal costs that can be directly identified with acquisition, exploration, and development activities, are also capitalized. For the years ended December 31, 2015 and 2014, the Company capitalized certain internal costs of approximately $4.5 million and $3.6 million, respectively.
Costs of acquiring unproved oil and gas properties are initially excluded from the depletable base and are assessed at each reporting period to ascertain whether impairment has occurred. When proved reserves are assigned to the property or the property is considered to be impaired, the costs of the property or the amount of impairment is added to the depletable base. Upon complete evaluation of a property, the total remaining excluded cost (net of any impairment) is included in the full cost amortization base.
Capitalized costs, as adjusted for estimated future development costs and estimated asset retirement costs, less estimated salvage values, are depreciated, depleted, and amortized using the units-of-production method based on estimated proved reserves as determined by petroleum engineers. The costs of wells-in-progress and unevaluated properties, including any related capitalized interest and internal costs, are not amortized. For the purposes of this calculation, crude oil and natural gas liquid reserves and production are converted to equivalent volumes of natural gas based on the relative energy content of one barrel to six thousand cubic feet of gas. Proceeds from the disposal of properties are normally deducted from the full-cost pool without recognition of gains or losses, except under circumstances where the deduction would significantly alter the relationship between capitalized costs and proved reserves of the cost center, in which case a gain or loss is recorded.
Pursuant to the full-cost accounting rules, the Company is required to perform a "ceiling test". If the net capitalized cost of the Company's oil and gas properties subject to the amortization (the carrying value) exceeds the ceiling limitation, the excess would be charged to expense. The ceiling limitation is equal to the sum of the present value discounted at 10% of estimated future net cash flows from proved reserves, the cost of properties not being amortized, the lower of cost or estimated fair value of unproven properties included in the costs being amortized, and all related income tax effects. The present value of estimated future net revenue is computed by applying the average first day of the month oil and gas price for the preceding 12-month period to estimated future production of proved oil and gas reserves as of period-end, less estimated future expenditures to be incurred in developing and producing the proved reserves, assuming the continuation of existing economic conditions.
For the year ended December 31, 2015, the carrying value of the Company's oil and gas properties subject to the test exceeded the calculated value of the ceiling limitation by $172.7 million. As a result, the Company recorded an impairment of $172.7 million. The ceiling test calculation uses rolling 12-month average commodity prices, the effect of lower quarter-over-quarter commodity prices in future quarters could result in a potentially lower ceiling value in future periods. This could result in ongoing impairments each quarter until prices stabilize or improve.
F-20
VANTAGE ENERGY II, LLC
Notes to Consolidated Financial Statements (Continued)
December 31, 2015 and 2014
(1) Description of Business and Summary of Significant Accounting Policies (Continued)
(e) Costs Not Being Amortized
The following table sets forth a summary of oil and gas property costs not being amortized at December 31, 2015, by the year in which such costs were incurred. Included in the $187.5 million of costs not subject to amortization are approximately $61 million that the Company deems significant related to its acquisition of properties from Chesapeake Energy in the Marcellus Shale during 2013. The Company expects to evaluate and develop these Marcellus Shale properties over the next three to five years and to include the relevant costs in the amortization computation as such evaluation activities are completed.
|
| Costs Incurred (In thousands) |
| ||||||||||||||||
| | | | | | | | | | | ||||||||||
|
| Prior to 2013 | | During 2014 | | During 2015 | | Total |
| ||||||||||
| | | | | | | | | | | ||||||||||
Acquisition Costs |
| | $ | 109,639 | | | | 38,888 | | | | 18,065 | | | 166,592 | | |||
Exploration and development costs |
| | — | | | | — | | | | 9,355 | | | 9,355 | | ||||
Capitalized Interest |
| | 2,444 | | | | 1,036 | | | | 8,082 | | | 11,562 | | ||||
| | | | | | | | | | | ||||||||||
Total |
| | $ | 112,083 | | | | 39,924 | | | | 35,502 | | | 187,509 | | |||
| | | | | | | | | | | ||||||||||
| | | | | | | | | | | | | | | | | ||||
| | | | | | | | | | | ||||||||||
(f) Joint Ventures
Certain of the Company's oil and gas exploration and development activities are conducted jointly with others; accordingly, the consolidated financial statements reflect only the Company's proportionate interest in such activities.
(g) Inventory
The Company's inventory primarily comprises tubular goods and well equipment to be used in future drilling operations. Inventory is charged to specific wells and transferred into oil and gas properties when used. There were no material inventory write-downs for the years ended December 31, 2015 and 2014.
(h) Gas Gathering System
The Company's gas gathering assets are held by Vista Gathering, LLC (hereinafter referred to as Vantage Midstream). The Company has a 100% membership interest in Vantage Midstream, operates the majority of Vantage Midstream's assets, and owns a 50% undivided working interest in such assets. All gas transported in the gas gathering system relates to wells in which the Company and/or Vantage Energy, LLC (Vantage I), an affiliate under common management, owns a working interest and for which either the Company or Vantage I serves as operator. Vantage Midstream also owns a 38% nonoperated interest in the Appalachia Midstream Services, Rogersville system gas gathering joint venture. The Company and Vantage I each own a 50% undivided working interest in Vantage Midstream's assets.
The Company's gas gathering assets are being depreciated on the straight-line method over a 20-year useful life. For the years ended December 31, 2015 and 2014, the Company recognized depreciation expense on its gas gathering system assets of approximately $3.0 million and $1.7 million, respectively. Maintenance and repairs are charged to expense as incurred.
F-21
VANTAGE ENERGY II, LLC
Notes to Consolidated Financial Statements (Continued)
December 31, 2015 and 2014
(1) Description of Business and Summary of Significant Accounting Policies (Continued)
Expenditures that extend the useful lives of assets are capitalized. When assets are retired or otherwise disposed of, the cost of the assets and the related accumulated depreciation are removed from the accounts. Any gain or loss on retirements is reflected in other income in the year in which the asset is disposed.
The Company reviews its long-lived assets other than oil and gas properties for impairment whenever events or changes in circumstances indicate that the carrying amount of the asset may not be recovered. The Company performs an analysis of the anticipated undiscounted future net cash flows of the related long-lived assets and if the carrying value of the related asset exceeds the undiscounted cash flows, the carrying value is reduced to the asset's fair value and an impairment loss is recorded against the long-lived asset. There have been no provisions for impairment recorded for the years ended December 31, 2015 and 2014.
(i) Water Investment
Vantage Midstream entered into a 10-year agreement for Water System Expansion and Supply with Southwestern Pennsylvania Water Authority (SPWA) on February 18, 2015. The purpose of the agreement was to fund and assist SPWA in constructing an expansion to its water supply system; grant the Company preferred rights to water volumes for its use in its oil and gas operations; and create a repayment structure for the Company and Vantage Midstream through a surcharge applicable to all oil and gas water users. The proposed water system improvements to be funded by the Company are estimated to be $14.7 million; however, the Company may terminate the agreement without penalty. The surcharge in the amount of $3.50 per 1,000 gallons of water sold to oil and gas users from the system is collected by SPWA and remitted to Vantage Midstream. The costs incurred by us are capitalized and are being amortized on a straight line basis over the life of the agreement. Payments to Vantage Midstream from SPWA derived from surcharges paid to SPWA by third parties are applied as a recovery of capital investment for funds advanced by Vantage Midstream to expand the system, while payments to Vantage Midstream from SPWA derived from surcharges from the Company are recorded as an offset to Vantage Midstream's cost of water.
The Company entered in a Water Services and Supply Agreement with Vantage Midstream effective May 1, 2015. Under the agreement, Vantage Midstream will provide water services required by the Company, including the supply of water for injection and related collection, recycling, purifying, and the disposal of water after use. Vantage Midstream is responsible for the sourcing and transportation of water as requested by the Company. Vantage Midstream will also collect, clean, recycle, transport, and/or dispose of produced water and flow back water resulting from the Company's operations. The Company's 50% undivided working interest in the profits of the water business are eliminated against the full cost pool upon consolidation.
(j) Deferred Financing Cost
Costs associated with obtaining debt financing are deferred and amortized over the term of the debt. These costs, net of amortization, are included in other assets.
(k) Asset Retirement Obligations
Asset retirement obligations relate to future costs associated with the plugging and abandonment of oil and gas wells, removal of equipment and facilities from leased acreage, and
F-22
VANTAGE ENERGY II, LLC
Notes to Consolidated Financial Statements (Continued)
December 31, 2015 and 2014
(1) Description of Business and Summary of Significant Accounting Policies (Continued)
returning such land to its original condition. The fair value of a liability for an asset retirement obligation is recorded in the period in which it is incurred and the cost of such liability is recorded as an increase in the carrying amount of the related long-lived asset by the same amount. The liability is accreted each period and the capitalized cost is depleted as part of the full-cost pool or is depreciated as part of the gas gathering system. Revisions to estimated asset retirement obligations result in adjustments to the related capitalized asset and corresponding liability.
(l) Commodity Derivatives
The Company uses commodity derivative instruments to provide a measure of stability to its cash flows in an environment of volatile natural gas prices and to manage its exposure to commodity price risk. The Company records all derivative instruments at fair value within the accompanying consolidated balance sheets. Changes in fair value are to be recognized currently in earnings unless specific hedge accounting criteria are met. Management has decided not to use hedge accounting under the accounting guidance for its derivatives; therefore, the changes in fair value are recognized in earnings. The Company classifies cash payment and receipts on its derivative instruments in operating cash flows in the accompanying consolidated statements of cash flows.
(m) Revenue Recognition
The Company accounts for natural gas sales using the "entitlements method". Under the entitlements method, revenue is recorded based upon the Company's ownership share of volumes sold, regardless of whether it has taken its ownership share of such volumes. The Company records a receivable or a liability to the extent it receives less or more than its share of the volumes and related revenue. Any amount received in excess of the Company's share is treated as a liability. If the Company receives less than its entitled share, the underproduction is recorded as a receivable. The Company sells the majority of its products soon after production at various locations, including the wellhead, at which time title and risk of loss pass to the buyer. At December 31, 2015 and 2014, the Company did not have any material gas imbalances.
The Company's gas gathering revenue is generated from gas gathering and compressing natural gas in Pennsylvania. The Company provides gas gathering services and compression services under fee-based arrangements.
(n) Concentrations of Credit Risk
The Company grants credit in the normal course of business to oil and gas purchasers in the United States of America. Collectability of the Company's natural gas revenue is dependent upon the financial wherewithal of the Company's purchasers, as well as general economic conditions of the industry. To date, the Company has not had any bad debts.
Approximately, 54%, 28%, and 15% of the Company's accounts receivable as of December 31, 2015 were due from Asset Risk Management (ARM), South Jersey, and Noble Group, respectively. Approximately, 41%, 24%, and 24% of the Company's accounts receivable as of December 31, 2014 were due from South Jersey Industries, Sequent Energy, and Noble Group, respectively.
F-23
VANTAGE ENERGY II, LLC
Notes to Consolidated Financial Statements (Continued)
December 31, 2015 and 2014
(1) Description of Business and Summary of Significant Accounting Policies (Continued)
Approximately, 39% and 32% of the Company's oil and gas revenue for the year ended December 31, 2015 were generated from ARM and South Jersey, respectively. Approximately, 51% and 48% of the Company's oil and gas revenue for the year ended December 31, 2014 were generated from EQT Production Company and Sequent Energy, respectively.
Although a substantial portion of production is purchased by these major customers, the Company does not believe the loss of any one or both customers would have a material adverse effect on our business, as other customers or markets would be accessible to us,
(o) Marketing and Gathering Costs
The Company sells its gas at the wellhead and receives payment net of gathering expenses. Vantage Midstream gathers all gas, excluding the Appalachia Midstream Services joint venture area. Vantage Midstream gathering fees are $0.26 per mmbtu for initial wells and $0.50 per mmbtu for subsequent wells, with a sliding scale downward to $0.25 per mmbtu based on cumulative system throughput.
(p) Impact Fees
The state of Pennsylvania imposes an impact fee on oil and gas production based on a formula applied to individual wells. The Company classifies the impact fees within production and ad valorem taxes on the accompanying consolidated statements of operations for the years ended December 31, 2015 and 2014.
(q) Capitalized Interest
The Company capitalizes interest costs to oil and gas properties on expenditures made in connection with projects that are not subject to current depletion. Interest is capitalized only for the period that activities are in progress to bring these projects to their intended use. For the years ended December 31, 2015 and 2014, the Company capitalized interest costs to unproved properties of $4.2 million and $2.7 million, respectively.
(r) Income Taxes
The Company is a multi-member limited liability company. Accordingly, no provision for income taxes has been recorded as the income, deductions, expenses, and credits of the Company are reported on the income tax returns of the Company's members.
The Company accounts for uncertainty in income taxes in accordance with generally accepted accounting principles, which prescribes a comprehensive model for recognizing, measuring, presenting, and disclosing in the consolidated financial statements tax positions taken or expected to be taken on a tax return, including a decision on whether or not to file in a particular jurisdiction. Only tax positions that meet a more-likely than-not recognition threshold at the effective date may be recognized or continue to be recognized.
Interest and penalties associated with tax positions are recorded in the period assessed as general and administrative expenses. No interest or penalties have been assessed as of December 31, 2015. The Company's information returns for tax years subject to examination by tax authorities include 2012 through the current year for state and federal tax reporting purposes.
F-24
VANTAGE ENERGY II, LLC
Notes to Consolidated Financial Statements (Continued)
December 31, 2015 and 2014
(1) Description of Business and Summary of Significant Accounting Policies (Continued)
(s) Industry Segment and Geographic Information
The Company conducts natural gas exploration, production, and gathering operations in the following segments: (1) Exploration and Production and (2) Midstream. All of the Company's operations and assets are located in the United States, and all of its revenue is attributable to domestic customers.
(t) New Accounting Pronouncements
The FASB issued ASU No. 2014-09, Revenue from Contracts with Customers, in May 2014. ASU 2014-09 requires an entity to recognize revenue to depict the transfer of promised goods or services to customers in an amount that reflects the consideration to which the entity expects to be entitled in exchange for those goods or services. ASU No. 2014-09 will supersede most of the existing revenue recognition requirements in United States GAAP when it becomes effective and is required to be adopted using one of two retrospective application methods. An entity should also disclose sufficient quantitative and qualitative information to enable users of financial statements to understand the nature, amount, timing, and uncertainty of revenue and cash flows arising from contracts with customers. The new standard is effective for annual reporting periods beginning after December 15, 2017. The Company will implement the provisions of ASU 2014-09 as of January 1, 2018. The Company has not yet determined the impact of the new standard on its current policies for revenue recognition.
The FASB issued ASU No 2016-02, Leases, in February 2016. ASU 2016-02 will require lessees to present right-of-use assets and lease liabilities on their balance sheets. ASU 2016-02 is effective for annual and interim periods beginning January 1, 2019. Early adoption of ASU 2016-02 is permitted. Upon adoption of ASU 2016-02, we are required to recognize and measure leases at the beginning of the earliest period presented in our consolidated financial statements using a modified retrospective approach. The modified retrospective approach includes a number of optional practical expedients that we may elect to apply. We have not yet decided when we will adopt ASU 2016-02 or which practical expedient options we will elect. We are currently evaluating and assessing the impact ASU 2016-02 will have on us and our financial statements. As of the date of this report, we cannot provide any estimate of the impact of adopting ASU 2016-02.
The FASB issued ASU 2015-03, Interest Imputation of Interest: Simplifying the Presentation of Debt Issuance Costs, in April 2015. The core principle of ASU 2015-03 will require all costs incurred to issue debt be presented in the balance sheet as a direct deduction from the carrying value of debt, consistent with debt discounts. Upon adoption of ASU 2015-03, the new standard is limited to the presentation of debt issuance costs. The standard does not affect the recognition and measurement of debt issuance costs. In August 2015, the FASB issued ASU 2015-15, Interest — Imputations of Interest, Subtopic 835-30, Interest (ASU 2015-15). The guidance in ASU 2015-03 did not address the presentation or subsequent measurement of debt issuance costs related to line-of-credit arrangements. ASU 2015-15 was issued to clarify that the SEC staff would not object to an entity deferring and presenting debt issuance costs as an asset and subsequently amortizing the deferred debt issuance costs ratably over the term of the line-of-credit arrangement, regardless of whether there are any outstanding borrowings on the line-of-credit arrangements. The amendments in ASU 2015-03 should be applied on a retrospective basis and early adoption is permitted. ASU 2015-03 is effective for financial statements issued for fiscal years beginning after
F-25
VANTAGE ENERGY II, LLC
Notes to Consolidated Financial Statements (Continued)
December 31, 2015 and 2014
(1) Description of Business and Summary of Significant Accounting Policies (Continued)
December 15, 2015, and interim periods within fiscal years beginning after December 15, 2016. The Company will implement the provision of ASU 2015-03 as of January 1, 2016. The Company does not believe the impact of the new standard on its presentation of debt issuance costs will have a material effect on the Company's financial statements and related disclosures.
(u) Pro Forma Financial Information
The pro forma statements of operations information for all periods presented reflects the impact of the Company's corporate reorganization to become taxed as a disregarded entity as if it had occurred at the beginning of the earliest period presented, pro forma net income (loss) per basic and diluted share is determined by dividing the pro forma net income (loss) by the number of common shares expected to be issued to the Company's Members in connection with the reorganization.
(2) Balance Sheet Disclosures
Accounts receivable consist of the following:
|
| December 31 |
| ||||
| | | | | | | ||
|
| 2015 | | 2014 |
| ||
| | | | | | | ||
|
| (In thousands) | | ||||
Joint interest billings |
| $ | 141 | | 219 | | |
Revenue |
| 10,256 | | 9,904 | | ||
| | | | | | | ||
|
| $ | 10,397 | | 10,123 | | |
| | | | | | | ||
| | | | | | | ||
| | | | | | | ||
Accounts payable and accrued liabilities consist of the following:
|
| December 31 |
| ||||
| | | | | | | ||
|
| 2015 | | 2014 |
| ||
| | | | | | | ||
|
| (In thousands) | | ||||
Accrued capital expenditures |
| $ | 20,366 | | 15,484 | | |
Accrued marketing, gathering, and transportation costs |
| 4,077 | | 4,151 | | ||
Cash calls payable |
| 232 | | — | | ||
Accrued impact fees payable |
| 1,911 | | 1,555 | | ||
Accrued interest payable |
| 1,380 | | 1,456 | | ||
Accounts payable |
| 5,643 | | 1,248 | | ||
Accrued production expense payable |
| 1,124 | | 753 | | ||
Accrued general and administrative expenses |
| 1,535 | | 644 | | ||
Accrued revenue payable |
| 2,748 | | 354 | | ||
| | | | | | | ||
|
| $ | 39,016 | | 25,645 | | |
| | | | | | | ||
| | | | | | | ||
| | | | | | | ||
F-26
VANTAGE ENERGY II, LLC
Notes to Consolidated Financial Statements (Continued)
December 31, 2015 and 2014
(3) Fair Value Measurements
Authoritative guidance defines fair value as the price that would be received to sell an asset or paid to transfer a liability (an exit price) in an orderly transaction between market participants at the measurement date. The guidance establishes a hierarchy for inputs used in measuring fair value that maximizes the use of observable inputs and minimizes the use of unobservable inputs by requiring that the most observable inputs be used when available. Observable inputs are inputs that market participants would use in pricing the asset or liability based on market data obtained from sources independent of the Company. Unobservable inputs are inputs that reflect the Company's assumptions of what market participants would use in pricing the asset or liability based on the best information available in the circumstances. The hierarchy is broken down into three levels based on the reliability of the inputs as follows:
| Level 1: | | Quoted prices are available in active markets for identical assets or liabilities |
Level 2: |
|
Quoted prices in active markets for similar assets and liabilities that are observable for the asset or liability |
Level 3: |
|
Unobservable pricing inputs that are generally less observable from objective sources, such as discounted cash flow models or valuations |
The assets and liabilities are classified based on the lowest level of input that is significant to the fair value measurement. The Company's policy is to recognize transfers in and/or out of the fair value hierarchy as of the end of the reporting period in which the event or change in circumstances caused the transfer. The Company has consistently applied the valuation techniques discussed below in all periods presented. The following table presents the Company's financial assets and liabilities that were accounted for at fair value on a recurring basis as of December 31, 2015 and 2014 by level within the fair value hierarchy (in thousands):
|
| December 31, 2015 |
| ||||||||||||||
| | | | | | | | | | | ||||||||
|
| Fair value measurements |
| ||||||||||||||
| | | | | | | | | | | ||||||||
Description |
| Level 1 |
| Level 2 |
| Level 3 |
| Total |
| ||||||||
Assets: |
| | | | | | | | | ||||||||
Commodity derivative instruments |
| | $ | — | | | 38,694 | | | — | | | 38,694 | | |||
|
| December 31, 2014 |
| ||||||||||||||
| | | | | | | | | | | ||||||||
|
| Fair value measurements |
| ||||||||||||||
| | | | | | | | | | | ||||||||
Description
|
| Level 1 |
| Level 2 |
| Level 3 |
| Total |
| ||||||||
Assets: |
| | | | | | | | | ||||||||
Commodity derivative instruments |
| | $ | — | | | 13,490 | | | — | | | 13,490 | | |||
The Company's commodity derivative instruments consist of variable-to-fixed price swaps. The fair values of the swap agreements are determined under the income valuation technique using a discounted cash flow model. The valuation model requires a variety of inputs, including contractual terms, published forward prices, and discount rates, as appropriate. The Company's estimates of fair value of commodity derivative instruments include consideration of the counterparty's creditworthiness, the Company's creditworthiness, and the time value of money. The consideration
F-27
VANTAGE ENERGY II, LLC
Notes to Consolidated Financial Statements (Continued)
December 31, 2015 and 2014
(3) Fair Value Measurements (Continued)
of these factors results in an estimated exit price for each derivative asset or liability under a marketplace participant's view. All of the significant inputs are observable, either directly or indirectly; therefore, the Company's derivative instruments are included within the Level 2 fair value hierarchy. The counterparties on the Company's derivative instruments are the same financial institutions that hold the Revolving Credit Facility (note 7). Accordingly, the Company is not required to post collateral on these derivatives since the bank is secured by the Company's oil and gas assets.
Non-Recurring Fair Value Measurements
The Company uses the income valuation technique using a discounted cash flow model to estimate the initial fair value of asset retirement obligations using estimated gross well costs of reclamation ranging in amounts from $10,000 to $100,000, timing of expected future dismantlement costs ranging from 20 to 28 years, and a weighted average credit-adjusted risk-free rate. Accordingly, the fair value is based on unobservable pricing inputs and, therefore, is included within the Level 3 fair value hierarchy. During the years ended December 31, 2015 and 2014, the Company recorded liabilities for asset retirement obligations of $0.3 million and $0.9 million, respectively. See note 4 for additional information,
Other Financial Instruments
Other financial instruments not measured at fair value on a recurring basis include cash and cash equivalents, accounts receivable, accounts payable, and accrued liabilities. The financial statement carrying amounts of these items approximate their fair values due to their short-term nature.
(4) Asset Retirement Obligations
The following table presents the reconciliation of the beginning and ending aggregate carrying amount of the obligations associated with the retirement of oil and gas properties and the gas gathering system:
|
| December 31 |
| ||||
| | | | | | | ||
|
| 2015 | | 2014 |
| ||
| | | | | | | ||
|
| (In thousands) | | ||||
Beginning of year |
| $ | 1,484 | | 564 | | |
Liabilities incurred |
| 288 | | 860 | | ||
Accretion expense |
| 73 | | 30 | | ||
Revisions to estimate |
| 246 | | 30 | | ||
| | | | | | | ||
End of year |
| $ | 2,091 | | 1,484 | | |
| | | | | | | ||
| | | | | | | ||
| | | | | | | ||
(5) Commodity Derivative Instruments
The Company is exposed to certain risks relating to its ongoing business operations, including risks related to commodity prices. The Company is focused on maintaining an active hedging
F-28
VANTAGE ENERGY II, LLC
Notes to Consolidated Financial Statements (Continued)
December 31, 2015 and 2014
(5) Commodity Derivative Instruments (Continued)
program using commodity derivative financial instruments to achieve a more predictable cash flow by reducing its exposure to commodity price fluctuations and regional basis differential exposure in an effort to protect its capital investment program, as well as expected future cash flows. The Company's risk management activity is generally accomplished through over-the-counter commodity derivative contracts with large financial institutions. The Company currently uses fixed price natural gas swaps for which it receives a fixed swap price for future production in exchange for a payment of the variable market price received at the time future production is sold.
While the use of instruments limits the downside risk of adverse price changes, their use may also limit future revenue from favorable price changes. The Company has adopted fair value accounting for its derivatives; therefore, changes in the fair value of derivative financial instruments are recognized in earnings. Cash payments or receipts on such contracts are included in cash flows from operating activities in the consolidated statements of cash flows.
At December 31, 2015, the terms of outstanding commodity derivative contracts were as follows:
Commodity
|
| Quantity remaining |
| Prices | | Price index | | Contract period |
| Estimated fair value |
| ||||||
| | | | | | | | | | | | | ||||||
|
| | | | | (in thousands) | | ||||||||||
Natural gas swaps (MMBtu): |
| | | | | | | | |||||||||
Dominion South Point |
| 65,201,000 | | 1.67 - 3.13 | | Dominion South Point | | 1/16 - 12/19 | | | $ | 38,694 | | | |||
| | | | | | | | | | | | | ||||||
Total (MMBtu) |
| 65,201,000 | | | | | | $ | 38,694 | | | ||||||
| | | | | | | | | | | | | ||||||
| | | | | | | | | | | | | | | ||||
| | | | | | | | | | | | | ||||||
The Company estimates that 2016 hedged volumes, in aggregate, represent approximately 63% of the Company's estimated proved gas production for 2016, based upon the year-end external reserve report.
Depending on changes in oil and natural gas futures markets and management's view of underlying supply and demand trends, the Company may increase or decrease its hedging positions.
The Company classifies the fair value amounts of derivative assets and liabilities as net current or noncurrent derivative assets or net current or noncurrent derivative liabilities, whichever the case may be, by commodity and by counterparty. As of December 31, 2015, the Company's commodity derivative instruments were subject to an enforceable master netting arrangement that provides for offsetting of amounts payable or receivable between the Company and the counterparty. The agreement also provides that in the event of an early termination, the counterparty has the right to offset amounts owed or owing under that and any other agreement with the same counterparty. The Company's accounting policy is to offset these positions in the accompanying consolidated balance sheets.
F-29
VANTAGE ENERGY II, LLC
Notes to Consolidated Financial Statements (Continued)
December 31, 2015 and 2014
(5) Commodity Derivative Instruments (Continued)
The following tables provide a reconciliation between the net assets and liabilities reflected in the accompanying consolidated balance sheets and the potential effects of master netting arrangements on the gross fair value of the commodity derivative contracts:
|
| | December 31, 2015 |
| ||||||||||||||
| | | | | | | | | | | |||||||||
|
| | Gross | | | Net recognized | | |||||||||||
|
| | recognized | | Gross | | fair value | | ||||||||||
|
| Consolidated balance | | assets/ | | amounts | | assets/ | | |||||||||
|
| sheet classification | | liabilities | | offset | | liabilities |
| |||||||||
| | | | | | | | | | | |||||||||
|
| | | (In thousands) | | | ||||||||||||
Commodity derivative assets: |
| | | | | | | | | | | |||||||
Commodity contracts |
| Current assets | | | $ | 30,868 | | | | (131 | ) | | | 30,737 | | | ||
Commodity contracts |
| Noncurrent assets | | | 7,998 | | | | (41 | ) | | | 7,957 | | | |||
| | | | | | | | | | | |||||||||
Total commodity derivative assets |
| | | $ | 38,866 | | | | (172 | ) | | | 38,694 | | | |||
| | | | | | | | | | | |||||||||
| | | | | | | | | | | | | | | | | |||
| | | | | | | | | | | |||||||||
Commodity derivative liabilities: |
| | | | | | | | | | | |||||||
Commodity contracts |
| Current liabilities | | | $ | 131 | | | | (131 | ) | | | — | | | ||
Commodity contracts |
| Noncurrent liabilities | | | 41 | | | | (41 | ) | | | — | | | |||
| | | | | | | | | | | |||||||||
Total commodity derivative liabilities |
| | | $ | 172 | | | | (172 | ) | | | — | | | |||
| | | | | | | | | | | |||||||||
| | | | | | | | | | | | | | | | | |||
| | | | | | | | | | | |||||||||
|
| | December 31, 2014 |
| ||||||||||||||
| | | | | | | | | | | |||||||||
|
| | Gross | | | Net recognized | | |||||||||||
|
| | recognized | | Gross | | fair value | | ||||||||||
|
| Consolidated balance | | assets/ | | amounts | | assets/ | | |||||||||
|
| sheet classification | | liabilities | | offset | | liabilities |
| |||||||||
| | | | | | | | | | | |||||||||
|
| | | (In thousands) | | | ||||||||||||
Commodity derivative assets: |
| | | | | | | | | | | |||||||
Commodity contracts |
| Current assets | | | $ | 10,296 | | | | (42 | ) | | | 10,254 | | | ||
Commodity contracts |
| Noncurrent assets | | | 3,391 | | | | (155 | ) | | | 3,236 | | | |||
| | | | | | | | | | | |||||||||
Total commodity derivative assets |
| | | $ | 13,687 | | | | (197 | ) | | | 13,490 | | | |||
| | | | | | | | | | | |||||||||
| | | | | | | | | | | | | | | | | |||
| | | | | | | | | | | |||||||||
Commodity derivative liabilities: |
| | | | | | | | | | | |||||||
Commodity contracts |
| Current liabilities | | | $ | 42 | | | | (42 | ) | | | — | | | ||
Commodity contracts |
| Noncurrent liabilities | | | 155 | | | | (155 | ) | | | — | | | |||
| | | | | | | | | | | |||||||||
Total commodity derivative liabilities |
| | | $ | 197 | | | | (197 | ) | | | — | | | |||
| | | | | | | | | | | |||||||||
| | | | | | | | | | | | | | | | | |||
| | | | | | | | | | | |||||||||
F-30
VANTAGE ENERGY II, LLC
Notes to Consolidated Financial Statements (Continued)
December 31, 2015 and 2014
(5) Commodity Derivative Instruments (Continued)
The table below summarizes the realized and unrealized gains related to the Company's commodity derivative instruments. These realized and unrealized gains are recorded in the accompanying consolidated statement of operations.
|
| Location of gains recognized in |
| Year ended December 31 |
| ||||
| | | | | | | | | ||
|
| earnings | | 2015 | | 2014 |
| ||
| | | | | | | | | ||
|
| | (In thousands) | | |||||
Commodity derivative instruments: |
| | | | |||||
Realized gains on commodity derivative instruments |
| Operating revenue | | $ | 26,589 | | 935 | | |
Unrealized gain on commodity derivative instruments |
| Operating revenue | | 25,204 | | 13,499 | | ||
| | | | | | | | | ||
Total gain on commodity derivatives |
| | $ | 51,793 | | 14,434 | | ||
| | | | | | | | | ||
| | | | | | | | | ||
| | | | | | | | | ||
Due to the volatility of oil and natural gas prices, the estimated fair values of the Company's commodity derivative instruments are subject to large fluctuations from period to period.
Derivative Novations
In January 2014, the Company assumed certain derivative contracts from Vantage I, as approved by Wells Fargo Bank, N.A. The Company determined the total fair value of the derivative contracts on the date of transfer to be approximately $(0.3) million.
(6) Related Party Transactions
(a) Gas Gathering System Operating Agreement
In connection with the Joint Development Agreement with Vantage I, the Company, through its wholly owned subsidiary, Vantage Midstream, became the operator of the gas gathering assets. Pursuant to a Gathering System Operating Agreement, dated August 2, 2012, between the Company and Vantage I, the Company and Vantage I are to pay their respective 50% shares of the gas gathering system operating and development costs, as well as their incurred gas gathering and compression fees. The Company was charged gas gathering and compression fees by Vantage Midstream of $23.9 million and $9.8 million for the years ended December 31, 2015 and 2014, respectively.
(b) Water Investment
Pursuant to the Water Services and Supply Agreement, Vantage Midstream provides water services required in the Company's drilling operations. The Company paid fees to Vantage Midstream of $6.5 million for the year ended December 31, 2015.
(c) Management Services Agreement
In August 2012, the Company and Vantage I entered into a Management Services Agreement (MSA) whereby Vantage I is to provide certain executive management, administrative, accounting, finance, engineering, land, and information technology assistance to the Company. In exchange for
F-31
VANTAGE ENERGY II, LLC
Notes to Consolidated Financial Statements (Continued)
December 31, 2015 and 2014
(6) Related Party Transactions (Continued)
providing these services, the Company will pay Vantage I a fee (the MSA Fee). Through June 2014, the MSA Fee was calculated as 50% of the overall gross general and administrative expenses incurred by Vantage I. Starting in July 2014, the MSA Fee is based upon the gross general and administrative expenses incurred by Vantage I multiplied by a ratio of the relative capital expenditures and oil and natural gas production volumes of the Company and Vantage I. Certain adjustments are made to this calculation to reflect the allocation of general and administrative expenses to Vantage Midstream. For the years ended December 31, 2015 and 2014, the Company recorded gross general and administrative expenses incurred under the MSA of approximately $12.0 million and $8.7 million, respectively.
(d) MIU Notes Receivable
In December 2014, the Company made loans to certain employees in the form of notes receivable. Interest accrues on the notes at 0.34% per annum, and the notes mature upon the earlier to occur of: 1) December 1, 2017; 2) consummation of Monetization Event (as defined); or 3) fifteen days after the date of voluntary termination of employment by the employee or termination by the Company for cause. As of December 31, 2015, the notes had a balance of $1.4 million and are classified in other assets in the accompanying consolidated balance sheets. The notes are collateralized by a first lien interest in the employees' interest in each employees' Management Incentive Units (MIUs) and all potential dividends and distributions and a second lien on all other personal assets. Interest income was deemed de minimus for the year ended December 31, 2015.
(7) Long-Term Debt
(a) Revolving Credit Facility
Effective November 29, 2012, the Company secured a credit facility (the Revolving Credit Facility) with a group of bank lenders. Wells Fargo Bank, N.A. acts as administrative agent. Effective December 4, 2014 the Company amended and restated its Revolving Credit Facility to add a lien on the Vantage Midstream gas gathering system and add a midstream borrowing base. The maturity date of the Revolving Credit Facility is January 1, 2017. The Revolving Credit Facility has a maximum commitment of $500 million and as of December 31, 2015 and 2014, had a borrowing base of $166 million and $126 million, respectively. As of December 31, 2015 and 2014, the Company had outstanding borrowings of $149 million and $100 million, respectively. On each borrowing, the Company has the election to pay interest at a Base rate or LIBOR. The margin on Base rate loans ranges from 0.75% to 1.75%. The margin on LIBOR loans ranges from 1.75% to 2.75%. The Company pays quarterly a commitment fee ranging from 0.375% to 0.50% of the unused borrowing base. The Company elected to pay interest based on LIBOR, plus the applicable margin, which was 2.93% in total as of December 31, 2015.
As of December 31, 2015, the Revolving Credit Facility was collateralized by all of the Company's assets, including its 50% operated interest in the Vantage Midstream assets.
The Revolving Credit Facility contains certain financial covenants, including maintenance of a minimum current ratio and a maximum leverage ratio. As of December 31, 2015, the Company was not in compliance with the minimum current ratio covenant under the Revolving Credit Facility. On
F-32
VANTAGE ENERGY II, LLC
Notes to Consolidated Financial Statements (Continued)
December 31, 2015 and 2014
(7) Long-Term Debt (Continued)
May 10, 2016, the Company entered into the Eighth Amendment to Credit Agreement (Eighth Amendment), which included among other things, an equity cure right, applied retroactively to December 31, 2015, applicable to the Company's covenants under its credit agreement. The Company executed two $10 million capital calls, aggregating $20 million, from its current equity owners during the first four months of 2016, and such equity was included in the calculation of the current ratio covenant as of December 31, 2015, and, as a result, the Company was in compliance with all of its financial covenants as of December 31, 2015.
(b) Second Lien Term Loan
In May 2014, the Company entered into a second lien note payable (Second Lien note payable) with a face amount of $100 million, maturing on May 8, 2017. The Company has the election to pay interest at a Base rate or Eurodollar LIBOR. The margin on Base rate loans is 6.50%. The margin on LIBOR loans is 7.50%. As of December 31, 2015, the stated interest rate was 8.50%, and $100.0 million remained outstanding. The Second Lien note payable contains an optional prepayment provision that enables the Company to prepay the Second Lien note payable at par. The Second Lien note payable was issued with an original issue discount of $2.75 million, which has been classified as a reduction to the note balance. The discount is amortized over the term of the note using the effective interest method.
As of December 31, 2015, the Second Lien note payable was collateralized by a second lien interest in all of the Company's assets, including its 50% operated interest in the Vantage Midstream assets, and contains certain financial covenants. These covenants include maintenance of a maximum leverage ratio. As of December 31, 2015 and 2014, the Company was in compliance with this financial covenant.
During the years ended December 31, 2015 and 2014, the Company recognized gross interest expense of approximately $13.0 million and $6.7 million, respectively.
Maturities of long-term debt as of December 31, 2015 (including current maturities, excluding unamortized debt discounts) are as follows (in thousands):
|
| Revolving Credit Facility |
| Second Lien |
| ||||||
| | | | | | | ||||||
Year ending December 31, |
| | | | | | | ||||
2016 |
| | $ | — | | | | — | | | |
2017 |
| | 149,000 | | | | 100,000 | | | ||
| | | | | | | ||||||
Total future maturities of long-term debt |
| | $ | 149,000 | | | | 100,000 | | | |
| | | | | | | ||||||
| | | | | | | | | | | ||
| | | | | | | ||||||
(8) Commitments and Contingencies
As of December 31, 2015, the Company, as counterparty along with Vantage I, had contracts with certain rig operators and pipe suppliers totaling approximately $0.5 million of commitments for 2016. The commitments are allocated evenly between Vantage I and Vantage II.
F-33
VANTAGE ENERGY II, LLC
Notes to Consolidated Financial Statements (Continued)
December 31, 2015 and 2014
(8) Commitments and Contingencies (Continued)
On April 17, 2014, the Company entered into a 20,000 Mmbtu/d firm marketing agreement to market gas production associated with volumes produced in the Marcellus Shale. The agreement begins in October 2014 and continues through October 2020. Under the contract, the Company is paid based on TETCO M-2 pricing with the ability to share in downstream price upside when market conditions allow.
On May 9, 2014, the Company entered into a 37,500 Mmbtu/d firm marketing agreement to market gas production associated with volumes produced in the Marcellus Shale. The agreement began in November 2014 and continues through October 2019. Under the contract, the Company is paid based on TETCO M-2 pricing.
From time to time, the Company is party to litigation. The Company maintains insurance to cover certain actions and believes that resolution of such litigation will not have a material adverse effect on the Company.
(9) Capital Structure
Summarized below are the classes of interests that have been authorized:
- a)
- Class I
Interest Units (Class I Units)
- b)
- Class M Management Incentive Units (Class M Units).
Effective July 29, 2012, the Members approved the Amended and Restated Limited Liability Company Agreement (the Agreement).
Class I Units
Class I Units are issued to Members from time to time in exchange for a Member's capital commitment to make cash contributions when called by the Company pursuant to the terms as described in the Agreement.
The Company is authorized to issue as many Class I Units as its board of managers approves. Total capital commitments and contributions associated with outstanding Class I Units are as follows:
|
| December 31 |
| ||||
| | | | | | | ||
|
| 2015 | | 2014 |
| ||
| | | | | | | ||
|
| (In thousands) | | ||||
Institutional investors (commitment — $400,000) |
| $ | 298,804 | | 298,804 | | |
Founders (commitment — $667) |
| 498 | | 498 | | ||
Other employees/friends and family (commitment — $1,225) |
| 967 | | 967 | | ||
| | | | | | | ||
Total (total commitment — $401,892) |
| $ | 300,269 | | 300,269 | | |
| | | | | | | ||
| | | | | | | ||
| | | | | | | ||
As of December 31, 2015 and 2014, the Company had undrawn commitments of $101.6 million and $101.7 million, respectively. Included in the member contributions on the
F-34
VANTAGE ENERGY II, LLC
Notes to Consolidated Financial Statements (Continued)
December 31, 2015 and 2014
(9) Capital Structure (Continued)
consolidated balance sheets are equity issuance costs of approximately $0.1 million as of December 31, 2015 and 2014.
In June 2018, all capital commitments associated with the Class I Units will be reduced to contributions made at that time. In addition, the capital commitments of the Founders and selected other employees are subject to an additional increase of up to $7.0 million in the aggregate depending upon distributions received from Vantage I.
Decisions of the Company are approved by the majority of the Company's board of managers. As of December 31, 2015, the Company's board of managers comprised eight managers, including six appointed by the Institutional Investors, and the two Founders. One of the managers appointed by each Institutional Investor shall be subject to approval by the Founders.
Distributions of funds associated with the Class I Units follow a prescribed framework, which is outlined in detail in the Agreement. In general, distributions are first made to those Members who have made capital contributions in accordance with sharing ratios until such Members receive distributions to meet an internal rate of return threshold of 8%. Subsequent distributions are then allocated between the Class I and Class M Units in accordance with the provisions of the Agreement.
The Class I Units are illiquid, subject to substantial transfer restrictions, and have certain drag-along and tag-along rights as provided for in the Agreement.
The Company has the right, but not the obligation, to repurchase all of the Class I Units of management members if employment is terminated for any reason. If employment is terminated without cause, the repurchase price of the Class I Units is based on the fair market value of the units, as defined in the Agreement. If employment is terminated for cause, the repurchase price is equal to the lesser of i) the aggregate unreturned capital contributions and ii) the fair market value. However, the Company option to acquire does not apply to the Founders if employment is terminated due to death or disability. Upon termination of employment without cause or due to death or disability, the Founders/heirs may put their Class I Units of the Company at fair market value. The put option cannot be exercised if a Founder voluntarily terminates employment or is terminated for cause.
Upon termination of employment without cause or due to death or disability, the Founders/heirs may put their Class I Units to the Company at fair market value. Upon the occurrence of death or disability, the exercise of this put right is at the discretion of the Founders/heirs, which is an event outside of the Company's control. Under the standard codified within ASC 480, "Accounting for Certain Financial Instruments with Characteristics of Both Liabilities and Equity" and Emerging Issues Tax Force ("EITF") Topic D-98, stock subject to redemption requirements outside the control of the Company are required to be classified outside of permanent equity. Accordingly, the Founders' equity is classified outside of members' equity. The occurrence of these events is not deemed probable, and therefore, the Founders' equity has been measured at historic cost. The put option cannot be exercised if a Founder voluntarily terminates employment or is terminated for cause.
F-35
VANTAGE ENERGY II, LLC
Notes to Consolidated Financial Statements (Continued)
December 31, 2015 and 2014
(9) Capital Structure (Continued)
Class M Management Incentive Units
The Company has issued management incentive units to certain employees. The management incentive units participate only in distributions in liquidation events, meeting requisite financial thresholds after Capital Interests have recovered their investment, and special allocation amounts. Management incentive units have no voting rights. Compensation expense for these awards will be recognized when all performance, market, and service conditions are probable of being satisfied (in general, upon a liquidating event). Accordingly, no value was assigned to the interests when issued.
The Management Incentive Plan, as described in the Agreement, authorizes up to 2,000,000 nonvoting Class M Units. Class M Units may be granted with an assigned participation level.
Class M Units issued to the Founders may not exceed 900,000 and vest 15% on each of the first, second, and third annual grant-date anniversaries and 100% upon consummation of a monetization event. However, if a Founder's employment is terminated without cause or due to death or disability, the Class M Units held will be at least 50% vested.
The Class M Units issued to all others vest in accordance with individual grant letters, but generally require a service period of between three and five years before vesting in 45% of the Class M Units, with the remaining Class M Units vesting upon a monetization event if employed by the Company for more than one year. All vested Class M Units shall be forfeited for no consideration if employment is terminated for cause. All unvested Class M Units, whether to Founders or management members, shall be forfeited upon termination of employment for any reason.
The Company has the right, but not the obligation, to repurchase all of the vested Class M Units of management members if employment is terminated for any reason. If employment is terminated without cause, the repurchase price of the Class M Units is based on the fair market value of the units, as defined in the Agreement. However, the Company's option to acquire the Class M Units does not apply to the Founders if employment is terminated due to death or disability.
Upon termination of employment upon death or disability, the Founders/heirs may put their Class M Units to the Company at fair market value. The put option cannot be exercised if a Founder voluntarily terminates employment or is terminated for cause.
The following table presents the activity for Class M Units outstanding:
|
| Units |
| |
| | | | | |
Outstanding — December 1, 2014 |
| 1,817,000 | | |
Granted |
| 20,000 | | |
Forfeited |
| (90,850 | ) | |
| | | | | |
Outstanding — December 31, 2014 |
| 1,746,150 | | |
Granted |
| 52,550 | | |
Forfeited |
| (167,100 | ) | |
| | | | | |
Outstanding — December 31, 2015 |
| 1,631,600 | | |
| | | | | |
| | | | | |
| | | | | |
F-36
VANTAGE ENERGY II, LLC
Notes to Consolidated Financial Statements (Continued)
December 31, 2015 and 2014
(9) Capital Structure (Continued)
As of December 31, 2015 and 2014, 649,650 and 448,825, respectively, Class M Units were vested. For financial reporting purposes, no related compensation expense has been recorded as of December 31, 2015 and 2014, as the grant-date fair value of the Class M Units was deemed immaterial.
(10) Liquidity
The Revolving Credit Facility matures on January 1, 2017. The Company expects to repay and retire the Revolving Credit Facility in connection with the net proceeds from the completion of the public offering and cash on hand. The Company intends the Second Lien note payable to remain outstanding following the completion of the public offering. Additionally, the Company plans to obtain new financing following the anticipated corporate reorganization, contemporaneous with the offering.
In the event that some deficiency exists between the proceeds of the offering or the terms of the new facility and the Company's current facility, as of December 31, 2015 the Company has available undrawn capacity under its existing borrowing base of $17 million and available undrawn capacity under its equity commitments of $102 million to address such a deficiency. In addition, the Company expects that it will be able to secure incremental equity commitments and other sources of capital, including debt, if necessary, from its current equity investors, other investors or lenders to address any shortfall. The Company's current equity investors continue to be supportive of the Company's long-term growth and financing strategy.
While we anticipate engaging in active dialogue with our creditors and the potential public offering, at this time we are unable to predict the outcome of such or whether any such efforts to raise additional equity will be successful.
(11) Segment Reporting
In accordance with Accounting Standards Codification No. 280 — Segment Reporting, the Company periodically assesses whether there are changes in its operating and reporting segments. The Company has evaluated how the chief operating decision maker analyzes performance and allocates resources and has identified two reportable segments: the exploration and production segment and the midstream segment. The exploration and production segment explores for and produces oil, natural gas, and NGLs. The midstream segment engages in natural gas gathering and transportation services as well as water services primarily for the Company and its affiliate under common management, Vantage I. Midstream assets are held though the Company's 50% working interest in Vantage Midstream.
To assess the performance of the Company's operating segments, the chief operating decision maker analyzes Adjusted EBITDA. The Company defines Adjusted EBITDA as income (loss) before income taxes; DD&A; impairments; interest expense, net of capitalized interest; and total (gains) losses on derivatives, net, less net cash from settlement of commodity derivatives. DD&A and impairments are excluded from Adjusted EBITDA as a measure of segment operating performance because capital expenditures are evaluated at the time capital costs are incurred. Similarly, total (gains) losses on derivatives, net, less net cash from settlement of commodity derivatives are excluded from Adjusted EBITDA because these (gains) losses are not considered a
F-37
VANTAGE ENERGY II, LLC
Notes to Consolidated Financial Statements (Continued)
December 31, 2015 and 2014
(11) Segment Reporting (Continued)
measure of asset operating performance. Management believes that the presentation of Adjusted EBITDA provides useful information in assessing the Company's financial condition and operating results as well as the profitability of our business segments.
Adjusted EBITDA is a widely accepted financial indicator; however, Adjusted EBITDA as defined by the Company may not be comparable to similarly titled measures used by other companies and should be considered in conjunction with net income (loss) and other performance measures. Below is a reconciliation of consolidated Adjusted EBITDA to income (loss) before income taxes for the years ended December 31 (in thousands):
|
| 2015 | | 2014 |
| ||
| | | | | | | ||
Net income (loss) |
| $ | (125,962 | ) | 22,830 | | |
Interest expense, net of capitalized interest |
| 8,778 | | 4,027 | | ||
Total (gains) losses on derivatives, net, less net cash from settlement of commodity derivatives |
| (25,204 | ) | (13,499 | ) | ||
Depreciation, depletion, amortization, and accretion expense |
| 39,698 | | 18,302 | | ||
Impairment of oil and gas properties |
| 172,673 | | — | | ||
| | | | | | | ||
Adjusted EBITDA |
| $ | 69,983 | | 31,660 | | |
| | | | | | | ||
| | | | | | | ||
| | | | | | | ||
F-38
VANTAGE ENERGY II, LLC
Notes to Consolidated Financial Statements (Continued)
December 31, 2015 and 2014
(11) Segment Reporting (Continued)
The following summarizes selected financial information for the Company's reporting segments (in thousands):
|
| For the year ended December 31, 2015 |
| ||||||||||||||||||
| | | | | | | | | | | ||||||||||||
|
| Exploration and Production Segment |
| Midstream Segment |
| Eliminations | | Consolidated Total |
| ||||||||||||
| | | | | | | | | | | ||||||||||||
Oil, gas, and NGL revenues |
| | $ | 65,252 | | | | $ | — | | | | $ | — | | | | $ | 65,252 | | |
Gas gathering and compression revenues |
| | — | | | | 15,756 | | | | (11,702 | ) | | | 4,054 | | | ||||
Water revenue |
| | — | | | | 5,487 | | | | (5,487 | ) | | | — | | | ||||
Gain on commodity derivatives |
| | 51,793 | | | | — | | | | — | | | | 51,793 | | | ||||
| | | | | | | | | | | ||||||||||||
Total revenues(1) |
| | 117,045 | | | | 21,243 | | | | (17,189 | ) | | | 121,099 | | | ||||
E&P operating expenses |
| | 28,292 |
| | | — |
| | | (11,702 |
) |
|
| 16,590 |
| | ||||
Gathering and compression expenses |
| | — | | | | 1,834 | | | | — | | | | 1,834 | | | ||||
Water system expense |
| | — | | | | 4,185 | | | | (4,185 | ) | | | — | | | ||||
General and administrative expenses |
| | 6,140 | | | | 1,168 | | | | — | | | | 7,308 | | | ||||
| | | | | | | | | | | ||||||||||||
Total operating expenses |
| | 34,432 | | | | 7,187 | | | | (15,887 | ) | | | 25,732 | | | ||||
Other expense |
| | (180 | ) | | | — | | | | — | | | | (180 | ) | | ||||
Total gains on derivatives, net, less net cash from settlement of commodity derivatives |
| | (25,204 | ) | | | — | | | | — | | | | (25,204 | ) | | ||||
| | | | | | | | | | | ||||||||||||
Adjusted EBITDA |
| | $ | 57,229 | | | | $ | 14,056 | | | | $ | (1,302 | ) | | | $ | 69,983 | | |
| | | | | | | | | | | ||||||||||||
| | | | | | | | | | | | | | | | | | | ||||
| | | | | | | | | | | ||||||||||||
Total assets(2) |
| | $ | 429,321 | | | | $ | 62,678 | | | | $ | (2,762 | ) | | | $ | 489,237 | | |
Capital expenditures(3) |
| | 135,524 | | | | 14,629 | | | | (1,301 | ) | | | 148,852 | | | ||||
- (1)
- Total
intrasegment revenues for the E&P segment and midstream segment were $0 and $20,135, respectively.
- (2)
- Included
in the total assets for the midstream segment is $662 for the net water investment, which is an other asset on the balance sheet.
- (3)
- Included in capital expenditures for the midstream segment is $1,512 for the water investment expenditures, which is an other asset on the balance sheet.
F-39
VANTAGE ENERGY II, LLC
Notes to Consolidated Financial Statements (Continued)
December 31, 2015 and 2014
(11) Segment Reporting (Continued)
|
| For the year ended December 31, 2014 |
| ||||||||||||||||||
| | | | | | | | | | | ||||||||||||
|
| Exploration and Production Segment |
| Midstream Segment |
| Eliminations | | Consolidated Total |
| ||||||||||||
| | | | | | | | | | | ||||||||||||
Oil, gas, and NGL revenues |
| | $ | 43,622 | | | | $ | — | | | | $ | — | | | | $ | 43,622 | | |
Gas gathering and compression revenues |
| | — | | | | 7,085 | | | | (4,095 | ) | | | 2,990 | | | ||||
Water revenue |
| | — | | | | — | | | | — | | | | — | | | ||||
Gain on commodity derivatives |
| | 14,434 | | | | — | | | | — | | | | 14,434 | | | ||||
| | | | | | | | | | | ||||||||||||
Total revenues(1) |
| | 58,056 | | | | 7,085 | | | | (4,095 | ) | | | 47,547 | | | ||||
E&P operating expenses |
| | 13,804 |
| | | — |
| | | (4,231 |
) |
|
| 9,573 |
| | ||||
Gathering and compression expenses |
| | — | | | | 891 | | | | — | | | | 891 | | | ||||
Water system expense |
| | — | | | | — | | | | — | | | | — | | | ||||
General and administrative expenses |
| | 4,546 | | | | 877 | | | | — | | | | 5,423 | | | ||||
| | | | | | | | | | | ||||||||||||
Total operating expenses |
| | 18,350 | | | | 1,768 | | | | (4,231 | ) | | | 15,887 | | | ||||
Total gains on derivatives, net, less net cash from settlement of commodity derivatives |
| | (13,499 | ) | | | — | | | | — | | | | (13,499 | ) | | ||||
| | | | | | | | | | | ||||||||||||
Adjusted EBITDA |
| | $ | 26,207 | | | | $ | 5,317 | | | | $ | 136 | | | | $ | 31,660 | | |
| | | | | | | | | | | ||||||||||||
| | | | | | | | | | | | | | | | | | | ||||
| | | | | | | | | | | ||||||||||||
Total assets |
| | $ | 497,806 | | | | $ | 54,464 | | | | $ | (925 | ) | | | $ | 551,345 | | |
Capital expenditures |
| | 176,799 | | | | 34,442 | | | | — | | | | 211,241 | | | ||||
- (1)
- Total intrasegment revenues for the E&P segment and midstream segment were $0 and $6,902, respectively.
(12) Supplemental Information on Gas Producing Activities (unaudited)
The following is supplemental information regarding our consolidated gas producing activities. The amounts shown include our net working and royalty interests in all of our gas properties.
(a) Capitalized Costs Relating to Gas Producing Activities
|
| December 31, |
| ||||
| | | | | | | ||
|
| 2015 | | 2014 |
| ||
| | | | | | | ||
|
| (In thousands) | | ||||
Proved properties |
| $ |
420,197 |
| 313,695 |
| |
Unproved properties |
| 187,509 | | 150,310 | | ||
| | | | | | | ||
|
| 607,706 | | 464,005 | | ||
Accumulated depreciation and depletion |
| (223,920 | ) | (24,929 | ) | ||
| | | | | | | ||
Net capitalized costs |
| $ | 373,786 | | 439,076 | | |
| | | | | | | ||
| | | | | | | ||
| | | | | | | ||
F-40
VANTAGE ENERGY II, LLC
Notes to Consolidated Financial Statements (Continued)
December 31, 2015 and 2014
(12) Supplemental Information on Gas Producing Activities (unaudited) (Continued)
(b) Costs incurred in Certain Gas Activities
|
| December 31, |
| ||||
| | | | | | | ||
|
| 2015 | | 2014 |
| ||
| | | | | | | ||
|
| (In thousands) | | ||||
Acquisitions: |
| | | ||||
Unproved properties |
| $ | 507 | | 10,704 | | |
Proved properties |
| — | | — | | ||
Development costs |
| 137,829 | | 161,756 | | ||
Exploration costs |
| — | | — | | ||
| | | | | | | ||
Gas expenditures |
| $ | 138,336 | | 172,460 | | |
| | | | | | | ||
| | | | | | | ||
| | | | | | | ||
(c) Results of Operations for Gas Producing Activities
|
| December 31, |
| ||||
| | | | | | | ||
|
| 2015 | | 2014 |
| ||
| | | | | | | ||
Revenues |
| $ |
65,252 |
| 43,622 |
| |
Production costs |
| 16,590 | | 9,573 | | ||
Depletion and accretion |
| 36,390 | | 16,550 | | ||
Impairment of proved oil and gas properties |
| 172,673 | | — | | ||
| | | | | | | ||
Results of operations from producing activities |
| (160,401 | ) | 17,499 | | ||
| | | | | | | ||
Depletion and accretion rate per Mcf |
| $ | 0.88 | | 1.13 | | |
(d) Gas Reserve Information
Proved reserve quantities are based on estimates prepared by the independent petroleum engineering firm Wright & Company for the years ended December 31, 2015 and 2014 in accordance with guidelines established by the Securities and Exchange Commission (the "SEC").
Reserve definitions comply with definitions of Rules 4-10(a) (1)-(32) of Regulation S-X of the SEC. The reserve quantity information is limited to reserves which had been evaluated as of December 31, 2015 and 2014. Proved developed reserves represent only those reserves expected to be recovered from existing wells and support equipment. Proved undeveloped reserves ("PUD") are expected to be recovered from new wells after substantial development costs are incurred. All of the Company's proved reserves are located in the Unites States.
Proved reserves are those quantities of oil, NGLs and gas, which, by analysis of geosciences and engineering data, can be estimated with reasonable certainty to be economically producible — from a given date forward, from known reservoirs, and under existing economic conditions, operating methods, and government regulations — prior to the time at which contracts providing the right to operate expire, unless evidence indicates that the renewal is reasonably certain, regardless of whether deterministic or probabilistic methods are used for estimation. The project to extract the hydrocarbons must have commenced or the operator must be reasonable certain that it will commence the project within a reasonable time.
There are numerous uncertainties inherent in estimating quantities of proved reserves and projecting future rates of production and the timing of development expenditures. The estimation of
F-41
VANTAGE ENERGY II, LLC
Notes to Consolidated Financial Statements (Continued)
December 31, 2015 and 2014
(12) Supplemental Information on Gas Producing Activities (unaudited) (Continued)
our proved reserves employs one or more of the following: production trend extrapolation, analogy, volumetric assessment and material balance analysis. Techniques including review of production and pressure histories, analysis of electric logs and fluid tests, and interpretations of geologic and geophysical data are also involved in this estimation process.
The following table provides a rollforward of the total proved reserves for the year ended December 31, 2015 and 2014, as well as proved developed and proved undeveloped reserves at the end of each respective year:
|
| Natural Gas |
| |||
| | | | | |||
|
| Millions of Cubic Feet |
| |||
| | | | | |||
Proved developed and undeveloped reserves as of: |
| | | | ||
December 31, 2013 |
| | 299,683 | | | |
Revisions of previous estimates |
| | 22,039 | | | |
Extensions and discoveries |
| | 195,724 | | | |
Acquisitions |
| | 3,558 | | | |
Production |
| | (14,683 | ) | | |
| | | | | |||
December 31, 2014 |
| | 506,321 | | | |
Revisions of previous estimates |
| | 75,400 | | | |
Extensions and discoveries |
| | 282,540 | | | |
Divestitures |
| | (1,671 | ) | | |
Acquisitions |
| | 31,437 | | | |
Production |
| | (41,130 | ) | | |
| | | | | |||
December 31, 2015 |
| | 852,897 | | | |
Proved developed reserves as of: |
| | | | ||
December 31, 2014 |
| | 155,674 | | | |
December 31, 2015 |
| | 318,170 | | | |
Proved undeveloped reserves as of: |
| | | | ||
December 31, 2014 |
| | 350,647 | | | |
December 31, 2015 |
| | 534,727 | | | |
All of the Company's reserves as of December 31, 2014, and 2015 were located in the Appalachian Basin.
Total proved reserves increased 346,576 MMcf in 2015 primarily due to the following:
Revisions of previous estimates Previous estimates of proved reserves were revised upward primarily attributable to technical revisions associated with PUD inventory performance after conversion to PDP as well as the base PDP reserves being revised.
Extensions and discoveries Proved reserves increased primarily attributable to increased technical certainty in areas of existing leasehold ownership, ties to internal and external development activity.
Acquisitions Proved reserves increased primarily attributable to new leasehold acquisition from third parties allowing for higher certainty in inventory development.
F-42
VANTAGE ENERGY II, LLC
Notes to Consolidated Financial Statements (Continued)
December 31, 2015 and 2014
(12) Supplemental Information on Gas Producing Activities (unaudited) (Continued)
Total proved reserves increased 206,638 MMcf in 2014 primarily due to the following:
Revisions of previous estimates Previous estimates of proved reserves were revised upward primarily attributable to technical revisions associated with PUD inventory performance after conversion to PDP, higher pricing extending reserve life and the base PDP reserves being revised.
Extensions and discoveries Proved reserves increased primarily attributable to increased technical certainty in areas of existing leasehold ownership, tied to internal and external development activity. Additional extensions tied to development and conversion from non-proven inventory to PDP reserves in year-end 2014.
Acquisitions Proved reserves increased primarily attributable to new leasehold acquisition from third parties allowing for higher certainty in inventory development.
(e) Standardized Measure of Discounted Future Net Cash Flows
The "Standardized Measure of Discounted Future Net Cash Flows Relating to Proved Gas Reserves" ("Standardized Measure") is calculated in accordance with guidance provided by FASB. The Standardized Measure does not purport, nor should it be interpreted, to present the fair value of a company's proved oil and gas reserves. Fair value would require, among other things, consideration of expected future economic and operating conditions, a discount factor more representative of the time value of money, and risks inherent in reserve estimates.
Under the Standardized Measure, future cash inflows are based upon the forecasted future production of year-end reserves. Future cash inflows are then reduced by estimated future production and development costs to determine net pre-tax flow. Tax credits and permanent differences are also considered in the future income tax calculation. Future net cash flow after income taxes is discounted using a 10% annual discount rate to arrive at the Standardized Measure.
The following summary sets forth the Standardized Measure (in thousands):
|
| December 31, |
| ||||
| | | | | | | ||
|
| 2015 | | 2014 |
| ||
| | | | | | | ||
Future cash inflows |
| $ | 916,592 | | $ | 1,733,819 | |
Future production costs |
| (222,386 | ) | (162,863 | ) | ||
Future development costs |
| (276,271 | ) | (282,455 | ) | ||
Future income tax expense(1) |
| — | | — | | ||
| | | | | | | ||
Future net cash flows |
| 417,935 | | 1,288,501 | | ||
10% annual discount for estimated timing of cash flows |
| (229,951 | ) | (690,854 | ) | ||
| | | | | | | ||
Standardized measure of Discounted Future Net Cash Flows |
| $ | 187,984 | | $ | 597,647 | |
| | | | | | | ||
- (1)
- Future net cash flows do not include the effects of income taxes on future revenues because Vantage II was a limited liability company to subject to entity-level income taxation as of December 31, 2015 and 2014. Accordingly, no provision for federal or state corporate income taxes has been provided because taxable income was passed through to the Vantage II's member. If Vantage II had been subject to entity-
F-43
VANTAGE ENERGY II, LLC
Notes to Consolidated Financial Statements (Continued)
December 31, 2015 and 2014
(12) Supplemental Information on Gas Producing Activities (unaudited) (Continued)
level income taxation, the unaudited pro forma future income tax expense at December 31, 2015 and 2014 would have been $81.6 million and $243.2 million, respectively, net of the discount. The unaudited Standardized Measure at December 31, 2015 and 2014 would have been $106.3 million and $354.5 million, respectively.
(f) Changes in the Standardized Measure
A summary of the changes in the Standardized Measure are contained in the table below (in thousands):
|
| December 31, |
| ||||
| | | | | | | ||
|
| 2015 | | 2014 |
| ||
| | | | | | | ||
Beginning of the period |
| $ | 597,649 | | $ | 256,035 | |
Net changes in prices and production costs |
| (563,534 | ) | 39,500 | | ||
Net change in future development costs |
| 76,285 | | (26,080 | ) | ||
Sales, net of production costs |
| (58,282 | ) | (39,382 | ) | ||
Extensions |
| 20,397 | | 253,772 | | ||
Acquisitions |
| 1,232 | | 5,462 | | ||
Divestitures |
| (2,789 | ) | | |||
Revisions of previous quantity estimates |
| 16,618 | | 26,014 | | ||
Previously estimated development costs incurred |
| 67,943 | | 30,105 | | ||
Accretion of discount |
| 59,765 | | 25,604 | | ||
Changes in timing and other |
| (27,300 | ) | 26,619 | | ||
| | | | | | | ||
End of period |
| $ | 187,984 | | $ | 597,649 | |
| | | | | | | ||
(g) Impact of Pricing
The estimates of cash flows and reserve quantities shown about are based upon the upon the unweighted average first-day-of-the month prices. If future gas sales are covered by contracts at specified prices, the contract prices would be used. Fluctuations in prices are due to supply and demand and are beyond our control.
The following average index prices were used in determining the Standardized Measure of:
|
| For the year ended December 31, |
| ||||
| | | | | | | ||
|
| 2015 | | 2014 |
| ||
| | | | | | | ||
Natural Gas per Mcf |
| $ | 2.59 | | $ | 4.35 | |
These prices related to the unweighted average first-of-the-month prices for the preceding twelve month period. These prices were then adjusted for quality, transportation fees, regional price differentials, fractionation costs, processing fees and other costs. For the Marcellus Shale, the relevant benchmark price for natural gas is Henry Hub.
Companies that follow the full cost accounting method are required to make ceiling test calculations. This test ensures that total capitalized costs for oil and gas properties (net of accumulated DD&A and deferred income taxes) do not exceed the sum of the present value discounted at 10% of estimated future net cash flows from proved reserves, the cost of properties
F-44
VANTAGE ENERGY II, LLC
Notes to Consolidated Financial Statements (Continued)
December 31, 2015 and 2014
(12) Supplemental Information on Gas Producing Activities (unaudited) (Continued)
not being amortized, the lower of cost or estimated fair value of unproven properties that are being amortized. Application of these rules during periods of relatively low commodity prices, even if of short-term duration, may result in write-downs.
(13) Subsequent Events
The Company has evaluated subsequent events that occurred after December 31, 2015 through the audit report date, July 26, 2016. On February 9, 2016, the Company issued a Capital Contribution request in the aggregate amount of $10 million, due February 23, 2016. On March 30, 2016, the Company issued a Capital Contribution request in the aggregate amount of $10 million, due April 11, 2016. These amounts were funded by the Company's Capital Members.
In May 2016, the Company loaned Vantage II Alpha, an affiliate formed by the Company's Investors and Management Members, $10 million in connection with an acquisition. It is expected that Vantage II Alpha will merge with and into the Company by the end of the year.
On May 5, 2016, the Company issued a Capital Contribution request in the aggregate amount of $10 million. Institutional investors funded $10 million on May 6, 2016 and the remainder, which is less than $0.1 million, is due from the other Capital Members by May 19, 2016.
On May 10, 2016, the Company entered into the Eighth Amendment to Credit Agreement (Eighth Amendment), which included among other things, an equity cure right, applied retroactively to December 31, 2015, applicable to the Company's covenants under its credit agreement.
On June 1, 2016, the Company entered into the Ninth Amendment to the Credit Agreement (Ninth Amendment), which stated the borrowing base to be $186 million compared to $166 million as of March 31, 2016.
Any other material subsequent events that occurred during this time have been properly recognized or disclosed in these consolidated financial statements or the notes to the consolidated financial statements.
F-45
VANTAGE ENERGY II GROUP
Condensed Combined Balance Sheets
(In thousands)
|
| June 30, 2016 |
| December 31, 2015 |
| ||||||
| | | | | | | ||||||
|
| (unaudited) | | | |||||||
Assets |
| | | | | | | ||||
Current assets: |
| | | | | | | ||||
Cash and cash equivalents |
| | $ | 15,085 | | | | 2,439 | | | |
Accounts receivable |
| | 12,194 | | | | 10,397 | | | ||
Accounts receivable — related party |
| | — | | | | 1,100 | | | ||
Inventory |
| | 528 | | | | 242 | | | ||
Prepayments and deposits |
| | 95 | | | | 70 | | | ||
Commodity derivative assets |
| | 1,800 | | | | 30,737 | | | ||
| | | | | | | ||||||
Total current assets |
| | 29,702 | | | | 44,985 | | | ||
| | | | | | | ||||||
Property, plant, and equipment: |
| | | | | | | ||||
Oil and gas properties, full-cost method of accounting: |
| | | | | | | ||||
Proved |
| | 483,202 | | | | 420,197 | | | ||
Unproved |
| | 537,234 | | | | 187,509 | | | ||
| | | | | | | ||||||
Total oil and gas properties |
| | 1,020,436 | | | | 607,706 | | | ||
Accumulated depletion, depreciation, and amortization |
| | (332,941 | ) | | | (233,920 | ) | | ||
| | | | | | | ||||||
Net oil and gas properties |
| | 687,495 | | | | 373,786 | | | ||
Gathering system, less accumulated depreciation of $7,170 and $5,551 |
| | 59,764 | | | | 59,970 | | | ||
| | | | | | | ||||||
Net property, plant, and equipment |
| | 747,259 | | | | 433,756 | | | ||
Commodity derivative assets |
| | 841 | | | | 7,957 | | | ||
Other assets |
| | 1,341 | | | | 1,379 | | | ||
Water investment, less accumulated amortization of $96 and $11 |
| | 1,278 | | | | 662 | | | ||
| | | | | | | ||||||
Total assets |
| | $ | 780,421 | | | | 488,739 | | | |
| | | | | | | ||||||
| | | | | | | | | | | ||
| | | | | | | ||||||
Liabilities and Members' Equity |
| | | | | | | ||||
Current liabilities: |
| | | | | | | ||||
Accounts payable and accrued liabilities |
| | $ | 23,534 | | | | 39,016 | | | |
Account payable — related party |
| | 20,685 | | | | — | | | ||
Commodity derivative liabilities |
| | 4,808 | | | | — | | | ||
Current portion of Revolving credit facility, net of unamortized deferred financing costs (note 3) |
| | 146,239 | | | | — | | | ||
Current portion of Second Lien note payable, net of unamortized deferred financing costs (note 3) |
| | 98,754 | | | | — | | | ||
| | | | | | | ||||||
Total current liabilities |
| | 294,020 | | | | 39,016 | | | ||
Revolving credit facility, net of unamortized deferred financing costs (note 3) |
| | — | | | | 148,845 | | | ||
Second Lien note payable, net of unamortized deferred financing costs (note 3) |
| | — | | | | 98,196 | | | ||
Commodity derivative liabilities |
| | 7,358 | | | | — | | | ||
Asset retirement obligations |
| | 3,052 | | | | 2,091 | | | ||
| | | | | | | ||||||
Total liabilities |
| | 304,430 | | | | 288,148 | | | ||
| | | | | | | ||||||
Contingently redeemable Founders' units |
| | 1,125 | | | | 498 | | | ||
Commitments and contingencies (note 8) |
| | | | | | | ||||
Members' equity: |
| | | | | | | ||||
Member contributions, net of issuance costs |
| | 670,074 | | | | 299,662 | | | ||
Retained earnings (accumulated deficit) |
| | (195,208 | ) | | | (99,569 | ) | | ||
| | | | | | | ||||||
Total members' equity |
| | 474,866 | | | | 200,093 | | | ||
| | | | | | | ||||||
Total liabilities and members' equity |
| | $ | 780,421 | | | | 488,739 | | | |
| | | | | | | ||||||
| | | | | | | | | | | ||
| | | | | | | ||||||
The accompanying notes are an integral part of these unaudited condensed
combined financial statements.
F-46
VANTAGE ENERGY II GROUP
Condensed Combined Statements of Operations
(Unaudited)
(In thousands)
|
| Three months ended June 30, |
| Six months ended June 30, |
| ||||||||
| | | | | | | | | | | ||||
|
| 2016 | | 2015 | | 2016 | | 2015 |
| ||||
| | | | | | | | | | | ||||
Operating revenues: |
| | | | | ||||||||
Gas revenues |
| $ | 26,055 | | 14,152 | | $ | 46,829 | | 40,375 | | ||
Midstream revenues |
| 1,732 | | 1,142 | | 2,895 | | 2,524 | | ||||
Gain on commodity derivatives |
| (34,507 | ) | 6,725 | | (22,599 | ) | 14,921 | | ||||
| | | | | | | | | | | ||||
Total operating revenues |
| (6,720 | ) | 22,019 | | 27,125 | | 57,820 | | ||||
| | | | | | | | | | | ||||
Operating expenses: |
| | | | | ||||||||
Production and ad valorem tax expense |
| 574 | | 288 | | 1,025 | | 512 | | ||||
Marketing and gathering expense |
| 5,237 | | 2,758 | | 7,961 | | 6,063 | | ||||
Lease operating and workover expense |
| 1,242 | | 1,814 | | 1,590 | | 4,451 | | ||||
Midstream operating expense |
| 416 | | 416 | | 1,428 | | 831 | | ||||
General and administrative expense |
| 2,432 | | 2,260 | | 4,336 | | 5,487 | | ||||
Depreciation, depletion, amortization, and accretion expense |
| 10,150 | | 9,481 | | 19,490 | | 23,357 | | ||||
Impairment of oil and gas properties |
| 15,952 | | — | | 81,673 | | — | | ||||
| | | | | | | | | | | ||||
Total operating expenses |
| 36,003 | | 17,017 | | 117,503 | | 40,701 | | ||||
| | | | | | | | | | | ||||
Operating income (loss) |
| (42,723 | ) | 5,002 | | (90,378 | ) | 17,119 | | ||||
| | | | | | | | | | | ||||
Other expense: |
| | | | | ||||||||
Other income (expense) |
| 3 | | (180 | ) | 3 | | (180 | ) | ||||
Interest expense, net of capitalized interest |
| (2,844 | ) | (2,766 | ) | (5,264 | ) | (4,229 | ) | ||||
| | | | | | | | | | | ||||
Total other expense |
| (2,841 | ) | (2,946 | ) | (5,261 | ) | (4,409 | ) | ||||
| | | | | | | | | | | ||||
Net income (loss) |
| $ | (45,564 | ) | 2,056 | | $ | (95,639 | ) | 12,710 | | ||
| | | | | | | | | | | ||||
| | | | | | | | | | | ||||
| | | | | | | | | | | ||||
Pro forma information (in thousands except per share data) |
| | | | | ||||||||
Pro forma income tax (expense) benefit |
| | | | | ||||||||
Pro forma earnings (loss) |
| | | | | ||||||||
Pro forma earnings (loss) per common share — basic |
| | | | | ||||||||
Pro forma earnings (loss) per common share — diluted |
| | | | | ||||||||
Pro forma weighted average number of shares outstanding: |
| | | | | ||||||||
Basic |
| | | | | ||||||||
Diluted |
| | | | | ||||||||
The accompanying notes are an integral part of these unaudited condensed
combined financial statements.
F-47
VANTAGE ENERGY II GROUP
Condensed Combined Statements of Changes in Members' Equity
Six months ended June 30, 2016 and year ended December 31, 2015
(Unaudited)
(In thousands)
|
| Contingently | | Members' Equity |
| ||||||||||||||
| | | | | | | | | | | | | ||||||||
|
| Redeemable Founders' Units |
| Members' Contributions |
| Accumulated Earnings (Deficit) |
| Total |
| ||||||||||
| | | | | | | | | | | ||||||||||
Balance at December 31, 2014 |
| | $ | 498 | | | | 299,662 | | | | 26,393 | | | 326,055 | | |||
Net loss |
| | — | | | | — | | | | (125,962 | ) | | (125,962 | ) | ||||
| | | | | | | | | | | ||||||||||
Balance at December 31, 2015 |
| | 498 | | | | 299,662 | | | | (99,569 | ) | | 200,093 | | ||||
Members' contributions |
| | 627 | | | | 370,412 | | | | — | | | 370,412 | | ||||
Net loss |
| | — | | | | — | | | | (95,639 | ) | | (95,639 | ) | ||||
| | | | | | | | | | | ||||||||||
Balance at June 30, 2016 |
| | $ | 1,125 | | | | 670,074 | | | | (195,208 | ) | | 474,866 | | |||
| | | | | | | | | | | ||||||||||
| | | | | | | | | | | | | | | | | ||||
| | | | | | | | | | | ||||||||||
The accompanying notes are an integral part of these unaudited condensed
combined financial statements.
F-48
VANTAGE ENERGY II GROUP
Condensed Combined Statements of Cash Flows
(Unaudited)
(In thousands)
|
| Six months ended June 30, |
| ||||
| | | | | | | ||
|
| 2016 | | 2015 |
| ||
| | | | | | | ||
Cash flows from operating activities: |
| | | ||||
Net income (loss) |
| $ | (95,639 | ) | 12,710 | | |
Adjustments to reconcile net income (loss) to net cash provided by operating activities: |
| | | ||||
Depreciation, depletion, amortization, and accretion |
| 19,490 | | 23,357 | | ||
Accretion of original issue discount |
| 467 | | 424 | | ||
Impairment of proved oil and gas properties |
| 81,673 | | — | | ||
Gain on commodity derivatives |
| 22,599 | | (14,921 | ) | ||
Settlements on commodity derivatives |
| 25,620 | | 9,964 | | ||
Changes in operating assets and liabilities: |
| | | ||||
Accounts receivable |
| (1,797 | ) | 2,794 | | ||
Accounts receivable — related party |
| 21,785 | | 3,208 | | ||
Inventory |
| (286 | ) | 141 | | ||
Prepayments and deposits |
| (25 | ) | (27 | ) | ||
Accounts payable and accrued liabilities |
| (1,678 | ) | 2,142 | | ||
| | | | | | | ||
Net cash provided by operating activities |
| 72,209 | | 39,792 | | ||
| | | | | | | ||
Cash flows from investing activities: |
| | | ||||
Oil and gas property exploration, acquisition, and development |
| (82,723 | ) | (70,809 | ) | ||
Purchase of natural gas properties |
| (342,630 | ) | — | | ||
Gathering system additions |
| (2,041 | ) | (7,995 | ) | ||
Water investment additions |
| (386 | ) | — | | ||
Other assets |
| 40 | | — | | ||
| | | | | | | ||
Net cash used in investing activities |
| (427,740 | ) | (78,804 | ) | ||
| | | | | | | ||
Cash flows from financing activities: |
| | | ||||
Member contributions |
| 371,039 | | — | | ||
Borrowings under revolving credit facility |
| 38,000 | | 27,000 | | ||
Principal payments on revolving credit facility |
| (40,000 | ) | — | | ||
Deferred financing costs |
| (862 | ) | (447 | ) | ||
| | | | | | | ||
Net cash provided by financing activities |
| 368,177 | | 26,553 | | ||
| | | | | | | ||
Net change in cash and cash equivalents |
| 12,646 | | (12,459 | ) | ||
Cash and cash equivalents — beginning of period |
| 2,439 | | 21,185 | | ||
| | | | | | | ||
Cash and cash equivalents — end of period |
| $ | 15,085 | | 8,726 | | |
| | | | | | | ||
| | | | | | | ||
| | | | | | | ||
Supplemental disclosure of cash flow information: |
| | | ||||
Cash paid for interest |
| $ | 6,980 | | 6,361 | | |
Supplemental disclosure of selected non cash accounts: |
| | | ||||
Accrued capital additions |
| $ | 13,805 | | 10,105 | | |
Capitalized asset retirement obligations |
| 870 | | 135 | | ||
The accompanying notes are an integral part of these unaudited condensed
combined financial statements.
F-49
VANTAGE ENERGY II GROUP
Notes to Condensed Combined Financial Statements
June 30, 2016 and December 31, 2015
(Unaudited)
(1) Description of Business and Summary of Significant Accounting Policies
(a) Nature of Operations and Principles of Consolidation
Vantage Energy II, LLC (Vantage II) was organized as a limited liability company under the laws of the state of Delaware in 2012. Vantage II Alpha, LLC (Vantage II Alpha) was formed in May 2016 by the Investors and substantially all of the Management Members of Vantage II in connection with Vantage II's entry into a purchase and sale agreement with a wholly owned subsidiary of Alpha Natural Resources, Inc. for the purchase of certain natural gas properties located in Greene County, Pennsylvania. Vantage II Alpha was formed as a transitory entity solely to facilitate the funding of the acquisition of the properties in an expeditious manner. Given the high degree of common ownership among the two entities, the accompanying condensed combined financial statements include the accounts of Vantage Energy II and its two wholly owned subsidiaries and Vantage II Alpha (collectively, "the Company"). All intercompany balances have been eliminated in consolidation.
The Company is engaged in the exploration and exploitation of petroleum and natural gas, as well as natural gas acquisition, development, and gathering, with a focus in unconventional resources in the Appalachian Basin of the United States.
In June 2016, Vantage II Alpha closed on a purchase, funded with sponsor equity, of primarily unproved property which is reflected in these unaudited condensed combined financial statements based on the preliminary purchase price allocation. The assets purchased generally consist of approximately 27,400 net undeveloped acres, non-operating royalty mineral interests in 25 producing wells and certain related assets. Substantially all of the $340 million purchase price is expected to be allocated to unproved leasehold acreage acquired. Vantage II Alpha had no operations prior to this date.
The accompanying unaudited condensed combined financial statements of Vantage Energy II Group have been prepared by the Company's management in accordance with generally accepted accounting principles in the United States (GAAP) for interim financial information and applicable rules and regulations promulgated under the Securities Exchange Act of 1934, as amended (Exchange Act). Accordingly, these financial statements do not include all of the information required by GAAP or the Securities and Exchange Commission (SEC) rules and regulation for complete financial statements. Therefore, these condensed combined financial statements should be read in conjunction with the audited combined financial statements and notes therein for the year ended December 31, 2015. The unaudited condensed combined financial statements included herein contain all adjustments which are, in the opinion of management, necessary to present fairly the Company's financial position as of June 30, 2016 and its condensed combined statements of operations for the three and six months ended June 30, 2016 and 2015, and its condensed combined statement of cash flows for the six months ended June 30, 2016 and 2015. The condensed combined statements of operations for the three and six months ended June 30, 2016 and 2015 are not necessarily indicative of the results to be expected for future periods.
F-50
VANTAGE ENERGY II GROUP
Notes to Condensed Combined Financial Statements (Continued)
June 30, 2016 and December 31, 2015
(Unaudited)
(1) Description of Business and Summary of Significant Accounting Policies (Continued)
(b) Use of Estimates
The preparation of these condensed combined financial statements, in conformity with generally accepted accounting principles in the United States of America, requires management to make estimates and assumptions that affect the amounts reported in the condensed combined financial statements and accompanying notes. As a result, actual amounts could differ from estimated amounts. By their nature, these estimates are subject to measurement uncertainty, and the effect on the condensed combined financial statements of changes in such estimates in future periods could be significant. Significant estimates with regard to the Company's condensed combined financial statements include the estimate of proved oil and gas reserve volumes and the related present value of estimated future net cash flows, the recoverability of unproved oil and gas properties, the calculation of depletion of oil and gas reserves, the estimated cost and timing related to asset retirement obligations, and the estimated fair value of derivative assets and liabilities.
Reserve estimates are, by their nature, inherently imprecise. The process of estimating quantities of oil and gas reserves is complex, requiring significant decisions in the evaluation of all available geological, geophysical, engineering, and economic data. The data for a given field may also change substantially over time as a result of numerous factors including, but not limited to, additional development activity, evolving production history and continual reassessment of the viability of production under varying economic conditions. As a result, material revisions to existing reserve estimates may occur from time to time. Although every reasonable effort is made to ensure that the reserve estimates represent the most accurate assessments possible, subjective decisions, and available data for our various fields make these estimates generally less precise than other estimates included in financial statement disclosures.
(c) Oil and Gas Properties
The Company follows the full-cost method of accounting for natural gas and crude oil properties. Pursuant to full-cost accounting rules, the Company is required to perform a "ceiling test". If the net capitalized cost of the Company's oil and gas properties subject to amortization (the carrying value) exceeds the ceiling limitation, the excess would be charged to expense. The ceiling limitation is equal to the sum of the present value discounted at 10% of estimated future net cash flows from proved reserves, the cost of properties not being amortized, the lower of cost or estimated fair value of unproven properties included in the costs being amortized, and all related income tax effects. The present value of estimated future net revenue is computed by applying the average first day of the month oil and gas price for the preceding 12-month period to estimated future production of proved oil and gas reserves as of period-end, less estimated future expenditures to be incurred in developing and producing the proved reserves, assuming the continuation of existing economic conditions.
As of June 30, 2016, the carrying value of the Company's oil and gas properties subject to the test exceeded the calculated value of the ceiling limitation. As a result, the Company recorded an impairment of $16.0 million for the three months ended June 30, 2016. For the six months ended
F-51
VANTAGE ENERGY II GROUP
Notes to Condensed Combined Financial Statements (Continued)
June 30, 2016 and December 31, 2015
(Unaudited)
(1) Description of Business and Summary of Significant Accounting Policies (Continued)
June 30, 2016, the Company recorded an impairment of $81.7 million. The ceiling test calculation uses rolling 12-month average commodity prices, the effect of lower quarter-over-quarter commodity prices in future quarters could result in a potentially lower ceiling value in future periods. This could result in ongoing impairments each quarter until prices stabilize or improve.
(d) Adoption of New Accounting Principles
The FASB issued ASU 2015-03, Interest Imputation of Interest: Simplifying the Presentation of Debt Issuance Costs, in April 2015. The core principle of ASU 2015-03 will require all costs incurred to issue debt be presented in the balance sheet as a direct deduction from the carrying value of debt, consistent with debt discounts. The Company adopted this standard as of January 1, 2016, and has applied the standard retrospectively. As a result of adoption, the Company has classified debt issuance costs to its Revolving credit facility and Second Lien note payable from other assets to debt on its condensed combined balance sheet. The retrospective adjustment to the December 31, 2015 condensed combined balance sheet is as follows:
|
| Reported December 31, 2015 |
| Adjustment Effect |
| As adjusted December 31, 2015 |
| |||||||||
| | | | | | | | | |||||||||
|
| (In thousands) | | |||||||||||||
Other assets |
| | $ | 1,877 | | | | (498 | ) | | | 1,379 | | | ||
Revolving credit facility |
| | 149,000 | | | | (155 | ) | | | 148,845 | | | |||
Second Lien note payable |
| | 98,539 | | | | (343 | ) | | | 98,196 | | | |||
(2) Balance Sheet Disclosures
Accounts receivable consist of the following:
|
| June 30, 2016 |
| December 31, 2015 |
| ||||||
| | | | | | | ||||||
|
| (In thousands) | | ||||||||
Joint interest billings |
| | $ | 142 | | | | 141 | | | |
Revenue |
| | 12,052 | | | | 10,256 | | | ||
| | | | | | | ||||||
|
| | $ | 12,194 | | | | 10,397 | | | |
| | | | | | | ||||||
| | | | | | | | | | | ||
| | | | | | | ||||||
F-52
VANTAGE ENERGY II GROUP
Notes to Condensed Combined Financial Statements (Continued)
June 30, 2016 and December 31, 2015
(Unaudited)
(2) Balance Sheet Disclosures (Continued)
Accounts payable and accrued liabilities consist of the following:
|
| June 30, 2016 | | December 31, 2015 |
| ||||||
| | | | | | | ||||||
|
| (In thousands) | | ||||||||
Accrued capital expenditures |
| | $ | 6,560 | | | | 20,366 | | | |
Accrued marketing, gathering, and transportation costs |
| | 5,540 | | | | 4,077 | | | ||
Cash calls payable |
| | 161 | | | | 232 | | | ||
Accrued impact fees payable |
| | 827 | | | | 1,911 | | | ||
Accrued interest payable |
| | 1,380 | | | | 1,380 | | | ||
Accounts payable |
| | 1,333 | | | | 5,643 | | | ||
Accrued production expense payable |
| | 1,251 | | | | 1,124 | | | ||
Accrued general and administrative expenses |
| | 1,687 | | | | 1,535 | | | ||
Accrued revenue payable |
| | 4,795 | | | | 2,748 | | | ||
| | | | | | | ||||||
|
| | $ | 23,534 | | | | 39,016 | | | |
| | | | | | | ||||||
| | | | | | | | | | | ||
| | | | | | | ||||||
(3) Long-Term Debt
(a) Revolving Credit Facility
Effective November 29, 2012, the Company secured a credit facility (the Revolving Credit Facility) with a group of bank lenders. Wells Fargo Bank, N.A. acts as administrative agent. Effective December 4, 2014 the Company amended and restated its Revolving Credit Facility to add a lien on the Vantage Midstream (as defined in note 7) gas gathering system and add a midstream borrowing base. The maturity date of the Revolving Credit Facility is January 1, 2017. The Revolving Credit Facility has a maximum commitment of $500 million and as of June 30, 2016 and December 31, 2015, had a borrowing base of $186 million and $166 million, respectively. As of June 30, 2016 and December 31, 2015, the Company had outstanding borrowings of $147 million and $149 million, respectively. On each borrowing, the Company has the election to pay interest at a Base rate or LIBOR. The margin on Base rate loans ranges from 0.75% to 1.75%. The margin on LIBOR loans ranges from 1.75% to 2.75%. The Company pays quarterly, a commitment fee ranging from 0.375% to 0.50% of the unused borrowing base. The Company elected to pay interest based on LIBOR, plus the applicable margin, which was 3.71% in total as of June 30, 2016.
As of June 30, 2016, the Revolving Credit Facility was collateralized by all of the Company's assets, including its 50% undivided operated interest in the Vantage Midstream assets.
The Revolving Credit Facility contains certain financial covenants, including maintenance of a minimum current ratio and a maximum leverage ratio. As of June 30, 2016, the Company was in compliance with all financial covenants.
F-53
VANTAGE ENERGY II GROUP
Notes to Condensed Combined Financial Statements (Continued)
June 30, 2016 and December 31, 2015
(Unaudited)
(3) Long-Term Debt (Continued)
(b) Second Lien Term Loan
In May 2014, the Company entered into a second lien note payable (Second Lien note payable) with a face amount of $100 million, maturing on May 8, 2017. The Company has the election to pay interest at a Base rate or Eurodollar LIBOR. The margin on Base rate loans is 6.50%. The margin on LIBOR loans is 7.50%. As of June 30, 2016, the stated interest rate was 3.625%, and $100 million remained outstanding. The Second Lien note payable contains an optional prepayment provision that enables the Company to prepay the Second Lien note payable at par. The Second Lien note payable was issued with an original issue discount of $2.75 million, which has been classified as a reduction to the note balance. The discount is amortized over the term of the note using the effective interest method.
As of June 30, 2016 and December 31, 2015, the Second Lien note payable was collateralized by a second lien interest in all of the Company's assets, including its 50% operated interest in the Vantage Midstream assets, and contains certain financial covenants. These covenants include maintenance of a maximum leverage ratio. As of June 30, 2016, the Company was in compliance with all financial covenants.
During the three months ended June 30, 2016 and 2015, the Company recognized gross interest expense of approximately $3.8 million and $3.3 million, respectively. The Company recognized gross interest expense of approximately $7.4 million and $6.3 million during the six months ended June 30, 2016 and 2015, respectively.
Long-term debt as of June 30, 2016 (in thousands):
|
| As of June 30, 2016 |
| ||||||
| | | | | | | ||||
|
| Revolving Credit Facility |
| Second Lien |
| ||||
| | | | | | | ||||
Principal |
| | $ | 147,000 | | | 100,000 | | |
Net unamortized premium |
| | — | | | (994 | ) | ||
Net unamortized debt issuance costs |
| | (761 | ) | | (252 | ) | ||
| | | | | | | ||||
Total Debt |
| | 146,239 | | | 98,754 | | ||
Less: Current portion of long term debt |
| | 146,239 | | | 98,754 | | ||
| | | | | | | ||||
Total Long-Term Debt |
| | $ | — | | | — | | |
| | | | | | | ||||
| | | | | | | | | ||
| | | | | | | ||||
Maturities of long-term debt as of June 30, 2016 (including current maturities, excluding unamortized debt discounts) are as follows (in thousands):
|
| Revolving Credit Facility |
| Second Lien |
| ||||
| | | | | | | ||||
Year ending December 31, 2017 |
| | $ | 147,000 | | | 100,000 | | |
| | | | | | | ||||
Total future maturities of long-term debt |
| | $ | 147,000 | | | 100,000 | | |
| | | | | | | ||||
| | | | | | | | | ||
| | | | | | | ||||
F-54
VANTAGE ENERGY II GROUP
Notes to Condensed Combined Financial Statements (Continued)
June 30, 2016 and December 31, 2015
(Unaudited)
(4) Fair Value Measurements
Authoritative guidance defines fair value as the price that would be received to sell an asset or paid to transfer a liability (an exit price) in an orderly transaction between market participants at the measurement date. The guidance establishes a hierarchy for inputs used in measuring fair value that maximizes the use of observable inputs and minimizes the use of unobservable inputs by requiring that the most observable inputs be used when available. Observable inputs are inputs that market participants would use in pricing the asset or liability based on market data obtained from sources independent of the Company. Unobservable inputs are inputs that reflect the Company's assumptions of what market participants would use in pricing the asset or liability based on the best information available in the circumstances. The hierarchy is broken down into three levels based on the reliability of the inputs as follows:
| Level 1: | | Quoted prices are available in active markets for identical assets or liabilities. |
Level 2: |
|
Quoted prices in active markets for similar assets and liabilities that are observable for the asset or liability. |
Level 3: |
|
Unobservable pricing inputs that are generally less observable from objective sources, such as discounted cash flow models or valuations. |
The assets and liabilities are classified based on the lowest level of input that is significant to the fair value measurement. The Company's policy is to recognize transfers in and/or out of the fair value hierarchy as of the end of the reporting period in which the event or change in circumstances caused the transfer. The Company has consistently applied the valuation techniques discussed below in all periods presented. The following table presents the Company's financial assets and liabilities that were accounted for at fair value on a recurring basis as of June 30, 2016 and December 31, 2015 by level within the fair value hierarchy (in thousands):
|
| June 30, 2016 |
| ||||||||||||||||
| | | | | | | | | | | ||||||||||
|
| Fair value measurements |
| ||||||||||||||||
| | | | | | | | | | | ||||||||||
Description |
| Level 1 |
| Level 2 |
| Level 3 |
| Total |
| ||||||||||
Assets: |
| | | | | | | | | | | ||||||||
Commodity derivative instruments |
| | $ | — | | | | 2,641 | | | | — | | | 2,641 | | |||
Liabilities: |
| | | | | | | | | | | ||||||||
Commodity derivative instruments |
| | $ | — | | | | 12,166 | | | | — | | | 12,166 | | |||
|
| December 31, 2015 |
| ||||||||||||||||
| | | | | | | | | | | ||||||||||
|
| Fair value measurements |
| ||||||||||||||||
| | | | | | | | | | | ||||||||||
Description |
| Level 1 |
| Level 2 |
| Level 3 |
| Total |
| ||||||||||
Assets: |
| | | | | | | | | | | ||||||||
Commodity derivative instruments |
| | $ | — | | | | 38,694 | | | | — | | | 38,694 | | |||
The Company's commodity derivative instruments consist of variable-to-fixed price swaps. The fair values of the swap agreements are determined under the income valuation technique using a
F-55
VANTAGE ENERGY II GROUP
Notes to Condensed Combined Financial Statements (Continued)
June 30, 2016 and December 31, 2015
(Unaudited)
(4) Fair Value Measurements (Continued)
discounted cash flow model. The valuation model requires a variety of inputs, including contractual terms, published forward prices, and discount rates, as appropriate. The Company's estimates of fair value of commodity derivative instruments include consideration of the counterparty's creditworthiness, the Company's creditworthiness, and the time value of money. The consideration of these factors results in an estimated exit price for each derivative asset or liability under a marketplace participant's view. All of the significant inputs are observable, either directly or indirectly; therefore, the Company's derivative instruments are included within the Level 2 fair value hierarchy. The counterparties on the Company's derivative instruments are the same financial institutions that hold the Revolving Credit Facility (note 3). Accordingly, the Company is not required to post collateral on these derivatives since the bank is secured by the Company's oil and gas assets.
(a) Non-Recurring Fair Value Measurements
The Company uses the income valuation technique to estimate the fair value of asset retirement obligations using estimated gross well costs of reclamation ranging in amounts from $50,000 to $185,000, timing of expected future dismantlement costs ranging from 20 to 30 years, and a weighted average credit-adjusted risk-free rate. Accordingly, the fair value is based on unobservable pricing inputs and, therefore, is included within the Level 3 fair value hierarchy. During the six months ended June 30, 2016 and year ended December 31, 2015, the Company recorded liabilities for asset retirement obligations of $0.7 million and $0.3 million, respectively. See note 5 for additional information.
(b) Other Financial Instruments
Other financial instruments not measured at fair value on a recurring basis include cash and cash equivalents, accounts receivable, accounts payable, and accrued liabilities. The financial statement carrying amounts of these items approximate their fair values due to their short-term nature.
(5) Asset Retirement Obligations
The following table presents the reconciliation of the Company's asset retirement obligation of oil and gas properties and the gas gathering system.
|
| June 30, 2016 |
| |||
| | | | | |||
|
| (In thousands) | | |||
Beginning of period |
| | $ | 2,091 | | |
Liabilities incurred |
| | 732 | | | |
Accretion expense |
| | 91 | | | |
Revisions to estimate |
| | 138 | | | |
| | | | | |||
End of period |
| | $ | 3,052 | | |
| | | | | |||
| | | | | | | |
| | | | | |||
F-56
VANTAGE ENERGY II GROUP
Notes to Condensed Combined Financial Statements (Continued)
June 30, 2016 and December 31, 2015
(Unaudited)
(6) Commodity Derivative Instruments
The Company is exposed to certain risks relating to its ongoing business operations, including risks related to commodity prices. The Company is focused on maintaining an active hedging program using commodity derivative financial instruments to achieve a more predictable cash flow by reducing its exposure to commodity price fluctuations and regional basis differential exposure in an effort to protect its capital investment program, as well as expected future cash flows. The Company's risk management activity is generally accomplished through over-the-counter commodity derivative contracts with large financial institutions. The Company currently uses fixed price natural gas swaps for which it receives a fixed swap price for future production in exchange for a payment of the variable market price received at the time future production is sold.
While the use of these instruments limits the downside risk of adverse price changes, their use may also limit future revenue from favorable price changes. The Company has adopted fair value accounting for its derivatives; therefore, changes in the fair value of derivative financial instruments are recognized in earnings. Cash payments or receipts on such contracts are included in cash flows from operating activities in the condensed combined statements of cash flows.
At June 30, 2016, the terms of outstanding commodity derivative contracts were as follows:
Commodity |
| Quantity remaining |
| Prices | | Price index | | Contract period |
| Estimated fair value |
| |||||
|
| | | | | (In thousands) | | |||||||||
Natural gas swaps (MMBtu): |
| | | | | | | | ||||||||
Dominion South Point |
| 110,425,000 | | $1.40 - 2.86 | | Dominion South Point | | 7/16 - 12/19 | | | $ | 9,525 | | | ||
| | | | | | | | | | | | | |||||
Total (MMBtu) |
| 110,425,000 | | | | | | $ | 9,525 | | | |||||
| | | | | | | | | | | | | |||||
| | | | | | | | | | | | | | | |||
| | | | | | | | | | | | | |||||
The Company estimates that 2016 hedged volumes, in aggregate, represent approximately 88% of the Company's estimated proved gas production for the remainder of 2016, based upon the year-end external reserve report.
Depending on changes in oil and natural gas futures markets and management's view of underlying supply and demand trends, the Company may increase or decrease its hedging positions.
The Company classifies the fair value amounts of derivative assets and liabilities as net current or noncurrent derivative assets or net current or noncurrent derivative liabilities, whichever the case may be, by commodity and by counterparty. As of June 30, 2016, the Company's commodity derivative instruments were subject to an enforceable master netting arrangement that provides for offsetting of amounts payable or receivable between the Company and the counterparty. The agreement also provides that in the event of an early termination, the counterparty has the right to offset amounts owed or owing under that and any other agreement with the same counterparty. The Company's accounting policy is to offset these positions in the accompanying combined balance sheets.
F-57
VANTAGE ENERGY II GROUP
Notes to Condensed Combined Financial Statements (Continued)
June 30, 2016 and December 31, 2015
(Unaudited)
(6) Commodity Derivative Instruments (Continued)
The following tables provide a reconciliation between the net assets and liabilities reflected in the accompanying combined balance sheets and the potential effects of master netting arrangements on the gross fair value of the commodity derivative contracts:
|
| | June 30, 2016 |
| ||||||||||||||
| | | | | | | | | | | |||||||||
|
| Consolidated balance sheet classification |
| Gross recognized assets/ liabilities |
| Gross amounts offset |
| Net recognized fair value assets/ liabilities |
| |||||||||
| | | | | | | | | | | |||||||||
|
| | (In thousands) | | ||||||||||||||
Commodity derivative assets: |
| | | | | | | | | | | |||||||
Commodity contracts |
| Current assets | | | $ | 6,712 | | | | (4,912 | ) | | | 1,800 | | | ||
Commodity contracts |
| Noncurrent assets | | | 4,168 | | | | (3,327 | ) | | | 841 | | | |||
| | | | | | | | | | | |||||||||
Total commodity derivative assets |
| | | $ | 10,880 | | | | (8,239 | ) | | | 2,641 | | | |||
| | | | | | | | | | | |||||||||
| | | | | | | | | | | | | | | | | |||
| | | | | | | | | | | |||||||||
Commodity derivative liabilities: |
| | | | | | | | | | | |||||||
Commodity contracts |
| Current liabilities | | | $ | 9,720 | | | | (4,912 | ) | | | 4,808 | | | ||
Commodity contracts |
| Noncurrent liabilities | | | 10,685 | | | | (3,327 | ) | | | 7,358 | | | |||
| | | | | | | | | | | |||||||||
Total commodity derivative liabilities |
| | | $ | 20,405 | | | | (8,239 | ) | | | 12,166 | | | |||
| | | | | | | | | | | |||||||||
| | | | | | | | | | | | | | | | | |||
| | | | | | | | | | | |||||||||
|
| | December 31, 2015 |
| ||||||||||||||
| | | | | | | | | | | |||||||||
|
| Consolidated balance sheet classification |
| Gross recognized assets/ liabilities |
| Gross amounts offset |
| Net recognized fair value assets/ liabilities |
| |||||||||
| | | | | | | | | | | |||||||||
|
| | (In thousands) | | ||||||||||||||
Commodity derivative assets: |
| | | | | | | | | | | |||||||
Commodity contracts |
| Current assets | | | $ | 30,868 | | | | (131 | ) | | | 30,737 | | | ||
Commodity contracts |
| Noncurrent assets | | | 7,998 | | | | (41 | ) | | | 7,957 | | | |||
| | | | | | | | | | | |||||||||
Total commodity derivative assets |
| | | $ | 38,866 | | | | (172 | ) | | | 38,694 | | | |||
| | | | | | | | | | | |||||||||
| | | | | | | | | | | | | | | | | |||
| | | | | | | | | | | |||||||||
Commodity derivative liabilities: |
| | | | | | | | | | | |||||||
Commodity contracts |
| Current liabilities | | | $ | 131 | | | | (131 | ) | | | — | | | ||
Commodity contracts |
| Noncurrent liabilities | | | 41 | | | | (41 | ) | | | — | | | |||
| | | | | | | | | | | |||||||||
Total commodity derivative liabilities |
| | | $ | 172 | | | | (172 | ) | | | — | | | |||
| | | | | | | | | | | |||||||||
| | | | | | | | | | | | | | | | | |||
| | | | | | | | | | | |||||||||
F-58
VANTAGE ENERGY II GROUP
Notes to Condensed Combined Financial Statements (Continued)
June 30, 2016 and December 31, 2015
(Unaudited)
(6) Commodity Derivative Instruments (Continued)
The table below summarizes the realized and unrealized gains related to the Company's commodity derivative instruments. These realized and unrealized gains are recorded in the accompanying combined statement of operations.
|
| Location of gain (loss) recognized in |
| Three months ended June 30, |
| ||||
| | | | | | | | | ||
|
| earnings | | 2016 | | 2015 |
| ||
| | | | | | | | | ||
|
| | (In thousands) | | |||||
Commodity derivative instruments: |
| | | | |||||
Realized gains on derivatives |
| Operating revenue | | $ | 10,174 | | 6,616 | | |
Unrealized (loss) gain on commodity derivatives, net |
| Operating revenue | | (44,681 | ) | 109 | | ||
| | | | | | | | | ||
Total realized and unrealized gains (losses), net |
| | $ | (34,507 | ) | 6,725 | | ||
| | | | | | | | | ||
| | | | | | | | | ||
| | | | | | | | | ||
|
| Location of gain (loss) recognized in |
| Six months ended June 30, |
| ||||
| | | | | | | | | ||
|
| earnings | | 2016 | | 2015 |
| ||
| | | | | | | | | ||
|
| | (In thousands) | | |||||
Commodity derivative instruments: |
| | | | |||||
Realized gains on derivatives |
| Operating revenue | | $ | 25,620 | | 9,964 | | |
Unrealized (loss) gain on commodity derivatives, net |
| Operating revenue | | (48,219 | ) | 4,957 | | ||
| | | | | | | | | ||
Total realized and unrealized gains (losses), net |
| | $ | (22,599 | ) | 14,921 | | ||
| | | | | | | | | ||
| | | | | | | | | ||
| | | | | | | | | ||
Due to the volatility of oil and natural gas prices, the estimated fair values of the Company's commodity derivative instruments are subject to large fluctuations from period to period.
(7) Related Party Transactions
(a) Gas Gathering System Operating Agreement
In connection with the Joint Development Agreement with Vantage I, the Company, through its wholly owned subsidiary, Vista Gathering, LLC (hereinafter referred to as "Vantage Midstream"), became the operator of the gas gathering assets. Pursuant to a Gathering System Operating Agreement, dated August 2, 2012, between the Company and Vantage I, the Company and Vantage I are to pay their respective 50% shares of the gas gathering system operating and development costs, as well as their incurred gas gathering and compression fees. For the three months ended June 30, 2016 and 2015, the Company was charged gas gathering and compression fees by Vantage Midstream for the wells that it operates of approximately $8.1 million and $6.1 million, respectively. The Company was charged gas gathering and compression fees by Vantage Midstream of $17.6 million and $12.5 million for the six months ended June 30, 2016 and 2015, respectively.
F-59
VANTAGE ENERGY II GROUP
Notes to Condensed Combined Financial Statements (Continued)
June 30, 2016 and December 31, 2015
(Unaudited)
(7) Related Party Transactions (Continued)
(b) Water Investment
Pursuant to the Water Services and Supply Agreement, Vantage Midstream provides water services required in the Company's drilling operations. For the three months and six months ended June 30, 2016, the Company paid water supply and transportation fees to Vantage Midstream of $2.7 million and $7.8 million, respectively.
(c) Management Services Agreement
In August 2012, the Company and Vantage I entered into a Management Services Agreement (MSA) whereby Vantage I is to provide certain executive management, administrative, accounting, finance, engineering, land, and information technology assistance to the Company. In exchange for providing these services, the Company will pay Vantage I a fee (the MSA Fee). The MSA Fee is based upon the gross general and administrative expenses incurred by Vantage I multiplied by a ratio of the relative capital expenditures and oil and natural gas production volumes of the Company and Vantage I. Certain adjustments are made to this calculation to reflect the allocation of general and administrative expenses to Vantage Midstream. For the three months ended June 30, 2016 and 2015, the Company recorded gross general and administrative expenses incurred under the MSA of approximately $2.9 million and $2.9 million, respectively. The Company recorded gross general and administrative expenses incurred under the MSA of approximately $6.2 million and $7.4 million for the six months ended June 30, 2016 and 2015, respectively.
(d) MIU Notes Receivable
In December 2014, the Company made loans to certain employees in the form of notes receivable. Interest accrues on the notes at 0.34% per annum, and the notes mature upon the earlier to occur of: 1) December 1, 2017; 2) consummation of Monetization Event (as defined); or 3) fifteen days after the date of voluntary termination of employment by the employee or termination by the Company for cause. As of June 30, 2016, the notes had a balance of $1.3 million and are classified in other assets in the accompanying combined balance sheets. The notes are collateralized by a first lien interest in the employees' interest in each employees' Management Incentive Units (MIUs) and all potential dividends and distributions and a second lien on all other personal assets. Interest income was deemed de minimus for the three and six months ended June 30, 2016.
(8) Commitments and Contingencies
The Company leases various compressors in Pennsylvania under noncancelable operating leases that expire at various dates through 2017. The following summarizes future minimum lease payments under operating leases at June 30, 2016 (in thousands):
Year ending December 31, |
| | ||
2016 |
| $ | 332 | |
2017 |
| 405 | | |
| | | | | |
Total future minimum lease payments |
| $ | 737 | |
| | | | | |
| | | | | |
| | | | | |
F-60
VANTAGE ENERGY II GROUP
Notes to Condensed Combined Financial Statements (Continued)
June 30, 2016 and December 31, 2015
(Unaudited)
(8) Commitments and Contingencies (Continued)
On April 17, 2014, the Company entered into a 20,000 Mmbtu/d firm marketing agreement to market gas production associated with volumes produced in the Marcellus Shale. The agreement began in October 2014 and continues through October 2020. Under the contract, the Company is paid based on TETCO M-2 pricing with the ability to share in downstream price upside when market conditions allow.
On May 9, 2014, the Company entered into a 37,500 Mmbtu/d firm marketing agreement to market gas production associated with volumes produced in the Marcellus Shale. The agreement began in November 2014 and continues through October 2019. Under the contract, the Company is paid based on TETCO M-2 pricing.
As of June 30, 2016, the Company has a drilling rig contract in Pennsylvania totaling approximately $0.7 million, which ends August 2016.
From time to time, the Company is party to litigation. The Company maintains insurance to cover certain actions and believes that resolution of such litigation will not have a material adverse effect on the Company.
(9) Capital Structure
Summarized below are the classes of interests that have been authorized:
- a)
- Class I
Interest Units (Class I Units)
- b)
- Class M Management Incentive Units (Class M Units).
Effective June 1, 2016, the Members approved the Second Amended and Restated Limited Liability Company Agreement (the Agreement).
(a) Class I Units
Class I Units are issued to Members from time to time in exchange for a Member's capital commitment to make cash contributions when called by the Company pursuant to the terms as described in the Agreement.
The Company is authorized to issue as many Class I Units as its board of managers approves. Total capital commitments and contributions associated with outstanding Class I Units are as follows:
|
| June 30, 2016 |
| December 31, 2015 |
| ||||
| | | | | | | ||||
|
| | | ||||||
| |
| (In thousands) |
| ||||||
|---|---|---|---|---|---|---|---|---|---|
Institutional investors (commitment — $400,000) |
| $ | 328,720 | | | 298,804 | | | |
Founders (commitment — $667) |
| 548 | | | 498 | | | ||
Other employees/friends and family (commitment — $1,225) |
| 1,044 | | | 967 | | | ||
| | | | | | | ||||
Total (total commitment — $401,892) |
| $ | 330,312 | | | 300,269 | | | |
| | | | | | | ||||
| | | | | | | | | ||
| | | | | | | ||||
F-61
VANTAGE ENERGY II GROUP
Notes to Condensed Combined Financial Statements (Continued)
June 30, 2016 and December 31, 2015
(Unaudited)
(9) Capital Structure (Continued)
As of June 30, 2016 and December 31, 2015, the Company had undrawn commitments of $71.6 million and $101.6 million, respectively. Included in the member contributions on the combined balance sheets are equity issuance costs of approximately $0.1 million as of June 30, 2016 and December 31, 2015.
In June 2018, all capital commitments associated with the Class I Units will be reduced to contributions made at that time. In addition, the capital commitments of the Founders and selected other employees are subject to an additional increase of up to $7.0 million in the aggregate depending upon distributions received from Vantage I.
Decisions of the Company are approved by the majority of the Company's board of managers. As of June 30, 2016, the Company's board of managers comprised eight managers, including six appointed by the Institutional Investors, and the two Founders. One of the managers appointed by each Institutional Investor shall be subject to approval by the Founders.
Distributions of funds associated with the Class I Units follow a prescribed framework, which is outlined in detail in the Agreement. In general, distributions are first made to those Members who have made capital contributions in accordance with sharing ratios until such Members receive distributions to meet an internal rate of return threshold of 8%. Subsequent distributions are then allocated between the Class I and Class M Units in accordance with the provisions of the Agreement.
The Class I Units are illiquid, subject to substantial transfer restrictions, and have certain drag-along and tag-along rights as provided for in the Agreement.
The Company has the right, but not the obligation, to repurchase all of the Class I Units of management members if employment is terminated for any reason. If employment is terminated without cause, the repurchase price of the Class I Units is based on the fair market value of the units, as defined in the Agreement. If employment is terminated for cause, the repurchase price is equal to the lesser of i) the aggregate unreturned capital contributions and ii) the fair market value. However, the Company option to acquire does not apply to the Founders if employment is terminated due to death or disability.
Upon termination of employment without cause or due to death or disability, the Founders/heirs may put their Class I Units of the Company at fair market value. Upon the occurrence of death of disability, the exercise of this put right is at the discretion of the Founders/heirs, which is an event outside of the Company's control. Under the standard codified within ASC 480, "Accounting for Certain Financial Instruments with Characteristics of Both Liabilities and Equity" and Emerging Issues Tax Force ("EITF") Topic D-98, stock subject to redemption requirements outside the control of the Company are required to be classified outside of permanent equity. Accordingly, the Founders' equity is classified outside of members' equity. The occurrence of these events is not deemed probably, and therefore, the Founders equity has been measured at historic cost. The put option cannot be exercised if a Founder voluntarily terminates employment or is terminated for cause.
F-62
VANTAGE ENERGY II GROUP
Notes to Condensed Combined Financial Statements (Continued)
June 30, 2016 and December 31, 2015
(Unaudited)
(9) Capital Structure (Continued)
(b) Class M Management Incentive Units
The Company has issued management incentive units to certain employees. The management incentive units participate only in distributions in liquidation events, meeting requisite financial thresholds after Capital Interests have recovered their investment, and special allocation amounts. Management incentive units have no voting rights. Compensation expense for these awards will be recognized when all performance, market, and service conditions are probable of being satisfied (in general, upon a liquidating event). Accordingly, no value was assigned to the interests when issued.
The Management Incentive Plan, as described in the Agreement, authorizes up to 2,000,000 nonvoting Class M Units. Class M Units may be granted with an assigned participation level.
Class M Units issued to the Founders may not exceed 900,000 and vest 15% on each of the first, second, and third annual grant-date anniversaries and 100% upon consummation of a monetization event. However, if a Founder's employment is terminated without cause or due to death or disability, the Class M Units held will be at least 50% vested.
The Class M Units issued to all others vest in accordance with individual grant letters, but generally require a service period of between three and five years before vesting in 45% of the Class M Units, with the remaining Class M Units vesting upon a monetization event if employed by the Company for more than one year. All vested Class M Units shall be forfeited for no consideration if employment is terminated for cause. All unvested Class M Units, whether to Founders or management members, shall be forfeited upon termination of employment for any reason.
The Company has the right, but not the obligation, to repurchase all of the vested Class M Units of management members if employment is terminated for any reason. If employment is terminated without cause, the repurchase price of the Class M Units is based on the fair market value of the units, as defined in the Agreement. However, the Company's option to acquire the Class M Units does not apply to the Founders if employment is terminated due to death or disability.
Upon termination of employment upon death or disability, the Founders/heirs may put their Class M Units to the Company at fair market value. The put option cannot be exercised if a Founder voluntarily terminates employment or is terminated for cause.
F-63
VANTAGE ENERGY II GROUP
Notes to Condensed Combined Financial Statements (Continued)
June 30, 2016 and December 31, 2015
(Unaudited)
(9) Capital Structure (Continued)
The following table presents the activity for Class M Units outstanding:
|
| Units |
| |
| | | | | |
Outstanding — December 31, 2014 |
| 1,746,150 | | |
Granted |
| 52,550 | | |
Forfeited |
| (167,100 | ) | |
| | | | | |
Outstanding — December 31, 2015 |
| 1,631,600 | | |
Granted |
| 30,000 | | |
Forfeited |
| (13,350 | ) | |
| | | | | |
Outstanding — June 30, 2016 |
| 1,648,250 | | |
| | | | | |
| | | | | |
| | | | | |
As of June 30, 2016 and December 31, 2015, 664,650 and 649,650, respectively, Class M Units were vested. For financial reporting purposes, no related compensation expense has been recorded as of June 30, 2016 and December 31, 2015, as the grant-date fair value of the Class M Units was deemed immaterial.
(c) Vantage II Alpha
Class I Units are issued to Vantage II Alpha Members from time to time in exchange for a Member's capital commitment to make cash contributions when called by the Vantage II Alpha pursuant to the terms as described in the Vantage II Alpha's LLC agreement ("the Vantage II Alpha Agreement").
Vantage II Alpha is authorized to issue as many Class I Units as its board of managers approves. Total capital commitments and contributions associated with outstanding Class I Units as follows:
|
| June 30, 2016 |
| December 31, 2015 |
| ||||
| | | | | | | ||||
|
| | | ||||||
| |
| (In thousands) |
| ||||||
|---|---|---|---|---|---|---|---|---|---|
Institutional investors (commitment — $375,000) |
| $ | 340,423 | | | — | | | |
Founders (commitment — $636) |
| 577 | | | — | | | ||
| | | | | | | ||||
Total (total commitment — $375,636) |
| $ | 341,000 | | | — | | | |
| | | | | | | ||||
| | | | | | | | | ||
| | | | | | | ||||
As of June 30, 2016, Vantage II Alpha had undrawn commitments of $34.6 million.
Vantage II Alpha is authorized to issue up to 2,000,000 nonvoting Class M Units under the terms and conditions of the Management Incentive Plan as defined in the Vantage II Alpha Agreement. Although no Class M Units have been issued, the Vantage II Alpha Agreement provides that if such units have not been authorized for issuance within 90 days of the effective date of the Vantage II Alpha Agreement, then current holders of the Company's Class m Unit's will be issued a like number of Vantage II Alpha Class M units.
F-64
VANTAGE ENERGY II GROUP
Notes to Condensed Combined Financial Statements (Continued)
June 30, 2016 and December 31, 2015
(Unaudited)
(10) Liquidity
The Revolving Credit Facility matures on January 1, 2017. The Company expects to repay and retire the Revolving Credit Facility in connection with the net proceeds from the completion of the public offering and cash on hand. The Company intends the Second Lien note payable to remain outstanding following the completion of the public offering. Additionally, the Company plans to obtain new financing following the anticipated corporate reorganization, contemporaneous with the offering.
In the event that some deficiency exists between the proceeds of the offering or the terms of the new facility and the Company's current facility, as of June 30, 2016, the Company has available undrawn capacity under its existing borrowing base of $39 million and available undrawn capacity under its equity commitments of $106.2 million to address such a deficiency. In addition, the Company expects that it will be able to secure incremental equity commitments or other sources of capital, including debt, if necessary, from its current equity investors, other investors, or lenders to address any shortfall. The Company's current equity investors continue to be supportive of the Company's long-term growth and financing strategy.
While we anticipate engaging in active dialogue with our creditors and the potential public offering, at this time we are unable to predict the outcome of such or whether any such efforts to raise additional equity will be successful.
(11) Segment Reporting
In accordance with Accounting Standards Codification No. 280 — Segment Reporting, the Company periodically assesses whether there are changes in its operating and reporting segments. The Company has evaluated how the chief operating decision maker analyzes performance and allocates resources and has identified two reportable segments: the exploration and production segment and the midstream segment. The exploration and production segment explores for and produces oil, natural gas, and NGLs. The midstream segment engages in natural gas gathering and transportation services as well as water services primarily for the Company and its affiliate under common management, Vantage I. Midstream assets are held though the Company's 50% working interest in Vantage Midstream.
To assess the performance of the Company's operating segments, the chief operating decision maker analyzes Adjusted EBITDA. The Company defines Adjusted EBITDA as income (loss) before income taxes; DD&A; impairments; interest expense; and total (gains) losses on derivatives, net, less net cash from settlement of commodity derivatives. DD&A and impairments are excluded from Adjusted EBITDA as a measure of segment operating performance because capital expenditures are evaluated at the time capital costs are incurred. Similarly, total (gains) losses on derivatives, net, less net cash from settlement of commodity derivatives are excluded from Adjusted EBITDA because these (gains) losses are not considered a measure of asset operating performance. Management believes that the presentation of Adjusted EBITDA provides useful information in assessing the Company's financial condition and operating results as well as the profitability of our business segments.
F-65
VANTAGE ENERGY II GROUP
Notes to Condensed Combined Financial Statements (Continued)
June 30, 2016 and December 31, 2015
(Unaudited)
(11) Segment Reporting (Continued)
Adjusted EBITDA is a widely accepted financial indicator; however, adjusted EBITDA as defined by the Company may not be comparable to similarly titled measures used by other companies and should be considered in conjunction with net income (loss) and other performance measures. Below is a reconciliation of consolidated Adjusted EBITDA to income (loss) before income taxes:
|
| Three months ended June 30, |
| ||||
| | | | | | | ||
|
| 2016 | | 2015 |
| ||
| | | | | | | ||
Net income (loss) |
| $ | (45,564 | ) | 2,056 | | |
Interest expense, net of capitalized interest |
| 2,844 | | 2,766 | | ||
Total (gains) losses on derivatives, net, less net cash from settlement of commodity derivatives |
| 44,681 | | (109 | ) | ||
Depreciation, depletion, amortization, and accretion expense |
| 10,150 | | 9,481 | | ||
Impairment of oil and gas properties |
| 15,952 | | — | | ||
| | | | | | | ||
Adjusted EBITDA |
| $ | 28,063 | | 14,194 | | |
| | | | | | | ||
| | | | | | | ||
| | | | | | | ||
|
| Six months ended June 30, |
| ||||
| | | | | | | ||
|
| 2016 | | 2015 |
| ||
| | | | | | | ||
Net income (loss) |
| $ | (95,639 | ) | 12,710 | | |
Interest expense, net of capitalized interest |
| 5,264 | | 4,229 | | ||
Total (gains) losses on derivatives, net, less net cash from settlement of commodity derivatives |
| 48,219 | | (4,957 | ) | ||
Depreciation, depletion, amortization, and accretion expense |
| 19,490 | | 23,357 | | ||
Impairment of oil and gas properties |
| 81,673 | | — | | ||
| | | | | | | ||
Adjusted EBITDA |
| $ | 59,007 | | 35,339 | | |
| | | | | | | ||
| | | | | | | ||
| | | | | | | ||
F-66
VANTAGE ENERGY II GROUP
Notes to Condensed Combined Financial Statements (Continued)
June 30, 2016 and December 31, 2015
(Unaudited)
(11) Segment Reporting (Continued)
The following summarizes selected financial information for the Company's reporting segments:
|
| Three months ended June 30, 2016 |
| ||||||||||||||||||
| | | | | | | | | | | ||||||||||||
|
| Exploration and Production Segment |
| Midstream Segment |
| Eliminations | | Consolidated Total |
| ||||||||||||
| | | | | | | | | | | ||||||||||||
Oil, gas, and NGL revenues |
| | $ | 26,055 | | | | — | | | | — | | | | 26,055 | | | |||
Gas gathering and compression revenues |
| | — | | | | 6,055 | | | | (4,323 | ) | | | 1,732 | | | ||||
Water revenue |
| | — | | | | 1,353 | | | | (1,353 | ) | | | — | | | ||||
Loss on commodity derivatives |
| | (34,507 | ) | | | — | | | | — | | | | (34,507 | ) | | ||||
| | | | | | | | | | | ||||||||||||
Total revenues(1) |
| | (8,452 | ) | | | 7,408 | | | | (5,676 | ) | | | (6,720 | ) | | ||||
E&P operating expenses |
| | 11,328 | | | | — | | | | (4,275 | ) | | | 7,053 | | | ||||
Gathering and compression expenses |
| | — | | | | 416 | | | | — | | | | 416 | | | ||||
Water system expenses |
| | — | | | | 1,649 | | | | (1,649 | ) | | | — | | | ||||
General and adminstrative expenses |
| | 2,131 | | | | 301 | | | | — | | | | 2,432 | | | ||||
| | | | | | | | | | | ||||||||||||
Total operating expenses |
| | 13,459 | | | | 2,366 | | | | (5,924 | ) | | | 9,901 | | | ||||
Other income |
| | 3 |
| | | — |
| | | — |
| | | 3 |
| | ||||
Total losses on derivatives, net, less net cash from settlement of commodity derivatives |
| | 44,681 | | | | — | | | | — | | | | 44,681 | | | ||||
| | | | | | | | | | | ||||||||||||
Adjusted EBITDA |
| | $ | 22,773 | | | | 5,042 | | | | 248 | | | | 28,063 | | | |||
| | | | | | | | | | | ||||||||||||
| | | | | | | | | | | | | | | | | | | ||||
| | | | | | | | | | | ||||||||||||
- (1)
- Total intrasegment revenues for the E&P segment and mistream segment were $0 and $6,904, respectively.
F-67
VANTAGE ENERGY II GROUP
Notes to Condensed Combined Financial Statements (Continued)
June 30, 2016 and December 31, 2015
(Unaudited)
(11) Segment Reporting (Continued)
|
| Three months ended June 30, 2015 |
| ||||||||||||||||||
| | | | | | | | | | | ||||||||||||
|
| Exploration and Production Segment |
| Midstream Segment |
| Eliminations | | Consolidated Total |
| ||||||||||||
| | | | | | | | | | | ||||||||||||
Oil, gas, and NGL revenues |
| | $ | 14,152 | | | | — | | | | — | | | | 14,152 | | | |||
Gas gathering and compression revenues |
| | — | | | | 3,967 | | | | (2,825 | ) | | | 1,142 | | | ||||
Water revenue |
| | — | | | | — | | | | — | | | | — | | | ||||
Gain on commodity derivatives |
| | 6,725 | | | | — | | | | — | | | | 6,725 | | | ||||
| | | | | | | | | | | ||||||||||||
Total revenues(1) |
| | 20,877 | | | | 3,967 | | | | (2,825 | ) | | | 22,019 | | | ||||
E&P operating expenses |
| | 7,685 | | | | — | | | | (2,825 | ) | | | 4,860 | | | ||||
Gathering and compression expenses |
| | (45 | ) | | | 461 | | | | — | | | | 416 | | | ||||
Water system expenses |
| | — | | | | — | | | | — | | | | — | | | ||||
General and adminstrative expenses |
| | 1,946 | | | | 314 | | | | — | | | | 2,260 | | | ||||
| | | | | | | | | | | ||||||||||||
Total operating expenses |
| | 9,586 | | | | 775 | | | | (2,825 | ) | | | 7,536 | | | ||||
Other expense |
| | (180 |
) |
|
| — |
| | | — |
| | | (180 |
) |
|
||||
Total gains on derivatives, net, less net cash from settlement of commodity derivatives |
| | (109 | ) | | | — | | | | — | | | | (109 | ) | | ||||
| | | | | | | | | | | ||||||||||||
Adjusted EBITDA |
| | $ | 11,002 | | | | 3,192 | | | | — | | | | 14,194 | | | |||
| | | | | | | | | | | ||||||||||||
| | | | | | | | | | | | | | | | | | | ||||
| | | | | | | | | | | ||||||||||||
- (1)
- Total intrasegment revenues for the E&P segment and mistream segment were $0 and $3,728, respectively.
F-68
VANTAGE ENERGY II GROUP
Notes to Condensed Combined Financial Statements (Continued)
June 30, 2016 and December 31, 2015
(Unaudited)
(11) Segment Reporting (Continued)
|
| Six months ended June 30, 2016 |
| ||||||||||||||||||
| | | | | | | | | | | ||||||||||||
|
| Exploration and Production Segment |
| Midstream Segment |
| Eliminations | | Consolidated Total |
| ||||||||||||
| | | | | | | | | | | ||||||||||||
Oil, gas, and NGL revenues |
| | $ | 46,829 | | | | — | | | | — | | | | 46,829 | | | |||
Gas gathering and compression revenues |
| | — | | | | 12,767 | | | | (9,872 | ) | | | 2,895 | | | ||||
Water revenue |
| | — | | | | 3,944 | | | | (3,944 | ) | | | — | | | ||||
Loss on commodity derivatives |
| | (22,599 | ) | | | — | | | | — | | | | (22,599 | ) | | ||||
| | | | | | | | | | | ||||||||||||
Total revenues(1) |
| | 24,230 | | | | 16,711 | | | | (13,816 | ) | | | 27,125 | | | ||||
E&P operating expenses |
| | 20,399 | | | | — | | | | (9,823 | ) | | | 10,576 | | | ||||
Gathering and compression expenses |
| | — | | | | 1,428 | | | | — | | | | 1,428 | | | ||||
Water system expenses |
| | — | | | | 3,457 | | | | (3,457 | ) | | | — | | | ||||
General and adminstrative expenses |
| | 3,705 | | | | 631 | | | | — | | | | 4,336 | | | ||||
| | | | | | | | | | | ||||||||||||
Total operating expenses |
| | 24,104 | | | | 5,516 | | | | (13,280 | ) | | | 16,340 | | | ||||
Other income |
| | 3 |
| | | — |
| | | — |
| | | 3 |
| | ||||
Total losses on derivatives, net, less net cash from settlement of commodity derivatives |
| | 48,219 | | | | — | | | | — | | | | 48,219 | | | ||||
| | | | | | | | | | | ||||||||||||
Adjusted EBITDA |
| | $ | 48,348 | | | | 11,195 | | | | (536 | ) | | | 59,007 | | | |||
| | | | | | | | | | | ||||||||||||
| | | | | | | | | | | | | | | | | | | ||||
| | | | | | | | | | | ||||||||||||
Total Assets(2) |
| | $ | 720,116 | | | | 63,703 | | | | (3,398 | ) | | | 780,421 | | | |||
Capital expenditures(3) |
| | 426,086 | | | | 2,427 | | | | (733 | ) | | | 427,780 | | | ||||
- (1)
- Total
intrasegment revenues for the E&P segment and mistream segment were $0 and $15,940, respectively.
- (2)
- Included
in the total assets for the midstream segment is $1,278 for the net water investment, which is an other asset on the balance sheet.
- (3)
- Included in capital expenditures for the midstream segment is $386 for the water investment expenditures, which is an other asset on the balance sheet.
F-69
VANTAGE ENERGY II GROUP
Notes to Condensed Combined Financial Statements (Continued)
June 30, 2016 and December 31, 2015
(Unaudited)
(11) Segment Reporting (Continued)
|
| Six months ended June 30, 2015 |
| ||||||||||||||||||
| | | | | | | | | | | ||||||||||||
|
| Exploration and Production Segment |
| Midstream Segment |
| Eliminations | | Consolidated Total |
| ||||||||||||
| | | | | | | | | | | ||||||||||||
Oil, gas, and NGL revenues |
| | $ | 40,375 | | | | — | | | | — | | | | 40,375 | | | |||
Gas gathering and compression revenues |
| | — | | | | 7,819 | | | | (5,295 | ) | | | 2,524 | | | ||||
Gain on commodity derivatives |
| | 14,921 | | | | — | | | | — | | | | 14,921 | | | ||||
| | | | | | | | | | | ||||||||||||
Total revenues(1) |
| | 55,296 | | | | 7,819 | | | | (5,295 | ) | | | 57,820 | | | ||||
E&P operating expenses |
| | 16,321 | | | | — | | | | (5,295 | ) | | | 11,026 | | | ||||
Gathering and compression expenses |
| | (45 | ) | | | 876 | | | | — | | | | 831 | | | ||||
Water system expenses |
| | — | | | | — | | | | — | | | | — | | | ||||
General and adminstrative expenses |
| | 4,889 | | | | 598 | | | | — | | | | 5,487 | | | ||||
| | | | | | | | | | | ||||||||||||
Total operating expenses |
| | 21,165 | | | | 1,474 | | | | (5,295 | ) | | | 17,344 | | | ||||
Other expense |
| | (180 |
) |
|
| — |
| | | — |
| | | (180 |
) |
|
||||
Total gains on derivatives, net, less net cash from settlement of commodity derivatives |
| | (4,957 | ) | | | — | | | | — | | | | (4,957 | ) | | ||||
| | | | | | | | | | | ||||||||||||
Adjusted EBITDA |
| | $ | 28,994 | | | | 6,345 | | | | — | | | | 40,656 | | | |||
| | | | | | | | | | | ||||||||||||
| | | | | | | | | | | | | | | | | | | ||||
| | | | | | | | | | | ||||||||||||
Total Assets |
| | $ | 531,830 | | | | 57,663 | | | | (853 | ) | | | 588,640 | | | |||
Capital expenditures |
| | 70,809 | | | | 7,995 | | | | — | | | | 78,804 | | | ||||
- (1)
- Total intrasegment revenues for the E&P segment and mistream segment were $0 and $7,310, respectively.
(12) Subsequent Events
The Company has evaluated subsequent events that occurred after June 30, 2016 through August 29, 2016. Any other material subsequent events that occurred during this time have been properly recognized or disclosed in these combined financial statements or the notes to the combined financial statements.
F-70
Report of Independent Registered Public Accounting Firm
The
Board of Managers and Members
Vantage Energy, LLC:
We have audited the accompanying consolidated balance sheets of Vantage Energy, LLC and subsidiaries (the Company) as of December 31, 2015 and 2014, and the related consolidated statements of operations, changes in members' equity, and cash flows for each of the years in the two-year period ended December 31, 2015. These consolidated financial statements are the responsibility of the Company's management. Our responsibility is to express an opinion on these consolidated financial statements based on our audits.
We conducted our audits in accordance with the standards of the Public Company Accounting Oversight Board (United States). Those standards require that we plan and perform the audit to obtain reasonable assurance about whether the financial statements are free of material misstatement. An audit includes examining, on a test basis, evidence supporting the amounts and disclosures in the financial statements. An audit also includes assessing the accounting principles used and significant estimates made by management, as well as evaluating the overall financial statement presentation. We believe that our audits provide a reasonable basis for our opinion.
In our opinion, the consolidated financial statements referred to above present fairly, in all material respects, the financial position of Vantage Energy, LLC and subsidiaries as of December 31, 2015 and 2014, and the results of their operations and their cash flows for each of the years in the two-year period ended December 31, 2015, in conformity with U.S. generally accepted accounting principles.
| | /s/ KPMG LLP | |
Denver, Colorado July 26, 2016 |
|
F-71
VANTAGE ENERGY, LLC
Consolidated Balance Sheets
December 31, 2015 and 2014
(In thousands)
|
| 2015 | | 2014 |
| ||
| | | | | | | ||
Assets |
| | | ||||
Current assets: |
| | | ||||
Cash and cash equivalents |
| $ | 2,191 | | $ | 20,479 | |
Accounts receivable |
| 21,989 | | 24,437 | | ||
Inventory |
| 1,212 | | 1,878 | | ||
Prepayments and deposits |
| 815 | | 217 | | ||
Commodity derivative assets |
| 40,944 | | 66,200 | | ||
| | | | | | | ||
Total current assets |
| 67,151 | | 113,211 | | ||
| | | | | | | ||
Property, plant, and equipment: |
| | | ||||
Oil and gas properties, full-cost method of accounting: |
| | | ||||
Proved |
| 1,032,782 | | 862,828 | | ||
Unproved |
| 74,619 | | 58,640 | | ||
| | | | | | | ||
Total oil and gas properties |
| 1,107,401 | | 921,468 | | ||
Accumulated depletion and ceiling write-down |
| (634,082 | ) | (243,978 | ) | ||
| | | | | | | ||
Net oil and gas properties |
| 473,319 | | 677,490 | | ||
Gathering systems, less accumulated depreciation of $5,299 and $2,323 |
| 58,815 | | 52,147 | | ||
Other property, plant, and equipment, less accumulated depreciation of $1,948 and $1,731 |
| 772 | | 428 | | ||
| | | | | | | ||
Net property, plant, and equipment |
| 532,906 | | 730,065 | | ||
Commodity derivative assets |
| 15,679 | | 5,468 | | ||
Other assets |
| 4,771 | | 4,518 | | ||
Water investment, less accumulated amortization of $11 and $0 |
| 662 | | — | | ||
| | | | | | | ||
Total assets |
| $ | 621,169 | | $ | 853,262 | |
| | | | | | | ||
| | | | | | | ||
| | | | | | | ||
Liabilities and Members' Equity |
| | | ||||
Current liabilities: |
| | | ||||
Accounts payable and accrued liabilities |
| $ | 40,937 | | $ | 45,656 | |
Accounts payable — related party |
| 1,100 | | 12,524 | | ||
Commodity derivative liabilities |
| — | | 1,183 | | ||
Current portion of Second Lien note payable |
| 2,000 | | 2,000 | | ||
Asset retirement obligations |
| — | | 12 | | ||
| | | | | | | ||
Total current liabilities |
| 44,037 | | 61,375 | | ||
Revolving credit facility |
| 271,000 | | 192,000 | | ||
Second Lien note payable, net of original issue discount of $1,275 and $1,646 |
| 192,725 | | 194,354 | | ||
Asset retirement obligations |
| 8,466 | | 7,654 | | ||
| | | | | | | ||
Total liabilities |
| 516,228 | | 455,383 | | ||
| | | | | | | ||
Contingently redeemable Founders' units |
| 5,788 | | 5,788 | | ||
Commitments and contingencies (note 8) |
| | | ||||
Members' equity: |
| | | ||||
Member contributions, net of issuance costs |
| 428,227 | | 428,227 | | ||
Accumulated deficit |
| (329,074 | ) | (36,136 | ) | ||
| | | | | | | ||
Total members' equity |
| 99,153 | | 392,091 | | ||
| | | | | | | ||
Total liabilities and members' equity |
| $ | 621,169 | | $ | 853,262 | |
| | | | | | | ||
| | | | | | | ||
| | | | | | | ||
See accompanying notes to consolidated financial statements.
F-72
VANTAGE ENERGY, LLC
Consolidated Statements of Operations
Years ended December 31, 2015 and 2014
(In thousands)
|
| 2015 | | 2014 |
| ||
| | | | | | | ||
Operating revenues: |
| | | ||||
Gas revenues |
| $ | 73,209 | | 76,693 | | |
Oil revenues |
| 3,053 | | 9,438 | | ||
NGLs revenues |
| 8,313 | | 13,833 | | ||
Midstream revenues |
| 5,679 | | 1,995 | | ||
Gain on commodity derivatives |
| 69,569 | | 66,615 | | ||
| | | | | | | ||
Total operating revenues |
| 159,823 | | 168,574 | | ||
| | | | | | | ||
Operating expenses: |
| | | ||||
Production and ad valorem tax expense |
| 4,843 | | 6,718 | | ||
Marketing and gathering expense |
| 5,352 | | 7,262 | | ||
Lease operating and workover expense |
| 18,092 | | 15,636 | | ||
Midstream operating expense |
| 1,834 | | 892 | | ||
General and administrative expense |
| 6,019 | | 8,838 | | ||
Depreciation, depletion, amortization, and accretion expense |
| 50,162 | | 37,908 | | ||
Impairment of oil and gas properties |
| 344,401 | | — | | ||
| | | | | | | ||
Total operating expenses |
| 430,703 | | 77,254 | | ||
| | | | | | | ||
Operating income (loss) |
| (270,880 | ) | 91,320 | | ||
| | | | | | | ||
Other expense: |
| | | ||||
Interest expense, net of capitalized interest |
| (22,058 | ) | (17,575 | ) | ||
| | | | | | | ||
Total other expense |
| (22,058 | ) | (17,575 | ) | ||
| | | | | | | ||
Net income (loss) |
| $ | (292,938 | ) | 73,745 | | |
| | | | | | | ||
| | | | | | | ||
| | | | | | | ||
See accompanying notes to consolidated financial statements.
F-73
VANTAGE ENERGY, LLC
Consolidated Statements of Changes in Members' Equity
Years ended December 31, 2015 and 2014
(In thousands)
|
| Contingently | | Members' Equity |
| ||||||||||||||
| | | | | | | | | | | | | ||||||||
|
| Redeemable Founders' Units |
| Members' Contributions |
| Accumulated Earnings (Deficit) |
| Total |
| ||||||||||
| | | | | | | | | | | ||||||||||
Balance at January 1, 2014 |
| | $ | 5,788 | | | | $ | 428,227 | | | | $ | (109,881 | ) | | $ | 318,346 | |
Net income |
| | — | | | | — | | | | 73,745 | | | 73,745 | | ||||
| | | | | | | | | | | ||||||||||
Balance at December 31, 2014 |
| | 5,788 | | | | 428,227 | | | | (36,136 | ) | | 392,091 | | ||||
Net loss |
| | — | | | | — | | | | (292,938 | ) | | (292,938 | ) | ||||
| | | | | | | | | | | ||||||||||
Balance at December 31, 2015 |
| | $ | 5,788 | | | | $ | 428,227 | | | | $ | (329,074 | ) | | $ | 99,153 | |
| | | | | | | | | | | ||||||||||
| | | | | | | | | | | | | | | | | ||||
| | | | | | | | | | | ||||||||||
See accompanying notes to consolidated financial statements.
F-74
VANTAGE ENERGY, LLC
Consolidated Statements of Cash Flows
Years ended December 31, 2015 and 2014
(In thousands)
|
| 2015 | | 2014 |
| ||
| | | | | | | ||
Cash flows from operating activities: |
| | | ||||
Net income (loss) |
| $ | (292,938 | ) | 73,745 | | |
Adjustments to reconcile net income (loss) to net cash provided by operating activities: |
| | | ||||
Depreciation, depletion, amortization, and accretion |
| 50,162 | | 37,908 | | ||
Accretion of original issue discount |
| 371 | | 354 | | ||
Impairment of oil and gas properties |
| 344,401 | | — | | ||
Gain on commodity derivatives |
| (69,569 | ) | (66,615 | ) | ||
Settlement of commodity derivatives |
| 83,431 | | (204 | ) | ||
Changes in operating assets and liabilities: |
| | | ||||
Accounts receivable |
| 2,448 | | (10,911 | ) | ||
Accounts payable — related party |
| (11,424 | ) | 3,231 | | ||
Inventory |
| 666 | | 364 | | ||
Prepayments and deposits |
| (598 | ) | (67 | ) | ||
Accounts payable and accrued liabilities |
| 3,860 | | 7,758 | | ||
| | | | | | | ||
Net cash provided by operating activities |
| 110,810 | | 45,563 | | ||
| | | | | | | ||
Cash flows from investing activities: |
| | | ||||
Oil and gas property acquisition, exploration, and development |
| (189,835 | ) | (259,431 | ) | ||
Gathering system additions |
| (12,867 | ) | (33,969 | ) | ||
Water investment additions, net of surcharges refunded |
| (1,512 | ) | — | | ||
Other assets |
| — | | (1,376 | ) | ||
Proceeds on sale of properties |
| 75 | | 60 | | ||
Other property, plant, and equipment additions |
| (560 | ) | (244 | ) | ||
| | | | | | | ||
Net cash used in investing activities |
| (204,699 | ) | (294,960 | ) | ||
| | | | | | | ||
Cash flows from financing activities: |
| | | ||||
Borrowings under revolving credit facility |
| 79,000 | | 192,000 | | ||
Principal payments on second lien note payable |
| (2,000 | ) | (2,000 | ) | ||
Financing costs |
| (1,399 | ) | (335 | ) | ||
| | | | | | | ||
Net cash provided by financing activities |
| 75,601 | | 189,665 | | ||
| | | | | | | ||
Net change in cash and cash equivalents |
| (18,288 | ) | (59,732 | ) | ||
Cash and cash equivalents — beginning of year |
| 20,479 | | 80,211 | | ||
| | | | | | | ||
Cash and cash equivalents — end of year |
| $ | 2,191 | | 20,479 | | |
| | | | | | | ||
| | | | | | | ||
| | | | | | | ||
Supplemental disclosure of cash flow information: |
| | | ||||
Cash paid for interest |
| $ | 23,386 | | 19,397 | | |
Supplemental disclosure of selected noncash accounts: |
| | | ||||
Accrued oil and gas capital additions |
| $ | 18,993 | | 27,577 | | |
Capitalized asset retirement obligations, net |
| 942 | | 1,001 | | ||
See accompanying notes to consolidated financial statements.
F-75
VANTAGE ENERGY, LLC
Notes to Consolidated Financial Statements
December 31, 2015 and 2014
(1) Description of Business and Summary of Significant Accounting Policies
(a) Nature of Operations and Principles of Consolidation
Vantage Energy, LLC (the Company) was organized as a limited liability company under the laws of the state of Delaware in 2006. The consolidated financial statements include the accounts of Vantage Energy, LLC and its seven wholly owned subsidiaries. All intercompany balances have been eliminated in consolidation.
The Company is engaged in the exploration and exploitation of petroleum and natural gas, as well as natural gas acquisition, development, and gathering, in various basins in the United States of America, with the primary focus on unconventional natural gas plays.
(b) Use of Estimates
The preparation of these consolidated financial statements, in conformity with generally accepted accounting principles in the United States of America, requires management to make estimates and assumptions that affect the amounts reported in the consolidated financial statements and accompanying notes. As a result, actual amounts could differ from estimated amounts. By their nature, these estimates are subject to measurement uncertainty, and the effect on the consolidated financial statements of changes in such estimates in future periods could be significant. Significant estimates with regard to the Company's consolidated financial statements include the estimate of proved oil and gas reserve volumes and the related present value of estimated future net cash flows, the recoverability of unproved oil and gas properties, the calculation of depletion of oil and gas reserves, the estimated cost and timing related to asset retirement obligations, and the estimated fair value of derivative assets and liabilities.
Reserve estimates are, by their nature, inherently imprecise. The process of estimating quantities of oil and gas reserves is complex, requiring significant decisions in the evaluation of all available geological, geophysical, engineering, and economic data. The data for a given field may also change substantially over time as a result of numerous factors including, but not limited to, additional development activity, evolving production history, and continual reassessment of the viability of production under varying economic conditions. As a result, material revisions to existing reserve estimates may occur from time to time. Although every reasonable effort is made to ensure that the reserve estimates represent the most accurate assessments possible, subjective decisions, and available data for the various fields make these estimates generally less precise than other estimates included in financial statement disclosures.
(c) Cash and Cash Equivalents
The Company considers all highly liquid investments with original maturities of three months or less to be cash equivalents. The Company continually monitors its positions with, and the credit quality of, the financial institutions with which it invests. As of the balance sheet date, and throughout the year, the Company has maintained balances in various operating accounts in excess of federally insured limits.
F-76
VANTAGE ENERGY, LLC
Notes to Consolidated Financial Statements (Continued)
December 31, 2015 and 2014
(1) Description of Business and Summary of Significant Accounting Policies (Continued)
(d) Oil and Gas Properties
The Company follows the full-cost method of accounting for natural gas and crude oil properties. All costs associated with property acquisition, exploration, and development activities are capitalized. Exploration and development costs include dry hole costs, geological and geophysical costs, direct overhead related to exploration and development activities, and other costs incurred for the purpose of finding oil and gas reserves. Salaries and benefits paid to employees directly involved in the exploration and development of properties, as well as other internal costs that can be directly identified with acquisition, exploration, and development activities, are also capitalized. During the years ended December 31, 2015 and 2014, the Company capitalized approximately $5.3 million and $4.0 million, respectively, of certain internal costs.
Costs of acquiring unproved oil and gas properties are initially excluded from the depletable base and are assessed at each reporting period to ascertain whether impairment has occurred. When proved reserves are assigned to the property or the property is considered to be impaired, the costs of the property or the amount of impairment is added to the depletable base. Upon complete evaluation of a property, the total remaining excluded cost (net of any impairment) is included in the full cost amortization base.
Capitalized costs, as adjusted for estimated future development costs and estimated asset retirement costs, less estimated salvage values, are depreciated, depleted, and amortized using the units-of-production method based on estimated proved reserves as determined by petroleum engineers. The costs of wells in progress and unevaluated properties, including any related capitalized interest and internal costs, are not amortized. For the purposes of this calculation, crude oil and natural gas liquid reserves and production are converted to equivalent volumes of natural gas based on the relative energy content of one barrel to six thousand cubic feet of gas. Proceeds from the disposal of properties are normally deducted from the full-cost pool without recognition of gains or losses, except under circumstances where the deduction would significantly alter the relationship between capitalized costs and proved reserves of the cost center, in which case a gain or loss is recorded.
Pursuant to full-cost accounting rules, the Company is required to perform a "ceiling test" calculation to test its oil and gas properties for possible impairment. If the net capitalized cost of the Company's oil and gas properties subject to the amortization (the carrying value) exceeds the ceiling limitation, the excess would be charged to expense. The ceiling limitation is equal to the sum of the present value discounted at 10% of estimated future net cash flows from proved reserves, the cost of properties not being amortized, the lower of cost or estimated fair value of unproven properties included in the costs being amortized, and all related income tax effects. The present value of estimated future net revenue is computed by applying the average first day of the month oil and gas price for the preceding 12-month period to estimated future production of proved oil and gas reserves as of period-end, less estimated future expenditures to be incurred in developing and producing the proved reserves, assuming the continuation of existing economic conditions.
For the year ended December 31, 2015, the carrying value of the Company's oil and gas properties subject to the test exceeded the calculated value of the ceiling limitation by
F-77
VANTAGE ENERGY, LLC
Notes to Consolidated Financial Statements (Continued)
December 31, 2015 and 2014
(1) Description of Business and Summary of Significant Accounting Policies (Continued)
$344.4 million. As a result, the Company recorded an impairment of $344.4 million. The ceiling test calculation uses rolling 12-month average commodity prices, the effect of lower quarter-over quarter prices in future quarters is a potentially lower ceiling value each quarter. This could result in ongoing impairments each quarter until prices stabilize or improve.
(e) Costs Not Being Amortized
The following table sets forth a summary of oil and gas property costs not being amortized at December 31, 2015, by the year in which such costs were incurred. Included in the $74.6 million of costs not subject to amortization are approximately $9.4 million that the Company deems significant related to its acquisition of properties from Tanglewood Exploration, LLC in the Marcellus Shale during 2012. The Company expects to evaluate and develop these Marcellus Shale properties over the next three to five years and to include the relevant costs in the amortization computation as such evaluation activities are completed.
|
| Costs Incurred |
| ||||||||||||||||
| | | | | | | | | | | ||||||||||
|
| Prior to 2013 | | During 2014 | | During 2015 | | Total |
| ||||||||||
| | | | | | | | | | | ||||||||||
|
| (In thousands) | | ||||||||||||||||
Acquisition Costs |
| | $ | 7,779 | | | | 30,860 | | | | 11,666 | | | 50,305 | | |||
Exploration and development costs |
| | — | | | | — | | | | 15,125 | | | 15,125 | | ||||
Capitalized Interest |
| | 101 | | | | 3,389 | | | | 5,699 | | | 9,189 | | ||||
| | | | | | | | | | | ||||||||||
Total |
| | $ | 7,880 | | | | 34,249 | | | | 32,490 | | | 74,619 | | |||
| | | | | | | | | | | ||||||||||
| | | | | | | | | | | | | | | | | ||||
| | | | | | | | | | | ||||||||||
(f) Joint Ventures
Certain of the Company's oil and gas exploration and development activities are conducted jointly with others; accordingly, the consolidated financial statements reflect only the Company's proportionate interest in such activities.
(g) Inventory
The Company's inventory primarily comprises tubular goods and well equipment to be used in future drilling operations. Inventory is charged to specific wells and transferred into oil and gas properties when used. There were no material inventory write-downs for the years ended December 31, 2015 and 2014.
(h) Gas Gathering System
The Company owns a 50% operated working interest in the assets of Vista Gathering, LLC (hereinafter referred to as Vantage Midstream). All gas transported in the gas gathering system relates to wells in which the Company and/or Vantage Energy II, LLC (Vantage II), an affiliate under common management, own a working interest and for which the Company or Vantage II serves as operator. Vantage Midstream owns and operates the majority of its gas gathering assets. Vantage Midstream also owns a 38% nonoperated interest in the Appalachia Midstream Services joint venture for its Rogersville gas gathering system.
F-78
VANTAGE ENERGY, LLC
Notes to Consolidated Financial Statements (Continued)
December 31, 2015 and 2014
(1) Description of Business and Summary of Significant Accounting Policies (Continued)
The Company's gas gathering assets are being depreciated on the straight-line method over a 20-year useful life. For the years ended December 31, 2015 and 2014, the Company recognized depreciation expense on its gas gathering system assets of approximately $3.0 million and $1.6 million, respectively. Maintenance and repairs are charged to expense as incurred. Expenditures that extend the useful lives of assets are capitalized. When assets are retired or otherwise disposed of, the cost of the assets and the related accumulated depreciation are removed from the accounts. Any gain or loss on retirements is reflected in other income in the year in which the asset is disposed.
The Company reviews its long-lived assets other than oil and gas properties for impairment whenever events or changes in circumstances indicate that the carrying amount of the asset may not be recovered. The Company performs an analysis of the anticipated undiscounted future net cash flows of the related long-lived asset and if the carrying value of the related asset exceeds the undiscounted cash flows, the carrying value is reduced to the asset's fair value and an impairment loss is recorded against the long-lived asset. There have been no provisions for impairment recorded for the years ended December 31, 2015 and 2014.
(i) Water Investment
Vantage Midstream entered into a 10-year agreement for Water System Expansion and Supply with Southwestern Pennsylvania Water Authority (SPWA) on July 30, 2015. The purpose of the agreement is to fund and assist SPWA in constructing an expansion to its water supply system; grant the Company preferred rights to water volumes for use in its oil and gas operations; and create a repayment structure for the Company through a surcharge applicable to all oil and gas water users. The proposed water system improvements to be funded by the Company are estimated to be $14.7 million; however, the Company may terminate the agreement without penalty. The surcharge in the amount of $3.50 per 1,000 gallons of water sold to oil and gas users from the system is collected by SPWA and remitted to Vantage Midstream. The costs incurred by us are capitalized and are being amortized on a straight line basis over the life of the agreement. Payments to the Company from SPWA derived from surcharges paid to SPWA by third parties are applied as a recovery of capital investment for funds advanced by Vantage Midstream to expand the system, while payments to Vantage Midstream from SPWA derived from surcharges from the Company are recorded as an offset to Vantage Midstream's cost of water.
The Company entered into a Water Service and Supply Agreement with Vantage Midstream effective May 1, 2015. Under the agreement Vantage Midstream will provide services required by the Company, including the supply of water for injection and related collection, recycling, purifying, and the disposal of water after use. Vantage Midstream is responsible for the sourcing and transportation of water as requested by the Company. Vantage Midstream will also collect, clean, recycle, transport, and/or dispose of produced water and flowback water resulting from the Company's operations. The Company's 50% undivided working interest in the profits of the water business are eliminated against the full cost pool upon consolidation.
F-79
VANTAGE ENERGY, LLC
Notes to Consolidated Financial Statements (Continued)
December 31, 2015 and 2014
(1) Description of Business and Summary of Significant Accounting Policies (Continued)
(j) Deferred Financing Costs
Costs associated with obtaining debt financing are deferred and amortized over the term of the debt. These costs, net of amortization, are included in other assets.
(k) Asset Retirement Obligations
Asset retirement obligations relate to future costs associated with the plugging and abandonment of oil and gas wells, removal of equipment and facilities from leased acreage, and returning such land to its original condition. The fair value of a liability for an asset retirement obligation is recorded in the period in which it is incurred and the cost of such liability is recorded as an increase in the carrying amount of the related long-lived asset by the same amount. The liability is accreted each period and the capitalized cost is depleted as part of the full-cost pool or depreciated as part of the gathering system. Revisions to estimated asset retirement obligations result in adjustments to the related capitalized asset and corresponding liability.
(l) Commodity Derivatives
The Company periodically uses derivative instruments to provide a measure of stability to its cash flows in an environment of volatile oil and gas prices and to manage its exposure to commodity price and interest rate risk. The Company records all derivative instruments at fair value within the accompanying consolidated balance sheets. Changes in fair value are to be recognized currently in earnings unless specific hedge accounting criteria are met. Management has decided not to use hedge accounting under the accounting guidance for its derivatives; therefore, the changes in fair value are recognized in earnings. The Company classifies cash payments and receipts on its derivative instruments in operating cash flows in the accompanying consolidated statements of cash flows.
(m) Revenue Recognition
Crude oil, natural gas, and natural gas liquid (NGLs) revenue is recognized when delivery has occurred, title has transferred, and collection is probable.
The Company accounts for oil and natural gas sales using the "entitlements method". Under the entitlements method, revenue is recorded based upon the Company's ownership share of volumes sold, regardless of whether it has taken its ownership share of such volumes. The Company records a receivable or a liability to the extent it receives less or more than its share of the volumes and related revenue. Any amount received in excess of the Company's share is treated as a liability. If the Company receives less than its entitled share, the underproduction is recorded as a receivable. The Company sells the majority of its products soon after production at various locations, including the wellhead, at which time title and risk of loss pass to the purchaser. At December 31, 2015 and 2014, the Company did not have any material gas imbalances.
The Company's gas gathering revenue is generated from gas gathering and compressing natural gas in Pennsylvania. The Company provides gas gathering services and compression services under fee-based arrangements.
F-80
VANTAGE ENERGY, LLC
Notes to Consolidated Financial Statements (Continued)
December 31, 2015 and 2014
(1) Description of Business and Summary of Significant Accounting Policies (Continued)
(n) Concentrations of Credit Risk
The Company grants credit in the normal course of business to oil and gas purchasers in the United States of America. Collectability of the Company's oil and gas sales is dependent upon the financial wherewithal of the Company's purchasers, as well as general economic conditions of the industry. To date, the Company has not had any bad debts.
Approximately, 27%, 21%, and 9% of the Company's accounts receivable as of December 31, 2015 were due from Chesapeake Energy, Asset Risk Management (ARM), and South Jersey, respectively. Approximately, 27%, 19%, and 14% of the Company's accounts receivable as of December 31, 2014 were due from ETC Marketing, Bayshore Energy, and Chesapeake Energy, respectively.
Approximately, 41%, 21%, 20%, and 11%, of the Company's oil and gas revenue for the year ended December 31, 2015 was generated from ARM, Targa Resources, ETC Marketing, and Chesapeake Energy, respectively. Approximately, 28%, 24%, 16%, and 13% of the Company's oil and gas revenue for the year ended December 31, 2014 was generated from Sequent Energy, Targa Resources, ETC Marketing, and Chesapeake Energy, respectively.
Although a substantial portion of production is purchased by these major customers, the Company does not believe the loss of any one or several customers would have a material adverse effect on our business, as other customers or markets would be accessible to us.
(o) Marketing and Gathering Costs
In Texas, the Company sells at the wellhead and receives payment net of gathering expenses. In the Lake Arlington area (Tarrant County), the Company's volumes are gathered by Summit under a long-term agreement and marketed by ETC Marketing, Ltd. The gathering fee is $0.67/mmbtu plus 3.2% for compression and fuel. In the Rosedale area (Tarrant County), volumes are gathered by Crestwood under a long-term agreement and marketed by ARM Energy Management. The current gathering fee is $0.3l/mmbtu with approximately $0.20/mmbtu for compression, and 1.5% for fuel. In the Southcliff area (Tarrant County), volumes are gathered by Access under a long-term agreement and marketed by ARM Energy Management. The current gathering fee is $0.57/mmbtu with a 2.0% fuel charge. The price received from these contracts is Waha index related.
The Company has multiple gathering and processing agreements for volumes produced in Denton County, Texas and Wise County, Texas. These agreements are with Targa, Devon, and EnLink. The average deduct from Waha for residue gas is approximately $0.40/mmbtu. The average deduct from Mt. Belvieu for NGLs is approximately $5.10/barrel. Field condensate is gathered and marketed by Enterprise under short-term agreement and generally receives a price of WTI less $5.00/bbl.
In Pennsylvania, Vantage Midstream gathers all gas, excluding the Appalachia Midstream Services joint venture area. Vantage Midstream gathering fees are $0.26/mmbtu for initial wells and $0.50/mmbtu for subsequent wells, with a sliding scale downward to $0.25/mmbtu based on cumulative system throughput.
F-81
VANTAGE ENERGY, LLC
Notes to Consolidated Financial Statements (Continued)
December 31, 2015 and 2014
(1) Description of Business and Summary of Significant Accounting Policies (Continued)
(p) Impact Fees
The state of Pennsylvania imposes an impact fee on oil and gas production based on a formula applied to individual wells. The Company classifies the impact fees within production and ad valorem taxes on the accompanying consolidated statements of operations for the years ended December 31, 2015 and 2014.
(q) Capitalized Interest
The Company capitalizes interest costs to oil and gas properties on expenditures made in connection with projects that are not subject to current depletion. Interest is capitalized for the period that activities are in progress to bring these projects to their intended use. For the years ended December 31, 2015 and 2014, the Company capitalized interest costs to unproved properties of $1.6 million and $1.5 million, respectively.
(r) Income Taxes
The Company is a multi-member limited liability company. Accordingly, no provision for income taxes has been recorded as the income, deductions, expenses, and credits of the Company are reported on the income tax returns of the Company's Members. The Company is subject to the Texas margin tax, which is generally calculated as 1% of gross margin. The tax is considered an income tax and is determined by applying a tax rate to a base that considers both revenue and expenses. During the years ended December 31, 2015 and 2014, the margin tax was immaterial to the consolidated financial statements.
The Company accounts for uncertainty in income taxes in accordance with generally accepted accounting principles, which prescribe a comprehensive model for recognizing, measuring, presenting, and disclosing in the consolidated financial statements tax positions taken or expected to be taken on a tax return, including a decision on whether or not to file in a particular jurisdiction. Only tax positions that meet a more-likely than-not recognition threshold at the effective date may be recognized or continue to be recognized.
Interest and penalties associated with tax positions are recorded in the period assessed as general and administrative expenses. No interest or penalties have been assessed as of December 31, 2015. The Company's information returns for tax years subject to examination by tax authorities include 2010 through the current year for state and federal tax reporting purposes.
(s) Industry Segment and Geographic Information
The Company conducts oil, gas and NGLs exploration, production, and gathering operations in the following segments: (1) Exploration and Production and (2) Midstream. All of the Company's operations and assets are located in the United States, and all of its revenue is attributable to domestic customers.
F-82
VANTAGE ENERGY, LLC
Notes to Consolidated Financial Statements (Continued)
December 31, 2015 and 2014
(1) Description of Business and Summary of Significant Accounting Policies (Continued)
(t) New Accounting Pronouncements
The FASB issued ASU No. 2014-09, Revenue from Contracts with Customers, in May 2014. ASU 2014-09 requires an entity to recognize revenue to depict the transfer of promised goods or services to customers in an amount that reflects the consideration to which the entity expects to be entitled in exchange for those goods or services. ASU No. 2014-09 will supersede most of the existing revenue recognition requirements in United States GAAP when it becomes effective and is required to be adopted using one of two retrospective application methods. An entity should also disclose sufficient quantitative and qualitative information to enable users of financial statements to understand the nature, amount, timing, and uncertainty of revenue and cash flows arising from contracts with customers. The new standard is effective for annual reporting periods beginning after December 15, 2017. The Company will implement the provisions of ASU 2014-09 as of January 1, 2018. The Company has not yet determined the impact of the new standard on its current policies for revenue recognition.
The FASB issued ASU No 2016-02, Leases, in February 2016. ASU 2016-02 will require lessees to present right-of-use assets and lease liabilities on their balance sheets. ASU 2016-02 is effective for annual and interim periods beginning January 1, 2019. Early adoption of ASU 2016-02 is permitted. Upon adoption of ASU 2016-02, we are required to recognize and measure leases at the beginning of the earliest period presented in our consolidated financial statements using a modified retrospective approach. The modified retrospective approach includes a number of optional practical expedients that we may elect to apply. We have not yet decided when we will adopt ASU 2016-02 or which practical expedient options we will elect. We are currently evaluating and assessing the impact ASU 2016-02 will have on us and our financial statements. As of the date of this report, we cannot provide any estimate of the impact of adopting ASU 2016-02.
The FASB issued ASU 2015-03, Interest Imputation of Interest: Simplifying the Presentation of Debt Issuance Costs, in April 2015. The core principle of ASU 2015-03 will require all costs incurred to issue debt be presented in the balance sheet as a direct deduction from the carrying value of debt, consistent with debt discounts. Upon adoption of ASU 2015-03, the new standard is limited to the presentation of debt issuance costs. The standard does not affect the recognition and measurement of debt issuance costs. In August 2015, the FASB issued ASU 2015-15, Interest — Imputations of Interest, Subtopic 835-30, Interest (ASU 2015-15). The guidance in ASU 2015-03 did not address the presentation or subsequent measurement of debt issuance costs related to line-of-credit arrangements. ASU 2015-15 was issued to clarify that the SEC staff would not object to an entity deferring and presenting debt issuance costs as an asset and subsequently amortizing the deferred debt issuance costs ratably over the term of the line-of-credit arrangement, regardless of whether there are any outstanding borrowings on the line-of-credit arrangements. The amendments in ASU 2015-03 should be applied on a retrospective basis and early adoption is permitted. ASU 2015-03 is effective for financial statements issued for fiscal years beginning after December 15, 2015, and interim periods within fiscal years beginning after December 15, 2016. The Company does not believe the impact of the new standard on its presentation of debt issuance costs will have a material effect on the Company's financial statements and related disclosures.
F-83
VANTAGE ENERGY, LLC
Notes to Consolidated Financial Statements (Continued)
December 31, 2015 and 2014
(2) Balance Sheet Disclosures
Accounts receivable consist of the following:
|
| December 31 |
| ||||
| | | | | | | ||
|
| 2015 | | 2014 |
| ||
| | | | | | | ||
|
| (In thousands) | | ||||
Revenue |
| $ | 14,128 | | 20,074 | | |
Joint interest billings |
| 5,021 | | 4,663 | | ||
Derivative receivable |
| 1,056 | | — | | ||
Other receivables |
| 2,284 | | — | | ||
Allowance for doubtful accounts |
| (500 | ) | (300 | ) | ||
| | | | | | | ||
|
| $ | 21,989 | | 24,437 | | |
| | | | | | | ||
| | | | | | | ||
| | | | | | | ||
Joint interest billings represent receivables from joint interest owners on properties the Company operates. For receivables from joint interest owners, the Company typically has the ability to withhold future revenue disbursements to recover nonpayment of joint interest billings.
Accounts payable and accrued liabilities consist of the following:
|
| December 31 |
| ||||
| | | | | | | ||
|
| 2015 | | 2014 |
| ||
| | | | | | | ||
|
| (In thousands) | | ||||
Accrued capital expenditures |
| $ | 18,993 | | 27,577 | | |
Accrued production and ad valorem taxes |
| 3,127 | | 6,359 | | ||
Accrued revenue payable |
| 6,978 | | 5,750 | | ||
Accrued production expense payable |
| 2,264 | | 1,969 | | ||
Accrued marketing, gathering, and transportation |
| 5,646 | | 2,378 | | ||
Accrued general and administrative expense |
| 1,854 | | 1,060 | | ||
Cash calls payable to other joint interest owners |
| 437 | | 101 | | ||
Accrued interest payable |
| 171 | | 274 | | ||
Accounts payable |
| 1,467 | | 188 | | ||
| | | | | | | ||
|
| $ | 40,937 | | 45,656 | | |
| | | | | | | ||
| | | | | | | ||
| | | | | | | ||
(3) Long-Term Debt
(a) Revolving Credit Facility
Effective July 19, 2007, the Company secured a credit facility with a group of bank lenders. Wells Fargo Bank, N.A. acts as administrative agent. Effective December 20, 2013, the Company amended and restated its credit facility (the Revolving Credit Facility) to adjust the borrowing base, increase the maximum commitment to $750 million, and allow for the Second Lien note payable (see below). The maturity date of the Revolving Credit Facility is January 1, 2017. As of December 31, 2015 and 2014, the Company had a borrowing base of $276 million and $250 million, respectively. As of December 31, 2015 and 2014, the Company had outstanding borrowings of $271 million and $192 million, respectively. On each borrowing, the Company has the
F-84
VANTAGE ENERGY, LLC
Notes to Consolidated Financial Statements (Continued)
December 31, 2015 and 2014
(3) Long-Term Debt (Continued)
election to pay interest at a Base rate or Eurodollar LIBOR. The margin on Base rate loans ranges from 0.75% to 1.75%. The margin on LIBOR loans ranges from 1.75% to 2.75%. The Company pays quarterly commitment fees ranging from 0.375% to 0.500% of the unused borrowing base. The Company generally elects to pay interest based on LIBOR, plus the applicable margin, which was 3.18% in total as of December 31, 2015.
As of December 31, 2015, the Revolving Credit Facility was collateralized by all of the Company's assets, including its 50% operated interest in the Vantage Midstream assets.
The Revolving Credit Facility contains certain financial covenants, including maintenance of a minimum current ratio, a minimum interest coverage ratio, and a minimum asset coverage ratio. As of December 31, 2015, the Company was not in compliance with the minimum current ratio covenant under the Revolving Credit Facility. On May 10, 2016, the Company entered into the Fifth Amendment to the Second Amended and Restated Credit Agreement (Fifth Amendment), which included among other things, an equity cure right, applied retroactively to December 31, 2015, applicable to the Company's covenants under its credit agreement. The Company executed a $20 million capital call from its current equity owners during the first quarter of 2016, and such equity was included in the calculation of the current ratio covenant as of December 31, 2015, and, as a result, the Company was in compliance with all of its financial covenants as of December 31, 2015.
(b) Second Lien Term Loan
In December 2013, the Company entered into a Second Lien note payable (Second Lien note payable) with a face amount of $200 million, maturing on December 20, 2018. The Company has the election to pay interest at a Base rate or Eurodollar LIBOR. The margin on Base rate loans is 6.50%. The margin on LIBOR loans is 7.50%. LIBOR has a floor of 1.00%. As of December 31, 2015, the stated interest rate was 8.50%, and approximately $196 million was outstanding. The Second Lien note payable contains an optional prepayment provision that enables the Company to prepay the Second Lien note payable at par. The Second Lien note payable was issued with an original issue discount of $2.0 million, which has been classified as a reduction to the note balance. The discount is amortized over the term of the note using the effective interest method. The Second Lien note payable requires quarterly principal payments of $500,000, which commenced March 31, 2014.
As of December 31, 2015, the Second Lien note payable was collateralized by a second lien interest in all of the Company's assets, including its 50% operated interest in the Vantage Midstream assets, and contains certain financial covenants. These covenants include maintenance of a minimum asset coverage ratio. As of December 31, 2015 and 2014, the Company was in compliance with this financial covenant.
The Company recognized gross interest expense of approximately $23.7 million and $19.1 million during the years ended December 31, 2015 and 2014, respectively.
F-85
VANTAGE ENERGY, LLC
Notes to Consolidated Financial Statements (Continued)
December 31, 2015 and 2014
(3) Long-Term Debt (Continued)
Maturities of long-term debt as of December 31, 2015 (including current maturities, excluding unamortized debt discounts) are as follows (in thousands):
|
| Revolving Credit Facility |
| Second Lien |
| ||||
| | | | | | | ||||
Year ending December 31, |
| | | | | ||||
2016 |
| | $ | — | | | 2,000 | | |
2017 |
| | 271,000 | | | 2,000 | | ||
2018 |
| | — | | | 192,000 | | ||
| | | | | | | ||||
Total future maturities of long-term debt |
| | $ | 271,000 | | | 196,000 | | |
| | | | | | | ||||
| | | | | | | | | ||
| | | | | | | ||||
(4) Fair Value Measurements
Authoritative guidance defines fair value as the price that would be received to sell an asset or paid to transfer a liability (an exit price) in an orderly transaction between market participants at the measurement date. The guidance establishes a hierarchy for inputs used in measuring fair value that maximizes the use of observable inputs and minimizes the use of unobservable inputs by requiring that the most observable inputs be used when available. Observable inputs are inputs that market participants would use in pricing the asset or liability based on market data obtained from sources independent of the Company. Unobservable inputs are inputs that reflect the Company's assumptions of what market participants would use in pricing the asset or liability developed based on the best information available in the circumstances. The hierarchy is broken down into three levels based on the reliability of the inputs as follows:
| Level 1: | | Quoted prices are available in active markets for identical assets or liabilities |
Level 2: |
|
Quoted prices in active markets for similar assets and liabilities that are observable for the asset or liability |
Level 3: |
|
Unobservable pricing inputs that are generally less observable from objective sources, such as discounted cash flow models or valuations |
The assets and liabilities are classified based on the lowest level of input that is significant to the fair value measurement. The Company's policy is to recognize transfers in to and/or out of the fair value hierarchy as of the end of the reporting period in which the event or change in circumstances caused the transfer. The Company has consistently applied the valuation techniques discussed below in all periods presented. The following tables present the Company's financial
F-86
VANTAGE ENERGY, LLC
Notes to Consolidated Financial Statements (Continued)
December 31, 2015 and 2014
(4) Fair Value Measurements (Continued)
assets and liabilities that were accounted for at fair value on a recurring basis as of December 31, 2015 and 2014, by level, within the fair value hierarchy (in thousands):
|
| December 31, 2015 |
| ||||||||||||||||
|
| Fair value measurements |
| ||||||||||||||||
Description |
| Level 1 |
| Level 2 |
| Level 3 |
| Total |
| ||||||||||
Assets: |
| | | | | | | | | | | ||||||||
Commodity derivative instruments |
| | $ | — | | | | 56,623 | | | | — | | | 56,623 | | |||
Liabilities: |
| | | | | | | | | | | ||||||||
Commodity derivative instruments |
| | $ | — | | | | — | | | | — | | | — | | |||
|
| December 31, 2015 |
| ||||||||||||||||
|
| Fair value measurements |
| ||||||||||||||||
Description |
| Level 1 |
| Level 2 |
| Level 3 |
| Total |
| ||||||||||
Assets: |
| | | | | | | | | | | ||||||||
Commodity derivative instruments |
| | $ | — | | | | 71,668 | | | | — | | | 71,668 | | |||
Liabilities: |
| | | | | | | | | | | ||||||||
Commodity derivative instruments |
| | $ | — | | | | 1,183 | | | | — | | | 1,183 | | |||
The Company's commodity derivative instruments consist of variable-to-fixed price swaps. The fair values of the swap agreements are determined under the income valuation technique using a discounted cash flow model. The valuation model requires a variety of inputs, including contractual terms, published forward prices, and discount rates as appropriate. The Company's estimates of fair value of commodity derivative instruments include consideration of the counterparties' creditworthiness, the Company's creditworthiness, and the time value of money. The consideration of these factors results in an estimated exit price for each derivative asset or liability under a marketplace participant's view. All of the significant inputs are observable, either directly or indirectly; therefore, the Company's derivative instruments are included within the Level 2 fair value hierarchy. The counterparties on the Company's derivative instruments are the same financial institutions that hold the Revolving Credit Facility. Accordingly, the Company is not required to post collateral on these derivatives since the banks are secured by the Company's oil and gas assets.
Non-Recurring Fair Value Measurements
The Company uses the income valuation technique using a discounted cash flow model to estimate the initial fair value of asset retirement obligations using estimated gross well costs of reclamation in amounts ranging from $10,000 to $100,000, timing of expected future dismantlement costs ranging from 1 year to 28 years, and a weighted average credit-adjusted risk-free rate. Accordingly, the fair value is based on unobservable pricing inputs and, therefore, is included within the Level 3 fair value hierarchy. During the years ended December 31, 2015 and 2014, the Company recorded liabilities for asset retirement obligations of $0.6 million and $1.7 million, respectively. See note 5 for additional information.
F-87
VANTAGE ENERGY, LLC
Notes to Consolidated Financial Statements (Continued)
December 31, 2015 and 2014
(4) Fair Value Measurements (Continued)
Other Financial Instruments
Other financial instruments not measured at fair value on a recurring basis include cash and cash equivalents, accounts receivable, accounts payable, accrued liabilities, and long-term debt. With the exception of long-term debt, the financial statement carrying amounts of these items approximate their fair values due to their short-term nature.
(5) Asset Retirement Obligations
The following table presents the reconciliation of the beginning and ending aggregate carrying amount of the obligations associated with the retirement of oil and gas properties and gathering system.
|
| December 31 |
| ||||
| | | | | | | ||
|
| 2015 | | 2014 |
| ||
| | | | | | | ||
|
| (In thousands) | | ||||
Beginning of year |
| $ | 7,666 | | 6,156 | | |
Liabilities incurred |
| 635 | | 1,719 | | ||
Accretion expense |
| 105 | | 295 | | ||
Asset dispositions |
| (247 | ) | (417 | ) | ||
Revisions to estimate |
| 307 | | (87 | ) | ||
| | | | | | | ||
End of year |
| 8,466 | | 7,666 | | ||
Less current portion |
| — | | (12 | ) | ||
| | | | | | | ||
Noncurrent portion |
| $ | 8,466 | | 7,654 | | |
| | | | | | | ||
| | | | | | | ||
| | | | | | | ||
(6) Commodity Derivative Instruments
The Company is exposed to certain risks relating to its ongoing business operations, including risks related to commodity prices. The Company is focused on maintaining an active hedging program using commodity derivative financial instruments to achieve a more predictable cash flow by reducing its exposure to commodity price fluctuations and regional basis differential exposure in an effort to protect its capital investment program, as well as expected future cash flows. The Company's risk management activity is generally accomplished through over-the-counter commodity derivative contracts with large financial institutions. The Company currently uses fixed price natural gas swaps for which it receives a fixed swap price for future production in exchange for a payment of the variable market price received at the time future production is sold.
While the use of these instruments limits the downside risk of adverse price changes, their use may also limit future revenue from favorable price changes. The Company has adopted fair value accounting for its derivatives; therefore, changes in the fair value of derivative financial instruments are recognized in earnings. Cash payments or receipts on such contracts are included in cash flows from operating activities in our consolidated statements of cash flows.
F-88
VANTAGE ENERGY, LLC
Notes to Consolidated Financial Statements (Continued)
December 31, 2015 and 2014
(6) Commodity Derivative Instruments (Continued)
At December 31, 2015, the terms of outstanding commodity derivative contracts were as follows:
Commodity |
| Quantity remaining |
| Prices | | Price index | | Contract period |
| Estimated fair value |
| ||||
| | | | | | | | | | | | | ||||
|
| | | | | (In thousands) | | ||||||||
Crude oil swaps (Bbls) |
| 31,116 | | $44.91 - $47.00 | | NYMEX WTI | | 1/16 - 12/16 | | | $ | 131 | | | |
Natural gas swaps (MMBtu): |
| | | | | | | | |||||||
Dominion |
| 39,845,100 | | $1.64 - $3.13 | | Dominion South Point | | 1/16 - 12/19 | | | 25,744 | | | ||
WAHA |
| 47,206,700 | | $2.36 - $3.88 | | WAHA | | 1/16 - 12/19 | | | 28,760 | | | ||
NYMEX Henry Hub |
| — | | — | | NYMEX Henry Hub | | — | | | — | | | ||
| | | | | | | | | | | | | ||||
Total |
| 87,051,800 | | | | | | 54,504 | | | |||||
| | | | | | | | | | | | | ||||
NGLs Swaps (Gal): |
| | | | | | | | |||||||
Ethane |
| 18,241,296 | | $0.18 - $0.20 | | OPIS MB Ethane | | 1/16 - 12/17 | | | 478 | | | ||
Propane |
| — | | — | | OPIS MB Propane | | — | | | — | | | ||
TetPropane |
| 6,969,564 | | $0.40 - $0.62 | | OPIS MB TetPropane | | 1/16 - 12/17 | | | 790 | | | ||
IsoButane |
| 2,197,082 | | $0.52 - $0.76 | | OPIS MB IsoButane | | 1/16 - 12/17 | | | 226 | | | ||
Normal butane |
| 997,078 | | $0.52 - $0.75 | | OPIS MB NButane | | 1/16 - 12/17 | | | 112 | | | ||
Natural gasoline |
| 2,318,566 | | $0.83 - $1.22 | | OPIS MB Nat Gasoline | | 1/16 - 12/17 | | | 382 | | | ||
| | | | | | | | | | | | | ||||
Total |
| 30,723,586 | | | | | | 1,988 | | | |||||
| | | | | | | | | | | | | ||||
| | | | | | | | | | | | | | | ||
| | | | | | | | | | | | | | | ||
|
| | | Total commodity derivatives | | | | $ | 56,623 | | | ||||
| | | | | | | | | | | | | ||||
| | | | | | | | | | | | | | | ||
| | | | | | | | | | | | | ||||
The Company estimates that 2016 hedged volumes, in aggregate, represent approximately 78% of the Company's estimated proved production for 2016, based upon the year-end external reserve report.
Depending on changes in oil and gas futures markets and management's view of underlying supply and demand trends, we may increase or decrease our hedging positions.
The Company classifies the fair value amounts of derivative assets and liabilities as net current or noncurrent derivative assets or net current or noncurrent derivative liabilities, whichever the case may be, by commodity and by counterparty. The Company enters into derivatives under a master netting arrangement with two counterparties, which, in an event of default, allows the Company to offset payables to and receivables from the defaulting counterparties.
F-89
VANTAGE ENERGY, LLC
Notes to Consolidated Financial Statements (Continued)
December 31, 2015 and 2014
(6) Commodity Derivative Instruments (Continued)
The following tables provide reconciliation between the net assets and liabilities reflected in the accompanying consolidated balance sheets and the potential effects of master netting arrangements on the gross fair value of the derivative contracts:
|
| | December 31, 2015 |
| ||||||||||||||
| | | | | | | | | | | |||||||||
|
| | Gross amounts |
| ||||||||||||||
| | | | | | | | | | | |||||||||
|
| Consolidated balance sheet classification |
| Gross recognized |
| Offset | | Net recognized |
| |||||||||
| | | | | | | | | | | |||||||||
|
| (In thousands) | | |||||||||||||||
Derivative assets: |
| | | | | | | | | | | |||||||
Commodity contracts |
| Current assets | | | $ | 41,242 | | | | (298 | ) | | | 40,944 | | | ||
Commodity contracts |
| Noncurrent assets | | | 15,872 | | | | (193 | ) | | | 15,679 | | | |||
| | | | | | | | | | | |||||||||
Total derivative assets |
| | | $ | 57,114 | | | | (491 | ) | | | 56,623 | | | |||
| | | | | | | | | | | |||||||||
| | | | | | | | | | | | | | | | | |||
| | | | | | | | | | | |||||||||
Derivative liabilities: |
| | | | | | | | | | | |||||||
Commodity contracts |
| Current liabilities | | | $ | 298 | | | | (298 | ) | | | — | | | ||
Commodity contracts |
| Noncurrent liabilities | | | 193 | | | | (193 | ) | | | — | | | |||
| | | | | | | | | | | |||||||||
Total derivative liabilities |
| | | $ | 491 | | | | (491 | ) | | | — | | | |||
| | | | | | | | | | | |||||||||
| | | | | | | | | | | | | | | | | |||
| | | | | | | | | | | |||||||||
|
| | December 31, 2014 |
| ||||||||||||||
| | | | | | | | | | | |||||||||
|
| | Gross amounts |
| ||||||||||||||
| | | | | | | | | | | |||||||||
|
| Consolidated balance sheet classification |
| Gross recognized |
| Offset | | Net recognized |
| |||||||||
| | | | | | | | | | | |||||||||
|
| (In thousands) | | |||||||||||||||
Derivative assets: |
| | | | | | | | | | | |||||||
Commodity contracts |
| Current assets | | | $ | 66,586 | | | | (386 | ) | | | 66,200 | | | ||
Commodity contracts |
| Noncurrent assets | | | 5,653 | | | | (185 | ) | | | 5,468 | | | |||
| | | | | | | | | | | |||||||||
Total derivative assets |
| | | $ | 72,239 | | | | (571 | ) | | | 71,668 | | | |||
| | | | | | | | | | | |||||||||
| | | | | | | | | | | | | | | | | |||
| | | | | | | | | | | |||||||||
Derivative liabilities: |
| | | | | | | | | | | |||||||
Commodity contracts |
| Current liabilities | | | $ | 1,569 | | | | (386 | ) | | | 1,183 | | | ||
Commodity contracts |
| Noncurrent liabilities | | | 185 | | | | (185 | ) | | | — | | | |||
| | | | | | | | | | | |||||||||
Total derivative liabilities |
| | | $ | 1,754 | | | | (571 | ) | | | 1,183 | | | |||
| | | | | | | | | | | |||||||||
| | | | | | | | | | | | | | | | | |||
| | | | | | | | | | | |||||||||
F-90
VANTAGE ENERGY, LLC
Notes to Consolidated Financial Statements (Continued)
December 31, 2015 and 2014
(6) Commodity Derivative Instruments (Continued)
The table below summarizes the realized and unrealized gains and losses related to the Company's derivative instruments. These realized and unrealized gains and losses are recorded in the accompanying consolidated statements of operations.
|
| Location of gain (loss) | | Year ended December 31 |
| ||||
| | | | | | | | | ||
|
| recognized in earnings | | 2015 | | 2014 |
| ||
| | | | | | | | | ||
|
| | (In thousands) | | |||||
Commodity derivative instruments: |
| | | | |||||
Realized (loss) gains on derivatives |
| Operating revenue | | $ | 83,431 | | (204 | ) | |
Unrealized gain on commodity derivatives, net |
| Operating revenue | | (13,862 | ) | 66,819 | | ||
| | | | | | | | | ||
Total realized and unrealized gains recorded, net |
| | $ | 69,569 | | 66,615 | | ||
| | | | | | | | | ||
| | | | | | | | | ||
| | | | | | | | | ||
Due to the volatility of oil and natural gas prices, the estimated fair values of the Company's commodity derivative instruments are subject to large fluctuations from period to period.
Derivative Novations
In January 2014, the Company entered into an agreement to transfer certain derivative contracts to Vantage II, as approved by Wells Fargo Bank, N.A. The Company determined the total fair value of the derivative contracts on the date of transfer to be approximately $(0.3) million.
(7) Related Party Transactions
(a) Gas Gathering System Operating Agreement
In connection with the Joint Development Agreement between the Company and Vantage II, Vantage Midstream became the operator of the gas gathering assets. Pursuant to a Gas Gathering System Operating Agreement, dated August 2, 2012, between the Company and Vantage Midstream, the Company and Vantage II are to pay their respective 50% shares of the gas gathering system's operating and development costs, as well as their incurred gas gathering and compression fees. The Company was charged gas gathering and compression fees by Vantage Midstream of $5.4 million and $3.0 million for the years ended December 31, 2015 and 2014, respectively.
(b) Water Investment
Pursuant to the Water Services and Supply Agreement, Vantage Midstream provides water services required in the Company's drilling operations. The Company paid fees to Vantage Midstream of $4.5 million for the year ended December 31, 2015.
(c) Management Services Agreement
In August 2012, the Company and Vantage II entered into a Management Services Agreement (MSA) whereby the Company is to provide certain executive management, administrative, accounting, finance, engineering, land, and information technology assistance to Vantage II. In
F-91
VANTAGE ENERGY, LLC
Notes to Consolidated Financial Statements (Continued)
December 31, 2015 and 2014
(7) Related Party Transactions (Continued)
exchange for receiving these services, Vantage II will pay the Company a fee (the MSA Fee). Through June 2014, the MSA Fee was calculated as 50% of the overall gross general and administrative expenses incurred by the Company. Starting in July 2014, the MSA Fee was allocated based upon the gross general and administrative expenses incurred by the Company multiplied by a ratio of the relative capital expenditures and oil and natural gas production volumes of the Company and Vantage II. Certain adjustments are made to this calculation to reflect the allocation of general and administrative expenses to Vantage Midstream. The Company billed general and administrative expenses under the MSA to Vantage II of approximately $12.0 million and $8.7 million for the years ended December 31, 2015 and 2014, respectively.
(d) MIU Notes Receivable
In December 2014, the Company made loans to certain employees in the form of notes receivable. Interest accrues on the notes at 0.34% per annum, and the notes mature upon the earlier to occur of: 1) December 1, 2017; 2) consummation of Monetization Event (as defined); or 3) fifteen days after the date of voluntary termination of employment by the employee or termination by the Company for cause. As of December 31, 2015, the notes had a balance of $1.4 million and are classified in other assets in the accompanying consolidated balance sheets. The notes are collateralized by a first lien interest in each employees' Management Incentive Units (MIUs) and all potential dividends and distributions and a second lien on all other personal assets. Interest income was deemed de minimus for the year ended December 31, 2015.
(8) Commitments and Contingencies
The Company leases office spaces in Colorado, Pennsylvania, and Texas under noncancelable operating leases that expire in 2017 and 2016, respectively. Rent expense for the years ended December 31, 2015 and 2014 was $0.4 million and $0.3 million, respectively. Future minimum lease payments under these leases are approximately $0.7 million for the period from November 2015 to June 2017, of which a portion will be allocated between the Company and Vantage II.
On August 22, 2008, the Company secured a letter of credit in the amount of $0.1 million with Wells Fargo Bank, N.A. in connection with the signing of an exploration agreement. Partial draws under this letter of credit are permitted. As of December 31, 2015, no amounts have been drawn under the letter of credit.
As part of a Founder's employment agreement, the Company will pay $0.5 million to such Founder provided all of the following conditions have been met:
- i.
- The
Company's invested capital equals $250 million or greater
- ii.
- Monetization
events aggregating at least $500 million in proceeds have been completed
- iii.
- Distributions to Capital Interest Members are sufficient, in part, to exceed the Second Threshold, as defined in the LLC Agreement.
As of December 31, 2015, none of the $0.5 million has been accrued, as fulfillment of the above criteria has not been deemed probable.
F-92
VANTAGE ENERGY, LLC
Notes to Consolidated Financial Statements (Continued)
December 31, 2015 and 2014
(8) Commitments and Contingencies (Continued)
Effective August 1, 2010, and amended in October 2014, the Company entered into a gas gathering agreement related to its Lake Arlington project in Tarrant County, Texas, which committed the Company to transport a minimum quantity of natural gas for seven years starting on the date gas is first delivered. If the Company transports more than the minimum quantity, the Company will receive a credit for excess transported gas, calculated as actual quantity transported, less minimum transportation quantity, multiplied by a stated dollar amount per MMBtu. This credit can be used to offset shortfalls incurred, if any, in the year immediately before or after the excess quantity was incurred. As of December 31, 2015, remaining total minimum revenue commitments due over the term of the agreement aggregate to $14.8 million The portion of the remaining minimum commitment that is due in 2016 totals $0.6 million as of December 31, 2015, subject to a rollover provision in the agreement that permits the Company to roll a portion of any deficit commitment to the subsequent period.
Effective August 1, 2013, the Company entered into a gas gathering agreement related to its Wedgwood project in Tarrant County, Texas, under which the Company is required to make a minimum revenue commitment of $8.8 million over four years starting on the date gas is first delivered. The gas gathering fee on which the minimum revenue commitment is based is $0.55 per MMBtu, and remains at that level under the agreement until the Company sells 20,000,000 MMBtu from its Wedgewood project, at which time the gas gathering fee reduces to $0.34 per MMBtu for all subsequent volumes. As of December 31, 2015, the Company had a remaining total commitment of $4.4 million The portion of the remaining minimum revenue commitment that is due in 2016 totals $0.3 million as of December 31, 2015, subject to a rollover provision in the agreement that permits the Company to roll a portion of any deficit obligations to the subsequent period.
On April 17, 2014, the Company entered into a 20,000 MMBtu/d firm marketing agreement to market a portion of our production associated with volumes produced in the Marcellus Shale. The agreement began in October 2014 and continues through October 2020. Under the contract, the Company is paid based on TETCO M-2 pricing with the ability to share in downstream price upside when market conditions allow.
On May 9, 2014, the Company entered in a 37,500 MMBtu/d firm marketing agreement to market a portion of our production associated with volumes produced in the Marcellus Shale. The agreement began in November 2014 and continues through October 2019. Under the contract, the Company is paid based on TETCO M-2 pricing.
As of December 31, 2015, the Company, as a counterparty along with Vantage II, had contracts with certain rig operators and pipe suppliers totaling approximately $2.3 million of commitments for 2015.
From time to time, the Company is party to litigation. The Company maintains insurance to cover certain actions and believes that resolution of such litigation will not have a material adverse effect on the Company.
F-93
VANTAGE ENERGY, LLC
Notes to Consolidated Financial Statements (Continued)
December 31, 2015 and 2014
(9) Capital Structure
Summarized below are the four classes of interests that have been authorized:
- a)
- Capital
Interests (excluding interests acquired under the Leveraged Investment Program)
- b)
- Class A
Management Incentive Units
- c)
- Class B
Management Incentive Units
- d)
- Class C Management Incentive Units.
Effective July 1, 2010, the Members approved the Fourth Amendment to the Company's Limited Liability Company Agreement (the Fourth Amendment) creating the Class C Management Incentive Units. The Company offered each holder of Class A Management Incentive Units and Class B Management Incentive Units, who was employed by the Company on July 1, 2010, the opportunity to exchange all of such Units held by such holders for new Class C Management Incentive Units. In addition, the Fourth Amendment provided for the return of $1.4 million of capital contributions to certain Members to maintain consistent capital commitment contribution percentages among all Members. Effective August 1, 2012, the Members entered into a Second Amended and Restated Limited Liability Company Agreement (the Agreement).
(a) Capital Interests
Capital Interests are issued to Members from time to time, in exchange for a Member's capital commitment to make cash contributions when called by the Company pursuant to the terms as described in the Agreement.
Total capital contributions and deemed commitments associated with outstanding Capital Interests are as follows:
|
| December 31 |
| ||||
| | | | | | | ||
|
| 2015 | | 2014 |
| ||
| | | | | | | ||
|
| (In thousands) | | ||||
Institutional investors (deemed commitment — $470,559) |
| $ | 420,940 | | 420,940 | | |
Founders (deemed commitment — $6,281) |
| 5,788 | | 5,788 | | ||
Other employees (deemed commitment — $2,169) |
| 2,055 | | 2,055 | | ||
Friends and family (deemed commitment — $6,225) |
| 5,568 | | 5,569 | | ||
| | | | | | | ||
Total (total deemed commitment — $485,234) |
| $ | 434,351 | | 434,352 | | |
| | | | | | | ||
| | | | | | | ||
| | | | | | | ||
As of December 31, 2015 and 2014, the Company had undrawn commitments of $50.9 million Member contributions on the consolidated balance sheets are net of equity issuance costs of approximately $0.4 million and $0.3 million as of December 31, 2015 and 2014, respectively.
Members are entitled to preferred distributions in an amount equal to 8% per annum. As it relates to Class C Management Incentive Units, preferred distributions are compounded annually beginning on July 1, 2010 on the sum of $135 million plus any capital contributions made by Members subsequent to July 1, 2010. Preferred distributions are paid only if distributable cash, as defined in the Agreement, is available. As of December 31, 2015 and 2014, accumulated but
F-94
VANTAGE ENERGY, LLC
Notes to Consolidated Financial Statements (Continued)
December 31, 2015 and 2014
(9) Capital Structure (Continued)
undeclared and unpaid preferred distributions related to the Class C Management Incentive Units approximated $124.4 million and $94.2 million, respectively.
The amount of accumulated preferred distributions is also used to determine the size of any payments that may be made to holders of Management Incentive Units. With respect to calculating payments, if any, to holders of the Class C Management Incentive Units, the actual amount of accumulated but undeclared preferred distributions with respect to the Capital Interests as described in the preceding paragraph is determinative. For purposes of calculating payments, if any, to holders of the Class A Management Incentive Units who did not exchange their Class A Management Incentive Units for new Class C Management Incentive Units, preferred distributions are accrued from the dates that capital contributions were made to the calculation date and are based on the full amount of all such capital contributions. As of December 31, 2015 and 2014, accumulated but undeclared and unpaid preferred distributions related to the Class A Management Incentive Units approximated $282.6 million and $229.5 million, respectively.
Decisions of the Company are approved by the majority of the Company's board of managers. As of December 31, 2015, the Company's board of managers comprised seven managers, including five appointed by the Institutional Investors, and the two Founders. The Founders may elect to appoint an additional independent manager.
The Company has the right, but not the obligation, to repurchase all Capital Interests and vested Management Incentive Units of employee Members, who are terminated for any reason, at the Units' estimated fair value under the conditions provided for in the Agreement, except that this right does not exist with respect to the death or disability of any Founder. If an employee Member is terminated for cause, his or her Management Incentive Units, whether vested or unvested, will be forfeited, and his or her Capital Interests may be repurchased for the lesser of the aggregate unreturned capital contributions of such Member or fair market value. Upon termination of employment without cause or due to death or disability, the Founders/heirs may put their Capital Interests to the Company at fair market value. The put option cannot be exercised if a Founder voluntarily terminates employment or is terminated for cause.
Distributions of funds associated with Capital Interests defined above follow a prescribed framework, which is outlined in detail in the Agreement. In general, distributions are first made to those Members who have made capital contributions until such Members receive the sum of $135 million plus any additional capital contributions made subsequent to July 1, 2010 plus an 8% per annum return from July 1, 2010, as described above. Subsequent distributions are then allocated 85% to the holders of Capital Interests in accordance with specified sharing ratios and 15% to the holders of Management Incentive Units. The 15% incentive pool is allocated based on the number of Class C Management Incentive Units, taking into consideration payments made to holders of any remaining Class A Management Incentive Units that have not been exchanged for Class C Management Incentive Units. In addition, depending on amounts due from or to participants in the Leveraged Investment Program, certain distributions may be made to or by such participants upon a monetization event.
The Capital Interests are illiquid and subject to substantial transfer restrictions and have certain drag-along and tag-along rights as provided with the agreement.
F-95
VANTAGE ENERGY, LLC
Notes to Consolidated Financial Statements (Continued)
December 31, 2015 and 2014
(9) Capital Structure (Continued)
Upon termination of employment without cause or due to death or disability, the Founders/heirs may put their Class I Units to the Company at fair market value. Upon the occurrence of death or disability, the exercise of this put right is at the discretion of the Founders/heirs, which is an event outside of the Company's control. Under the standard codified within ASC 480, "Accounting for Certain Financial Instruments with Characteristics of Both Liabilities and Equity" and Emerging Issues Tax Force ("EITF") Topic D-98, stock subject to redemption requirements outside the control of the Company are required to be classified outside of permanent equity. Accordingly, the Founders' equity is classified outside of members' equity. The occurrence of these events is not deemed probable, and therefore, the Founders equity has been measured at historic cost. The put option cannot be exercised if a Founder voluntarily terminates employment or is terminated for cause
(b) Leveraged Investment Program
Between December 18, 2006 and June 19, 2009, and at the time of employment for employees first employed between June 16, 2008 and June 17, 2009, the Company was authorized to issue to employees who are also Capital Interest Members up to $15 million of Leveraged Amounts. The Leveraged Amounts are limited recourse notes, collateralized by both the Capital Interests acquired independently of the Leveraged Investment Program amounts and the Capital Interests acquired through the Leveraged Investment Program amounts, but otherwise nonrecourse to the Capital Interest Members. The participants have significant capital at risk outside the Leveraged Amounts and therefore no compensation is derived from these notes. The notes mature only upon the occurrence of a sale of the Company.
In connection with the Fourth Amendment, participants in the Leveraged Investment Program who were current employees were given the opportunity to surrender and relinquish their right to participate in the remaining undrawn portion of the Leveraged Investment Program, which represented 41.5% of such participants' allocated Leveraged Amounts under the Leveraged Investment Program. As of December 31, 2010, participants had surrendered the right to participate in $1.6 million aggregate Leveraged Amounts under the Plan.
The terms of the notes issued under the Leveraged Investment Program provide for interest to accrue at 5.0% per annum. As the interest due to the Company on these notes will be withheld out of future distributions, interest income will be recognized at the time such distributions are paid. As of December 31, 2015 and 2014, interest income accumulated, but not recognized, approximated $2.4 million and $2.0 million, respectively. The total Leverage Investment Capital since inception through December 31, 2015 is $5.3 million.
(10) Management Incentive Units
The Company has issued management incentive units to certain employees. The management incentive units participate only in distributions in liquidation events, meeting requisite financial thresholds after Capital Interests have recovered their investment and special allocation amounts. Management incentive units have no voting rights. Compensation expense for these awards will be recognized when all performance, market, and service conditions are probable of being satisfied (in general, upon a liquidating event). Accordingly, no value was assigned to the interests when issued.
F-96
VANTAGE ENERGY, LLC
Notes to Consolidated Financial Statements (Continued)
December 31, 2015 and 2014
(10) Management Incentive Units (Continued)
Upon termination of employment upon death or disability, the Founders/heirs may put their management incentive units to the Company at fair market value. The put option cannot be exercised if a Founder voluntarily terminates employment or is terminated for a cause.
(a) Class A Management Incentive Units
The Management Incentive Plan, as described in the Agreement, authorizes up to 1,000,000 nonvoting, Class A Management Incentive Units. In connection with the Fourth Amendment, holders of Class A Management Incentive Units who were employed by the Company on July 1, 2010 were offered the opportunity to exchange their Class A Management Incentive Units for newly issued Class C Management Incentive Units. No new Class A Management Incentive Units may be issued following the Fourth Amendment. As of December 31, 2015 and 2014, 109,171 and 110,171 Class A Management Incentive Units were outstanding, respectively. For financial reporting purposes, no related compensation expense has been recorded as of and for the years ended December 31, 2015 and 2014.
Prior to the Fourth Amendment, certain Class A Management Incentive Units vest on a schedule of 20% at the end of each of the first four years following the date of grant, with the final 20% vesting only upon the occurrence of a sale of the Company. Other Class A Management Incentive Units vest 100% upon the occurrence of a sale of the Company. As of December 31, 2015 and 2014, 109,171 and 110,171 Class A Management Incentive Units were vested and outstanding, respectively.
(b) Class B Management Incentive Units
The Management Incentive Plan, as described in the Agreement, authorizes up to 45 Class B Management Incentive Units. In connection with the Fourth Amendment, holders of Class B Management Incentive Units were offered the opportunity to exchange their Class B Management Incentive Units for newly issued Class C Management Incentive Units. No new Class B Management Incentive Units may be issued following the Fourth Amendment. All holders of Class B Management Incentive Units accepted such offer; thus, at December 31, 2015 and 2014, there were no Class B Management Incentive Units outstanding.
(c) Class C Management Incentive Units
The 2010 Management Incentive Plan, as described in the Fourth Amendment, authorizes up to 1,818,182 nonvoting, Class C Management Incentive Units. In connection with the Fourth Amendment, holders of Class A Management Incentive Units and Class B Management Incentive Units who were employed by the Company on July 1, 2010 were offered the opportunity to exchange their Class A Management Incentive Units and Class B Management Incentive Units for newly issued Class C Management Incentive Units. Holders of 564,182 Class A Management Incentive Units exchanged such Units for 564,182 Class C Management Incentive Units, and holders of all of the 45 outstanding Class B Units exchanged such Units for 894,195 Class C Management Incentive Units. As of December 31, 2015 and 2014, 1,630,604 and 1,698,479 Class C Management Incentive Units were outstanding, respectively.
F-97
VANTAGE ENERGY, LLC
Notes to Consolidated Financial Statements (Continued)
December 31, 2015 and 2014
(10) Management Incentive Units (Continued)
The Class C Management Incentive Units vest on a schedule of 15% if the holder has been employed by the Company on a full-time basis for each of three, four, and five years beginning on the date of grant, with the final 55% to vest only upon the occurrence of a sale of the Company, provided that the Company gives employees up to two full years' credit against the vesting schedule for employment prior to the date of grant. In addition, there is accelerated vesting for each Founder of up to 50% of the Class C Management Units held by such Founder if his employment is terminated by the Company without cause. As of December 31, 2015 and 2014, 715,909 and 675,322 Class C Management Incentive Units, respectively, were vested.
The following table presents the activity for Class C Management Incentive Units outstanding:
|
| Units |
| |
| | | | | |
Outstanding — January 1, 2014 |
| 1,751,479 | | |
Granted |
| | ||
Forfeited |
| (53,000 | ) | |
| | | | | |
Outstanding — December 31, 2014 |
| 1,698,479 | | |
Granted |
| 24,500 | | |
Forfeited |
| (92,375 | ) | |
| | | | | |
Outstanding — December 31, 2015 |
| 1,630,604 | | |
| | | | | |
| | | | | |
| | | | | |
(11) Employee Retirement Savings Plan
The Company sponsors a qualified tax-deferred savings plan (Retirement Savings Plan) for its employees in accordance with the provisions of Section 401(k) of the Internal Revenue Code. Employees may defer up to 80% of their compensation, subject to certain limitations. Effective May 1, 2007, the Company's matching percentage is up to 6% of eligible employee compensation. For the years ended December 31, 2015 and 2014, expenses associated with the Company's contributions to the Retirement Saving Plan totaled approximately $0.5 million and $0.4 million, respectively. The Company matches all employee contributions in cash.
(12) Liquidity
The Revolving Credit Facility matures on January 1, 2017. The Company expects to repay and retire the Revolving Credit Facility and the Second Lien note payable in connection with the net proceeds from the completion of the public offering and cash on hand. Additionally, the Company plans to obtain new financing following the anticipated corporate reorganization, contemporaneous with the offering.
In the event that some deficiency exists between the proceeds of the offering or the terms of the new facility and the Company's current facility, as of December 31, 2015 the Company has available undrawn capacity under its existing borrowing base of $5 million and available undrawn capacity under its equity commitments of $51 million to address such a deficiency. In addition, the Company expects that it will be able to secure incremental equity commitments and other sources of capital, including debt, if necessary, from its current equity investors, other investors or lenders to
F-98
VANTAGE ENERGY, LLC
Notes to Consolidated Financial Statements (Continued)
December 31, 2015 and 2014
(12) Liquidity (Continued)
address any shortfall. The Company's current equity investors continue to be supportive of the Company's long-term growth and financing strategy.
While we anticipate engaging in active dialogue with our creditors and the potential public offering, at this time we are unable to predict the outcome of such or whether any such efforts to raise additional equity will be successful.
(13) Segment Reporting
In accordance with Accounting Standards Codification No. 280 — Segment Reporting, the Company periodically assesses whether there are changes in its operating and reporting segments. The Company has evaluated how the chief operating decision maker analyzes performance and allocates resources and has identified two reportable segments: the exploration and production segment and the midstream segment. The exploration and production segment explores for and produces oil, natural gas, and NGLs. The midstream segment engages in natural gas gathering and transportation services as well as water services primarily for the Company and its affiliate under common management, Vantage II. Midstream assets are held though the Company's 50% working interest in Vantage Midstream.
To assess the performance of the Company's operating segments, the chief operating decision maker analyzes Adjusted EBITDA. The Company defines Adjusted EBITDA as income (loss) before income taxes; DD&A; impairments; interest expense, net of capitalized interest; and total (gains) losses on derivatives, net, less net cash from settlement of commodity derivatives. DD&A and impairments are excluded from Adjusted EBITDA as a measure of segment operating performance because capital expenditures are evaluated at the time capital costs are incurred. Similarly, total (gains) losses on derivatives, net, less net cash from settlement of commodity derivatives are excluded from Adjusted EBITDA because these (gains) losses are not considered a measure of asset operating performance. Management believes that the presentation of Adjusted EBITDA provides useful information in assessing the Company's financial condition and operating results as well as the profitability of our business segments.
Adjusted EBITDA is a widely accepted financial indicator; however, Adjusted EBITDA as defined by the Company may not be comparable to similarly titled measures used by other companies and should be considered in conjunction with net income (loss) and other performance
F-99
VANTAGE ENERGY, LLC
Notes to Consolidated Financial Statements (Continued)
December 31, 2015 and 2014
(13) Segment Reporting (Continued)
measures. Below is a reconciliation of consolidated Adjusted EBITDA to income (loss) before income taxes for the years ended December 31 (in thousands):
|
| 2015 | | 2014 |
| ||
| | | | | | | ||
Net income (loss) |
| $ | (292,938 | ) | 73,745 | | |
Interest expense, net of capitalized interest |
| 22,058 | | 17,575 | | ||
Total (gains) losses on derivatives, net, less net cash from settlement of commodity derivatives |
| 13,862 | | (66,819 | ) | ||
Depreciation, depletion, amortization, and accretion expense |
| 50,162 | | 37,908 | | ||
Impairment of oil and gas properties |
| 344,401 | | — | | ||
| | | | | | | ||
Adjusted EBITDA |
| $ | 137,545 | | 62,409 | | |
| | | | | | | ||
| | | | | | | ||
| | | | | | | ||
The following summarizes selected financial information for the Company's reporting segments (in thousands):
|
| For the year ended December 31, 2015 |
| ||||||||||||||||||
| | | | | | | | | | | ||||||||||||
|
| Exploration and Production Segment |
| Midstream Segment |
| Eliminations | | Consolidated Total |
| ||||||||||||
| | | | | | | | | | | ||||||||||||
Oil, gas, and NGL revenues |
| | $ | 84,575 | | | | $ | — | | | | $ | — | | | | $ | 84,575 | | |
Gas gathering and compression revenues |
| | — | | | | 15,756 | | | | (10,077 | ) | | | 5,679 | | | ||||
Water revenue |
| | — | | | | 5,487 | | | | (5,487 | ) | | | — | | | ||||
Gain on commodity derivatives |
| | 69,569 | | | | — | | | | — | | | | 69,569 | | | ||||
| | | | | | | | | | | ||||||||||||
Total revenues(1) |
| | 154,144 | | | | 21,243 | | | | (15,564 | ) | | | 159,823 | | | ||||
E&P operating expenses |
| | 38,364 | | | | — | | | | (10,077 | ) | | | 28,287 | | | ||||
Gathering and compression expenses |
| | — | | | | 1,834 | | | | — | | | | 1,834 | | | ||||
Water system expense |
| | — | | | | 4,185 | | | | (4,185 | ) | | | — | | | ||||
General and administrative expenses |
| | 4,851 | | | | 1,168 | | | | — | | | | 6,019 | | | ||||
| | | | | | | | | | | ||||||||||||
Total operating expenses |
| | 43,215 | | | | 7,187 | | | | (14,262 | ) | | | 36,140 | | | ||||
Total losses on derivatives, net, less net cash from settlement of commodity derivatives |
| | 13,862 | | | | — | | | | — | | | | 13,862 | | | ||||
| | | | | | | | | | | ||||||||||||
Adjusted EBITDA |
| | $ | 124,791 | | | | $ | 14,056 | | | | $ | (1,302 | ) | | | $ | 137,545 | | |
| | | | | | | | | | | ||||||||||||
| | | | | | | | | | | | | | | | | | | ||||
| | | | | | | | | | | ||||||||||||
Total assets(2) |
| | $ | 562,376 | | | | $ | 61,523 | | | | $ | (2,730 | ) | | | $ | 621,169 | | |
Capital expenditures(3) |
| | 191,136 | | | | 14,379 | | | | (1,301 | ) | | | 204,214 | | | ||||
- (1)
- Total
intrasegment revenues for the E&P segment and midstream segment were $0 and $20,135, respectively.
- (2)
- Included
in the total assets for the midstream segment is $662 for the net water investment, which is an other asset on the balance sheet.
- (3)
- Included in capital expenditures for the midstream segment is $1,512 for the water investment expenditures, which is an other asset on the balance sheet.
F-100
VANTAGE ENERGY, LLC
Notes to Consolidated Financial Statements (Continued)
December 31, 2015 and 2014
(13) Segment Reporting (Continued)
|
| For the year ended December 31, 2014 |
| ||||||||||||||||||
| | | | | | | | | | | ||||||||||||
|
| Exploration and Production Segment |
| Midstream Segment |
| Eliminations | | Consolidated Total |
| ||||||||||||
| | | | | | | | | | | ||||||||||||
Oil, gas, and NGL revenues |
| | $ | 99,964 | | | | $ | — | | | | $ | — | | | | $ | 99,964 | | |
Gas gathering and compression revenues |
| | — | | | | 7,086 | | | | (5,091 | ) | | | 1,995 | | | ||||
Gain on commodity derivatives |
| | 66,615 | | | | — | | | | — | | | | 66,615 | | | ||||
| | | | | | | | | | | ||||||||||||
Total revenues(1) |
| | 166,579 | | | | 7,086 | | | | (5,091 | ) | | | 168,574 | | | ||||
E&P operating expenses |
| | 34,571 | | | | — | | | | (4,955 | ) | | | 29,616 | | | ||||
Gathering and compression expenses |
| | — | | | | 892 | | | | — | | | | 892 | | | ||||
General and administrative expenses |
| | 7,961 | | | | 877 | | | | — | | | | 8,838 | | | ||||
| | | | | | | | | | | ||||||||||||
Total operating expenses |
| | 42,532 | | | | 1,769 | | | | (4,955 | ) | | | 39,346 | | | ||||
Total gains on derivatives, net, less net cash from settlement of commodity derivatives |
| | (66,819 | ) | | | — | | | | — | | | | (66,819 | ) | | ||||
| | | | | | | | | | | ||||||||||||
Adjusted EBITDA |
| | $ | 57,228 | | | | $ | 5,317 | | | | $ | (136 | ) | | | $ | 62,409 | | |
| | | | | | | | | | | ||||||||||||
| | | | | | | | | | | | | | | | | | | ||||
| | | | | | | | | | | ||||||||||||
Total assets |
| | $ | 800,171 | | | | $ | 53,495 | | | | $ | (404 | ) | | | $ | 853,262 | | |
Capital expenditures |
| | 259,431 | | | | 33,969 | | | | — | | | | 293,400 | | | ||||
- (1)
- Total intrasegment revenues for the E&P segment and midstream segment were $0 and $6,903, respectively.
(14) Supplemental Information on Oil and Gas Producing Activities (unaudited)
The following is supplemental information regarding our consolidated oil and gas producing activities. The amounts shown include out net working and royalty interest in all our oil and gas properties.
(a) Capitalized Costs Relating to Oil and Gas Producing Activities
|
| December 31, |
| ||||
| | | | | | | ||
|
| 2015 | | 2014 |
| ||
| | | | | | | ||
|
| (In thousands) | | ||||
Proved properties |
| $ | 1,032,782 | | 862,828 | | |
Unproved properties |
| 74,619 | | 58,640 | | ||
| | | | | | | ||
|
| 1,107,401 | | 921,468 | | ||
Accumulated depreciation and depletion |
| (634,082 | ) | (243,978 | ) | ||
| | | | | | | ||
Net capitalized costs |
| $ | 473,319 | | 677,490 | | |
| | | | | | | ||
| | | | | | | ||
| | | | | | | ||
F-101
VANTAGE ENERGY, LLC
Notes to Consolidated Financial Statements (Continued)
December 31, 2015 and 2014
(14) Supplemental Information on Oil and Gas Producing Activities (unaudited) (Continued)
(b) Costs incurred in Certain Oil and Gas Activities
|
| December 31, |
| ||||
| | | | | | | ||
|
| 2015 | | 2014 |
| ||
| | | | | | | ||
|
| (In thousands) | | ||||
Acquisitions: |
| | | ||||
Unproved properties |
| $ | 770 | | 8,072 | | |
Proved properties |
| — | | 129 | | ||
Development costs |
| 179,123 | | 257,500 | | ||
Exploration costs |
| — | | — | | ||
| | | | | | | ||
Oil and gas expenditures |
| $ | 179,893 | | 265,701 | | |
| | | | | | | ||
| | | | | | | ||
| | | | | | | ||
(c) Results of Operations for Oil and Gas Producing Activities
|
| December 31, |
| ||||
| | | | | | | ||
|
| 2015 | | 2014 |
| ||
| | | | | | | ||
Revenues |
| $ | 84,575 | | 99,964 | | |
Production costs |
| 28,287 | | 29,616 | | ||
Depletion and accretion |
| 45,808 | | 35,368 | | ||
Impairment of proved oil and gas properties |
| 344,401 | | — | | ||
| | | | | | | ||
Results of operations from producing activities |
| (333,921 | ) | 34,980 | | ||
| | | | | | | ||
Depletion and accretion rate per Mcfe |
| $ | 0.99 | | 1.25 | | |
(d) Oil and Gas Reserve Information
Proved reserve quantities are based on estimates prepared by the independent petroleum engineering firms of Netherland, Sewell & Associates, Inc. and Wright & Company for the years ended December 31, 2015 and 2014 in accordance with guidelines established by the Securities and Exchange Commission (the "SEC").
Reserve definitions comply with definitions of Rules 4-10(a) (1)-(32) of Regulation S-X of the SEC. The reserve quantity information is limited to reserves which had been evaluated as of December 31, 2015 and 2014. Proved developed reserves represent only those reserves expected to be recovered from existing wells and support equipment. Proved undeveloped reserves ("PUD") are expected to be recovered from new wells after substantial development costs are incurred. All of the Company's proved reserves are located in the Unites States.
Proved reserves are those quantities of oil, NGLs and gas, which, by analysis of geosciences and engineering data, can be estimated with reasonable certainty to be economically producible — from a given date forward, from known reservoirs, and under existing economic conditions, operating methods, and government regulations — prior to the time at which contracts providing the right to operate expire, unless evidence indicates that the renewal is reasonably certain, regardless of whether deterministic or probabilistic methods are used for estimation. The project to
F-102
VANTAGE ENERGY, LLC
Notes to Consolidated Financial Statements (Continued)
December 31, 2015 and 2014
(14) Supplemental Information on Oil and Gas Producing Activities (unaudited) (Continued)
extract the hydrocarbons must have commenced or the operator must be reasonable certain that it will commence the project within a reasonable time.
There are numerous uncertainties inherent in estimating quantities of proved reserves and projecting future rates of production and the timing of development expenditures. The estimation of our proved reserves employs one or more of the following: production trend extrapolation, analogy, volumetric assessment and material balance analysis. Techniques including review of production and pressure histories, analysis of electric logs and fluid tests, and interpretations of geologic and geophysical data are also involved in this estimation process.
The following table provides a rollforward of the total proved reserves for the year ended December 31, 2015 and 2014, as well as proved developed and proved undeveloped reserves at the beginning and end of each respective year:
|
| Natural Gas (MMcf) |
| NGL (MBbl) |
| Oil (MBbl) |
| Total (MMcfe) |
| ||||||||
| | | | | | | | | | | ||||||||
Proved developed and undeveloped reserves as of: |
| | | | | | | | | ||||||||
January 1, 2014 |
| | 612,688 | | | 15,476 | | | 1,354 | | | 713,668 | | ||||
Revisions of previous estimates |
| | (4,600 | ) | | (616 | ) | | (575 | ) | | (11,746 | ) | ||||
Extensions and discoveries |
| | 166,158 | | | 4,033 | | | 204 | | | 191,580 | | ||||
Divestitures |
| | (43 | ) | | (5 | ) | | — | | | (73 | ) | ||||
Acquisitions |
| | 39,839 | | | 4,560 | | | 275 | | | 68,849 | | ||||
Production |
| | (24,242 | ) | | (563 | ) | | (108 | ) | | (28,268 | ) | ||||
| | | | | | | | | | | ||||||||
December 31, 2014 |
| | 789,800 | | | 22,885 | | | 1,150 | | | 934,010 | | ||||
Revisions of previous estimates |
| | (16,585 | ) | | 1,704 | | | 134 | | | (5,557 | ) | ||||
Extensions and discoveries |
| | 136,658 | | | — | | | — | | | 136,658 | | ||||
Divestitures |
| | (9 | ) | | (1 | ) | | — | | | (15 | ) | ||||
Acquisitions |
| | 33,429 | | | — | | | — | | | 33,429 | | ||||
Production |
| | (41,175 | ) | | (796 | ) | | (74 | ) | | (46,395 | ) | ||||
| | | | | | | | | | | ||||||||
December 31, 2015 |
| | 902,118 | | | 23,792 | | | 1,210 | | | 1,052,130 | | ||||
Proved developed reserves as of: |
| | | | | | | | | ||||||||
December 31, 2014 |
| | 228,613 | | | 6,476 | | | 240 | | | 268,909 | | ||||
December 31, 2015 |
| | 398,378 | | | 8,185 | | | 323 | | | 449,426 | | ||||
Proved undeveloped reserves as of: |
| | | | | | | | | ||||||||
December 31, 2014 |
| | 561,187 | | | 16,409 | | | 910 | | | 665,101 | | ||||
December 31, 2015 |
| | 503,740 | | | 15,607 | | | 887 | | | 602,704 | | ||||
Total proved reserves increased 118,120 MMcfe in 2015 primarily due to the following:
Revisions of previous estimates. Reserves were revised upward primarily attributable to technical revisions associated with PUD inventory performance after conversion to PDP as well as the base PDP reserves being revised.
Extensions and discoveries. Reserves increased primarily attributable to increased technical certainty in areas of existing leasehold ownership, tied to internal and external development activity,
F-103
VANTAGE ENERGY, LLC
Notes to Consolidated Financial Statements (Continued)
December 31, 2015 and 2014
(14) Supplemental Information on Oil and Gas Producing Activities (unaudited) (Continued)
additional extensions tied to successful regulatory efforts in urban leasehold areas of Tarrant County, Texas and an improved regulatory environment in Denton County, Texas.
Acquisitions. Proved reserves increased due to new leasehold acquisition from third parties allowing for higher certainty in inventory development.
Total proved reserves increased 220,342 MMCFe in 2014 primarily due to the following:
Revisions of previous estimates. Reserves were revised upward primarily attributable to technical revisions associated with PUD inventory performance after conversion to PDP, higher pricing extending reserve life and the base PDP reserves being revised.
Extensions and discoveries. Reserves increased primarily attributable to increased technical certainty in areas of existing leasehold ownership, tied to internal and external development activity, additional extension tied to development and conversion from non-proven inventory to PDP reserves in the year ended December 31, 2014, successful regulatory efforts in urban leasehold areas of Tarrant County, Texas and successful efforts in joint venture activities.
Acquisitions. Proved reserves increased due to new leasehold acquisition from third parties allowing for higher certainty in inventory development and successful acreage earning agreement with third party operators.
(e) Standardized Measure of Discounted Future Net Cash Flows
The "Standardized Measure of Discounted Future Net Cash Flows Relating to Proved Gas Reserves" ("Standardized Measure") is calculated in accordance with guidance provided by FASB. The Standardized Measure does not purport, nor should it be interpreted, to present the fair value of a company's proved oil and gas reserves. Fair value would require, among other things, consideration of expected future economic and operating conditions, a discount factor more representative of the time value of money, and risks inherent in reserve estimates.
Under the Standardized Measure, future cash inflows are based upon the forecasted future production of year-end reserves. Future cash inflows are then reduced by estimated future production and development costs to determine net pre-tax flow. Tax credits and permanent differences are also considered in the future income tax calculation. Future net cash flow after income taxes is discounted using a 10% annual discount rate to arrive at the Standardized Measure.
F-104
VANTAGE ENERGY, LLC
Notes to Consolidated Financial Statements (Continued)
December 31, 2015 and 2014
(14) Supplemental Information on Oil and Gas Producing Activities (unaudited) (Continued)
The following summary sets forth the Standardized Measure (in thousands):
|
| December 31, |
| ||||
| | | | | | | ||
|
| 2015 | | 2014 |
| ||
| | | | | | | ||
Future cash inflows |
| $ | 1,691,862 | | $ | 3,527,953 | |
Future production costs |
| (471,148 | ) | (603,201 | ) | ||
Future development costs |
| (321,563 | ) | (545,352 | ) | ||
Future income tax expense(1) |
| (6,480 | ) | (12,526 | ) | ||
| | | | | | | ||
Future net cash flows |
| 892,671 | | 2,366,874 | | ||
10% annual discount for estimated timing of cash flows |
| (497,151 | ) | (1,372,282 | ) | ||
| | | | | | | ||
Standardized measure of Discounted Future Net Cash Flows |
| $ | 395,520 | | $ | 994,592 | |
| | | | | | | ||
- (1)
- Future net cash flows do not include the effects of income taxes on future revenues because Vantage I was a limited liability company to subject to entity-level income taxation as of December 31, 2015 and 2014. Accordingly, no provision for federal or state corporate income taxes has been provided because taxable income was passed through to the Company's members, with the exception of the provision made for the Texas Margin Tax. If the Company had been subject to entity-level income taxation, the unaudited pro forma future income tax expense at December 31, 2015 and 2014 would have been $172.2 million and $411.7 million, respectively, net of the discount. The unaudited Standardized Measure at December 31, 2015 and 2014 would have been $226.7 million and $588.6 million, respectively.
(f) Changes in the Standardized Measure
A summary of the changes in the Standardized Measure are contained in the table below (in thousands):
|
| December 31, |
| ||||
| | | | | | | ||
|
| 2015 | | 2014 |
| ||
| | | | | | | ||
Beginning of the period |
| $ | 994,592 | | $ | 532,354 | |
Net changes in prices and production costs |
| (907,840 | ) | 92,051 | | ||
Net change in future development costs |
| 135,489 | | (11,617 | ) | ||
Sales, net of production costs |
| (61,640 | ) | (77,610 | ) | ||
Extensions |
| 28,501 | | 185,556 | | ||
Acquisitions |
| 2,755 | | 74,849 | | ||
Divestitures of reserves |
| (4 | ) | (63 | ) | ||
Revisions of previous quantity estimates |
| (21,794 | ) | (8,854 | ) | ||
Previously estimated development costs incurred |
| 139,064 | | 115,384 | | ||
Net change in taxes |
| 2,614 | | (138 | ) | ||
Accretion of discount |
| 100,038 | | 53,801 | | ||
Changes in timing and other |
| (16,255 | ) | 38,879 | | ||
| | | | | | | ||
End of period |
| 395,520 | | 994,592 | | ||
F-105
VANTAGE ENERGY, LLC
Notes to Consolidated Financial Statements (Continued)
December 31, 2015 and 2014
(14) Supplemental Information on Oil and Gas Producing Activities (unaudited) (Continued)
(g) Impact of Pricing
The estimates of cash flows and reserve quantities shown about are based upon the upon the unweighted average first-day-of-the month prices. If future gas sales are covered by contracts at specified prices, the contract prices would be used. Fluctuations in prices are due to supply and demand and are beyond our control.
The following average index prices were used in determining the Standardized Measure of:
|
| Marcellus Shale |
| Barnett Shale |
| ||||||
| | | | | | | ||||||
December 31, 2014 |
| | | | | | | ||||
Natural Gas per MMBtu |
| | 4.35 | | | | 4.24 | | | ||
Oil per bbl |
| | — | | | | 94.99 | | | ||
Natural Gas liquids per bbl |
| | — | | | | 30.66 | | | ||
December 31, 2015 |
| | | | | | | ||||
Natural Gas per MMBtu |
| | 2.59 | | | | 2.47 | | | ||
Oil per bbl |
| | — | | | | 50.28 | | | ||
Natural Gas liquids per bbl |
| | — | | | | 16.22 | | | ||
These prices related to the unweighted average first-of-the-month prices for the preceding twelve month period. These prices were then adjusted for quality, transportation fees, regional price differentials, fractionation costs, processing fees and other costs. For the Marcellus Shale, the relevant benchmark price for natural gas is Henry Hub. For the Barnett Shale, the relevant benchmark prices for oil, natural gas liquids and natural gas are WAHA, West Texas Intermediate and Oil Price Information Service, respectively.
Companies that follow the full cost accounting method are required to make ceiling test calculations. This test ensures that total capitalized costs for oil and gas properties (net of accumulated DD&A and deferred income taxes) do not exceed the sum of the present value discounted at 10% of estimated future net cash flows from proved reserves, the cost of properties not being amortized, the lower of cost or estimated fair value of unproven properties that are being amortized. Application of these rules during periods of relatively low commodity prices, even if of short-term duration, may result in write-downs.
(15) Subsequent Events
The Company has evaluated subsequent events that occurred after December 31, 2015 through the audit report date, July 26, 2016. On January 19, 2016 the Company issued a Capital Contribution request in the aggregate amount of $20 million, due January 26, 2016. The amount was funded by the Company's current equity interest owners.
On June 1, 2016, the Company entered into the Sixth Amendment to the Second Amended and Restated Credit Agreement (Sixth Amendment), which stated the borrowing base to be $285 million compared to $276 million as of March 31, 2016.
Any other material subsequent events that occurred during this time have been properly recognized or disclosed in these consolidated financial statements or the notes to the consolidated financial statements.
F-106
VANTAGE ENERGY, LLC
Condensed Consolidated Balance Sheets
(In thousands)
|
| June 30, 2016 |
| December 31, 2015 |
| ||||||
| | | | | | | ||||||
|
| (unaudited) | | | |||||||
Assets |
| | | | | | | ||||
Current assets: |
| | | | | | | ||||
Cash and cash equivalents |
| | $ | 2,821 | | | | 2,191 | | | |
Accounts receivable |
| | 16,010 | | | | 21,989 | | | ||
Accounts receivable — related party |
| | 20,685 | | | | — | | | ||
Inventory |
| | 882 | | | | 1,212 | | | ||
Prepayments and deposits |
| | 755 | | | | 815 | | | ||
Commodity derivative assets |
| | 6,928 | | | | 40,944 | | | ||
| | | | | | | ||||||
Total current assets |
| | 48,081 | | | | 67,151 | | | ||
| | | | | | | ||||||
Property, plant, and equipment: |
| | | | | | | ||||
Oil and gas properties, full-cost method of accounting: |
| | | | | | | ||||
Proved |
| | 1,070,096 | | | | 1,032,782 | | | ||
Unproved |
| | 78,288 | | | | 74,619 | | | ||
| | | | | | | ||||||
Total oil and gas properties |
| | 1,148,384 | | | | 1,107,401 | | | ||
Accumulated depletion and ceiling write-down |
| | (813,657 | ) | | | (634,082 | ) | | ||
| | | | | | | ||||||
Net oil and gas properties |
| | 334,727 | | | | 473,319 | | | ||
Gathering systems, less accumulated depreciation of $6,886 and $5,299 |
| | 60,473 | | | | 58,815 | | | ||
Other property, plant, and equipment, less accumulated depreciation of $2,072 and $1,948 |
| | 723 | | | | 772 | | | ||
| | | | | | | ||||||
Net property, plant, and equipment |
| | 395,923 | | | | 532,906 | | | ||
Commodity derivative assets |
| | 5,702 | | | | 15,679 | | | ||
Other assets |
| | 1,347 | | | | 1,381 | | | ||
Water investment, less accumulated amortization of $96 and $11 |
| | 1,278 | | | | 662 | | | ||
| | | | | | | ||||||
Total assets |
| | $ | 452,331 | | | | 617,779 | | | |
| | | | | | | ||||||
| | | | | | | | | | | ||
| | | | | | | ||||||
Liabilities and Members' Equity |
| | | | | | | ||||
Current liabilities: |
| | | | | | | ||||
Accounts payable and accrued liabilities |
| | $ | 27,257 | | | | 40,937 | | | |
Accounts payable — related party |
| | — | | | | 1,100 | | | ||
Commodity derivative liabilities |
| | 6,793 | | | | — | | | ||
Current portion of Revolving credit facility, net of unamortized deferred financing costs (note 3) |
| | 268,873 | | | | — | | | ||
Current portion of Second Lien note payable |
| | 2,000 | | | | 2,000 | | | ||
| | | | | | | ||||||
Total current liabilities |
| | 304,923 | | | | 44,037 | | | ||
Revolving credit facility, net of unamortized deferred financing costs (note 3) |
| | — | | | | 270,555 | | | ||
Second Lien note payable, net of unamortized deferred financing costs (note 3) |
| | 189,407 | | | | 189,780 | | | ||
Commodity derivative liabilities |
| | 5,806 | | | | — | | | ||
Asset retirement obligations |
| | 8,818 | | | | 8,466 | | | ||
| | | | | | | ||||||
Total liabilities |
| | 508,954 | | | | 512,838 | | | ||
| | | | | | | ||||||
Contingently redeeemable Founders' units |
| | 5,960 | | | | 5,788 | | | ||
Commitments and contingencies (note 8) |
| | | | | | | ||||
Members' equity: |
| | | | | | | ||||
Member contributions, net of issuance costs |
| | 448,059 | | | | 428,227 | | | ||
Accumulated deficit |
| | (510,642 | ) | | | (329,074 | ) | | ||
| | | | | | | ||||||
Total members' equity |
| | (62,583 | ) | | | 99,153 | | | ||
| | | | | | | ||||||
Total liabilities and members' equity |
| | $ | 452,331 | | | | 617,779 | | | |
| | | | | | | ||||||
| | | | | | | | | | | ||
| | | | | | | ||||||
The accompanying notes are an integral part of these unaudited condensed
consolidated financial statements.
F-107
VANTAGE ENERGY, LLC
Condensed Consolidated Statements of Operations
(Unaudited)
(In thousands)
|
| Three months ended June 30, |
| Six months ended June 30, |
| ||||||||
| | | | | | | | | | | ||||
|
| 2016 | | 2015 | | 2016 | | 2015 |
| ||||
| | | | | | | | | | | ||||
Operating revenues: |
| | | | | ||||||||
Gas revenues |
| $ | 19,527 | | 16,813 | | 43,806 | | 38,946 | | |||
Oil revenues |
| 757 | | 1,591 | | 1,477 | | 1,883 | | ||||
NGLs revenues |
| 3,518 | | 2,794 | | 5,822 | | 5,495 | | ||||
Midstream revenues |
| 4,062 | | 1,097 | | 4,966 | | 2,728 | | ||||
Gain on commodity derivatives |
| (38,973 | ) | 1,120 | | (21,155 | ) | 15,921 | | ||||
| | | | | | | | | | | ||||
Total operating revenues |
| (11,109 | ) | 23,415 | | 34,916 | | 64,973 | | ||||
| | | | | | | | | | | ||||
Operating expenses: |
| | | | | ||||||||
Production and ad valorem tax expense |
| 1,268 | | 1,259 | | 2,928 | | 2,115 | | ||||
Marketing and gathering expense |
| 4,102 | | 537 | | 6,333 | | 1,266 | | ||||
Lease operating and workover expense |
| 3,494 | | 4,370 | | 7,581 | | 9,280 | | ||||
Midstream operating expense |
| 415 | | 416 | | 1,427 | | 831 | | ||||
General and administrative expense |
| 1,945 | | 2,082 | | 3,222 | | 3,888 | | ||||
Depreciation, depletion, amortization, and accretion expense |
| 12,174 | | 13,320 | | 26,476 | | 28,459 | | ||||
Impairment of oil and gas properties |
| 63,397 | | — | | 155,994 | | — | | ||||
| | | | | | | | | | | ||||
Total operating expenses |
| 86,795 | | 21,984 | | 203,961 | | 45,839 | | ||||
| | | | | | | | | | | ||||
Operating income (loss) |
| (97,904 | ) | 1,431 | | (169,045 | ) | 19,134 | | ||||
| | | | | | | | | | | ||||
Other expense: |
| | | | | ||||||||
Other income (expense) |
| 18 | | (76 | ) | (152 | ) | (2 | ) | ||||
Interest expense, net of capitalized interest |
| (6,412 | ) | (5,543 | ) | (12,371 | ) | (10,569 | ) | ||||
| | | | | | | | | | | ||||
Total other expense |
| (6,394 | ) | (5,619 | ) | (12,523 | ) | (10,571 | ) | ||||
| | | | | | | | | | | ||||
Net income (loss) |
| $ | (104,298 | ) | (4,188 | ) | (181,568 | ) | 8,563 | | |||
| | | | | | | | | | | ||||
| | | | | | | | | | | ||||
| | | | | | | | | | | ||||
The accompanying notes are an integral part of these unaudited condensed
consolidated financial statements.
F-108
VANTAGE ENERGY, LLC
Condensed Consolidated Statements of Changes in Members' Equity
Six months ended June 30, 2016 and year ended December 31, 2015
(Unaudited)
(In thousands)
|
| Contingently Redeemable |
| Members' Equity |
| ||||||||||||||
| | | | | | | | | | | | | ||||||||
|
| Founders' Units |
| Members' Contributions |
| Accumulated Deficit |
| Total |
| ||||||||||
| | | | | | | | | | | ||||||||||
Balance at December 31, 2014 |
| | 5,788 | | | | 428,227 | | | | (36,136 | ) | | 392,091 | | ||||
Net loss |
| | — | | | | — | | | | (292,938 | ) | | (292,938 | ) | ||||
| | | | | | | | | | | ||||||||||
Balance at December 31, 2015 |
| | $ | 5,788 | | | | 428,227 | | | | (329,074 | ) | | 99,153 | | |||
Members' Contributions |
| | 172 | | | | 19,832 | | | | — | | | 19,832 | | ||||
Net loss |
| | — | | | | — | | | | 181,568 | | | 181,568 | | ||||
| | | | | | | | | | | ||||||||||
Balance at June 30, 2016 |
| | $ | 5,960 | | | | 448,059 | | | | (510,642 | ) | | (62,583 | ) | |||
| | | | | | | | | | | ||||||||||
| | | | | | | | | | | | | | | | | ||||
| | | | | | | | | | | ||||||||||
The accompanying notes are an integral part of these unaudited condensed
consolidated financial statements.
F-109
VANTAGE ENERGY, LLC
Condensed Consolidated Statements of Cash Flows
(Unaudited)
(In thousands)
|
| Six months ended June 30, |
| ||||
| | | | | | | ||
|
| 2016 | | 2015 |
| ||
| | | | | | | ||
Cash flows from operating activities: |
| | | ||||
Net income (loss) |
| $ | (181,568 | ) | 8,563 | | |
Adjustments to reconcile net income (loss) to net cash provided by operating activities: |
| | | ||||
Depreciation, depletion, amortization, and accretion |
| 26,476 | | 28,459 | | ||
Accretion of original issue discount |
| 195 | | 181 | | ||
Impairment of oil and gas properties |
| 155,994 | | — | | ||
Gain on commodity derivatives |
| 21,155 | | (15,921 | ) | ||
Settlement of commodity derivatives |
| 35,437 | | 40,894 | | ||
Changes in operating assets and liabilities: |
| | | ||||
Accounts receivable |
| 5,979 | | 5,703 | | ||
Accounts payable — related party |
| (21,785 | ) | (3,212 | ) | ||
Inventory |
| 330 | | (106 | ) | ||
Prepayments and deposits |
| 60 | | (311 | ) | ||
Accounts payable and accrued liabilities |
| (1,435 | ) | 121 | | ||
| | | | | | | ||
Net cash provided by operating activities |
| 40,838 | | 64,371 | | ||
| | | | | | | ||
Cash flows from investing activities: |
| | | ||||
Oil and gas property acquisition, exploration, and development |
| (52,770 | ) | (106,158 | ) | ||
Gathering system additions |
| (3,867 | ) | (7,994 | ) | ||
Water investment additions, net of surcharges refunded |
| (385 | ) | — | | ||
Other assets |
| 36 | | — | | ||
Other property, plant, and equipment additions |
| (75 | ) | (51 | ) | ||
| | | | | | | ||
Net cash used in investing activities |
| (57,061 | ) | (114,203 | ) | ||
| | | | | | | ||
Cash flows from financing activities: |
| | | ||||
Borrowings under revolving credit facility |
| 37,000 | | 34,000 | | ||
Principal payments on revolving credit facility |
| (38,000 | ) | — | | ||
Principal payments on second lien note payable |
| (1,000 | ) | (1,000 | ) | ||
Members' contributions, net |
| 20,004 | | — | | ||
Financing costs |
| (1,151 | ) | (1,377 | ) | ||
| | | | | | | ||
Net cash provided by financing activities |
| 16,853 | | 31,623 | | ||
| | | | | | | ||
Net change in cash and cash equivalents |
| 630 | | (18,209 | ) | ||
Cash and cash equivalents — beginning of period |
| 2,191 | | 20,479 | | ||
| | | | | | | ||
Cash and cash equivalents — end of period |
| $ | 2,821 | | 2,270 | | |
| | | | | | | ||
| | | | | | | ||
| | | | | | | ||
Supplemental disclosure of cash flow information: |
| | | ||||
Cash paid for interest |
| $ | 12,986 | | 11,434 | | |
Supplemental disclosure of selected noncash accounts: |
| | | ||||
Accrued oil and gas capital additions |
| $ | 12,247 | | 17,595 | | |
Capitalized asset retirement obligations, net |
| 155 | | 159 | | ||
The accompanying notes are an integral part of these unaudited condensed
consolidated financial statements.
F-110
VANTAGE ENERGY, LLC
Notes to Condensed Consolidated Financial Statements
June 30, 2016 and December 31, 2015
(Unaudited)
(1) Description of Business and Summary of Significant Accounting Policies
(a) Nature of Operations and Principles of Consolidation
Vantage Energy, LLC (the Company) was organized as a limited liability company under the laws of the state of Delaware in 2006. The condensed consolidated financial statements include the accounts of Vantage Energy, LLC and its seven wholly owned subsidiaries. All intercompany balances have been eliminated in consolidation.
The Company is engaged in the exploration and exploitation of petroleum and natural gas, as well as natural gas acquisition, development, and gathering, in various basins in the United States of America, with the primary focus on unconventional natural gas plays.
The accompanying unaudited condensed consolidated financial statements of Vantage Energy, LLC have been prepared by the Company's management in accordance with generally accepted accounting principles in the United States (GAAP) for interim financial information and applicable rules and regulations promulgated under the Securities Exchange Act of 1934, as amended (Exchange Act). Accordingly, these financial statements do not include all of the information required by GAAP or the Securities and Exchange Commission (SEC) rules and regulation for sscomplete financial statements. Therefore, these condensed consolidated financial statements should be read in conjunction with the audited consolidated financial statements and notes therein for the year ended December 31, 2015. The unaudited condensed consolidated financial statements included herein contain all adjustment which are, in the opinion of management, necessary to present fairly the Company's financial position as of June 30, 2016 and its condensed consolidated statements of operations for the three and six months ended June 30, 2016 and 2015, and its condensed consolidated statement of cash flows for the six months ended June 30, 2016 and 2015. The condensed consolidated statements of operations for the three and six months ended June 30, 2016 and 2015 are not necessarily indicative of the results to be expected for future periods.
(b) Use of Estimates
The preparation of these condensed consolidated financial statements, in conformity with generally accepted accounting principles in the United States of America, requires management to make estimates and assumptions that affect the amounts reported in the condensed consolidated financial statements and accompanying notes. As a result, actual amounts could differ from estimated amounts. By their nature, these estimates are subject to measurement uncertainty, and the effect on the condensed consolidated financial statements of changes in such estimates in future periods could be significant. Significant estimates with regard to the Company's condensed consolidated financial statements include the estimate of proved oil and gas reserve volumes and the related present value of estimated future net cash flows, the recoverability of unproved oil and gas properties, the calculation of depletion of oil and gas reserves, the estimated cost and timing related to asset retirement obligations, and the estimated fair value of derivative assets and liabilities.
Reserve estimates are, by their nature, inherently imprecise. The process of estimating quantities of oil and gas reserves is complex, requiring significant decisions in the evaluation of all
F-111
VANTAGE ENERGY, LLC
Notes to Condensed Consolidated Financial Statements (Continued)
June 30, 2016 and December 31, 2015
(Unaudited)
(1) Description of Business and Summary of Significant Accounting Policies (Continued)
available geological, geophysical, engineering, and economic data. The data for a given field may also change substantially over time as a result of numerous factors including, but not limited to, additional development activity, evolving production history, and continual reassessment of the viability of production under varying economic conditions. As a result, material revisions to existing reserve estimates may occur from time to time. Although every reasonable effort is made to ensure that the reserve estimates represent the most accurate assessments possible, subjective decisions, and available data for the various fields make these estimates generally less precise than other estimates included in financial statement disclosures.
(c) Oil and Gas Properties
The Company follows the full-cost method of accounting for natural gas and crude oil properties. Pursuant to full-cost accounting rules, the Company is required to perform a "ceiling test" calculation to test its oil and gas properties for possible impairment. If the net capitalized cost of the Company's oil and gas properties subject to the amortization (the carrying value) exceeds the ceiling limitation, the excess would be charged to expense. The ceiling limitation is equal to the sum of the present value discounted at 10% of estimated future net cash flows from proved reserves, the cost of properties not being amortized, the lower of cost or estimated fair value of unproven properties included in the costs being amortized, and all related income tax effects. The present value of estimated future net revenue is computed by applying the average first day of the month oil and gas price for the preceding 12-month period to estimated future production of proved oil and gas reserves as of period-end, less estimated future expenditures to be incurred in developing and producing the proved reserves, assuming the continuation of existing economic conditions.
As of June 30, 2016, the carrying value of the Company's oil and gas properties subject to the test exceeded the calculated value of the ceiling limitation. As a result, the Company recorded an impairment of $63.4 million for the three months ended June 30, 2016. For the six months ended June 30, 2016, the Company recorded an impairment of $156.0 million. The ceiling test calculation uses rolling 12-month average commodity prices, the effect of lower quarter-over quarter prices in future quarters is a potentially lower ceiling value each quarter. This could result in ongoing impairments each quarter until prices stabilize or improve.
(d) Adoption of New Accounting Principles
The FASB issued ASU 2015-03, Interest Imputation of Interest: Simplifying the Presentation of Debt Issuance Costs, in April 2015. The core principle of ASU 2015-03 will require all costs incurred to issue debt be presented in the balance sheet as a direct deduction from the carrying value of debt, consistent with debt discounts. The Company adopted this standard as of January 1, 2016, and has applied the standard retrospectively. As a result of adoption, the Company has classified debt issuance costs to its Revolving credit facility and Second Lien note payable from other assets
F-112
VANTAGE ENERGY, LLC
Notes to Condensed Consolidated Financial Statements (Continued)
June 30, 2016 and December 31, 2015
(Unaudited)
(1) Description of Business and Summary of Significant Accounting Policies (Continued)
to debt on its condensed consolidated balance sheet. The retrospective adjustment to the December 31, 2015 condensed consolidated balance sheet is as follows:
|
| Reported December 31, 2015 |
| Adjustment Effect |
| As adjusted December 31, 2015 |
| |||||||||
| | | | | | | | | |||||||||
|
| (In thousands) | | |||||||||||||
Other assets |
| | $ | 4,771 | | | | (3,390 | ) | | | 1,381 | | | ||
Revolving credit facility |
| | 271,000 | | | | (445 | ) | | | 270,555 | | | |||
Second Lien note payable |
| | 192,725 | | | | (2,945 | ) | | | 189,780 | | | |||
(2) Balance Sheet Disclosures
Accounts receivable consist of the following:
|
| June 30, 2016 |
| December 31, 2015 |
| ||||||
| | | | | | | ||||||
|
| (In thousands) | | ||||||||
Revenue |
| | $ | 12,066 | | | | 14,128 | | | |
Joint interest billings |
| | 4,297 | | | | 5,021 | | | ||
Derivative receivable |
| | 25 | | | | 1,056 | | | ||
Other receivables |
| | 122 | | | | 2,284 | | | ||
Allowance for doubtful accounts |
| | (500 | ) | | | (500 | ) | | ||
| | | | | | | ||||||
|
| | $ | 16,010 | | | | 21,989 | | | |
| | | | | | | ||||||
| | | | | | | | | | | ||
| | | | | | | ||||||
Joint interest billings represent receivables from joint interest owners on properties the Company operates. For receivables from joint interest owners, the Company typically has the ability to withhold future revenue disbursements to recover nonpayment of joint interest billings.
Accounts payable and accrued liabilities consist of the following:
|
| June 30, 2016 |
| December 31, 2015 |
| ||||||
| | | | | | | ||||||
|
| (In thousands) | | ||||||||
Accrued capital expenditures |
| | $ | 6,746 | | | | 18,993 | | | |
Accrued production and ad valorem taxes |
| | 1,719 | | | | 3,127 | | | ||
Accrued revenue payable |
| | 7,338 | | | | 6,978 | | | ||
Accrued production expense payable |
| | 1,941 | | | | 2,264 | | | ||
Accrued marketing, gathering, and transportation |
| | 5,391 | | | | 5,646 | | | ||
Accrued general and administrative expense |
| | 1,937 | | | | 1,854 | | | ||
Cash calls payable to other joint interest owners |
| | 222 | | | | 437 | | | ||
Accrued interest payable |
| | 123 | | | | 171 | | | ||
Accounts payable |
| | 1,840 | | | | 1,467 | | | ||
| | | | | | | ||||||
|
| | $ | 27,257 | | | | 40,937 | | | |
| | | | | | | ||||||
| | | | | | | | | | | ||
| | | | | | | ||||||
F-113
VANTAGE ENERGY, LLC
Notes to Condensed Consolidated Financial Statements (Continued)
June 30, 2016 and December 31, 2015
(Unaudited)
(3) Long-Term Debt
(a) Revolving Credit Facility
Effective July 19, 2007, the Company secured a credit facility with a group of bank lenders. Wells Fargo Bank, N.A. acts as administrative agent. Effective December 20, 2013, the Company amended and restated its credit facility (the Revolving Credit Facility) to adjust the borrowing base, increase the maximum commitment to $750 million, and allow for the Second Lien note payable (see below). The maturity date of the Revolving Credit Facility is January 1, 2017. As of June 30, 2016 and December 31, 2015, the Company had a borrowing base of $285.0 million and $276.0 million, respectively. As of June 30, 2016 and December 31, 2015, the Company had outstanding borrowings of $270.0 million and $271.0 million, respectively. On each borrowing, the Company has the election to pay interest at a Base rate or Eurodollar LIBOR. The margin on Base rate loans ranges from 0.75% to 1.75%. The margin on LIBOR loans ranges from 1.75% to 2.75%. The Company pays quarterly commitment fees ranging from 0.375% to 0.500% of the unused borrowing base. The Company generally elects to pay interest based on LIBOR, plus the applicable margin, which was 3.96% in total as of June 30, 2016.
As of June 30, 2016, the Revolving Credit Facility was collateralized by all of the Company's assets, including its 50% undivided nonoperated interest in the Vantage Midstream assets (as defined in note 7).
The Revolving Credit Facility contains certain financial covenants, including maintenance of a minimum current ratio, a minimum interest coverage ratio, and a minimum asset coverage ratio. As of June 30, 2016 and December 31, 2105, the Company was in compliance with all of its financial covenants.
(b) Second Lien Term Loan
In December 2013, the Company entered into a Second Lien note payable (Second Lien note payable) with a face amount of $200 million, maturing on December 20, 2018. The Company has the election to pay interest at a Base rate or Eurodollar LIBOR. The margin on Base rate loans is 6.50%. The margin on LIBOR loans is 7.50%. LIBOR has a floor of 1.00%. As of June 30, 2016, the stated interest rate was 8.5%, and $195.0 million was outstanding. The Second Lien note payable contains an optional prepayment provision that enables the Company to prepay the Second Lien note payable at par. The Second Lien note payable was issued with an original issue discount of $2.0 million, which has been classified as a reduction to the note balance. The discount is amortized over the term of the note using the effective interest method. The Second Lien note payable requires quarterly principal payments of $500,000, which commenced March 31, 2014.
As of June 30, 2016, the Second Lien note payable was collateralized by a second lien interest in all of the Company's assets, including its 50% nonoperated interest in the Vantage Midstream assets, and contains certain financial covenants. These covenants include maintenance of a minimum asset coverage ratio and a minimum proved reserves value. As of June 30, 2016 and December 31, 2015, the Company was in compliance with all of its financial covenants.
F-114
VANTAGE ENERGY, LLC
Notes to Condensed Consolidated Financial Statements (Continued)
June 30, 2016 and December 31, 2015
(Unaudited)
(3) Long-Term Debt (Continued)
During the three months ended June 30, 2016 and 2015, the Company recognized gross interest expense of approximately $6.7 million and $5.8 million, respectively. The Company recognized gross interest expense of approximately $13.1 million and $11.3 million during the six months ended June 30, 2016 and 2015, respectively.
Long-term debt as of June 30, 2016 (in thousands):
|
| As of June 30, 2016 |
| ||||||||
| | | | | | | ||||||
|
| Revolving Credit Facility |
| Second Lien |
| ||||||
| | | | | | | ||||||
Principal |
| | $ | 270,000 | | | | 195,000 | | | |
Net unamortized premium |
| | — | | | | (1,080 | ) | | ||
Net unamortized debt issuance costs |
| | (1,127 | ) | | | (2,513 | ) | | ||
| | | | | | | ||||||
Total Debt |
| | 268,873 | | | | 191,407 | | | ||
Less: Current portion of long term debt |
| | 268,873 | | | | 2,000 | | | ||
| | | | | | | ||||||
Total Long-Term Debt |
| | $ | — | | | | 189,407 | | | |
| | | | | | | ||||||
| | | | | | | | | | | ||
| | | | | | | ||||||
Maturities of long-term debt as of June 30, 2016 (including current maturities, excluding unamortized debt discounts) are as follows (in thousands):
|
| Revolving Credit Facility |
| Second Lien |
| ||||||
| | | | | | | ||||||
Year ending December 31, |
| | | | | | | ||||
2016 |
| | $ | — | | | | 1,000 | | | |
2017 |
| | 270,000 | | | | 2,000 | | | ||
2018 |
| | — | | | | 192,000 | | | ||
| | | | | | | ||||||
Total future maturities of long-term debt |
| | $ | 270,000 | | | | 195,000 | | | |
| | | | | | | ||||||
| | | | | | | | | | | ||
| | | | | | | ||||||
(4) Fair Value Measurements
Authoritative guidance defines fair value as the price that would be received to sell an asset or paid to transfer a liability (an exit price) in an orderly transaction between market participants at the measurement date. The guidance establishes a hierarchy for inputs used in measuring fair value that maximizes the use of observable inputs and minimizes the use of unobservable inputs by requiring that the most observable inputs be used when available. Observable inputs are inputs that market participants would use in pricing the asset or liability based on market data obtained from sources independent of the Company. Unobservable inputs are inputs that reflect the Company's assumptions of what market participants would use in pricing the asset or liability developed based
F-115
VANTAGE ENERGY, LLC
Notes to Condensed Consolidated Financial Statements (Continued)
June 30, 2016 and December 31, 2015
(Unaudited)
(4) Fair Value Measurements (Continued)
on the best information available in the circumstances. The hierarchy is broken down into three levels based on the reliability of the inputs as follows:
| Level 1: | | Quoted prices are available in active markets for identical assets or liabilities. |
Level 2: |
|
Quoted prices in active markets for similar assets and liabilities that are observable for the asset or liability. |
Level 3: |
|
Unobservable pricing inputs that are generally less observable from objective sources, such as discounted cash flow models or valuations. |
The assets and liabilities are classified based on the lowest level of input that is significant to the fair value measurement. The Company's policy is to recognize transfers in to and/or out of the fair value hierarchy as of the end of the reporting period in which the event or change in circumstances caused the transfer. The Company has consistently applied the valuation techniques discussed below in all periods presented. The following tables present the Company's financial assets and liabilities that were accounted for at fair value on a recurring basis as of June 30 , 2016 and December 31, 2015, by level, within the fair value hierarchy (in thousands):
|
| June 30, 2016 |
| ||||||||||||||||
| | | | | | | | | | | ||||||||||
|
| Fair value measurements |
| ||||||||||||||||
| | | | | | | | | | | ||||||||||
Description
|
| Level 1 |
| Level 2 |
| Level 3 |
| Total |
| ||||||||||
Assets: |
| | | | | | | | | | | ||||||||
Commodity derivative instruments |
| | $ | — | | | | 12,630 | | | | — | | | 12,630 | | |||
Liabilities: |
| | | | | | | | | | | ||||||||
Commodity derivative instruments |
| | $ | — | | | | 12,599 | | | | — | | | 12,599 | | |||
|
| December 31, 2015 |
| ||||||||||||||||
| | | | | | | | | | | ||||||||||
|
| Fair value measurements |
| ||||||||||||||||
| | | | | | | | | | | ||||||||||
Description |
| Level 1 |
| Level 2 |
| Level 3 |
| Total |
| ||||||||||
Assets: |
| | | | | | | | | | | ||||||||
Commodity derivative instruments |
| | $ | — | | | | 56,623 | | | | — | | | 56,623 | | |||
The Company's commodity derivative instruments consist of variable-to-fixed price swaps. The fair values of the swap agreements are determined under the income valuation technique using a discounted cash flow model. The valuation model requires a variety of inputs, including contractual terms, published forward prices, and discount rates as appropriate. The Company's estimates of fair value of commodity derivative instruments include consideration of the counterparties' creditworthiness, the Company's creditworthiness, and the time value of money. The consideration of these factors results in an estimated exit price for each derivative asset or liability under a marketplace participant's view. All of the significant inputs are observable, either directly or indirectly; therefore, the Company's derivative instruments are included within the Level 2 fair value hierarchy. The counterparties on the Company's derivative instruments are the same financial
F-116
VANTAGE ENERGY, LLC
Notes to Condensed Consolidated Financial Statements (Continued)
June 30, 2016 and December 31, 2015
(Unaudited)
(4) Fair Value Measurements (Continued)
institutions that hold the Revolving Credit Facility. Accordingly, the Company is not required to post collateral on these derivatives since the banks are secured by the Company's oil and gas assets.
(a) Nonrecurring Fair Value Measurements
The Company uses the income valuation technique to estimate the fair value of asset retirement obligations using estimated gross well costs of reclamation in amounts ranging from $21,500 to $185,000, timing of expected future dismantlement costs ranging from 1 year to 30 years, and a weighted average credit-adjusted risk-free rate. Accordingly, the fair value is based on unobservable pricing inputs and, therefore, is included within the Level 3 fair value hierarchy. During the six months ended June 30, 2016 and year ended December 31, 2015, the Company recorded liabilities for asset retirement obligations of less than $0.1 million and $0.6 million, respectively. See note 5 for additional information.
(b) Other Financial Instruments
Other financial instruments not measured at fair value on a recurring basis include cash and cash equivalents, accounts receivable, accounts payable, accrued liabilities, and long-term debt. With the exception of long-term debt, the financial statement carrying amounts of these items approximate their fair values due to their short-term nature.
(5) Asset Retirement Obligations
The following table presents the reconciliation of the Company's asset retirement obligation of oil and gas properties and gathering system.
|
| June 30, 2016 |
| |||
| | | | | |||
|
| (In thousands) | | |||
Beginning of period |
| | $ | 8,466 | | |
Liabilities incurred |
| | 13 | | | |
Accretion expense |
| | 198 | | | |
Revisions to estimate |
| | 141 | | | |
| | | | | |||
End of period |
| | 8,818 | | | |
| | | | | |||
| | | | | | | |
| | | | | |||
(6) Commodity Derivative Instruments
The Company is exposed to certain risks relating to its ongoing business operations, including risks related to commodity prices. The Company is focused on maintaining an active hedging program using commodity derivative financial instruments to achieve a more predictable cash flow by reducing its exposure to commodity price fluctuations and regional basis differential exposure in an effort to protect our capital investment program, as well as expected future cash flows. The Company's risk management activity is generally accomplished through over-the-counter commodity derivative contracts with large financial institutions. The Company currently uses fixed price natural gas swaps for which it receives a fixed swap price for future production in exchange for a payment of the variable market price received at the time future production is sold.
While the use of these instruments limits the downside risk of adverse price changes, their use may also limit future revenue from favorable price changes. The Company has adopted fair value accounting for its derivatives; therefore, changes in the fair value of derivative financial instruments are recognized in earnings. Cash payments or receipts on such contracts are included in cash flows from operating activities in our condensed consolidated statements of cash flows.
F-117
VANTAGE ENERGY, LLC
Notes to Condensed Consolidated Financial Statements (Continued)
June 30, 2016 and December 31, 2015
(Unaudited)
(6) Commodity Derivative Instruments (Continued)
At June 30, 2016, the terms of outstanding commodity derivative contracts were as follows:
Commodity |
| Quantity remaining |
| Prices | | Price index | | Contract period |
| Estimated fair value |
| |||||
| | | | | | | | | | | | | |||||
|
| | | | | (In thousands) | | |||||||||
Crude oil swaps (Bbls) |
| 33,808 | | $44.60 - 47.00 | | NYMEX WTI | | 7/16 - 12/17 | | | $ | (209 | ) | | ||
Natural gas swaps (MMBtu): |
| | | | | | | | ||||||||
Dominion South Point |
| 52,210,000 | | 1.67 - 3.13 | | Dominion South Point | | 7/16 - 12/19 | | | 515 | | | |||
WAHA |
| 47,775,000 | | 2.36 - 3.88 | | WAHA | | 7/16 - 12/19 | | | 750 | | | |||
| | | | | | | | | | | | | |||||
Total |
| 99,985,000 | | | | | | 1,265 | | | ||||||
| | | | | | | | | | | | | |||||
| | | | | | | | | | | | | | | |||
| | | | | | | | | | | | | |||||
NGL Swaps (Gal): |
| | | | | | | | ||||||||
Ethane |
| 11,295,073 | | .18 - .22 | | OPIS MB Ethane | | 7/16 - 12/17 | | | (760 | ) | | |||
TetPropane |
| 4,452,168 | | .40 - .62 | | OPIS MB TetPropane | | 7/16 - 12/17 | | | (202 | ) | | |||
IsoButane |
| 1,369,777 | | .52 - .76 | | OPIS MB IsoButane | | 7/16 - 12/17 | | | (74 | ) | | |||
Normal butane |
| 653,183 | | .52 - .75 | | OPIS MB NButane | | 7/16 - 12/17 | | | (34 | ) | | |||
Natural gasoline |
| 1,469,159 | | .83 - 1.22 | | OPIS MB Nat Gasoline | | 7/16 - 12/17 | | | 45 | | | |||
| | | | | | | | | | | | | |||||
Total |
| 19,239,360 | | | | | | (1,025 | ) | | ||||||
| | | | | | | | | | | | | |||||
| | | | | | | | | | | | | | | |||
| | | | | | | | | | | | | | | |||
|
| | | Total commodity derivatives | | | | $ | 31 | | | |||||
| | | | | | | | | | | | | |||||
| | | | | | | | | | | | | | | |||
| | | | | | | | | | | | | |||||
The Company estimates that 2016 hedged volumes, in aggregate, represent approximately 90% of the Company's estimated proved production for the remainder of 2016, based upon the year-end external reserve report.
Depending on changes in oil and gas futures markets and management's view of underlying supply and demand trends, we may increase or decrease our hedging positions.
The Company classifies the fair value amounts of derivative assets and liabilities as net current or noncurrent derivative assets or net current or noncurrent derivative liabilities, whichever the case may be, by commodity and by counterparty. The Company enters into derivatives under a master netting arrangement with two counterparties, which, in an event of default, allows the Company to offset payables to and receivables from the defaulting counterparties.
F-118
VANTAGE ENERGY, LLC
Notes to Condensed Consolidated Financial Statements (Continued)
June 30, 2016 and December 31, 2015
(Unaudited)
(6) Commodity Derivative Instruments (Continued)
The following tables provide reconciliation between the net assets and liabilities reflected in the accompanying consolidated balance sheets and the potential effects of master netting arrangements on the gross fair value of the derivative contracts:
|
| | June 30, 2016 |
| ||||||||||||||
| | | | | | | | | | | |||||||||
|
| | Gross amounts |
| ||||||||||||||
| | | | | | | | | | | |||||||||
|
| Consolidated balance sheet classification | | Gross recognized | | Offset | | Net recognized |
| |||||||||
| | | | | | | | | | | |||||||||
|
| | (In thousands) | | ||||||||||||||
Derivative assets: |
| | | | | | | | | | | |||||||
Commodity contracts |
| Current assets | | | $ | 10,477 | | | | (3,549 | ) | | | 6,928 | | | ||
Commodity contracts |
| Noncurrent assets | | | 7,389 | | | | (1,687 | ) | | | 5,702 | | | |||
| | | | | | | | | | | |||||||||
Total derivative assets |
| | | $ | 17,866 | | | | (5,236 | ) | | | 12,630 | | | |||
| | | | | | | | | | | |||||||||
| | | | | | | | | | | | | | | | | |||
| | | | | | | | | | | |||||||||
Derivative liabilities: |
| | | | | | | | | | | |||||||
Commodity contracts |
| Current liabilities | | | $ | 10,342 | | | | (3,549 | ) | | | 6,793 | | | ||
Commodity contracts |
| Noncurrent liabilities | | | 7,493 | | | | (1,687 | ) | | | 5,806 | | | |||
| | | | | | | | | | | |||||||||
Total derivative liabilities |
| | | $ | 17,835 | | | | (5,236 | ) | | | 12,599 | | | |||
| | | | | | | | | | | |||||||||
| | | | | | | | | | | | | | | | | |||
| | | | | | | | | | | |||||||||
|
| | December 31, 2015 |
| ||||||||||||||
| | | | | | | | | | | |||||||||
|
| | Gross amounts |
| ||||||||||||||
| | | | | | | | | | | |||||||||
|
| Consolidated balance sheet classification |
| Gross recognized |
| Offset | | Net recognized |
| |||||||||
| | | | | | | | | | | |||||||||
|
| | (In thousands) | | ||||||||||||||
Derivative assets: |
| | | | | | | | | | | |||||||
Commodity contracts |
| Current assets | | | $ | 41,242 | | | | (298 | ) | | | 40,944 | | | ||
Commodity contracts |
| Noncurrent assets | | | 15,872 | | | | (193 | ) | | | 15,679 | | | |||
| | | | | | | | | | | |||||||||
Total derivative assets |
| | | $ | 57,114 | | | | (491 | ) | | | 56,623 | | | |||
| | | | | | | | | | | |||||||||
| | | | | | | | | | | | | | | | | |||
| | | | | | | | | | | |||||||||
Derivative liabilities: |
| | | | | | | | | | | |||||||
Commodity contracts |
| Current liabilities | | | $ | 298 | | | | (298 | ) | | | — | | | ||
Commodity contracts |
| Noncurrent liabilities | | | 193 | | | | (193 | ) | | | — | | | |||
| | | | | | | | | | | |||||||||
Total derivative liabilities |
| | | $ | 491 | | | | (491 | ) | | | — | | | |||
| | | | | | | | | | | |||||||||
| | | | | | | | | | | | | | | | | |||
| | | | | | | | | | | |||||||||
F-119
VANTAGE ENERGY, LLC
Notes to Condensed Consolidated Financial Statements (Continued)
June 30, 2016 and December 31, 2015
(Unaudited)
(6) Commodity Derivative Instruments (Continued)
The table below summarizes the realized and unrealized gains and losses related to the Company's derivative instruments for the three and six months ended June 30, 2016 and 2015 recorded in the accompanying condensed consolidated statements of operations.
|
| Location of gain (loss) | | Three months ended June 30, |
| ||||
| | | | | | | | | ||
|
| recognized in earnings | | 2016 | | 2015 |
| ||
| | | | | | | | | ||
|
| | (In thousands) | | |||||
Commodity derivative instruments: |
| | | | |||||
Realized gains on derivatives |
| Operating revenue | | $ | 16,335 | | 28,421 | | |
Unrealized loss on commodity derivatives, net |
| Operating revenue | | (55,308 | ) | (27,301 | ) | ||
| | | | | | | | | ||
Total realized and unrealized gains (losses), net |
| | $ | (38,973 | ) | 1,120 | | ||
| | | | | | | | | ||
| | | | | | | | | ||
| | | | | | | | | ||
|
| Location of gain (loss) | | Six months ended June 30, |
| ||||
| | | | | | | | | ||
|
| recognized in earnings | | 2016 | | 2015 |
| ||
| | | | | | | | | ||
|
| | (In thousands) | | |||||
Commodity derivative instruments: |
| | | | |||||
Realized gains on derivatives |
| Operating revenue | | $ | 35,437 | | 40,894 | | |
Unrealized loss on commodity derivatives, net |
| Operating revenue | | (56,592 | ) | (24,973 | ) | ||
| | | | | | | | | ||
Total realized and unrealized gains (losses), net |
| | $ | (21,155 | ) | 15,921 | | ||
| | | | | | | | | ||
| | | | | | | | | ||
| | | | | | | | | ||
Due to the volatility of oil and natural gas prices, the estimated fair values of the Company's commodity derivative instruments are subject to large fluctuations from period to period.
(7) Related Party Transactions
(a) Gas Gathering System Operating Agreement
In connection with the Joint Development Agreement between the Company and Vantage II, Vista Gathering, LLC (hereinafter referred to as "Vantage Midstream") became the operator of the gas gathering assets. Pursuant to a Gas Gathering System Operating Agreement, dated August 2, 2012, between the Company and Vantage Midstream, the Company and Vantage II are to pay their respective 50% shares of the gas gathering system's operating and development costs, as well as their incurred gas gathering and compression fees. For the three months ended June 30, 2016 and 2015, the Company was charged gas gathering and compression fees by Vantage Midstream for the wells that it operates approximately $3.0 million and $1.1 million, respectively. The Company was charged gas gathering and compression fees by Vantage Midstream for the wells that it operates approximately $6.4 million and $2.3 million for the six months ended June 30, 2016 and 2015, respectively.
F-120
VANTAGE ENERGY, LLC
Notes to Condensed Consolidated Financial Statements (Continued)
June 30, 2016 and December 31, 2015
(Unaudited)
(7) Related Party Transactions (Continued)
(b) Water Investment
Pursuant to the Water Services and Supply Agreement, Vantage Midstream provides water services required in the Company's drilling operations. For the three months and six months ended June 30, 2016, the Company paid water supply and transportation fees to Vantage Midstream of less than $0.1 million and $0.1 million, respectively.
(c) Management Services Agreement
In August 2012, the Company and Vantage II entered into a Management Services Agreement (MSA) whereby the Company is to provide certain executive management, administrative, accounting, finance, engineering, land, and information technology assistance to Vantage II. In exchange for receiving these services, Vantage II will pay the Company a fee (the MSA Fee).The MSA Fee is allocated based upon the gross general and administrative expenses incurred by the Company multiplied by a ratio of the relative capital expenditures and oil and natural gas production volumes of the Company and Vantage II. Certain adjustments are made to this calculation to reflect the allocation of general and administrative expenses to Vantage Midstream. For the three months ended June 30, 2016 and 2015, the Company billed approximately $2.9 million and $2.9 million, respectively, of general and administrative expenses under the MSA to Vantage II. The Company billed general and administrative expenses under the MSA to Vantage II of approximately $6.2 million and $7.4 million for the six months ended June 30, 2016 and 2015, respectively.
(d) MIU Notes Receivable
In December 2014, the Company made loans to certain employees in the form of notes receivable. Interest accrues on the notes at 0.34% per annum, and the notes mature upon the earlier to occur of: 1) December 1, 2017; 2) consummation of Monetization Event (as defined); or 3) fifteen days after the date of voluntary termination of employment by the employee or termination by the Company for cause. As of June 30, 2016, the notes had a balance of $1.3 million and are classified in other assets in the accompanying consolidated balance sheets. The notes are collateralized by a first lien interest in each employees' Management Incentive Units (MIUs) and all potential dividends and distributions and a second lien on all other personal assets. Interest income was deemed de minimus for the three and six months ended June 30, 2016.
(8) Commitments and Contingencies
The Company leases office spaces in Colorado, Pennsylvania, and Texas and various compressors in Pennsylvania and Texas under noncancelable operating leases that expire at various dates through 2017. For the three months ended June 30, 2016 and 2015, rent expense was $0.2 million and $0.3 million, respectively, of which a portion will be allocated between the Company and Vantage II. Rent expense for the six months ended June 30, 2016 and 2015 was $0.4 million and $0.3 million, respectively, of which a portion will be allocated between the Company and Vantage II.
F-121
VANTAGE ENERGY, LLC
Notes to Condensed Consolidated Financial Statements (Continued)
June 30, 2016 and December 31, 2015
(Unaudited)
(8) Commitments and Contingencies (Continued)
The following summarizes future minimum lease payments under operating leases at June 30, 2016 (in thousands):
Year ending December 31, |
| | ||
2016 |
| $ | 937 | |
2017 |
| 883 | | |
| | | | | |
Total future minimum lease payments |
| $ | 1,820 | |
| | | | | |
| | | | | |
| | | | | |
On August 22, 2008, the Company secured a letter of credit in the amount of $0.1 million with Wells Fargo Bank, N.A. in connection with the signing of an exploration agreement. Partial draws under this letter of credit are permitted. As of June 30, 2016, no amounts have been drawn under the letter of credit.
As part of a Founder's employment agreement, the Company will pay $0.5 million to such Founder provided all of the following conditions have been met:
- i.
- The
Company's invested capital equals $250 million or greater
- ii.
- Monetization
events aggregating at least $500 million in proceeds have been completed
- iii.
- Distributions to Capital Interest Members are sufficient, in part, to exceed the Second Threshold, as defined in the LLC Agreement.
As of June 30, 2016, none of the $0.5 million has been accrued, as fulfillment of the above criteria has not been deemed probable.
Effective August 1, 2010, and amended in October 2014, the Company entered into a gas gathering agreement related to its Lake Arlington project in Tarrant County, Texas, which committed the Company to transport a minimum quantity of natural gas for seven years starting on the date gas is first delivered. If the Company transports more than the minimum quantity, the Company will receive a credit for excess transported gas, calculated as actual quantity transported, less minimum transportation quantity, multiplied by a stated dollar amount per MMBtu. This credit can be used to offset shortfalls incurred, if any, in the year immediately before or after the excess quantity was incurred. As of June 30, 2016, remaining total minimum revenue commitments due over the term of the agreement aggregate to $23.7 million. As of June 30, 2016, the portion of the remaining minimum commitment that is due in 2017 totals $7.1 million, subject to a rollover provision in the agreement that permits the Company to roll a portion of any deficit commitment to the subsequent period.
Effective August 1, 2013, the Company entered into a gas gathering agreement related to its Wedgwood project in Tarrant County, Texas, under which the Company is required to make a minimum revenue commitment of $8.8 million over four years starting on the date gas is first delivered. The gas gathering fee on which the minimum revenue commitment is based is $0.55 per MMBtu, and remains at that level under the agreement until the Company sells 20,000,000 MMBtu from its Wedgewood project, at which time the gas gathering fee reduces to $0.34 per MMBtu for
F-122
VANTAGE ENERGY, LLC
Notes to Condensed Consolidated Financial Statements (Continued)
June 30, 2016 and December 31, 2015
(Unaudited)
(8) Commitments and Contingencies (Continued)
all subsequent volumes. As of June 30, 2016, the Company had a remaining total commitment of $2.8 million. As of June 30, 2016 the portion of the remaining minimum revenue commitment that is due in 2017 totals $1.5 million, subject to a rollover provision in the agreement that permits the Company to roll a portion of any deficit obligations to the subsequent period.
On April 17, 2014, the Company entered into a 20,000 MMBtu/d firm marketing agreement to market a portion of our production associated with volumes produced in the Marcellus Shale. The agreement began in October 2014 and continues through October 2020. Under the contract, the Company is paid based on TETCO M-2 pricing with the ability to share in downstream price upside when market conditions allow.
On May 9, 2014, the Company entered in a 37,500 MMBtu/d firm marketing agreement to market a portion of our production associated with volumes produced in the Marcellus Shale. The agreement began in November 2014 and continues through October 2019. Under the contract, the Company is paid based on TETCO M-2 pricing.
As of June 30, 2016, the Company had a rig contract in Texas totaling approximately $0.7 million, which ends in July 2016.
From time to time, the Company is party to litigation. The Company maintains insurance to cover certain actions and believes that resolution of such litigation will not have a material adverse effect on the Company.
(9) Capital Structure
Summarized below are the four classes of interests that have been authorized:
- a)
- Capital
Interests (excluding interests acquired under the Leveraged Investment Program)
- b)
- Class A
Management Incentive Units
- c)
- Class B
Management Incentive Units
- d)
- Class C Management Incentive Units.
Effective July 1, 2010, the Members approved the Fourth Amendment to the Company's Limited Liability Company Agreement (the Fourth Amendment) creating the Class C Management Incentive Units. The Company offered each holder of Class A Management Incentive Units and Class B Management Incentive Units, who was employed by the Company on July 1, 2010, the opportunity to exchange all of such Units held by such holders for new Class C Management Incentive Units. In addition, the Fourth Amendment provided for the return of $1.4 million of capital contributions to certain Members to maintain consistent capital commitment contribution percentages among all Members. Effective August 1, 2012, the Members entered into a Second Amended and Restated Limited Liability Company Agreement (the Agreement).
F-123
VANTAGE ENERGY, LLC
Notes to Condensed Consolidated Financial Statements (Continued)
June 30, 2016 and December 31, 2015
(Unaudited)
(9) Capital Structure (Continued)
(a) Capital Interests
Capital Interests are issued to Members from time to time, in exchange for a Member's capital commitment to make cash contributions when called by the Company pursuant to the terms as described in the Agreement.
Total capital contributions and deemed commitments associated with outstanding Capital Interests are as follows:
|
| June 30, 2016 |
| December 31, 2015 |
| ||||
| | | | | | | ||||
|
| (In thousands) | | ||||||
Institutional investors (deemed commitment — $470,559) |
| $ | 440,464 | | | 420,940 | | | |
Founders (deemed commitment — $6,281) |
| 5,960 | | | 5,788 | | | ||
Other employees (deemed commitment — $2,169) |
| 2,103 | | | 2,055 | | | ||
Friends and family (deemed commitment — $6,225) |
| 5,827 | | | 5,568 | | | ||
| | | | | | | ||||
Total (total deemed commitment — $485,234) |
| $ | 454,354 | | | 434,351 | | | |
| | | | | | | ||||
| | | | | | | | | ||
| | | | | | | ||||
As of June 30, 2016 and December 31, 2015, the Company had undrawn commitments of $30.9 million and $50.9 million, respectively. Member contributions on the condensed consolidated balance sheets are net of equity issuance costs of approximately $0.4 million as of June 30, 2016 and December 31, 2015.
Members are entitled to preferred distributions in an amount equal to 8% per annum. As it relates to Class C Management Incentive Units, preferred distributions are compounded annually beginning on July 1, 2010 on the sum of $135 million plus any capital contributions made by members subsequent to July 1, 2010. Preferred distributions are paid only if distributable cash, as defined in the Agreement, is available. As of June 30, 2016 and December 31, 2015, accumulated but undeclared and unpaid preferred distributions related to the Class C Management Incentive Units approximated $141.1 million and $124.4 million, respectively.
The amount of accumulated preferred distributions is also used to determine the size of any payments that may be made to holders of Management Incentive Units. With respect to calculating payments, if any, to holders of the Class C Management Incentive Units, the actual amount of accumulated but undeclared preferred distributions with respect to the Capital Interests as described in the preceding paragraph is determinative. For purposes of calculating payments, if any, to holders of the Class A Management Incentive Units who did not exchange their Class A Management Incentive Units for new Class C Management Incentive Units, preferred distributions are accrued from the dates that capital contributions were made to the calculation date and are based on the full amount of all such capital contributions. As of June 30, 2016 and December 31, 2015, accumulated but undeclared and unpaid preferred distributions related to the Class A Management Incentive Units approximated $311.3 million and $282.6 million, respectively.
F-124
VANTAGE ENERGY, LLC
Notes to Condensed Consolidated Financial Statements (Continued)
June 30, 2016 and December 31, 2015
(Unaudited)
(9) Capital Structure (Continued)
Decisions of the Company are approved by the majority of the Company's board of managers. As of June 30, 2016, the Company's board of managers comprised seven managers, including five appointed by the Institutional Investors, and the two Founders. The Founders may elect to appoint an additional independent manager.
The Company has the right, but not the obligation, to repurchase all Capital Interests and vested Management Incentive Units of employee Members, who are terminated for any reason, at the Units' estimated fair value under the conditions provided for in the Agreement, except that this right does not exist with respect to the death or disability of any Founder. If an employee member is terminated for cause, his or her Management Incentive Units, whether vested or unvested, will be forfeited, and his or her Capital Interests may be repurchased for the lesser of the aggregate unreturned capital contributions of such Member or fair market value. Upon termination of employment without cause or due to death or disability, the Founders/heirs may put their Capital Interests to the Company at fair market value. Upon the occurrence of death or disability, the exercise of this put right is at the Founders'/heirs discretion, which is an event outside of the Company's control. Under the standard codified within ASC 480, "Accounting for Certain Financial Instruments with Characteristics of Both Liabilities and Equity" and Emerging Issues Tax Force ("EITF") Topic D-98 stock subject to redemption requirements outside the control of the Company are required to be classified outside of permanent equity. Accordingly, the Founder's equity is classified outside of member's equity. The occurrence of these events is not deemed probable, and therefore, the Founders equity has been measured at historic cost. The put option cannot be exercised if a Founder voluntarily terminates employment or is terminated for cause.
Distributions of funds associated with Capital Interests defined above follow a prescribed framework, which is outlined in detail in the Agreement. In general, distributions are first made to those Members who have made capital contributions until such Members receive the sum of $135 million plus any additional capital contributions made subsequent to July 1, 2010 plus an 8% per annum return from July 1, 2010, as described above. Subsequent distributions are then allocated 85% to the holders of Capital Interests in accordance with specified sharing ratios and 15% to the holders of Management Incentive Units. The 15% incentive pool is allocated based on the number of Class C Management Incentive Units, taking into consideration payments made to holders of any remaining Class A Management Incentive Units that have not been exchanged for Class C Management Incentive Units. In addition, depending on amounts due from or to participants in the Leveraged Investment Program, certain distributions may be made to or by such participants upon a monetization event.
The Capital Interests are illiquid and subject to substantial transfer restrictions and have certain drag-along and tag-along rights as provided with the agreement.
(b) Leveraged Investment Program
Between December 18, 2006 and June 19, 2009, and at the time of employment for employees first employed between June 16, 2008 and June 17, 2009, the Company was authorized to issue to employees who are also Capital Interest Members up to $15 million of Leveraged
F-125
VANTAGE ENERGY, LLC
Notes to Condensed Consolidated Financial Statements (Continued)
June 30, 2016 and December 31, 2015
(Unaudited)
(9) Capital Structure (Continued)
Amounts. The Leveraged Amounts are limited recourse notes, collateralized by both the Capital Interests acquired independently of the Leveraged Investment Program amounts and the Capital Interests acquired through the Leveraged Investment Program amounts, but otherwise nonrecourse to the Capital Interest Members. The notes mature only upon the occurrence of a sale of the Company.
In connection with the Fourth Amendment, participants in the Leveraged Investment Program who were current employees were given the opportunity to surrender and relinquish their right to participate in the remaining undrawn portion of the Leveraged Investment Program, which represented 41.5% of such participants' allocated Leveraged Amounts under the Leveraged Investment Program. As of December 31, 2010, participants had surrendered the right to participate in $1.6 million aggregate Leveraged Amounts under the Plan.
The terms of the notes issued under the Leveraged Investment Program provide for interest to accrue at 5.0% per annum. As the interest due to the Company on these notes will be withheld out of future distributions, interest income will be recognized at the time such distributions are paid. As of June 30, 2016 and December 31, 2015, interest income accumulated, but not recognized, approximated $2.5 million and $2.4 million, respectively. For the six months ended June 30, 2016 and 2015, no compensation expense related to Leveraged Amounts had been recorded, as such amounts were immaterial. The total Leverage Investment Capital since inception through June 30, 2016 is $5.3 million.
(10) Management Incentive Units
The Company has issued management incentive units to certain employees. The management incentive units participate only in distributions in liquidation events, meeting requisite financial thresholds after Capital Interests have recovered their investment and special allocation amounts. Management incentive units have no voting rights. Compensation expense for these awards will be recognized when all performance, market, and service conditions are probable of being satisfied (in general, upon a liquidating event). Accordingly, no value was assigned to the interests when issued.
(a) Class A Management Incentive Units
The Management Incentive Plan, as described in the Agreement, authorizes up to 1,000,000 nonvoting, Class A Management Incentive Units. In connection with the Fourth Amendment, holders of Class A Management Incentive Units who were employed by the Company on July 1, 2010 were offered the opportunity to exchange their Class A Management Incentive Units for newly issued Class C Management Incentive Units. No new Class A Management Incentive Units may be issued following the Fourth Amendment. As of June 30, 2016 and December 31, 2015, 109,171 Class A Management Incentive Units were outstanding. For financial reporting purposes, no related compensation expense has been recorded as of and for the six months ended June 30, 2016 and year ended December 31, 2015.
Prior to the Fourth Amendment, certain Class A Management Incentive Units vest on a schedule of 20% at the end of each of the first four years following the date of grant, with the final
F-126
VANTAGE ENERGY, LLC
Notes to Condensed Consolidated Financial Statements (Continued)
June 30, 2016 and December 31, 2015
(Unaudited)
(10) Management Incentive Units (Continued)
20% vesting only upon the occurrence of a sale of the Company. Other Class A Management Incentive Units vest 100% upon the occurrence of a sale of the Company. As of June 30, 2016 and December 31, 2015, 109,171 Class A Management Incentive Units were vested and outstanding.
(b) Class B Management Incentive Units
The Management Incentive Plan, as described in the Agreement, authorizes up to 45 Class B Management Incentive Units. In connection with the Fourth Amendment, holders of Class B Management Incentive Units were offered the opportunity to exchange their Class B Management Incentive Units for newly issued Class C Management Incentive Units. No new Class B Management Incentive Units may be issued following the Fourth Amendment. All holders of Class B Management Incentive Units accepted such offer; thus, at June 30, 2016 and December 31, 2015, there were no Class B Management Incentive Units outstanding.
(c) Class C Management Incentive Units
The 2010 Management Incentive Plan, as described in the Fourth Amendment, authorizes up to 1,818,182 nonvoting, Class C Management Incentive Units. In connection with the Fourth Amendment, holders of Class A Management Incentive Units and Class B Management Incentive Units who were employed by the Company on July 1, 2010 were offered the opportunity to exchange their Class A Management Incentive Units and Class B Management Incentive Units for newly issued Class C Management Incentive Units. Holders of 564,182 Class A Management Incentive Units exchanged such Units for 564,182 Class C Management Incentive Units, and holders of all of the 45 outstanding Class B Units exchanged such Units for 894,195 Class C Management Incentive Units. As of June 30, 2016 and December 31, 2015, 1,605,254 and 1,630,604 Class C Management Incentive Units were outstanding, respectively.
The Class C Management Incentive Units vest on a schedule of 15% if the holder has been employed by the Company on a full-time basis for each of three, four, and five years beginning on the date of grant, with the final 55% to vest only upon the occurrence of a sale of the Company, provided that the Company gives employees up to two full years' credit against the vesting schedule for employment prior to the date of grant. In addition, there is accelerated vesting for each Founder of up to 50% of the Class C Management Units held by such Founder if his employment is terminated by the Company without cause. As of June 30, 2016 and December 31, 2015, 726,409 and 715,909, respectively, Class C Management Incentive Units were vested.
F-127
VANTAGE ENERGY, LLC
Notes to Condensed Consolidated Financial Statements (Continued)
June 30, 2016 and December 31, 2015
(Unaudited)
(10) Management Incentive Units (Continued)
The following table presents the activity for Class C Management Incentive Units outstanding:
|
| Units |
| |
| | | | | |
Outstanding — December 31, 2014 |
| 1,698,479 | | |
Granted |
| 24,500 | | |
Forfeited |
| (92,375 | ) | |
| | | | | |
Outstanding — December 31, 2015 |
| 1,630,604 | | |
Granted |
| 25,000 | | |
Forfeited |
| (13,500 | ) | |
| | | | | |
Outstanding — June 30, 2016 |
| 1,642,104 | | |
| | | | | |
| | | | | |
| | | | | |
(11) Liquidity
The Revolving Credit Facility matures on January 1, 2017. The Company expects to repay and retire the Revolving Credit Facility and the Second Lien note payable in connection with the net proceeds from the completion of the public offering and cash on hand. Additionally the Company plans to obtain new financing following the anticipated corporate reorganization, contemporaneous with the offering.
In the event that some deficiency exists between the proceeds of the offering or the terms of the new facility and the Company's current facility, as of June 30, 2016 the Company has available undrawn capacity under its existing borrowing base of $14.0 million and available undrawn capacity under its equity commitments of $30.9 million to address such a deficiency. In addition, the Company expects that it will be able to secure incremental equity commitments or other sources of capital, including debt, if necessary, from its current equity investors, other investors, or lenders to address any shortfall. The Company's current equity investors continue to be supportive of the Company's long-term growth and financing strategy.
While we anticipate engaging in active dialogue with our creditors and the potential public offering, at this time we are unable to predict the outcome of such or whether any such efforts to raise additional equity will be successful.
(12) Segment Reporting
In accordance with Accounting Standards Codification No. 280 — Segment Reporting, the Company periodically assesses whether there are changes in its operating and reporting segments. The Company has evaluated how the chief operating decision maker analyzes performance and allocates resources and has identified two reportable segments: the exploration and production segment and the midstream segment. The exploration and production segment explores for and produces oil, natural gas, and NGLs. The midstream segment engages in natural gas gathering and transportation services as well as water services primarily for the Company and its affiliate under common management, Vantage II. Midstream assets are held though the Company's 50% working interest in Vantage Midstream assets.
F-128
VANTAGE ENERGY, LLC
Notes to Condensed Consolidated Financial Statements (Continued)
June 30, 2016 and December 31, 2015
(Unaudited)
(12) Segment Reporting (Continued)
To assess the performance of the Company's operating segments, the chief operating decision maker analyzes Adjusted EBITDA. The Company defines Adjusted EBITDA as income (loss) before income taxes; DD&A; impairments; interest expense; and total (gains) losses on derivatives, net, less net cash from settlement of commodity derivatives. DD&A and impairments are excluded from Adjusted EBITDA as a measure of segment operating performance because capital expenditures are evaluated at the time capital costs are incurred. Similarly, total (gains) losses on derivatives, net, less net cash from settlement of commodity derivatives are excluded from Adjusted EBITDA because these (gains) losses are not considered a measure of asset operating performance. Management believes that the presentation of Adjusted EBITDA provides useful information in assessing the Company's financial condition and operating results as well as the profitability of our business segments.
Adjusted EBITDA is a widely accepted financial indicator; however, Adjusted EBITDA as defined by the Company may not be comparable to similarly titled measures used by other companies and should be considered in conjunction with net income (loss) and other performance measures. Below is a reconciliation of consolidated Adjusted EBITDA to income (loss) before income taxes:
|
| Three months ended June 30, |
| ||||
| | | | | | | ||
|
| 2016 | | 2015 |
| ||
| | | | | | | ||
Net income (loss) |
| $ | (104,298 | ) | (4,188 | ) | |
Interest expense, net of capitalized interest |
| 6,412 | | 5,543 | | ||
Total (gains) losses on derivatives, net, less net cash from settlement of commodity derivatives |
| 55,308 | | 27,301 | | ||
Depreciation, depletion, amortization, and accretion expense |
| 12,174 | | 13,320 | | ||
Impairment of oil and gas properties |
| 63,397 | | — | | ||
| | | | | | | ||
Adjusted EBITDA |
| $ | 32,993 | | 41,976 | | |
| | | | | | | ||
| | | | | | | ||
| | | | | | | ||
|
| Six months ended June 30, |
| ||||
| | | | | | | ||
|
| 2016 | | 2015 |
| ||
| | | | | | | ||
Net income (loss) |
| $ | (181,568 | ) | 8,563 | | |
Interest expense, net of capitalized interest |
| 12,371 | | 10,569 | | ||
Total (gains) losses on derivatives, net, less net cash from settlement of commodity derivatives |
| 56,592 | | 24,973 | | ||
Depreciation, depletion, amortization, and accretion expense |
| 26,476 | | 28,459 | | ||
Impairment of oil and gas properties |
| 155,994 | | — | | ||
| | | | | | | ||
Adjusted EBITDA |
| $ | 69,865 | | 72,564 | | |
| | | | | | | ||
| | | | | | | ||
| | | | | | | ||
F-129
VANTAGE ENERGY, LLC
Notes to Condensed Consolidated Financial Statements (Continued)
June 30, 2016 and December 31, 2015
(Unaudited)
(12) Segment Reporting (Continued)
The following summarizes selected financial information for the Company's reporting segments for the three and six month periods ended June 30, 2016 and 2015:
|
| Three months ended June 30, 2016 |
| ||||||||||||||||||
| | | | | | | | | | | ||||||||||||
|
| Exploration and Production Segment |
| Midstream Segment |
| Eliminations | | Consolidated Total |
| ||||||||||||
| | | | | | | | | | | ||||||||||||
Oil, gas, and NGL revenues |
| | $ | 23,802 | | | | — | | | | — | | | | 23,802 | | | |||
Gas gathering and compression revenues |
| | — | | | | 6,056 | | | | (1,994 | ) | | | 4,062 | | | ||||
Water revenue |
| | — | | | | 1,353 | | | | (1,353 | ) | | | — | | | ||||
Loss on commodity derivatives |
| | (38,973 | ) | | | — | | | | — | | | | (38,973 | ) | | ||||
| | | | | | | | | | | ||||||||||||
Total revenues(1) |
| | (15,171 | ) | | | 7,409 | | | | (3,347 | ) | | | (11,109 | ) | | ||||
E&P operating expenses |
| | 10,795 | | | | — | | | | (1,931 | ) | | | 8,864 | | | ||||
Gathering and compression expenses |
| | — | | | | 415 | | | | — | | | | 415 | | | ||||
Water system expenses |
| | — | | | | 1,649 | | | | (1,649 | ) | | | — | | | ||||
General and adminstrative expenses |
| | 1,644 | | | | 301 | | | | — | | | | 1,945 | | | ||||
| | | | | | | | | | | ||||||||||||
Total operating expenses |
| | 12,439 | | | | 2,365 | | | | (3,580 | ) | | | 11,224 | | | ||||
Other income |
| | 18 |
| | | — |
| | | — |
| | | 18 |
| | ||||
Total losses on derivatives, net, less net cash from settlement of commodity derivatives |
| | 55,308 | | | | — | | | | — | | | | 55,308 | | | ||||
| | | | | | | | | | | ||||||||||||
Adjusted EBITDA |
| | $ | 27,716 | | | | 5,044 | | | | 233 | | | | 32,993 | | | |||
| | | | | | | | | | | ||||||||||||
| | | | | | | | | | | | | | | | | | | ||||
| | | | | | | | | | | ||||||||||||
- (1)
- Total intrasegment revenues for the E&P segment and mistream segment were $0 and $6,906, respectively.
F-130
VANTAGE ENERGY, LLC
Notes to Condensed Consolidated Financial Statements (Continued)
June 30, 2016 and December 31, 2015
(Unaudited)
(12) Segment Reporting (Continued)
|
| Three months ended June 30, 2015 |
| ||||||||||||||||||
| | | | | | | | | | | ||||||||||||
|
| Exploration and Production Segment |
| Midstream Segment |
| Eliminations | | Consolidated Total |
| ||||||||||||
| | | | | | | | | | | ||||||||||||
Oil, gas, and NGL revenues |
| | $ | 21,198 | | | | — | | | | — | | | | 21,198 | | | |||
Gas gathering and compression revenues |
| | — | | | | 3,798 | | | | (2,701 | ) | | | 1,097 | | | ||||
Gain on commodity derivatives |
| | 1,120 | | | | — | | | | — | | | | 1,120 | | | ||||
| | | | | | | | | | | ||||||||||||
Total revenues(1) |
| | 22,318 | | | | 3,798 | | | | (2,701 | ) | | | 23,415 | | | ||||
E&P operating expenses |
| | 8,867 | | | | — | | | | (2,701 | ) | | | 6,166 | | | ||||
Gathering and compression expenses |
| | (45 | ) | | | 461 | | | | — | | | | 416 | | | ||||
General and adminstrative expenses |
| | 1,767 | | | | 315 | | | | — | | | | 2,082 | | | ||||
| | | | | | | | | | | ||||||||||||
Total operating expenses |
| | 10,589 | | | | 776 | | | | (2,701 | ) | | | 8,664 | | | ||||
Other expense |
| | (76 |
) |
|
| — |
| | | — |
| | | (76 |
) |
|
||||
Total losses on derivatives, net, less net cash from settlement of commodity derivatives |
| | 27,301 | | | | — | | | | — | | | | 27,301 | | | ||||
| | | | | | | | | | | ||||||||||||
Adjusted EBITDA |
| | $ | 38,954 | | | | 3,022 | | | | — | | | | 41,976 | | | |||
| | | | | | | | | | | ||||||||||||
| | | | | | | | | | | | | | | | | | | ||||
| | | | | | | | | | | ||||||||||||
- (1)
- Total intrasegment revenues for the E&P segment and mistream segment were $0 and $3,559, respectively.
F-131
VANTAGE ENERGY, LLC
Notes to Condensed Consolidated Financial Statements (Continued)
June 30, 2016 and December 31, 2015
(Unaudited)
(12) Segment Reporting (Continued)
|
| Six months ended June 30, 2016 |
| ||||||||||||||||||
| | | | | | | | | | | ||||||||||||
|
| Exploration and Production Segment |
| Midstream Segment |
| Eliminations | | Consolidated Total |
| ||||||||||||
| | | | | | | | | | | ||||||||||||
Oil, gas, and NGL revenues |
| | $ | 51,105 | | | | — | | | | — | | | | 51,105 | | | |||
Gas gathering and compression revenues |
| | — | | | | 12,768 | | | | (7,802 | ) | | | 4,966 | | | ||||
Water revenue |
| | — | | | | 3,945 | | | | (3,945 | ) | | | — | | | ||||
Loss on commodity derivatives |
| | (21,155 | ) | | | — | | | | — | | | | (21,155 | ) | | ||||
| | | | | | | | | | | ||||||||||||
Total revenues(1) |
| | 29,950 | | | | 16,713 | | | | (11,747 | ) | | | 34,916 | | | ||||
E&P operating expenses |
| | 24,581 | | | | — | | | | (7,739 | ) | | | 16,842 | | | ||||
Gathering and compression expenses |
| | — | | | | 1,427 | | | | — | | | | 1,427 | | | ||||
Water system expenses |
| | — | | | | 3,457 | | | | (3,457 | ) | | | — | | | ||||
General and adminstrative expenses |
| | 2,591 | | | | 631 | | | | — | | | | 3,222 | | | ||||
| | | | | | | | | | | ||||||||||||
Total operating expenses |
| | 27,172 | | | | 5,515 | | | | (11,196 | ) | | | 21,491 | | | ||||
Other expense |
| | (152 |
) |
|
| — |
| | | — |
| | | (152 |
) |
|
||||
Total losses on derivatives, net, less net cash from settlement of commodity derivatives |
| | 56,592 | | | | — | | | | — | | | | 56,592 | | | ||||
| | | | | | | | | | | ||||||||||||
Adjusted EBITDA |
| | $ | 59,218 | | | | 11,198 | | | | (551 | ) | | | 69,865 | | | |||
| | | | | | | | | | | ||||||||||||
| | | | | | | | | | | | | | | | | | | ||||
| | | | | | | | | | | ||||||||||||
Total Assets(2) |
| | $ | 389,432 | | | | 64,412 | | | | (1,513 | ) | | | 452,331 | | | |||
Capital expenditures(3) |
| | 53,517 | | | | 4,252 | | | | (747 | ) | | | 57,022 | | | ||||
- (1)
- Total
intrasegment revenues for the E&P segment and mistream segment were $0 and $15,943, respectively.
- (2)
- Included
in the total assets for the midstream segment is $1,278 for the net water investment, which is an other asset on the balance sheet.
- (3)
- Included in capital expenditures for the midstream segment is $386 for the water investment expenditures, which is an other asset on the balance sheet.
F-132
VANTAGE ENERGY, LLC
Notes to Condensed Consolidated Financial Statements (Continued)
June 30, 2016 and December 31, 2015
(Unaudited)
(12) Segment Reporting (Continued)
|
| Six months ended June 30, 2015 |
| ||||||||||||||||||
| | | | | | | | | | | ||||||||||||
|
| Exploration and Production Segment |
| Midstream Segment |
| Eliminations | | Consolidated Total |
| ||||||||||||
| | | | | | | | | | | ||||||||||||
Oil, gas, and NGL revenues |
| | $ | 46,324 | | | | — | | | | — | | | | 46,324 | | | |||
Gas gathering and compression revenues |
| | — | | | | 7,649 | | | | (4,921 | ) | | | 2,728 | | | ||||
Gain on commodity derivatives |
| | 15,921 | | | | — | | | | — | | | | 15,921 | | | ||||
| | | | | | | | | | | ||||||||||||
Total revenues(1) |
| | 62,245 | | | | 7,649 | | | | (4,921 | ) | | | 64,973 | | | ||||
E&P operating expenses |
| | 17,582 | | | | — | | | | (4,921 | ) | | | 12,661 | | | ||||
Gathering and compression expenses |
| | (45 | ) | | | 876 | | | | — | | | | 831 | | | ||||
General and adminstrative expenses |
| | 3,290 | | | | 598 | | | | — | | | | 3,888 | | | ||||
| | | | | | | | | | | ||||||||||||
Total operating expenses |
| | 20,827 | | | | 1,474 | | | | (4,921 | ) | | | 17,380 | | | ||||
Other expense |
| | (2 |
) |
|
| — |
| | | — |
| | | (2 |
) |
|
||||
Total losses on derivatives, net, less net cash from settlement of commodity derivatives |
| | 24,973 | | | | — | | | | — | | | | 24,973 | | | ||||
| | | | | | | | | | | ||||||||||||
Adjusted EBITDA |
| | $ | 66,389 | | | | 6,175 | | | | — | | | | 72,564 | | | |||
| | | | | | | | | | | ||||||||||||
| | | | | | | | | | | | | | | | | | | ||||
| | | | | | | | | | | ||||||||||||
Total Assets |
| | $ | 826,383 | | | | 56,729 | | | | (846 | ) | | | 882,266 | | | |||
Capital expenditures |
| | 106,158 | | | | 7,994 | | | | — | | | | 114,152 | | | ||||
- (1)
- Total intrasegment revenues for the E&P segment and mistream segment were $0 and $7,140, respectively.
(13) Subsequent Events
The Company has evaluated subsequent events that occurred after June 30, 2016 through, August 29, 2016. Any other material subsequent events that occurred during this time have been properly recognized or disclosed in these consolidated financial statements or the notes to the consolidated financial statements.
F-133
Report of Independent Registered Public Accounting Firm
The
Board of Directors
Vantage Energy Inc.:
We have audited the accompanying balance sheet of Vantage Energy Inc. as of June 30, 2016. This financial statement is the responsibility of the Company's management. Our responsibility is to express an opinion on this financial statement based on our audit.
We conducted our audit in accordance with the standards of the Public Company Accounting Oversight Board (United States). Those standards require that we plan and perform the audit to obtain reasonable assurance about whether the balance sheet is free of material misstatement. An audit includes examining, on a test basis, evidence supporting the amounts and disclosures in the financial statements. An audit also includes assessing the accounting principles used and significant estimates made by management, as well as evaluating the overall financial statement presentation. We believe that our audit provides a reasonable basis for our opinion.
In our opinion, the balance sheet referred to above presents fairly, in all material respects, the financial position of Vantage Energy Inc. as of June 30, 2016, in conformity with U.S. generally accepted accounting principles.
|
| /s/ KPMG LLP |
Denver, Colorado |
| |
August 29, 2016 |
|
F-134
VANTAGE ENERGY INC.
Balance Sheet
June 30, 2016
Assets |
| | ||
Current assets |
| | ||
Receivable from affiliate |
| $ | 10 | |
| | | | | |
Total current assets |
| 10 | | |
| | | | | |
Total assets |
| $ | 10 | |
| | | | | |
Liabilities and Shareholder's Equity |
| | ||
Total liabilities |
| $ | — | |
| | | | | |
Commitments and contingencies |
| | ||
Shareholder's equity: |
| | ||
Common stock, $0.01 par value; authorized 1,000 shares; 1,000 shares issued and outstanding |
| 10 | | |
| | | | | |
Total Shareholder's equity |
| 10 | | |
| | | | | |
Total liabilities and Shareholder's equity |
| $ | 10 | |
| | | | | |
| | | | | |
| | | | | |
The accompanying notes are an integral part of this balance sheet
F-135
VANTAGE ENERGY INC.
Notes to Balance Sheet
Note 1 — Nature of Operations
Vantage Energy Inc. (the "Company") is a Delaware corporation formed on May 7, 2014. The Company was formed to be the parent holding company of two operating companies, Vantage I Energy, LLC ("Vantage I") and Vantage Energy II, LLC ("Vantage II"), in connection with the Company's initial public offering. The Company has no prior operating activities.
Pursuant to the terms of a corporate reorganization that will be completed simultaneously with the closing of the initial public offering, (i) Vantage I and Vantage II will merge into subsidiaries of newly-formed holding companies, Vantage Energy Investment LLC and Vantage Energy Investment II LLC, that will be owned by the existing members in equal proportions to their current ownership of Vantage I and Vantage II and (ii) the existing members will contribute all of the interests in Vantage I and Vantage II to the Company in exchange for all of our issued and outstanding shares of common stock (prior to the issuance of shares of common stock in the initial public offering).
Note 2 — Basis of Presentation and Summary of Significant Accounting Policies
The balance sheets have been prepared in accordance with accounting principles generally accepted in the United States of America ("GAAP"). Separate Statements of Operations, Changes in Stockholder's Equity and of Cash Flows have not been presented because the Company had no business transactions or activities as of June 30, 2016, except for the initial capitalization of the Company which funded by an affiliate. In this regard, general and administrative costs associated with the formation and daily management of the Company have determined by the Company to be insignificant.
Estimates
The preparation of the balance sheets, in accordance with generally accepted principles in the United States of America, requires management to make estimates and assumptions that affect the amounts reported in the balance sheet and accompanying notes. Actual results could differ from those estimates.
Cash
Cash and cash equivalents are stated in the balance sheets at nominal value, and consist of all investments that are readily convertible into cash and have maturities of three months or less at the time of acquisition.
Income Taxes
The Company is a subchapter C corporation and is subject to U.S. federal and state income taxes. Income taxes are accounted for under the asset and liability method. The Company recognizes deferred tax assets and liabilities for the future tax consequences attributable to differences between the financial statement carrying amounts and income tax basis of assets and liabilities and the expected benefits of utilizing net operating loss and tax credit carryforwards, using enacted tax rates in effect for the taxing jurisdiction in which the Company operates for the year in which those temporary differences are expected to be recovered or settled. The Company recognizes the financial statement effects of a tax position when it is more-likely-than-not, based on technical merits, that the position will be sustained upon examination. Net deferred tax assets are
F-136
VANTAGE ENERGY INC.
Notes to Balance Sheet (Continued)
Note 2 — Basis of Presentation and Summary of Significant Accounting Policies (Continued)
then reduced by a valuation allowance if the Company believes it more-likely-than-not such net deferred tax assets will not be realized.
Note 3 — Shareholder's Equity
The Company has authorized share capital of 1,000 common shares with $0.01 par value. On May 7, 2014, all 1,000 shares were issued and acquired by Vantage I for consideration of $10 note receivable from that affiliate. Each share has one voting right.
Note 4 — Subsequent Events
The balance sheet and these notes to the balance sheet reflect the Company's consideration of the accounting and disclosure implications of the subsequent events through the date of issuance.
F-137
ANNEX A
GLOSSARY OF OIL AND NATURAL GAS TERMS
The following are abbreviations and definitions of certain terms used in this document, which are commonly used in the oil and natural gas industry:
"Bbl". One stock tank barrel, of 42 U.S. gallons liquid volume, used herein in reference to crude oil, condensate or NGLs.
"Bcf". One billion cubic feet of natural gas.
"Bcfe". One billion cubic feet of natural gas equivalent with one barrel of oil, condensate or NGLs converted to six thousand cubic feet of natural gas.
"Btu". One British thermal unit, the quantity of heat required to raise the temperature of a one-pound mass of water by one degree of Fahrenheit.
"Basin". A large natural depression on the earth's surface in which sediments generally brought by water accumulate.
"Completion". The process of treating a drilled well followed by the installation of permanent equipment for the production of natural gas or oil, or in the case of a dry hole, the reporting of abandonment to the appropriate agency.
"DD&A". Depreciation, depletion, amortization and accretion.
"Delineation". The process of placing a number of wells in various parts of a reservoir to determine its boundaries and production characteristics.
"Developed acreage". The number of acres that are allocated or assignable to productive wells or wells capable of production.
"Development well". A well drilled within the proved area of an oil or natural gas reservoir to the depth of a stratigraphic horizon known to be productive.
"Dry hole". A well found to be incapable of producing hydrocarbons in sufficient quantities such that proceeds from the sale of such production exceed production expenses and taxes.
"Effective Horizontal Acreage". The summation of combined horizontal acreage that is prospective for hydrocarbon production across multiple target formations.
"Estimated ultimate recovery" or "EUR". The sum of reserves remaining as of a given date and cumulative production as of that date. As used in this prospectus, EUR includes only proved reserves and is based on our reserve estimates.
"Exploratory well". A well drilled to find and produce natural gas or oil reserves not classified as proved, to find a new reservoir in a field previously found to be productive of natural gas or oil in another reservoir or to extend a known reservoir.
"Field". An area consisting of a single reservoir or multiple reservoirs all grouped on, or related to, the same individual geological structural feature or stratigraphic condition. The field name refers to the surface area, although it may refer to both the surface and the underground productive formations.
"Formation". A layer of rock which has distinct characteristics that differs from nearby rock.
"Gal". Gallon.
"Gross acres" or "gross wells". The total acres or wells, as the case may be, in which a working interest is owned.
A-1
"Horizontal drilling". A drilling technique used in certain formations where a well is drilled vertically to a certain depth and then drilled at a right angle within a specified interval.
"Identified drilling locations". Total gross (net) resource play locations that we may be able to drill on our existing acreage. A portion of our identified drilling locations constitute estimated locations based on our acreage and spacing assumptions, as described in "Business — Our Operations — Reserve Data — Determination of Identified Drilling Locations". Actual drilling activities may change depending on the availability of capital, regulatory approvals, seasonal restrictions, natural gas and oil prices, costs, drilling results and other factors.
"Identified lateral footage". Total gross (net) estimated feet of horizontal lateral length that comprise our identified drilling locations.
"MBbl". One thousand barrels of crude oil, condensate or NGLs.
"Mcf". One thousand cubic feet of natural gas.
"Mcfe". One thousand cubic feet equivalent, determined using the ratio of six Mcf of natural gas to one Bbl of crude oil, condensate or NGLs.
"MMBbl". One million barrels of crude oil, condensate or NGLs.
"MMBtu". One million Btu.
"MMcf". One million cubic feet of natural gas.
"MMcfe". One million cubic feet equivalent, determined using the ratio of six Mcf of natural gas to one Bbl of crude oil, condensate or NGLs.
"NGLs". Natural gas liquids. Hydrocarbons found in natural gas which may be extracted as liquefied petroleum gas and natural gasoline.
"NYMEX". The New York Mercantile Exchange.
"Net acres". The percentage of total acres an owner has out of a particular number of acres, or a specified tract. An owner who has 50% interest in 100 acres owns 50 net acres.
"OPIS". Oil Price Information Service
"OPIS MB". Oil Price Information Service Mont Belvieu.
"Productive well". A well that is found to be capable of producing hydrocarbons in sufficient quantities such that proceeds from the sale of the production exceed production expenses and taxes.
"Prospect". A specific geographic area which, based on supporting geological, geophysical or other data and also preliminary economic analysis using reasonably anticipated prices and costs, is deemed to have potential for the discovery of commercial hydrocarbons.
"Proved developed reserves". Reserves that can be expected to be recovered through existing wells with existing equipment and operating methods.
"Proved reserves". The estimated quantities of oil, natural gas and NGLs which geological and engineering data demonstrate with reasonable certainty to be commercially recoverable in future years from known reservoirs under existing economic and operating conditions.
"Proved undeveloped reserves ("PUD")". Proved reserves that are expected to be recovered from new wells on undrilled acreage or from existing wells where a relatively major expenditure is required for recompletion.
A-2
"Recompletion". The process of re-entering an existing wellbore that is either producing or not producing and completing new reservoirs in an attempt to establish or increase existing production.
"Reservoir". A porous and permeable underground formation containing a natural accumulation of producible oil and/or natural gas that is confined by impermeable rock or water barriers and is separate from other reservoirs.
"Spacing". The distance between wells producing from the same reservoir. Spacing is often expressed in terms of acres, e.g., 40-acre spacing, and is often established by regulatory agencies.
"Standardized measure". Discounted future net cash flows estimated by applying year-end prices to the estimated future production of year-end proved reserves. Future cash inflows are reduced by estimated future production and development costs based on period-end costs to determine pre-tax cash inflows. Future income taxes, if applicable, are computed by applying the statutory tax rate to the excess of pre-tax cash inflows over our tax basis in the natural gas and oil properties. Future net cash inflows after income taxes are discounted using a 10% annual discount rate.
"Success rate". All wells have produced hydrocarbons in commercially viable quantities.
"Undeveloped acreage". Lease acreage on which wells have not been drilled or completed to a point that would permit the production of commercial quantities of natural gas and oil regardless of whether such acreage contains proved reserves.
"Unit". The joining of all or substantially all interests in a reservoir or field, rather than a single tract, to provide for development and operation without regard to separate property interests. Also, the area covered by a unitization agreement.
"Waha". Natural Gas — Permian Basin Delivery Point.
"Wellbore". The hole drilled by the bit that is equipped for natural gas production on a completed well. Also called well or borehole.
"Working interest". The right granted to the lessee of a property to explore for and to produce and own natural gas or other minerals. The working interest owners bear the exploration, development, and operating costs on either a cash, penalty, or carried basis.
"WTI". West Texas Intermediate. A grade of crude oil used as a benchmark in oil pricing.
A-3
Shares

Vantage Energy Inc.
Common Stock
Prospectus
, 2016
Joint Book-Running Managers
Goldman, Sachs & Co.
Barclays
Credit Suisse
Citigroup
J.P. Morgan
Wells Fargo Securities
Senior Co-Managers
BofA Merrill Lynch
Capital One Securities
Deutsche Bank Securities
KeyBanc Capital Markets
SunTrust Robinson Humphrey
Tudor, Pickering, Holt & Co.
Co-Managers
ABN AMRO
Baird
BOK Financial Securities, Inc.
Fifth Third Securities
Heikkinen Energy Advisors
Williams Trading, LLC
Through and including , 2016 (the 25th day after the date of this prospectus), all dealers effecting transactions in these securities, whether or not participating in this offering, may be required to deliver a prospectus. This is in addition to a dealer's obligation to deliver a prospectus when acting as underwriters and with respect to an unsold allotment or subscription.
Part II
INFORMATION NOT REQUIRED IN PROSPECTUS
Item 13. Other expenses of issuance and distribution
The following table sets forth an itemized statement of the amounts of all expenses (excluding underwriting discounts and commissions) payable by us in connection with the registration of the common stock offered hereby. With the exception of the Registration Fee, FINRA Filing Fee and New York Stock Exchange listing fee), the amounts set forth below are estimates.
SEC Registration Fee |
| * | ||
FINRA Filing Fee |
| * | ||
New York Stock Exchange listing fee |
| * | ||
Accountants' fees and expenses |
| * | ||
Legal fees and expenses |
| * | ||
Printing and engraving expenses |
| * | ||
Transfer agent and registrar fees |
| * | ||
Miscellaneous |
| * | ||
| | | | | |
Total |
| $ | * | |
| | | | | |
| | | | | |
| | | | | |
- *
- To be filed by amendment.
Item 14. Indemnification of Directors and Officers
Our amended and restated certificate of incorporation will provide that a director will not be liable to the corporation or its stockholders for monetary damages to the fullest extent permitted by the DGCL. In addition, if the DGCL is amended to authorize the further elimination or limitation of the liability of directors, then the liability of a director of the corporation, in addition to the limitation on personal liability provided for in our certificate of incorporation, will be limited to the fullest extent permitted by the amended DGCL. Our amended and restated bylaws will provide that the corporation will indemnify, and advance expenses to, any officer or director to the fullest extent authorized by the DGCL.
Section 145 of the DGCL provides that a corporation may indemnify directors and officers as well as other employees and individuals against expenses, including attorneys' fees, judgments, fines and amounts paid in settlement in connection with specified actions, suits and proceedings whether civil, criminal, administrative, or investigative, other than a derivative action by or in the right of the corporation, if they acted in good faith and in a manner they reasonably believed to be in or not opposed to the best interests of the corporation and, with respect to any criminal action or proceeding, had no reasonable cause to believe their conduct was unlawful. A similar standard is applicable in the case of derivative actions, except that indemnification extends only to expenses, including attorneys' fees, incurred in connection with the defense or settlement of such action and the statute requires court approval before there can be any indemnification where the person seeking indemnification has been found liable to the corporation. The statute provides that it is not exclusive of other indemnification that may be granted by a corporation's certificate of incorporation, bylaws, disinterested director vote, stockholder vote, agreement or otherwise.
Our amended and restated certificate of incorporation will also contain indemnification rights for our directors and our officers. Specifically, our amended and restated certificate of incorporation will provide that we shall indemnify our officers and directors to the fullest extent authorized by the DGCL. Further, we may maintain insurance on behalf of our officers and directors against expense, liability or loss asserted incurred by them in their capacities as officers and directors.
II-1
We have obtained directors' and officers' insurance to cover our directors, officers and some of our employees for certain liabilities.
We will enter into written indemnification agreements with our directors and executive officers. Under these proposed agreements, if an officer or director makes a claim of indemnification to us, either a majority of the independent directors or independent legal counsel selected by the independent directors must review the relevant facts and make a determination whether the officer or director has met the standards of conduct under Delaware law that would permit (under Delaware law) and require (under the indemnification agreement) us to indemnify the officer or director.
The underwriting agreement provides for indemnification by the underwriters of us and our officers and directors, and by us of the underwriters, for certain liabilities arising under the Securities Act or otherwise in connection with this offering.
Item 15. Recent Sales of Unregistered Securities
In connection with its formation, on May 7, 2014, Vantage Energy Inc. issued 1,000 shares of its common stock, par value $0.01 per share, to Vantage Energy, LLC in exchange for a promissory note in the amount of $10. The issuance of such shares of common stock did not involve any underwriters, underwriting discounts or commissions or a public offering, and we believe that such issuance was exempt from registration requirements pursuant to Section 4(a)(2) of the Securities Act of 1933, as amended.
Item 16. Exhibits and financial statement schedules
See the Exhibit Index immediately following the signature page hereto, which is incorporated by reference as if fully set forth herein.
The undersigned registrant hereby undertakes to provide to the underwriters at the closing specified in the underwriting agreement certificates in such denominations and registered in such names as required by the underwriters to permit prompt delivery to each purchaser.
Insofar as indemnification for liabilities arising under the Securities Act may be permitted to directors, officers and controlling persons of the registrant pursuant to the foregoing provisions, or otherwise, the registrant has been advised that in the opinion of the Securities and Exchange Commission such indemnification is against public policy as expressed in the Securities Act and is, therefore, unenforceable. In the event that a claim for indemnification against such liabilities (other than the payment by the registrant of expenses incurred or paid by a director, officer or controlling person of the registrant in the successful defense of any action, suit or proceeding) is asserted by such director, officer or controlling person in connection with the securities being registered, the registrant will, unless in the opinion of its counsel the matter has been settled by controlling precedent, submit to a court of appropriate jurisdiction the question whether such indemnification by it is against public policy as expressed in the Securities Act and will be governed by the final adjudication of such issue.
The undersigned registrant hereby undertakes that:
(1) For purposes of determining any liability under the Securities Act, the information omitted from the form of prospectus filed as part of this registration statement in reliance upon Rule 430A and contained in a form of prospectus filed by the registrant pursuant to Rule 424(b)(1) or (4) or 497(h) under the Securities Act shall be deemed to be part of this registration statement as of the time it was declared effective.
(2) For the purpose of determining any liability under the Securities Act, each post-effective amendment that contains a form of prospectus shall be deemed to be a new registration statement relating to the securities offered therein, and the offering of such securities at that time shall be deemed to be the initial bona fide offering thereof.
II-2
Pursuant to the requirements of the Securities Act of 1933, the registrant has duly caused this registration statement to be signed on its behalf by the undersigned, thereunto duly authorized, in the City of Englewood, State of Colorado, on September 13, 2016.
|
By: |
|
/s/ ROGER J. BIEMANS Roger J. Biemans Chairman and Chief Executive Officer |
Each person whose signature appears below appoints Roger J. Biemans and Thomas B. Tyree, Jr., and each of them, any of whom may act without the joinder of the other, as his true and lawful attorneys-in-fact and agents, with full power of substitution and resubstitution, for him and in his name, place and stead, in any and all capacities, to sign any and all amendments (including post-effective amendments) to this Registration Statement and any Registration Statement (including any amendment thereto) for this offering that is to be effective upon filing pursuant to Rule 462(b) under the Securities Act of 1933, as amended, and to file the same, with all exhibits thereto, and all other documents in connection therewith, with the Securities and Exchange Commission, granting unto said attorneys-in-fact and agents full power and authority to do and perform each and every act and thing requisite and necessary to be done, as fully to all intents and purposes as he might or would do in person, hereby ratifying and confirming all that said attorneys-in-fact and agents or any of them or their or his substitute or substitutes, may lawfully do or cause to be done by virtue hereof.
Pursuant to the requirements of the Securities Act of 1933, as amended, this Registration Statement has been signed below by the following persons in the capacities and the dates indicated.
Signature
|
| Title |
| Date
|
|
|
|||
| /s/ ROGER J. BIEMANS Roger J. Biemans |
| Chairman and Chief Executive Officer (Principal Executive Officer) |
| September 13, 2016 |
/s/ THOMAS B. TYREE, JR. Thomas B. Tyree, Jr. |
|
President and Chief Financial Officer and Director (Principal Financial Officer) |
|
September 13, 2016 |
/s/ RYAN T. GOSNEY Ryan T. Gosney |
|
Vice President — Controller and Chief Accounting Officer (Principal Accounting Officer) |
|
September 13, 2016 |
/s/ S. WIL VANLOH, JR. S. Wil VanLoh, Jr. |
|
Director |
|
September 13, 2016 |
II-3
| /s/ E. BARTOW JONES E. Bartow Jones |
| Director | | September 13, 2016 |
/s/ JONATHAN C. FARBER Jonathan C. Farber |
|
Director |
|
September 13, 2016 |
/s/ BLAKE A. WEBSTER Blake A. Webster |
|
Director |
|
September 13, 2016 |
/s/ RALPH ALEXANDER Ralph Alexander |
|
Director |
|
September 13, 2016 |
/s/ TOWNES G. PRESSLER, JR. Townes G. Pressler, Jr. |
|
Director |
|
September 13, 2016 |
II-4
| Exhibit number |
| Description | |
|---|---|---|---|
| *1.1 | | Form of Underwriting Agreement. | |
*2.1 |
|
Form of Master Reorganization Agreement. |
|
††2.2 |
|
Asset Purchase Agreement between Pennsylvania Land Resources, LLC and Vantage Energy Appalachia II, LLC, dated as of May 16, 2016. |
|
*3.1 |
|
Form of Amended and Restated Certificate of Incorporation of Vantage Energy Inc. |
|
*3.2 |
|
Form of Amended and Restated Bylaws of Vantage Energy Inc. |
|
*4.1 |
|
Form of Sponsor Shareholders' Agreement. |
|
*5.1 |
|
Form of opinion of Vinson & Elkins L.L.P. as to the legality of the securities being registered. |
|
*10.1 |
|
Credit Agreement, dated as of November 29, 2012, among Vantage Energy II, LLC, as borrower, Wells Fargo Bank, N.A., as administrative agent, and the lenders party thereto. |
|
*10.2 |
|
First Amendment to Credit Agreement, dated as of December 3, 2013, among Vantage Energy II, LLC, as borrower, Wells Fargo Bank, N.A., as administrative agent, and the lenders party thereto. |
|
*10.3 |
|
Second Amendment to Credit Agreement, dated as of May 8, 2014, among Vantage Energy II, LLC, as borrower, Wells Fargo Bank, N.A., as administrative agent, and the lenders party thereto. |
|
*10.4 |
|
Third Amendment to Credit Agreement, dated as of July 10, 2014, among Vantage Energy II, LLC, as borrower, Wells Fargo Bank, N.A., as administrative agent, and the lenders party thereto. |
|
*10.5 |
|
Fourth Amendment to Credit Agreement, dated as of October 10, 2014, among Vantage Energy II, LLC, as borrower, Wells Fargo Bank, N.A., as administrative agent, and the lenders party thereto. |
|
*10.6 |
|
Fifth Amendment to Credit Agreement, dated as of December 4, 2014, among Vantage Energy II, LLC, as borrower, Wells Fargo Bank, N.A., as administrative agent, and the lenders party thereto. |
|
*10.7 |
|
Sixth Amendment to Credit Agreement, dated as of February 10, 2015, among Vantage Energy II, LLC, as borrower, Wells Fargo Bank, N.A., as administrative agent, and the lenders party thereto. |
|
*10.8 |
|
Seventh Amendment to Credit Agreement, dated as of May 15, 2015, among Vantage Energy II, LLC, as borrower, Wells Fargo Bank, N.A., as administrative agent, and the lenders party thereto. |
|
*10.9 |
|
Eighth Amendment to Credit Agreement and Third Amendment to Security Agreement, dated as of April 29, 2016, among Vantage Energy II, LLC, as borrower, Wells Fargo Bank, N.A., as administrative agent, and the lenders party thereto. |
|
*10.10 |
|
Ninth Amendment to Credit Agreement, dated as of June 1, 2016, among Vantage Energy II, LLC, as borrower, Wells Fargo Bank, N.A., as administrative agent, and the lenders party thereto. |
|
II-5
| Exhibit number |
| Description | |
|---|---|---|---|
| *10.11 | | Second Amended and Restated Credit Agreement, dated as of December 20, 2013, among Vantage Energy, LLC, as borrower, Wells Fargo Bank, N.A., as administrative agent, and the lenders party thereto. | |
*10.12 |
|
First Amendment to Second Amended and Restated Credit Agreement, dated as of May 12, 2014, among Vantage Energy, LLC as borrower, Wells Fargo Bank, N.A., as administrative agent, and the lenders party thereto. |
|
*10.13 |
|
Second Amendment to Second Amended and Restated Credit Agreement, dated as of October 10, 2014, among Vantage Energy, LLC as borrower, Wells Fargo Bank, N.A., as administrative agent, and the lenders party thereto. |
|
*10.14 |
|
Third Amendment to Second Amended and Restated Credit Agreement, dated as of February 10, 2015, among Vantage Energy, LLC as borrower, Wells Fargo Bank, N.A., as administrative agent, and the lenders party thereto. |
|
*10.15 |
|
Fourth Amendment to Second Amended and Restated Credit Agreement, dated as of May 15, 2015, among Vantage Energy, LLC as borrower, Wells Fargo Bank, N.A., as administrative agent, and the lenders party thereto. |
|
*10.16 |
|
Fifth Amendment to Second Amended and Restated Credit Agreement and Second Amendment to Second Amended and Restated Security Agreement, dated as of April 29, 2016, among Vantage Energy, LLC as borrower, Wells Fargo Bank, N.A., as administrative agent, and the lenders party thereto. |
|
*10.17 |
|
Sixth Amendment to Second Amended and Restated Credit Agreement, dated as of June 1, 2016, among Vantage Energy, LLC as borrower, Wells Fargo Bank, N.A., as administrative agent, and the lenders party thereto. |
|
*10.18 |
|
Second Lien Credit Agreement, dated as of December 20, 2013, among Vantage Energy, LLC, as borrower, Credit Suisse AG, Cayman Islands Branch, as administrative agent, and the lenders party thereto. |
|
*10.19 |
|
First Amendment to Second Lien Credit Agreement, dated as of May 15, 2015, among Vantage Energy, LLC, as borrower, Credit Suisse AG, Cayman Islands Branch, as administrative agent, and the lenders party thereto. |
|
*10.20 |
|
Second Amendment to Second Lien Credit Agreement, dated as of June 1, 2016, among Vantage Energy, LLC, as borrower, Credit Suisse AG, Cayman Islands Branch, as administrative agent, and the lenders party thereto. |
|
*10.21 |
|
Second Lien Term Loan Credit Agreement, dated as of May 8, 2014, among Vantage Energy II, LLC, as borrower, Wilmington Trust, National Association, as administrative agent, and the lenders party thereto. |
|
*10.22 |
|
First Amendment and Waiver of Credit Agreement, dated as of December 4, 2014, among Vantage Energy II, LLC, as borrower, Wilmington Trust, National Association, as administrative agent, and the lenders party thereto. |
|
*10.23 |
|
Second Amendment to Second Lien Term Loan Credit Agreement, dated as of May 15, 2015, among Vantage Energy II, LLC, as borrower, Wilmington Trust, National Association, as administrative agent, and the lenders party thereto. |
|
II-6
| Exhibit number |
| Description | |
|---|---|---|---|
| *10.24 | | Third Amendment to Second Lien Term Loan Credit Agreement and Third Amendment to Security Agreement, dated as of April 29, 2016, among Vantage Energy II, LLC, as borrower, Wilmington Trust, National Association, as administrative agent and the lenders party thereto. | |
*†10.25 |
|
Form of Indemnification Agreement. |
|
*10.26 |
|
Form of New Revolving Credit Agreement. |
|
*†10.27 |
|
Form of Vantage Energy Inc. Long-Term Incentive Plan. |
|
*†10.28 |
|
Form of Employment Agreement (Named Executive Officers). |
|
*†10.29 |
|
Form of Employment Agreement (Roger J. Biemans). |
|
*21.1 |
|
List of subsidiaries of Vantage Energy Inc. |
|
23.1 |
|
Consent of KPMG LLP (Vantage Energy Inc.). |
|
23.2 |
|
Consent of KPMG LLP (Vantage Energy, LLC). |
|
23.3 |
|
Consent of KPMG LLP (Vantage Energy II, LLC). |
|
23.4 |
|
Consent of Netherland, Sewell & Associates, Inc. |
|
23.5 |
|
Consent of Wright & Company, Inc. |
|
23.6 |
|
Consent of Vinson & Elkins L.L.P. (included as part of Exhibit 5.1 hereto). |
|
24.1 |
|
Power of Attorney (included on the signature page of this Registration Statement). |
|
99.1 |
|
Netherland, Sewell & Associates, Inc. Summary of Reserves at December 31, 2015 Vantage Energy, LLC. |
|
99.2 |
|
Netherland, Sewell & Associates, Inc. Summary of Reserves at December 31, 2014 Vantage Energy, LLC. |
|
99.3 |
|
Wright & Company, Inc. Summary of Reserves at December 31, 2015 (Vantage Energy, LLC). |
|
99.4 |
|
Wright & Company, Inc. Summary of Reserves at December 31, 2015 (Vantage Energy II, LLC). |
|
99.5 |
|
Wright & Company, Inc. Summary of Reserves at December 31, 2014 (Vantage Energy, LLC). |
|
99.6 |
|
Wright & Company, Inc. Summary of Reserves at December 31, 2014 (Vantage Energy II, LLC). |
|
99.7 |
|
Consent of Justin A. Gannon, as Director Nominee. |
|
- *
- To
be filed by amendment.
- **
- Previously
filed.
- †
- Compensatory
plan or arrangement.
- ††
- Schedules and exhibits to this Exhibit omitted pursuant to Regulation S-K Item 601(b)(2). The Company agrees to furnish supplementally a copy of any omitted schedule or exhibit to the SEC upon request.
II-7