Attached files
| file | filename |
|---|---|
| 8-K - 8-K - HUTTIG BUILDING PRODUCTS INC | d257699d8k.htm |
Huttig Building Products Nasdaq: HBP Investor Presentation Fall 2016 Exhibit 99.1
SAFE HARBOR / FORWARD LOOKING STATEMENT These presentation materials may contain forward-looking statements as defined by the U.S. Private Securities Litigation Reform Act of 1995 (“Reform Act”). Statements made in this presentation looking forward in time, including, but not limited to, statements regarding our current views with respect to future financial performance, the housing market, distribution channels, sales, supplier relationships, inventory levels, the ability to meet customer needs, competitive posture, obligations with respect to environmental remediation (including remediation of the Montana site in accordance with regulatory requirements and cost estimates), deterioration in our relationship with our unionized employees, including work stoppages or other disputes, and the financial impact of litigation or otherwise, are included pursuant to the “safe harbor” provision of the Reform Act. These statements present management’s expectations, beliefs, plans and objectives regarding our future financial performance and assumptions or judgments concerning such performance. These forward-looking statements are based on current projections, estimates, assumptions and judgments, and involve known and unknown risks and uncertainties. We disclaim any obligation to publicly update or revise any of these forward-looking statements, whether as a result of new information, future events or otherwise. There are a number of other important factors that could cause our actual results or outcomes to differ materially from those expressed or implied in the forward-looking statements, including, but not limited to, those detailed in Huttig’s Annual Report on Form 10-K for the year ended December 31, 2015 filed with the U.S. Securities and Exchange Commission (“SEC”) and other filings with the SEC, all of which are available on our website. Forward-looking statements should not be relied upon as a predictor of actual results. NON-GAAP FINANCIAL MEASURES Huttig defines Adjusted EBITDA as net income adjusted for interest, income taxes, depreciation and amortization and other special significant items. Huttig presents Adjusted EBITDA because it is a primary measure used by management, and by similar companies in the industry, to evaluate operating performance and Huttig believes it enhances investors’ overall understanding of the financial performance of our business. Additionally, Huttig defines Free Cash Flow as Adjusted EBITDA less capital expenditures. Huttig presents Free Cash Flow because it is a meaningful indicator of cash available for the execution of Huttig’s business strategy. Huttig defines Coverage Ratio as Adjusted EBITDA less capital expenditures divided by interest expense. The Coverage Ratio represents Huttig’s ability to meet financial obligations and its potential to fund growth opportunities. Adjusted EBITDA, Free Cash Flow, Coverage Ratio are not recognized terms under U.S. generally accepted accounting principles (“GAAP”) and do not purport to be alternatives to net income or operating cash flow as a measure of operating performance. Huttig compensates for the limitations of using non-GAAP financial measures by using them to supplement GAAP results to provide a more complete understanding of the factors affecting the business. Because not all companies use identical calculations, Huttig’s presentation of Adjusted EBITDA, Free Cash Flow, Coverage Ratio may not be comparable to other similarly titled measures of other companies. The table in the appendix presents a reconciliation of Adjusted EBITDA to net income (loss) attributable to Huttig for the periods indicated. Safe Harbor / Non-GAAP Financial Measures Huttig Building Products Fall 2016
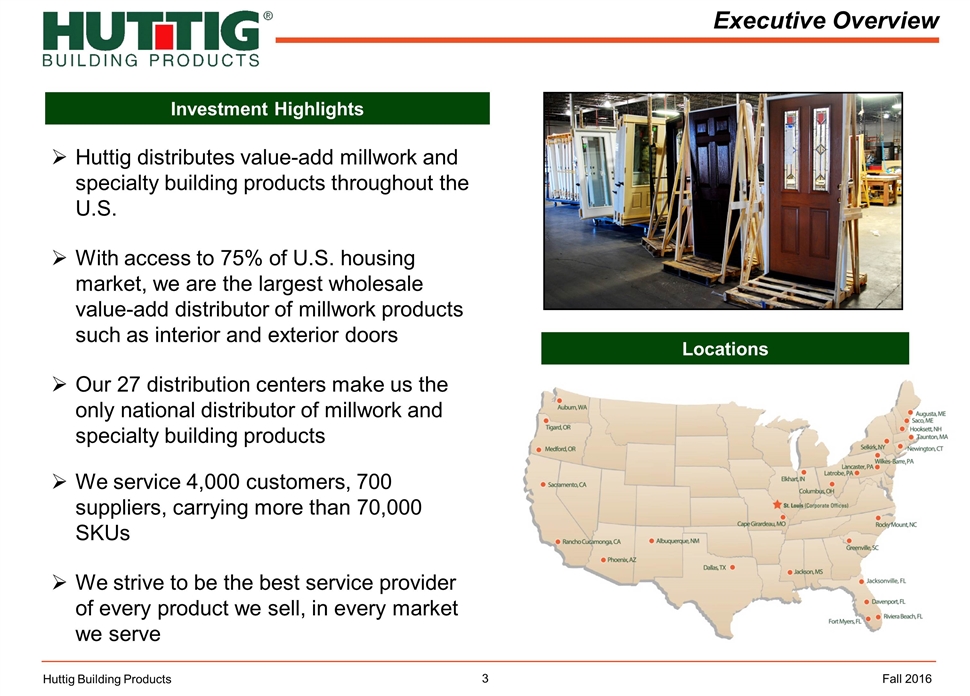
Executive Overview Huttig Building Products Locations Fall 2016 Investment Highlights Huttig distributes value-add millwork and specialty building products throughout the U.S. With access to 75% of U.S. housing market, we are the largest wholesale value-add distributor of millwork products such as interior and exterior doors Our 27 distribution centers make us the only national distributor of millwork and specialty building products We service 4,000 customers, 700 suppliers, carrying more than 70,000 SKUs We strive to be the best service provider of every product we sell, in every market we serve
Company / Industry Overview Value Proposition / Strategy Overview Financial Overview Summary / Q&A Huttig Building Products Fall 2016
Company / Industry Overview Huttig Building Products Fall 2016
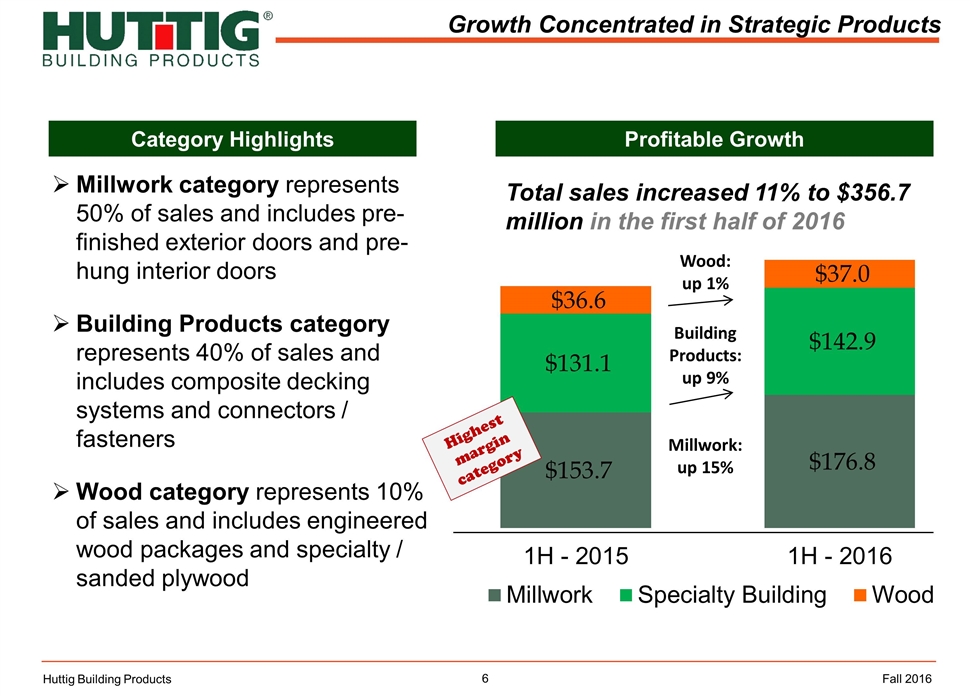
Growth Concentrated in Strategic Products Total sales increased 11% to $356.7 million in the first half of 2016 Millwork: up 15% Wood: up 1% Building Products: up 9% Category Highlights Profitable Growth Millwork category represents 50% of sales and includes pre-finished exterior doors and pre-hung interior doors Building Products category represents 40% of sales and includes composite decking systems and connectors / fasteners Wood category represents 10% of sales and includes engineered wood packages and specialty / sanded plywood Highest margin category Huttig Building Products Fall 2016
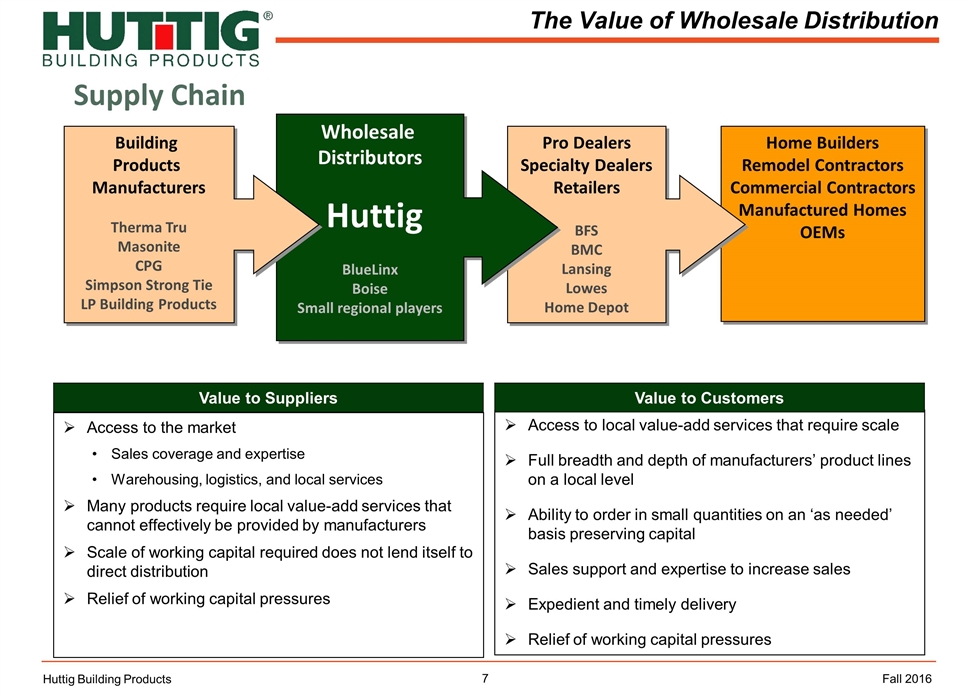
Home Builders Remodel Contractors Commercial Contractors Manufactured Homes OEMs Pro Dealers Specialty Dealers Retailers BFS BMC Lansing Lowes Home Depot Wholesale Distributors Huttig BlueLinx Boise Small regional players Building Products Manufacturers Therma Tru Masonite CPG Simpson Strong Tie LP Building Products The Value of Wholesale Distribution Access to the market Sales coverage and expertise Warehousing, logistics, and local services Many products require local value-add services that cannot effectively be provided by manufacturers Scale of working capital required does not lend itself to direct distribution Relief of working capital pressures Huttig Building Products Value to Suppliers Access to local value-add services that require scale Full breadth and depth of manufacturers’ product lines on a local level Ability to order in small quantities on an ‘as needed’ basis preserving capital Sales support and expertise to increase sales Expedient and timely delivery Relief of working capital pressures Value to Customers Fall 2016 Supply Chain
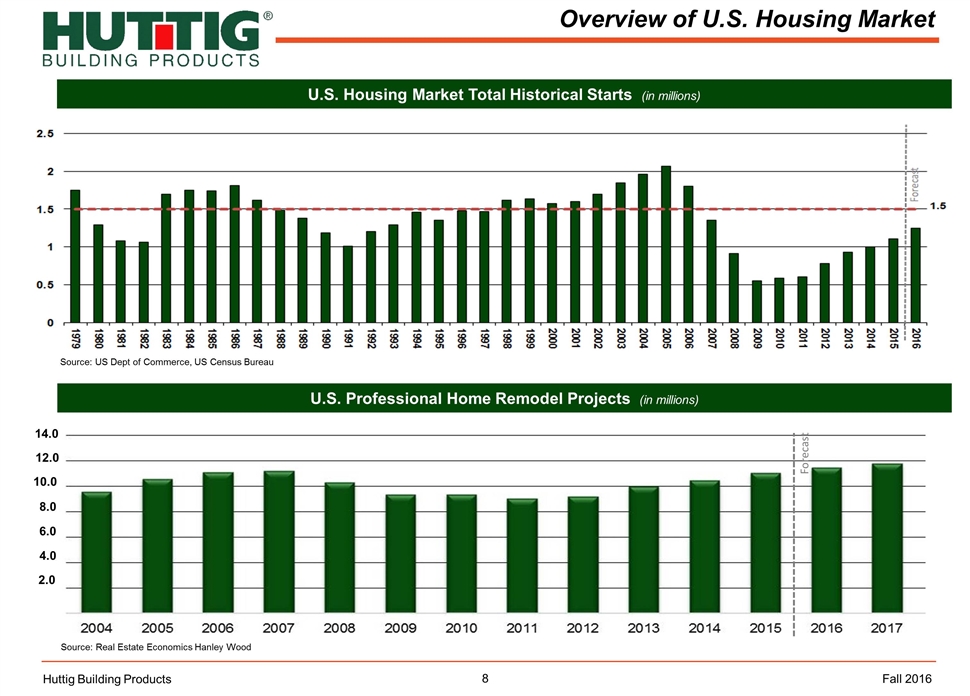
Overview of U.S. Housing Market Source: US Dept of Commerce, US Census Bureau U.S. Housing Market Total Historical Starts (in millions) Huttig Building Products U.S. Professional Home Remodel Projects (in millions) Source: Real Estate Economics Hanley Wood Forecast 14.0 12.0 10.0 8.0 4.0 6.0 2.0 Fall 2016
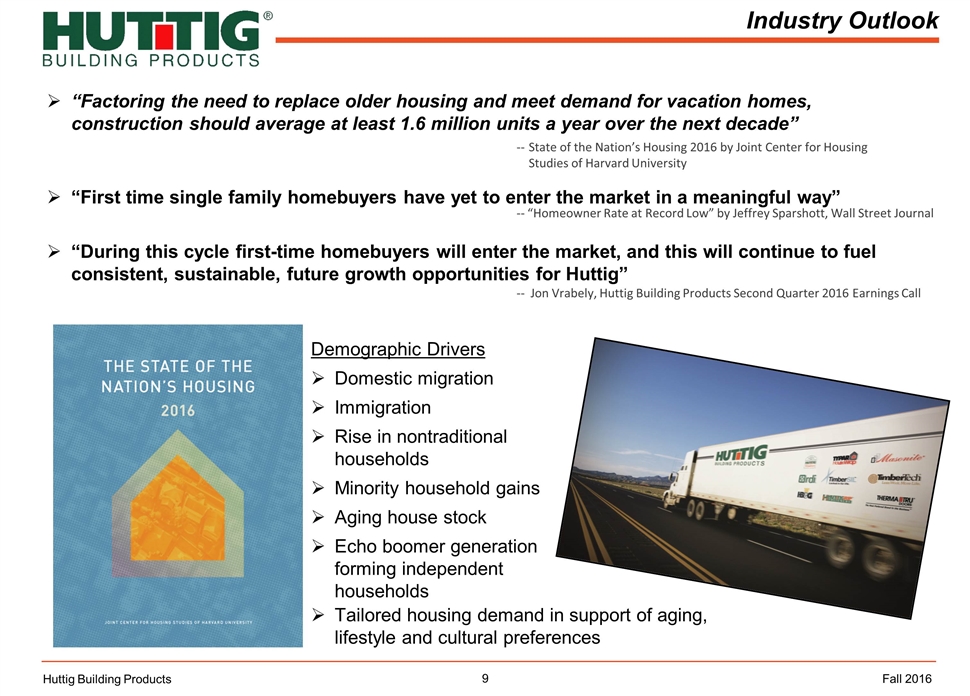
Industry Outlook Huttig Building Products “Factoring the need to replace older housing and meet demand for vacation homes, construction should average at least 1.6 million units a year over the next decade” “First time single family homebuyers have yet to enter the market in a meaningful way” “During this cycle first-time homebuyers will enter the market, and this will continue to fuel consistent, sustainable, future growth opportunities for Huttig” -- “Homeowner Rate at Record Low” by Jeffrey Sparshott, Wall Street Journal -- Jon Vrabely, Huttig Building Products Second Quarter 2016 Earnings Call -- State of the Nation’s Housing 2016 by Joint Center for Housing Studies of Harvard University Fall 2016 Demographic Drivers Domestic migration Immigration Rise in nontraditional households Minority household gains Aging house stock Echo boomer generation forming independent households Tailored housing demand in support of aging, lifestyle and cultural preferences
Value Proposition / Strategy Overview Huttig Building Products Fall 2016
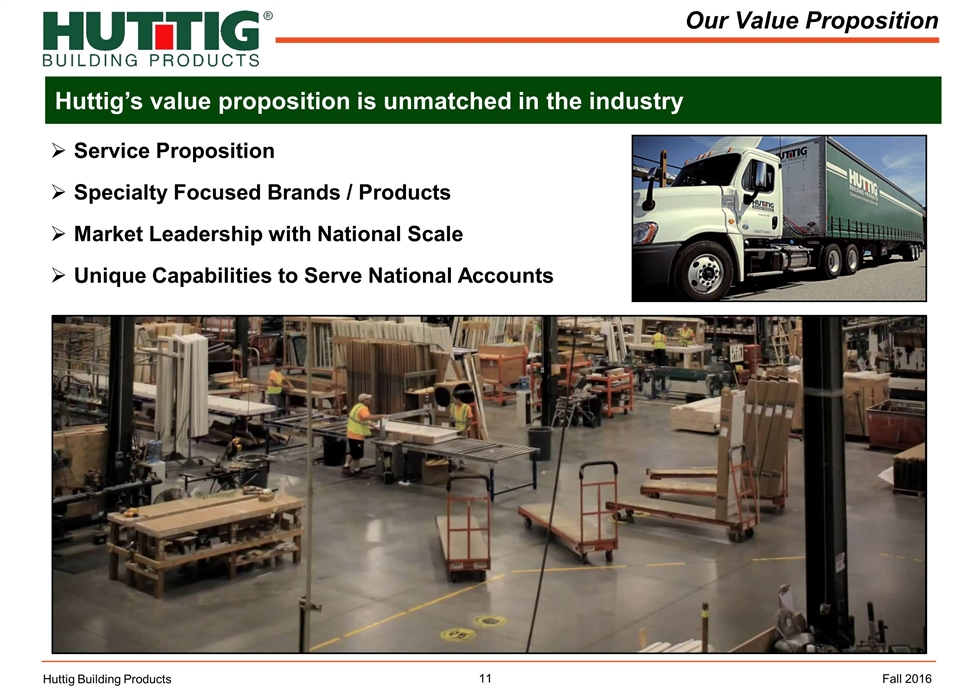
Service Proposition Specialty Focused Brands / Products Market Leadership with National Scale Unique Capabilities to Serve National Accounts Huttig’s value proposition is unmatched in the industry Our Value Proposition Huttig Building Products Fall 2016
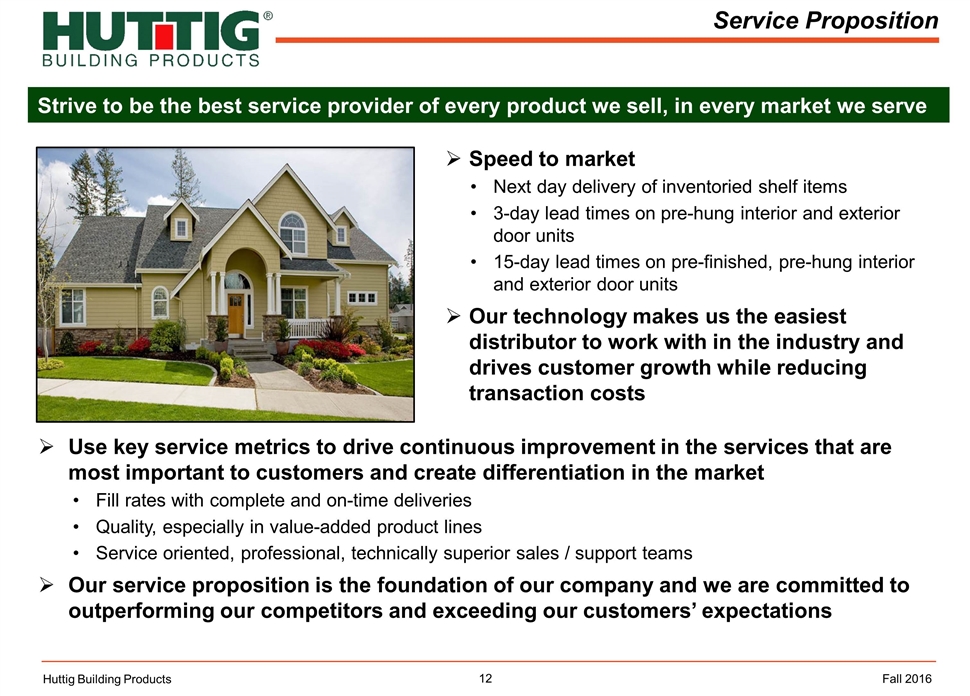
Service Proposition Huttig Building Products Fall 2016 Speed to market Next day delivery of inventoried shelf items 3-day lead times on pre-hung interior and exterior door units 15-day lead times on pre-finished, pre-hung interior and exterior door units Our technology makes us the easiest distributor to work with in the industry and drives customer growth while reducing transaction costs Use key service metrics to drive continuous improvement in the services that are most important to customers and create differentiation in the market Fill rates with complete and on-time deliveries Quality, especially in value-added product lines Service oriented, professional, technically superior sales / support teams Our service proposition is the foundation of our company and we are committed to outperforming our competitors and exceeding our customers’ expectations Strive to be the best service provider of every product we sell, in every market we serve
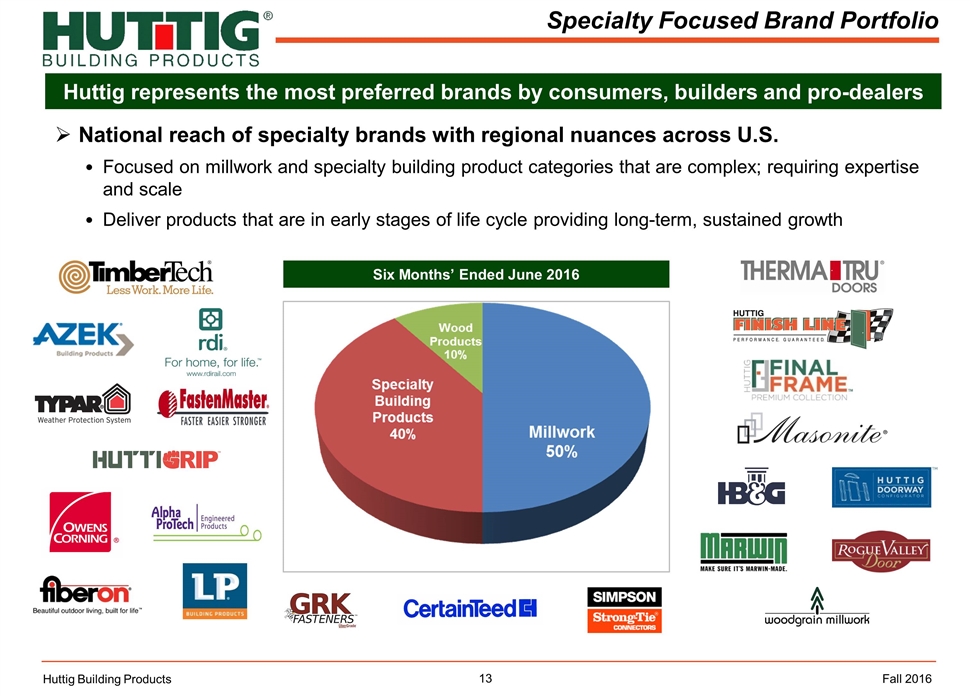
Specialty Focused Brand Portfolio Huttig represents the most preferred brands by consumers, builders and pro-dealers Huttig Building Products Six Months’ Ended June 2016 Fall 2016 National reach of specialty brands with regional nuances across U.S. Focused on millwork and specialty building product categories that are complex; requiring expertise and scale Deliver products that are in early stages of life cycle providing long-term, sustained growth
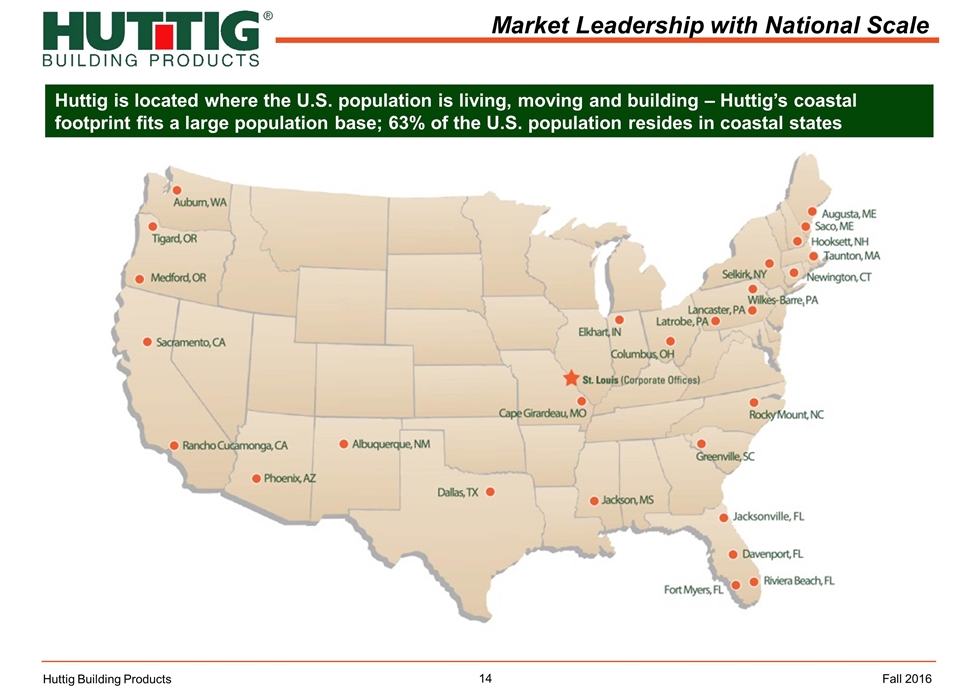
Huttig is located where the U.S. population is living, moving and building – Huttig’s coastal footprint fits a large population base; 63% of the U.S. population resides in coastal states Market Leadership with National Scale Huttig Building Products Fall 2016
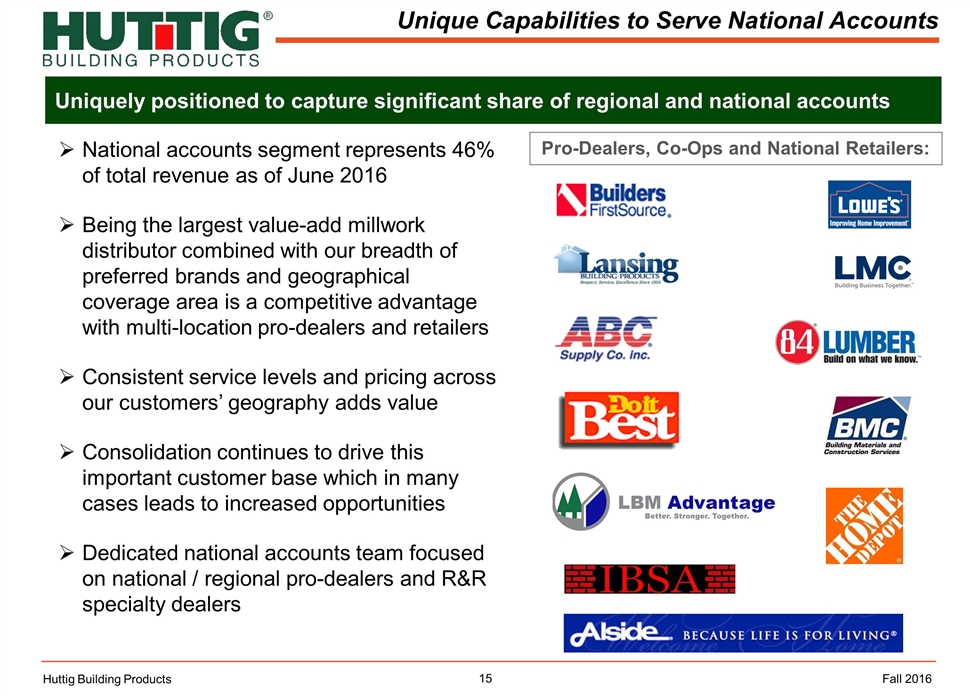
Unique Capabilities to Serve National Accounts Uniquely positioned to capture significant share of regional and national accounts Huttig Building Products National accounts segment represents 46% of total revenue as of June 2016 Being the largest value-add millwork distributor combined with our breadth of preferred brands and geographical coverage area is a competitive advantage with multi-location pro-dealers and retailers Consistent service levels and pricing across our customers’ geography adds value Consolidation continues to drive this important customer base which in many cases leads to increased opportunities Dedicated national accounts team focused on national / regional pro-dealers and R&R specialty dealers Fall 2016 Pro-Dealers, Co-Ops and National Retailers:
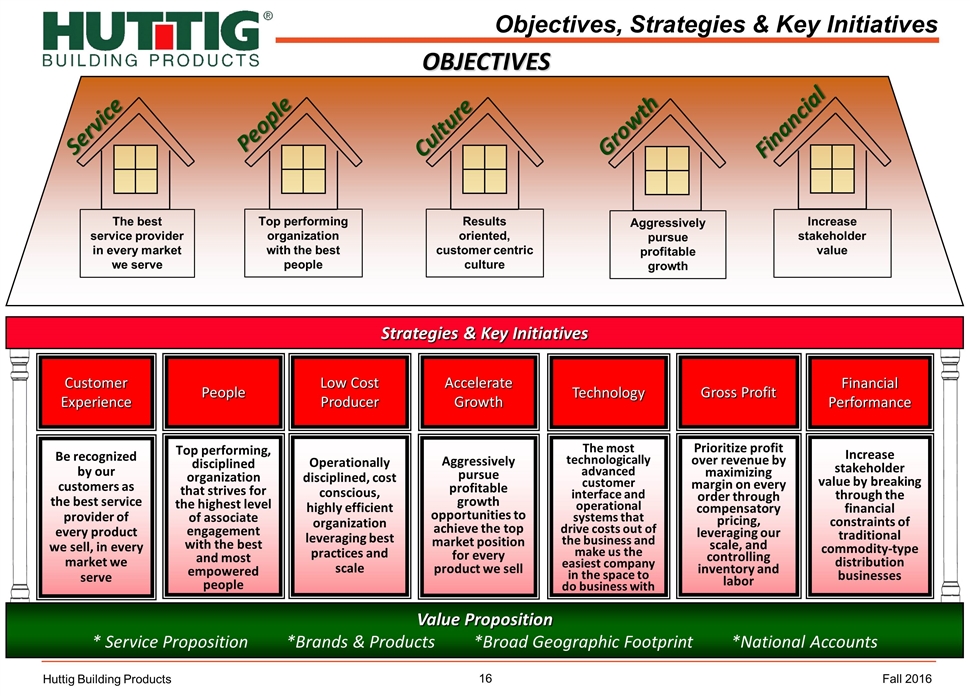
Strategies & Key Initiatives Objectives, Strategies & Key Initiatives OBJECTIVES Value Proposition * Service Proposition *Brands & Products *Broad Geographic Footprint *National Accounts Accelerate Growth Aggressively pursue profitable growth opportunities to achieve the top market position for every product we sell Low Cost Producer Operationally disciplined, cost conscious, highly efficient organization leveraging best practices and scale Customer Experience Be recognized by our customers as the best service provider of every product we sell, in every market we serve Gross Profit Prioritize profit over revenue by maximizing margin on every order through compensatory pricing, leveraging our scale, and controlling inventory and labor Financial Performance People Top performing, disciplined organization that strives for the highest level of associate engagement with the best and most empowered people Technology The most technologically advanced customer interface and operational systems that drive costs out of the business and make us the easiest company in the space to do business with The best service provider in every market we serve Top performing organization with the best people Aggressively pursue profitable growth Service People Culture Growth Financial Increase stakeholder value Results oriented, customer centric culture Increase stakeholder value by breaking through the financial constraints of traditional commodity-type distribution businesses Huttig Building Products Fall 2016
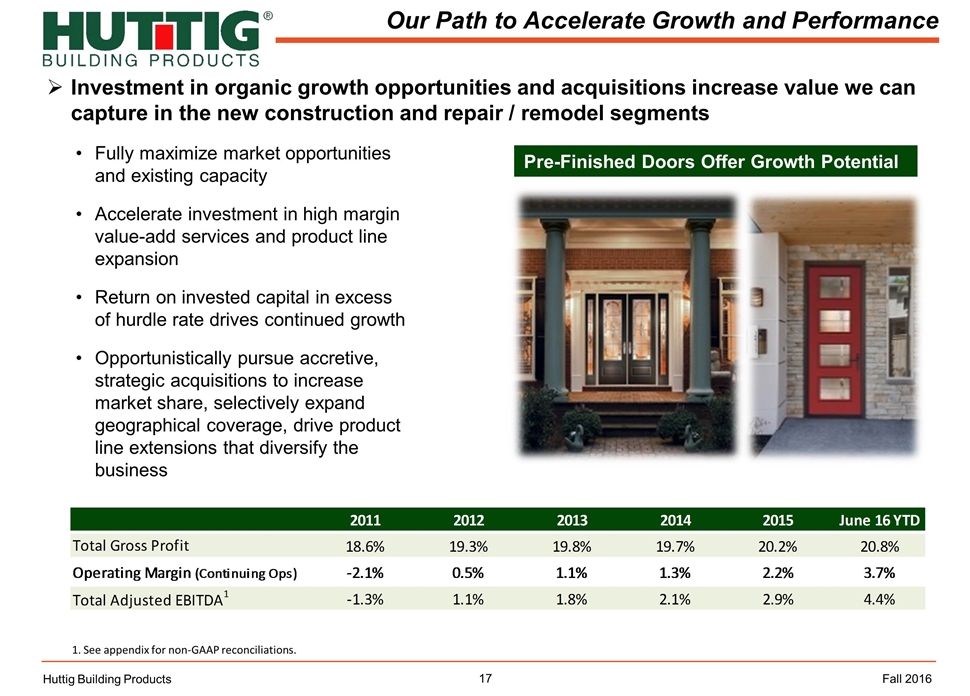
Investment in organic growth opportunities and acquisitions increase value we can capture in the new construction and repair / remodel segments Our Path to Accelerate Growth and Performance Huttig Building Products 1. See appendix for non-GAAP reconciliations. Fully maximize market opportunities and existing capacity Accelerate investment in high margin value-add services and product line expansion Return on invested capital in excess of hurdle rate drives continued growth Opportunistically pursue accretive, strategic acquisitions to increase market share, selectively expand geographical coverage, drive product line extensions that diversify the business Fall 2016 Pre-Finished Doors Offer Growth Potential Slide Q3 2015 IR Presentation 2011 2012 2013 2014 2015 June 16 YTD Total Gross Profit 0.186 0.193 0.19800000000000001 0.19700000000000001 0.20200000000000001 0.20801794224838802 2.2000000000000002 2.2000000000000002 Operating Margin (Continuing Ops) -2.1% .5% 1.0999999999999999 1.3% 2.2% 3.7% Total Adjusted EBITDA1 -1.3% 1.0999999999999999 1.8% 2.1% 2.9% 4.4%
Financial Overview Huttig Building Products Fall 2016
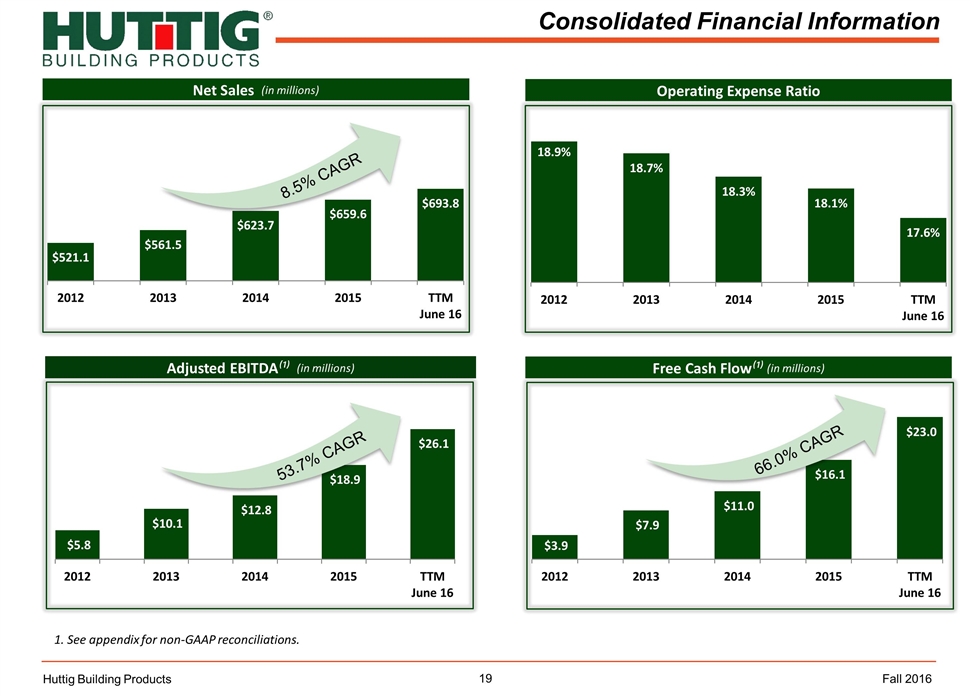
Consolidated Financial Information Huttig Building Products Net Sales (in millions) Operating Expense Ratio Free Cash Flow⁽¹⁾ (in millions) 1. See appendix for non-GAAP reconciliations. Adjusted EBITDA⁽¹⁾ (in millions) Fall 2016 53.7% CAGR 66.0% CAGR 8.5% CAGR
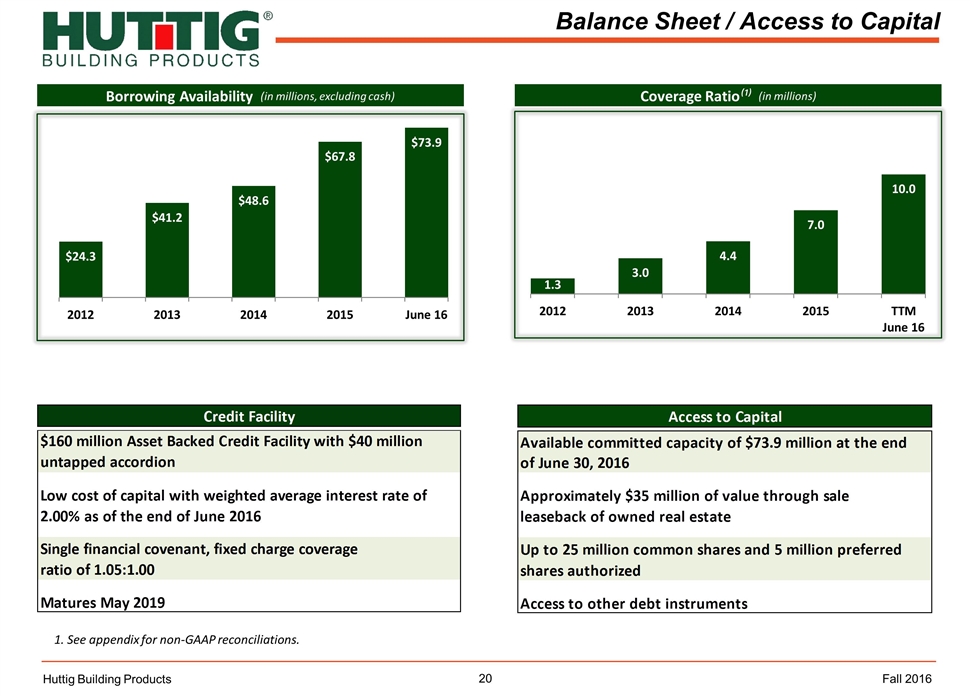
Balance Sheet / Access to Capital Huttig Building Products Borrowing Availability (in millions, excluding cash) Coverage Ratio⁽¹⁾ (in millions) Fall 2016 1. See appendix for non-GAAP reconciliations. Credit Facility Bal Sheet $160 million Asset Backed Credit Facility with $40 million untapped accordion Low cost of capital with weighted average interest rate of 2.00% as of the end of June 2016 Single financial covenant, fixed charge coverage ratio of 1.05:1.00 Matures May 2019 Access to Capital Bal Sheet Available committed capacity of $73.9 million at the end of June 30, 2016 Approximately $35 million of value through sale leaseback of owned real estate Up to 25 million common shares and 5 million preferred shares authorized Other debt instruments Credit Facility Bal Sheet $160 million Asset Backed Credit Facility with $40 million untapped accordion Low cost of capital with weighted average interest rate of 2.00% as of the end of June 2016 Single financial covenant, fixed charge coverage ratio of 1.05:1.00 Matures May 2019 Access to Capital Bal Sheet Available committed capacity of $73.9 million at the end of June 30, 2016 Approximately $35 million of value through sale leaseback of owned real estate Up to 25 million common shares and 5 million preferred shares authorized Access to other debt instruments
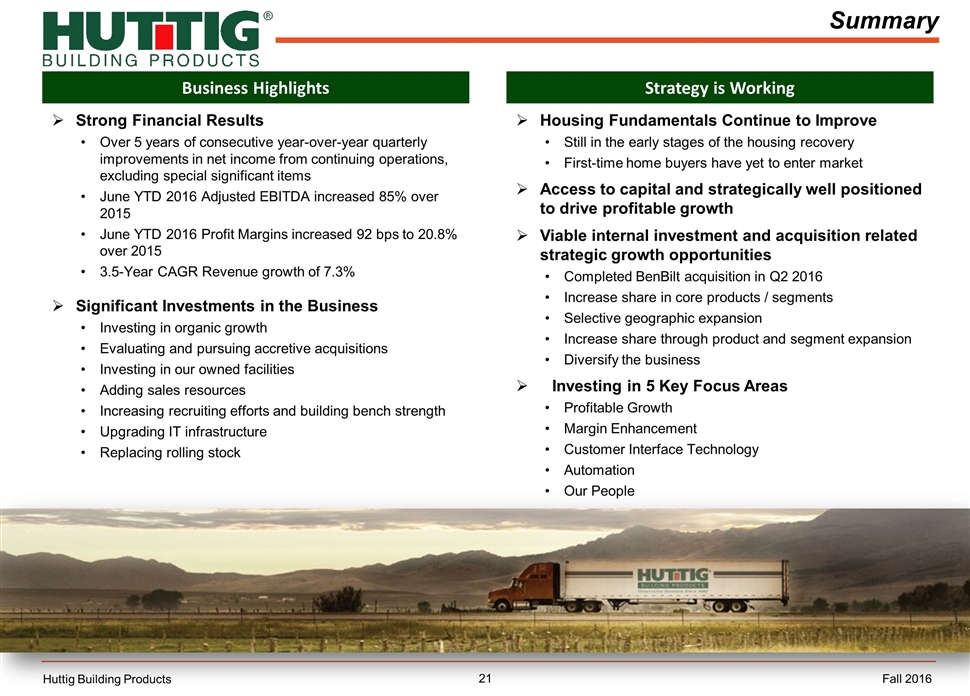
Summary Housing Fundamentals Continue to Improve Still in the early stages of the housing recovery First-time home buyers have yet to enter market Access to capital and strategically well positioned to drive profitable growth Viable internal investment and acquisition related strategic growth opportunities Completed BenBilt acquisition in Q2 2016 Increase share in core products / segments Selective geographic expansion Increase share through product and segment expansion Diversify the business Investing in 5 Key Focus Areas Profitable Growth Margin Enhancement Customer Interface Technology Automation Our People Business Highlights Strategy is Working Huttig Building Products Strong Financial Results Over 5 years of consecutive year-over-year quarterly improvements in net income from continuing operations, excluding special significant items June YTD 2016 Adjusted EBITDA increased 85% over 2015 June YTD 2016 Profit Margins increased 92 bps to 20.8% over 2015 3.5-Year CAGR Revenue growth of 7.3% Significant Investments in the Business Investing in organic growth Evaluating and pursuing accretive acquisitions Investing in our owned facilities Adding sales resources Increasing recruiting efforts and building bench strength Upgrading IT infrastructure Replacing rolling stock Fall 2016
APPENDIX Huttig Building Products Fall 2016
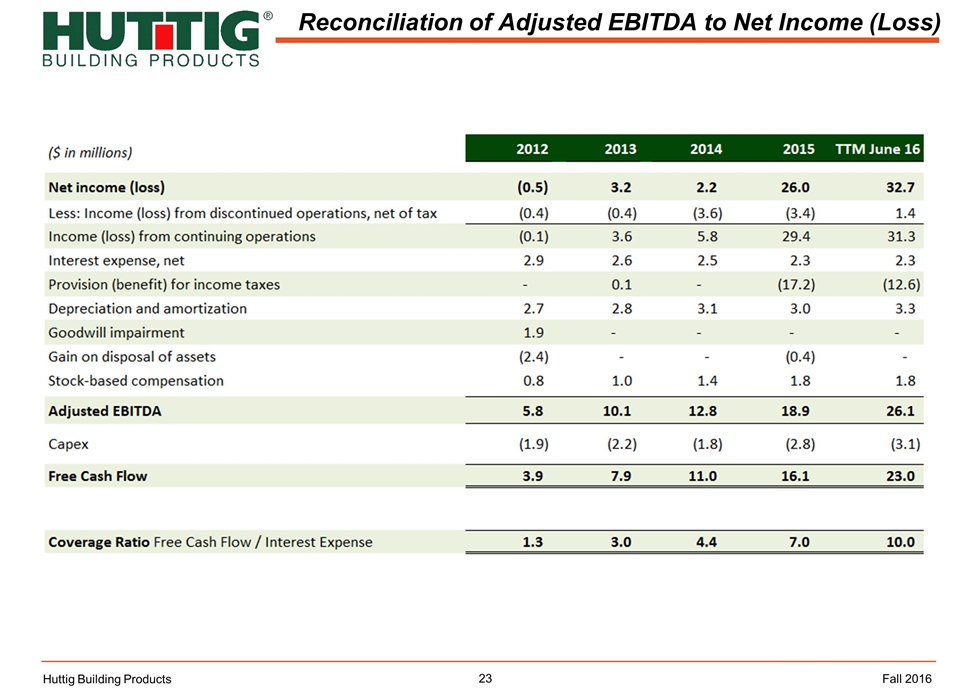
Reconciliation of Adjusted EBITDA to Net Income (Loss) Huttig Building Products Fall 2016
