Attached files
| file | filename |
|---|---|
| 8-K - 8-K - ZIONS BANCORPORATION, NATIONAL ASSOCIATION /UT/ | a20160912-coverpagexbarcla.htm |

Barclays 2016 Global Financial Services Conference
September 12-14, 2016

2
Forward-Looking Statements; Use of Non-GAAP Financial Measures; Peer Group Key
Statements in this presentation that are based on other than historical data or that express the Company’s expectations regarding future
events or determinations are forward-looking within the meaning of the Private Securities Litigation Reform Act of 1995. Statements
based on historical data are not intended and should not be understood to indicate the Company’s expectations regarding future events.
Forward-looking statements provide current expectations or forecasts or intentions regarding future events or determinations. These
forward-looking statements are not guarantees of future performance or determinations, nor should they be relied upon as representing
management’s views as of any subsequent date. Forward-looking statements involve significant risks and uncertainties, and actual results
may differ materially from those presented, either expressed or implied, in this presentation. Factors that could cause actual results to
differ materially from those expressed in the forward-looking statements include the actual amount and duration of declines in the price
of oil and gas, our ability to meet our efficiency and noninterest expense goals, as well as other factors discussed in the Company’s most
recent Annual Report on Form 10-K and Quarterly Report on Form 10-Q, filed with the Securities and Exchange Commission (“SEC”) and
available at the SEC’s Internet site (http://www.sec.gov).
Except as required by law, the Company specifically disclaims any obligation to update any factors or to publicly announce the result of
revisions to any of the forward-looking statements included herein to reflect future events or developments.
This document contains several references to non-GAAP measures, including pre-provision net revenue and the “efficiency ratio,” which
are common industry terms used by investors and financial services analysts. Certain of these non-GAAP measures are key inputs into
Zions’ management compensation and are used in Zions’ strategic goals that have been and may continue to be articulated to investors.
Therefore, the use of such non-GAAP measures are believed by management to be of substantial interest to the consumers of these
financial disclosures and are used prominently throughout the disclosures. A full reconciliation of the difference between such measures
and GAAP financials is provided within the document, and users of this document are encouraged to carefully review this reconciliation.
ASB: Associated Banc-Corp
BAC: Bank of America
BBT: BB&T Corporation
BOKF: BOK Financial Corporation
C: Citigroup, Inc.
CBSH: Commerce Bancshares, Inc.
CFG: Citizens Financial Group, Inc.
CMA: Comerica Incorporated
EWBC: East West Bancorp, Inc.
FHN: First Horizon National Corporation
FITB: Fifth Third Bancorp
FMER: FirstMerit Corporation
FRC: First Republic Bank
HBAN: Huntington Bancshares Incorporated
JPM: JPMorgan Chase & Co.
KEY: KeyCorp
MTB: M&T Bank Corporation
PBCT: People’s United Financial, Inc.
PNC: PNC Financial Services Group
RF: Regions Financial Corporation
SNV: Synovus Financial Corp.
STI: SunTrust Banks, Inc.
UB: Union Bank
USB: US Bank
WFC: Wells Fargo & Co.
ZION: Zions Bancorporation
3
A Collection of Community Banks
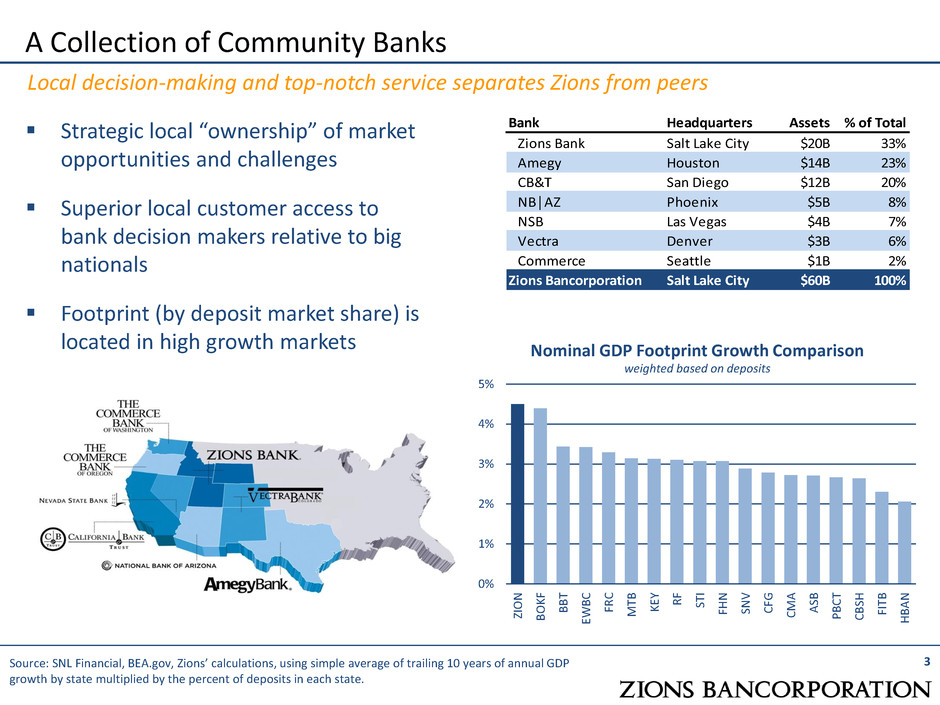
Local decision-making and top-notch service separates Zions from peers
Source: SNL Financial, BEA.gov, Zions’ calculations, using simple average of trailing 10 years of annual GDP
growth by state multiplied by the percent of deposits in each state.
Strategic local “ownership” of market
opportunities and challenges
Superior local customer access to
bank decision makers relative to big
nationals
Footprint (by deposit market share) is
located in high growth markets
0%
1%
2%
3%
4%
5%
ZI
O
N
B
O
K
F
B
B
T
EWB
C
FR
C
M
TB K
EY R
F
ST
I
FH
N
SN
V
C
FG
C
M
A
A
SB
PB
C
T
C
B
SH
FI
TB
H
BA
N
Nominal GDP Footprint Growth Comparison
weighted based on deposits
Bank Headquarters Assets % of Total
Zions Bank Salt Lake City $20B 33%
Amegy Houston $14B 23%
CB&T San Diego $12B 20%
NB│AZ Phoenix $5B 8%
NSB Las Vegas $4B 7%
Vectra Denver $3B 6%
Commerce Seattle $1B 2%
Zions Bancorporation Salt Lake City $60B 100%
4
Superior Brand: Nationally Recognized for Excellence
(1) One of five winning teams, 2015, Zions Bank. (2) Readers of the San Diego Union-Tribune, August 2016, for
six consecutive years; Orange County Register, for three consecutive years. (3) Ranking Arizona, 2015.
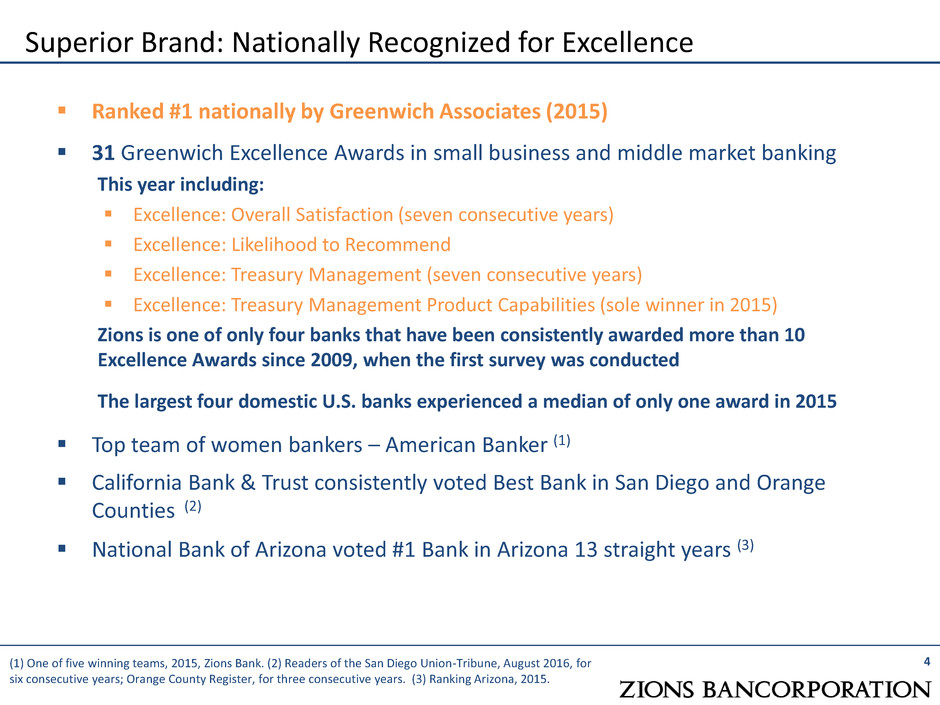
Ranked #1 nationally by Greenwich Associates (2015)
31 Greenwich Excellence Awards in small business and middle market banking
This year including:
Excellence: Overall Satisfaction (seven consecutive years)
Excellence: Likelihood to Recommend
Excellence: Treasury Management (seven consecutive years)
Excellence: Treasury Management Product Capabilities (sole winner in 2015)
Zions is one of only four banks that have been consistently awarded more than 10
Excellence Awards since 2009, when the first survey was conducted
The largest four domestic U.S. banks experienced a median of only one award in 2015
Top team of women bankers – American Banker (1)
California Bank & Trust consistently voted Best Bank in San Diego and Orange
Counties (2)
National Bank of Arizona voted #1 Bank in Arizona 13 straight years (3)
Zions is a Commercially-Oriented Bank
Earning Assets Liabilities and Equity
5
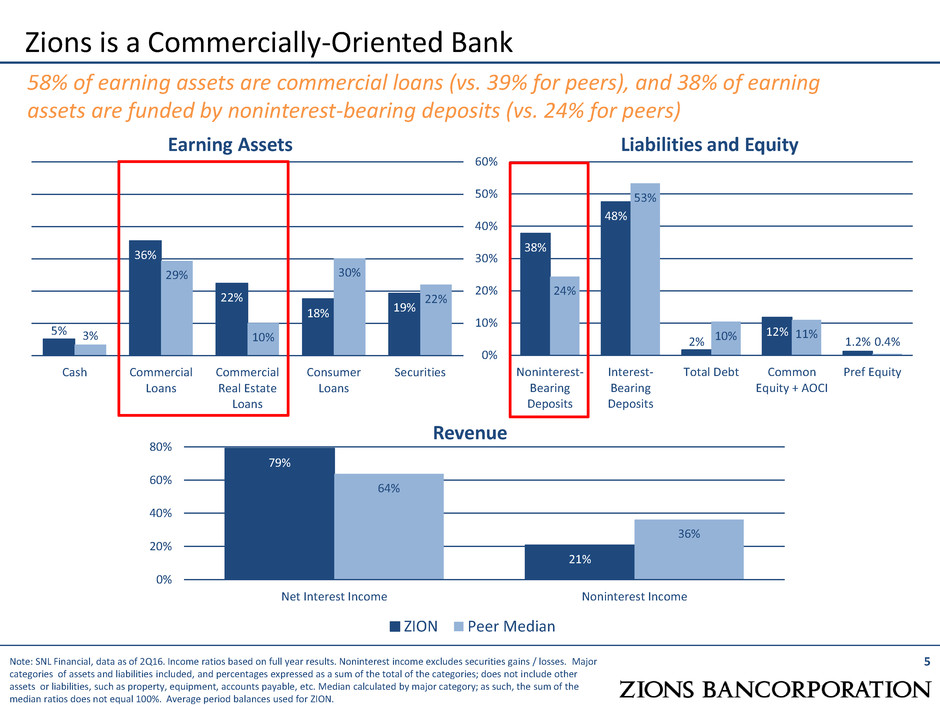
58% of earning assets are commercial loans (vs. 39% for peers), and 38% of earning
assets are funded by noninterest-bearing deposits (vs. 24% for peers)
5%
36%
22%
18% 19%
3%
29%
10%
30%
22%
Cash Commercial
Loans
Commercial
Real Estate
Loans
Consumer
Loans
Securities
38%
48%
2%
12%
1.2%
24%
53%
10% 11% 0.4%
0%
10%
20%
30%
40%
50%
60%
Noninterest-
Bearing
Deposits
Interest-
Bearing
Deposits
Total Debt Common
Equity + AOCI
Pref Equity
Revenue
79%
21%
64%
36%
0%
20%
40%
60%
80%
Net Interest Income Noninterest Income
ZION Peer Median
Note: SNL Financial, data as of 2Q16. Income ratios based on full year results. Noninterest income excludes securities gains / losses. Major
categories of assets and liabilities included, and percentages expressed as a sum of the total of the categories; does not include other
assets or liabilities, such as property, equipment, accounts payable, etc. Median calculated by major category; as such, the sum of the
median ratios does not equal 100%. Average period balances used for ZION.
Small Business Lending
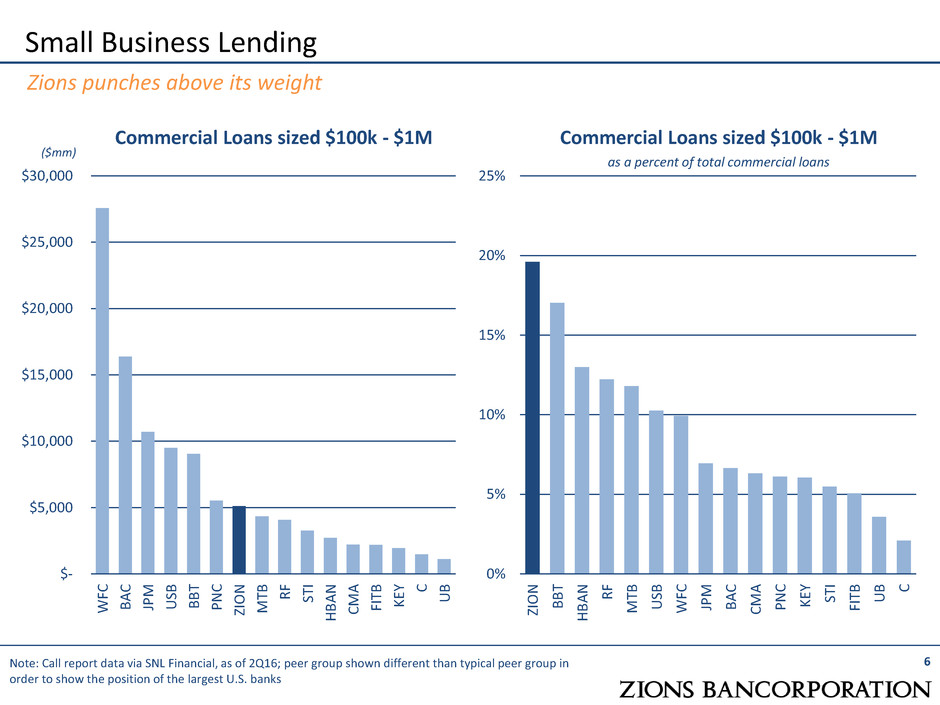
Commercial Loans sized $100k - $1M
Commercial Loans sized $100k - $1M
as a percent of total commercial loans
6
0%
5%
10%
15%
20%
25%
ZIO
N
B
B
T
H
B
A
N R
F
M
TB
US
B
WF
C
JP
M
B
A
C
CM
A
P
N
C
KE
Y
ST
I
FIT
B
U
B C
Note: Call report data via SNL Financial, as of 2Q16; peer group shown different than typical peer group in
order to show the position of the largest U.S. banks
$-
$5,000
$10,000
$15,000
$20,000
$25,000
$30,000
WF
C
B
A
C
JP
M
US
B
B
B
T
P
N
C
ZIO
N
M
TB R
F
ST
I
H
B
A
N
CM
A
FIT
B
KE
Y C
U
B
Zions punches above its weight
($mm)
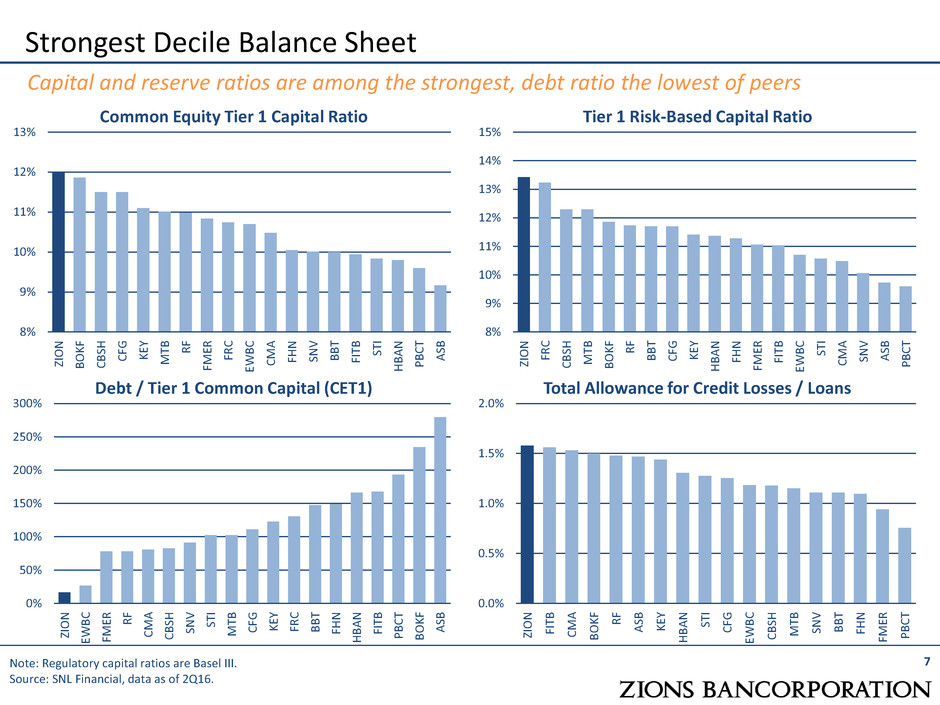
Strongest Decile Balance Sheet
Common Equity Tier 1 Capital Ratio Tier 1 Risk-Based Capital Ratio
8%
9%
10%
11%
12%
13%
14%
15%
ZI
O
N
FR
C
C
B
SH
M
TB
B
O
K
F
R
F
B
B
T
C
FG K
EY
H
BA
N
FH
N
FM
ER
FI
TB
EWB
C
ST
I
C
M
A
SN
V
A
SB
PB
C
T
Note: Regulatory capital ratios are Basel III.
Source: SNL Financial, data as of 2Q16.
8%
9%
10%
11%
12%
13%
ZI
O
N
B
O
K
F
C
B
SH
C
FG K
EY
M
TB R
F
FM
ER
FR
C
EWB
C
C
M
A
FH
N
SN
V
B
B
T
FI
TB ST
I
H
BA
N
PB
C
T
A
SB
Capital and reserve ratios are among the strongest, debt ratio the lowest of peers
Debt / Tier 1 Common Capital (CET1) Total Allowance for Credit Losses / Loans
0.0%
0.5%
1.0%
1.5%
2.0%
ZI
O
N
FI
TB
C
M
A
B
O
K
F
R
F
A
SB K
EY
H
BA
N
ST
I
C
FG
EWB
C
C
B
SH
M
TB
SN
V
B
B
T
FH
N
FM
ER
PB
C
T
0%
50%
100%
150%
200%
250%
300%
ZI
O
N
EWB
C
FM
ER R
F
C
M
A
C
B
SH
SN
V
ST
I
M
TB
C
FG K
EY
FR
C
B
B
T
FH
N
H
BA
N
FI
TB
PB
C
T
B
O
K
F
A
SB
7
0.00%
0.50%
1.00%
1.50%
2.00%
BOKF MTB CBSH EWBC ASB ZION CMA BBT FMER CFG STI RF HBAN FITB KEY FHN SNV
0.00%
0.50%
1.00%
1.50%
2.00%
FR
C
C
B
SH
EWB
C
ST
I
PB
C
T
B
B
T
FI
TB
FM
ER K
EY
H
BA
N
C
M
A
SN
V
C
FG
ZI
O
N
A
SB
B
O
K
F
FH
N
M
TB R
F
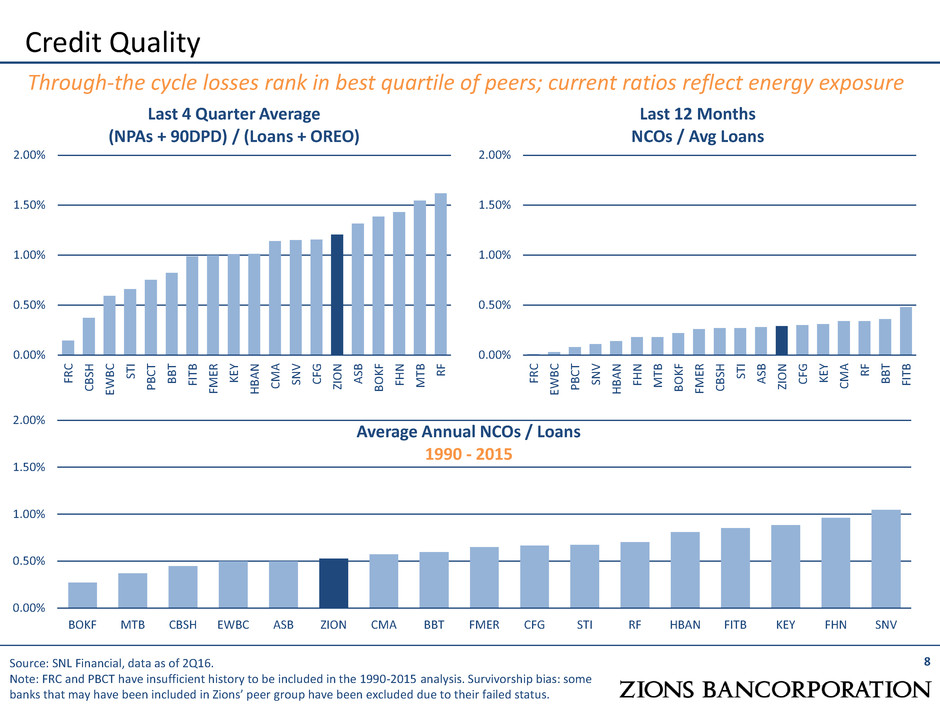
Credit Quality
Last 4 Quarter Average
(NPAs + 90DPD) / (Loans + OREO)
Last 12 Months
NCOs / Avg Loans
8
0.00%
0.50%
1.00%
1.50%
2.00%
FR
C
EWB
C
PB
C
T
SN
V
H
BA
N
FH
N
M
TB
B
O
K
F
FM
ER
C
B
SH ST
I
A
SB
ZI
O
N
C
FG K
EY
C
M
A R
F
B
B
T
FI
TB
Source: SNL Financial, data as of 2Q16.
Note: FRC and PBCT have insufficient history to be included in the 1990-2015 analysis. Survivorship bias: some
banks that may have been included in Zions’ peer group have been excluded due to their failed status.
Through-the cycle losses rank in best quartile of peers; current ratios reflect energy exposure
Average Annual NCOs / Loans
1990 - 2015
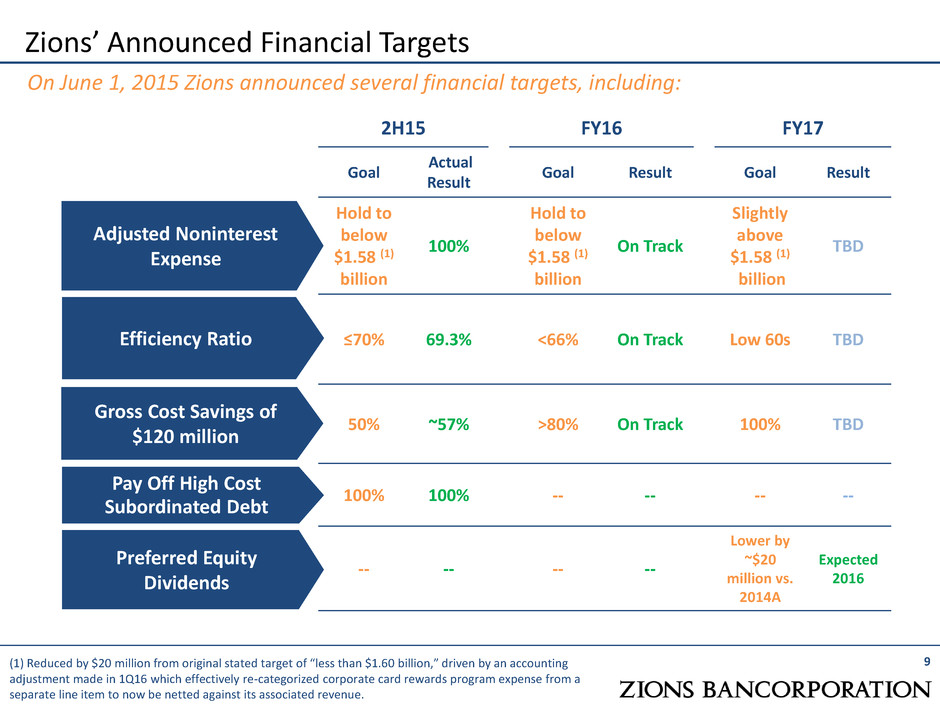
Zions’ Announced Financial Targets
9
On June 1, 2015 Zions announced several financial targets, including:
2H15 FY16 FY17
Goal
Actual
Result
Goal Result Goal Result
Hold to
below
$1.58 (1)
billion
100%
Hold to
below
$1.58 (1)
billion
On Track
Slightly
above
$1.58 (1)
billion
TBD
≤70% 69.3% <66% On Track Low 60s TBD
50% ~57% >80% On Track 100% TBD
100% 100% -- -- -- --
-- -- -- --
Lower by
~$20
million vs.
2014A
Expected
2016
Adjusted Noninterest
Expense
Gross Cost Savings of
$120 million
Pay Off High Cost
Subordinated Debt
Preferred Equity
Dividends
Efficiency Ratio
(1) Reduced by $20 million from original stated target of “less than $1.60 billion,” driven by an accounting
adjustment made in 1Q16 which effectively re-categorized corporate card rewards program expense from a
separate line item to now be netted against its associated revenue.
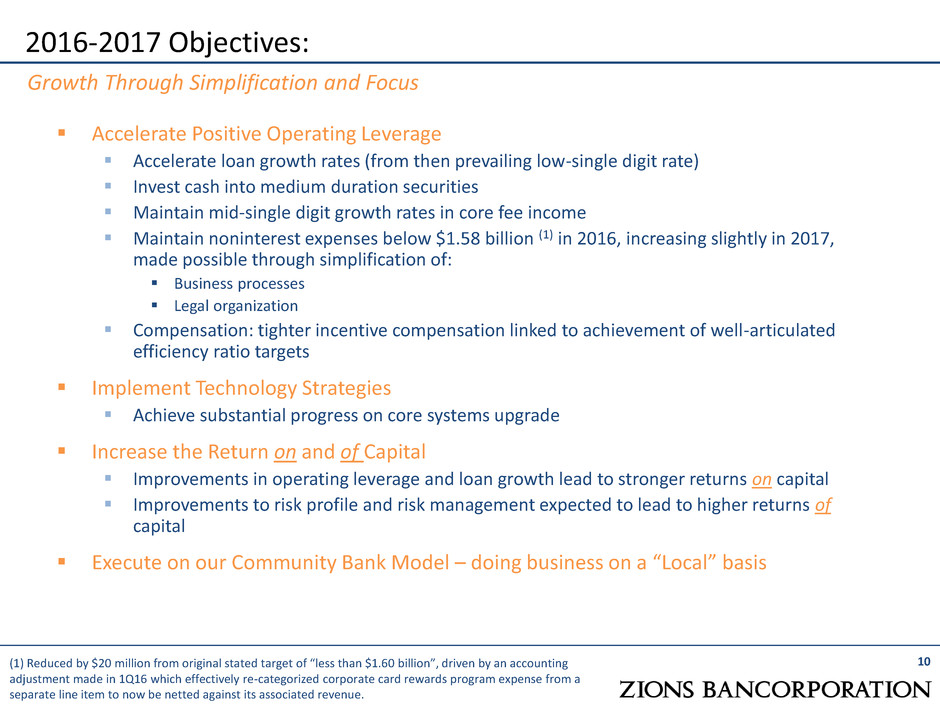
Accelerate Positive Operating Leverage
Accelerate loan growth rates (from then prevailing low-single digit rate)
Invest cash into medium duration securities
Maintain mid-single digit growth rates in core fee income
Maintain noninterest expenses below $1.58 billion (1) in 2016, increasing slightly in 2017,
made possible through simplification of:
Business processes
Legal organization
Compensation: tighter incentive compensation linked to achievement of well-articulated
efficiency ratio targets
Implement Technology Strategies
Achieve substantial progress on core systems upgrade
Increase the Return on and of Capital
Improvements in operating leverage and loan growth lead to stronger returns on capital
Improvements to risk profile and risk management expected to lead to higher returns of
capital
Execute on our Community Bank Model – doing business on a “Local” basis
10
2016-2017 Objectives:
(1) Reduced by $20 million from original stated target of “less than $1.60 billion”, driven by an accounting
adjustment made in 1Q16 which effectively re-categorized corporate card rewards program expense from a
separate line item to now be netted against its associated revenue.
Growth Through Simplification and Focus
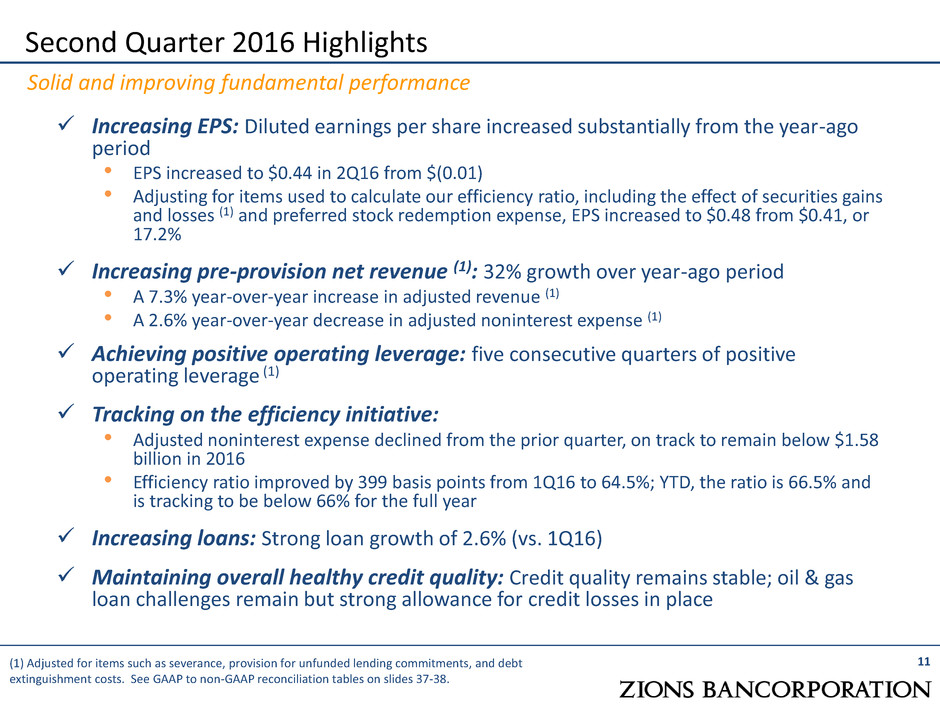
Increasing EPS: Diluted earnings per share increased substantially from the year-ago
period
• EPS increased to $0.44 in 2Q16 from $(0.01)
• Adjusting for items used to calculate our efficiency ratio, including the effect of securities gains
and losses (1) and preferred stock redemption expense, EPS increased to $0.48 from $0.41, or
17.2%
Increasing pre-provision net revenue (1): 32% growth over year-ago period
• A 7.3% year-over-year increase in adjusted revenue (1)
• A 2.6% year-over-year decrease in adjusted noninterest expense (1)
Achieving positive operating leverage: five consecutive quarters of positive
operating leverage (1)
Tracking on the efficiency initiative:
• Adjusted noninterest expense declined from the prior quarter, on track to remain below $1.58
billion in 2016
• Efficiency ratio improved by 399 basis points from 1Q16 to 64.5%; YTD, the ratio is 66.5% and
is tracking to be below 66% for the full year
Increasing loans: Strong loan growth of 2.6% (vs. 1Q16)
Maintaining overall healthy credit quality: Credit quality remains stable; oil & gas
loan challenges remain but strong allowance for credit losses in place
11
Second Quarter 2016 Highlights
Solid and improving fundamental performance
(1) Adjusted for items such as severance, provision for unfunded lending commitments, and debt
extinguishment costs. See GAAP to non-GAAP reconciliation tables on slides 37-38.
Pre-Provision Net Revenue
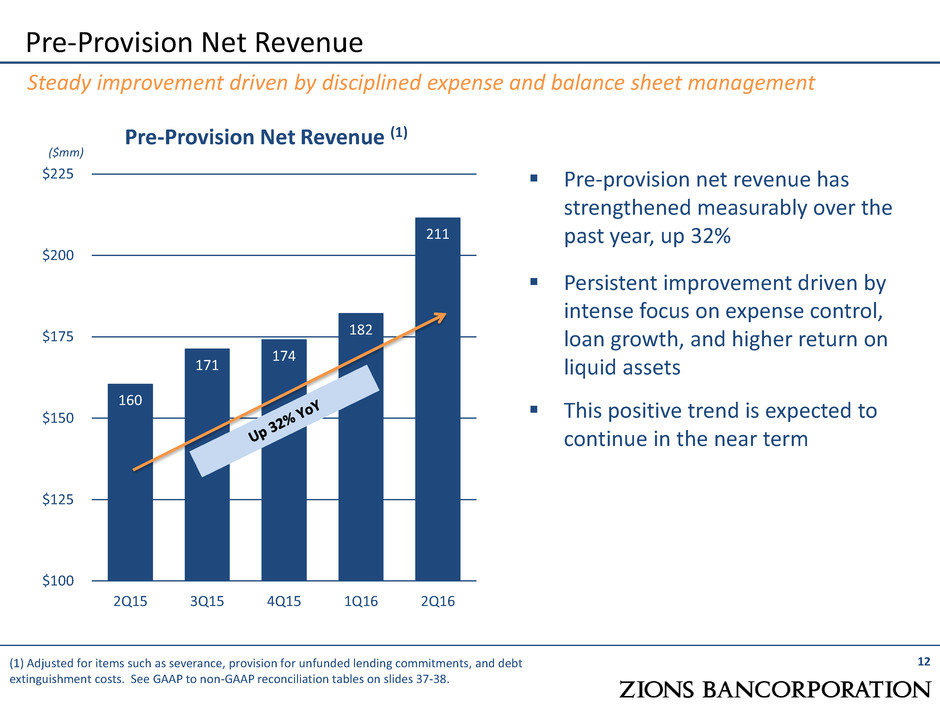
Pre-Provision Net Revenue (1)
12
Steady improvement driven by disciplined expense and balance sheet management
(1) Adjusted for items such as severance, provision for unfunded lending commitments, and debt
extinguishment costs. See GAAP to non-GAAP reconciliation tables on slides 37-38.
($mm)
160
171
174
182
211
$100
$125
$150
$175
$200
$225
2Q15 3Q15 4Q15 1Q16 2Q16
Pre-provision net revenue has
strengthened measurably over the
past year, up 32%
Persistent improvement driven by
intense focus on expense control,
loan growth, and higher return on
liquid assets
This positive trend is expected to
continue in the near term
Total Loan and Deposit Growth
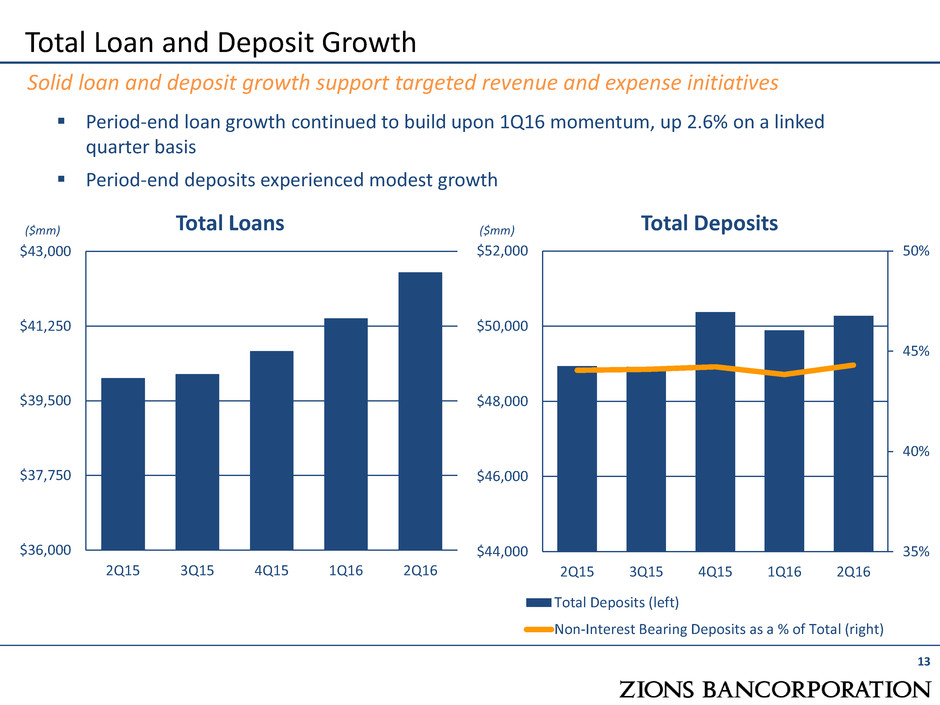
Total Loans Total Deposits
13
Solid loan and deposit growth support targeted revenue and expense initiatives
Period-end loan growth continued to build upon 1Q16 momentum, up 2.6% on a linked
quarter basis
Period-end deposits experienced modest growth
($mm)
$36,000
$37,750
$39,500
$41,250
$43,000
2Q15 3Q15 4Q15 1Q16 2Q16
35%
40%
45%
50%
$44,000
$46,000
$48,000
$50,000
$52,000
2Q15 3Q15 4Q15 1Q16 2Q16
Total Deposits (left)
Non-Interest Bearing Deposits as a % of Total (right)
($mm)
C&I (ex-O&G)
Owner Occupied
(ex-NRE)
C&D
Term CRE (ex-
NRE)
1-4 Family
National Real
Estate
O&G
Home Equity
Other
-20%
-10%
0%
10%
20%
30%
Loan Growth by Type
14
Solid loan growth achieved in targeted growth categories
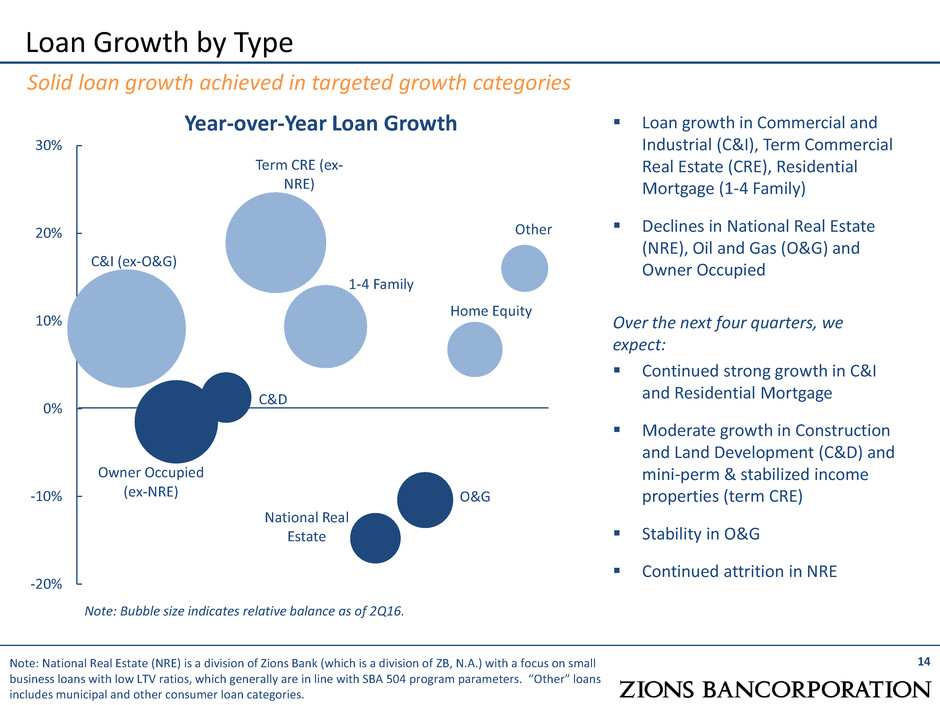
Year-over-Year Loan Growth Loan growth in Commercial and
Industrial (C&I), Term Commercial
Real Estate (CRE), Residential
Mortgage (1-4 Family)
Declines in National Real Estate
(NRE), Oil and Gas (O&G) and
Owner Occupied
Over the next four quarters, we
expect:
Continued strong growth in C&I
and Residential Mortgage
Moderate growth in Construction
and Land Development (C&D) and
mini-perm & stabilized income
properties (term CRE)
Stability in O&G
Continued attrition in NRE
Note: National Real Estate (NRE) is a division of Zions Bank (which is a division of ZB, N.A.) with a focus on small
business loans with low LTV ratios, which generally are in line with SBA 504 program parameters. “Other” loans
includes municipal and other consumer loan categories.
Note: Bubble size indicates relative balance as of 2Q16.
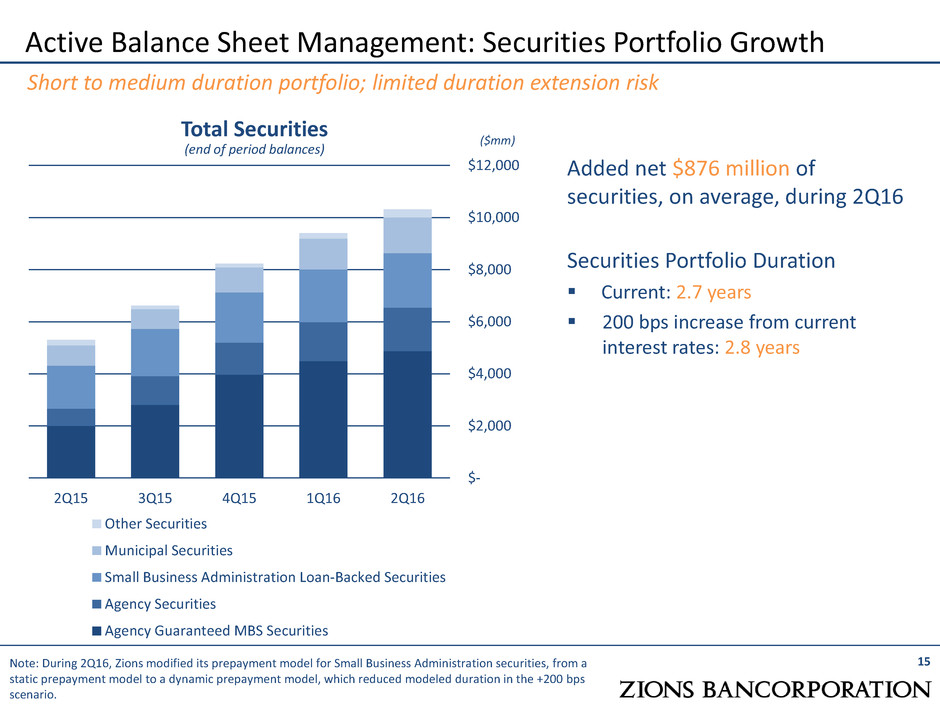
Active Balance Sheet Management: Securities Portfolio Growth
15
Short to medium duration portfolio; limited duration extension risk
Total Securities
(end of period balances)
($mm)
$-
$2,000
$4,000
$6,000
$8,000
$10,000
$12,000
2Q15 3Q15 4Q15 1Q16 2Q16
Other Securities
Municipal Securities
Small Business Administration Loan-Backed Securities
Agency Securities
Agency Guaranteed MBS Securities
Added net $876 million of
securities, on average, during 2Q16
Securities Portfolio Duration
Current: 2.7 years
200 bps increase from current
interest rates: 2.8 years
Note: During 2Q16, Zions modified its prepayment model for Small Business Administration securities, from a
static prepayment model to a dynamic prepayment model, which reduced modeled duration in the +200 bps
scenario.
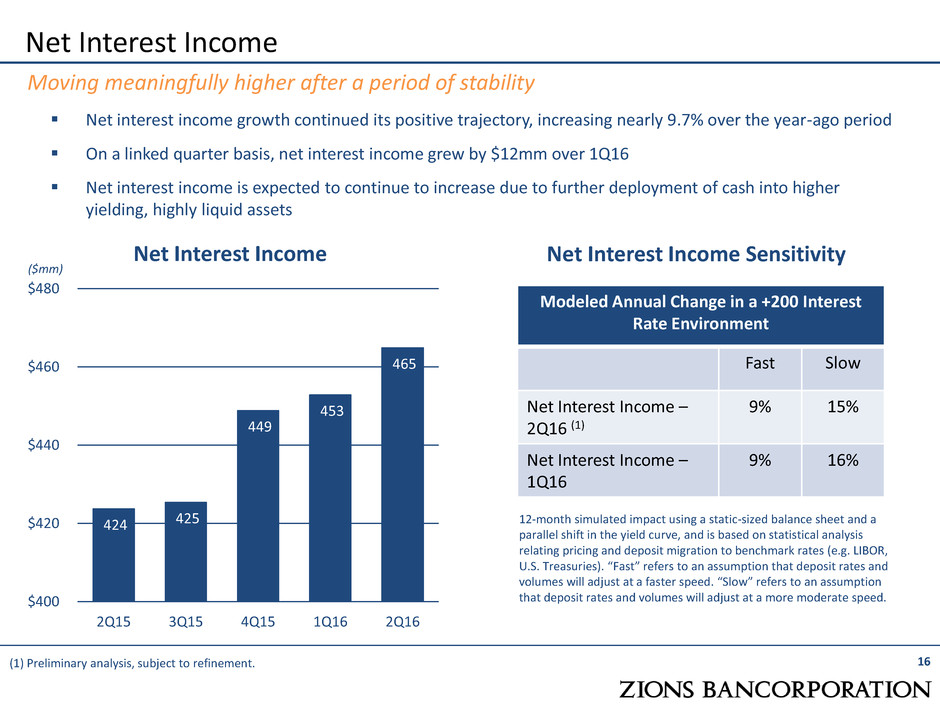
Net interest income growth continued its positive trajectory, increasing nearly 9.7% over the year-ago period
On a linked quarter basis, net interest income grew by $12mm over 1Q16
Net interest income is expected to continue to increase due to further deployment of cash into higher
yielding, highly liquid assets
Net Interest Income
Net Interest Income
16
Moving meaningfully higher after a period of stability
($mm)
424 425
449
453
465
$400
$420
$440
$460
$480
2Q15 3Q15 4Q15 1Q16 2Q16
Modeled Annual Change in a +200 Interest
Rate Environment
Fast Slow
Net Interest Income –
2Q16 (1)
9% 15%
Net Interest Income –
1Q16
9% 16%
12-month simulated impact using a static-sized balance sheet and a
parallel shift in the yield curve, and is based on statistical analysis
relating pricing and deposit migration to benchmark rates (e.g. LIBOR,
U.S. Treasuries). “Fast” refers to an assumption that deposit rates and
volumes will adjust at a faster speed. “Slow” refers to an assumption
that deposit rates and volumes will adjust at a more moderate speed.
(1) Preliminary analysis, subject to refinement.
Net Interest Income Sensitivity
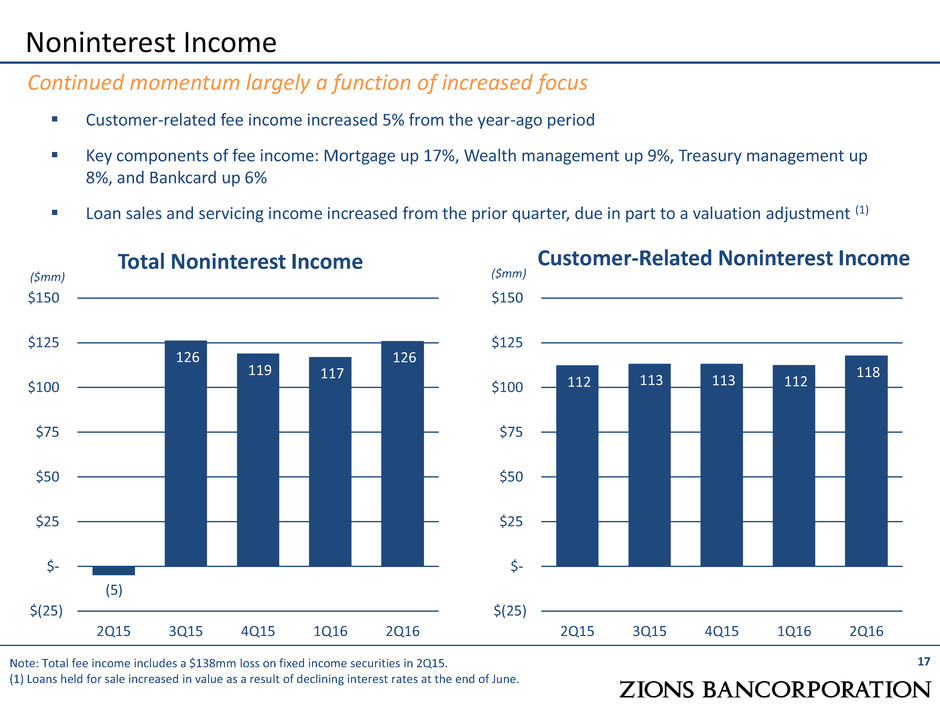
Customer-related fee income increased 5% from the year-ago period
Key components of fee income: Mortgage up 17%, Wealth management up 9%, Treasury management up
8%, and Bankcard up 6%
Loan sales and servicing income increased from the prior quarter, due in part to a valuation adjustment (1)
112 113 113 112
118
$(25)
$-
$25
$50
$75
$100
$125
$150
2Q15 3Q15 4Q15 1Q16 2Q16
Noninterest Income
Customer-Related Noninterest Income
17
($mm)
Continued momentum largely a function of increased focus
Note: Total fee income includes a $138mm loss on fixed income securities in 2Q15.
(1) Loans held for sale increased in value as a result of declining interest rates at the end of June.
Total Noninterest Income
($mm)
(5)
126
119 117
126
$(25)
$-
$25
$50
$75
$100
$125
$150
2Q15 3Q15 4Q15 1Q16 2Q16
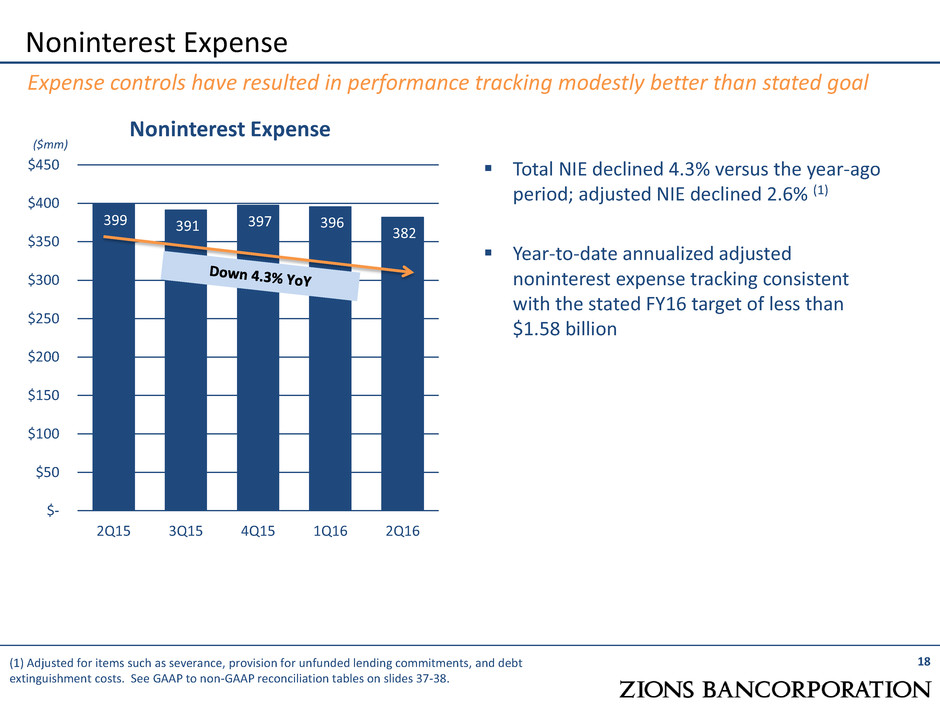
Noninterest Expense
($mm)
399 391 397 396 382
$-
$50
$100
$150
$200
$250
$300
$350
$400
$450
2Q15 3Q15 4Q15 1Q16 2Q16
Noninterest Expense
18
Expense controls have resulted in performance tracking modestly better than stated goal
Total NIE declined 4.3% versus the year-ago
period; adjusted NIE declined 2.6% (1)
Year-to-date annualized adjusted
noninterest expense tracking consistent
with the stated FY16 target of less than
$1.58 billion
(1) Adjusted for items such as severance, provision for unfunded lending commitments, and debt
extinguishment costs. See GAAP to non-GAAP reconciliation tables on slides 37-38.
Efficiency Ratio
Efficiency Ratio (1)
19
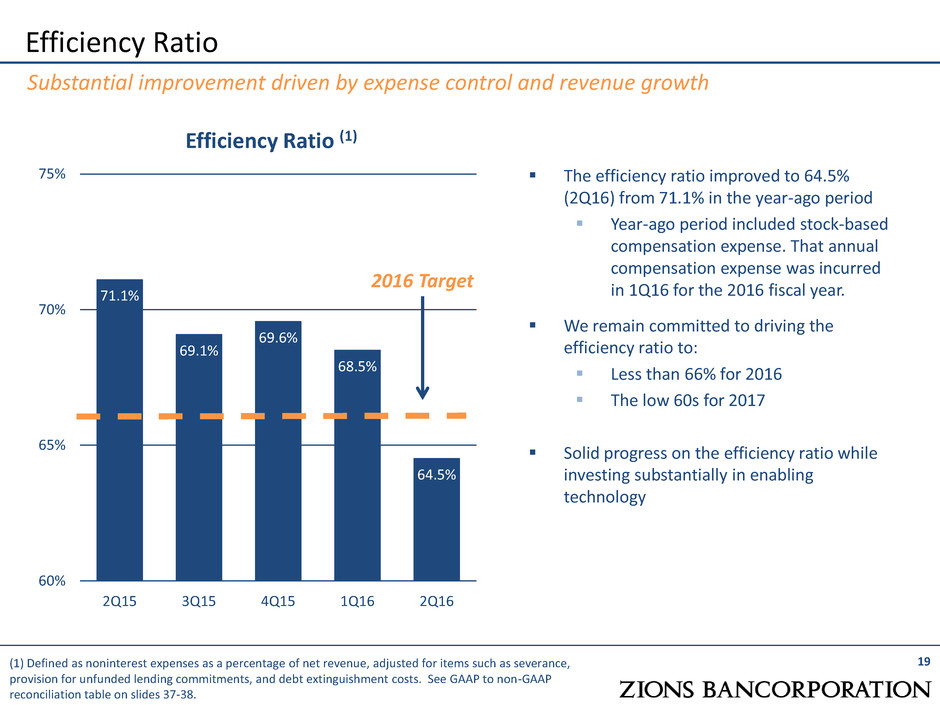
Substantial improvement driven by expense control and revenue growth
(1) Defined as noninterest expenses as a percentage of net revenue, adjusted for items such as severance,
provision for unfunded lending commitments, and debt extinguishment costs. See GAAP to non-GAAP
reconciliation table on slides 37-38.
The efficiency ratio improved to 64.5%
(2Q16) from 71.1% in the year-ago period
Year-ago period included stock-based
compensation expense. That annual
compensation expense was incurred
in 1Q16 for the 2016 fiscal year.
We remain committed to driving the
efficiency ratio to:
Less than 66% for 2016
The low 60s for 2017
Solid progress on the efficiency ratio while
investing substantially in enabling
technology
71.1%
69.1%
69.6%
68.5%
64.5%
60%
65%
70%
75%
2Q15 3Q15 4Q15 1Q16 2Q16
2016 Target

Credit Quality (Ex-Energy)
20
Key Credit Quality Ratios (Ex-Energy)
Overall credit quality remains pristine outside energy
Overall stable and healthy credit quality
Relative to March 31, 2016:
Classified loans decreased to 2.0% of
loans
NPAs decreased to 0.65% of loans
Annualized NCOs equaled 0.01% of
average loans
Allowance for credit losses remains strong at
1.15% of total loans and leases
1.8x coverage of NPAs
Not meaningful coverage of
annualized NCOs (>50x)
Reaffirming full year 2016 net charge-off
outlook of 30-35 basis points of average
loans (overall, inclusive of Energy)
-0.5%
0.0%
0.5%
1.0%
1.5%
2.0%
2.5%
3.0%
2Q15 3Q15 4Q15 1Q16 2Q16
Classifieds / Loans Nonperforming Assets / Loans
Net Charge-offs / Loans
Note: Net Charge-offs/Loans ratio is annualized for all periods shown. Oil and gas loans discussed in greater
detail later in this presentation.
Capital plan for next four quarters
Increase the dividend payout to an annualized $0.32 from $0.24
Repurchase up to $180 million of common equity (~3% of shares outstanding)
Reduce preferred equity by up to $144 million
Expect improved return on tangible common equity due to improved profitability
and less excess equity outstanding
Actively managing capital lower to better align with risk profile
21
Capital Actions: 2H16 – 1H17
Increased common dividend, common share repurchase and preferred equity
redemption
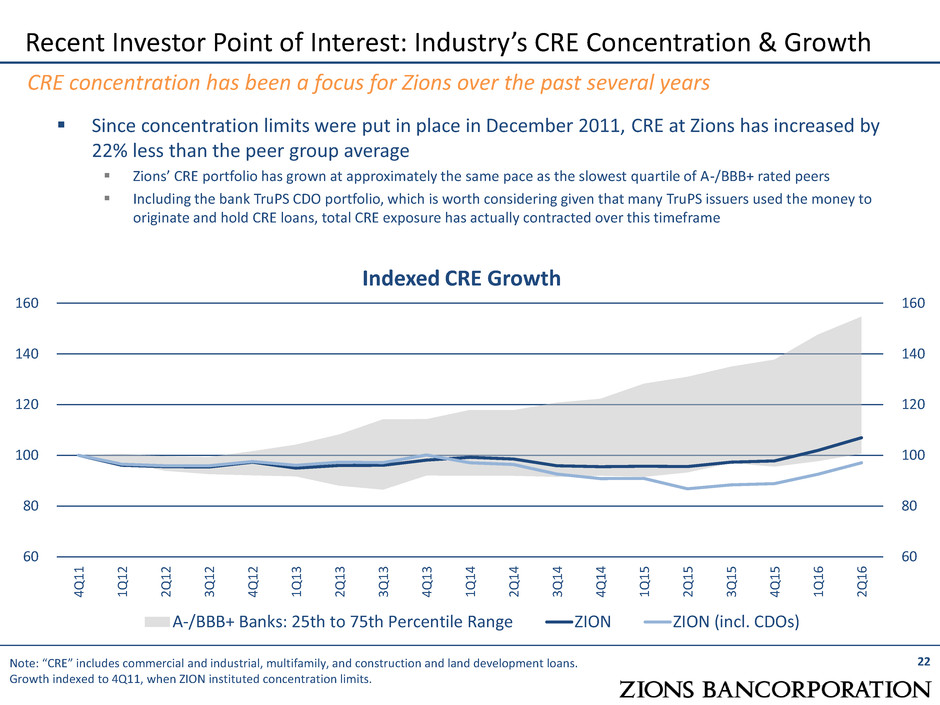
Since concentration limits were put in place in December 2011, CRE at Zions has increased by
22% less than the peer group average
Zions’ CRE portfolio has grown at approximately the same pace as the slowest quartile of A-/BBB+ rated peers
Including the bank TruPS CDO portfolio, which is worth considering given that many TruPS issuers used the money to
originate and hold CRE loans, total CRE exposure has actually contracted over this timeframe
Recent Investor Point of Interest: Industry’s CRE Concentration & Growth
CRE concentration has been a focus for Zions over the past several years
Note: “CRE” includes commercial and industrial, multifamily, and construction and land development loans.
Growth indexed to 4Q11, when ZION instituted concentration limits.
Indexed CRE Growth
60
80
100
120
140
160
60
80
100
120
140
160
4Q
1
1
1Q
1
2
2Q
1
2
3Q
1
2
4Q
1
2
1Q
1
3
2Q
1
3
3Q
1
3
4Q
1
3
1Q
1
4
2Q
1
4
3Q
1
4
4Q1
4
1Q
1
5
2Q
1
5
3Q
1
5
4Q
1
5
1Q
1
6
2Q
1
6
A-/BBB+ Banks: 25th to 75th Percentile Range ZION ZION (incl. CDOs)
22
Recent Investor Point of Interest: Commercial Real Estate, Relative to Capital Levels
23
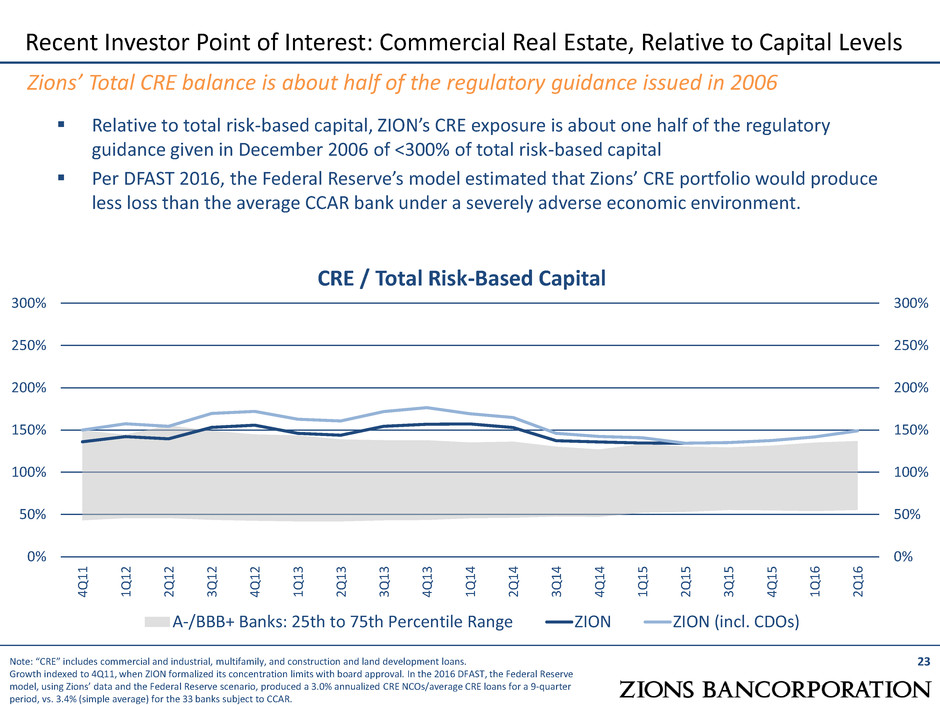
Zions’ Total CRE balance is about half of the regulatory guidance issued in 2006
Note: “CRE” includes commercial and industrial, multifamily, and construction and land development loans.
Growth indexed to 4Q11, when ZION formalized its concentration limits with board approval. In the 2016 DFAST, the Federal Reserve
model, using Zions’ data and the Federal Reserve scenario, produced a 3.0% annualized CRE NCOs/average CRE loans for a 9-quarter
period, vs. 3.4% (simple average) for the 33 banks subject to CCAR.
CRE / Total Risk-Based Capital
0%
50%
100%
150%
200%
250%
300%
0%
50%
100%
150%
200%
250%
300%
4Q
1
1
1Q
1
2
2Q
1
2
3Q
1
2
4Q
1
2
1Q
1
3
2Q
1
3
3Q
1
3
4Q
1
3
1Q
1
4
2Q
1
4
3Q1
4
4Q
1
4
1Q
1
5
2Q
1
5
3Q
1
5
4Q
1
5
1Q
1
6
2Q
1
6
A-/BBB+ Banks: 25th to 75th Percentile Range ZION ZION (incl. CDOs)
Relative to total risk-based capital, ZION’s CRE exposure is about one half of the regulatory
guidance given in December 2006 of <300% of total risk-based capital
Per DFAST 2016, the Federal Reserve’s model estimated that Zions’ CRE portfolio would produce
less loss than the average CCAR bank under a severely adverse economic environment.

Oil & Gas (O&G) Credit Quality
24
O&G Key Credit Quality Ratios
O&G credit quality [has stabilized]
O&G credit quality stabilizing
Relative to March 31, 2016:
Criticized loans increased slightly to
37.8% of loans
Classified loans increased to 31.5% of
loans
NPAs increased to 11.1% of loans
Annualized NCOs equaled 5.8% of
average loans
Allowance for credit losses remains strong at
over 8% of total loans and leases
0.8x coverage of NPAs
1.5x coverage of annualized NCOs
Estimate full year 2016 O&G net charge-offs
of approximately $125 million
0%
5%
10%
15%
20%
25%
30%
35%
40%
2Q15 3Q15 4Q15 1Q16 2Q16
Criticized / Loans Classifieds / Loans
Nonperforming Assets / Loans Net Charge-offs / Loans
Note: Net Charge-offs/Loans ratio is annualized for all periods shown.

$-
$100
$200
$300
$400
$500
4Q14 1Q15 2Q15 3Q15 4Q15 1Q16 2Q16
Allowance for Credit Losses Upstream Services Other
Oil & Gas (O&G) Portfolio Trends
25
Loan Balances by O&G Segment Classifieds by O&G Segment
Steadily declining balances in O&G Services
Nonaccruals by O&G Segment
($mm)
$-
$200
$400
$600
$800
$1,000
$1,200
$1,400
4Q14 1Q15 2Q15 3Q15 4Q15 1Q16 2Q16
Upstream Services Other
($mm)
($mm)
$-
$100
$200
$300
$400
$500
4Q14 1Q15 2Q15 3Q15 4Q15 1Q16 2Q16
Upstream Services Other
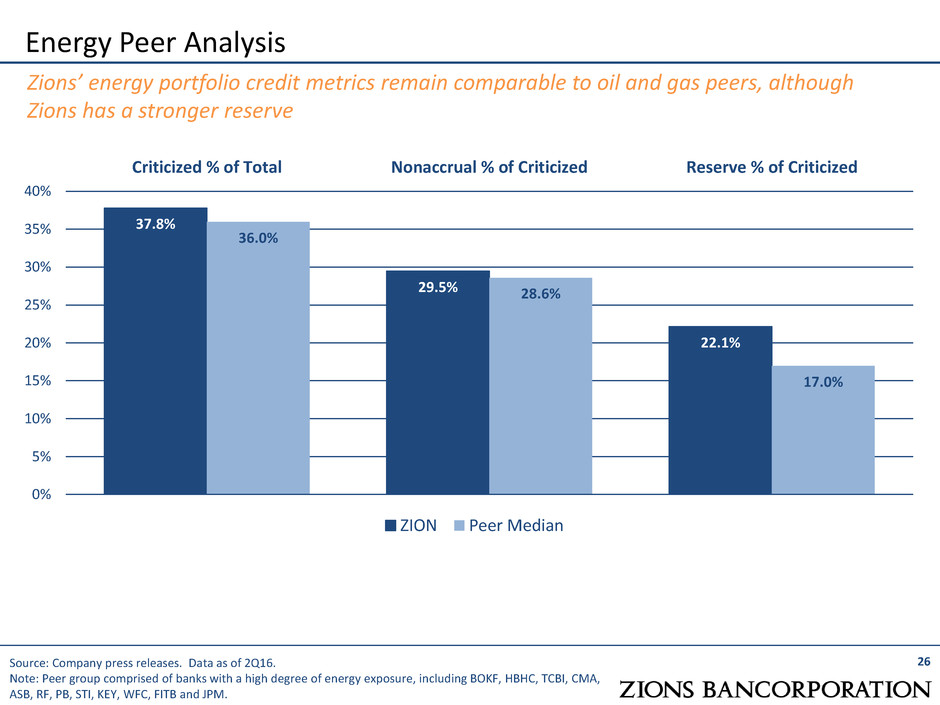
37.8%
29.5%
22.1%
36.0%
28.6%
17.0%
0%
5%
10%
15%
20%
25%
30%
35%
40%
Criticized % of Total Nonaccrual % of Criticized Reserve % of Criticized
ZION Peer Median
Energy Peer Analysis
26
Zions’ energy portfolio credit metrics remain comparable to oil and gas peers, although
Zions has a stronger reserve
Source: Company press releases. Data as of 2Q16.
Note: Peer group comprised of banks with a high degree of energy exposure, including BOKF, HBHC, TCBI, CMA,
ASB, RF, PB, STI, KEY, WFC, FITB and JPM.
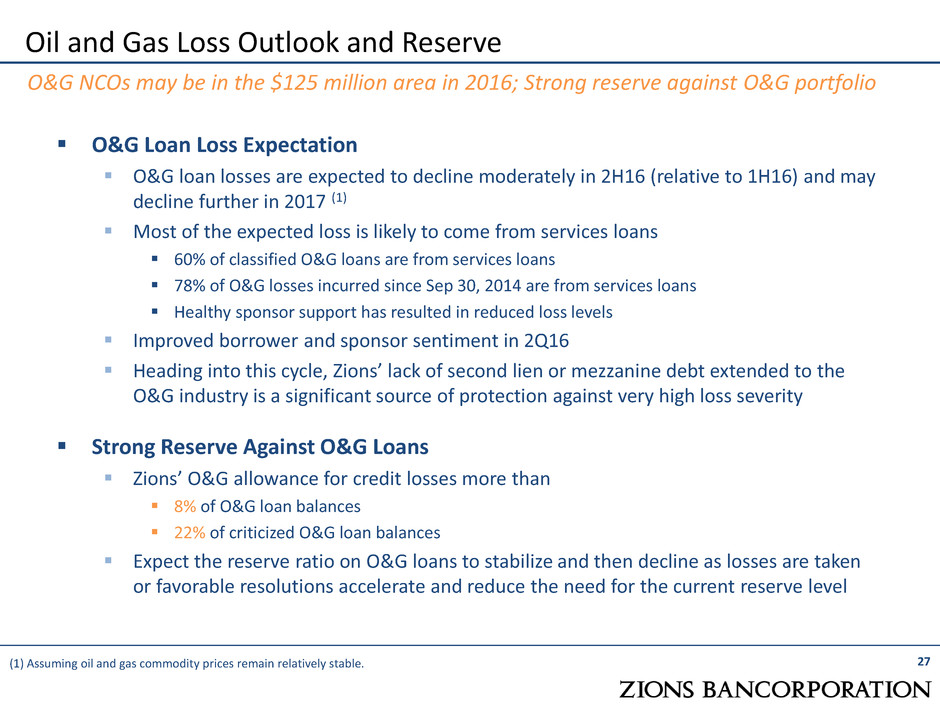
O&G Loan Loss Expectation
O&G loan losses are expected to decline moderately in 2H16 (relative to 1H16) and may
decline further in 2017 (1)
Most of the expected loss is likely to come from services loans
60% of classified O&G loans are from services loans
78% of O&G losses incurred since Sep 30, 2014 are from services loans
Healthy sponsor support has resulted in reduced loss levels
Improved borrower and sponsor sentiment in 2Q16
Heading into this cycle, Zions’ lack of second lien or mezzanine debt extended to the
O&G industry is a significant source of protection against very high loss severity
Strong Reserve Against O&G Loans
Zions’ O&G allowance for credit losses more than
8% of O&G loan balances
22% of criticized O&G loan balances
Expect the reserve ratio on O&G loans to stabilize and then decline as losses are taken
or favorable resolutions accelerate and reduce the need for the current reserve level
27
Oil and Gas Loss Outlook and Reserve
O&G NCOs may be in the $125 million area in 2016; Strong reserve against O&G portfolio
(1) Assuming oil and gas commodity prices remain relatively stable.
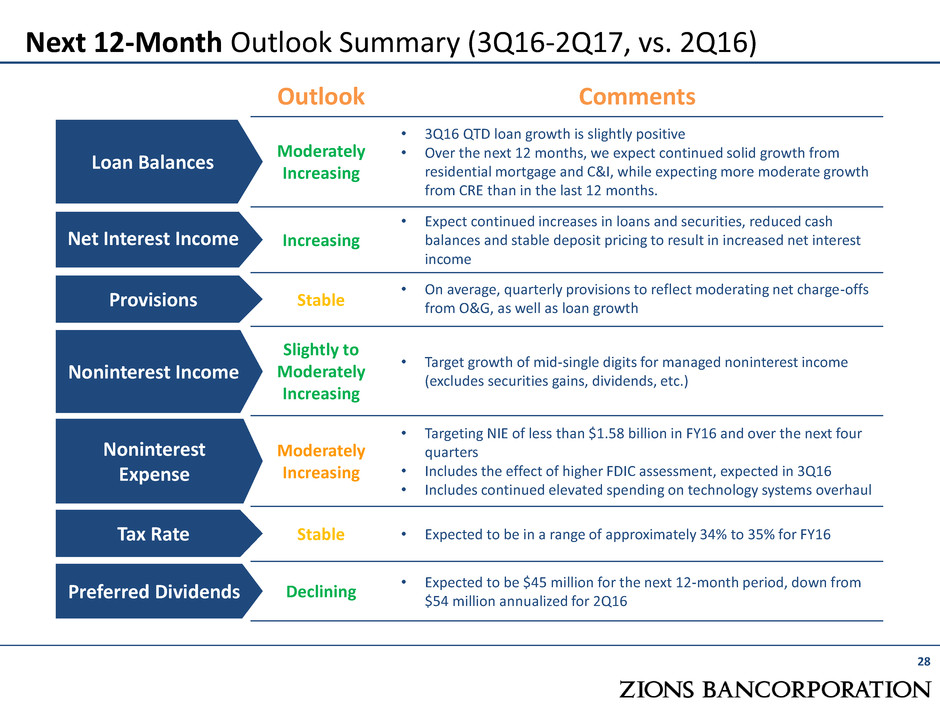
Next 12-Month Outlook Summary (3Q16-2Q17, vs. 2Q16)
28
Outlook Comments
Moderately
Increasing
• 3Q16 QTD loan growth is slightly positive
• Over the next 12 months, we expect continued solid growth from
residential mortgage and C&I, while expecting more moderate growth
from CRE than in the last 12 months.
Increasing
• Expect continued increases in loans and securities, reduced cash
balances and stable deposit pricing to result in increased net interest
income
Stable
• On average, quarterly provisions to reflect moderating net charge-offs
from O&G, as well as loan growth
Slightly to
Moderately
Increasing
• Target growth of mid-single digits for managed noninterest income
(excludes securities gains, dividends, etc.)
Moderately
Increasing
• Targeting NIE of less than $1.58 billion in FY16 and over the next four
quarters
• Includes the effect of higher FDIC assessment, expected in 3Q16
• Includes continued elevated spending on technology systems overhaul
Stable • Expected to be in a range of approximately 34% to 35% for FY16
Declining
• Expected to be $45 million for the next 12-month period, down from
$54 million annualized for 2Q16
Loan Balances
Net Interest Income
Provisions
Noninterest Income
Noninterest
Expense
Tax Rate
Preferred Dividends
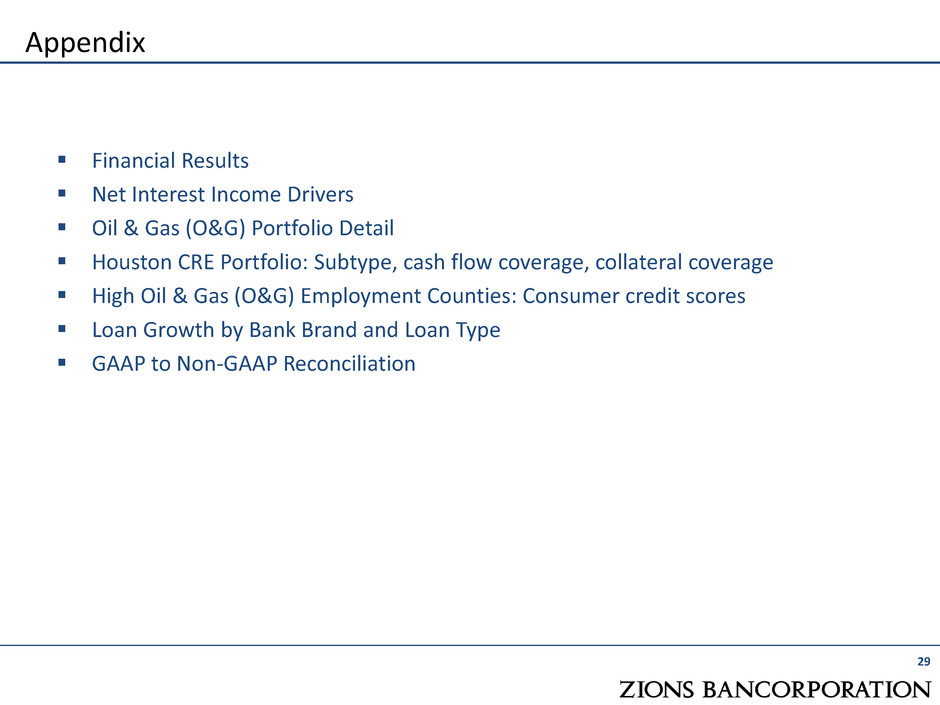
Financial Results
Net Interest Income Drivers
Oil & Gas (O&G) Portfolio Detail
Houston CRE Portfolio: Subtype, cash flow coverage, collateral coverage
High Oil & Gas (O&G) Employment Counties: Consumer credit scores
Loan Growth by Bank Brand and Loan Type
GAAP to Non-GAAP Reconciliation
29
Appendix

Financial Results
30
Solid and improving fundamental performance
Three Months Ended
(Dollar amounts in millions, except per share data) June 30,
2016
March 31,
2016
June 30,
2015
Earnings Results:
Diluted Earnings Per Share 0.44 0.38 (0.01)
Net Earnings (Loss) Applicable to Common Shareholders 91 79 (1)
Net Interest Income 465 453 424
Noninterest Income 126 117 (5)
Noninterest Expense 382 396 399
Pre-Provision Net Revenue (1) 211 182 160
Provision for Credit Losses 30 36 (2)
Ratios:
Return on Average Assets 0.77 % 0.62 % 0.10 %
Return on Average Common Equity 5.30 % 4.67 % (0.07) %
Tangible Return on Average Tangible Common Equity 6.31 % 5.59 % 0.03 %
Net Interest Margin 3.39 % 3.35 % 3.18 %
Yield on Loans 4.16 % 4.14 % 4.22 %
Yield on Securities 2.13 % 2.30 % 2.35 %
Average Cost of Deposits* 0.10 % 0.10 % 0.10 %
Efficiency Ratio (1) 64.5 % 68.5 % 71.9 %
Ratio of Nonperforming Assets to Loans, Leases and OREO 1.30 % 1.33 % 0.96 %
Annualized Ratio of Net Loan and Lease Charge-offs to Average Loans 0.36 % 0.35 % 0.11 %
Basel III Common Equity Tier 1 11.94 % 12.13 % 12.00 %
(1) Adjusted for items such as severance, provision for unfunded lending commitments, and debt
extinguishment costs. See GAAP to non-GAAP reconciliation tables on slides 38-39.
* Includes noninterest-bearing deposits.
Loans
76%
Securities
17%
Cash
7%
Net Interest Income Drivers
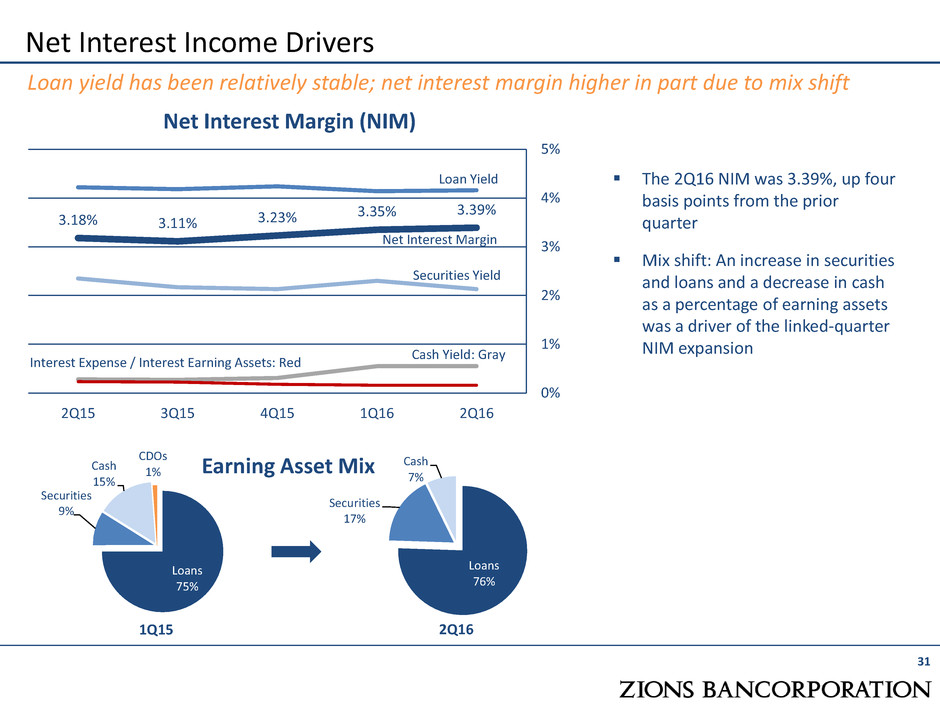
Loan yield has been relatively stable; net interest margin higher in part due to mix shift
Net Interest Margin (NIM)
Earning Asset Mix
The 2Q16 NIM was 3.39%, up four
basis points from the prior
quarter
Mix shift: An increase in securities
and loans and a decrease in cash
as a percentage of earning assets
was a driver of the linked-quarter
NIM expansion
3.18% 3.11% 3.23%
3.35% 3.39%
0%
1%
2%
3%
4%
5%
2Q15 3Q15 4Q15 1Q16 2Q16
Loan Yield
Securities Yield
Interest Expense / Interest Earning Assets: Red
Net Interest Margin
Cash Yield: Gray
Loans
75%
Securities
9%
Cash
15%
CDOs
1%
1Q15 2Q16
31
32 Note: Because many borrowers operate in multiple businesses, judgment has been applied in characterizing a
borrower as O&G-related, including a particular segment of O&G-related activity, i.e. upstream or downstream.
Typically 50%+ of revenues coming from the O&G sector is the hurdle rate for inclusion.
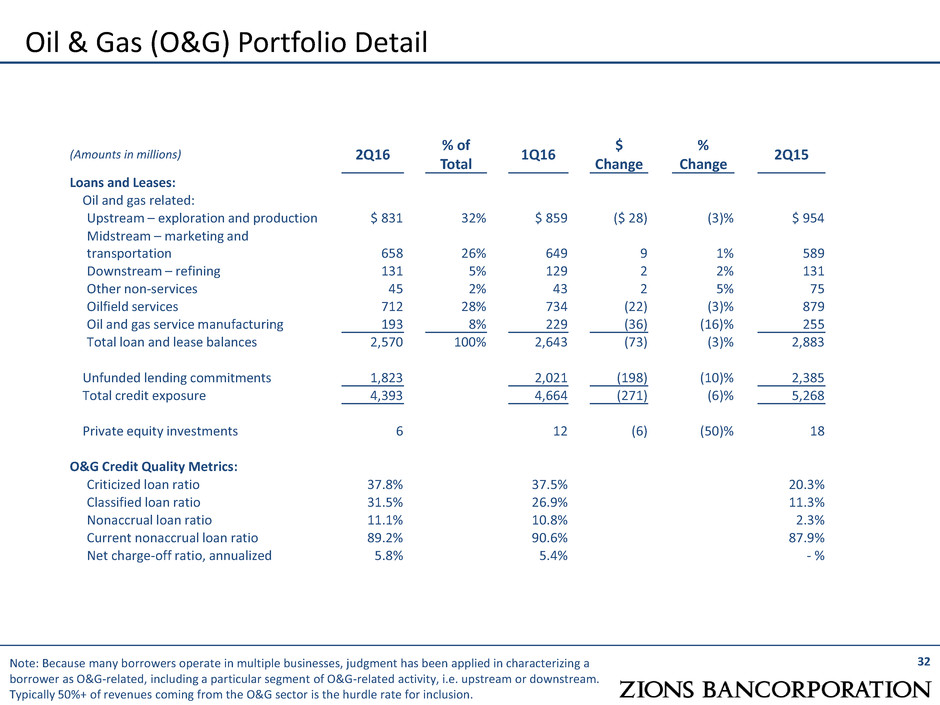
Oil & Gas (O&G) Portfolio Detail
(Amounts in millions) 2Q16
% of
Total
1Q16
$
Change
%
Change
2Q15
Loans and Leases:
Oil and gas related:
Upstream – exploration and production $ 831 32% $ 859 ($ 28) (3)% $ 954
Midstream – marketing and
transportation 658 26% 649 9 1% 589
Downstream – refining 131 5% 129 2 2% 131
Other non-services 45 2% 43 2 5% 75
Oilfield services 712 28% 734 (22) (3)% 879
Oil and gas service manufacturing 193 8% 229 (36) (16)% 255
Total loan and lease balances 2,570 100% 2,643 (73) (3)% 2,883
Unfunded lending commitments 1,823 2,021 (198) (10)% 2,385
Total credit exposure 4,393 4,664 (271) (6)% 5,268
Private equity investments 6 12 (6) (50)% 18
O&G Credit Quality Metrics:
Criticized loan ratio 37.8% 37.5% 20.3%
Classified loan ratio 31.5% 26.9% 11.3%
Nonaccrual loan ratio 11.1% 10.8% 2.3%
Current nonaccrual loan ratio 89.2% 90.6% 87.9%
Net charge-off ratio, annualized 5.8% 5.4% - %
33 Note: Data as of June 30, 2016.
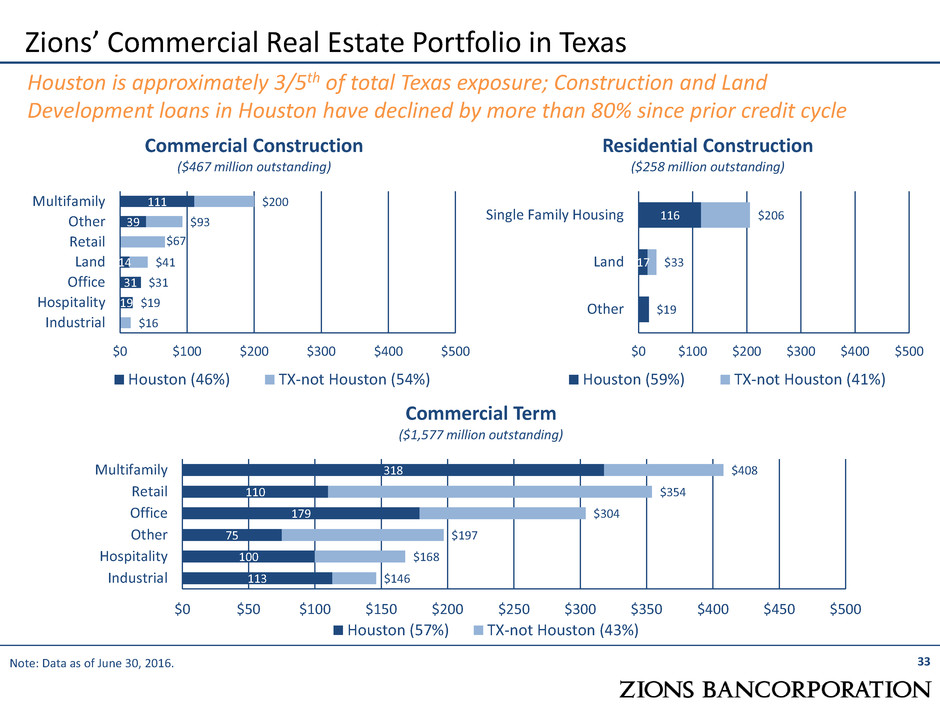
Zions’ Commercial Real Estate Portfolio in Texas
Houston is approximately 3/5th of total Texas exposure; Construction and Land
Development loans in Houston have declined by more than 80% since prior credit cycle
19
31
14
39
111
$16
$19
$31
$41
$67
$93
$200
$0 $100 $200 $300 $400 $500
Industrial
Hospitality
Office
Land
Retail
Other
Multifamily
Commercial Construction
($467 million outstanding)
Houston (46%) TX-not Houston (54%)
17
116
$19
$33
$206
$0 $100 $200 $300 $400 $500
Other
Land
Single Family Housing
Residential Construction
($258 million outstanding)
Houston (59%) TX-not Houston (41%)
113
100
75
179
110
318
$146
$168
$197
$304
$354
$408
$0 $50 $100 $150 $200 $250 $300 $350 $400 $450 $500
Industrial
Hospitality
Other
Office
Retail
Multifamily
Commercial Term
($1,577 million outstanding)
Houston (57%) TX-not Houston (43%)
34
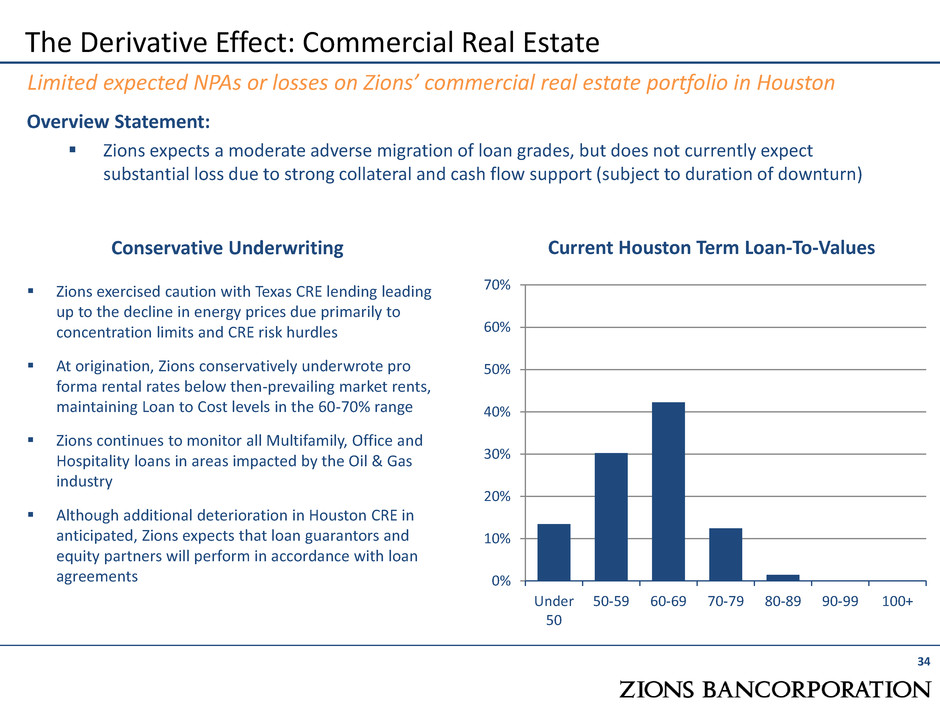
The Derivative Effect: Commercial Real Estate
Limited expected NPAs or losses on Zions’ commercial real estate portfolio in Houston
Overview Statement:
Zions expects a moderate adverse migration of loan grades, but does not currently expect
substantial loss due to strong collateral and cash flow support (subject to duration of downturn)
0%
10%
20%
30%
40%
50%
60%
70%
Under
50
50-59 60-69 70-79 80-89 90-99 100+
Current Houston Term Loan-To-Values
Zions exercised caution with Texas CRE lending leading
up to the decline in energy prices due primarily to
concentration limits and CRE risk hurdles
At origination, Zions conservatively underwrote pro
forma rental rates below then-prevailing market rents,
maintaining Loan to Cost levels in the 60-70% range
Zions continues to monitor all Multifamily, Office and
Hospitality loans in areas impacted by the Oil & Gas
industry
Although additional deterioration in Houston CRE in
anticipated, Zions expects that loan guarantors and
equity partners will perform in accordance with loan
agreements
Conservative Underwriting
35
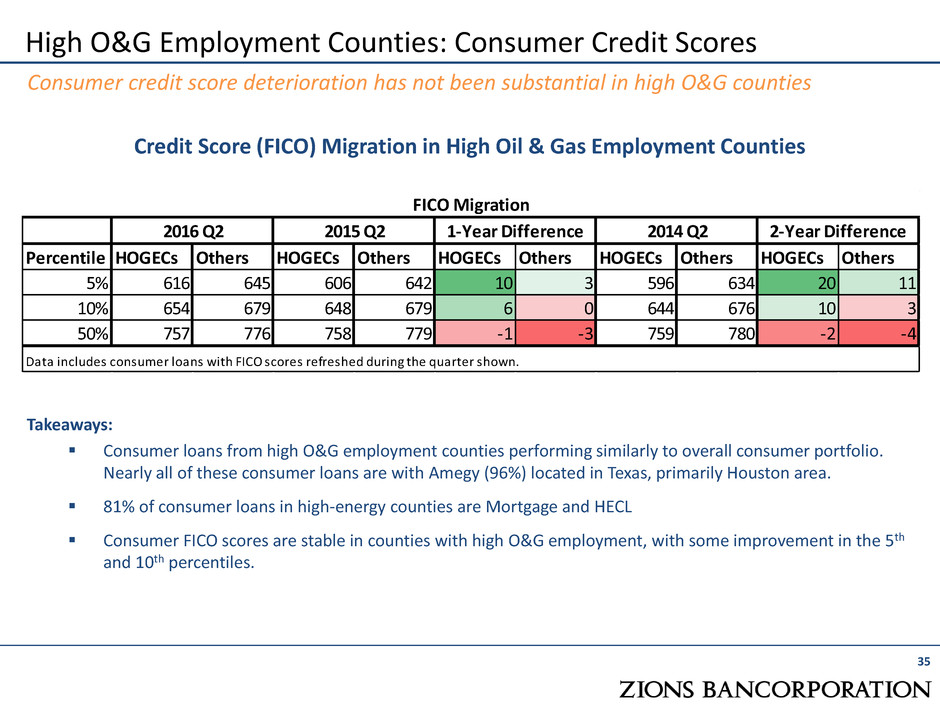
High O&G Employment Counties: Consumer Credit Scores
Consumer credit score deterioration has not been substantial in high O&G counties
Credit Score (FICO) Migration in High Oil & Gas Employment Counties
Percentile HOGECs Others HOGECs Others HOGECs Others HOGECs Others HOGECs Others
5% 616 645 606 642 10 3 596 634 20 11
10% 654 679 648 679 6 0 644 676 10 3
50% 757 776 758 779 -1 -3 759 780 -2 -4
Data includes consumer loans with FICO scores refreshed during the quarter shown.
FICO Migration
2016 Q2 2015 Q2 1-Year Difference 2014 Q2 2-Year Difference
Takeaways:
Consumer loans from high O&G employment counties performing similarly to overall consumer portfolio.
Nearly all of these consumer loans are with Amegy (96%) located in Texas, primarily Houston area.
81% of consumer loans in high-energy counties are Mortgage and HECL
Consumer FICO scores are stable in counties with high O&G employment, with some improvement in the 5th
and 10th percentiles.
36
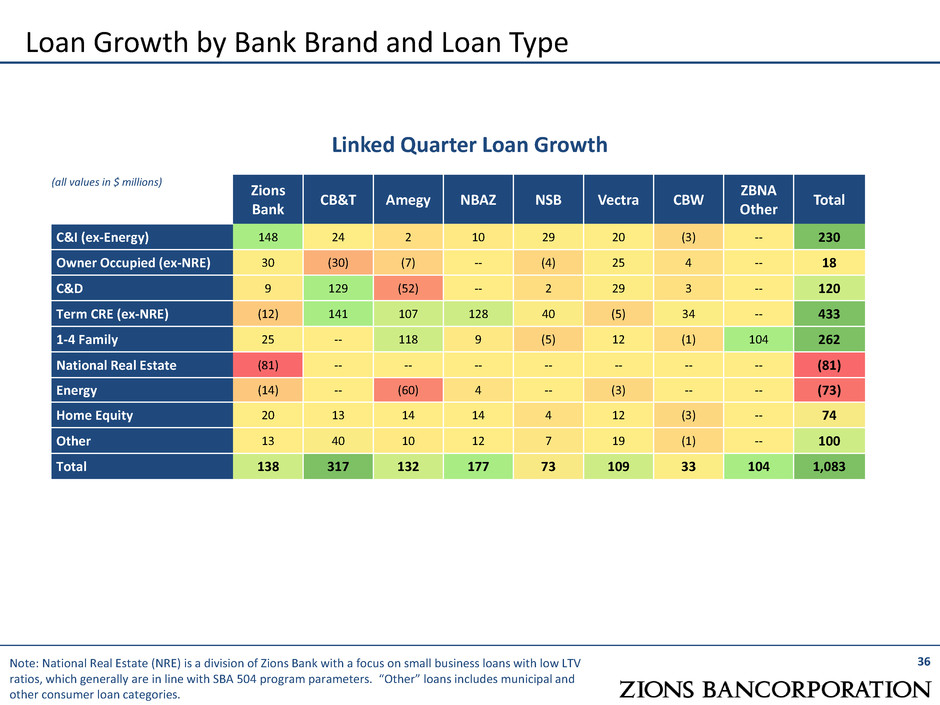
Loan Growth by Bank Brand and Loan Type
Note: National Real Estate (NRE) is a division of Zions Bank with a focus on small business loans with low LTV
ratios, which generally are in line with SBA 504 program parameters. “Other” loans includes municipal and
other consumer loan categories.
Linked Quarter Loan Growth
(all values in $ millions)
Zions
Bank
CB&T Amegy NBAZ NSB Vectra CBW
ZBNA
Other
Total
C&I (ex-Energy) 148 24 2 10 29 20 (3) -- 230
Owner Occupied (ex-NRE) 30 (30) (7) -- (4) 25 4 -- 18
C&D 9 129 (52) -- 2 29 3 -- 120
Term CRE (ex-NRE) (12) 141 107 128 40 (5) 34 -- 433
1-4 Family 25 -- 118 9 (5) 12 (1) 104 262
National Real Estate (81) -- -- -- -- -- -- -- (81)
Energy (14) -- (60) 4 -- (3) -- -- (73)
Home Equity 20 13 14 14 4 12 (3) -- 74
Other 13 40 10 12 7 19 (1) -- 100
Total 138 317 132 177 73 109 33 104 1,083
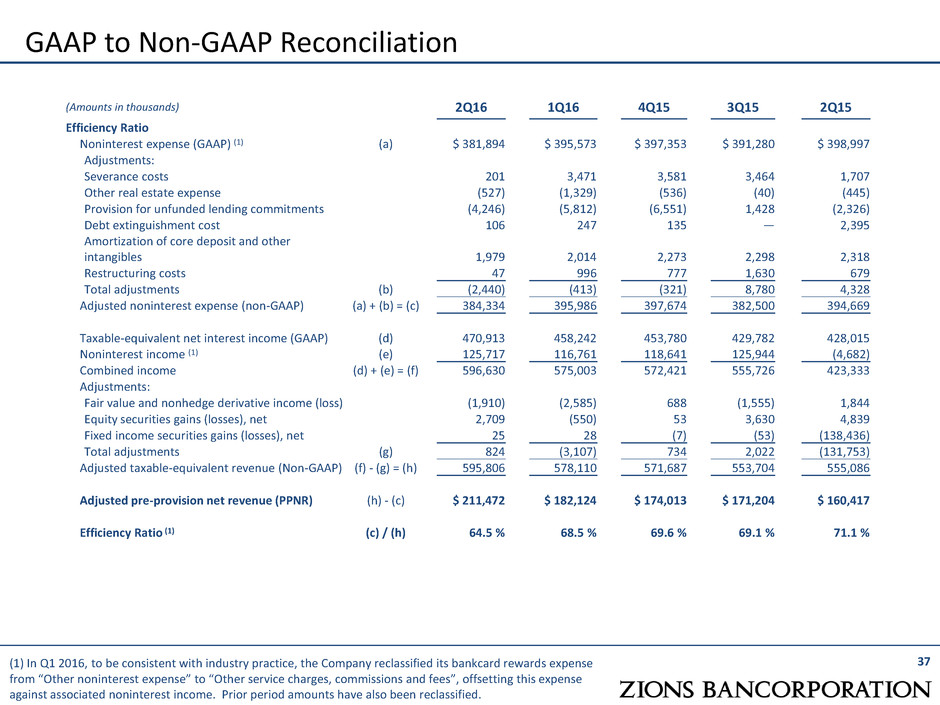
37 (1) In Q1 2016, to be consistent with industry practice, the Company reclassified its bankcard rewards expense
from “Other noninterest expense” to “Other service charges, commissions and fees”, offsetting this expense
against associated noninterest income. Prior period amounts have also been reclassified.
GAAP to Non-GAAP Reconciliation
(Amounts in thousands) 2Q16 1Q16 4Q15 3Q15 2Q15
Efficiency Ratio
Noninterest expense (GAAP) (1) (a) $ 381,894 $ 395,573 $ 397,353 $ 391,280 $ 398,997
Adjustments:
Severance costs 201 3,471 3,581 3,464 1,707
Other real estate expense (527) (1,329) (536) (40) (445)
Provision for unfunded lending commitments (4,246) (5,812) (6,551) 1,428 (2,326)
Debt extinguishment cost 106 247 135 — 2,395
Amortization of core deposit and other
intangibles 1,979 2,014 2,273 2,298 2,318
Restructuring costs 47 996 777 1,630 679
Total adjustments (b) (2,440) (413) (321) 8,780 4,328
Adjusted noninterest expense (non-GAAP) (a) + (b) = (c) 384,334 395,986 397,674 382,500 394,669
Taxable-equivalent net interest income (GAAP) (d) 470,913 458,242 453,780 429,782 428,015
Noninterest income (1) (e) 125,717 116,761 118,641 125,944 (4,682)
Combined income (d) + (e) = (f) 596,630 575,003 572,421 555,726 423,333
Adjustments:
Fair value and nonhedge derivative income (loss) (1,910) (2,585) 688 (1,555) 1,844
Equity securities gains (losses), net 2,709 (550) 53 3,630 4,839
Fixed income securities gains (losses), net 25 28 (7) (53) (138,436)
Total adjustments (g) 824 (3,107) 734 2,022 (131,753)
Adjusted taxable-equivalent revenue (Non-GAAP) (f) - (g) = (h) 595,806 578,110 571,687 553,704 555,086
Adjusted pre-provision net revenue (PPNR) (h) - (c) $ 211,472 $ 182,124 $ 174,013 $ 171,204 $ 160,417
Efficiency Ratio (1) (c) / (h) 64.5 % 68.5 % 69.6 % 69.1 % 71.1 %
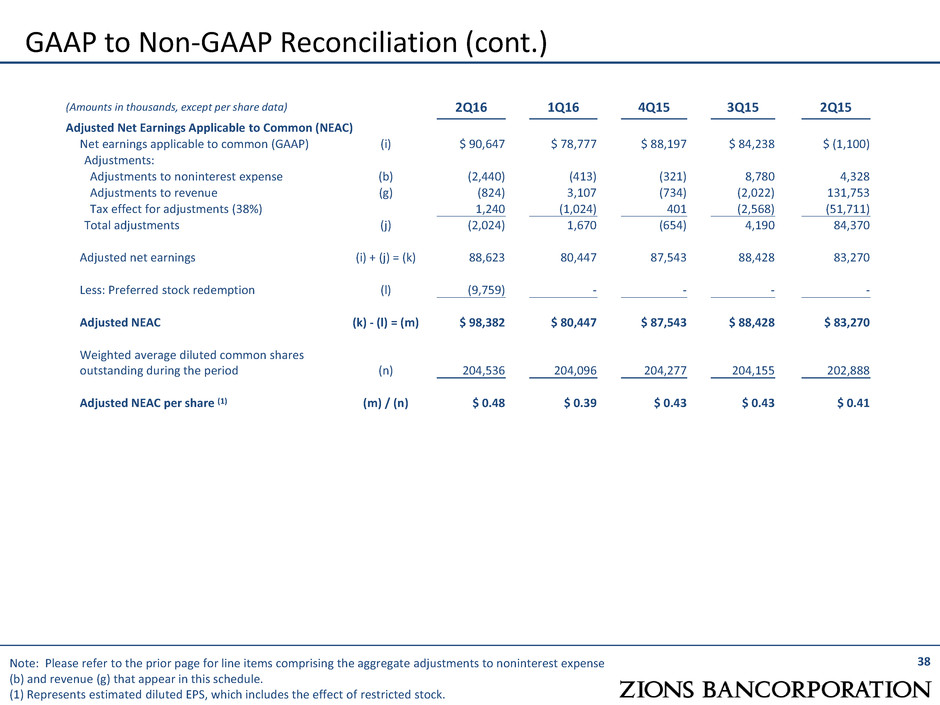
38 Note: Please refer to the prior page for line items comprising the aggregate adjustments to noninterest expense
(b) and revenue (g) that appear in this schedule.
(1) Represents estimated diluted EPS, which includes the effect of restricted stock.
GAAP to Non-GAAP Reconciliation (cont.)
(Amounts in thousands, except per share data) 2Q16 1Q16 4Q15 3Q15 2Q15
Adjusted Net Earnings Applicable to Common (NEAC)
Net earnings applicable to common (GAAP) (i) $ 90,647 $ 78,777 $ 88,197 $ 84,238 $ (1,100)
Adjustments:
Adjustments to noninterest expense (b) (2,440) (413) (321) 8,780 4,328
Adjustments to revenue (g) (824) 3,107 (734) (2,022) 131,753
Tax effect for adjustments (38%) 1,240 (1,024) 401 (2,568) (51,711)
Total adjustments (j) (2,024) 1,670 (654) 4,190 84,370
Adjusted net earnings (i) + (j) = (k) 88,623 80,447 87,543 88,428 83,270
Less: Preferred stock redemption (l) (9,759) - - - -
Adjusted NEAC (k) - (l) = (m) $ 98,382 $ 80,447 $ 87,543 $ 88,428 $ 83,270
Weighted average diluted common shares
outstanding during the period (n) 204,536 204,096 204,277 204,155 202,888
Adjusted NEAC per share (1) (m) / (n) $ 0.48 $ 0.39 $ 0.43 $ 0.43 $ 0.41
