Attached files
| file | filename |
|---|---|
| 8-K - INTRAWEST RESORTS HOLDINGS, INC 8-K 9-8-2016 - Intrawest Resorts Holdings, Inc. | form8k.htm |
| EX-99.1 - EXHIBIT 99.1 - Intrawest Resorts Holdings, Inc. | ex99_1.htm |
Exhibit 99.2

Intrawest Resorts Holdings, Inc.Fiscal 2016 Year-End Earnings Call PresentationSeptember 8, 2016
Important Information 2 This document contains forward-looking statements. These forward-looking statements are based on current expectations, estimates and projections about the industry and markets in which Intrawest operates as well as the Company’s beliefs and assumptions regarding our operations and financial performance, all of which are subject to known and unknown risks, uncertainties and other factors that may cause our actual results, performance or achievements, industry results or market trends to differ materially from those expressed or implied by such forward-looking statements. Therefore any statements contained herein that are not statements of historical fact may be forward-looking statements and should be evaluated as such. Without limiting the foregoing, words such as “Expects”, “Anticipates”, “Should”, “Intends”, “Plans”, “Believes”, “Seeks”, “Estimates”, “Projects”, and variations of such words and similar expressions are intended to identify such forward-looking statements. These statements are not guarantees of future performance and involve certain risks, uncertainties and assumptions which are difficult to predict, including those described in Part I - Item 1A, ‘‘Risk Factors’’ in our Annual Report on Form 10-K for the fiscal year ended June 30, 2016 filed with the Securities and Exchange Commission (“SEC”) on September 8, 2016, as may be revised in subsequent SEC filings. Therefore, actual outcomes and results may differ materially from what is expressed or forecasted in such forward-looking statements. The actual performance of Intrawest may differ from the budget, projections and returns set forth herein and may differ materially.Certain information contained herein has been obtained from published and non-published sources. Such information has not been independently verified by Intrawest. Except where otherwise indicated, the information provided herein is based on matters as they exist as of the date of preparation and not as of any future date, and will not be updated or otherwise revised to reflect information that subsequently becomes available, or circumstances existing or changes occurring after the date hereof.This presentation is part of the fiscal 2016 year-end earnings call dated September 8, 2016, and includes certain non-GAAP financial measures, including Adjusted EBITDA (“Adj. EBITDA”). Non-GAAP financial measures such as Adj. EBITDA should be considered only as supplemental to, and not as superior to, financial measures prepared in accordance with GAAP. Please refer to our Current Report on Form 10-K filed September 8, 2016, with the SEC for a reconciliation of the non-GAAP financial measures included in this presentation to the most directly comparable financial measures prepared in accordance with GAAP.We use Adj. EBITDA as a measure of our operating performance. Adj. EBITDA is a supplemental non-GAAP financial measure.Our board of directors and management team focus on Adj. EBITDA as a key performance and compensation measure. Adj. EBITDA assists us in comparing our performance over various reporting periods because it removes from our operating results the impact of items that our management believes do not reflect our core operating performance. The compensation committee of our board of directors will determine the annual variable compensation for certain members of our management team, based in part, on Adj. EBITDA. Adj. EBITDA is not a substitute for net income (loss), income (loss) from continuing operations, cash flows from operating activities or any other measure prescribed by GAAP. There are limitations to using non-GAAP measures such as Adj. EBITDA. Although we believe that Adj. EBITDA can make an evaluation of our operating performance more consistent because it removes items that do not reflect our core operations, other companies in our industry may define Adj. EBITDA differently than we do. As a result, it may be difficult to use Adj. EBITDA to compare the performance of those companies to our performance. Adj. EBITDA should not be considered as a measure of the income generated by our business or discretionary cash available to us to invest in the growth of our business. Our management compensates for these limitations by reference to our GAAP results and using Adj. EBITDA as a supplemental measure.
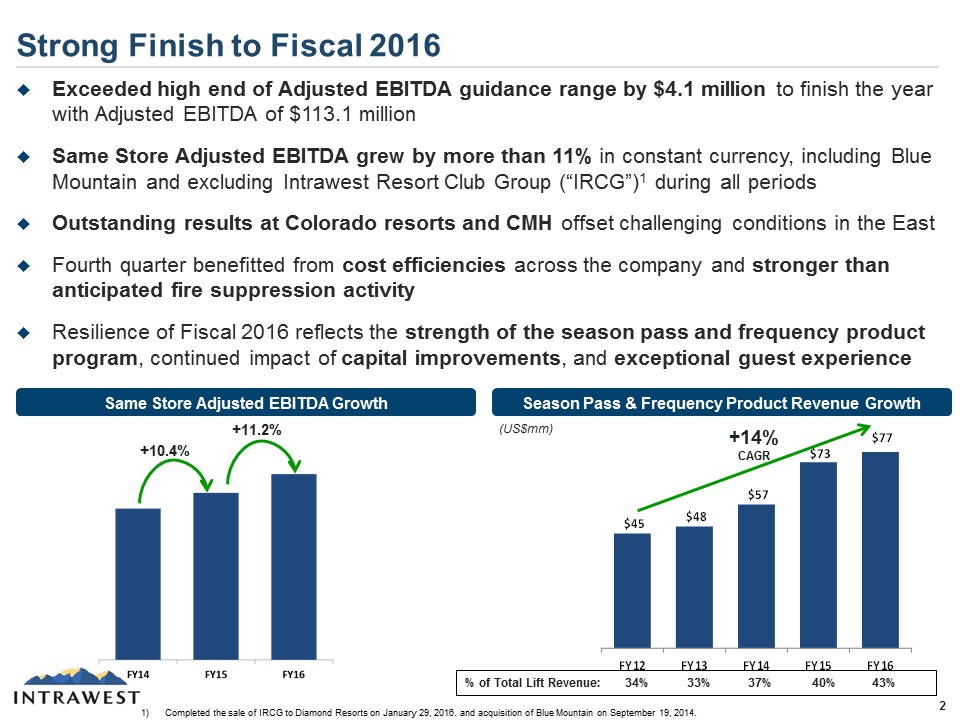
Strong Finish to Fiscal 2016 2 Completed the sale of IRCG to Diamond Resorts on January 29, 2016. and acquisition of Blue Mountain on September 19, 2014. Exceeded high end of Adjusted EBITDA guidance range by $4.1 million to finish the year with Adjusted EBITDA of $113.1 millionSame Store Adjusted EBITDA grew by more than 11% in constant currency, including Blue Mountain and excluding Intrawest Resort Club Group (“IRCG”)1 during all periodsOutstanding results at Colorado resorts and CMH offset challenging conditions in the EastFourth quarter benefitted from cost efficiencies across the company and stronger than anticipated fire suppression activityResilience of Fiscal 2016 reflects the strength of the season pass and frequency product program, continued impact of capital improvements, and exceptional guest experience Season Pass & Frequency Product Revenue Growth +14% CAGR % of Total Lift Revenue: 34% 33% 37% 40% 43% Same Store Adjusted EBITDA Growth +10.4% +11.2% (US$mm)
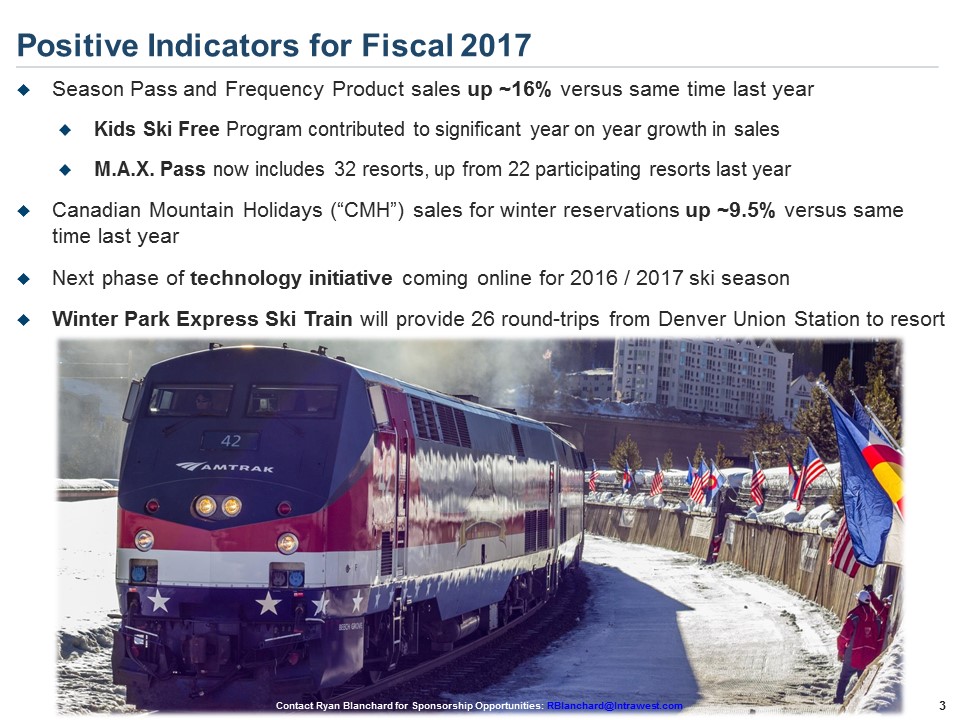
Positive Indicators for Fiscal 2017 3 Season Pass and Frequency Product sales up ~16% versus same time last yearKids Ski Free Program contributed to significant year on year growth in salesM.A.X. Pass now includes 32 resorts, up from 22 participating resorts last yearCanadian Mountain Holidays (“CMH”) sales for winter reservations up ~9.5% versus same time last yearNext phase of technology initiative coming online for 2016 / 2017 ski seasonWinter Park Express Ski Train will provide 26 round-trips from Denver Union Station to resort Contact Ryan Blanchard for Sponsorship Opportunities: RBlanchard@Intrawest.com
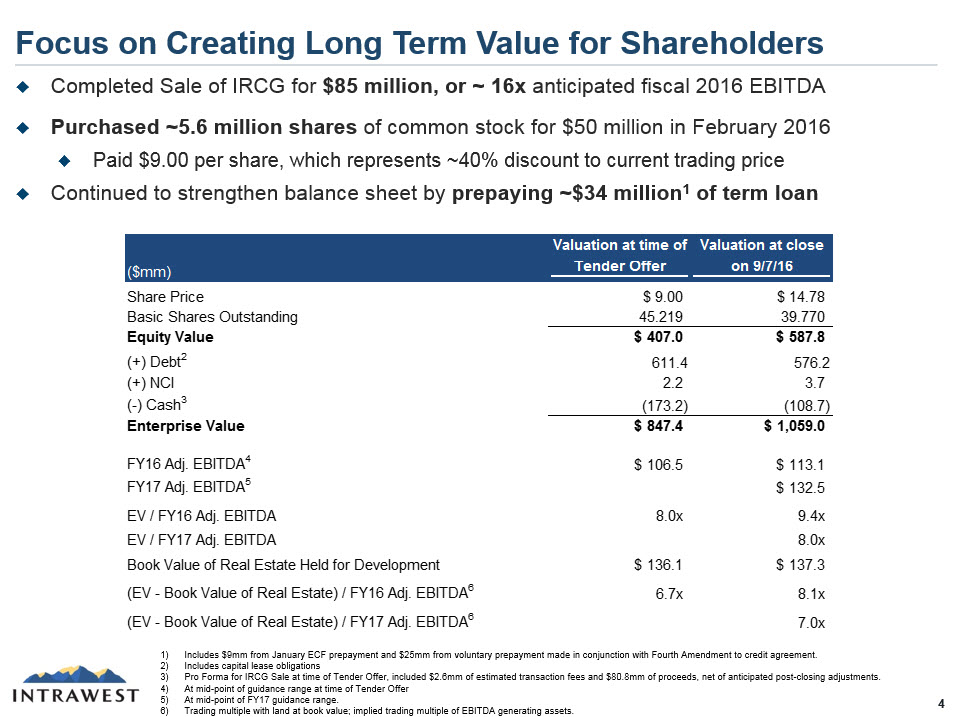
Focus on Creating Long Term Value for Shareholders 4 Includes $9mm from January ECF prepayment and $25mm from voluntary prepayment made in conjunction with Fourth Amendment to credit agreement. Includes capital lease obligationsPro Forma for IRCG Sale at time of Tender Offer, included $2.6mm of estimated transaction fees and $80.8mm of proceeds, net of anticipated post-closing adjustments.At mid-point of guidance range at time of Tender OfferAt mid-point of FY17 guidance range.Trading multiple with land at book value; implied trading multiple of EBITDA generating assets. Completed Sale of IRCG for $85 million, or ~ 16x anticipated fiscal 2016 EBITDAPurchased 5.6 million shares of common stock for $50 million in February 2016 Paid $9.00 per share, which represents ~40% discount to current trading price Continued to strengthen balance sheet by prepaying ~$34 million1 of term loan
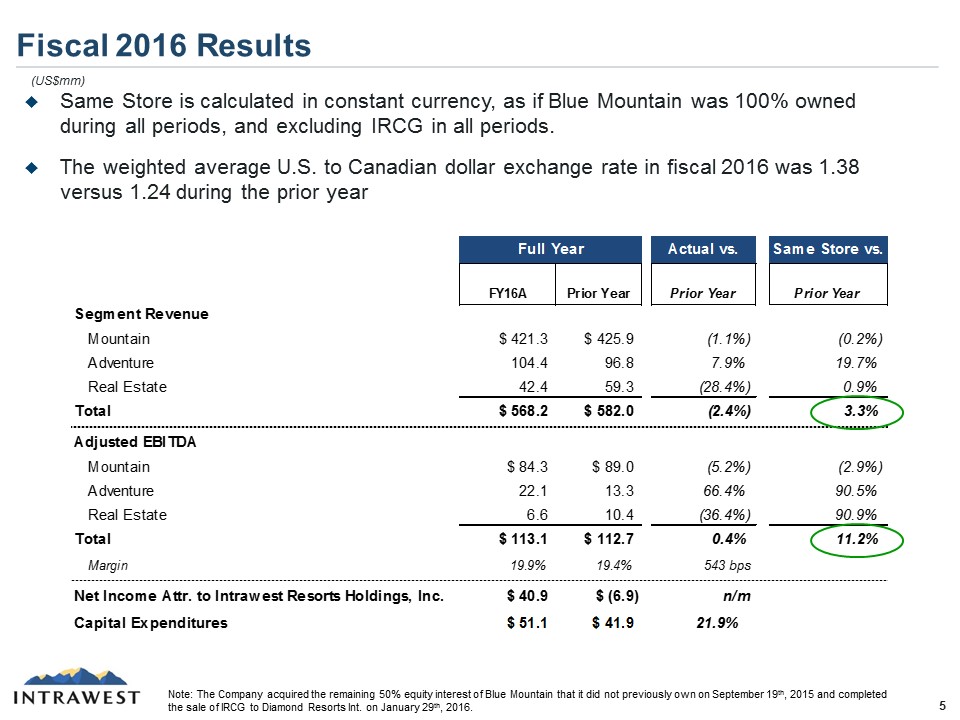
Fiscal 2016 Results 6 (US$mm) Note: The Company acquired the remaining 50% equity interest of Blue Mountain that it did not previously own on September 19th, 2015 and completed the sale of IRCG to Diamond Resorts Int. on January 29th, 2016. Same Store is calculated in constant currency, as if Blue Mountain was 100% owned during all periods, and excluding IRCG in all periods.The weighted average U.S. to Canadian dollar exchange rate in fiscal 2016 was 1.38 versus 1.24 during the prior year
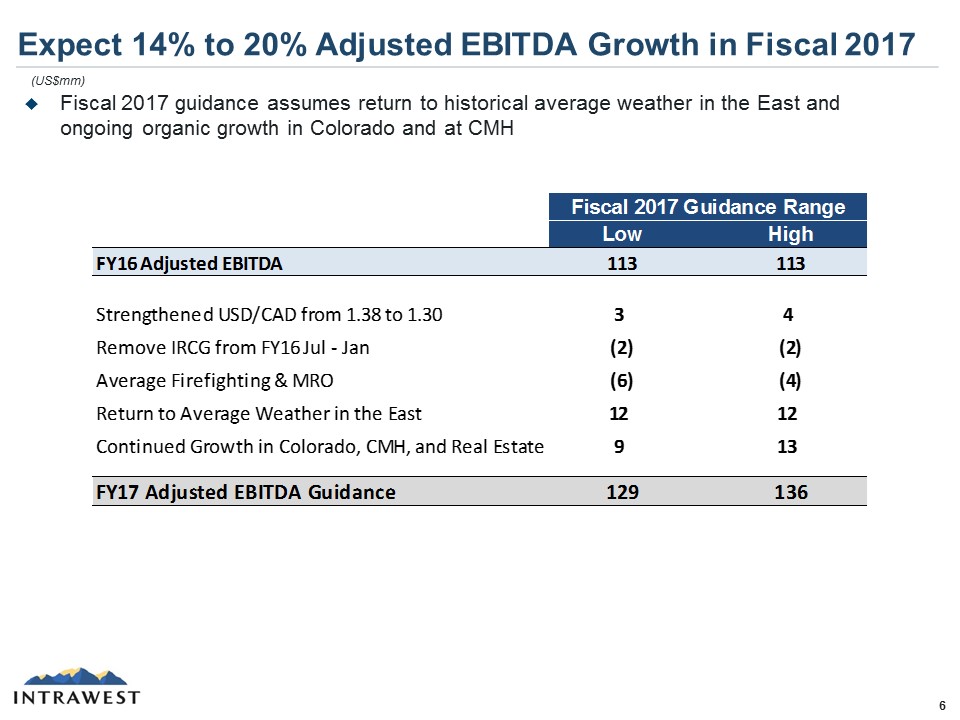
Expect 14% to 20% Adjusted EBITDA Growth in Fiscal 2017 7 Fiscal 2017 guidance assumes return to historical average weather in the East and ongoing organic growth in Colorado and at CMH (US$mm)
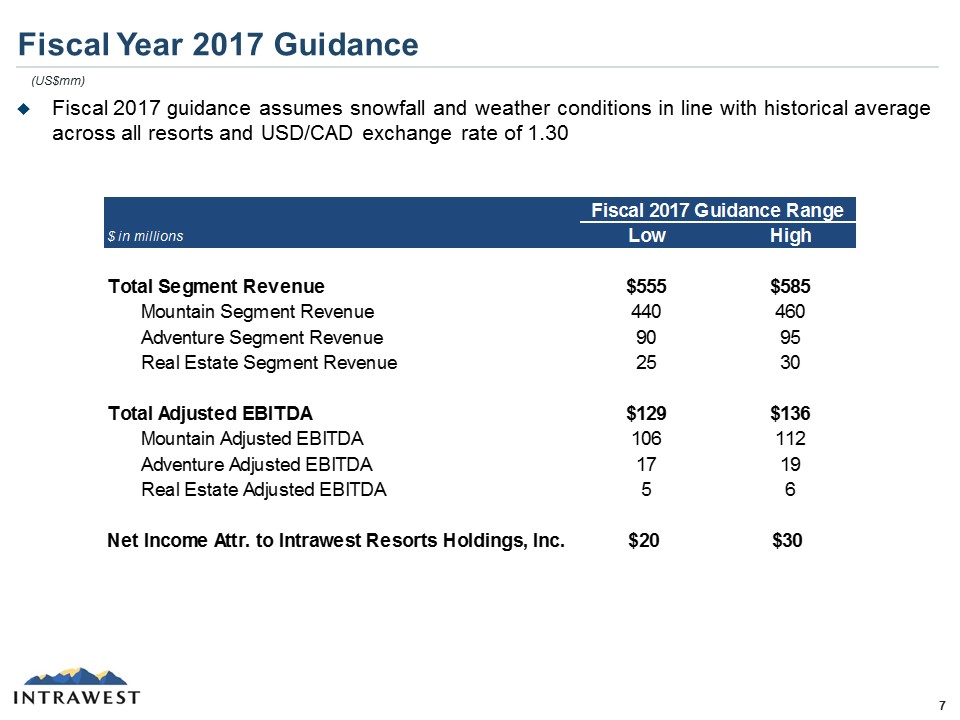
Fiscal Year 2017 Guidance Fiscal 2017 guidance assumes snowfall and weather conditions in line with historical average across all resorts and USD/CAD exchange rate of 1.30 8 (US$mm)
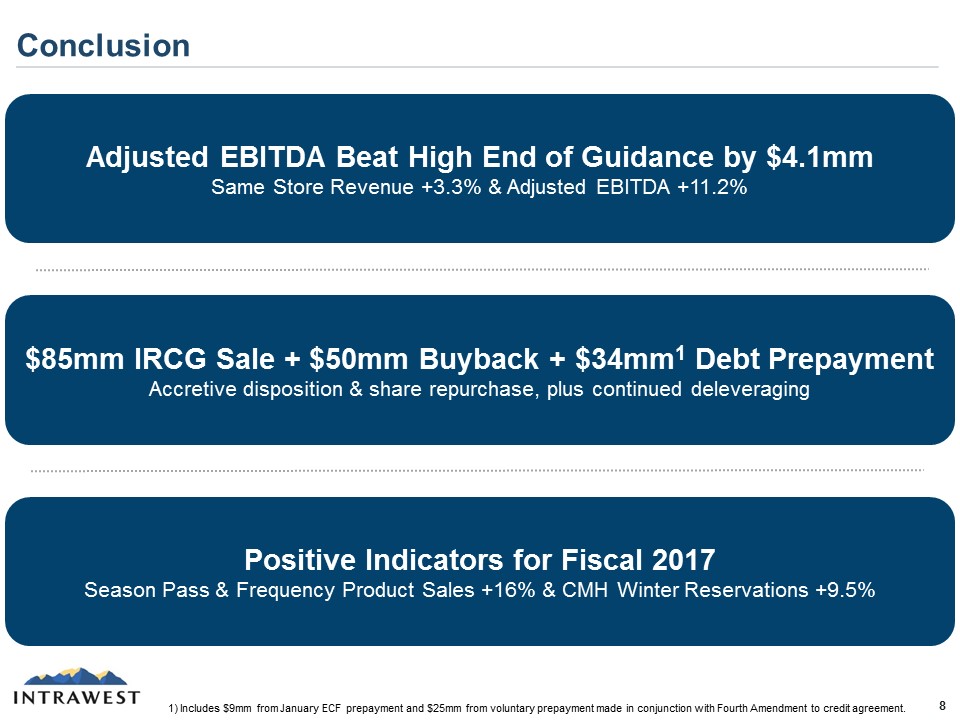
Conclusion 9 $85mm IRCG Sale + $50mm Buyback + $34mm1 Debt Prepayment Accretive disposition & share repurchase, plus continued deleveraging Positive Indicators for Fiscal 2017Season Pass & Frequency Product Sales +16% & CMH Winter Reservations +9.5% Adjusted EBITDA Beat High End of Guidance by $4.1mmSame Store Revenue +3.3% & Adjusted EBITDA +11.2% 1) Includes $9mm from January ECF prepayment and $25mm from voluntary prepayment made in conjunction with Fourth Amendment to credit agreement.