Attached files
| file | filename |
|---|---|
| EX-99.1 - EX-99.1 - HD Supply Holdings, Inc. | a16-17815_1ex99d1.htm |
| 8-K - 8-K - HD Supply Holdings, Inc. | a16-17815_18k.htm |
Exhibit 99.2
2016 Second-Quarter Performance September 7, 2016 Financial Results and Company Highlights

Disclaimers Forward-Looking Statements and Preliminary Results This presentation includes “forward-looking statements” within the meaning of Section 27A of the Securities Act and Section 21E of the Exchange Act. Forward-looking statements are based on management’s beliefs and assumptions and information currently available to management and are subject to known and unknown risks and uncertainties, many of which may be beyond our control. We caution you that the forward-looking information presented in this presentation is not a guarantee of future results, and that actual results may differ materially from those made in or suggested by the forward-looking information contained in this presentation. In addition, forward-looking statements generally can be identified by the use of forward-looking terminology such as “may,” “plan,” “seek,” “comfortable with,” “will,” “expect,” “intend,” “estimate,” “anticipate,” “believe” or “continue” or the negative thereof or variations thereon or similar terminology. A number of important factors could cause actual events to differ materially from those contained in or implied by the forward-looking statements, including those “Risk factors” in our annual report on Form 10-K, for the fiscal year ended January 31, 2016, filed on March 18, 2016 and those described from time to time in our, and HD Supply, Inc.’s, other filings with the U.S. Securities and Exchange Commission, which can be found at the SEC’s website www.sec.gov. Any forward-looking information presented herein is made only as of the date of this presentation, and we do not undertake any obligation to update or revise any forward-looking information to reflect changes in assumptions, the occurrence of unanticipated events, or otherwise. Estimates for Net sales are preliminary estimates and are subject to risks and uncertainties, including, among others, changes in connection with quarter-end adjustments. Any variation between HD Supply’s actual results and the preliminary financial data set forth herein may be material. Non-GAAP Financial Measures HD Supply supplements its financial results that are determined in accordance with accounting principles generally accepted in the United States of America (“GAAP”) with non-GAAP measurements, including Adjusted EBITDA, Adjusted net income (loss) and Adjusted net income (loss) per share and Free Cash Flow. This supplemental information should not be considered in isolation or as a substitute for the GAAP measurements. Additional information regarding Adjusted EBITDA, Adjusted net income (loss) and Adjusted net income (loss) per share referred to in this presentation is included at the end of this presentation under “Reconciliation of Non-GAAP Measures.”
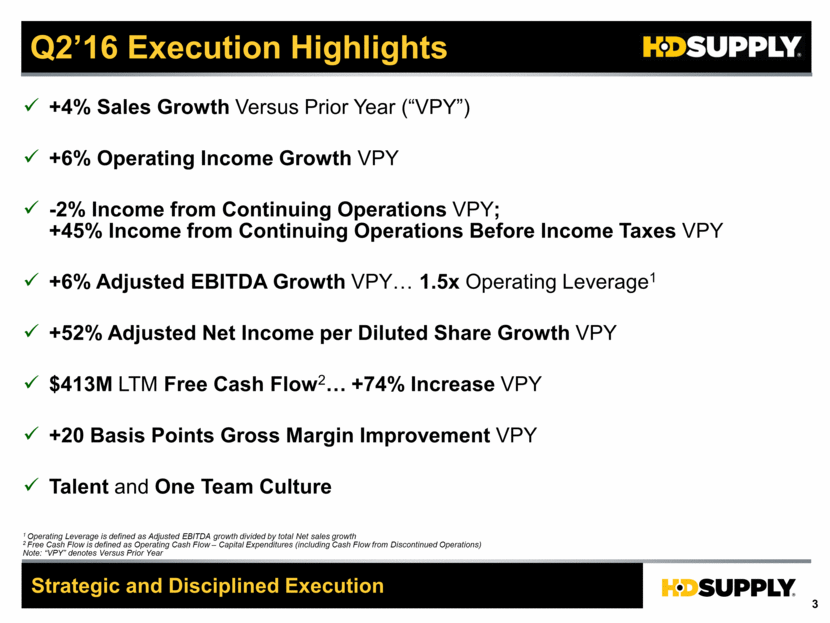
Q2’16 Execution Highlights Strategic and Disciplined Execution 1 Operating Leverage is defined as Adjusted EBITDA growth divided by total Net sales growth 2 Free Cash Flow is defined as Operating Cash Flow – Capital Expenditures (including Cash Flow from Discontinued Operations) Note: “VPY” denotes Versus Prior Year +4% Sales Growth Versus Prior Year (“VPY”) +6% Operating Income Growth VPY -2% Income from Continuing Operations VPY; +45% Income from Continuing Operations Before Income Taxes VPY +6% Adjusted EBITDA Growth VPY 1.5x Operating Leverage1 +52% Adjusted Net Income per Diluted Share Growth VPY $413M LTM Free Cash Flow2 +74% Increase VPY +20 Basis Points Gross Margin Improvement VPY Talent and One Team Culture
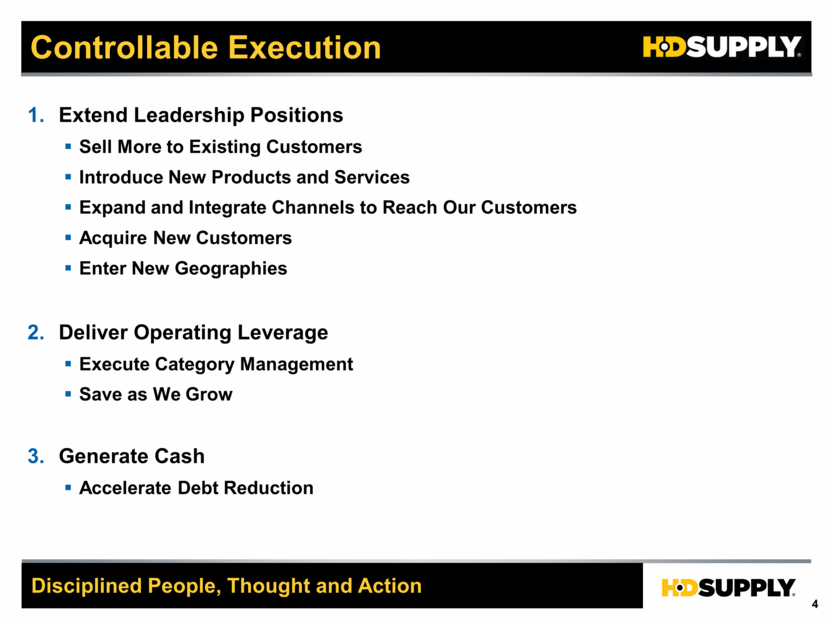
Controllable Execution Extend Leadership Positions Sell More to Existing Customers Introduce New Products and Services Expand and Integrate Channels to Reach Our Customers Acquire New Customers Enter New Geographies Deliver Operating Leverage Execute Category Management Save as We Grow Generate Cash Accelerate Debt Reduction Disciplined People, Thought and Action
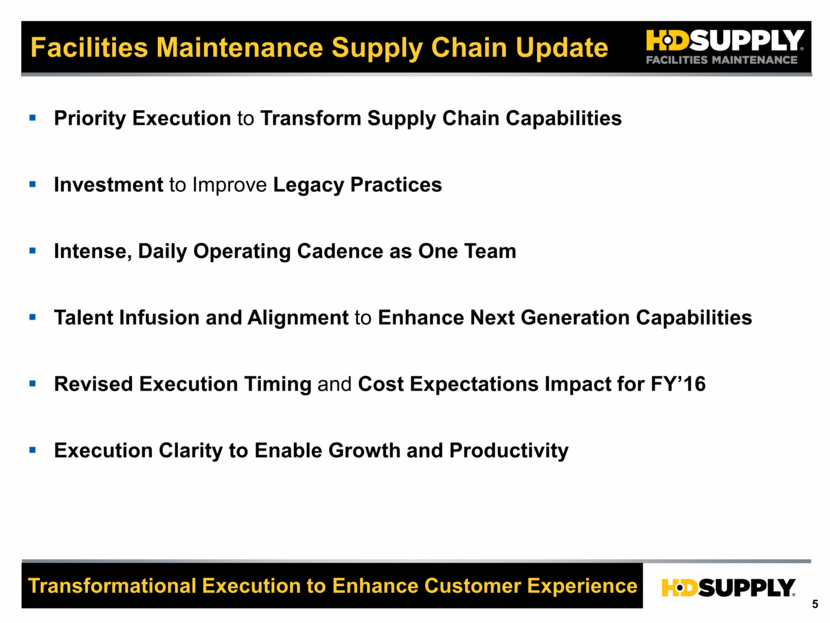
Facilities Maintenance Supply Chain Update Transformational Execution to Enhance Customer Experience Priority Execution to Transform Supply Chain Capabilities Investment to Improve Legacy Practices Intense, Daily Operating Cadence as One Team Talent Infusion and Alignment to Enhance Next Generation Capabilities Revised Execution Timing and Cost Expectations Impact for FY’16 Execution Clarity to Enable Growth and Productivity
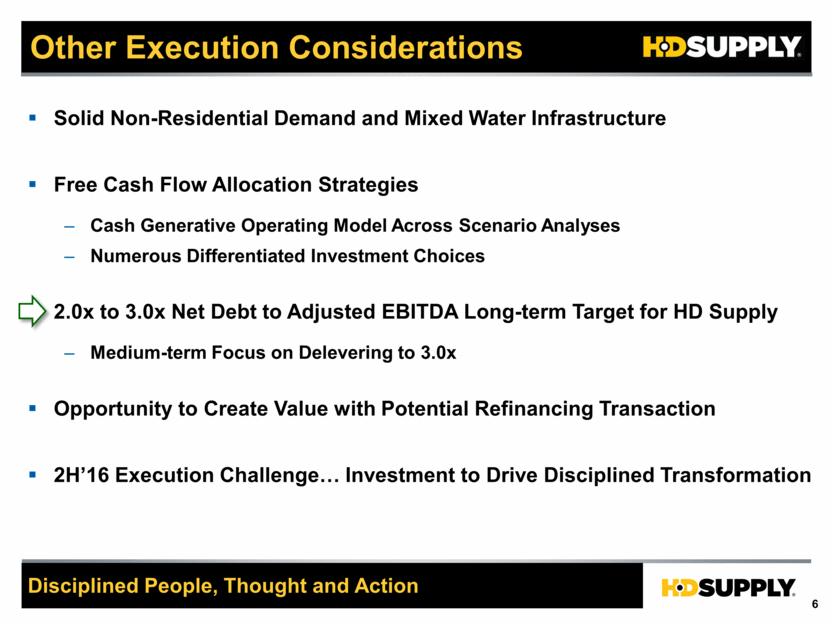
Other Execution Considerations Disciplined People, Thought and Action Solid Non-Residential Demand and Mixed Water Infrastructure Free Cash Flow Allocation Strategies Cash Generative Operating Model Across Scenario Analyses Numerous Differentiated Investment Choices 2.0x to 3.0x Net Debt to Adjusted EBITDA Long-term Target for HD Supply Medium-term Focus on Delevering to 3.0x Opportunity to Create Value with Potential Refinancing Transaction 2H’16 Execution Challenge Investment to Drive Disciplined Transformation
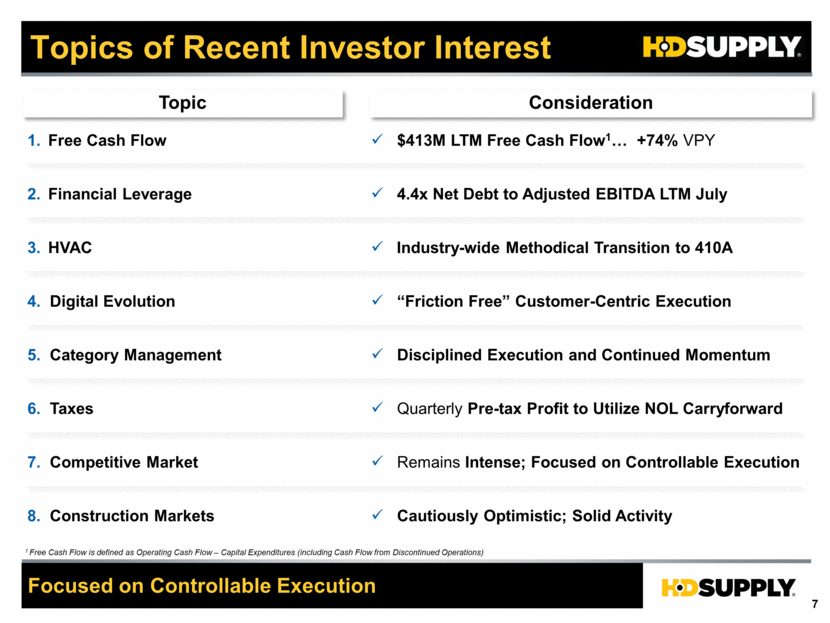
$413M LTM Free Cash Flow1 +74% VPY 4.4x Net Debt to Adjusted EBITDA LTM July Industry-wide Methodical Transition to 410A Quarterly Pre-tax Profit to Utilize NOL Carryforward Disciplined Execution and Continued Momentum Cautiously Optimistic; Solid Activity Remains Intense; Focused on Controllable Execution Topics of Recent Investor Interest Free Cash Flow is defined as Operating Cash Flow – Capital Expenditures (including Cash Flow from Discontinued Operations) Topic Consideration Free Cash Flow Financial Leverage HVAC 6. Taxes 4. Digital Evolution 5. Category Management 8. Construction Markets “Friction Free” Customer-Centric Execution 7. Competitive Market 1 Free Cash Flow is defined as Operating Cash Flow – Capital Expenditures (including Cash Flow from Discontinued Operations) Focused on Controllable Execution
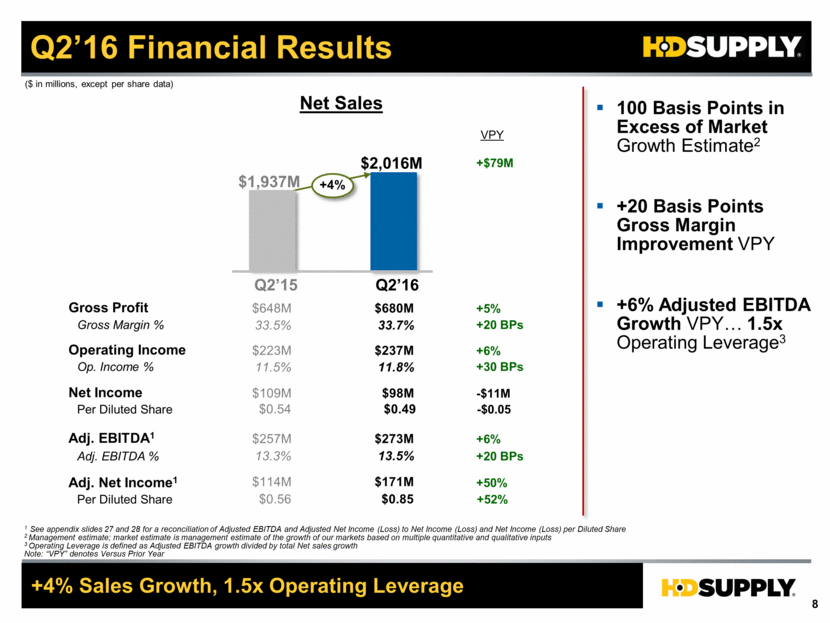
Q2’16 Financial Results $1,937M $2,016M +4% Gross Profit Gross Margin % Operating Income Adj. EBITDA % Op. Income % $648M $680M 33.5% 33.7% $257M $273M $223M $237M 13.3% 13.5% 11.8% +5% +20 BPs +20 BPs +6% ($ in millions, except per share data) $114M $171M +6% Net Sales 1 See appendix slides 27 and 28 for a reconciliation of Adjusted EBITDA and Adjusted Net Income (Loss) to Net Income (Loss) and Net Income (Loss) per Diluted Share 2 Management estimate; market estimate is management estimate of the growth of our markets based on multiple quantitative and qualitative inputs 3 Operating Leverage is defined as Adjusted EBITDA growth divided by total Net sales growth Note: “VPY” denotes Versus Prior Year Q2’15 Adj. EBITDA1 VPY Adj. Net Income1 11.5% +30 BPs Q2’16 $0.56 $0.85 +52% Per Diluted Share +$79M 100 Basis Points in Excess of Market Growth Estimate2 +20 Basis Points Gross Margin Improvement VPY +6% Adjusted EBITDA Growth VPY 1.5x Operating Leverage3 +4% Sales Growth, 1.5x Operating Leverage +50% Net Income $109M $98M -$11M $0.54 $0.49 -$0.05 Per Diluted Share
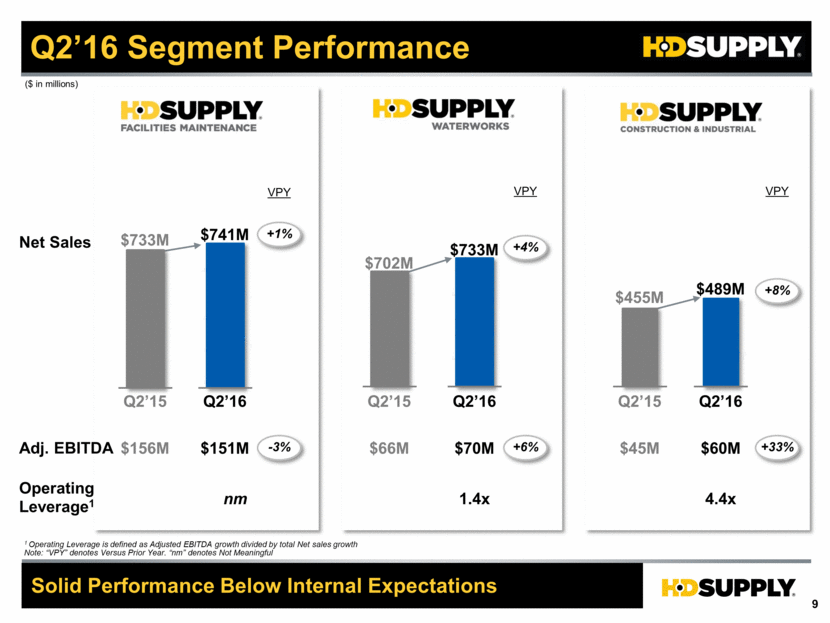
Q2’16 Segment Performance Q2’16 $741M $733M $489M Adj. EBITDA $151M $70M $60M Operating Leverage1 nm 1.4x 4.4x Net Sales ($ in millions) Solid Performance Below Internal Expectations Q2’15 $733M $702M $455M $156M $66M +4% VPY +1% -3% VPY VPY +6% +8% +33% $45M 1 Operating Leverage is defined as Adjusted EBITDA growth divided by total Net sales growth Note: “VPY” denotes Versus Prior Year. “nm” denotes Not Meaningful Q2’16 Q2’15 Q2’16 Q2’15
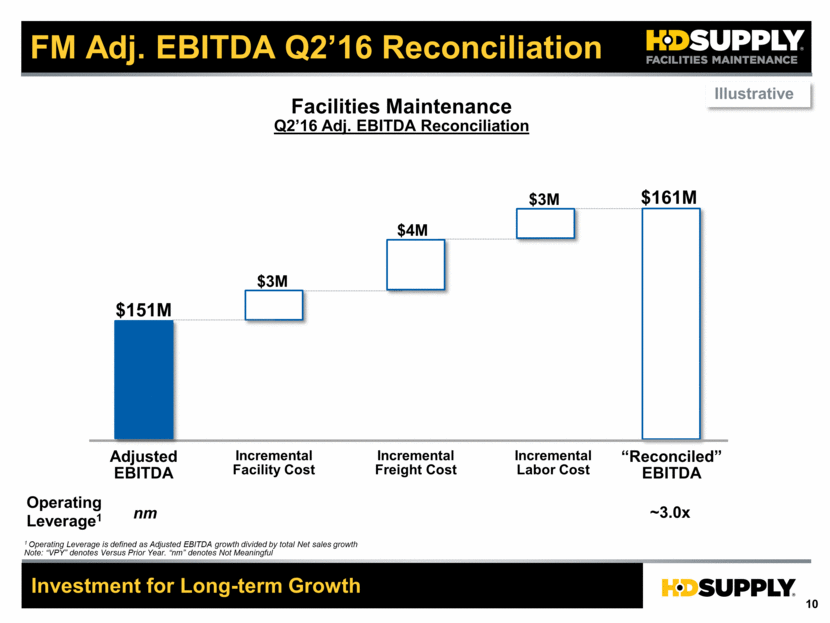
FM Adj. EBITDA Q2’16 Reconciliation Incremental Facility Cost Incremental Freight Cost Adjusted EBITDA Incremental Labor Cost “Reconciled” EBITDA $151M $3M $4M $161M Operating Leverage1 nm ~3.0x Investment for Long-term Growth $3M Illustrative Facilities Maintenance Q2’16 Adj. EBITDA Reconciliation 1 Operating Leverage is defined as Adjusted EBITDA growth divided by total Net sales growth Note: “VPY” denotes Versus Prior Year. “nm” denotes Not Meaningful
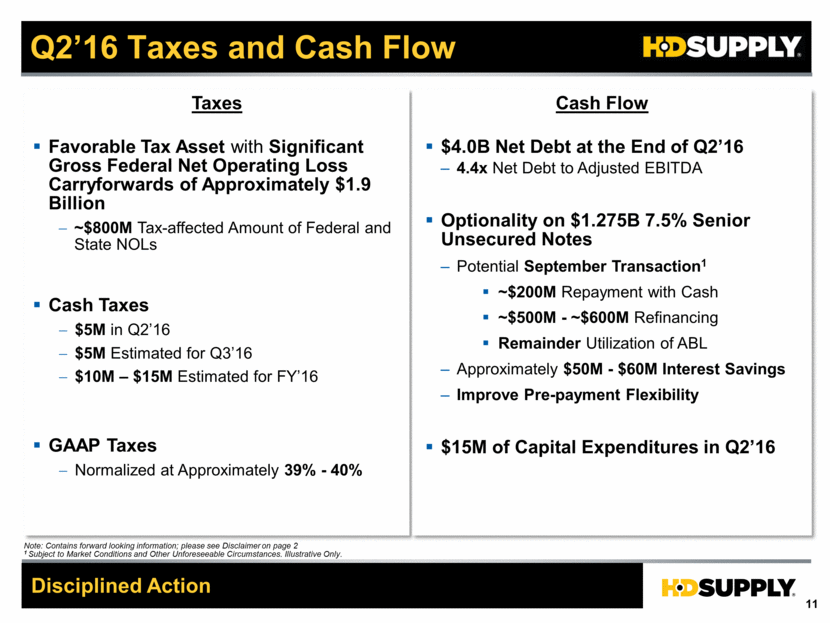
Q2’16 Taxes and Cash Flow Taxes Cash Flow Favorable Tax Asset with Significant Gross Federal Net Operating Loss Carryforwards of Approximately $1.9 Billion ~$800M Tax-affected Amount of Federal and State NOLs Cash Taxes $5M in Q2’16 $5M Estimated for Q3’16 $10M – $15M Estimated for FY’16 GAAP Taxes Normalized at Approximately 39% - 40% $4.0B Net Debt at the End of Q2’16 4.4x Net Debt to Adjusted EBITDA Optionality on $1.275B 7.5% Senior Unsecured Notes Potential September Transaction1 ~$200M Repayment with Cash ~$500M - ~$600M Refinancing Remainder Utilization of ABL Approximately $50M - $60M Interest Savings Improve Pre-payment Flexibility $15M of Capital Expenditures in Q2’16 Disciplined Action Note: Contains forward looking information; please see Disclaimer on page 2 1 Subject to Market Conditions and Other Unforeseeable Circumstances. Illustrative Only.
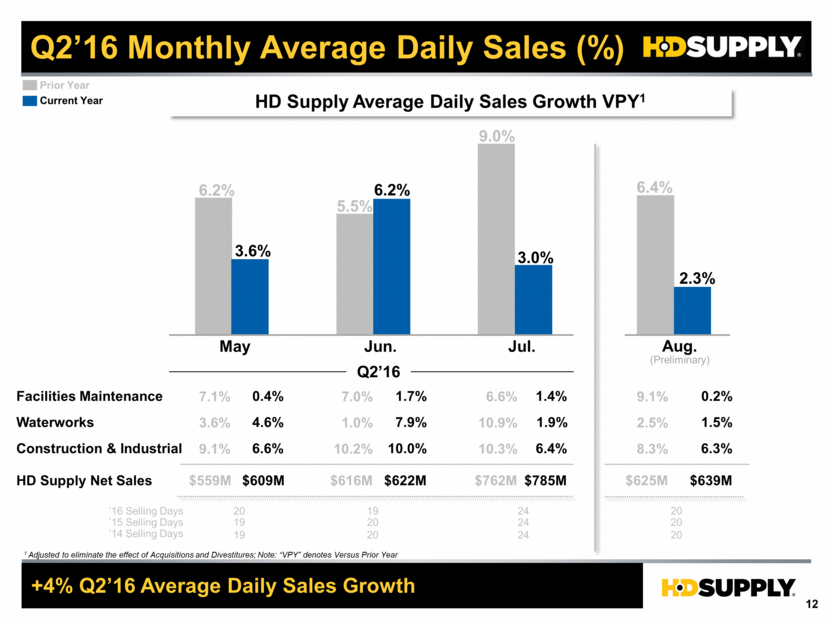
Q2’16 Monthly Average Daily Sales (%) +4% Q2’16 Average Daily Sales Growth 1 Adjusted to eliminate the effect of Acquisitions and Divestitures; Note: “VPY” denotes Versus Prior Year 1.4% 1.9% 6.4% 2.3% Aug. 0.2% 1.5% 6.3% 1.7% ’15 Selling Days 24 20 20 7.9% 10.0% Facilities Maintenance Waterworks Construction & Industrial (Preliminary) 3.6% 6.2% 3.0% 0.4% 4.6% 6.6% 19 6.2% 6.4% May Jun. Jul. Prior Year $785M $639M $622M HD Supply Net Sales $609M 5.5% 9.0% ’14 Selling Days 24 20 20 19 Q2’16 9.1% 2.5% 8.3% $625M 6.6% 10.9% 10.3% $762M 7.0% 1.0% 10.2% $616M 7.1% 3.6% 9.1% $559M HD Supply Average Daily Sales Growth VPY1 ’16 Selling Days 24 20 19 20 Current Year
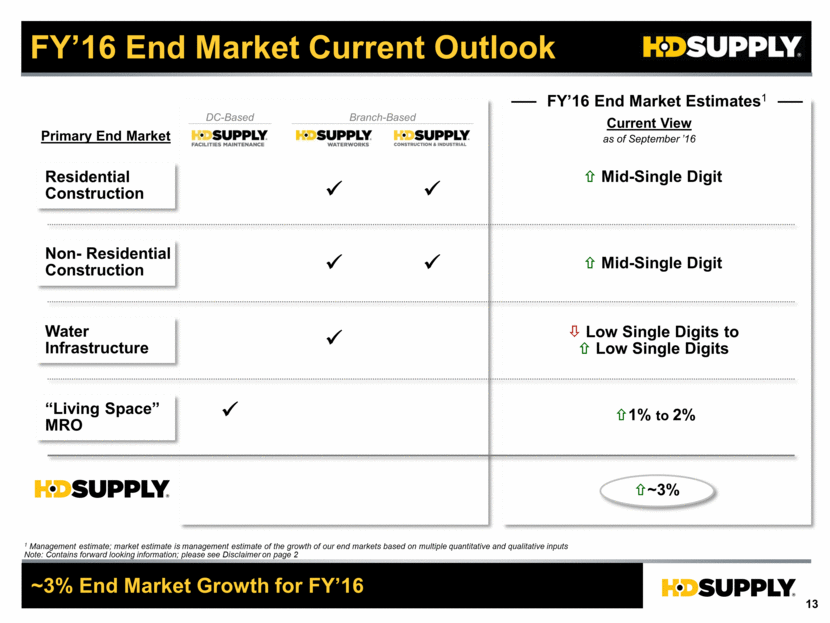
FY’16 End Market Current Outlook ~3% End Market Growth for FY’16 Residential Construction Water Infrastructure “Living Space” MRO Primary End Market Non- Residential Construction ~3% FY’16 End Market Estimates1 1% to 2% Current View as of September ’16 Mid-Single Digit Low Single Digits to Low Single Digits 1 Management estimate; market estimate is management estimate of the growth of our end markets based on multiple quantitative and qualitative inputs Note: Contains forward looking information; please see Disclaimer on page 2 Mid-Single Digit DC-Based Branch-Based
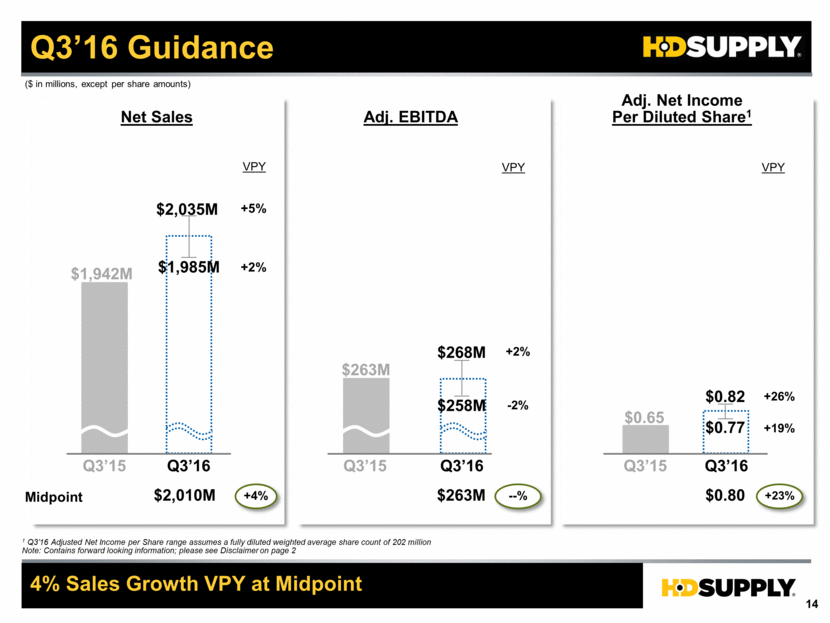
+2% -2% +5% +2% Q3’16 Guidance 4% Sales Growth VPY at Midpoint $2,035M $1,985M $263M $1,942M $268M $258M VPY Q3’15 Q3’16 Q3’15 Q3’16 Q3’16 Net Sales Adj. EBITDA Adj. Net Income Per Diluted Share1 VPY 1 Q3’16 Adjusted Net Income per Share range assumes a fully diluted weighted average share count of 202 million Note: Contains forward looking information; please see Disclaimer on page 2 $0.82 $0.77 VPY ($ in millions, except per share amounts) $0.65 . . . . Q3’15 +26% +19% Midpoint $2,010M +4% $263M --% $0.80 +23%
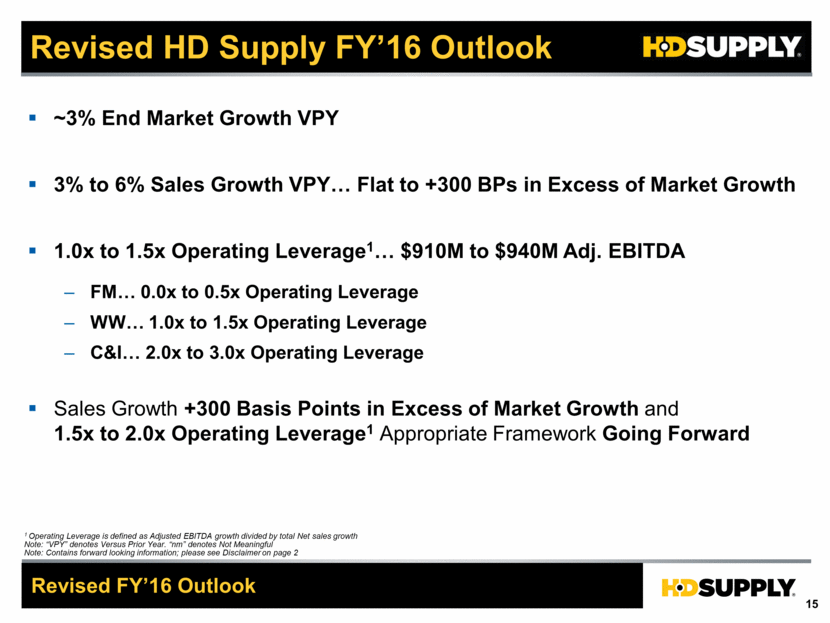
Revised HD Supply FY’16 Outlook Revised FY’16 Outlook ~3% End Market Growth VPY 3% to 6% Sales Growth VPY Flat to +300 BPs in Excess of Market Growth 1.0x to 1.5x Operating Leverage1 $910M to $940M Adj. EBITDA FM 0.0x to 0.5x Operating Leverage WW 1.0x to 1.5x Operating Leverage C&I 2.0x to 3.0x Operating Leverage Sales Growth +300 Basis Points in Excess of Market Growth and 1.5x to 2.0x Operating Leverage1 Appropriate Framework Going Forward 1 Operating Leverage is defined as Adjusted EBITDA growth divided by total Net sales growth Note: “VPY” denotes Versus Prior Year. “nm” denotes Not Meaningful Note: Contains forward looking information; please see Disclaimer on page 2
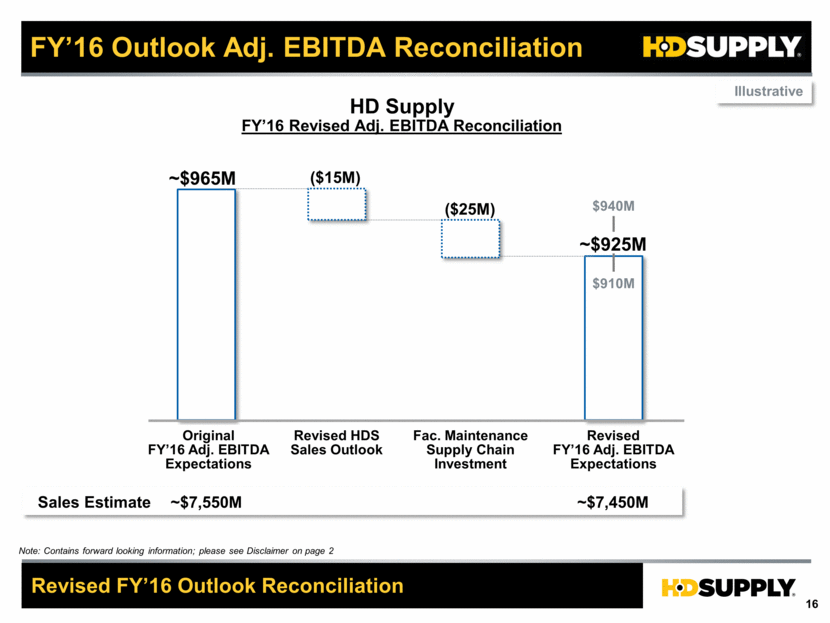
FY’16 Outlook Adj. EBITDA Reconciliation Revised FY’16 Outlook Reconciliation Revised HDS Sales Outlook Original FY’16 Adj. EBITDA Expectations ~$965M Sales Estimate ~$7,550M HD Supply FY’16 Revised Adj. EBITDA Reconciliation Revised FY’16 Adj. EBITDA Expectations $940M ~$925M $910M ~$7,450M Fac. Maintenance Supply Chain Investment ($15M) ($25M) Illustrative Note: Contains forward looking information; please see Disclaimer on page 2
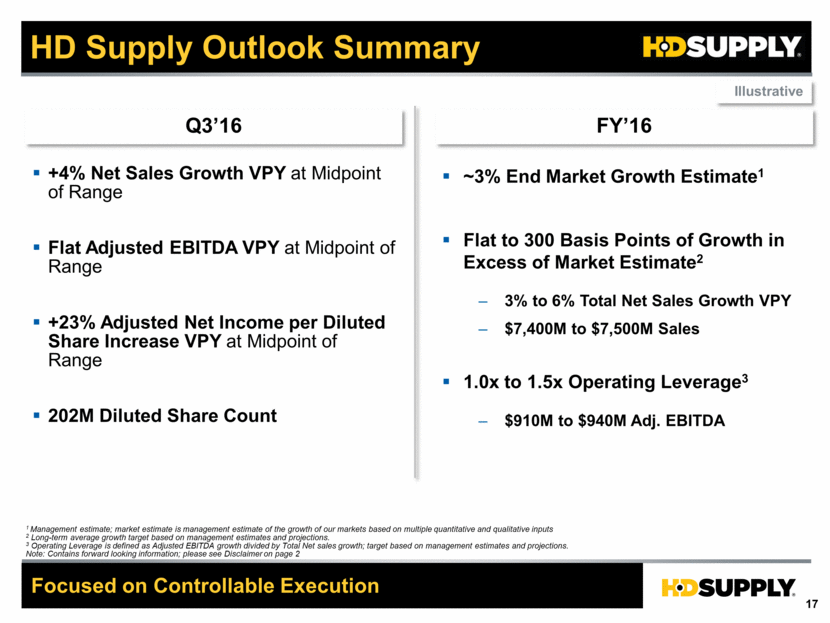
HD Supply Outlook Summary Focused on Controllable Execution Q3’16 FY’16 +4% Net Sales Growth VPY at Midpoint of Range Flat Adjusted EBITDA VPY at Midpoint of Range +23% Adjusted Net Income per Diluted Share Increase VPY at Midpoint of Range 202M Diluted Share Count Illustrative 1 Management estimate; market estimate is management estimate of the growth of our markets based on multiple quantitative and qualitative inputs 2 Long-term average growth target based on management estimates and projections. 3 Operating Leverage is defined as Adjusted EBITDA growth divided by Total Net sales growth; target based on management estimates and projections. Note: Contains forward looking information; please see Disclaimer on page 2 ~3% End Market Growth Estimate1 Flat to 300 Basis Points of Growth in Excess of Market Estimate2 3% to 6% Total Net Sales Growth VPY $7,400M to $7,500M Sales 1.0x to 1.5x Operating Leverage3 $910M to $940M Adj. EBITDA
Q&A

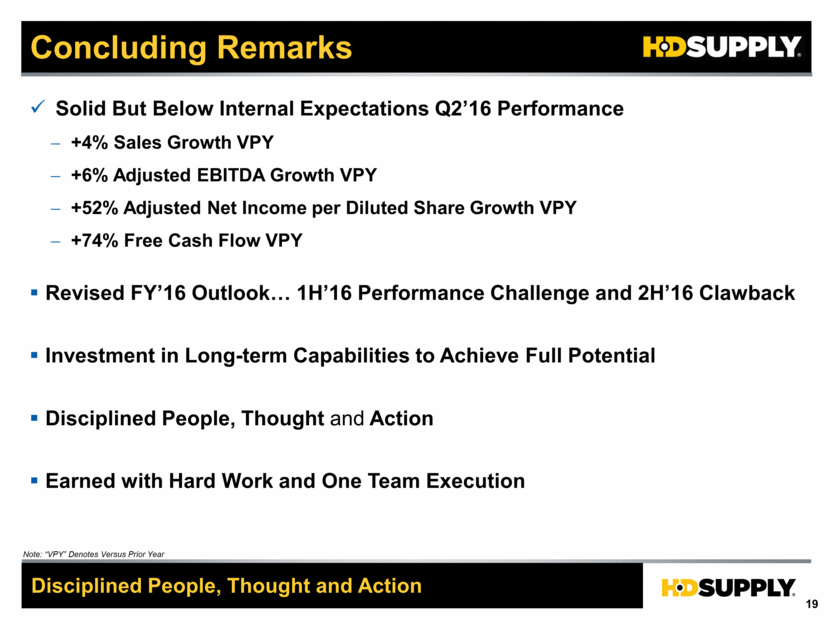
Concluding Remarks Solid But Below Internal Expectations Q2’16 Performance +4% Sales Growth VPY +6% Adjusted EBITDA Growth VPY +52% Adjusted Net Income per Diluted Share Growth VPY +74% Free Cash Flow VPY Revised FY’16 Outlook 1H’16 Performance Challenge and 2H’16 Clawback Investment in Long-term Capabilities to Achieve Full Potential Disciplined People, Thought and Action Earned with Hard Work and One Team Execution Disciplined People, Thought and Action Note: “VPY” Denotes Versus Prior Year
Appendix
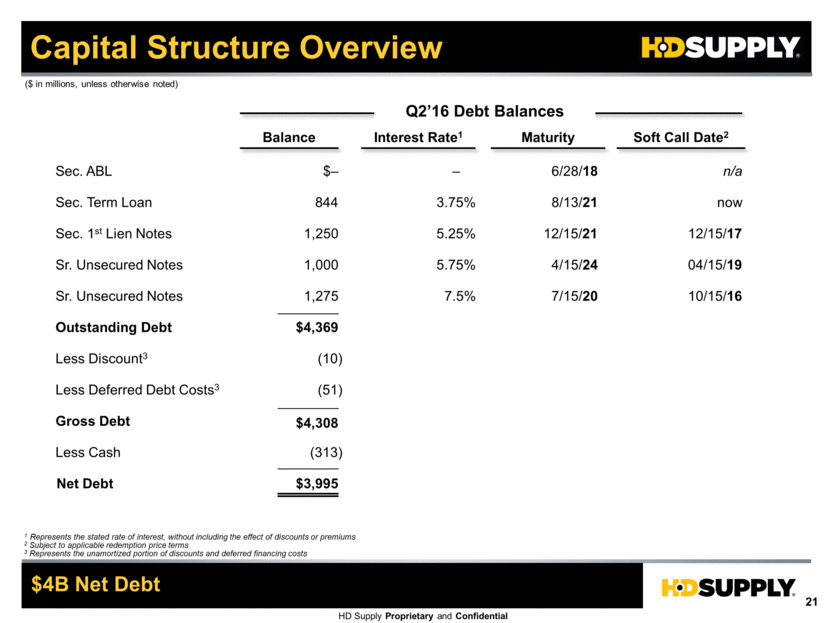
Capital Structure Overview Q2’16 Debt Balances Sec. ABL Sec. Term Loan Sec. 1st Lien Notes Sr. Unsecured Notes Sr. Unsecured Notes $– 1,250 1,000 1,275 6/28/18 8/13/21 12/15/21 7/15/20 Outstanding Debt Less Cash Net Debt $3,995 (313) $4,369 Balance Maturity 1 Represents the stated rate of interest, without including the effect of discounts or premiums 2 Subject to applicable redemption price terms 3 Represents the unamortized portion of discounts and deferred financing costs $4B Net Debt ($ in millions, unless otherwise noted) – 3.75% 5.25% 7.5% Interest Rate1 844 n/a now 12/15/17 10/15/16 Soft Call Date2 5.75% 4/15/24 04/15/19 Less Discount3 (10) Less Deferred Debt Costs3 (51) Gross Debt $4,308
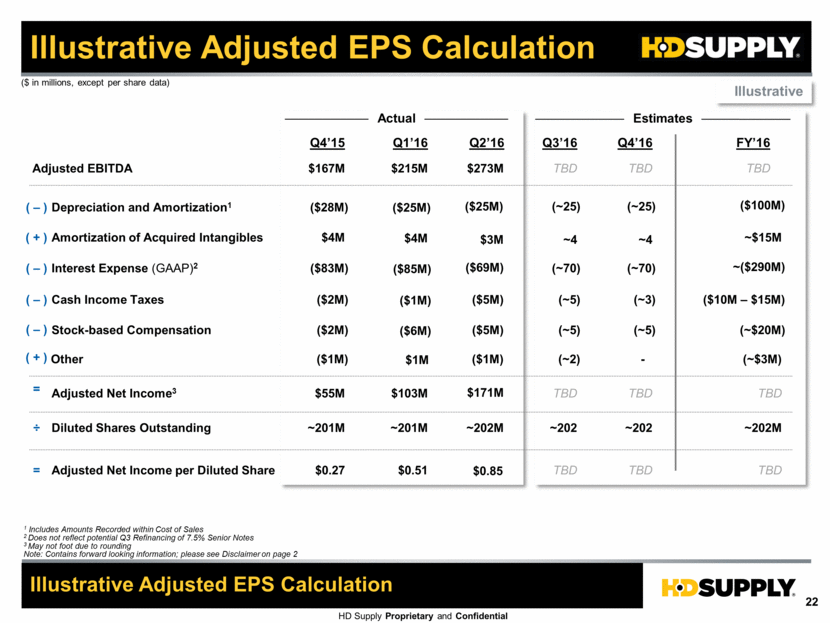
Illustrative Adjusted EPS Calculation Adjusted EBITDA Adjusted Net Income per Diluted Share Illustrative Adjusted EPS Calculation Adjusted Net Income3 = = Diluted Shares Outstanding ÷ TBD TBD TBD ~202M FY’16 $167M $0.27 $55M ~201M Q4’15 ($ in millions, except per share data) Q1’16 TBD TBD TBD ~202 Q4’16 Estimates ~202M Q2’16 TBD TBD TBD ~202 Q3’16 Depreciation and Amortization1 ( – ) ($28M) (~25) ($100M) (~25) Amortization of Acquired Intangibles ( + ) ~$15M $4M ~4 $3M ~4 Interest Expense (GAAP)2 ( – ) ($83M) ~($290M) Cash Income Taxes ( – ) ($10M – $15M) ($2M) Stock-based Compensation ( – ) ($2M) (~70) (~70) (~3) (~5) 1 Includes Amounts Recorded within Cost of Sales 2 Does not reflect potential Q3 Refinancing of 7.5% Senior Notes 3 May not foot due to rounding Note: Contains forward looking information; please see Disclaimer on page 2 Actual (~5) ($5M) (~5) (~$20M) $273M ($25M) ($69M) $171M $0.85 ($5M) $215M ($25M) $4M ($85M) ($1M) ($6M) $0.51 $103M ~201M Illustrative Other ($1M) - ($1M) (~2) (~$3M) $1M ( + )
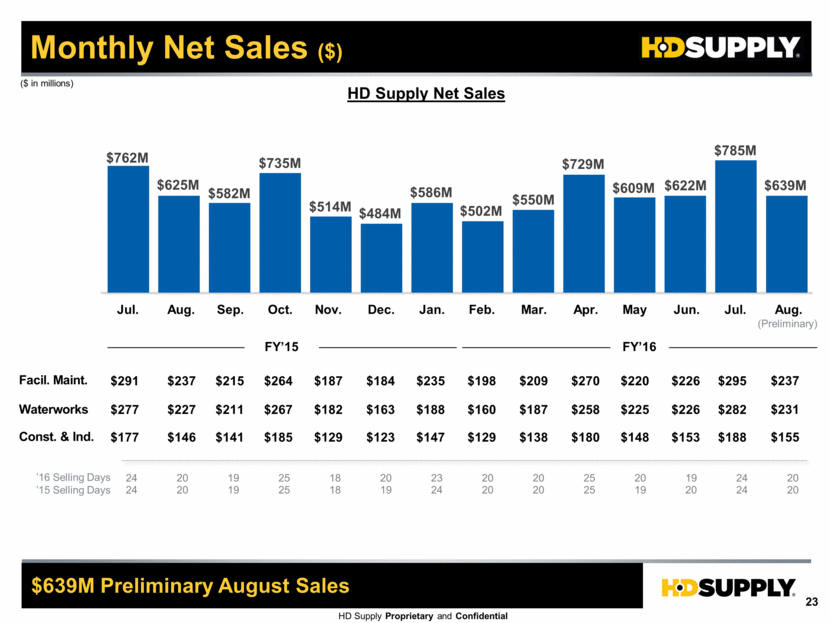
Monthly Net Sales ($) $639M Preliminary August Sales FY’15 Facil. Maint. Waterworks Const. & Ind. ’16 Selling Days ’15 Selling Days ($ in millions) HD Supply Net Sales (Preliminary) FY’16 Jul. Aug. Sep. Oct. Nov. Dec. Jan. Feb. Mar. Apr. May Jun. Jul. Aug. 24 20 19 25 18 20 23 20 20 25 20 19 24 20 24 20 19 25 18 19 24 20 20 25 19 20 24 20 $762M $625M $582M $735M $514M $484M $586M $502M $550M $729M $609M $622M $785M $639M $291 $237 $215 $264 $187 $184 $235 $198 $209 $270 $220 $226 $295 $277 $227 $211 $267 $182 $163 $188 $160 $187 $258 $225 $226 $282 $177 $146 $141 $185 $129 $123 $147 $129 $138 $180 $148 $153 $188 $237 $231 $155
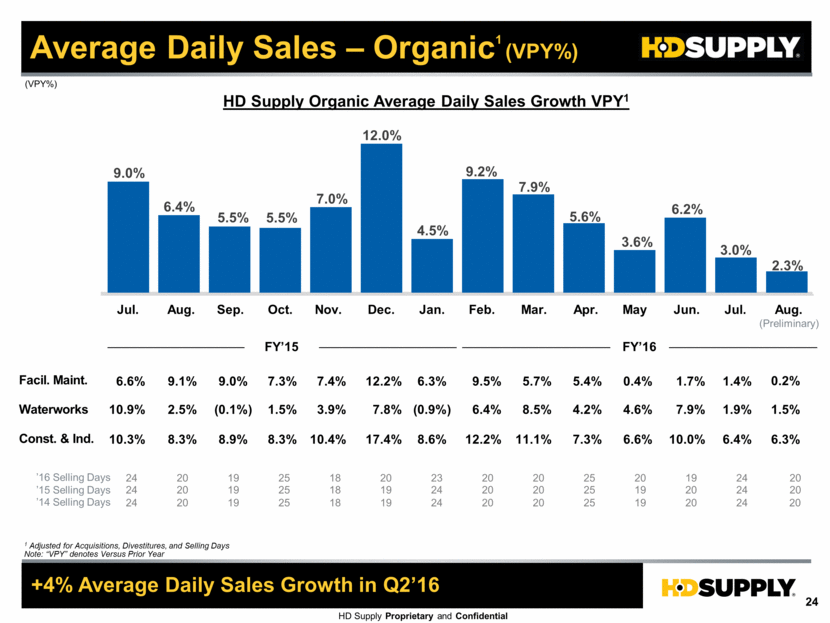
HD Supply Organic Average Daily Sales Growth VPY1 +4% Average Daily Sales Growth in Q2’16 (VPY%) 1 Adjusted for Acquisitions, Divestitures, and Selling Days Note: “VPY” denotes Versus Prior Year Facil. Maint. Waterworks Const. & Ind. (Preliminary) ’16 Selling Days ’15 Selling Days 24 20 19 25 18 20 23 20 20 25 20 19 24 20 24 20 19 25 18 19 24 20 20 25 19 20 24 20 FY’15 FY’16 Jul. Aug. Sep. Oct. Nov. Dec. Jan. Feb. Mar. Apr. May Jun. Jul. Aug. 9.0% 6.4% 5.5% 5.5% 7.0% 12.0% 4.5% 9.2% 7.9% 5.6% 3.6% 6.2% 3.0% 6.6% 9.1% 9.0% 7.3% 7.4% 12.2% 6.3% 9.5% 5.7% 5.4% 0.4% 1.7% 1.4% 10.9% 2.5% (0.1%) 1.5% 3.9% 7.8% (0.9%) 6.4% 8.5% 4.2% 4.6% 7.9% 1.9% 10.3% 8.3% 8.9% 8.3% 10.4% 17.4% 8.6% 12.2% 11.1% 7.3% 6.6% 10.0% 6.4% 0.2% 1.5% 6.3% 2.3% Average Daily Sales – Organic1 (VPY%) ’14 Selling Days 24 20 19 25 18 19 24 20 20 25 19 20 24 20
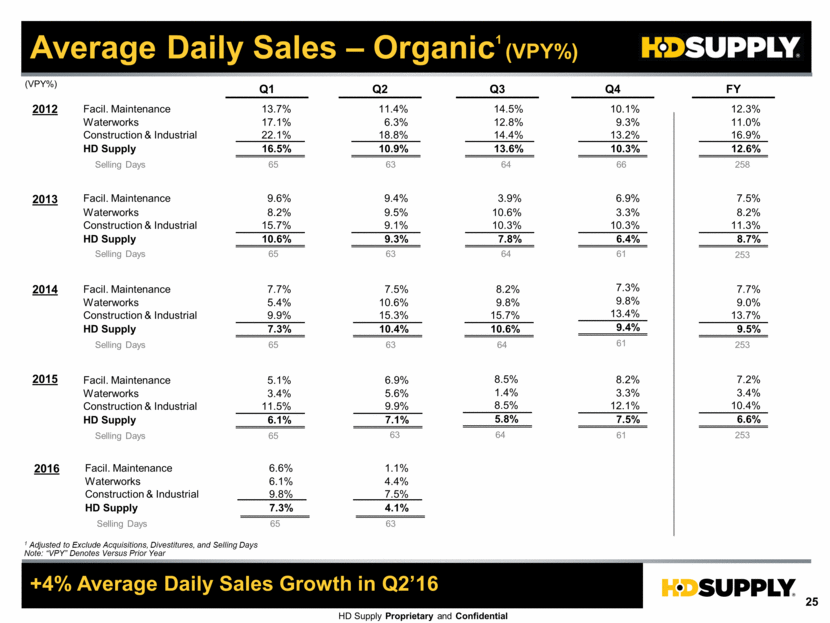
Average Daily Sales – Organic1 (VPY%) +4% Average Daily Sales Growth in Q2’16 1 Adjusted to Exclude Acquisitions, Divestitures, and Selling Days Note: “VPY” Denotes Versus Prior Year (VPY%) Selling Days Facil. Maintenance Waterworks Construction & Industrial HD Supply 65 6.6% 6.1% 9.8% 7.3% Facil. Maintenance Waterworks Construction & Industrial HD Supply Selling Days 12.3% 11.0% 16.9% 12.6% 258 13.7% 17.1% 22.1% 16.5% 65 11.4% 6.3% 18.8% 10.9% 63 14.5% 12.8% 14.4% 13.6% 64 10.1% 9.3% 13.2% 10.3% 66 Facil. Maintenance Waterworks HD Supply Selling Days 7.5% 8.2% 11.3% 8.7% 253 Construction & Industrial 9.6% 8.2% 15.7% 10.6% 65 9.4% 9.5% 9.1% 9.3% 63 64 3.9% 10.6% 10.3% 7.8% 6.9% 3.3% 10.3% 6.4% 61 Facil. Maintenance Waterworks HD Supply Selling Days 7.7% 5.4% 9.9% 7.3% 65 Construction & Industrial 7.5% 10.6% 15.3% 10.4% 63 8.2% 9.8% 15.7% 10.6% 64 7.3% 9.8% 13.4% 9.4% 61 7.7% 9.0% 13.7% 9.5% 253 FY Q1 Q2 Q3 Q4 Facil. Maintenance Waterworks HD Supply Selling Days 5.1% 3.4% 11.5% 6.1% 65 Construction & Industrial 2016 2012 2013 2014 2015 6.9% 5.6% 9.9% 7.1% 63 8.5% 1.4% 8.5% 5.8% 64 8.2% 3.3% 12.1% 7.5% 61 7.2% 3.4% 10.4% 6.6% 253 63 1.1% 4.4% 7.5% 4.1%
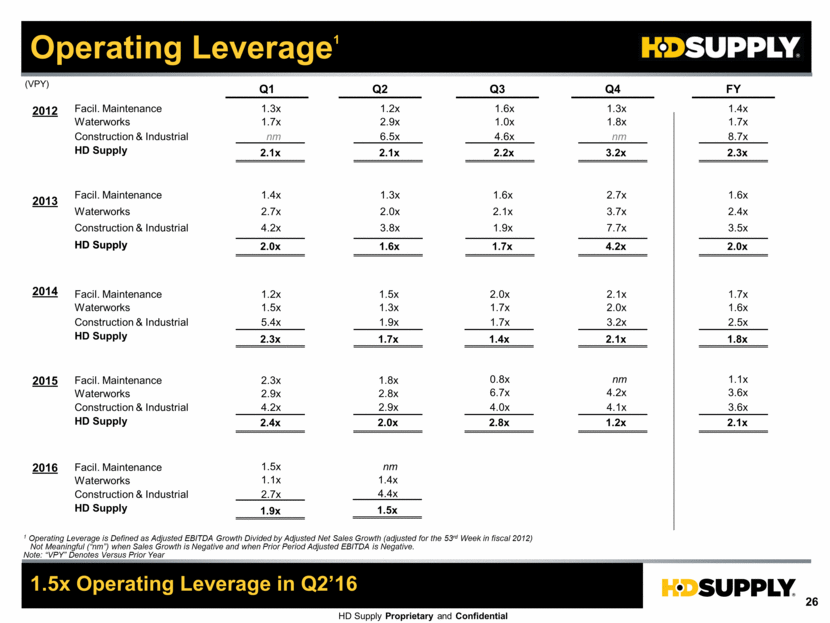
Operating Leverage1 1.5x Operating Leverage in Q2’16 (VPY) 1 Operating Leverage is Defined as Adjusted EBITDA Growth Divided by Adjusted Net Sales Growth (adjusted for the 53rd Week in fiscal 2012) Not Meaningful (“nm”) when Sales Growth is Negative and when Prior Period Adjusted EBITDA is Negative. Note: “VPY” Denotes Versus Prior Year 1.5x 1.1x 2.7x 1.9x Facil. Maintenance Waterworks Construction & Industrial HD Supply 1.4x 1.7x 8.7x 2.3x 1.3x 1.8x nm 3.2x 1.3x 1.7x nm 2.1x 1.2x 2.9x 6.5x 2.1x Facil. Maintenance Waterworks Construction & Industrial HD Supply 1.6x 1.0x 4.6x 2.2x 2.7x 3.7x 7.7x 4.2x 1.6x 2.4x 3.5x 2.0x 1.4x 2.7x 4.2x 2.0x 1.3x 2.0x 3.8x 1.6x Facil. Maintenance Waterworks HD Supply Construction & Industrial HD Supply 1.6x 2.1x 1.9x 1.7x 1.2x 1.5x 5.4x 2.3x 1.5x 1.3x 1.9x 1.7x Facil. Maintenance Waterworks HD Supply Construction & Industrial 2.0x 1.7x 1.7x 1.4x 2.1x 2.0x 3.2x 2.1x 1.7x 1.6x 2.5x 1.8x FY Q1 Q2 Q3 Q4 2016 2012 2013 2014 2015 2.3x 2.9x 4.2x 2.4x Facil. Maintenance Waterworks HD Supply Construction & Industrial 1.8x 2.8x 2.9x 2.0x 0.8x 6.7x 4.0x 2.8x nm 4.2x 4.1x 1.2x 1.1x 3.6x 3.6x 2.1x nm 1.4x 4.4x 1.5x
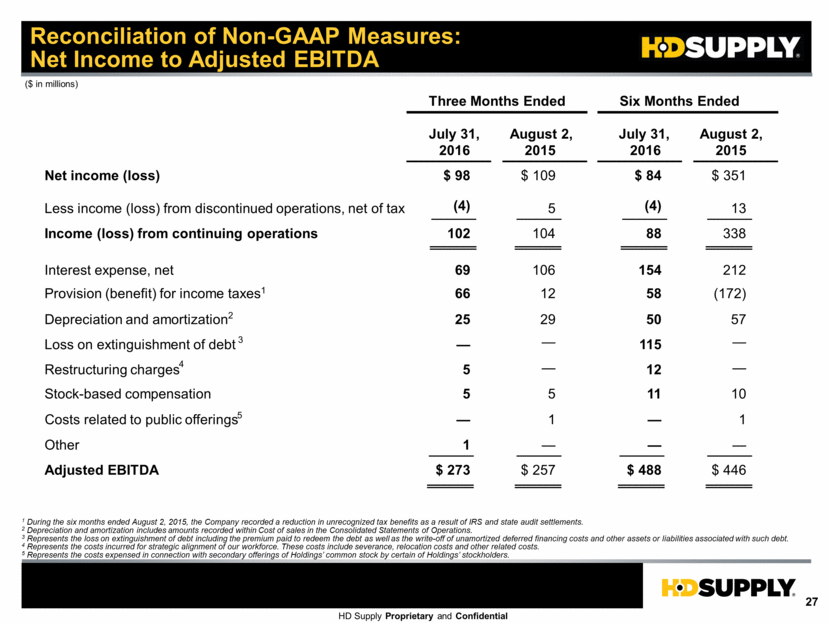
Reconciliation of Non-GAAP Measures: Net Income to Adjusted EBITDA ($ in millions) 1 During the six months ended August 2, 2015, the Company recorded a reduction in unrecognized tax benefits as a result of IRS and state audit settlements. 2 Depreciation and amortization includes amounts recorded within Cost of sales in the Consolidated Statements of Operations. 3 Represents the loss on extinguishment of debt including the premium paid to redeem the debt as well as the write-off of unamortized deferred financing costs and other assets or liabilities associated with such debt. 4 Represents the costs incurred for strategic alignment of our workforce. These costs include severance, relocation costs and other related costs. 5 Represents the costs expensed in connection with secondary offerings of Holdings’ common stock by certain of Holdings’ stockholders. Three Months Ended July 31, 2016 August 2, 2015 Net income (loss) $ 98 $ 109 Less income (loss) from discontinued operations, net of tax (4) 5 Income (loss) from continuing operations 102 104 Interest expense, net 69 106 Provision (benefit) for income taxes 1 12 Depreciation and amortization 2 25 29 Loss on extinguishment of debt — Restructuring charges 3 5 — Stock-based compensation 4 5 5 Other 1 — Adjusted EBITDA $ 273 $ 257 66 — Six Months Ended July 31, 2016 August 2, 2015 $ 84 $ 351 (4) 13 88 338 154 212 (172) 50 57 115 12 — 11 10 — — $ 488 $ 446 58 — Costs related to public offerings — 1 — 1 5
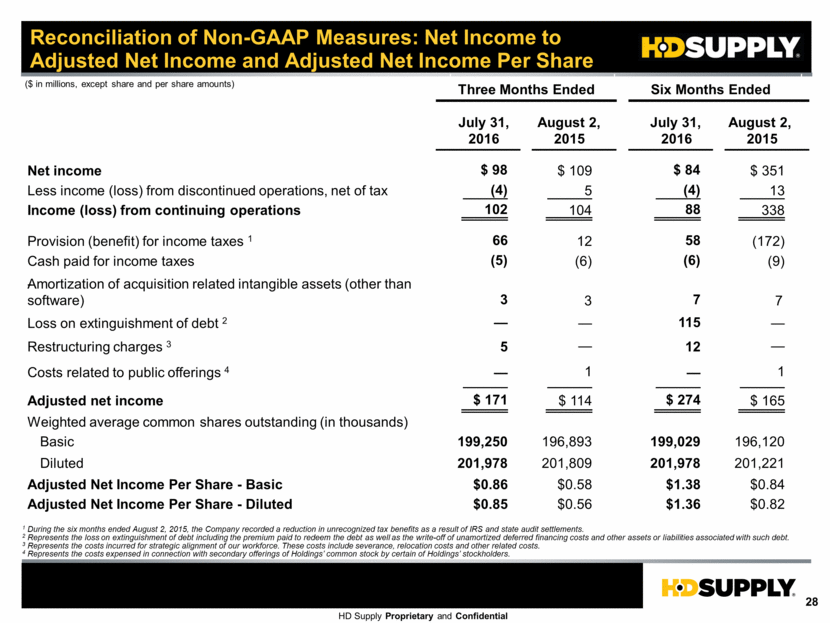
Reconciliation of Non-GAAP Measures: Net Income to Adjusted Net Income and Adjusted Net Income Per Share ($ in millions, except share and per share amounts) 1 During the six months ended August 2, 2015, the Company recorded a reduction in unrecognized tax benefits as a result of IRS and state audit settlements. 2 Represents the loss on extinguishment of debt including the premium paid to redeem the debt as well as the write-off of unamortized deferred financing costs and other assets or liabilities associated with such debt. 3 Represents the costs incurred for strategic alignment of our workforce. These costs include severance, relocation costs and other related costs. 4 Represents the costs expensed in connection with secondary offerings of Holdings’ common stock by certain of Holdings’ stockholders. Weighted average common shares outstanding (in thousands) Basic Diluted Adjusted Net Income Per Share - Basic Adjusted Net Income Per Share - Diluted Net income $ 98 $ 109 Less income (loss) from discontinued operations, net of tax 5 Income (loss) from continuing operations 102 104 Provision (benefit) for income taxes 1 66 12 Cash paid for income taxes (5) (6) Amortization of acquisition related intangible assets (other than - software) Restructuring charges 3 — 5 Loss on extinguishment of debt 2 — Adjusted net income $ 171 $ 114 Three Months Ended July 31, 2016 August 2, 2015 199,250 196,893 201,978 201,809 $0.86 $0.58 $0.85 $0.56 (4) — 3 3 $ 84 $ 351 13 88 338 58 (172) (6) (9) — 12 115 $ 274 $ 165 Six Months Ended July 31, 2016 August 2, 2015 199,029 196,120 201,978 201,221 $1.38 $0.84 $1.36 $0.82 (4) — 7 7 Costs related to public offerings 4 1 — 1 —