Attached files
| file | filename |
|---|---|
| 8-K - 8-K - C&J Energy Services, Inc. | d252781d8k.htm |
C&J Energy Services 2Q’16 Operational Update As of June 30, 2016 Exhibit 99.1
Disclaimer © C&J Energy Services Ltd. 2015 Cautionary Statement Regarding Forward-Looking Statements This presentation includes certain statements and information that may constitute “forward-looking statements” within the meaning of Section 27A of the Securities Act of 1933, as amended, and Section 21E of the Securities Exchange Act of 1934, as amended. The words “anticipate,” “believe,” “ensure,” “expect,” “if,” “intend,” “plan,” “estimate,” “project,” “forecasts,” “predict,” “outlook,” “aim,” “will,” “could,” “should,” “potential,” “would,” “may,” “probable,” “likely,” and similar expressions that convey the uncertainty of future events or outcomes, and the negative thereof, are intended to identify forward-looking statements. Forward-looking statements, which are not generally historical in nature, include those that express a belief, expectation or intention regarding our future activities, plans and goals and our current expectations with respect to, among other things: the potential impact of the Chapter 11 Proceeding on the Company’s operations, management, customers, suppliers, employees and other third-party stakeholders, our ability to develop, confirm and consummate a plan under Chapter 11 or an alternative restructuring transaction and emerge from the Chapter 11 Proceeding as a going concern, our business strategy, our financial strategy, our financial position, including operating cash flows, the availability of capital and our liquidity, our ability to continue as a going concern, our future revenue, income and overall financial and operating performance, our ability to sustain and improve our utilization, revenue and margins, our ability to maintain acceptable pricing for our services, future capital expenditures, our ability to finance equipment, working capital and capital expenditures, our ability to execute our long-term growth strategy, including expansion into new geographic regions and business lines, our plan to continue to focus on international growth opportunities, and our ability to successfully execute and capitalize on such opportunities, our ability to successfully develop our research and technology capabilities and implement technological developments and enhancements, and the timing and success of future acquisitions and other strategic initiatives and special projects. Forward-looking statements are not assurances of future performance and actual results could differ materially from our historical experience and our present expectations or projections. These forward-looking statements are based on management’s current expectations and beliefs, forecasts for our existing operations, experience, expectations and perception of historical trends, current conditions, anticipated future developments and their effect on us, and other factors believed to be appropriate. Although management believes the expectations and assumptions reflected in these forward-looking statements are reasonable as and when made, no assurance can be given that these assumptions are accurate or that any of these expectations will be achieved (in full or at all). Our forward-looking statements involve significant risks, contingencies and uncertainties, most of which are difficult to predict and many of which are beyond our control. Known material factors that could cause actual results to differ materially from those in the forward-looking statements include, but are not limited to, risks associated with the following: risks and uncertainties associated with the Chapter 11 Proceeding, including our ability to develop, confirm and consummate the Restructuring Plan or an alternative plan under Chapter 11 or alternative restructuring transaction, including a sale of all or substantially all of our assets, which may be necessary to continue as a going concern, ability to maintain relationships with suppliers, customers, employees and other third parties as a result of our Chapter 11 Proceeding, our ability to obtain the approval with respect to motions or other requests made to the Bankruptcy Court in our Chapter 11 Proceeding, including maintaining strategic control as debtors-in-possession, our ability to obtain sufficient financing to allow us to emerge from the Chapter 11 Proceeding and execute our business plan post-emergence, failure to satisfy our short- or long-term liquidity needs, including our inability to generate sufficient cash flow from operations or to obtain adequate financing to fund our capital expenditures and meet working capital needs, the effects of the Chapter 11 Proceeding on the Company and on the interests of our various constituents, including holders of our common shares, Bankruptcy Court rulings in the Chapter 11 Proceeding as well as the outcome of all other pending litigation and the outcome of the Chapter 11 Proceeding in general, the length of time that the Company will operate under Chapter 11 protection and the continued availability of operating capital during the pendency of the Chapter 11 Proceeding, risks associated with third party motions in the Chapter 11 Proceeding, which may interfere with our ability to confirm and consummate a plan of reorganization, the potential adverse effects of the Chapter 11 Proceeding on our liquidity and results of operations, increased advisory costs to execute a reorganization, the impact of the New York Stock Exchange's delisting of our common shares on the liquidity and market price of our common shares and on our ability to access the public capital markets, a decline in demand for our services, including due to declining commodity prices, overcapacity and other competitive factors affecting our industry, the cyclical nature and volatility of the oil and gas industry, which impacts the level of exploration, production and development activity and spending patterns by the oil and gas industry, a decline in, or substantial volatility of, crude oil and gas commodity prices, which generally leads to decreased spending by our customers and negatively impacts drilling, completion and production activity and therefore impacts demand and pricing for our services, which negatively impacts our results of operations, including potentially resulting in impairment charges, pressure on pricing for our core services, including due to competition and industry and/or economic conditions, which may impact, among other things, our ability to implement price increases or maintain pricing on our core services, the loss of, or interruption or delay in operations by, one or more significant customers, the failure to pay amounts when due, or at all, by one or more significant customers, changes in customer requirements in markets or industries we serve, costs, delays, regulatory compliance requirements and other difficulties in executing our long-term growth strategy, including those related to expansion into new geographic regions and new business lines, the effects of future acquisitions on our business, including our ability to successfully integrate our operations and the costs incurred in doing so, business growth outpacing the capabilities of our infrastructure, adverse weather conditions in oil or gas producing regions, the effect of environmental and other governmental regulations on our operations, including the risk that future changes in the regulation of hydraulic fracturing could reduce or eliminate demand for our hydraulic fracturing services, the incurrence of significant costs and liabilities resulting from litigation, the incurrence of significant costs and liabilities resulting from our failure to comply, or our compliance with, new or existing environmental regulations or an accidental release of hazardous substances into the environment, expanding our operations overseas, the loss of, or inability to attract key management personnel, a shortage of qualified workers, the loss of, or interruption or delay in operations by, one or more of our key suppliers, operating hazards inherent in our industry, including the significant possibility of accidents resulting in personal injury or death, property damage or environmental damage, and accidental damage to or malfunction of equipment. The foregoing list of factors is not exclusive. For additional information regarding known material factors that could affect our operating results and performance, please see C&J’s most recently filed Annual Report on Form10-K, subsequent Quarterly Reports on Form 10-Q, recent Current Reports on Form 8-K, which are available at the SEC’s website, http://www.sec.gov. All subsequent written or oral forward-looking statements concerning C&J are expressly qualified in their entirety by the cautionary statements above. Readers are cautioned not to place undue reliance on forward-looking statements, which speak only as of the date hereof. We undertake no obligation to publicly update or revise any forward-looking statements after the date they are made, whether as a result of new information, future events or otherwise, except as required by law. EBITDA is defined as earnings before net interest expense, income taxes, depreciation and amortization. Adjusted EBITDA is defined as earnings before net interest expense, income taxes, depreciation and amortization, net gain or loss on disposal of assets, transaction costs and certain non-routine items. EBITDA and Adjusted EBITDA are non-GAAP financial measures, and when analyzing C&J’s operating performance, investors should use EBITDA and Adjusted EBITDA in addition to, and not as an alternative for, operating income and net income (loss) (each as determined in accordance with U.S. GAAP). C&J Management uses EBITDA and Adjusted EBITDA as supplemental financial measures because we believe they are useful indicators of our performance.
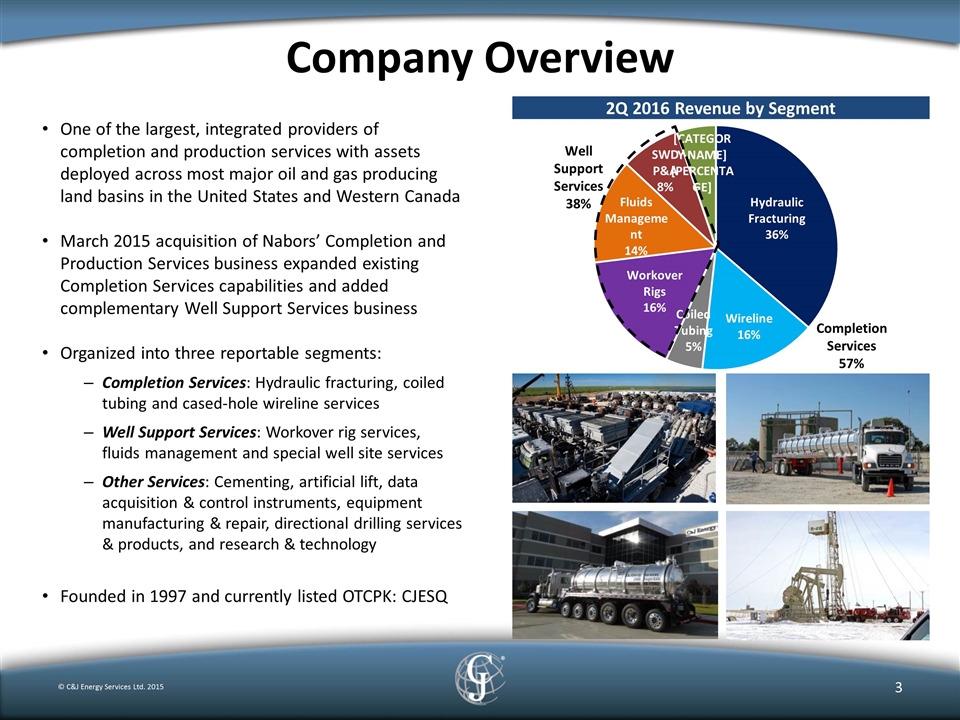
Company Overview One of the largest, integrated providers of completion and production services with assets deployed across most major oil and gas producing land basins in the United States and Western Canada March 2015 acquisition of Nabors’ Completion and Production Services business expanded existing Completion Services capabilities and added complementary Well Support Services business Organized into three reportable segments: Completion Services: Hydraulic fracturing, coiled tubing and cased-hole wireline services Well Support Services: Workover rig services, fluids management and special well site services Other Services: Cementing, artificial lift, data acquisition & control instruments, equipment manufacturing & repair, directional drilling services & products, and research & technology Founded in 1997 and currently listed OTCPK: CJESQ © C&J Energy Services Ltd. 2015 2Q 2016 Revenue by Segment
Near Term Outlook: Managing the Downturn Navigating the Volatile Market Conditions & Positioning for an Industry Recovery © C&J Energy Services Ltd. 2015 Current Focus & Strategy Retain competitive position with key customers in most active and profitable operating land basins Leverage full suite of core services to grow market share, increase scale and enhance operational efficiency Manage allocation of equipment and services to increase utilization and profitability Control costs through focus on operational efficiencies and management of consumables “Right-size” CAPEX budget to current activity levels without sacrificing operational performance or safety Exploring divestiture of smaller, non-core service lines in order to reduce costs and increase overall liquidity Position of Strength for the Future Move through balance sheet restructuring process as quickly as possible; elimination of all debt and enhanced liquidity provides a competitive advantage to better grow core businesses as the market recovers Continued reduction of overall cost structure will lead to greater margin expansion with market improvement R&T initiatives provide a scalable platform to increase overall profitability in core business segments
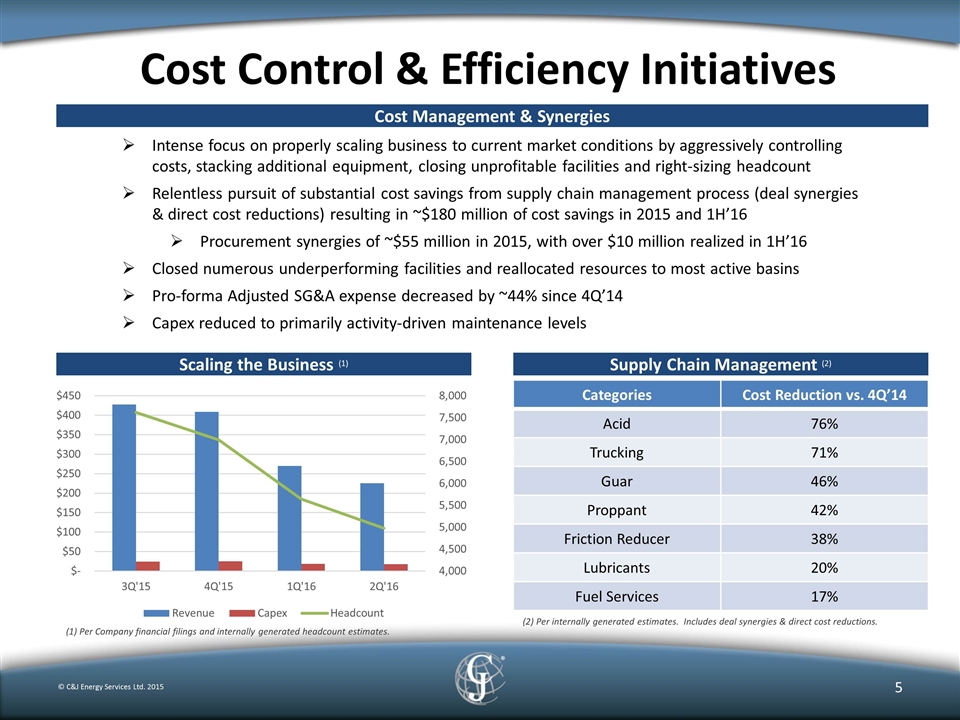
Cost Control & Efficiency Initiatives © C&J Energy Services Ltd. 2015 Scaling the Business (1) Supply Chain Management (2) Categories Cost Reduction vs. 4Q’14 Acid 76% Trucking 71% Guar 46% Proppant 42% Friction Reducer 38% Lubricants 20% Fuel Services 17% Intense focus on properly scaling business to current market conditions by aggressively controlling costs, stacking additional equipment, closing unprofitable facilities and right-sizing headcount Relentless pursuit of substantial cost savings from supply chain management process (deal synergies & direct cost reductions) resulting in ~$180 million of cost savings in 2015 and 1H’16 Procurement synergies of ~$55 million in 2015, with over $10 million realized in 1H’16 Closed numerous underperforming facilities and reallocated resources to most active basins Pro-forma Adjusted SG&A expense decreased by ~44% since 4Q’14 Capex reduced to primarily activity-driven maintenance levels Cost Management & Synergies (1) Per Company financial filings and internally generated headcount estimates. (2) Per internally generated estimates. Includes deal synergies & direct cost reductions.
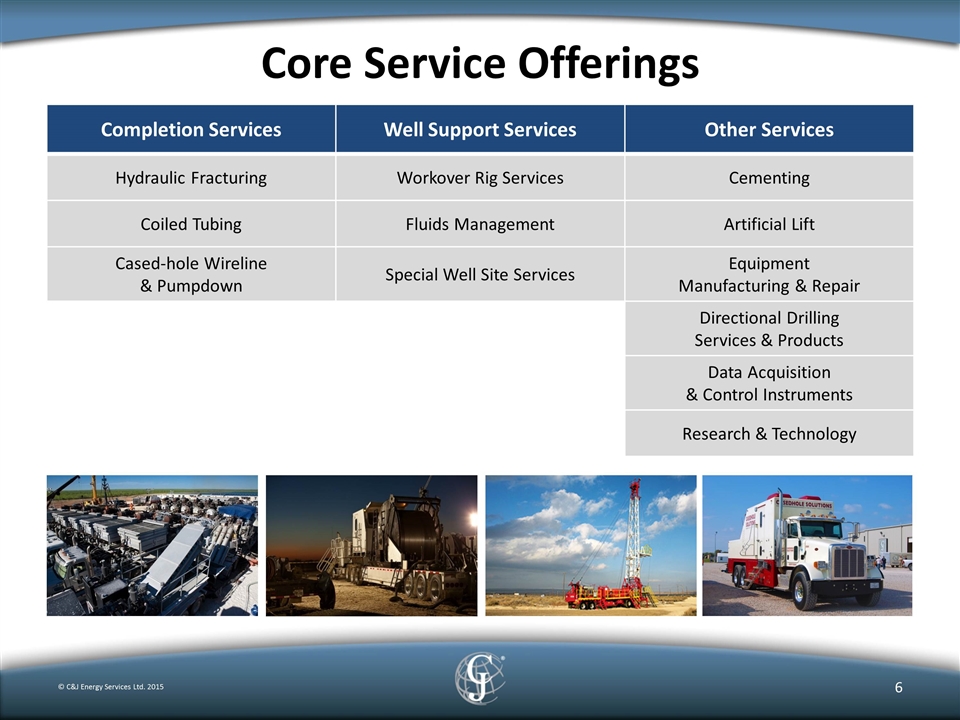
Core Service Offerings © C&J Energy Services Ltd. 2015 Completion Services Well Support Services Other Services Hydraulic Fracturing Workover Rig Services Cementing Coiled Tubing Fluids Management Artificial Lift Cased-hole Wireline & Pumpdown Special Well Site Services Equipment Manufacturing & Repair Directional Drilling Services & Products Data Acquisition & Control Instruments Research & Technology
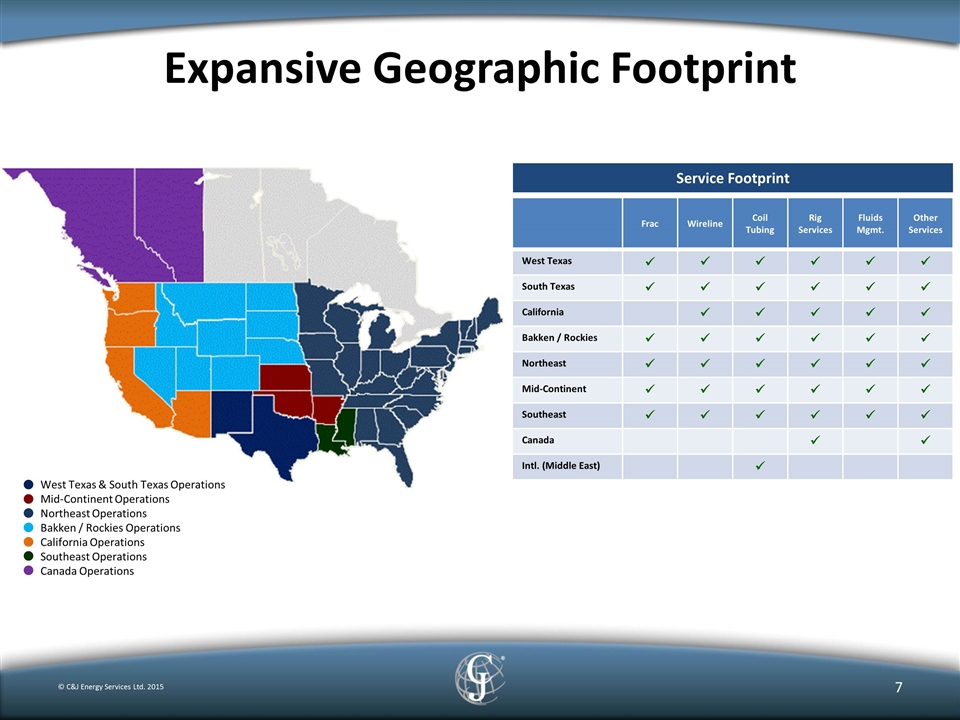
Expansive Geographic Footprint © C&J Energy Services Ltd. 2015 West Texas & South Texas Operations Mid-Continent Operations Northeast Operations Bakken / Rockies Operations California Operations Southeast Operations Canada Operations Service Footprint Frac Wireline Coil Tubing Rig Services Fluids Mgmt. Other Services West Texas ü ü ü ü ü ü South Texas ü ü ü ü ü ü California ü ü ü ü ü Bakken / Rockies ü ü ü ü ü ü Northeast ü ü ü ü ü ü Mid-Continent ü ü ü ü ü ü Southeast ü ü ü ü ü ü Canada ü ü Intl. (Middle East) ü
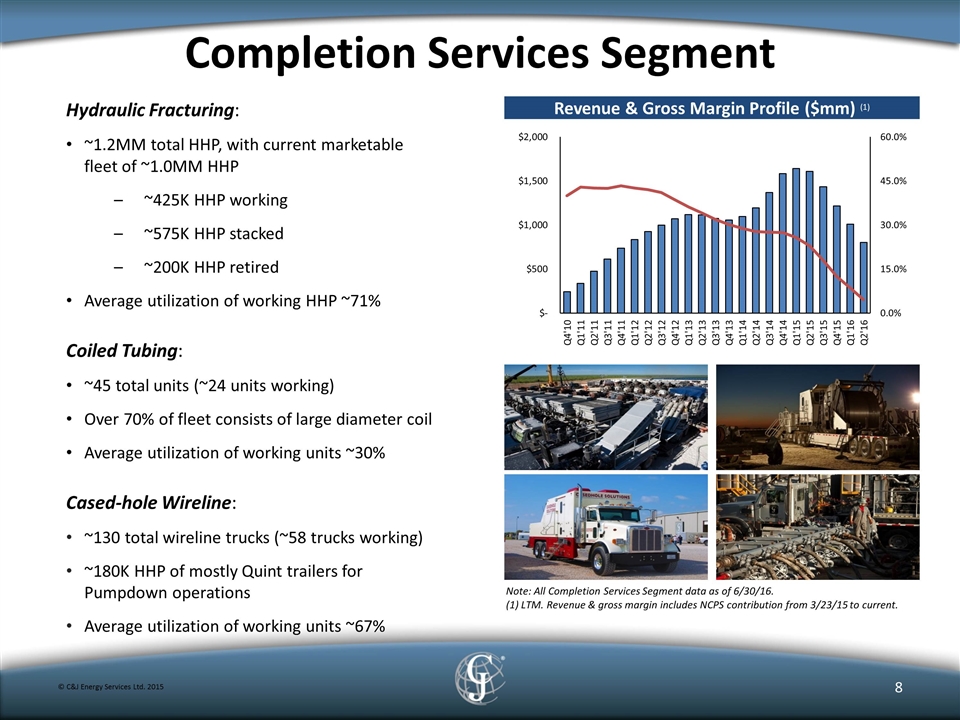
Completion Services Segment © C&J Energy Services Ltd. 2015 Hydraulic Fracturing: ~1.2MM total HHP, with current marketable fleet of ~1.0MM HHP ~425K HHP working ~575K HHP stacked ~200K HHP retired Average utilization of working HHP ~71% Coiled Tubing: ~45 total units (~24 units working) Over 70% of fleet consists of large diameter coil Average utilization of working units ~30% Cased-hole Wireline: ~130 total wireline trucks (~58 trucks working) ~180K HHP of mostly Quint trailers for Pumpdown operations Average utilization of working units ~67% Revenue & Gross Margin Profile ($mm) (1) Note: All Completion Services Segment data as of 6/30/16. (1) LTM. Revenue & gross margin includes NCPS contribution from 3/23/15 to current.
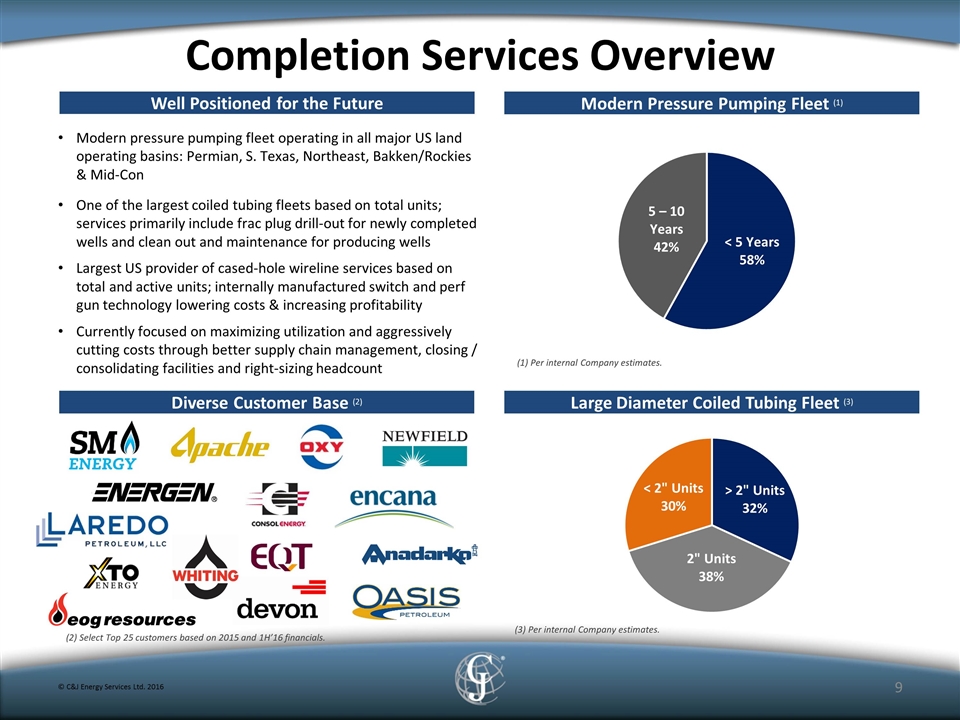
Completion Services Overview © C&J Energy Services Ltd. 2016 Modern Pressure Pumping Fleet (1) Diverse Customer Base (2) Large Diameter Coiled Tubing Fleet (3) Well Positioned for the Future Modern pressure pumping fleet operating in all major US land operating basins: Permian, S. Texas, Northeast, Bakken/Rockies & Mid-Con One of the largest coiled tubing fleets based on total units; services primarily include frac plug drill-out for newly completed wells and clean out and maintenance for producing wells Largest US provider of cased-hole wireline services based on total and active units; internally manufactured switch and perf gun technology lowering costs & increasing profitability Currently focused on maximizing utilization and aggressively cutting costs through better supply chain management, closing / consolidating facilities and right-sizing headcount (2) Select Top 25 customers based on 2015 and 1H’16 financials. (3) Per internal Company estimates. (1) Per internal Company estimates.
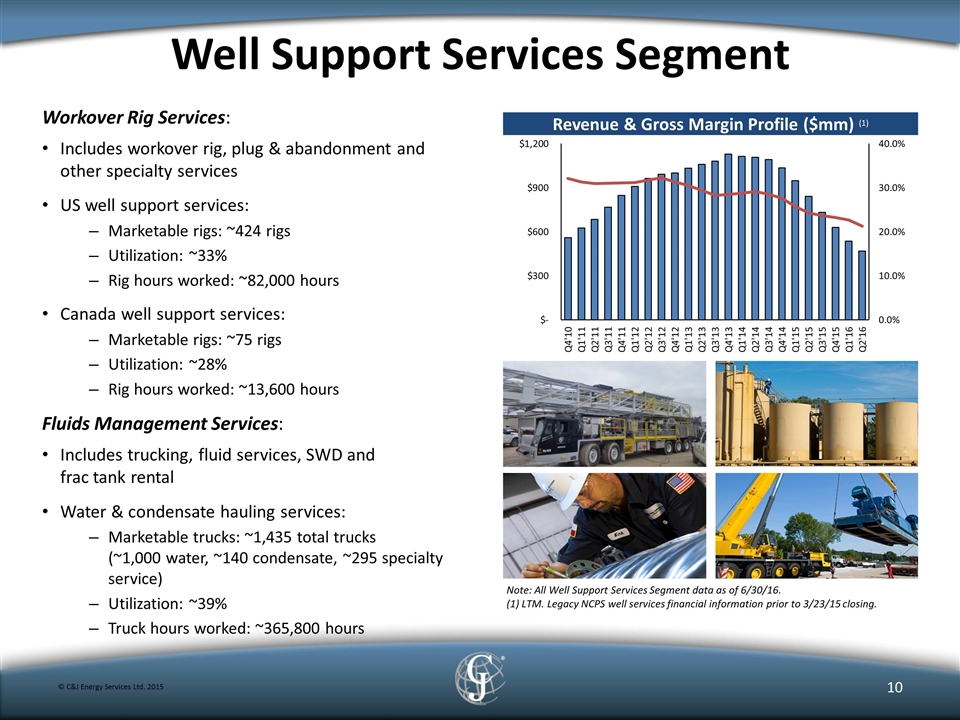
Well Support Services Segment © C&J Energy Services Ltd. 2015 Revenue & Gross Margin Profile ($mm) (1) Workover Rig Services: Includes workover rig, plug & abandonment and other specialty services US well support services: Marketable rigs: ~424 rigs Utilization: ~33% Rig hours worked: ~82,000 hours Canada well support services: Marketable rigs: ~75 rigs Utilization: ~28% Rig hours worked: ~13,600 hours Fluids Management Services: Includes trucking, fluid services, SWD and frac tank rental Water & condensate hauling services: Marketable trucks: ~1,435 total trucks (~1,000 water, ~140 condensate, ~295 specialty service) Utilization: ~39% Truck hours worked: ~365,800 hours Note: All Well Support Services Segment data as of 6/30/16. (1) LTM. Legacy NCPS well services financial information prior to 3/23/15 closing.
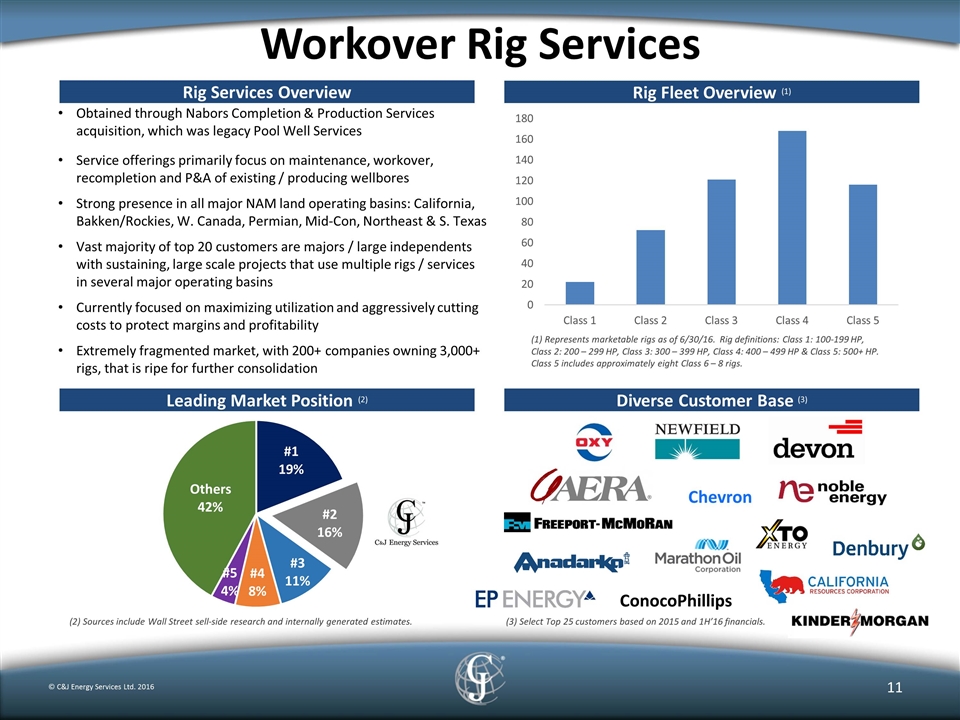
Workover Rig Services © C&J Energy Services Ltd. 2016 Rig Fleet Overview (1) Diverse Customer Base (3) Leading Market Position (2) Rig Services Overview Obtained through Nabors Completion & Production Services acquisition, which was legacy Pool Well Services Service offerings primarily focus on maintenance, workover, recompletion and P&A of existing / producing wellbores Strong presence in all major NAM land operating basins: California, Bakken/Rockies, W. Canada, Permian, Mid-Con, Northeast & S. Texas Vast majority of top 20 customers are majors / large independents with sustaining, large scale projects that use multiple rigs / services in several major operating basins Currently focused on maximizing utilization and aggressively cutting costs to protect margins and profitability Extremely fragmented market, with 200+ companies owning 3,000+ rigs, that is ripe for further consolidation (2) Sources include Wall Street sell-side research and internally generated estimates. (1) Represents marketable rigs as of 6/30/16. Rig definitions: Class 1: 100-199 HP, Class 2: 200 – 299 HP, Class 3: 300 – 399 HP, Class 4: 400 – 499 HP & Class 5: 500+ HP. Class 5 includes approximately eight Class 6 – 8 rigs. (3) Select Top 25 customers based on 2015 and 1H’16 financials. ConocoPhillips Chevron
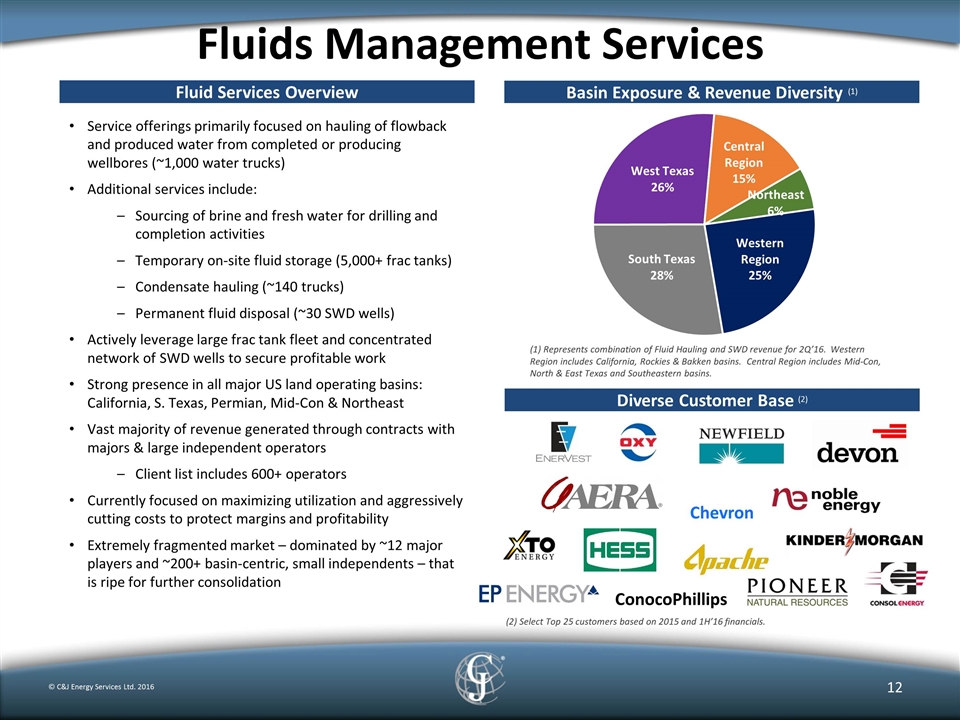
Fluids Management Services © C&J Energy Services Ltd. 2016 Basin Exposure & Revenue Diversity (1) Diverse Customer Base (2) Fluid Services Overview Service offerings primarily focused on hauling of flowback and produced water from completed or producing wellbores (~1,000 water trucks) Additional services include: Sourcing of brine and fresh water for drilling and completion activities Temporary on-site fluid storage (5,000+ frac tanks) Condensate hauling (~140 trucks) Permanent fluid disposal (~30 SWD wells) Actively leverage large frac tank fleet and concentrated network of SWD wells to secure profitable work Strong presence in all major US land operating basins: California, S. Texas, Permian, Mid-Con & Northeast Vast majority of revenue generated through contracts with majors & large independent operators Client list includes 600+ operators Currently focused on maximizing utilization and aggressively cutting costs to protect margins and profitability Extremely fragmented market – dominated by ~12 major players and ~200+ basin-centric, small independents – that is ripe for further consolidation (2) Select Top 25 customers based on 2015 and 1H’16 financials. (1) Represents combination of Fluid Hauling and SWD revenue for 2Q’16. Western Region includes California, Rockies & Bakken basins. Central Region includes Mid-Con, North & East Texas and Southeastern basins. ConocoPhillips Chevron
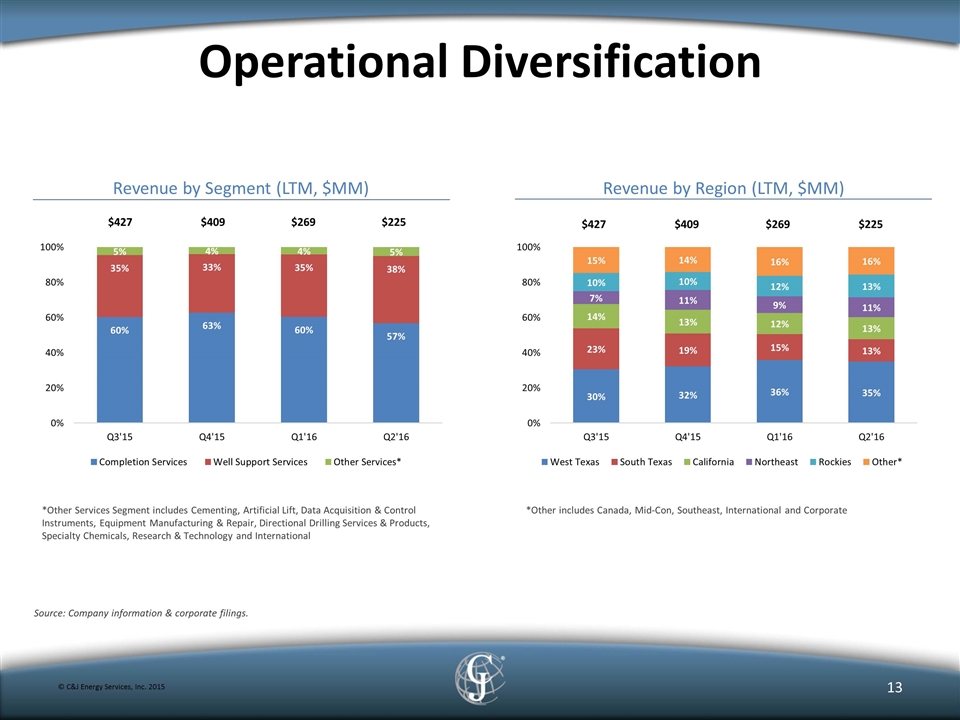
Operational Diversification Source: Company information & corporate filings. *Other Services Segment includes Cementing, Artificial Lift, Data Acquisition & Control Instruments, Equipment Manufacturing & Repair, Directional Drilling Services & Products, Specialty Chemicals, Research & Technology and International Revenue by Segment (LTM, $MM) © C&J Energy Services, Inc. 2015 Revenue by Region (LTM, $MM) *Other includes Canada, Mid-Con, Southeast, International and Corporate $427 $409 $269 $225 $427 $409 $269 $225
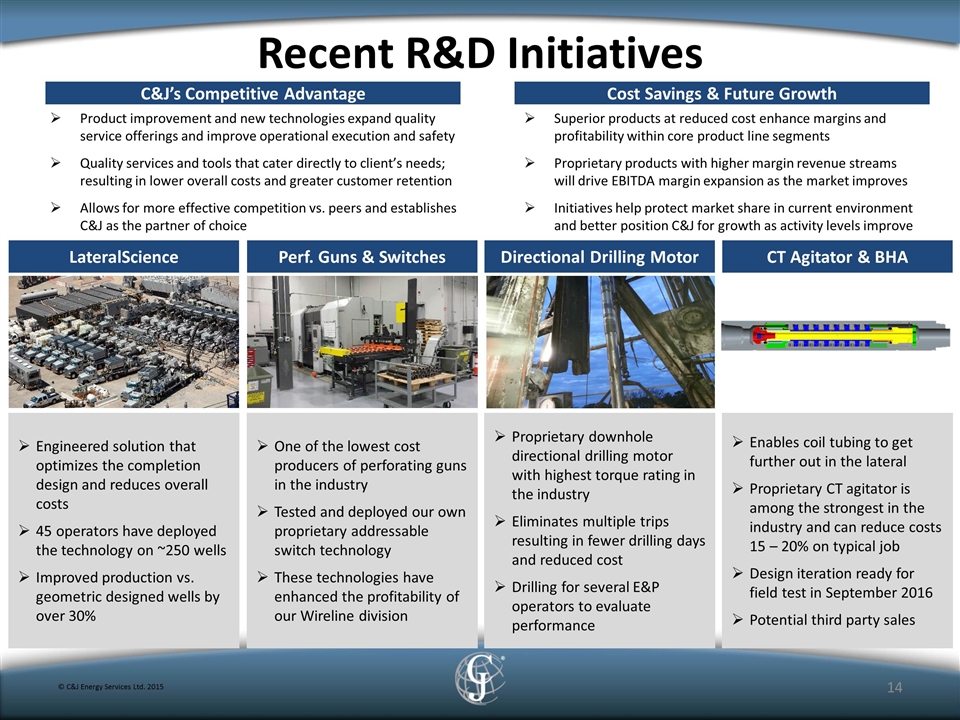
Recent R&D Initiatives © C&J Energy Services Ltd. 2015 LateralScience Perf. Guns & Switches Directional Drilling Motor CT Agitator & BHA Engineered solution that optimizes the completion design and reduces overall costs 45 operators have deployed the technology on ~250 wells Improved production vs. geometric designed wells by over 30% One of the lowest cost producers of perforating guns in the industry Tested and deployed our own proprietary addressable switch technology These technologies have enhanced the profitability of our Wireline division Proprietary downhole directional drilling motor with highest torque rating in the industry Eliminates multiple trips resulting in fewer drilling days and reduced cost Drilling for several E&P operators to evaluate performance Enables coil tubing to get further out in the lateral Proprietary CT agitator is among the strongest in the industry and can reduce costs 15 – 20% on typical job Design iteration ready for field test in September 2016 Potential third party sales Product improvement and new technologies expand quality service offerings and improve operational execution and safety Quality services and tools that cater directly to client’s needs; resulting in lower overall costs and greater customer retention Allows for more effective competition vs. peers and establishes C&J as the partner of choice Superior products at reduced cost enhance margins and profitability within core product line segments Proprietary products with higher margin revenue streams will drive EBITDA margin expansion as the market improves Initiatives help protect market share in current environment and better position C&J for growth as activity levels improve C&J’s Competitive Advantage Cost Savings & Future Growth
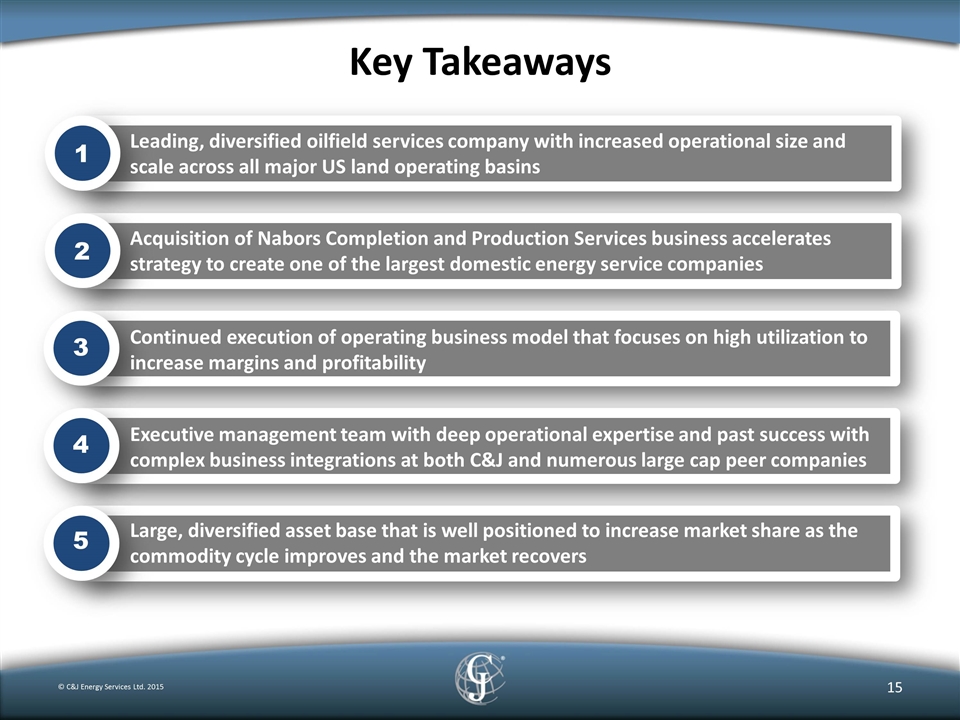
Key Takeaways © C&J Energy Services Ltd. 2015 1 Leading, diversified oilfield services company with increased operational size and scale across all major US land operating basins 2 3 4 Acquisition of Nabors Completion and Production Services business accelerates strategy to create one of the largest domestic energy service companies 5 Large, diversified asset base that is well positioned to increase market share as the commodity cycle improves and the market recovers Executive management team with deep operational expertise and past success with complex business integrations at both C&J and numerous large cap peer companies Continued execution of operating business model that focuses on high utilization to increase margins and profitability
Appendix
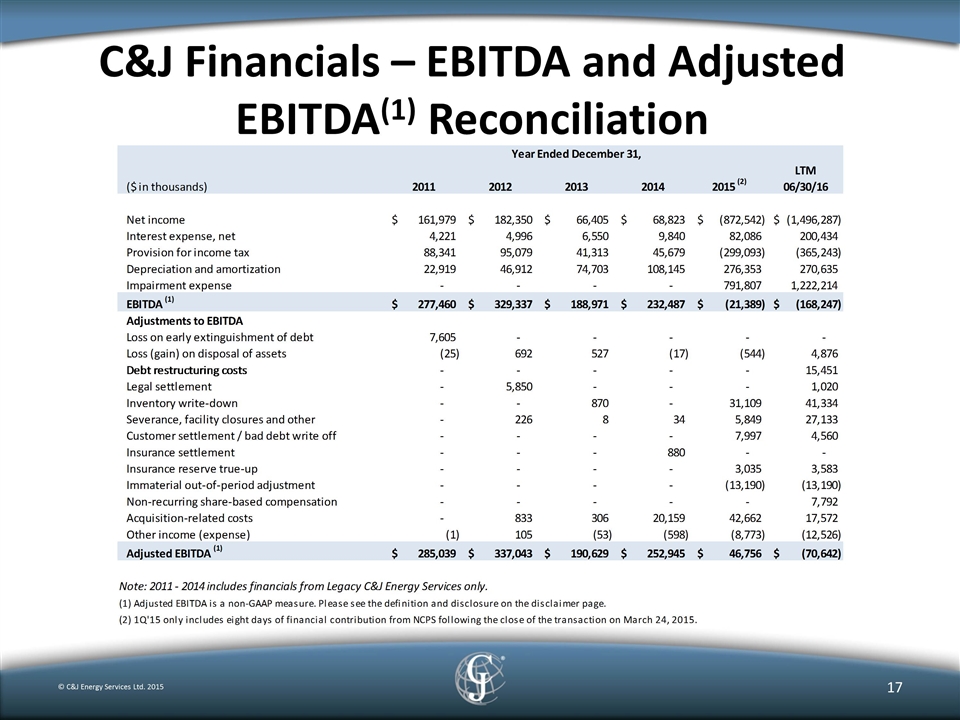
C&J Financials – EBITDA and Adjusted EBITDA(1) Reconciliation © C&J Energy Services Ltd. 2015
