Attached files
| file | filename |
|---|---|
| EX-10.25 - EX-10.25 - EXTREME NETWORKS INC | extr-ex1025_853.htm |
| EX-32.2 - EX-32.2 - EXTREME NETWORKS INC | extr-ex322_296.htm |
| EX-32.1 - EX-32.1 - EXTREME NETWORKS INC | extr-ex321_317.htm |
| EX-31.2 - EX-31.2 - EXTREME NETWORKS INC | extr-ex312_294.htm |
| EX-31.1 - EX-31.1 - EXTREME NETWORKS INC | extr-ex311_293.htm |
| EX-23.1 - EX-23.1 - EXTREME NETWORKS INC | extr-ex231_805.htm |
| EX-21.1 - EX-21.1 - EXTREME NETWORKS INC | extr-ex211_852.htm |
| EX-10.30 - EX-10.30 - EXTREME NETWORKS INC | extr-ex1030_655.htm |
| EX-10.28 - EX-10.28 - EXTREME NETWORKS INC | extr-ex1028_851.htm |
| EX-10.27 - EX-10.27 - EXTREME NETWORKS INC | extr-ex1027_969.htm |
| EX-10.26 - EX-10.26 - EXTREME NETWORKS INC | extr-ex1026_850.htm |
| EX-10.17 - EX-10.17 - EXTREME NETWORKS INC | extr-ex1017_659.htm |
| EX-10.16 - EX-10.16 - EXTREME NETWORKS INC | extr-ex1016_658.htm |
| EX-10.15 - EX-10.15 - EXTREME NETWORKS INC | extr-ex1015_657.htm |
| EX-10.12 - EX-10.12 - EXTREME NETWORKS INC | extr-ex1012_654.htm |
| EX-10.11 - EX-10.11 - EXTREME NETWORKS INC | extr-ex1011_653.htm |
UNITED STATES
SECURITIES AND EXCHANGE COMMISSION
Washington, D.C. 20549
Form 10-K
(Mark One)
|
x |
ANNUAL REPORT PURSUANT TO SECTION 13 OR 15(d) OF THE SECURITIES EXCHANGE ACT OF 1934 |
For the fiscal year ended June 30, 2016
OR
|
o |
TRANSITION REPORT PURSUANT TO SECTION 13 OR 15(d) OF THE SECURITIES EXCHANGE ACT OF 1934 |
For the transition period from to .
Commission file number 000-25711
Extreme Networks, Inc.
(Exact name of Registrant as specified in its charter)
|
Delaware |
|
77-0430270 |
|
(State or other jurisdiction of incorporation or organization) |
|
(I.R.S. Employer Identification No.) |
|
|
|
|
|
145 Rio Robles San Jose, California |
|
95134 |
|
(Address of principal executive offices) |
|
(Zip Code) |
Registrant’s telephone number, including area code: (408) 579-2800
Securities registered pursuant to Section 12(b) of the Act: None
Securities registered pursuant to Section 12(g) of the Act:
Common stock, $0.001 par value
Indicate by check mark if the registrant is a well-known seasoned issuer, as defined in Rule 405 of the Securities Act. Yes o No x
Indicate by check mark if the registrant is not required to file reports pursuant to Section 13 or Section 15(d) of the Act. Yes o No x
Indicate by check mark whether the registrant (1) has filed all reports required to be filed by Section 13 or 15(d) of the Securities Exchange Act of 1934 during the preceding 12 months (or for such shorter period that the registrant was required to file such reports), and (2) has been subject to such filing requirements for the past 90 days. Yes x No o
Indicate by check mark if disclosure of delinquent filers pursuant to Item 405 of Regulation S-K (§229.405 of this chapter) is not contained herein, and will not be contained, to the best of registrant’s knowledge, in definitive proxy or information statements incorporated by reference in Part III of this Form 10-K or any amendment to this Form 10-K. o
Indicate by check mark whether the registrant has submitted electronically and posted on its corporate Web site, if any, every Interactive Data File required to be submitted and posted pursuant to Rule 405 of Regulation S-T (§229.405 of this chapter) during the preceding 12 months (or for such shorter period that the registrant was required to submit and post such files). Yes x No o
Indicate by check mark whether the registrant is a large accelerated filer, an accelerated filer, a non-accelerated filer, or a smaller reporting company. See definitions of “large accelerated filer,” “accelerated filer” and “smaller reporting company” in Rule 12b-2 of the Exchange Act. (Check One):
|
Large Accelerated Filer |
o |
|
Accelerated Filer |
x |
|
Non-Accelerated Filer |
o |
|
Smaller reporting company |
o |
Indicate by check mark whether the registrant is a shell company (as defined in Rule 12b-2 of the Exchange Act). Yes o No x
The aggregate market value of voting stock held by non-affiliates of the Registrant was approximately $302.9 million as of December 31, 2015, the last business day of the Registrant’s most recently completed second fiscal quarter, based upon the per share closing price of the Registrant’s common stock as reported on The NASDAQ Global Market reported on such date. For purposes of this disclosure, shares of common stock held or controlled by executive officers and directors of the registrant and by persons who hold more than 5% of the outstanding shares of common stock have been treated as shares held by affiliates. This calculation does not reflect a determination that certain persons are affiliates of the Registrant for any other purpose.
106,388,401 shares of the Registrant’s Common stock, $.001 par value, were outstanding as of August 26, 2016.
DOCUMENTS INCORPORATED BY REFERENCE
Portions of the registrant's definitive proxy statement for the 2016 Annual Meeting of Stockholders to be filed with the Commission pursuant to Regulation 14A not later than 120 days after the end of the fiscal year covered by this Annual Report on Form 10-K are incorporated herein by reference in Part III of this Annual Report on Form 10-K.
FORM 10-K
INDEX
|
|
|
|
|
Page |
|
Forward Looking Statements |
|
|
||
|
|
|
|
||
|
|
|
|
1 |
|
|
|
|
|
|
|
|
Item 1. |
|
|
1 |
|
|
|
|
|
|
|
|
Item 1A. |
|
|
14 |
|
|
|
|
|
|
|
|
Item 1B. |
|
|
28 |
|
|
|
|
|
|
|
|
Item 2. |
|
|
28 |
|
|
|
|
|
|
|
|
Item 3. |
|
|
28 |
|
|
|
|
|
|
|
|
Item 4. |
|
|
28 |
|
|
|
|
|
|
|
|
|
|
|
29 |
|
|
|
|
|
|
|
|
Item 5. |
|
|
29 |
|
|
|
|
|
|
|
|
Item 6. |
|
|
31 |
|
|
|
|
|
|
|
|
Item 7. |
|
Management’s Discussion and Analysis of Financial Condition and Results of Operations |
|
33 |
|
|
|
|
|
|
|
Item 7A. |
|
|
45 |
|
|
|
|
|
|
|
|
Item 8. |
|
|
47 |
|
|
|
|
|
|
|
|
Item 9. |
|
Changes in and Disagreements With Accountants on Accounting and Financial Disclosure |
|
83 |
|
|
|
|
|
|
|
Item 9A. |
|
|
83 |
|
|
|
|
|
|
|
|
Item 9B. |
|
|
84 |
|
|
|
|
|
|
|
|
|
|
|
85 |
|
|
|
|
|
|
|
|
Item 10. |
|
|
85 |
|
|
|
|
|
|
|
|
Item 11. |
|
|
85 |
|
|
|
|
|
|
|
|
Item 12. |
|
Security Ownership of Certain Beneficial Owners and Management and Related Stockholder Matters |
|
85 |
|
|
|
|
|
|
|
Item 13. |
|
Certain Relationships and Related Transactions, and Director Independence |
|
85 |
|
|
|
|
|
|
|
Item 14. |
|
|
85 |
|
|
|
|
|
|
|
|
|
|
|
86 |
|
|
|
|
|
|
|
|
Item 15. |
|
|
86 |
|
|
|
|
|
|
|
|
|
87 |
|||
i
Except for historical information contained herein, certain matters included in this annual report on Form 10-K are, or may be deemed to be forward-looking statements within the meaning of Section 21E of the Securities Exchange Act of 1934 and Section 27A of the Securities Act of 1933. The words "will," "may," "designed to," "believe," "should," "anticipate," "plan," "expect," "intend," "estimate" and similar expressions identify forward-looking statements, which speak only as of the date of this annual report. These forward-looking statements are contained principally under Item 1, "Business," and under Item 7, "Management's Discussion and Analysis of Financial Condition and Results of Operations," but may also be in other sections of this annual report on Form 10-K. Because these forward-looking statements are subject to risks and uncertainties, actual results could differ materially from the expectations expressed in the forward-looking statements. Important factors that could cause actual results to differ materially from the expectations reflected in the forward-looking statements include those described in Item 1A, "Risk Factors" and Item 7, "Management's Discussion and Analysis of Financial Condition and Results of Operations." In addition, new risks emerge from time to time and it is not possible for management to predict all such risk factors or to assess the impact of such risk factors on our business. Given these risks and uncertainties, you should not place undue reliance on these forward-looking statements. We undertake no obligation to update or revise these forward-looking statements to reflect subsequent events or circumstances.
Overview
Extreme Networks, Inc., together with its subsidiaries (collectively referred to as “Extreme” and as “we”, “us” and “our”) is a leader in providing software-driven networking solutions for enterprise customers. Providing a combined end-to-end solution from the data center to the access point, Extreme designs, develops and manufactures wired and wireless network infrastructure equipment and develops the software for network management, policy, analytics, security and access controls. We strive to help our customers and partners Connect Beyond the Network by building world-class software and network infrastructure solutions that solve the wide range of problems faced by information technology (“IT”) departments.
The Internet of Things (“IoT”) and the evolution of the cloud have made reliable and secure Internet connections increasingly critical to business success. In this time of rapid changes and market shifts, delivering a focused value proposition based on automation, simplicity, high quality solutions and world class customer support is vitally important. As the volume and the demands of users, applications, data and devices on networks continue to increase, Extreme stands ready to help our customers address the ever-evolving demands of the business.
We seek to differentiate ourselves in the market by delivering a value proposition based on a software-driven approach to network management, control and analytics.
Our key points of differentiation include:
|
|
· |
End-to-end, wired and wireless solutions. Extreme offers a complete, unified portfolio of software-driven network access technology. We offer the latest in wireless access points for both outdoor and indoor use plus a complete line of switches to cover the campus, right up to and including the data center. |
|
|
· |
Multi-vendor management from a “single pane of glass”. Extreme offers a single unified management system that is designed to provide visibility and control across the entire network. This can make the network easier to manage and troubleshoot, often with lower operating expenses. Our software can also manage many other vendors’ network devices, enabling our customers to potentially maximize device lifespan. |
|
|
· |
Software-driven vertical solutions. Extreme’s software-driven solutions are designed to be easily adaptable to vertical solutions in industries such as, healthcare, education, manufacturing, government and hospitality. Extreme solutions are also designed to be well-suited for vertical-specific partners. |
|
|
· |
Application-aware Quality of Service (“QoS”) and analytics. Extreme has innovative analytic software that enables our customers to see application usage across the network and apply policies that maximize network capabilities. This allows our customers to improve the user experience. |
|
|
· |
Built-in identity and access control. Extreme’s network access control and identity management are delivered with the wired and wireless hardware. This may reduce the need to add on expensive software or hardware that may require complex compatibility testing. |
|
|
· |
EZ policy assignment and software-defined networking (“SDN”). ExtremeControl and ExtremeManagement software allow our customers to assign policy across the entire network. The SDN component adds versatility for implementing policies that increase network utilization. |
|
|
· |
100% in-sourced tech support. Extreme delivers best in class customer support in the industry with 92% first call resolution through a 100% in-sourced support model. |
Extreme sells products primarily through an ecosystem of channel partners which combine our Ethernet, wireless and management and software analytics products with their vertical-specific offerings to create IT solutions for end user customers.
On October 31, 2013, we completed the acquisition of Enterasys Networks, Inc. (“Enterasys”), a privately held provider of wired and wireless network infrastructure and security solutions, whereby Enterasys became our wholly-owned subsidiary. The combined entity immediately became a networking industry leader with more than 14,000 customers. As network switching leaders in enterprise, datacenter and cloud, Extreme and Enterasys together combine and extend their world-class products and technologies to provide customers with some of the most advanced, high performance and open solutions in the market as well as a superb overall customer experience. The combination of Extreme and Enterasys is significant in that it brings together two companies with distinct strengths addressing the key areas of the network, from unified wired and wireless edge, to the enterprise core, to the data center and cloud. With an open software approach, we can drive product innovations and customers will benefit from the increased resources and larger scale.
Industry Background
The networking industry appears to be invigorated by a wave of technological change:
|
|
· |
Ethernet (wired and wireless) has solidified its role in both public and private networks through its scalability, adaptability and cost-effectiveness. At the same time, the enterprises and service providers expect the technology to follow a price-performance curve that mandates continued innovation by Ethernet vendors. |
|
|
· |
The mobile workforce has proliferated. Employees expect high-quality and secure access to corporate resources in a Bring Your Own Device ("BYOD") world across a diversity of endpoints such as laptops, tablets, smart phones and wearables, whether they are within the corporate firewall or on-the-go. IT departments focus their investment decisions on this mobile workforce, taking a unified view of wireless access, the campus core and the data center. Networking vendors offer end-to-end solutions that permit IT managers to meet employee expectations and to maximize IT return on investment. |
|
|
· |
Growing usage of the cloud. Deployment of server virtualization is influencing data center architecture. Enterprises have migrated increasing numbers of applications and services to either private clouds or public clouds offered by third parties. In either case, the network infrastructure must adapt to this new dynamic environment. Intelligence and automation are key if enterprises are to derive maximum benefit from their cloud deployments. Ethernet speeds, scaling from 10 Gigabits per second ("G") to 40G and even 100G, provide the infrastructure for both private and public clouds. In addition, there is growing interest in SDN approaches that may include technologies such as OpenFlow, OpenStack, and CloudStack for increased network agility. |
|
|
· |
Vendor Consolidation. We believe consolidation of vendors within the Ethernet networking market and between adjacent markets (storage, security, wireless & voice software and applications) continues to gain momentum. In 2015, the Hewlett-Packard Company (“HP”) acquired Aruba, Dell, Inc. acquisition of EMC is expected to close in October 2016 and Brocade Communication Systems acquired Ruckus in May 2016. We believe these acquisitions reflect a realization that customers want end-to-end, integrated networking solutions. Extreme identified this trend in 2013 and address the issue with its acquisition of Enterasys in 2013. Since that time, Extreme has rationalized the roadmap and provided an upgrade path for customers. |
Extreme’s strategy, product portfolio and research and development are closely aligned with what we have identified as the following trends in our industry:
|
|
· |
Rapid adoption of white box/brite box devices. We believe the transition to white box/brite box is taking place faster than analyst firms had initially predicted. Network decision makers may be able to reduce cost, improve management and enable long-term innovation using brite box switches versus traditional switching approaches. |
|
|
Ø |
Extreme announced its brite box offering will begin in the first half of FY 2017. |
2
|
|
· |
Cloud is a revolutionary disrupter in the network switching market. In August 2016, International Data Corporation (“IDC”), forecasts between 2015 through 2020 that private cloud is expected to experience a compound annual growth rate (“CAGR”) of 25.0% while (traditional data center) is expected to experience slow to negative growth. |
|
|
Ø |
Extreme announced its cloud offering in April of 2016. |
|
|
· |
SDN is providing more revenue and delivery models to the industry than predicted. |
|
|
Ø |
Extreme’s SDN offering is innovative and adaptable to a wide range of use cases. |
|
|
· |
Enterprise adoption of the cloud and open-source options are disrupting traditional license and maintenance business models. |
|
|
Ø |
Extreme announced cloud offerings in April of 2016 and began participation in the OpenSwitch program in May, 2016. |
|
|
· |
Growth of wireless devices is expected to continue to outpace hardwire switch growth. |
|
|
Ø |
Extreme announced its 802.11ac Wave 2 wireless offering in late 2015 and plans to continue to advance its wireless portfolio of indoor and outdoor access points. |
The Extreme Strategy
In today’s BYOD world, the proliferation of mobile users and devices within a campus or across continents has increased the challenge of operating and managing a network. IT has rapidly evolved from a fixed world to a new world of mobility where everything - people, devices, machines and applications - is in motion. IT now supports end-users with smart phones, tablets, laptops and other wireless peripherals as well as their wired workstations. Users know what they need to be productive, and they expect the network to help them achieve productivity, as such, they are beginning to define the services that must be offered for these devices so they are able to work on-the-go. The blurring of work and personal applications that must be supported on the network places increasing security demands on our customers.
Extreme delivers software-driven networking solutions designed for the BYOD world, spanning private cloud data centers, the campus and the mobile infrastructure. Customers deploying our solutions know which users are on the network, what they are requesting and where they are located. They are able to provide customized access to approved resources and content. Our solutions provide granular visibility and control, higher performance and resource security.
Our strategy is to offer differentiated solutions that deliver a stronger value proposition to customers and offer an alternative to single-sourced, highly-proprietary networking equipment from other companies. Our commitment to open standards is manifested by demonstrated interoperability within both enterprise and service provider networks, and the active participation in key industry and standards associations.
Key elements of our strategy include:
|
|
· |
Enable customers and partners to “Connect Beyond the Network.” Extreme software-driven networking and services-led solutions provide visibility and control across our wired and wireless networking platforms. Our solutions include wired switching, wireless switching, wireless access points and controllers, management software, access control software, analytics software as well as applications and services. In addition, Extreme offers cloud-managed wired and wireless networking solutions that provide additional choice and flexibility with on or off premise software management. These technical capabilities coupled with our award-winning services and support provide a strong value proposition to the following customers and applications: |
|
|
- |
Enterprises and private cloud data centers use our products to deploy automated next-generation virtualized and high-density infrastructure solutions. |
|
|
- |
Enterprises and organizations in education, healthcare, manufacturing, hospitality and government agencies use our solutions for their mobile campus and backbone networks. |
|
|
- |
Enterprises, universities, healthcare and hospitality organizations use our solutions to enable better visibility and control of their data processing and analytics requirements. |
3
|
|
· |
Extend switching and routing technology leadership. Our technological leadership is based on innovative switching, routing and wireless products, the depth and focus of our market experience and our operating systems - the software that runs on all of our Ethernet switches. Our network operating systems, our primary merchant silicon vendor, and select manufacturing partners, permit us to leverage our engineering investment. We plan to invest in engineering resources to continue to create leading-edge technologies to increase the performance and functionality of our products, and as a direct result, the value of our solution to our current and future customers. We look for maximum synergies from our engineering investment in our targeted verticals. |
|
|
· |
Expand Wi-Fi technology leadership. Wireless is today’s network access method of choice and every business must deal with scale, density and BYOD challenges. The increase in demand being seen today, fueled by more users with multiple devices, increases the expectation that everything will just work. The network edge landscape is changing as the explosion of mobile devices increases the demand for mobile, transparent and always-on wired to wireless edge services. This new “unified access layer” requires intelligent distributed components to ensure that access control and resiliency of business services are available across the entire infrastructure and manageable from a single console. Our unified access layer portfolio provides intelligence for the wired/wireless edge. |
|
|
· |
Continue to deliver unified management across the wired/wireless environment from the data center to the mobile edge. Our rich set of integrated management capabilities provides centralized visibility and highly efficient anytime, anywhere control of enterprise wired and wireless network resources. |
|
|
· |
Offer network-powered business and application analytics. Our network-powered application analytics and optimization solution captures and analyzes context-based data about application traffic to deliver meaningful intelligence about applications, users, locations and devices. This enables the network to become a strategic business asset by enabling the mining of network-based business events and strategic information that help executives make faster and more effective decisions. |
Data can be mined to show how applications are being used enabling a better understanding of user behavior on the network, identifying the level of user engagement and assuring business application delivery to optimize the user experience. Application adoption can be tracked to determine the return on investment associated with new application deployment.
Visibility into network and application performance enables our customers to pinpoint and resolve performance bottlenecks in the infrastructure whether they are caused by the network, application or server. This saves both time and money for the business and ensures critical applications are running at the best possible performance.
|
|
· |
Support SDN. Networks are built using switches, routers and other devices in a distributed fashion to scale and provide reliability. In this distributed environment, it has become more complex to provide new end-to-end services and applications in a seamless and cost-effective manner. As the business demands more agile and flexible IT services, this has become a focal point for innovation and also for differentiation by vendors that have solved that challenge. To address the simultaneous needs for security, virtualization, manageability, mobility and agility in today´s networks, the concept of SDNs are gaining attention as a viable solution. |
The value of SDN in the enterprise lies specifically in the ability to provide network virtualization and automation of configuration across the entire network/fabric so new services and end systems can be deployed rapidly and operational cost can be minimized.
|
|
· |
Expand market penetration by targeting high-growth market segments. Within the campus, we focus on the mobile user, leveraging our automation capabilities and tracking wireless local area network (“LAN”) growth. Our data center approach leverages our product portfolio to address the needs of private cloud data center providers. Within the campus we also target the high-growth physical security market, converging technologies such as Internet Protocol (“IP”) video across a common Ethernet infrastructure in conjunction with technology partners. |
|
|
· |
Leverage and expand multiple distribution channels. We distribute our products through select distributors, a large number of resellers and system-integrators worldwide, and several large strategic partners. We maintain a field sales force to support our channel partners and to sell directly to certain strategic accounts. As an independent Ethernet switch vendor, we seek to provide products that, when combined with the offerings of our channel partners, create compelling solutions for end-user customers. |
4
|
|
· |
Maintain and extend our strategic relationships. We have established strategic relationships with a number of industry-leading vendors to both provide increased and enhanced routes to market, but also to collaboratively develop unique solutions. |
|
|
· |
Provide high-quality customer service and support. We seek to enhance customer satisfaction and build customer loyalty through high-quality service and support. This includes a wide range of standard support programs that provide the level of service our customers require, from standard business hours to global 24-hour-a-day, 365-day-a-year real-time response support. |
Products
Our software-driven networking products offer resilient high-performance networking, intelligence and operational simplicity for our customers. We build our products into vertical market solutions for converged campus networks that provide user and device mobility. Data center and cloud administrators are able to virtualize their servers and storage over our high-performance Ethernet infrastructure. Extreme’s management software provides visibility, security and intelligent control from the data center to the edge - all through a single pane of glass.
Our product categories include:
|
|
· |
Modular Ethernet switching systems. Our ExtremeSwitching products deliver modular or chassis-based Ethernet connectivity solutions for enterprises, data centers and service providers. These products have a range of management and line cards that allow our customers to flexibly configure and re-purpose the systems to meet specific needs. Our chassis products, in conjunction with our operating systems and our centralized management software product, provide the density, performance and reliability required to serve in environments with demanding applications. |
During fiscal year 2016, we announced the industry's highest capacity 100G interfaces for the ExtremeSwitching BDX. Our S-Series and K-Series switching deliver flow-based architecture via our CoreFlow2 technology that enable granular visibility and policy control without impacting performance or user experience. These products scale up to 576 ports with Quad Small Form-factor Pluggable, 10GBase-T and SFP+ connectivity options, with built-in hardware support for 10/100/1000, 1GE, 10GE, 40GE, emerging protocols (IPv6) and large-scale deployment protocols such as Multi-Protocol Label Switching (“MPLS”).
|
|
· |
Stackable Ethernet switching systems. Our ExtremeSwitching fixed form factor product family delivers Ethernet connectivity for the network edge, aggregation and core. Within the ExtremeSwitching family are products that offer a range of connection speeds (from 100 Megabit to 100 Gigabit), various physical presentations (copper and fiber) and options to deliver PoE or unpowered standard Ethernet ports. As with the our modular chassis switching products, the fixed switching products in conjunction with our operating systems provide the features, performance and reliability required by our customers to deploy, operate and manage converged networking infrastructures. We have recently announced the Summit X440-G2 and X620, which we believe is one of the most cost-effective, feature-rich, enterprise-grade switching platform in the industry. |
|
|
· |
High density Wi-Fi. In addition to our wired Ethernet switch portfolio, we offer our ExtremeWireless family of wireless access points, centralized management and appliance to enable the deployment of wired-like performance, at scale for high-density in every environment. Our wireless access point products offer both indoor and outdoor 802.11a/b/g/n/ac access points. Proven in the most demanding environments, ExtremeWireless delivers an exceptional experience for BYOD/Mobile users wherever they may roam. |
During the last year, we continued our growth in high-density venue deployments with many new NFL stadiums including the Green Bay Packers, Baltimore Ravens, Carolina Panthers, Jacksonville Jaguars and Cincinnati Bengals. Extreme also signed contracts in the NHL with the Buffalo Sabres and the Detroit Red Wings, in the NBA with the Golden State Warriors and in MLB with the Chicago Cubs.
|
|
· |
Centralized management software. To provide a central network-wide visibility and control capability, we offer our ExtremeManagement software platform. This platform provides the ability to manage and automate the entire network through a single interface. This means deploy, configure, monitor and support the complete range of Wi-Fi and switching infrastructure and also set network-wide policy to enable our customers to reduce the overall cost of network administration and operations, protect corporate resources and provide a consistent high-quality user experience. |
5
|
|
· |
Network Access Control (“NAC”) and BYOD management. The ExtremeControl software solution provides a complete standards-based, multi-vendor interoperable pre-connect and post-connect Network Access Control solution for wired and wireless LAN and VPN users. Automated BYOD registration allows users to register their own devices using their credentials with no IT intervention. Guest registration access control features seek to facilitate secure guest networking. ExtremeControl also allows easy integration with other third party network management tools for Mobile Device Management integration, threat response Next Generation Firewall (“NGFW”), Security Information and Event Management (“SIEM”), Intrusion Prevention System (“IPS”) and more. |
|
|
· |
Application analytics. ExtremeAnalytics is a network-powered application analytics and optimization solution that captures network data, then aggregates, analyzes, correlates and reports on it to enable better decision making and improved business performance. ExtremeAnalytics allows IT operations to optimize the network for each and every application, enhance security for those applications and provide data for business analytics. This empowers IT to turn the network into a strategic business asset that can now provide value to other lines of business, and enable business innovation powered by the network infrastructure. As an example, Extreme was selected as the Official Wi-Fi & Analytics Provider for the NFL, including Super Bowl XLVIII, XLIX, XLVI and XLI. |
|
|
· |
Cloud-based network management. ExtremeCloud is a resilient and scalable cloud-based network management solution offered by Extreme as a subscription service. The network is the platform of engagement for clients and staff. We have designed ExtremeCloud to provide superior user experience by empowering our customers and the applications that drive their business. The combination of Extreme’s smart wired and wireless edges and the elasticity, resilience and scalability provided via state-of-the-art data centers distributed strategically for worldwide availability, allows our customers to respond to the changing needs of their business at the speed of cloud through a simple, multi-site aware user interface. ExtremeCloud is subscription based to align with new business imperatives. Ease-of-purchasing, provisioning and ongoing operations are at the very core of ExtremeCloud to allow our customers, and their teams, to transform with the business, but without high upfront costs or complex infrastructure changes or software deployments. |
|
|
· |
Software-defined networks. Extreme’s SDN architecture provides a comprehensive networking solution from the Extreme Wireless edge to the Extreme Switching wired edge to the aggregation and core network layers, and all the way across the data center. Extreme controls the technology and roadmap for the entire infrastructure, which is all managed from a single pane of glass with ExtremeManagement. User and device control enabled by ExtremeControl provides secure, policy-based access to the network. ExtremeAnalytics provides application visibility at Layer 7. |
Competitive alternatives often combine technologies from several vendors resulting in multiple disparate points of management. With Extreme’s SDN architecture, centralized management and visibility and control of the network, the solution truly is greater than the sum of the parts, providing high levels of performance and security with the highest levels of operational efficiency.
Key product functionality includes:
|
|
· |
Resilient high performance networking. Customers can choose to deploy redundant management and fabric modules, hot swappable line cards, multi-speed stacking across 100 Megabits (“M”)/1G/10G/40G/100G systems, redundant power supplies and fan trays delivering high hardware availability. These deployments are supported by our modular and fault-tolerant network operating systems that spans our complete switching portfolio, unique in the industry. Technologies supported include a variety of Layer 2 (“L2”) resiliency protocols including multi-switch Link Aggregation (“M-LAG”), Ethernet Automatic Protection Switching (“EAPS”), MPLS / Virtual Private LAN Service (“VPLS”) for high service availability, and Layer 3 IPv4 and IPv6 routing protocols for high network availability. |
EAPS is an example of our innovation and allows our customers to configure their network infrastructure so that critical network communications can be rapidly rerouted in the event of a network outage in most topologies. This level of high-speed communications 'reroute' is targeted for mission-critical and demanding applications, including voice and video, and maintains service delivery in the event of network outage.
We further offer a versatile and flexible QoS solution that allows network operators to configure bandwidth for mission-critical applications and in doing so, control the overall experience and the service-level of the communication flows. We have deep experience with communication quality controls, starting with our introduction to the market of the first broad QoS controls for Ethernet to the recent Data Center Bridging protocols for 'lossless' Ethernet that enables traditional storage networks to converge over a common Ethernet infrastructure.
6
We provide L2 extension for data centers through multiple supported technologies that include Virtual Extensible LAN, VPLS and Pseudo-Wire Emulation as well as L2 extension with Generic Routing Encapsulation (“GRE”/L2) and Shortest Path Bridging (“SPB”) (on the S-Series). In addition to GRE/L2 and SPB on our S-Series, we offer innovative traffic optimization for east/west and north/south traffic using Fabric routing and Host routing, respectively. This means we can enable Virtual Machine (“VM”) mobility using Layer 3 Data Center Interconnect, even without L2 stretch. Our unique CoreFlow2 architecture delivers tens of millions of flows for deep visibility and control over users, services and applications to meet the demands of today’s businesses applications.
|
|
· |
Intelligence. Based on a unified, pervasive and intelligent software foundation, our customers can take advantage of user, machine and application visibility and control for the whole network infrastructure - from data center to edge. |
|
|
- |
Universal Port automatically detects new devices such as IP phones that plug-in to the network and can assign appropriate power, server and other configurations. The Identity Management engine allows tracking of users based on their login id and host machine, and assigns them to roles based on guest, contractor or employee privilege. |
|
|
- |
In the data center and cloud, Network Virtualization allows network administrators visibility into VM movement and having virtual port-profiles follow VMs as they move within and across network switches. CLEAR-Flow, our wire-speed security rules engine, helps detect and mitigate traffic anomalies, including denial of service attacks. |
|
|
- |
ExtremeManagement and ExtremeControl provide centralized visibility and granular control of enterprise network resources end-to-end, to manage, automate and report on the entire network through a single interface. ExtremeControl NAC and ExtremeAnalytics provides comprehensive visibility and policy for multi-vendor environments, providing detailed context that correlates users with their devices, applications, locations and other attributes. These products provide deep network insight and analytics, which can be used for better network optimization, improved security and smarter business decisions. This enables business innovation powered by the network infrastructure and empowers our customers to turn the network into a strategic business asset that can now provide value to other lines of business. |
|
|
- |
Our Audio-Video Bridging capabilities add intelligence within the network to support the convergence of professional audio and video across Ethernet, while our SDN investments provide a foundation for enhanced automation and orchestration from private cloud to user edge. |
|
|
· |
Operational simplicity. We provide a unified management system for the entire network providing consistent management across all network segments and devices, making IT operations more efficient and simpler. No matter how many moves, adds or changes occur in your environment, ExtremeManagement keeps everything in view and under control through role-based access controls. ExtremeManagement can manage beyond Extreme switching, routing, and wireless hardware to deliver standards-based control of other vendors’ network equipment. This means faster provisioning, quicker problem resolution, tighter security and reduced IT administration time. |
|
|
· |
Vertical Market Solutions. Our SDN and services-led solution offerings are solutions targeted at specific high-growth vertical markets. These include Open Fabric, our architecture for open and scalable next-generation data center deployments that offer investment protection and provide a path to SDN. Extreme’s All Ethernet Open Fabric is anchored by our ExtremeSwitching family of products, ExtremeManagement, and where required, products from technology partners. |
In the campus, our intelligent mobile edge offering combines our ExtremeSwitching edge virtual chassis switches, our ExtremeWireless access point and controller portfolio and our ExtremeManagement & Control platform offering user and device identity awareness.
Sales, Marketing and Distribution
We conduct our sales and marketing activities on a worldwide basis through a channel that utilizes distributors, resellers and our field sales organization. As of June 30, 2016, our worldwide sales and marketing organization consisted of 521 employees, including vice presidents, directors, managers, sales representatives, and technical and administrative support personnel. We have domestic sales offices located in 5 states and international sales offices located in 28 countries.
We sell our products primarily through an ecosystem of channel partners who combine our Ethernet, wireless, management and analytics software products with their vertical specific offerings to create compelling information technology solutions for end-user customers. We utilize our field sales organization to support our channel partners and to sell directly to certain end-user customers, including some large global accounts.
7
The details of our sales and distribution channels are as follows:
|
|
· |
Alliance, Original Equipment Manufacturers ("OEM") and Strategic Relationships. We have active Alliance, OEM & strategic relationships with Barco NV, Ericsson Enterprise AB, Silicon Graphics International, Inc. (acquired by HP), PC HK Ltd., Nokia Siemens Networks and Aviat Networks, Inc. as well as other global industry technology leaders in which our products are qualified to be included into an overall solution or reference architecture. These tested and validated solutions are then marketed and sold by the Alliance, OEM or strategic partners into their specific verticals, market segments and customers as turnkey offerings. |
|
|
· |
Distributors. We have established several key relationships with leading distributors in the electronics and computer networking industries. Each of our distributors primarily resells our products to resellers. The distributors enhance our ability to sell and provide support to resellers who may benefit from the broad service and product fulfillment capabilities offered by these distributors. Extreme maintained distribution agreements with Westcon Group, Tech Data Corporation and Jenne Corporation on substantially the same material terms as we generally enter into with each of our distributor partners. Distributors are generally given the right to return a portion of inventory to us for the purpose of stock rotation, to claim rebates for competitive discounts and participate in various cooperative marketing programs to promote the sale of our products and services. We defer recognition of revenue on all sales to distributors who maintain inventory of our products until the distributors sell the product, as evidenced by monthly “sales-out” reports that the distributors provide to us, provided other revenue recognition criteria are met. (See “Revenue Recognition” in Item 7. Management’s Discussion and Analysis of Financial Condition and Results of Operations.) |
|
|
· |
Resellers. We rely on many resellers worldwide that sell directly to the end-user customer. Our resellers include regional networking system resellers, resellers who focus on specific vertical markets, value added resellers, network integrators and wholesale resellers. We provide training and support to our resellers and our resellers generally provide the first level of contact to end-users of our products. Our relationships with resellers are on a non-exclusive basis. Our resellers are not given rights to return inventory and do not automatically participate in any cooperative marketing programs. We generally recognize product revenue from our reseller and end-user customers at the time of shipment, provided other revenue recognition criteria are met. When significant obligations or contingencies remain after products are delivered, such as installation or customer acceptance, revenue and related costs are deferred until such obligations or contingencies are satisfied. (See “Revenue Recognition” in Item 7. Management’s Discussion and Analysis of Financial Condition and Results of Operations.) |
|
|
· |
Field Sales. Our field sales organization is trained to sell solutions, support and develop leads for our resellers and to establish and maintain key accounts and strategic end-user customers. To support these objectives, our field sales force: |
|
|
- |
Assists end-user customers in finding solutions to complex network system and architecture problems. |
|
|
- |
Differentiates the features and capabilities of our products from competitive offerings. |
|
|
- |
Continually monitors and understands the evolving networking needs of enterprise and service provider customers. |
|
|
- |
Promotes our products and ensures direct contact with current and potential customers. |
|
|
- |
Assists our resellers to drive opportunities to closure business. |
Although we compete in many vertical markets, in fiscal year 2016, we have focused on the specific verticals of healthcare, education, manufacturing, government and hospitality, which includes sports and entertainment venues. Years of experience and a track record of success in the verticals we serve enables us to address the following industry-specific problems.
Healthcare:
|
|
· |
Patient services. In an increasingly competitive healthcare market, ensuring patient and visitor access from a variety of devices to the Internet can be a competitive advantage. We have several medical facilities worldwide that can reference Extreme’s expertise in meeting the challenges of patient services which include: online services, guest Wi-Fi, IoT, wearables and sensors. |
|
|
· |
The majority of new medical devices are IP-based. Not only are most medical devices monitored through the network, they are regulated by various government agencies across the globe. Extreme has success in meeting this challenge with compliance through its complete wireless and wired product suite overseen by innovative management and analytics. |
|
|
· |
Clinical workflow has shifted to real-time mobility inside and outside the hospital. Medical professionals often access critical patient records through network connections. Extreme’s reliable and comprehensive technology, including the latest Wave 2 capability, is backed by practical experience in addressing the demanding needs of clinical workflow. |
8
Education:
|
|
· |
New styles of teaching. Personalized learning, flipped classrooms and competency-based education depend on well-managed high-bandwidth digital content delivery. Extreme has extensive knowledge in smart classroom and large campus environments; both of which are experiencing a growing presence of IoT devices. Our easy-to-manage networks provide the bandwidth necessary to deliver digital content, including emerging styles like virtual and mixed reality, to thousands of students with the speed and quality required. Extreme has demonstrated the ability to provide high density, two-way Internet connectivity so that each student has a rich and uninterrupted educational experience. |
|
|
· |
Online and technology-based assessment is growing in importance. K-12 is implementing high stakes standardized testing and higher education is moving to BYOD for online mid-term and final exams. ExtremeAnalytics helps ensure tests proceed by providing visibility into the network flow from student device to local school server to remote testing server. |
|
|
· |
Protecting student privacy, safety and digital freedom. Extreme has built-in access and identity control to protect the safety and privacy of students, faculty and administrators. This all in one offering helps ease the burden on education institutions that have limited IT resources. |
Manufacturing:
|
|
· |
Operations to meet the fast-changing customer and market requirements. Flexible manufacturing and build-to-order processes place high demands on the network for material and shop floor control. Extreme’s proven technology strives to meet these demands in some of the world’s most demanding manufacturing environments. |
|
|
· |
Speed, adaptability and innovation are the new currencies in the manufacturing realm. A fast and reliable network can help to accommodate speed. Extreme’s full suite of wired and wireless product and management and analytics software enable agile manufacturing. |
|
|
· |
Visibility into plant and back office technology performance. Extreme’s management, control and analytics provide end-to-end network visibility from a single console without the need to swap user interfaces. This unique capability is well-suited for plant and back office environments. |
Government:
|
|
· |
Secure access. Government agencies are being challenged to provide their employees and the citizens they serve with secure, cost-effective, high-speed access to online information and resources. For today’s agencies, high quality video, collaboration, social media, VoIP and multimedia applications have become mission-critical services. These applications have placed unprecedented bandwidth and control demands on existing networks. |
|
|
· |
Management of new technologies. The increasingly rapid deployment of wireless access, data center virtualization and the adoption of cloud computing have further complicated network management and control. For federal government agencies, the challenge is determining how to deliver secure, seamless, always-on access to these mission-critical services. |
|
|
· |
Controlling costs. Agencies need to deliver access from laptops, tablets, smartphones and other types of devices, at any time, from any place and from anywhere, while at the same time maximizing efficiencies and cost savings across all areas of the network infrastructure. Extreme provides a rich set of networking solutions that strive to be cost-effective and secure and allow government agencies to meet not only today’s needs, but also to be prepared for future demands. |
Hospitality:
|
|
· |
Developing a cohesive and enhanced mobile experience. Through real world experience in sports stadiums, where over 70,000 fans actively access the Internet, Extreme has developed the expertise to handle the most demanding venue challenges. Our hospitality experience spans hotels, casinos, theaters, convention centers, vacation destinations and outdoor venues. |
|
|
· |
Emphasizing the user experience and mobile engagement. Extreme has the ability to monitor applications so that policy to maximize user experience can be implemented in fixed and mobile environments with the same set of management tools from a single pane of glass. |
|
|
· |
Generating revenue opportunities for the business. Knowing the behaviors of customers and clients is a key to success and Extreme Analytics provides visibility to the usage patterns and traits of network users. |
9
Furthermore, we have decided to focus on the following customer profiles where we believe we can add the most value:
|
|
· |
Customer size: Those customers with annual revenue of $100 million to $2.5 billion. |
|
|
· |
Target deployment: Campus deployments with 250 to 5,000 employees or education campuses with 1,000 to 15,000 students. |
|
|
· |
Target data centers: Data centers with 1,000 servers or less. |
|
|
· |
Vertical markets: Healthcare, education, manufacturing, government/enterprise, hospitality. |
|
|
· |
Customer characteristics: Our customers tend to operate in transient environments, such as college campuses, hospitals and sports venues, where BYOD and secure network access and identity control are critical. Their networks must be highly available with the ability to continue operations in the event of a service interruption. Secure access is essential to ensuring the protection of mission-critical systems and confidential information. Often tasked to manage the network with a limited IT staff, our customers appreciate the excellent service and support we strive to provide. |
Customers with 10% of net revenue or greater
The following table sets forth major customers accounting for 10% or more of our net revenue:
|
|
|
Year Ended |
|
|||||||||
|
|
|
June 30, 2016 |
|
|
June 30, 2015 |
|
|
June 30, 2014 |
|
|||
|
Tech Data Corporation |
|
|
17 |
% |
|
|
15 |
% |
|
|
11 |
% |
|
Westcon Group Inc. |
|
|
14 |
% |
|
|
15 |
% |
|
|
11 |
% |
|
Jenne |
|
|
14 |
% |
|
* |
|
|
* |
|
||
|
* |
Less than 10% of revenue |
International sales
International sales are an important portion of our business. In fiscal 2016, sales to customers outside of the United States accounted for 55% of our consolidated net revenue, compared to 57% in fiscal 2015 and 59% in fiscal 2014. These sales are conducted primarily through foreign-based distributors and resellers managed by our worldwide sales organization. In addition, we have direct sales to end-user customers, including large global accounts. The primary markets for sales outside of the United States are countries in Europe and Asia, as well as Canada, Mexico, Central America and South America. (See “Net Revenue” in Item 7. Management’s Discussion and Analysis of Financial Condition and Results of Operations.)
Marketing
We continue to develop and execute on a number of marketing programs to support the sale and distribution of our products by communicating the value of our solutions to our existing and potential customers, our distribution channels, our resellers and our technology alliance partners. Our marketing efforts include participation in industry tradeshows, conferences and seminars, publication of technical and educational articles in industry journals, communication across social media channels, frequent updates to our publicly available website, promotions, web-based training courses, advertising and public relations. We also submit our products for independent product testing and evaluation.
Backlog
Our products are often sold on the basis of standard purchase orders that are cancelable prior to shipment without significant penalties. In addition, purchase orders are subject to changes in quantities of products and delivery schedules in order to reflect changes in customer requirements and manufacturing capacity. Our business is characterized by seasonal variability in demand and short lead-time orders and delivery schedules. Actual shipments depend on the then-current capacity of our contract manufacturers and the availability of materials and components from our vendors. Although we believe that the orders included in the backlog are firm, all orders are subject to possible rescheduling by customers, cancellations by customers which we may elect to allow without penalty to customer, and further pricing adjustments on orders from distributors. Therefore, we do not believe that our backlog, as of any particular date is necessarily indicative of actual revenue for any future period.
Our product backlog at June 30, 2016, net of anticipated back end rebates for distributor sales, was $26.8 million, compared to $14.8 million at June 30, 2015.
10
Seasonality
Like many of our competitors, we historically have experienced seasonal fluctuations in customer spending patterns, which generally adversely affect our first and third fiscal quarters. This pattern should not be relied upon or be considered indicative of our future performance, however, as it has varied in the past.
Customer Service and Support
Our customers seek high reliability and maximum uptime for their networks. To that extent, we provide the following service offerings:
|
|
· |
Support services for end-users, resellers and distributors. We meet the service requirements of our customers and channel partners through our Technical Assistance Centers ("TACs"), located in Research Triangle Park ("RTP"), North Carolina; Salem, New Hampshire and Chennai, India. Our TAC engineers and technicians assist in diagnosing and troubleshooting technical issues regarding customer networks. Development engineers work with the TACs to resolve product functionality issues specific to each customer. |
|
|
· |
Professional services. We provide consultative services to improve customer productivity in all phases of the network lifecycle – planning, design, implementation, operations and optimization management. Our network architects develop and execute customized software and service-led networking solutions for deployment plans to meet individualized network strategies. These activities may include the management and coordination of the design and network configuration, resource planning, staging, logistics, migration and deployment. We also provide customized training and operational best practices manuals to assist customers in the transition and sustenance of their networks. |
|
|
· |
Education. We offer classes covering a wide range of topics such as installation, configuration, operation, management and optimization – providing customers with the necessary knowledge and experience to successfully deploy and manage our products in various networking environments. Classes may be scheduled and available at numerous locations worldwide. We deliver training using our staff, on-line training classes and authorized training partners. In addition, we make much of our training materials accessible free-of-charge on our internet site for customers and partners to use in self-education. We believe this approach enhances the market’s ability to learn and understand the broad array of advantages of our products. |
Long-Lived Assets
See Note 3 of our Notes to Consolidated Financial Statements in this Annual Report on Form 10-K for more information regarding our long-lived assets.
Manufacturing
We outsource the majority of our manufacturing and supply chain management operations as part of our strategy to maintain global manufacturing capabilities and to reduce our costs. We conduct quality assurance, manufacturing engineering, document control and test development at engineering facilities at Research Triangle Park (“RTP”), North Carolina, Salem, New Hampshire, Toronto, Canada and Chennai, India. This approach enables us to reduce fixed costs and to flexibly respond to changes in market demand. Our end-to-end supply chain, including our three engineering facilities at RTP and Chennai are all ISO 9001 certified.
We use Alpha Networks, Inc. (“Alpha Networks”) headquartered in Hsinchu, Taiwan to design and manufacture our Summit, A-Series, B-Series, C-Series, Stackable products, G-Series, D-Series, I-Series and 800-Series Standalone products and Black Diamond chassis products. Alpha Networks is a global networking Original/Joint Design Manufacturer ("ODM/JDM") leader with core competencies in areas such as Ethernet, LAN/MAN, Wireless, Broadband and VoIP. Alpha Networks manufacturing processes and procedures are ISO 9001 certified.
We use Benchmark Electronics, Inc. ("Benchmark") headquartered in Huntsville, Alabama and Flextronics International ("Flextronics") headquartered in Singapore, to manufacture our S-Series and K-Series chassis products, 7100-Series Stackable products and SSA Standalone products. Benchmark and Flextronics have a significant investment in capital to ensure they have the latest in manufacturing and test technologies and both companies are ISO 9001 certified.
Our wireless access point products are supplied by Senao Electronics ("Senao"), headquartered in Taipei, Taiwan. Senao’s manufacturing processes and procedures are ISO 9001 certified.
11
All of our manufacturers utilize automated testing equipment to perform product testing and burn-in with specified tests. Together we rely upon comprehensive inspection testing and statistical process controls to assure the quality and reliability of our products.
We use a collaborative sales and operations planning forecast of expected demand to determine our material requirements. Lead times for materials and components vary significantly, and depend on factors such as the specific supplier, contract terms and demand for a component at a given time. We order most of our materials and components on an indirect basis through our ODM/JDM, OEMs and contract manufacturers’ (“CMs”). Purchase commitments with all of our manufacturers are generally on a purchase order basis.
Research and Development
The success of our products to date is due in large part to our focus on research and development. We believe that continued success in the marketplace will depend on our ability to develop new and enhanced products employing leading-edge technology. Accordingly, we plan to undertake development efforts with an emphasis on increasing the reliability, performance and features of our family of products, and designing innovative products to reduce the overall network operating costs of customers.
Our product development activities focus on solving the needs of customers in the enterprise campus by providing an end-to-end, wired and wireless network solution from the access edge to the private clouds in targeted verticals. Current activities include the continuing development of our innovative switching technology aimed at extending the capabilities of our products. Our ongoing research activities cover a broad range of areas, including, in particular, 40G and 100G Ethernet, routing, timing and resiliency protocols, open standards interfaces, software defined networks, network security, identity management, data center fabrics, and wireless networking.
We plan to continue to enhance the functionality of our modular operating systems which have been designed to provide high reliability and availability. This allows us to leverage a common operating system across different hardware and network chipsets.
As of June 30, 2016, our research and development organization consisted of 402 employees. Research and development efforts are conducted in several of our locations, including RTP, North Carolina; Salem, New Hampshire, Toronto, Canada and Chennai, India. Our research and development expenses in fiscal years 2016, 2015 and 2014 were $78.7 million, $93.4 million and $77.1 million, respectively.
Intellectual Property
We rely on a combination of patent, copyright, trademark and trade secret laws and restrictions on disclosure to protect our intellectual property rights. As of June 30, 2016, we had 363 issued patents in the United States and 183 patents outside of the United States. The expiration dates of our issued patents in the United States range from 2017 to approximately 2032. Although we have patent applications pending, there can be no assurance that patents will be issued from pending applications or that claims allowed on any future patents will be sufficiently broad to protect our technology. With respect to trademarks, we have a number of pending and registered trademarks in the United States and outside the United States.
We enter into confidentiality, inventions assignment or license agreements with our employees, consultants and other third parties with whom we do business, and control access to, and distribution of, our software, documentation and other proprietary information. In addition, we provide our software products to end-user customers primarily under “shrink-wrap” or "click-through" license agreements. These agreements are not negotiated with or signed by the licensee, and thus these agreements may not be enforceable in some jurisdictions. Despite our efforts to protect our proprietary rights, unauthorized parties may attempt to copy or otherwise obtain and use our products or technology, particularly in foreign countries where the laws may not protect our proprietary rights as fully as in the United States.
Competition
The market for network switches, routers and software (including analytics) which is part of the broader market for networking equipment is extremely competitive and characterized by rapid technological progress, frequent new product introductions, changes in customer requirements and evolving industry standards. We believe the principal competitive factors in this market are:
|
|
· |
expertise and familiarity with network protocols, network switching/routing/wireless and network management; |
|
|
· |
expertise and familiarity with application analytics software; |
|
|
· |
expertise with network operations and management software; |
12
|
|
· |
product performance, features, functionality and reliability; |
|
|
· |
price/performance characteristics; |
|
|
· |
timeliness of new product introductions; |
|
|
· |
adoption of emerging industry standards; |
|
|
· |
customer service and support; |
|
|
· |
size and scope of distribution network; |
|
|
· |
brand name; |
|
|
· |
breadth of product offering; |
|
|
· |
access to customers; and |
|
|
· |
size of installed customer base. |
We believe we compete with our competitors with respect to many of the foregoing factors. However, the market for network switching solutions is dominated by a few large companies, particularly Brocade Communications Systems, Inc., Cisco Systems, Inc., Dell, Hewlett-Packard Company, Huawei Technologies Co. Ltd., and Juniper Networks Inc. Most of these competitors have longer operating histories, greater name recognition, larger customer bases, broader product lines and substantially greater financial, technical, sales, marketing and other resources.
Restructuring
2015 Restructuring Plan Phase 1
During the fourth quarter of fiscal 2015, we initiated a plan to reduce costs through targeted restructuring activities intended to reduce operating costs and realign our organization in the current competitive environment. We initiated a plan to reduce our worldwide headcount by more than 225 employees, primarily in sales and marketing as well as research and development, consolidate specific global administrative functions, and shift certain operating costs to lower cost regions in the United States, among other actions.
Phase 2
During fiscal 2016, we continued our initiative to realign our operations with a second phase by abandoning excess facilities, primarily in San Jose, California; Salem, New Hampshire; Research Triangle Park, North Carolina in addition to other smaller leased locations. The abandoned facilities represented approximately 32% of the floor space in the aggregate at these locations and included general office and warehouse space. There may be additional abandonments of excess facilities in future periods as we further align our organization to our business and operational needs.
Environmental Matters
We are subject to various environmental and other regulations governing product safety, materials usage, packaging and other environmental impacts in the United States and in various countries where our products are manufactured and sold. We are also subject to regulatory developments, including recent SEC disclosure regulations relating to so-called "conflict minerals," relating to ethically responsible sourcing of the components and materials used in our products. To date, compliance with federal, state, local, and foreign laws enacted for the protection of the environment has had no material effect on our capital expenditures, earnings, or competitive position.
We are committed to energy efficiency in our product lines. Accordingly, we believe this is an area that affords us a competitive advantage for our products in the marketplace. We maintain compliance with various regulations related to the environment, including the Waste Electrical and Electronic Equipment and the Restriction of the Use of Certain Hazardous Substances in Electrical and Electronic Equipment regulations adopted by the European Union. To date, our compliance efforts with various United States and foreign regulations related to the environment has not had a material effect on our operating results.
13
Employees
As of June 30, 2016, we employed 1,378 people, including 521 in sales and marketing, 402 in research and development, 174 in operations, 190 in customer support and services, and 91 in finance and administration. We have never had a work stoppage and no U.S. employees are represented under collective bargaining agreements. We consider our employee relations to be good.
We believe our future success depends on our continued ability to attract, integrate, retain, train and motivate highly qualified employees, and upon the continued service of our senior management and key employees. None of our executive officers or key employees is bound by an employment agreement which mandates that the employee render services for any specific term. The market for qualified personnel is highly competitive.
Organization
We were incorporated in California in May 1996, and reincorporated in Delaware in March 1999. Our corporate headquarters are located at 145 Rio Robles, San Jose, CA 95134 and our telephone number is (408) 579-2800. We electronically file our SEC disclosure reports with the SEC and they are available free of charge at both www.sec.gov and www.extremenetworks.com. The public may also read or copy any materials we file with the Securities Exchange Commission at the SEC’s Public Reference Room at Station Place, 100 F Street, N.E., Washington, DC 20549. The public may obtain information on the operation of the Public Reference Room by calling the SEC at 1-800-SEC-0330.
Our corporate governance guidelines, the charters of our audit committee, our compensation committee and our nominating and corporate governance committee and our code of conduct policy (including code of ethics provisions that apply to our principal executive officer, principal financial officer, controller and senior financial officers) are available on our website at www.extremenetworks.com under “Corporate Governance.” These items are also available to any stockholder who requests them by calling (408) 579-2800.
The following is a list of risks and uncertainties which may have a material and adverse effect on our business, operations, industry, financial condition, results of operations or future financial performance. While we believe we have identified and discussed below the key risk factors affecting our business, there may be additional risks and uncertainties that are not presently known or that are not currently believed to be significant that may adversely affect our business, results of operations, industry, financial position and financial performance in the future
We cannot assure you we will be profitable in the future because a number of factors could negatively affect our financial results.
We have reported losses in each of our two most recent fiscal years. In addition, in years when we reported profits, we were not profitable in each quarter during those years. We anticipate continuing to incur significant sales and marketing, product development and general and administrative expenses. Any delay in generating or recognizing revenue could result in a loss for a quarter or full year. Even if we are profitable, our operating results may fall below our expectations and those of our investors, which could cause the price of our stock to fall.
We may experience challenges or delays in generating or recognizing revenue for a number of reasons and our revenue and operating results have varied significantly in the past and may vary significantly in the future due to a number of factors, including, but not limited to, the following:
|
|
· |
we are dependent upon obtaining orders during a quarter and shipping those orders in the same quarter to achieve our revenue objectives; |
|
|
· |
decreases in the prices of the products we sell; |
|
|
· |
the mix of products sold and the mix of distribution channels through which products are sold; |
|
|
· |
acceptance provisions in customer contracts; |
|
|
· |
our ability to deliver installation or inspection services by the end of the quarter; |
|
|
· |
changes in general and/or specific economic conditions in the networking industry; |
|
|
· |
seasonal fluctuations in demand for our products and services; |
14
|
|
· |
a disproportionate percentage of our sales occurring in the last month of the quarter; |
|
|
· |
our ability to ship products by the end of a quarter; |
|
|
· |
reduced visibility into the implementation cycles for our products and our customers’ spending plans; |
|
|
· |
our ability to forecast demand for our products, which in the case of lower-than-expected sales, may result in excess or obsolete inventory in addition to non-cancelable purchase commitments for component parts; |
|
|
· |
sales to the telecommunications service provider market, which represents a significant source of large product orders, are especially volatile and difficult to forecast; |
|
|
· |
product returns or the cancellation or rescheduling of orders; |
|
|
· |
announcements and new product introductions by our competitors; |
|
|
· |
our ability to develop and support relationships with enterprise customers, service providers and other potential large customers; |
|
|
· |
our ability to achieve targeted cost reductions; |
|
|
· |
fluctuations in warranty or other service expenses actually incurred; |
|
|
· |
our ability to obtain sufficient supplies of sole- or limited-source components for our products on a timely basis; and |
|
|
· |
increases in the price of the components we purchase. |
Due to the foregoing factors, period-to-period comparisons of our operating results should not be relied upon as an indicator of our future performance.
The global economic environment has and may continue to negatively impact our business and operating results.
The challenges and uncertainty currently affecting global economic conditions may negatively impact our business and operating results in the following ways:
|
|
· |
customers may delay or cancel plans to purchase our products and services; |
|
|
· |
customers may not be able to pay, or may delay payment of, the amounts they owe us which may adversely affect our cash flow, the timing of our revenue recognition and the amount of revenue; |
|
|
· |
increased pricing pressure may result from our competitors aggressively discounting their products; |
|
|
· |
accurate budgeting and planning will be difficult due to low visibility into future sales; |
|
|
· |
forecasting customer demand will be more difficult, increasing the risk of either excess and obsolete inventory if our forecast is too high or insufficient inventory to meet customer demand if our forecast is too low; and |
|
|
· |
our component suppliers and contract manufacturers have been negatively affected by the economy which may result in product delays and changes in pricing and service levels. |
If global economic conditions do not show continued improvement, we believe we could experience material adverse impacts to our business and operating results.
We depend upon international sales for a significant portion of our revenue which imposes a number of risks on our business.
International sales constitute a significant portion of our net revenue. Our ability to grow will depend in part on the expansion of international sales. Our international sales primarily depend on the success of our resellers and distributors. The failure of these resellers and distributors to sell our products internationally would limit our ability to sustain and grow our revenue. There are a number of risks arising from our international business, including:
|
|
· |
longer accounts receivable collection cycles; |
|
|
· |
difficulties in managing operations across disparate geographic areas; |
|
|
· |
difficulties associated with enforcing agreements through foreign legal systems; |
15
|
|
· |
reduced or limited protection of intellectual property rights, particularly in jurisdictions that have less developed intellectual property regimes, such as China and India; |
|
|
· |
higher credit risks requiring cash in advance or letters of credit; |
|
|
· |
potential adverse tax consequences; |
|
|
· |
compliance with regulatory requirements of foreign countries, including compliance with rapidly evolving environmental regulations; |
|
|
· |
compliance with U.S. laws and regulations pertaining to the sale and distribution of products to customers in foreign countries, including export controls and the Foreign Corrupt Practices Act; |
|
|
· |
the payment of operating expenses in local currencies, which exposes us to risks of currency fluctuations. |
|
|
· |
political and economic turbulence; |
|
|
· |
terrorism, war or other armed conflict; |
|
|
· |
compliance with U.S. and other applicable government regulations prohibiting certain end-uses and restrictions on trade with embargoed or sanctioned countries, such as Russia, and with denied parties; and |
|
|
· |
natural disasters and epidemics; |
Substantially all of our international sales are United States dollar-denominated. The continued strength and future increases in the value of the United States dollar relative to foreign currencies could make our products less competitive in international markets. In the future, we may elect to invoice some of our international customers in local currency, which would expose us to fluctuations in exchange rates between the United States dollar and the particular local currency. If we do so, we may decide to engage in hedging transactions to minimize the risk of such fluctuations.
We have entered into foreign exchange forward contracts to offset the impact of payment of operating expenses in local currencies to some of our operating foreign subsidiaries. However, if we are not successful in managing these foreign currency transactions, we could incur losses from these activities.
We expect the average selling price of our products to decrease, which is likely to reduce gross margin and/or revenue.
The network equipment industry has traditionally experienced an erosion of average selling prices due to a number of factors, including competitive pricing pressures, promotional pricing and technological progress. We anticipate the average selling prices of our products will decrease in the future in response to competitive pricing pressures, excess inventories, increased sales discounts and new product introductions by us or our competitors. We may experience decreases in future operating results due to the erosion of our average selling prices. To maintain our gross margin, we must develop and introduce on a timely basis new products and product enhancements and continually reduce our product costs. Our failure to do so will likely cause our revenue and gross margin to decline.
We may not realize anticipated benefits of past or future acquisitions, divestitures, and strategic investments, and the integration of acquired companies or technologies may negatively impact our business and financial results or dilute the ownership interests of our stockholders.
As part of our business strategy, we review acquisition and strategic investment prospects that we believe would complement our current product offerings, augment our market coverage or enhance our technical capabilities, or otherwise offer growth opportunities. In the event of any future acquisitions, we could:
|
|
· |
issue equity securities which would dilute current stockholders' percentage ownership; |
|
|
· |
incur substantial debt; |
|
|
· |
assume contingent liabilities; or |
|
|
· |
expend significant cash. |
These actions could have a material adverse effect on our operating results or the price of our common stock.
16
Moreover, even if we do obtain benefits in the form of increased sales and earnings, these benefits may be recognized much later than the time when the expenses associated with an acquisition are incurred. This is particularly relevant in cases where it would be necessary to integrate new types of technology into our existing portfolio and new types of products may be targeted for potential customers with which we do not have pre-existing relationships.
Our ability to realize the anticipated benefits our acquisitions and investment activities also entail numerous risks, including, but not limited to:
|
|
· |
difficulties in the assimilation and successful integration of acquired operations, technologies and/or products; |
|
|
· |
unanticipated costs, litigation or other contingent liabilities associated with the acquisition or investment transaction; |
|
|
· |
incurrence of acquisition- and integration-related costs, goodwill or in-process research and development impairment charges, or amortization costs for acquired intangible assets, that could negatively impact our operating results and financial condition; |
|
|
· |
the diversion of management's attention from other business concerns; |
|
|
· |
adverse effects on existing business relationships with suppliers and customers; |
|
|
· |
risks associated with entering markets in which we have no or limited prior experience; |
|
|
· |
the potential loss of key employees of acquired organizations and inability to attract or retain other key employees; and |
|
|
· |
substantial charges for the amortization of certain purchased intangible assets, deferred stock compensation or similar items. |
We may not be able to successfully integrate any businesses, products, technologies, or personnel that we might acquire in the future, and our failure to do so could have a material adverse effect on our business, operating results and financial condition.
Our senior secured credit facilities impose financial and operating restrictions on us.
Our debt instruments impose, and the terms of any future debt may impose, operating and other restrictions on us. These restrictions could affect, and in many respects limit or prohibit, among other items, our ability to:
|
|
· |
incur additional indebtedness; |
|
|
· |
create liens; |
|
|
· |
make investments; |
|
|
· |
enter into transactions with affiliates; |
|
|
· |
sell assets; |
|
|
· |
guarantee indebtedness; |
|
|
· |
declare or pay dividends or other distributions to stockholders; |
|
|
· |
repurchase equity interests; |
|
|
· |
change the nature of our business; |
|
|
· |
enter into swap agreements; |
|
|
· |
issue or sell capital stock of certain of our subsidiaries; and |
|
|
· |
consolidate, merge, or transfer all or substantially all of our assets and the assets of our subsidiaries on a consolidated basis. |
17
The agreements governing our senior secured credit facilities also require us to achieve and maintain compliance with specified financial ratios. A breach of any of these restrictive covenants or the inability to comply with the required financial ratios could result in a default under our debt instruments. If any such default occurs, the lenders under our credit agreement may elect to declare all outstanding borrowings, together with accrued interest and other fees, to be immediately due and payable. The lenders under our credit agreement also have the right in these circumstances to terminate any commitments they have to provide further borrowings. If we are unable to repay outstanding borrowings when due, the lenders under our credit agreement will have the right to proceed against the collateral granted to them to secure the debt. If the debt under our credit agreement were to be accelerated, we cannot give assurance that this collateral would be sufficient to repay our debt.
If we fail to meet our payment or other obligations under our senior secured credit facility, the lenders under such senior secured credit facility could foreclose on, and acquire control of, substantially all of our assets.
Our credit agreement is jointly and severally guaranteed by us and certain of our subsidiaries. Borrowings under our senior secured credit facilities are secured by liens on substantially all of our assets, including the capital stock of certain of our subsidiaries, and the assets of our subsidiaries that are loan party guarantors. If we are unable to repay outstanding borrowings when due, the lenders under our credit agreement will have the right to proceed against this pledged capital stock and take control of substantially all of our assets.
We purchase several key components for products from single or limited sources and could lose sales if these suppliers fail to meet our needs.
We currently purchase several key components used in the manufacturing of our products from single or limited sources and are dependent upon supply from these sources to meet our needs. Certain components such as tantalum capacitors, SRAM, DRAM, and printed circuit boards, have been in the past, and may in the future be, in short supply. We have encountered, and are likely in the future to encounter, shortages and delays in obtaining these or other components, and this could have a material adverse effect on our ability to meet customer orders. Our principal sole-source components include:
|
|
· |
ASICs - merchant silicon, Ethernet switching, custom and physical interface : |
|
|
· |
microprocessors; |
|
|
· |
programmable integrated circuits; |
|
|
· |
selected other integrated circuits; |
|
|
· |
custom power supplies; and |
|
|
· |
custom-tooled sheet metal. |
Our principal limited-source components include:
|
|
· |
flash memory; |
|
|
· |
DRAMs and SRAMs; |
|
|
· |
printed circuit boards; |
|
|
· |
CAMs; |
|
|
· |
Connectors; and |
|
|
· |
Timing circuits (crystals & clocks). |
We use our forecast of expected demand to determine our material requirements. Lead times for materials and components we order vary significantly, and depend on factors such as the specific supplier, contract terms and demand for a component at a given time. If forecasts exceed orders, we may have excess and/or obsolete inventory, which could have a material adverse effect on our operating results and financial condition. If orders exceed forecasts, we may have inadequate supplies of certain materials and components, which could have a material adverse effect on our ability to meet customer delivery requirements and to recognize revenue.
18
Our top ten suppliers accounted for a significant portion of our purchases during the quarter. Given the significant concentration of our supply chain, particularly with certain sole or limited source providers, any significant interruption by any of the key suppliers or a termination of a relationship could temporarily disrupt our operations. Additionally, our operations are materially dependent upon the continued market acceptance and quality of these manufacturers’ products and their ability to continue to manufacture products that are competitive and that comply with laws relating to environmental and efficiency standards. Our inability to obtain products from one or more of these suppliers or a decline in market acceptance of these suppliers’ products could have a material adverse effect on our results of operations, cash flows and liquidity.
Generally, we do not have agreements fixing long-term prices or minimum volume requirements from suppliers. From time to time we have experienced shortages and allocations of certain components, resulting in delays in filling orders. Qualifying new suppliers to compensate for such shortages may be time-consuming and costly, and may increase the likelihood of errors in design or production. In addition, during the development of our products, we have experienced delays in the prototyping of our chipsets, which in turn has led to delays in product introductions. Similar delays may occur in the future. Furthermore, the performance of the components as incorporated in our products may not meet the quality requirements of our customers.
Intense competition in the market for networking equipment could prevent us from increasing revenue and attaining profitability.
The market for network switching solutions is intensely competitive and dominated primarily by Brocade Communications Systems, Inc., Cisco Systems Inc., Dell, Hewlett-Packard Company, Huawei Technologies Co. Ltd., and Juniper Networks, Inc. Most of our competitors have longer operating histories, greater name recognition, larger customer bases, broader product lines and substantially greater financial, technical, sales, marketing and other resources. As a result, these competitors are able to devote greater resources to the development, promotion, sale and support of their products. In addition, they have larger distribution channels, stronger brand names, access to more customers, a larger installed customer base and a greater ability to make attractive offers to channel partners and customers than we do. Some of our customers may question whether we have the financial resources to complete their projects and future service commitments.
For example, we have encountered, and expect to continue to encounter in the future, many potential customers who are confident in and committed to the product offerings of our principal competitors. Accordingly, these potential customers may not consider or evaluate our products. When such potential customers have considered or evaluated our products, we have in the past lost, and expect in the future to lose, sales to some of these customers as large competitors have offered significant price discounts to secure these sales.
The pricing policies of our competitors impact the overall demand for our products and services. Some of our competitors are capable of operating at significant losses for extended periods of time, increasing pricing pressure on our products and services. If we do not maintain competitive pricing, the demand for our products and services, as well as our market share, may decline. From time to time, we may lower the prices of our products and services in response to competitive pressure. When this happens, if we are unable to reduce our component costs or improve operating efficiencies, our revenue and gross margins will be adversely affected.
We may not fully realize the anticipated positive impacts to future financial results from our restructuring efforts.
We have undertaken restructuring efforts in the past to streamline operations and reduce operating expenses. Our ability to achieve the anticipated cost savings and other benefits from our restructuring efforts within expected time frames is subject to many estimates and assumptions, and may vary materially based on factors such as market conditions and the effect of our restructuring efforts on our work force. These estimates and assumptions are subject to significant economic, competitive and other uncertainties, some of which are beyond our control. There can be no assurance that we will fully realize the anticipated positive impacts to future financial results from our current or future restructuring efforts. If our estimates and assumptions are incorrect or if other unforeseen events occur, we may not achieve the cost savings expected from such restructurings, and our business and results of operations could be adversely affected.
19
Industry consolidation may lead to stronger competition and may harm our operating results.
There has been a trend toward industry consolidation in our markets for several years. We expect this trend to continue as companies attempt to strengthen or hold their market positions in an evolving industry and as companies are acquired or are unable to continue operations. For example, some of our current and potential competitors for enterprise data center business have made acquisitions, or announced new strategic alliances, designed to position them with the ability to provide end-to-end technology solutions for the enterprise data center. Companies that are strategic alliance partners in some areas of our business may acquire or form alliances with our competitors, thereby reducing their business with us. We believe industry consolidation may result in stronger competitors that are better able to compete as sole-source vendors for customers. This could lead to more variability in our operating results and could have a material adverse effect on our business, operating results, and financial condition. Furthermore, particularly in the service provider market, rapid consolidation will lead to fewer customers, with the effect that loss of a major customer could have a material impact on results not anticipated in a customer marketplace composed of more numerous participants.
We intend to invest in engineering, sales, services, marketing and manufacturing on a long term basis, and delays or inability to attain the expected benefits may result in unfavorable operating results.
While we intend to focus on managing our costs and expenses, over the long term, we also intend to invest in personnel and other resources related to our engineering, sales, services, marketing and manufacturing functions as we focus on our foundational priorities, such as leadership in our core products and solutions and architectures for business transformation. We are likely to recognize the costs associated with these investments earlier than some of the anticipated benefits and the return on these investments may be lower, or may develop more slowly, than we expect. If we do not achieve the benefits anticipated from these investments, or if the achievement of these benefits is delayed, our operating results may be adversely affected.
Our success is dependent on our ability to continually introduce new products and features that achieve broad market acceptance.
The network equipment market is characterized by rapid technological progress, frequent new product introductions, changes in customer requirements and evolving industry standards. If we do not regularly introduce new products in this dynamic environment, our product lines will become obsolete. These new products must be compatible and inter-operate with products and architectures offered by other vendors. We have and may in the future experience delays in product development and releases, and such delays have and could in the future adversely affect our ability to compete and our operating results.
When we announce new products or product enhancements or end of sale existing products that have the potential to replace or shorten the life cycle of our existing products, customers may defer or cancel orders for our existing products. These actions could have a material adverse effect on our operating results by unexpectedly decreasing sales, increasing inventory levels of older products and exposing us to greater risk of product obsolescence.
Even if we introduce new switching products, alternative technologies could achieve widespread market acceptance and displace the Ethernet technology on which we have based our product architecture. For example, developments in routers and routing software could significantly reduce demand for our products. As a result, we may not be able to achieve widespread market acceptance of our current or future products.
If we do not successfully anticipate technological shifts, market needs and opportunities, and develop products and product enhancements that meet those technological shifts, needs and opportunities, or if those products are not made available in a timely manner or do not gain market acceptance, we may not be able to compete effectively and our ability to generate revenues will suffer.
We cannot guarantee that we will be able to anticipate future technological shifts, market needs and opportunities or be able to develop new products or product enhancements to meet such technological shifts, needs or opportunities in a timely manner or at all. For example, the move from traditional network infrastructures towards SDN has been receiving considerable attention. In our view, it will take several years to see the full impact of SDN, and we believe the successful products and solutions in this market will combine hardware and software elements together. If we fail to anticipate market requirements or fail to develop and introduce new products or product enhancements to meet those needs in a timely manner, it could cause us to lose customers, and such failure could substantially decrease or delay market acceptance and sales of our present and future products, which would significantly harm our business, financial condition, and results of operations. Even if we are able to anticipate, develop, and commercially introduce new products and enhancements, there can be no assurance that new products or enhancements will achieve widespread market acceptance.
20
The cloud networking market is still in its early stages and is rapidly evolving. If this market does not evolve as we anticipate or our target end customers do not adopt our cloud networking solutions, we may not be able to compete effectively, and our ability to generate revenue will suffer.
The cloud networking market is still in its early stages. The market demand for cloud networking solutions has increased in recent years as end customers have deployed larger networks and have increased the use of virtualization and cloud computing. Our success may be impacted by our ability to provide successful cloud networking solutions that address the needs of our channel partners and end customers more effectively and economically than those of other competitors or existing technologies. If the cloud networking solutions market does not develop in the way we anticipate, if our solutions do not offer significant benefits compared to competing legacy network switching products or if end customers do not recognize the benefits that our solutions provide, then our potential for growth in this cloud market could be adversely affected.
Claims of infringement by others may increase and the resolution of such claims may adversely affect our operating results.
Our industry is characterized by the existence of a large number of patents and frequent claims and related litigation regarding patents, copyrights (including rights to “open source” software), and other intellectual property rights. Because of the existence of a large number of patents in the networking field, the secrecy of some pending patents and the issuance of new patents at a rapid pace, it is not possible to determine in advance if a product or component might infringe the patent rights of others. Because of the potential for courts awarding substantial damages, the lack of predictability of such awards, and the high legal costs associated with the defense of such patent infringement matters that would be expended to prove lack of infringement, it is not uncommon for companies in our industry to settle even potentially unmeritorious claims for very substantial amounts. Furthermore, the entities with whom we have or could have disputes or discussions include entities with extensive patent portfolios and substantial financial assets. These entities are actively engaged in programs to generate substantial revenue from their patent portfolios and are seeking or may seek significant payments or royalties from us and others in our industry.
Litigation resulting from claims that we are infringing the proprietary rights of others has resulted and could in the future result in substantial costs and a diversion of resources, and could have a material adverse effect on our business, financial condition and results of operations. We previously received notices from entities alleging that we were infringing their patents, and have been party to patent litigation in the past.
Without regard to the merits of these or any other claims, an adverse court order or a settlement could require us, among other actions, to:
|
|
· |
stop selling our products that incorporate the challenged intellectual property; |
|
|
· |
obtain a royalty bearing license to sell or use the relevant technology, and that license may not be available on reasonable terms or available at all; |
|
|
· |
pay damages; |
|
|
· |
redesign those products that use the disputed technology; or |
|
|
· |
face a ban on importation of our products into the United States. |
In addition, our products include so-called “open source” software. Open source software is typically licensed for use at no initial charge, but imposes on the user of the open source software certain requirements to license to others both the open source software as well as modifications to the open source software under certain circumstances. Our use of open source software subjects us to certain additional risks for the following reasons:
|
|
· |
open source license terms may be ambiguous and may result in unanticipated obligations regarding the licensing of our products and intellectual property; |
|
|
· |
open source software cannot be protected under trade secret law; |
|
|
· |
suppliers of open-source software do not provide the warranty, support and liability protections typically provided by vendors who offer proprietary software; and |
|
|
· |
it may be difficult for us to accurately determine the developers of the open source code and whether the acquired software infringes third-party intellectual property rights. |
21
We believe even if we do not infringe the rights of others, we will incur significant expenses in the future due to defense of legal claims, disputes or licensing negotiations, though the amounts cannot be determined. These expenses may be material or otherwise adversely affect our operating results.
Our operating results may be negatively affected by defending or pursuing claims or lawsuits.
We have in the past, currently are and will likely in the future pursue or be subject to claims or lawsuits in the normal course of our business. In addition to the risks related to the intellectual property lawsuits described above, we are currently parties to other litigation as described in Part II, Item 8. Financial Statements and Supplementary Data. Regardless of the result, litigation can be expensive, lengthy and disruptive to normal business operations. Moreover, the results of complex legal proceedings are difficult to predict. An unfavorable resolution of a lawsuit in which we are a defendant could result in a court order against us or payments to other parties that would have an adverse affect on our business, results of operations or financial condition. Even if we are successful in prosecuting claims and lawsuits, we may not recover damages sufficient to cover our expenses incurred to manage, investigate and pursue the litigation. In addition, subject to certain limitations, we may be obligated to indemnify our current and former customers, suppliers, directors, officers and employees in certain lawsuits. We may not have adequate insurance coverage to cover all of our litigation costs and liabilities.
If we fail to protect our intellectual property, our business could suffer.
We rely on a combination of patent, copyright, trademark and trade secret laws and restrictions on disclosure to protect our intellectual property rights. However, we cannot ensure that the actions we have taken will adequately protect our intellectual property rights or that other parties will not independently develop similar or competing products that do not infringe on our patents. We generally enter into confidentiality, invention assignment or license agreements with our employees, consultants and other third parties with whom we do business, and control access to and distribution of our intellectual property and other proprietary information. Despite our efforts to protect our proprietary rights, unauthorized parties may attempt to copy or otherwise misappropriate or use our products or technology, which would adversely affect our business.
When our products contain undetected errors, we may incur significant unexpected expenses and could lose sales.
Network products frequently contain undetected errors when new products or new versions or updates of existing products are released to the marketplace. In the past, we have experienced such errors in connection with new products and product updates. We have experienced component problems in prior years that caused us to incur higher than expected warranty, service costs and expenses, and other related operating expenses. In the future, we expect that, from time to time, such errors or component failures will be found in new or existing products after the commencement of commercial shipments. These problems may have a material adverse effect on our business by causing us to incur significant warranty, repair and replacement costs, diverting the attention of our engineering personnel from new product development efforts, delaying the recognition of revenue and causing significant customer relations problems. Further, if products are not accepted by customers due to such defects, and such returns exceed the amount we accrued for defective returns based on our historical experience, our operating results would be adversely affected.
Our products must successfully inter-operate with products from other vendors. As a result, when problems occur in a network, it may be difficult to identify the sources of these problems. The occurrence of system errors, whether or not caused by our products, could result in the delay or loss of market acceptance of our products and any necessary revisions may cause us to incur significant expenses. The occurrence of any such problems would likely have a material adverse effect on our business, operating results and financial condition.
Our dependence on a few manufacturers for our manufacturing requirements could harm our operating results.
We primarily rely on our manufacturing partners; Alpha Networks, Inc. headquartered in Hsinchu, Taiwan; Senao Networks, Inc. headquartered in Taoyuan, Taiwan; Benchmark Electronics headquartered in Huntsville, Alabama and select other partners to manufacture our products. We have experienced delays in product shipments from our manufacturing partners in the past, which in turn delayed product shipments to our customers. These or similar problems may arise in the future, such as delivery of products of inferior quality, delivery of insufficient quantity of products, or the interruption or discontinuance of operations of a manufacturer, any of which could have a material adverse effect on our business and operating results. In addition, any natural disaster or business interruption to our manufacturing partners could significantly disrupt our business. While we maintain strong relationships with our manufacturing partners, our agreements with these manufacturers are generally of limited duration and pricing, quality and volume commitments are negotiated on a recurring basis. The failure to maintain continuing agreements with our manufacturing partners could adversely affect our business. We intend to introduce new products and product enhancements, which will require that we rapidly achieve volume production by coordinating our efforts with those of our suppliers and contract manufacturers.
22
As part of our cost-reduction efforts, we will need to realize lower per unit product costs from our manufacturing partners by means of volume efficiencies and the utilization of manufacturing sites in lower-cost geographies. However, we cannot be certain when or if such price reductions will occur. The failure to obtain such price reductions would adversely affect our operating results.
We must continue to develop and increase the productivity of our indirect distribution channels to increase net revenue and improve our operating results.
Our distribution strategy focuses primarily on developing and increasing the productivity of our indirect distribution channels. If we fail to develop and cultivate relationships with significant channel partners, or if these channel partners are not successful in their sales efforts, sales of our products may decrease and our operating results could suffer. Many of our channel partners also sell products from other vendors that compete with our products. Our channel partners may not continue to market or sell our products effectively or to devote the resources necessary to provide us with effective sales, marketing and technical support. We may not be able to successfully manage our sales channels or enter into additional reseller and/or distribution agreements. Our failure to do any of these could limit our ability to grow or sustain revenue.
Our operating results for any given period have and will continue to depend to a significant extent on large orders from a relatively small number of channel partners and other customers. For example, sales through our top three distributors accounted for 46% of our net sales in the third quarter of fiscal 2016. However, we do not have binding purchase commitments from any of them. A substantial reduction or delay in sales of our products to a significant reseller, distributor or other customer could harm our business, operating results and financial condition because our expense levels are based on our expectations as to future revenue and to a large extent are fixed in the short term. Under specified conditions, some third-party distributors are allowed to return products to us and unexpected returns could adversely affect our results.
The sales cycle for our products is long and we may incur substantial non-recoverable expenses or devote significant resources to sales that do not occur when anticipated.
The purchase of our products represent a significant strategic decision by a customer regarding its communications infrastructure. The decision by customers to purchase our products is often based on the results of a variety of internal procedures associated with the evaluation, testing, implementation and acceptance of new technologies. Accordingly, the product evaluation process frequently results in a lengthy sales cycle, typically ranging from three months to longer than a year, and as a result, our ability to sell products is subject to a number of significant risks, including risks that:
|
|
· |
budgetary constraints and internal acceptance reviews by customers will result in the loss of potential sales; |
|
|
· |
there may be substantial variation in the length of the sales cycle from customer to customer, making decisions on the expenditure of resources difficult to assess; |
|
|
· |
we may incur substantial sales and marketing expenses and expend significant management time in an attempt to initiate or increase the sale of products to customers, but not succeed; |
|
|
· |
if a sales forecast from a specific customer for a particular quarter is not achieved in that quarter, we may be unable to compensate for the shortfall, which could harm our operating results; and |
|
|
· |
downward pricing pressures could occur during the lengthy sales cycle for our products. |
Our revenues may decline as a result of changes in public funding of educational institutions.
A portion of our revenues comes from sales to both public and private K-12 educational institutions. Public schools receive funding from local tax revenue, and from state and federal governments through a variety of programs, many of which seek to assist schools located in underprivileged or rural areas. The funding for a portion of our sales to educational institutions comes from a federal funding program known as the E-Rate program. E-Rate is a program of the Federal Communications Commission that subsidizes the purchase of approved telecommunications, Internet access, and internal connection costs for eligible public educational institutions. The E-Rate program, its eligibility criteria, the timing and specific amount of federal funding actually available and which Wi-Fi infrastructure and product sectors will benefit, are uncertain and subject to final federal program approval and funding appropriation continues to be under review by the Federal Communications Commission and there can be no assurance that this program or its equivalent will continue, and as a result, our business may be harmed. Furthermore, if state or local funding of public education is significantly reduced because of legislative or policy changes or by reductions in tax revenues due to changing economic conditions, our sales to educational institutions may be negatively impacted by these changed conditions. Any reduction in spending on information technology systems by educational institutions would likely materially and adversely affect our business and results of operations. This is a specific example of the many factors which add additional uncertainty to our future revenue from our education end-customers.
23
To successfully manage our business or achieve our goals, we must attract, retain, train, motivate, develop and promote key employees, and failure to do so can harm us.
Our success depends to a significant degree upon the continued contributions of our key management, engineering, sales and marketing, service and operations personnel, many of whom would be difficult to replace. We do not have employment contracts with these individuals that mandate that they render services for any specific term, nor do we carry life insurance on any of our key personnel. We have experienced and may in the future experience significant turnover in our executive personnel. In addition, retention has generally become more difficult for us, in part because the exercise price of most of the stock options granted to many of our employees is above the market price. As a result, we experienced high levels of attrition. We believe our future success will also depend in large part upon our ability to attract and retain highly skilled managerial, engineering, sales and marketing, service, finance and operations personnel. The market for these personnel is competitive, and we have had difficulty in hiring employees, particularly engineers, in the time-frame we desire.
Companies in the networking industry whose employees accept positions with competitors frequently claim that competitors have engaged in unfair hiring practices. We have from time to time been involved in claims like this with other companies and, although to date they have not resulted in material litigation, we do not know whether we will be involved in additional claims in the future. We could incur substantial costs in litigating any such claims, regardless of the merits.
Failure to successfully expand our sales and support teams or educate them in regard to technologies and our product families may harm our operating results.
The sale of our products and services requires a concerted effort that is frequently targeted at several levels within a prospective customer's organization. We may not be able to increase net revenue unless we expand our sales and support teams in order to address all of the customer requirements necessary to sell our products.
We cannot assure you that we will be able to successfully integrate employees into our company or to educate and train current and future employees in regard to rapidly evolving technologies and our product families. A failure to do so may hurt our revenue growth and operating results.
Failure of our products to comply with evolving industry standards and complex government regulations may adversely impact our business.
If we do not comply with existing or evolving industry standards and government regulations, we may not be able to sell our products where these standards or regulations apply. The network equipment industry in which we compete is characterized by rapid changes in technology and customers' requirements and evolving industry standards. As a result, our success depends on:
|
|
· |
the timely adoption and market acceptance of industry standards, and timely resolution of conflicting U.S. and international industry standards; and |
|
|
· |
our ability to influence the development of emerging industry standards and to introduce new and enhanced products that are compatible with such standards. |
In the past, we have introduced new products that were not compatible with certain technological standards, and in the future, we may not be able to effectively address the compatibility and interoperability issues that arise as a result of technological changes and evolving industry standards.
Our products must also comply with various U.S. federal government regulations and standards defined by agencies such as the Federal Communications Commission, standards established by governmental authorities in various foreign countries and recommendations of the International Telecommunication Union. In some circumstances, we must obtain regulatory approvals or certificates of compliance before we can offer or distribute our products in certain jurisdictions or to certain customers. Complying with new regulations or obtaining certifications can be costly and disruptive to our business.
If we do not comply with existing or evolving industry standards or government regulations, we will not be able to sell our products where these standards or regulations apply, which may prevent us from sustaining our net revenue or achieving profitability.
24
If we do not adequately manage and evolve our financial reporting and managerial systems and processes, our ability to manage and grow our business may be harmed.
Our ability to successfully implement our business plan and comply with regulations requires an effective planning and management process. We need to continue improving our existing, and implement new, operational and financial systems, procedures and controls. We need to ensure that any businesses acquired are appropriately integrated in our financial systems. Any delay in the implementation of, or disruption in the integration of acquired businesses, or delay and disruption in the transition to, new or enhanced systems, procedures or controls, could harm our ability to record and report financial and management information on a timely and accurate basis, or to forecast future results.
Changes in the effective tax rate including from the release of the valuation allowance recorded against our net U.S. deferred tax assets, or adverse outcomes resulting from examination of our income or other tax returns or change in ownership, could adversely affect our results.
Our future effective tax rates may be volatile or adversely affected by changes in our business or U.S. or foreign tax laws, including: the partial or full release of the valuation allowance recorded against our net U.S. deferred tax assets; expiration of or lapses in the research and development tax credit laws; transfer pricing adjustments; tax effects of stock-based compensation; or costs related to restructuring. In addition, we are subject to the examination of our income tax returns by the Internal Revenue Service and other tax authorities. Although we regularly assess the likelihood of adverse outcomes resulting from these examinations to determine the adequacy of our provision for income taxes, there is no assurance that such determinations by us are in fact adequate. Changes in our effective tax rates or amounts assessed upon examination of our tax returns may have a material, adverse impact on our cash flows and our financial condition.
Our future effective tax rate in particular could be adversely affected by a change in ownership pursuant to U.S. Internal Revenue Code Section 382. If a change in ownership occurs, it may limit our ability to utilize our net operating losses to offset our U.S. taxable income. If U.S. taxable income is greater than the change in ownership limitation, we will pay a higher rate of tax with respect to the amount of taxable income that exceeds the limitation. This could have a material adverse impact on our results of operations. On April 26, 2012, we adopted an Amended and Restated Rights Agreement to help protect our assets (the “Rights Agreement”). In general, this does not allow a stockholder to acquire more than 4.95% of our outstanding common stock without a waiver from our board of directors, who must take into account the relevant tax analysis relating to potential limitation of our net operating losses. The Rights Agreement is effective through May 31, 2017.
Provisions in our charter documents and Delaware law and our adoption of a stockholder rights plan may delay or prevent an acquisition of Extreme, which could decrease the value of our Common Stock.
Our certificate of incorporation and bylaws and Delaware law contain provisions that could make it more difficult for a third party to acquire us without the consent of our Board of Directors. Delaware law also imposes some restrictions on mergers and other business combinations between us and any holder of 15% or more of our outstanding common stock. In addition, our Board of Directors has the right to issue preferred stock without stockholder approval, which could be used to dilute the stock ownership of a potential hostile acquirer. Although we believe these provisions of our certificate of incorporation and bylaws and Delaware law will provide for an opportunity to receive a higher bid by requiring potential acquirers to negotiate with our Board of Directors, these provisions apply even if the offer may be considered beneficial by some of our stockholders.
Our Rights Agreement provides that if a single stockholder (or group) acquires more than 4.95% of our outstanding common stock without a waiver from our Board of Directors, each holder of one share of our common stock (other than the stockholder or group who acquired in excess of 4.95% of our common stock) may purchase a fractional share of our preferred stock that would result in substantial dilution to the triggering stockholder or group. Accordingly, although this plan is designed to prevent any limitation on the utilization of our net operating losses by avoiding issues raised under Section 382 of the U.S. Internal Revenue Code, the Rights Agreement could also serve as a deterrent to stockholders wishing to effect a change of control.
Compliance with laws, rules and regulations relating to corporate governance and public disclosure may result in additional expenses.
Federal securities laws, rules and regulations, as well as NASDAQ Stock Market rules and regulations, require companies to maintain extensive corporate governance measures, impose comprehensive reporting and disclosure requirements, set strict independence and financial expertise standards for audit and other committee members and impose civil and criminal penalties for companies and their Chief Executive Officers, Chief Financial Officers and directors for securities law violations. These laws, rules and regulations and the interpretation of these requirements are evolving, and we are making investments to evaluate current practices and to continue to achieve compliance, which investments may have a material impact on the Company’s financial condition.
25
Our headquarters and some significant supporting businesses are located in Northern California and other areas subject to natural disasters that could disrupt our operations and harm our business.
Our corporate headquarters are located in Silicon Valley in Northern California. Historically, this region as well as our R&D centers in North Carolina and New Hampshire have been vulnerable to natural disasters and other risks, such as earthquakes, fires, floods and tropical storms, which at times have disrupted the local economy and posed physical risks to our property. We have contract manufacturers located in Taiwan where similar natural disasters and other risks may disrupt the local economy and pose physical risks to our property and the property of our contract manufacturer.
In addition, the continued threat of terrorism and heightened security and military action in response to this threat, or any future acts of terrorism, may cause further disruptions to the economies of the U.S. and other countries. If such disruptions result in delays or cancellations of customer orders for our products, our business and operating results will suffer.
We currently do not have redundant, multiple site capacity in the event of a natural disaster, terrorist act or other catastrophic event. In the event of such an occurrence, our business would suffer.
Our stock price has been volatile in the past and our stock price may significantly fluctuate in the future.
In the past, our common stock price has fluctuated significantly. This could continue as we or our competitors announce new products, our results or those of our customers or competition fluctuate, conditions in the networking or semiconductor industry change, or when investors, change their sentiment toward stocks in the networking technology sector.
In addition, fluctuations in our stock price and our price-to-earnings multiple may make our stock attractive to momentum, hedge or day-trading investors who often shift funds into and out of stock rapidly, exacerbating price fluctuations in either direction, particularly when viewed on a quarterly basis.
We rely on the availability of third-party licenses.
Some of our products are designed to include software or other intellectual property, including open source software, licensed from third parties. It may be necessary in the future to seek or renew licenses relating to various aspects of these products. There can be no assurance that the necessary licenses would be available on acceptable terms, if at all. The inability to obtain certain licenses or other rights or to obtain such licenses or rights on favorable terms, could have a material adverse effect on our business, operating results, and financial condition. Moreover, the inclusion in our products of software or other intellectual property licensed from third parties on a nonexclusive basis could limit our ability to protect our proprietary rights in our products. Further, the failure to comply with the terms of any license, including free open source software, may result in our inability to continue to use such license. Our inability to maintain or re-license any third-party licenses required in our products or our inability to obtain third-party licenses necessary to develop new products and product enhancements, could require us, if possible, to develop substitute technology or obtain substitute technology of lower quality or performance standards or at a greater cost, any of which could delay or prevent product shipment and harm our business, financial condition, and results of operations.
System security risks, data protection breaches, and cyber-attacks could compromise our proprietary information, disrupt our internal operations and harm public perception of our products, which could adversely affect our business.
In the ordinary course of business, we store sensitive data, including intellectual property, our proprietary business information and that of our customers, suppliers and business partners on our networks. The secure maintenance of this information is critical to our operations and business strategy. Increasingly, companies, including Extreme Networks, are subject to a wide variety of attacks on their networks on an ongoing basis. Despite our security measures, Extreme Networks' information technology and infrastructure may be vulnerable to penetration or attacks by computer programmers and hackers, or breached due to employee error, malfeasance or other disruptions. Any such breach could compromise our networks, creating system disruptions or slowdowns and exploiting security vulnerabilities of our products, and the information stored on our networks could be accessed, publicly disclosed, lost or stolen, which could subject us to liability to our customers, suppliers, business partners and others, and cause us reputational and financial harm. In addition, sophisticated hardware and operating system software and applications that we produce or procure from third parties may contain defects in design or manufacture, including "bugs" and other problems that could unexpectedly interfere with the operation of our networks.
26
If an actual or perceived breach of network security occurs in our network or in the network of a customer of our networking products, regardless of whether the breach is attributable to our products, the market perception of the effectiveness of our products could be harmed. In addition, the economic costs to us to eliminate or alleviate cyber or other security problems, bugs, viruses, worms, malicious software systems and security vulnerabilities could be significant and may be difficult to anticipate or measure. Because the techniques used by computer programmers and hackers, many of whom are highly sophisticated and well-funded, to access or sabotage networks change frequently and generally are not recognized until after they are used, we may be unable to anticipate or immediately detect these techniques. This could impede our sales, manufacturing, distribution or other critical functions, which could adversely affect our business.
Market conditions and changes in the industry could lead to discontinuation of our products or businesses resulting in asset impairments.
In response to changes in industry and market conditions, we may be required to strategically realign our resources and consider restructuring, disposing of, or otherwise exiting businesses. Any decision to limit investment in or dispose of or otherwise exit businesses may result in the recording of special charges, such as inventory and technology-related write-offs, workforce reduction costs, charges relating to consolidation of excess facilities, or claims from third parties who were resellers or users of discontinued products. Our estimates with respect to the useful life or ultimate recoverability of our carrying basis of assets, including purchased intangible assets, could change as a result of such assessments and decisions. Although in certain instances, our supply agreements allow us the option to cancel, reschedule, and adjust our requirements based on our business needs prior to firm orders being placed, our loss contingencies may include liabilities for contracts that we cannot cancel with contract manufacturers and suppliers. Further, our estimates relating to the liabilities for excess facilities are affected by changes in real estate market conditions.
If our products do not effectively inter-operate with our customers’ networks and result in cancellations and delays of installations our business could be harmed.
Our products are designed to interface with our customers’ existing networks, each of which have different specifications and utilize multiple protocol standards and products from other vendors. Many of our customers’ networks contain multiple generations of products that have been added over time as these networks have grown and evolved. Our products must inter-operate with many or all of the products within these networks as well as future products in order to meet our customers’ requirements. If we find errors in the existing software or defects in the hardware used in our customers’ networks, we may need to modify our software networking solutions to fix or overcome these errors so that our products will inter-operate and scale with the existing software and hardware, which could be costly and could negatively affect our business, financial condition, and results of operations. In addition, if our products do not inter-operate with those of our customers’ networks, demand for our products could be adversely affected or orders for our products could be canceled. This could hurt our operating results, damage our reputation, and seriously harm our business and prospects.
Regulations related to conflict minerals may cause us to incur additional expenses and could limit the supply and increase the costs of certain metals used in the manufacturing of our products.
As a public company, we are subject to requirements under the Dodd-Frank Wall Street Reform and Consumer Protection Act of 2010, or the Dodd-Frank Act, and the regulations adopted by the SEC as a result of the Dodd-Frank Act, that will require us to perform certain reasonable country of origin inquiry and diligence exercises, and disclose and report on our diligence process and efforts to ascertain whether or not our products may contain “conflict minerals” mined from the Democratic Republic of the Congo or adjoining countries. The implementation of these new requirements could adversely affect the sourcing, availability and pricing of the materials used in the manufacture of components used in our products. In addition, we will incur additional costs to comply with these disclosure requirements, including costs related to conducting ongoing diligence procedures and, if applicable, potential changes to products, processes or sources of supply as a consequence of such activities. We may also face reputational harm if we determine that certain of our products contain minerals not determined to be conflict-free or if we are unable to alter our products, processes or sources of supply to avoid such materials. In such an event, we may also face difficulties in satisfying customers if we are unable to verify that any conflict minerals used in our products are not sourced from the covered countries or are not done so by conflict free certified refiners and smelters.
We have liabilities for real estate leases in excess of what is necessary for our current business.
We have real estate leases that we are currently trying to sublease or that we have had to write-off their cost. Until such time that we are able to sublease these properties, or the current leases expire, we may incur financial liabilities for real estate leases significantly in excess of what is necessary for our current business.
27
The results of the United Kingdom's referendum on withdrawal from the European Union may have a negative effect on global economic conditions, financial markets and our business.
In June 2016, a majority of voters in the United Kingdom elected to withdraw from the European Union in a national referendum. The referendum was advisory, and the terms of any withdrawal are subject to a negotiation period that could last at least two years after the government of the United Kingdom formally initiates a withdrawal process. Nevertheless, the referendum has created significant uncertainty about the future relationship between the United Kingdom and the European Union, including with respect to the laws and regulations that will apply as the United Kingdom determines which European Union laws to replace or replicate in the event of a withdrawal. The referendum has also given rise to calls for the governments of other European Union member states to consider withdrawal. These developments, or the perception that any of them could occur, have had and may continue to have a material adverse effect on global economic conditions and the stability of global financial markets, and may significantly reduce global market liquidity and restrict the ability of key market participants to operate in certain financial markets. Any of these factors could depress economic activity and restrict our access to capital, which could have a material adverse effect on our business, financial condition and results of operations and reduce the price of our securities.
Item 1B. Unresolved Staff Comments
None.
We started leasing our current headquarters, which is located in San Jose, California, in June 2013. We also lease office space and executive suites in various other geographic locations domestically and internationally for research & development, sales and service personnel and administration. Our aggregate lease expense for fiscal year 2016 was $8.5 million.
At June 30, 2016, the significant facilities that we leased were as follows:
|
Location |
|
Use |
|
Size |
|
|
|
|
|
|
|
(in square feet) |
|
|
|
San Jose, California |
|
Principal administrative, sales and marketing facilities |
|
|
57,600 |
|
|
Research Triangle Park, North Carolina |
|
Research and development, sales and administrative offices |
|
|
54,530 |
|
|
Salem, New Hampshire |
|
Research and development, sales and marketing and administrative offices |
|
|
197,300 |
|
|
Chennai, India |
|
Research and development facilities |
|
|
43,839 |
|
|
Shannon, Ireland |
|
Administrative offices |
|
|
26,100 |
|
The information set forth under the heading “Legal Proceedings” in Note 5, Commitments, Contingencies and Leases, in Notes to Consolidated Financial Statements in Item 8 of Part II of this Annual Report on Form 10-K, is incorporated herein by reference.
Item 4. Mine Safety Disclosures
Not Applicable
28
Item 5. Market for Registrant’s Common Equity, Related Stockholder Matters and Issuer Purchases of Equity Securities
Common Stock Market Prices and Dividends
Our common stock trades on the NASDAQ Global Market and commenced trading on NASDAQ on April 9, 1999 under the symbol “EXTR.” The following table sets forth the high and low sales prices as reported by NASDAQ. Such prices represent prices between dealers, do not include retail mark-ups, mark-downs or commissions and may not represent actual transactions.
|
Stock Prices |
|
High |
|
|
Low |
|
||
|
Fiscal year ended June 30, 2016: |
|
|
|
|
|
|
|
|
|
First quarter |
|
$ |
3.56 |
|
|
$ |
2.13 |
|
|
Second quarter |
|
$ |
4.42 |
|
|
$ |
3.34 |
|
|
Third quarter |
|
$ |
3.99 |
|
|
$ |
2.35 |
|
|
Fourth quarter |
|
$ |
3.78 |
|
|
$ |
3.08 |
|
|
Fiscal year ended June 30, 2015: |
|
|
|
|
|
|
|
|
|
First quarter |
|
$ |
5.38 |
|
|
$ |
4.24 |
|
|
Second quarter |
|
$ |
4.85 |
|
|
$ |
3.01 |
|
|
Third quarter |
|
$ |
3.60 |
|
|
$ |
2.70 |
|
|
Fourth quarter |
|
$ |
3.25 |
|
|
$ |
2.41 |
|
As of August 22, 2016, there were 217 stockholders of record of our common stock. Because many of our shares of common stock are held by brokers and other institutions on behalf of stockholders, we are unable to estimate the total number of stockholders represented by these record holders. We have never declared or paid cash dividends on our capital stock and do not anticipate paying any cash dividends in the foreseeable future.
We had authority granted by our Board of Directors to repurchase up to $75 million which were to be purchased over a three year period starting October 1, 2012 and ending on October 1, 2015. Since the inception of the program, 4.1 million shares of common stock have been repurchased at a total purchase price of $14.5 million, none of which was repurchased in fiscal 2015 or 2016.
Certain information regarding our equity compensation plan(s) as required by Part II is incorporated by reference from our definitive Proxy Statement to be filed with the Securities and Exchange Commission in connection with the solicitation of proxies for our 2016 Annual Meeting of Stockholders not later than 120 days after the end of the fiscal year covered by this report.
29
STOCK PRICE PERFORMANCE GRAPH
Set forth below is a stock price performance graph comparing the annual percentage change in the cumulative total return on our common stock with the cumulative total returns of the CRSP Total Return Index for The NASDAQ Stock Market (U.S. companies) and the NASDAQ Computer Manufacturers Securities for the period commencing July 3, 2011 and ending on June 30, 2016. The comparisons in the graph below are based on historical data and are not intended to forecast the possible future performance of our common stock.
Comparison of Five-Year Cumulative Total Returns
Performance Graph for Extreme Networks, Inc.
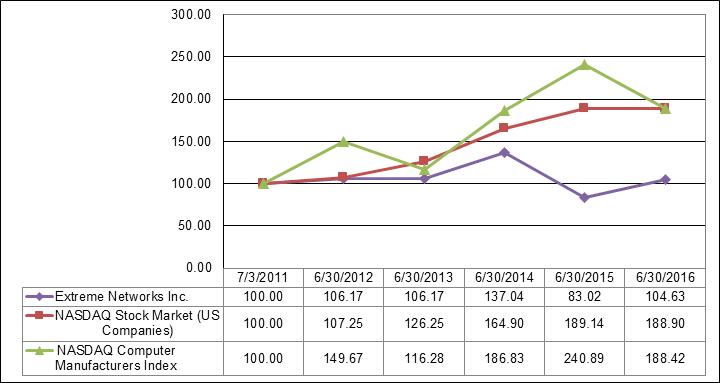
Prepared by CRSP (www.crsp.uchicago.edu), Center for Research in Security Prices, Booth School of Business, The University of Chicago. Used with permission. All rights reserved.
30
Item 6. Selected Financial Data
The following table sets forth selected consolidated financial data for each of the fiscal years ended June 30, 2016, 2015, 2014, 2013 and 2012 derived from the Company’s audited financial statements (in thousands, except per share amounts). These tables should be reviewed in conjunction with the Consolidated Financial Statements in Item 8 and related Notes, as well as Item 7, “Management’s Discussion and Analysis of Financial Condition and Results of Operations.” Historical results may not be indicative of future results.
|
|
|
Year Ended |
|
|||||||||||||||||
|
|
|
June 30, |
|
|||||||||||||||||
|
|
|
2016(1) |
|
|
2015(2) |
|
|
2014(3) |
|
|
2013(4) |
|
|
2012(5) |
|
|||||
|
Consolidated Statements of Operations Data: |
|
|
|
|
|
|
|
|
|
|
|
|
|
|
|
|
|
|
|
|
|
Net revenues |
|
$ |
528,389 |
|
|
$ |
552,940 |
|
|
$ |
519,554 |
|
|
$ |
299,343 |
|
|
$ |
322,722 |
|
|
Operating income (loss) |
|
$ |
(25,550 |
) |
|
$ |
(62,994 |
) |
|
$ |
(50,232 |
) |
|
$ |
10,852 |
|
|
$ |
13,909 |
|
|
Net income (loss) |
|
$ |
(31,884 |
) |
|
$ |
(71,643 |
) |
|
$ |
(57,310 |
) |
|
$ |
9,673 |
|
|
$ |
15,872 |
|
|
Net income (loss) per share – basic |
|
$ |
(0.31 |
) |
|
$ |
(0.72 |
) |
|
$ |
(0.60 |
) |
|
$ |
0.10 |
|
|
$ |
0.17 |
|
|
Net income (loss) per share – diluted |
|
$ |
(0.31 |
) |
|
$ |
(0.72 |
) |
|
$ |
(0.60 |
) |
|
$ |
0.10 |
|
|
$ |
0.17 |
|
|
Shares used in per share calculation – basic |
|
|
103,074 |
|
|
|
99,000 |
|
|
|
95,515 |
|
|
|
93,954 |
|
|
|
93,451 |
|
|
Shares used in per share calculation – diluted |
|
|
103,074 |
|
|
|
99,000 |
|
|
|
95,515 |
|
|
|
95,044 |
|
|
|
94,490 |
|
|
|
|
|
|
|
|
|
|
|
|
|
|
|
|
|
|
|
|
|
|
|
|
|
|
As of |
|
|||||||||||||||||
|
|
|
June 30, |
|
|||||||||||||||||
|
|
|
2016 |
|
|
2015 |
|
|
2014 |
|
|
2013 |
|
|
2012 |
|
|||||
|
Consolidated Balance Sheets Data: |
|
|
|
|
|
|
|
|
|
|
|
|
|
|
|
|
|
|
|
|
|
Cash and cash equivalents, short-term investments and marketable securities |
|
$ |
94,122 |
|
|
$ |
76,225 |
|
|
$ |
105,882 |
|
|
$ |
205,613 |
|
|
$ |
153,515 |
|
|
Inventories |
|
$ |
40,989 |
|
|
$ |
58,014 |
|
|
$ |
57,109 |
|
|
$ |
16,167 |
|
|
$ |
26,609 |
|
|
Total assets |
|
$ |
374,849 |
|
|
$ |
428,660 |
|
|
$ |
526,432 |
|
|
$ |
311,424 |
|
|
$ |
284,590 |
|
|
Deferred revenue, net |
|
$ |
94,860 |
|
|
$ |
99,782 |
|
|
$ |
97,677 |
|
|
$ |
41,454 |
|
|
$ |
39,328 |
|
|
Total debt |
|
$ |
55,500 |
|
|
$ |
66,875 |
|
|
$ |
121,563 |
|
|
$ |
— |
|
|
$ |
— |
|
|
Other long-term liabilities |
|
$ |
13,328 |
|
|
$ |
10,264 |
|
|
$ |
8,595 |
|
|
$ |
1,507 |
|
|
$ |
643 |
|
|
Common stock and capital in excess of par value |
|
$ |
884,706 |
|
|
$ |
865,382 |
|
|
$ |
845,364 |
|
|
$ |
821,425 |
|
|
$ |
970,743 |
|
|
Accumulated deficit |
|
$ |
(791,740 |
) |
|
$ |
(759,856 |
) |
|
$ |
(688,213 |
) |
|
$ |
(630,903 |
) |
|
$ |
(640,576 |
) |
|
(1) |
Fiscal 2016 net loss and net loss per share includes acquisition and integrations costs of $1.1 million, amortization of intangibles of $17.0 million and a restructuring charge of $11.0 million. |
|
(2) |
Fiscal 2015 net loss and net loss per share includes acquisition and integrations costs of $10.2 million, amortization of intangibles of $17.9 million and a restructuring charge of $9.8 million. |
|
(3) |
Fiscal 2014 net loss and net loss per share includes acquisition and integration costs of $25.7 million, amortization of intangibles of $16.7 million and a restructuring charge of $0.5 million. |
|
(4) |
Fiscal 2013 net income and net income per share includes a gain on sale of facilities of $11.5 million, a restructuring charge of $6.8 million and a charge for litigation settlement, net of $2.0 million. |
|
(5) |
Fiscal 2012 net income and net income per share includes a restructuring charge of $1.6 million and a litigation settlement gain of $0.1 million and $1.9 million cumulative translation adjustments gain from the liquidation of our Japanese subsidiary. |
31
Quarterly Financial Data (Unaudited)
Quarterly results for the years ended June 30, 2016 and 2015 are as follow (in thousands, except per share amounts):
|
|
|
June 30, |
|
|
March 31, |
|
|
December 31, |
|
|
September 30, |
|
||||
|
|
|
2016(1) |
|
|
2016(2) |
|
|
2015(3) |
|
|
2015(4) |
|
||||
|
Net revenues |
|
$ |
139,617 |
|
|
$ |
124,886 |
|
|
$ |
139,305 |
|
|
$ |
124,581 |
|
|
Gross profit |
|
$ |
72,675 |
|
|
$ |
62,720 |
|
|
$ |
70,275 |
|
|
$ |
65,118 |
|
|
Net loss |
|
$ |
(2,340 |
) |
|
$ |
(10,784 |
) |
|
$ |
(7,234 |
) |
|
$ |
(11,526 |
) |
|
Net loss per share – basic |
|
$ |
(0.02 |
) |
|
$ |
(0.10 |
) |
|
$ |
(0.07 |
) |
|
$ |
(0.11 |
) |
|
Net loss per share – diluted |
|
$ |
(0.02 |
) |
|
$ |
(0.10 |
) |
|
$ |
(0.07 |
) |
|
$ |
(0.11 |
) |
|
|
|
|
|
|
|
|
|
|
|
|
|
|
|
|
|
|
|
|
|
June 30, |
|
|
March 31, |
|
|
December 31, |
|
|
September 30, |
|
||||
|
|
|
2015(5) |
|
|
2015(6) |
|
|
2014(7) |
|
|
2014(8) |
|
||||
|
Net revenues |
|
$ |
149,870 |
|
|
$ |
119,590 |
|
|
$ |
147,208 |
|
|
$ |
136,274 |
|
|
Gross profit |
|
$ |
76,327 |
|
|
$ |
57,724 |
|
|
$ |
75,162 |
|
|
$ |
70,527 |
|
|
Net loss |
|
$ |
(15,657 |
) |
|
$ |
(23,548 |
) |
|
$ |
(13,105 |
) |
|
$ |
(19,330 |
) |
|
Net loss per share – basic |
|
$ |
(0.16 |
) |
|
$ |
(0.24 |
) |
|
$ |
(0.13 |
) |
|
$ |
(0.20 |
) |
|
Net loss per share – diluted |
|
$ |
(0.16 |
) |
|
$ |
(0.24 |
) |
|
$ |
(0.13 |
) |
|
$ |
(0.20 |
) |
|
(1) |
Net loss and net loss per share include the effect of amortization of intangibles of $4.1 million and a restructuring charge of $1.0 million. |
|
(2) |
Net loss and net loss per share include the effect of amortization of intangibles of $4.1 million and a restructuring charge of $1.4 million. |
|
(3) |
Net loss and net loss per share include the effect of acquisition and integration costs of $0.8 million, amortization of intangibles of $4.3 million and a restructuring charge of $3.0 million. |
|
(4) |
Net loss and net loss per share include the effect of acquisition and integration costs of $0.3 million, amortization of intangibles of $4.5 million and a restructuring charge of $5.6 million. |
|
(5) |
Net loss and net loss per share include the effect of acquisition and integration costs of $0.9 million, amortization of intangibles of $4.5 million and a restructuring charge of $9.8 million. |
|
(6) |
Net loss and net loss per share include the effect of acquisition and integration costs of $1.7 million and amortization of intangibles of $4.5 million. |
|
(7) |
Net loss and net loss per share include the effect of acquisition and integration costs of $3.5 million and amortization of intangibles of $4.5 million. |
|
(8) |
Net loss and net loss per share include the effect of acquisition and integration costs of $4.1 million and amortization of intangibles of $4.5 million. |
Quarterly and year-to-date computations of per share amounts are made independently. Therefore, the sum of per share amounts for the quarters may not agree with the per share amounts for the year.
32
Item 7. Management’s Discussion and Analysis of Financial Condition and Results of Operations
Business Overview
The following discussion should be read with the Consolidated Financial Statements and the related notes in Item 8 of Part II of this Report.
The following discussion is based upon our Consolidated Financial Statements included elsewhere in this Report, which have been prepared in accordance with U.S. generally accepted accounting principles, or U.S. GAAP. In the course of operating our business, we routinely make decisions as to the timing of the payment of invoices, the collection of receivables, the manufacturing and shipment of products, the fulfillment of orders, the purchase of supplies, and the building of inventory and spare parts, among other matters. Each of these decisions has some impact on the financial results for any given period. In making these decisions, we consider various factors including contractual obligations, customer satisfaction, competition, internal and external financial targets and expectations, and financial planning objectives. For further information about our critical accounting policies and estimates, see “Critical Accounting Policies and Estimates” section included in this “Management's Discussion and Analysis of Financial Condition and Results of Operations.”
Extreme is a leading provider of network infrastructure equipment and offer related maintenance contracts for extended warranty and maintenance to our enterprise, data center and service provider customers. We were incorporated in California in May 1996, and reincorporated in Delaware in March 1999. Our corporate headquarters are located in San Jose, California. Substantially all of our revenue is derived from the sale of our networking equipment and related maintenance contracts.
Restructuring
During the fourth quarter of fiscal 2015, we implemented a plan to reduce costs through targeted restructuring activities intended to reduce operating costs and realign our organization in the current competitive environment. We initiated a plan to reduce our worldwide headcount by more than 225 employees, primarily in sales and marketing as well as research and development, consolidate specific global administrative functions, and shift certain operating costs to lower cost regions, among other actions.
During fiscal 2016, we continued our initiative to realign our operations with a second phase by abandoning excess facilities, primarily in San Jose, California; Salem, New Hampshire; Research Triangle Park, North Carolina in addition to other smaller leased locations. Such facilities represented approximately 32% of the floor space in the aggregate at these locations and included general office and warehouse space. We may terminate or choose not to renew leases for excess facilities in future periods as we further align our organization to our business and operational needs.
Amendment to Rights Agreement
On April 26, 2012, we entered into an Amended and Restated Rights Agreement between the Company and Computershare Shareholder Services LLC as the rights agent (the “Restated Rights Plan”). The Restated Rights Plan governs the terms of each right (“Right”) that has been issued with respect to each share of our Common Stock. Each Right initially represents the right to purchase one one-thousandth of a share of our Preferred Stock. The Restated Rights Plan replaces in its entirety the Rights Agreement, dated as of April 27, 2001, as subsequently amended, between us and Mellon Investor Services LLC (the “Prior Rights Plan”).
The Board adopted the Restated Rights Plan to preserve the value of our deferred tax assets, including our net operating loss carry forwards, with respect to our ability to fully use tax benefits to offset future income which may be limited if we experience an “ownership change” for purposes of Section 382 of the Internal Revenue Code of 1986, as amended as a result of ordinary buying and selling of our common stock. Following its review of the terms of the plan, the Board decided it was necessary and in the best interests of us and our stockholders to enter into the Restated Rights Plan. The Restated Rights Plan incorporates the Prior Rights Plan and the amendments thereto into a single agreement and extended the term of the Prior Rights Plan to April 30, 2013. Each year since 2013 our Board and shareholders have approved an amendment providing for a one year extension of the term of the Restated Rights Plan. Our Board of Directors unanimously approved an amendment to the Restated Rights Plan on May 5, 2016 to extend the Restated Rights Plan through May 31, 2017, subject to ratification by a majority of the stockholders of the Company at the next annual shareholders meeting, expected to be held on November 18, 2016.
33
Results of Operations
Our operations and financial performance during fiscal 2016, achieved the following results:
|
|
· |
Net revenue of $528.4 million, a decrease of 4.4% from fiscal 2015 net revenue of $552.9 million. |
|
|
· |
Product revenue of $395.5 million, a decrease of 5.4% from fiscal 2015 product revenue of $418.0 million. |
|
|
· |
Service revenue of $132.9 million, a decrease of 1.5% from fiscal 2015 service revenue of $134.9 million. |
|
|
· |
Total gross margin of 51.2% of net revenue in fiscal 2016, compared to 50.6% in fiscal 2015. |
|
|
· |
Restructuring charge of $11.0 million, for excess facilities and contract termination. |
|
|
· |
Operating loss of $25.6 million, a decrease in the operating loss of $37.4 million from fiscal 2015. |
|
|
· |
Net loss was $31.9 million in fiscal 2016, a decrease of $39.8 million from a net loss of $71.6 million in fiscal 2015. |
|
|
· |
Cash flow provided by operating activities was $30.4 million, compared to cash flow provided by operating activities of $37.4 million in fiscal 2015, a decrease of $7.1 million. Cash and cash equivalents were $94.1 million as of June 30, 2016, an increase of $17.9 million compared to fiscal 2015. |
Net Revenue
The following table presents net product and service revenue for the fiscal years 2016, 2015 and 2014 (dollars in thousands):
|
|
|
Year Ended |
|
|
Year Ended |
|
||||||||||||||||||||||||||
|
|
|
June 30, 2016 |
|
|
June 30, 2015 |
|
|
$ Change |
|
|
% Change |
|
|
June 30, 2015 |
|
|
June 30, 2014 |
|
|
$ Change |
|
|
% Change |
|
||||||||
|
Net Revenues: |
|
|
|
|
|
|
|
|
|
|
|
|
|
|
|
|
|
|
|
|
|
|
|
|
|
|
|
|
|
|
|
|
|
Product |
|
$ |
395,464 |
|
|
$ |
418,046 |
|
|
$ |
(22,582 |
) |
|
|
(5.4 |
)% |
|
$ |
418,046 |
|
|
$ |
411,761 |
|
|
$ |
6,285 |
|
|
|
1.5 |
% |
|
Percentage of net revenue |
|
|
74.8 |
% |
|
|
75.6 |
% |
|
|
|
|
|
|
|
|
|
|
75.6 |
% |
|
|
79.3 |
% |
|
|
|
|
|
|
|
|
|
Service |
|
|
132,925 |
|
|
|
134,894 |
|
|
|
(1,969 |
) |
|
|
(1.5 |
)% |
|
|
134,894 |
|
|
$ |
107,793 |
|
|
|
27,101 |
|
|
|
25.1 |
% |
|
Percentage of net revenue |
|
|
25.2 |
% |
|
|
24.4 |
% |
|
|
|
|
|
|
|
|
|
|
24.4 |
% |
|
|
20.7 |
% |
|
|
|
|
|
|
|
|
|
Total net revenues |
|
$ |
528,389 |
|
|
$ |
552,940 |
|
|
$ |
(24,551 |
) |
|
|
(4.4 |
)% |
|
$ |
552,940 |
|
|
$ |
519,554 |
|
|
$ |
33,386 |
|
|
|
6.4 |
% |
Product revenue decreased $22.6 million or 5.4% for the year-ended June 30, 2016, compared to the corresponding period of fiscal 2015. The decrease in sales was primarily due to an increase in competitive pricing pressure on lower volumes of chassis (modular) based products due to market shifts towards fixed products which are generally lower cost and are capable of rapidly adapting to changes and needs of the marketplace. The growth in the fixed products was not sufficient to offset the modular product decline and to a lesser extent, to the strengthening of the United States Dollar in nearly all geographical regions.
Product revenue increased $6.3 million or 1.5% for the year-ended June 30, 2015, compared to the corresponding period of fiscal 2014. The fiscal 2015 period reflects increased product shipments and customers as a result of our acquisition of Enterasys, whereas the fiscal 2014 period only reflects eight months of sales subsequent to the October 31, 2013 acquisition date. However, the increase in sales was partially offset by declines of customer spending across each geographical region and an increase in customer discounts. The decline in customer spending was partially due to the significant strengthening of the United States Dollar in all geographical areas and the entrance of competitors in regions where we have a strong presence, specifically in Asia Pacific and EMEA regions.
Service revenue decreased $2.0 million or 1.5% for the year-ended June 30, 2016 compared to the corresponding period of fiscal 2015 due to a decrease in service maintenance contracts and professional service and training revenues. Partially offsetting the decrease were lower purchase accounting charges related to deferred service revenues which decreased $1.6 million for the year-ended June 30, 2016, to $1.5 million from $3.1 million in the corresponding period of fiscal 2015.
Service revenue increased $27.1 million or 25.1% for the year-ended June 30, 2015 compared to the corresponding period of fiscal 2014 due to an increase in service maintenance contracts and professional service and training revenues due to our acquisition of Enterasys. Purchase accounting charges related to deferred service revenues decreased $2.2 million for the year-ended June 30, 2015, to $3.1 million from $5.3 million in the corresponding period of fiscal 2014.
34
We operate in three regions: Americas, which includes the United States, Canada, Mexico, Central America and South America; EMEA, which includes Europe, Russia, Middle East, and Africa; and APAC which includes Asia Pacific, South Asia, Japan and Australia. The following table presents the total net revenue geographically for the fiscal years 2016, 2015 and 2014 (dollars in thousands):
|
|
|
Year Ended |
|
|
Year Ended |
|
||||||||||||||||||||||||||
|
Net Revenues |
|
June 30, 2016 |
|
|
June 30, 2015 |
|
|
$ Change |
|
|
% Change |
|
|
June 30, 2015 |
|
|
June 30, 2014 |
|
|
$ Change |
|
|
% Change |
|
||||||||
|
Americas: |
|
|
|
|
|
|
|
|
|
|
|
|
|
|
|
|
|
|
|
|
|
|
|
|
|
|
|
|
|
|
|
|
|
United States |
|
$ |
237,933 |
|
|
$ |
238,748 |
|
|
$ |
(815 |
) |
|
|
(0.3 |
)% |
|
$ |
238,748 |
|
|
$ |
211,734 |
|
|
$ |
27,014 |
|
|
|
12.8 |
% |
|
Other |
|
|
44,455 |
|
|
|
31,931 |
|
|
|
12,524 |
|
|
|
39.2 |
% |
|
|
31,931 |
|
|
|
45,790 |
|
|
|
(13,859 |
) |
|
|
(30.3 |
)% |
|
Total Americas |
|
|
282,388 |
|
|
|
270,679 |
|
|
|
11,709 |
|
|
|
4.3 |
% |
|
|
270,679 |
|
|
|
257,524 |
|
|
|
13,155 |
|
|
|
5.1 |
% |
|
Percentage of net revenue |
|
|
53.4 |
% |
|
|
49.0 |
% |
|
|
|
|
|
|
|
|
|
|
49.0 |
% |
|
|
49.6 |
% |
|
|
|
|
|
|
|
|
|
EMEA |
|
|
196,588 |
|
|
|
223,368 |
|
|
|
(26,780 |
) |
|
|
(12.0 |
)% |
|
|
223,368 |
|
|
|
202,555 |
|
|
|
20,813 |
|
|
|
10.3 |
% |
|
Percentage of net revenue |
|
|
37.2 |
% |
|
|
40.4 |
% |
|
|
|
|
|
|
|
|
|
|
40.4 |
% |
|
|
39.0 |
% |
|
|
|
|
|
|
|
|
|
APAC |
|
|
49,413 |
|
|
|
58,893 |
|
|
|
(9,480 |
) |
|
|
(16.1 |
)% |
|
|
58,893 |
|
|
|
59,475 |
|
|
|
(582 |
) |
|
|
(1.0 |
)% |
|
Percentage of net revenue |
|
|
9.4 |
% |
|
|
10.7 |
% |
|
|
|
|
|
|
|
|
|
|
10.7 |
% |
|
|
11.4 |
% |
|
|
|
|
|
|
|
|
|
Total net revenues |
|
$ |
528,389 |
|
|
$ |
552,940 |
|
|
$ |
(24,551 |
) |
|
|
(4.4 |
)% |
|
$ |
552,940 |
|
|
$ |
519,554 |
|
|
$ |
33,386 |
|
|
|
6.4 |
% |
We rely upon multiple channels of distribution, including distributors, direct resellers, OEM, and direct sales. Revenue through our distributor channel was 49% of total product revenue in fiscal 2016, 47% of total product revenue in fiscal 2015 and 44% of total product revenue in fiscal 2014.
The level of sales to any one customer, including a distributor, may vary from period to period.
Cost of Revenue and Gross Profit
The following table presents the gross profit on product and service revenue and the gross profit percentage of net revenue for the fiscal years 2016, 2015 and 2014 (dollars in thousands):
|
|
|
Year Ended |
|
|
Year Ended |
|
||||||||||||||||||||||||||
|
|
|
June 30, 2016 |
|
|
June 30, 2015 |
|
|
$ Change |
|
|
% Change |
|
|
June 30, 2015 |
|
|
June 30, 2014 |
|
|
$ Change |
|
|
% Change |
|
||||||||
|
Gross profit: |
|
|
|
|
|
|
|
|
|
|
|
|
|
|
|
|
|
|
|
|
|
|
|
|
|
|
|
|
|
|
|
|
|
Product |
|
$ |
186,725 |
|
|
$ |
193,028 |
|
|
$ |
(6,303 |
) |
|
|
(3.3 |
)% |
|
$ |
193,028 |
|
|
$ |
198,088 |
|
|
$ |
(5,060 |
) |
|
|
(2.6 |
)% |
|
Percentage of product revenue |
|
|
47.2 |
% |
|
|
46.2 |
% |
|
|
|
|
|
|
|
|
|
|
46.2 |
% |
|
|
48.1 |
% |
|
|
|
|
|
|
|
|
|
Service |
|
|
84,063 |
|
|
|
86,709 |
|
|
|
(2,646 |
) |
|
|
(3.1 |
)% |
|
|
86,709 |
|
|
|
69,241 |
|
|
|
17,468 |
|
|
|
25.2 |
% |
|
Percentage of service revenue |
|
|
63.2 |
% |
|
|
64.3 |
% |
|
|
|
|
|
|
|
|
|
|
64.3 |
% |
|
|
64.2 |
% |
|
|
|
|
|
|
|
|
|
Total gross profit |
|
$ |
270,788 |
|
|
$ |
279,737 |
|
|
$ |
(8,949 |
) |
|
|
(3.2 |
)% |
|
$ |
279,737 |
|
|
$ |
267,329 |
|
|
$ |
12,408 |
|
|
|
4.6 |
% |
|
Percentage of net revenue |
|
|
51.2 |
% |
|
|
50.6 |
% |
|
|
|
|
|
|
|
|
|
|
50.6 |
% |
|
|
51.5 |
% |
|
|
|
|
|
|
|
|
Cost of product revenue includes costs of materials, amounts paid to third-party contract manufacturers, costs related to warranty obligations, charges for excess and obsolete inventory, amortization of developed technology intangibles, royalties under technology license agreements, and internal costs associated with manufacturing overhead, including management, manufacturing engineering, quality assurance, development of test plans, and document control. We outsource substantially all of our manufacturing and supply chain management operations, and we conduct quality assurance, manufacturing engineering, document control and distribution at our facilities in San Jose, California, Salem, New Hampshire, China, and Taiwan.
Product gross profit decreased to $186.7 million for the year-ended June 30, 2016, from $193.0 million in the corresponding period of fiscal 2015. Product gross profit for the year-ended June 30, 2016, was unfavorably impacted by a decrease in product revenue of $22.6 million, offset by lower amortization of developed technology intangibles of $2.3 million, lower royalty charges of $1.9 million and warranty charges of $0.8 million.
35
Product gross profit decreased to $193.0 million for the year-ended June 30, 2015, from $198.1 million in the corresponding period of fiscal 2014. Product gross profit for the year-ended June 30, 2015, was favorably impacted by an increase in product revenue of $6.3 million, offset by higher material costs and increases of $5.8 million in excess and obsolete inventory charges, $6.1 million for amortization of the developed technology intangibles from the acquisition of Enterasys, $3.4 million for distribution costs due to higher utilization of air freight and $3.3 million of warranty charges. Gross profit for fiscal 2014, was negatively impacted by $11.1 million related to the sale of inventory which had been adjusted to fair value upon the Enterasys acquisition due to purchase accounting.
Our cost of service revenue consists primarily of labor, overhead, repair and freight costs and the cost of spare parts used in providing support under customer maintenance contracts.
Service gross profit decreased to $84.1 million for the year-ended June 30, 2016, from $86.7 million in the corresponding period of fiscal 2015, primarily due to a decrease in service revenue of $2.0 million and increased operating expenses, primarily professional fees of $0.6 million.
Service gross profit increased to $86.7 million for the year-ended June 30, 2015, from $69.2 million in the corresponding period of fiscal 2014, primarily due to an increase in service revenue of $27.1 million partially offset by increased personnel, overhead and travel costs as a result of the acquisition of Enterasys.
Operating Expenses
The following table presents operating expenses and operating income (dollars in thousands):
|
|
|
Year Ended |
|
|
Year Ended |
|
||||||||||||||||||||||||||
|
|
|
June 30, 2016 |
|
|
June 30, 2015 |
|
|
$ Change |
|
|
% Change |
|
|
June 30, 2015 |
|
|
June 30, 2014 |
|
|
$ Change |
|
|
% Change |
|
||||||||
|
Research and development |
|
$ |
78,721 |
|
|
$ |
93,447 |
|
|
$ |
(14,726 |
) |
|
|
(15.8 |
)% |
|
$ |
93,447 |
|
|
$ |
77,146 |
|
|
$ |
16,301 |
|
|
|
21.1 |
% |
|
Sales and marketing |
|
|
150,806 |
|
|
|
169,299 |
|
|
|
(18,493 |
) |
|
|
(10.9 |
)% |
|
|
169,299 |
|
|
|
156,666 |
|
|
|
12,633 |
|
|
|
8.1 |
% |
|
General and administrative |
|
|
37,675 |
|
|
|
42,092 |
|
|
|
(4,417 |
) |
|
|
(10.5 |
)% |
|
|
42,092 |
|
|
|
40,812 |
|
|
|
1,280 |
|
|
|
3.1 |
% |
|
Acquisition and integration costs |
|
|
1,145 |
|
|
|
10,205 |
|
|
|
(9,060 |
) |
|
|
(88.8 |
)% |
|
|
10,205 |
|
|
|
25,716 |
|
|
|
(15,511 |
) |
|
|
(60.3 |
)% |
|
Restructuring charge, net of reversals |
|
|
10,990 |
|
|
|
9,819 |
|
|
|
1,171 |
|
|
|
11.9 |
% |
|
|
9,819 |
|
|
|
510 |
|
|
|
9,309 |
|
|
|
1,825.3 |
% |
|
Amortization of intangibles |
|
|
17,001 |
|
|
|
17,869 |
|
|
|
(868 |
) |
|
|
(4.9 |
)% |
|
|
17,869 |
|
|
|
16,711 |
|
|
|
1,158 |
|
|
|
6.9 |
% |
|
Total operating expenses |
|
$ |
296,338 |
|
|
$ |
342,731 |
|
|
$ |
(46,393 |
) |
|
|
(13.5 |
)% |
|
$ |
342,731 |
|
|
$ |
317,561 |
|
|
$ |
25,170 |
|
|
|
7.9 |
% |
|
Operating loss |
|
$ |
(25,550 |
) |
|
$ |
(62,994 |
) |
|
$ |
37,444 |
|
|
|
59.4 |
% |
|
$ |
(62,994 |
) |
|
$ |
(50,232 |
) |
|
$ |
(12,762 |
) |
|
|
(25.4 |
)% |
The following table highlights our operating expenses and operating loss as a percentage of net revenues:
|
|
|
Year Ended |
|
|||||||||
|
|
|
June 30, 2016 |
|
|
June 30, 2015 |
|
|
June 30, 2014 |
|
|||
|
Research and development |
|
|
14.9 |
% |
|
|
16.9 |
% |
|
|
14.8 |
% |
|
Sales and marketing |
|
|
28.5 |
% |
|
|
30.6 |
% |
|
|
30.2 |
% |
|
General and administrative |
|
|
7.1 |
% |
|
|
7.6 |
% |
|
|
7.9 |
% |
|
Acquisition and integration costs |
|
|
0.2 |
% |
|
|
1.8 |
% |
|
|
4.9 |
% |
|
Restructuring charge, net of reversals |
|
|
2.1 |
% |
|
|
1.8 |
% |
|
|
0.1 |
% |
|
Amortization of intangibles |
|
|
3.2 |
% |
|
|
3.2 |
% |
|
|
3.2 |
% |
|
Total operating expenses |
|
|
56.1 |
% |
|
|
62.0 |
% |
|
|
61.1 |
% |
|
Operating loss |
|
|
(4.8 |
)% |
|
|
(11.4 |
)% |
|
|
(9.7 |
)% |
Research and Development Expenses
Research and development expenses consist primarily of salaries and related personnel expenses, consultant fees and prototype expenses related to the design, development, and testing of our products.
Research and development expenses decreased by $14.7 million or 15.8% for fiscal 2016 as compared to fiscal 2015. The decrease in spending is related to $11.6 million of personnel costs, which includes compensation, benefits and non-cash stock based compensation, $1.6 million in reduced supplies and equipment costs, $1.2 million in depreciation and $0.3 million of other costs.
36
Research and development expenses increased by $16.3 million or 21.1% for fiscal 2015 as compared to fiscal 2014. The increase in research and development expenses was primarily due to increased spending as a result of our acquisition of Enterasys. The increase in spending related to $13.4 million of personnel costs, which includes compensation, benefits and non-cash stock based compensation, including $0.4 million of expense related to our executive transition activity, $1.3 million in depreciation and $0.8 million for supplies and equipment.
Sales and Marketing Expenses
Sales and marketing expenses consist of salaries, commissions and related expenses for personnel engaged in marketing and sales functions, as well as trade shows and promotional expenses.
Sales and marketing expenses decreased by $18.5 million or 10.9% for the year-ended June 30, 2016 as compared to the corresponding period of fiscal 2015. The decrease in sales and marketing expenses during fiscal 2016 was primarily due to lower personnel costs including benefits and non-cash stock compensation of $11.5 million, $3.1 million in reduced travel costs, $2.4 million in occupancy expense and $1.9 million for sales conferences and related costs. In addition, sales and marketing professional fees decreased by $0.8 million during the period.
Sales and marketing expenses increased by $12.6 million or 8.1% for the year-ended June 30, 2015 as compared to the corresponding period of fiscal 2014. The increase in sales and marketing expenses during fiscal 2015 was primarily due to $6.7 million of higher compensation, benefits and non-cash stock compensation, including $0.5 million of expense related to our executive transition activity, $2.7 million in marketing expense, $1.8 million in facilities and $0.8 million in depreciation. All of these factors were primarily driven by the acquisition of Enterasys.
General and Administrative Expenses
General and administrative expense consists primarily of personnel costs, legal and professional service costs, share-based compensation, travel and facilities and information technology costs.
General and administrative expenses decreased by $4.4 million or 10.5% for the year-ended June 30, 2016 as compared to the corresponding period of fiscal 2015. The decrease in general and administrative expenses was primarily due to $3.6 million in lower personnel costs related to our reduced headcount, as well as reduced professional fees of $1.9 million and other expenses of $0.4 million.
General and administrative expenses increased by $1.3 million or 3.1% for the year-ended June 30, 2015 as compared to the corresponding period of fiscal 2014. The increase in general and administrative expenses was primarily due to $1.1 million in higher personnel costs related to our executive transition activity, higher occupancy costs due to additional facilities in Salem, New Hampshire and Shannon, Ireland as a result of our acquisition of Enterasys, a $0.8 million increase in bad debt expense and $0.2 million in professional service fees. This increase was partially offset by $1.0 million in lower travel costs.
Acquisition and Integration Costs
As a result of our acquisition of Enterasys, we incurred $1.1 million, $10.2 million and $25.7 million of acquisition and integration costs in fiscal 2016, 2015 and 2014, respectively. For fiscal 2016 and 2015, the entire $1.1 million and $10.2 million, respectively, of expense was related to integration costs. The fiscal 2014 expense was related to $19.7 million of integration costs and the remaining $6.0 million expense was related to acquisition costs. The lower fiscal 2016 integration expenses was due to winding down of integration activities associated with the acquisition, which included lower severance and termination costs, information systems applications costs and consulting fees. The lower fiscal 2015 integration expenses were due to lower severance and termination costs and third party consulting fees.
Restructuring Charge, Net of Reversals
During fiscal years 2016, 2015 and 2014, we recorded restructuring charges, net of reversals, of $11.0 million, $9.8 million and $0.5 million, respectively.
37
2015 Restructuring Plan
Fiscal year 2016 – Phase 2
During fiscal 2016, we continued our initiative that began in fiscal 2015, to realign our operations with a second phase by abandoning excess facilities, primarily in San Jose, California; Salem, New Hampshire; Research Triangle Park, North Carolina in addition to other smaller leased locations. The abandoned facilities represented approximately 32% of the floor space in the aggregate at these locations and included general office and warehouse space.
In conjunction with the exiting of facilities noted above, we incurred $11.0 of restructuring charges. Excess facilities charges included accrued lease costs pertaining to the estimated future obligations for non-cancelable lease payments for excess facilities and contract termination charges of $5.4 million, acceleration of depreciation of leasehold improvements of $4.5 million, professional fees of $1.0 million and other expenses of $0.1 million.
Significant restructuring charges incurred during the period, by location, included $1.8 million of charges for excess facilities pertaining to the estimated future obligations for non-cancelable lease payments at our San Jose location. This represented 39% of the San Jose lease space. We amended our facility lease at our North Carolina location and exited excess space while recording $4.1 million of charges, which included $3.1 million in accelerated depreciation of leasehold improvements. This action represented 36% of the North Carolina location lease space. We recorded $4.4 million of charges for excess facilities at our Salem location, which included $1.3 million in accelerated depreciation of leasehold improvements. This action represented 27% of the Salem lease space.
As of June 30, 2016, we reflect restructuring liabilities of $4.6 million related to the excess facilities charges, of which, payments will continue through fiscal year 2023, due to the length of the lease agreements. The restructuring liability is recorded in "Other accrued liabilities" and “Other long-term liabilities” on the consolidated balance sheets.
Fiscal year 2015-Phase 1
During the fourth quarter of fiscal 2015, we implemented a plan to reduce costs through targeted restructuring activities intended to reduce operating costs and realign our organization in the current competitive environment. We initiated a plan to reduce our worldwide headcount by more than 225 employees, primarily in sales and marketing as well as research and development, consolidate specific global administrative functions, and shift certain operating costs to lower cost regions, among other actions. We have expensed all costs associated with this initiative. As of June 30, 2015, we reflected a restructuring liability of $5.9 million related to this initiative which was fully paid as of June 30, 2016.
Fiscal year 2014
In fiscal 2014, we incurred an additional $0.5 million of expenses related to a restructuring plan originating in 2013. As part of our restructuring efforts that began in fiscal 2013, we initiated a plan to reduce our worldwide headcount by 13%, consolidate specific global administrative functions, and shift certain operating costs to lower cost regions, among other actions. There were no outstanding liabilities related to the fiscal 2013 restructuring as of June 30, 2015.
Amortization of Intangibles
During fiscal 2016, 2015 and 2014, we recorded $17.0 million, $17.9 million and $16.7 million, respectively, of amortization expenses in operating expenses primarily for certain intangibles related to the acquisition of Enterasys.
Interest Income
Interest income was $0.1 million, $0.5 million and $0.8 million in fiscal years 2016, 2015 and 2014, respectively, representing a decrease of $0.4 million in fiscal 2016 from fiscal 2015 and a decrease of $0.3 million in fiscal 2015 from fiscal 2014. The decrease in interest income in fiscal 2016 and 2015 was due to a decrease in the investment balances to fund debt reduction.
Interest Expense
We had $3.1 million, $3.2 million and $2.1 million of interest expense for fiscal 2016, 2015 and 2014, respectively. Interest expense in fiscal years 2016, 2015 and 2014 was primarily related to the Senior Secured Credit Facilities, as amended, we entered into on October 31, 2013.
38
Other (Expense) Income, net
Other (expense) income, net was income of $1.0 million in fiscal 2016 and expense of $1.2 million and $1.6 million in fiscal years 2015 and 2014, respectively. Other expense in the respective periods was primarily due to the revaluation of certain assets and liabilities denominated in foreign currencies into U.S. Dollars.
Provision for Income Taxes
We are subject to income taxes in the United States and numerous foreign jurisdictions. Our effective tax rate differs from the U.S. federal statutory rate of 35% primarily due to the impact of state taxes, foreign operations which are generally taxed at lower statutory rates and the full valuation of our deferred tax assets in the U.S. and certain foreign jurisdictions. For the fiscal years ended June 30, 2016, 2015 and 2014, we recorded income tax provisions of $4.3 million, $4.8 million and $4.2 million, respectively. The effective tax rates for fiscal years ended June 30, 2016, 2015 and 2014 were 15.7%, 7.2% and 7.9%, respectively.
For the fiscal years ended June 30, 2016, 2015 and 2014 the majority of our tax provision related to taxes on our foreign operations as well as state taxes due to the full valuation allowance on our U.S. and certain foreign deferred tax assets. In the fiscal year ended June 30, 2014, a portion of our provision resulted from the establishment of a U.S. deferred tax liability for amortizable goodwill resulting from the acquisition of Enterasys.
For a full reconciliation of our effective tax rate to the U.S. federal statutory rate of 35% and for further explanation of our provision for income taxes, see Note 9 to the consolidated financial statements.
Critical Accounting Policies and Estimates
Our significant accounting policies are more fully described in Note 3 of Notes to Consolidated Financial Statements included in Item 8 of this Annual Report on Form 10-K. The preparation of consolidated financial statements in accordance with generally accepted accounting principles requires management to make estimates, assumptions and judgments that affect the reported amounts of assets and liabilities and the disclosure of contingent assets and liabilities at the date of the consolidated financial statements, and the reported amounts of revenue and expenses during the period reported. By their nature, these estimates, assumptions and judgments are subject to an inherent degree of uncertainty. We base our estimates, assumptions and judgments on historical experience, market trends and other factors that are believed to be reasonable under the circumstances. Estimates, assumptions and judgments are reviewed on an ongoing basis and the effects of revisions are reflected in the consolidated financial statements in the period they are determined to be necessary. Actual results may differ from these estimates under different assumptions or conditions. We believe the critical accounting policies stated below, among others, affect our more significant judgments and estimates used in the preparation of our consolidated financial statements.
Revenue Recognition
We derive the majority of our revenue from sales of our networking equipment, with the remaining revenue generated from service fees relating to maintenance contracts, professional services, and training for our products. We recognize revenue when persuasive evidence of an arrangement exists, delivery has occurred, the price of the product is fixed or determinable, and the collection of the sales proceeds is reasonably assured. In instances where any of the criteria for revenue recognition are not met, we defer revenue until all criteria have been met.
Product revenue from our value-added resellers, non-stocking distributors and end-user customers is recognized at the time of shipment, provided that all of the foregoing revenue recognition requirements have been satisfied. We generally do not grant return privileges, except for defective products during the warranty period, nor do we grant pricing credits. Accordingly, we recognize revenue upon transfer of title and risk of loss to the customer, which is generally upon shipment. We maintain estimated accruals and allowances for sales incentives and other programs that we may make available to our partners, based on historical experience or applicable contractual terms. Sales taxes collected from customers are excluded from revenues. Shipping costs are included in cost of product revenues.
39
We also sell our products to distributors that stock inventory and sell to resellers. We defer recognition of revenue on all sales to our stocking distributors until the distributors have sold the products, as evidenced by sales data that the distributors provide to us. We grant stocking distributors certain price protection rights and the right to return a portion of unsold inventory for the purpose of stock rotation. The distributor-related deferred revenue and receivables are adjusted at the time of the stock rotation return or price reduction. We also provide stocking distributors with credits for changes in selling prices based on competitive conditions, and provide funding for our distributors and their resellers to perform marketing development activities. We maintain estimated accruals and allowances for these exposures based upon our contractual obligations. Our marketing development channel programs do not meet the criteria for recognizing the costs as marketing expenses and therefore these costs are accrued as a reduction to revenue in the same period that the products are sold.
Revenue from maintenance contracts is deferred and recognized ratably over the contractual service period, which is typically from one to two years. Professional service revenue is recognized upon delivery or completion of performance.
Our networking products are tangible products that contain software and non-software components that function together to deliver the tangible product's essential functionality. Our sales arrangements may contain multiple deliverables comprised of our tangible products, standalone software licenses, and maintenance offerings depending on the distribution sales channel through which the products are sold and the requirements of our customers. We recognize revenue for our multiple deliverable arrangements in accordance with the accounting standard for multiple deliverable revenue arrangements, which provides guidance on whether multiple deliverables exist, how deliverables in an arrangement should be separated, and how consideration should be allocated. The industry-specific software revenue recognition guidance does not apply to the sales of our tangible products. Software revenue guidance is applied to sales of our standalone software products, including software upgrades and software that is not essential to the functionality of the hardware with which it is sold.
Pursuant to the guidance of the accounting standard for multiple-deliverable revenue arrangements, we allocate the total arrangement consideration to each separable element of an arrangement based on the relative selling price of each element. We determine the standalone selling price for each element based on a selling price hierarchy. Under the selling price hierarchy, the selling price for each deliverable is based on our vendor-specific objective evidence ("VSOE") of selling price, which is determined by a substantial majority of our historical standalone sales transactions for a product or service falling within a reasonable range. If VSOE is not available due to a lack of standalone sales transactions or lack of pricing within a narrow range, then third party evidence (“TPE”), as determined by the standalone pricing of competitive vendor products in similar markets, is used. TPE typically is difficult to establish due to the proprietary differences of competitive products and difficulty in obtaining reliable competitive standalone pricing information. When neither VSOE nor TPE is available, we determine the best estimate of standalone selling price (“ESP”) for a product or service by considering several factors including, but not limited to, the 12-month historical median sales price, sales channels, geography, gross margin consistency, competitive product pricing, and product life cycle. In consideration of all relevant pricing factors, we apply management judgment to determine the best estimate of selling price through consultation with and formal approval by our management for all products and services for which neither VSOE nor TPE is available. Generally, the standalone selling price of services is determined using VSOE and the standalone selling price of all other deliverables is determined by using ESP. We regularly review VSOE, TPE and ESP for all of our products and services and maintain internal controls over the establishment and updates of these estimates.
Pursuant to the software revenue recognition accounting standard, we continue to recognize revenue for software using the residual method for our sales of standalone software products and other software that is not essential to the functionality of the hardware with which it is sold. After allocation of the relative selling price to each element of the multiple deliverable arrangement, we recognize revenue in accordance with our policies for product, software, and maintenance revenue recognition.
We provide an allowance for sales returns based on our historical returns, analysis of credit memo data and our return policies. The allowance for sales returns was $1.6 million and $1.1 million as of June 30, 2016 and 2015, respectively, for estimated future returns that were recorded as a reduction of our accounts receivable. If the historical data that we use to calculate the estimated sales returns and allowances does not properly reflect future levels of product returns, these estimates will be revised, thus resulting in an impact on future net revenue. We estimate and adjust this allowance at each balance sheet date.
40
Goodwill
Goodwill is assessed for impairment annually during the fourth quarter of the fiscal year (which begins on April 1) or more frequently when an event occurs or circumstances change between annual tests that would more likely than not reduce the fair value of the reporting unit below its carrying value. We have determined that we have one reporting unit. To test goodwill for impairment, we first perform a qualitative assessment to determine whether it is more likely than not that the fair value of a reporting unit is less than its carrying value. If it is concluded that this is the case, we then perform the two-step goodwill impairment test. Otherwise, the two-step goodwill impairment test is not required. Under the two-step goodwill impairment test, we in the first step, compare the estimated fair value of a reporting unit to its carrying value. If the fair value of the reporting unit exceeds the carrying value, no impairment loss is recognized. However, if the carrying value of the reporting unit exceeds its fair value, the goodwill of the unit may be impaired. The amount, if any, of the impairment is then measured in the second step in which we determine the implied value of goodwill based on the allocation of the estimated fair value determined in the initial step to all assets and liabilities of the reporting unit.
We completed our annual goodwill impairment test in the fourth quarter of fiscal 2016 and determined there was no impairment as the fair value of the reporting unit exceeded its carrying value.
Share-based Payments
We use the Black-Scholes option-pricing model to determine the fair value of option grants other than option grants, with market, performance conditions, options assumed as part of the Enterasys acquisition, and share purchase options under our Employee Stock Purchase Plan (“ESPP”) on the date of grant with the weighted average assumptions. We use the Monte-Carlo simulation model to determine the fair value and the derived service period of option grants, with market, performance or service conditions or combinations of those conditions, on the date of grant. The expected term of options granted is derived from historical data on employee exercise and post-vesting employment termination behavior. The expected term of purchase options under our ESPP represents the contractual life of the ESPP purchase period. The risk-free rate based upon the estimated life of each option and ESPP award is based on the U.S. Treasury yield curve in effect at the time of grant. Expected volatility is based on both the implied volatilities from traded options on our stock and historical volatility on our stock. We do not currently pay cash dividends on our common stock and do not anticipate doing so in the foreseeable future. Accordingly, our expected dividend yield is zero. We are required to estimate forfeitures at the time of grant and revise those estimates in subsequent periods if actual forfeitures differ from those estimates. In fiscal 2016, our estimated forfeiture rates based on historical forfeiture experiences are 19% for executives and 13% for non-executive employees. We use the straight-line method for expense attribution, and we only recognize expense for those shares expected to vest.
Restructuring Charges
We recognize a liability for exit and disposal activities when the liability is incurred. A liability for post-employment benefits, including severance, is recorded upon attainment of certain criteria including when payment is probable, the amount is reasonably estimable, and the obligation relates to rights that have vested or accumulated. Facilities consolidation charges are calculated using estimates and are based upon the remaining future lease commitments for vacated facilities from the date of facility consolidation, net of estimated future sublease income. The estimated costs of vacating these leased facilities are based on market information and trend analysis.
We continually evaluate the adequacy of the remaining liabilities under our restructuring initiatives. Although we believe that these estimates accurately reflect the costs of our restructuring plans, actual results may differ, thereby requiring us to record additional provisions or reverse a portion of such provision.
41
New Accounting Pronouncements
See Note 4 of the accompanying consolidated financial statements for a full description of new accounting pronouncements, including the respective expected dates of adoption and effects on results of operations and financial condition.
Liquidity and Capital Resources
The following summarizes information regarding our cash, investments, and working capital (in thousands):
|
|
|
June 30, 2016 |
|
|
June 30, 2015 |
|
|
June 30, 2014 |
|
|||
|
Cash and cash equivalent |
|
$ |
94,122 |
|
|
$ |
76,225 |
|
|
$ |
73,190 |
|
|
Short term investments |
|
|
— |
|
|
|
— |
|
|
$ |
32,692 |
|
|
Total cash and investments |
|
$ |
94,122 |
|
|
$ |
76,225 |
|
|
$ |
105,882 |
|
|
Working capital |
|
$ |
17,195 |
|
|
$ |
2,564 |
|
|
$ |
56,548 |
|
As of June 30, 2016, our principal sources of liquidity consisted of cash and cash equivalents of $94.1 million, accounts receivable, net of $81.4 million and availability of borrowings from the Revolving Facility of $34.1 million as of June 30, 2016. We anticipate that our principal uses of cash will include repayments of debt and related interest, purchase of finished goods inventory from our contract manufacturers, payroll, restructuring expenses and other operating expenses related to the development, marketing of our products and purchases of property and equipment. We believe that our $94.1 million of cash and cash equivalents at June 30, 2016, cash flows from operations along with the availability of borrowings from the Revolving Facility will be sufficient to fund our principal uses of cash for at least the next 12 months.
The Senior Secured Credit Facilities, as amended, contain financial covenants that require us to maintain a minimum Consolidated Fixed Charge Coverage Ratio and Consolidated Quick Ratio and a maximum Consolidated Leverage Ratio and several other financial and non-financial covenants and restrictions that limit our ability, among other things, to incur additional indebtedness, create liens upon any of our property, merge, consolidate or sell all or substantially all of our assets.
The Senior Secured Credit Facilities, as amended, also include customary events of default, including failure to pay principal, interest or fees when due, failure to comply with covenants, any representation or warranty made by us being false or misleading in any material respect, certain insolvency or receivership events affecting our Company, the occurrence of certain material judgments, the occurrence of certain ERISA events, the invalidity of the loan documents or a change in control of our Company. The amounts outstanding under the Senior Secured Credit Facilities, as amended, may be accelerated upon certain events of default. We believe we are in compliance and expect to remain in compliance with the covenants of the Senior Secured Credit Facilities, as amended, and they are not expected to negatively impact our liquidity or capital resources. The Senior Secured Credit Facilities, as amended, is more fully described in Note 3 of Notes to Consolidated Financial Statements.
Key Components of Cash Flows and Liquidity
A summary of the sources and uses of cash and cash equivalents is as follows (in thousands):
|
|
|
Year Ended |
|
|||||||||
|
|
|
June 30, 2016 |
|
|
June 30, 2015 |
|
|
June 30, 2014 |
|
|||
|
Net cash provided by (used in) operating activities |
|
$ |
30,366 |
|
|
$ |
37,423 |
|
|
$ |
(26,843 |
) |
|
Net cash (used in) provided by investing activities |
|
|
(5,327 |
) |
|
|
21,598 |
|
|
|
(126,189 |
) |
|
Net cash (used in) provided by financing activities |
|
|
(6,738 |
) |
|
|
(52,470 |
) |
|
|
129,580 |
|
|
Foreign currency effect on cash |
|
|
(404 |
) |
|
|
(3,516 |
) |
|
|
839 |
|
|
Net increase (decrease) in cash and cash equivalents |
|
$ |
17,897 |
|
|
$ |
3,035 |
|
|
$ |
(22,613 |
) |
Cash, cash equivalents and short-term investments were $94.1 million at June 30, 2016, representing an increase of $17.9 million from $76.2 million at June 30, 2015. Cash and cash equivalents increased primarily due to cash provided by operations of $30.4 million offset by cash used in investing activities of $5.3 million, cash used in financing activities of $6.7 million and a negative foreign currency impact of $0.4 million.
42
Cash, cash equivalents and short-term investments were $76.2 million at June 30, 2015, representing a decrease of $29.7 million from $105.9 million at June 30, 2014. Cash and cash equivalents increased primarily due to cash provided by operations of $37.4 million and cash provided by investing activities of $21.6 million offset by cash used in financing activities of $52.5 million and foreign currency impact of $3.5 million.
Cash provided by operating activities for the year ended June 30, 2016 was $30.4 million compared to cash provided by operating activities of $37.4 million in fiscal 2015, a decrease of $7.1 million. The current year's net loss of $31.9 million was primarily offset by non-cash expenses such as amortization of intangibles, stock-based compensation, and depreciation. Other contributing factors to cash provided by operating activities for the year ended June 30, 2016 were decreases in accounts receivables and inventory as a source of cash offset by declines in the balance of our deferred revenues and accounts payable which decreased cash.
Cash provided by operating activities was $37.4 million during fiscal 2015 compared to cash used in operating activities of $26.8 million in fiscal 2014, an increase of $64.3 million. The net loss of $71.6 million during fiscal 2015 was primarily offset by non-cash expenses such as amortization of intangibles, stock-based compensation, and depreciation. Decreases in accounts receivables and increases in deferred revenue were also factors contributing to the cash provided by operating activities for the year ended June 30, 2015.
Cash used in operating activities was $26.8 million during fiscal 2014 compared to cash provided by operating activities of $32.2 million in fiscal 2013, a decrease of $59.1 million during the year ended June 30, 2014. The year's net loss of 57.3 million was primarily offset by non-cash expenses such as amortization of intangibles, stock-based compensation, and depreciation. Post-
42
43
acquisition increases in accounts receivables, inventory, accounts payable and deferred revenue were the primary factors contributing to the cash used in operating activities for the year ended June 30, 2014 .
Cash used in investing activities during fiscal 2016 totaled $5.3 million, was mainly due to capital expenditures.
Cash flow provided by investing activities during fiscal 2015 total $21.6 million, and was mainly due to proceeds from sales and maturities of investments of $32.4 million offset by capital expenditures of $7.2 million and purchase of non-marketable equity investment of $3.0 million.
Cash flow used in investing activities during fiscal 2014 was $126.2 million primarily from $180.0 million proceeds used for acquisition of Enterasys, capital expenditures of $22.4 million and purchases of investments of $9.0 million. Such decreases were offset by proceeds from maturities of investments and marketable securities of $28.7 million and sales of investments and marketable securities of $56.6 million.
Cash used in financing activities during fiscal 2016 was $6.7 million due to the repayment of debt of $26.4 million offset by borrowings of $15.0 million on the Revolving Facility for working capital requirements and proceeds from the sale of common stock of $4.6 million primarily through our Employee Stock Purchase Plan.
Cash flow used in financing activities during fiscal 2015 was $52.5 million mainly due to the repayment of debt of $78.7 million offset with borrowings of $24.0 million on the Revolving Facility for working capital requirements.
Cash flow provided by financing activities during 2014 was $129.6 million resulting from issuance of Term Loan of $65 million and a draw on the Revolving Facility of $59 million used for the acquisition of Enterasys and working capital requirements, and $8.0 million proceeds from the exercise of stock options and purchases of shares of our common stock under the ESPP, net of taxes paid on vested and released stock awards.
Contractual Obligations
The following summarizes our contractual obligations at June 30, 2016, and the effect such obligations are expected to have on our liquidity and cash flow in future periods (in thousands):
|
|
|
Total |
|
|
Less than 1 Year |
|
|
1-3 years |
|
|
3-5 years |
|
|
More than 5 years |
|
|||||
|
Contractual Obligations: |
|
|
|
|
|
|
|
|
|
|
|
|
|
|
|
|
|
|
|
|
|
Debt obligations |
|
$ |
55,500 |
|
|
$ |
17,875 |
|
|
$ |
37,625 |
|
|
$ |
— |
|
|
$ |
— |
|
|
Interest on debt obligations |
|
|
2,925 |
|
|
|
1,703 |
|
|
|
1,222 |
|
|
|
— |
|
|
|
— |
|
|
Non-cancellable inventory purchase commitments |
|
|
63,676 |
|
|
|
63,676 |
|
|
|
— |
|
|
|
— |
|
|
|
— |
|
|
Non-cancellable operating lease obligations |
|
|
55,391 |
|
|
|
9,733 |
|
|
|
17,116 |
|
|
|
15,466 |
|
|
|
13,076 |
|
|
Other liabilities |
|
|
1,911 |
|
|
|
1,716 |
|
|
|
195 |
|
|
|
— |
|
|
|
— |
|
|
Total contractual cash obligations |
|
$ |
179,403 |
|
|
$ |
94,703 |
|
|
$ |
56,158 |
|
|
$ |
15,466 |
|
|
$ |
13,076 |
|
Non-cancelable inventory purchase commitments represent the purchase of long lead-time component inventory that our contract manufacturers procure in accordance with our forecast. Inventory purchase commitments were $63.7 million as of June 30, 2016, a decrease of $6.2 million from $69.9 million as of June 30, 2015.
Non-cancelable operating lease obligations represent base rents and operating expense obligations to landlords for facilities we occupy at various locations.
Other liabilities include the Company's commitments towards debt related fees and specific arrangements other than inventory.
The amounts in the table above exclude income tax liabilities related to uncertain tax positions as existing tax attributes of the Company are available to offset any potential income tax obligations.
We did not have any material commitments for capital expenditures as of June 30, 2016.
44
Off-Balance Sheet Arrangements
We did not have any off-balance sheet arrangements as of June 30, 2016.
Capital Resources and Financial Condition
As of June 30, 2016, we had $94.1 million in cash and cash equivalents. We believe that our current cash, cash equivalents, cash available from future operations along with the availability of borrowings from the Revolving Facility will enable us to meet our working capital requirements for at least the next 12 months.
45
Item 7A. Quantitative and Qualitative Disclosures About Market Risk
Interest Rate Sensitivity
The primary objective of our investment activities is to preserve principal while at the same time maximize the income we receive from our investments without significantly increasing risk. Some of the securities we have invested in may be subject to market risk. This means that a change in prevailing interest rates may cause the principal amount of the investment to fluctuate. For example, if we hold a security that was issued with a fixed interest rate at the then-prevailing rate and the prevailing interest rate later rises, the principal amount of our investment will probably decline. To reduce/address this risk, we maintain our portfolio of cash equivalents and short-term investments in a variety of securities, including commercial paper, other non-government debt securities and money market funds.
The valuation of our investment portfolio is subject to uncertainties that are difficult to predict. Factors that may impact its valuation include changes to credit ratings of the securities, discount rates and ongoing strength and quality of market credit and liquidity.
If the current market conditions deteriorate further, or the anticipated recovery in market values does not occur, we may be required to record impairment charges in future quarters.
The following table presents the amounts of our cash equivalents that are subject to market risk by range of expected maturity and weighted-average interest rates as of June 30, 2016. This table does not include money market funds as those funds are generally not considered subject to market risk We did not have any short-term investments or marketable securities as of June 30, 2016, (dollars in thousands):
|
|
|
Maturing in |
|
|||||||||||||||||
|
|
|
Three months or less |
|
|
Three months to one year |
|
|
Greater than one year |
|
|
Total |
|
|
Fair Value |
|
|||||
|
June 30, 2016 |
|
|
|
|
|
|
|
|
|
|
|
|
|
|
|
|
|
|
|
|
|
Included in cash equivalents |
|
$ |
4,275 |
|
|
$ |
— |
|
|
$ |
— |
|
|
$ |
4,275 |
|
|
$ |
4,275 |
|
|
Weighted average interest rate |
|
|
0.20 |
% |
|
|
— |
% |
|
|
— |
% |
|
|
|
|
|
|
|
|
The following table presents hypothetical changes in the fair value of financial instruments held at June 30, 2016, that are sensitive to changes in interest rates (in thousands):
|
Unrealized gain given a decrease in interest rate of X bps |
|
|
Fair value as of |
|
|
Unrealized loss given an increase in interest rate of X bps |
|
|||||||||||
|
(100 bps) |
|
|
(50 bps) |
|
|
June 30, 2016 |
|
|
100 bps |
|
|
50 bps |
|
|||||
|
$ |
— |
|
|
$ |
— |
|
|
$ |
4,275 |
|
|
$ |
— |
|
|
$ |
— |
|
Debt
At certain points in time we are exposed to the impact of interest rate fluctuations, primarily in the form of variable rate borrowings from our Senior Secured Credit Facilities, as amended, that we entered into on October 31, 2013. Our debt and Senior Secured Credit Facilities, as amended, are fully described in the Note 3 of our Notes to the Consolidated Financial Statements. At June 30, 2016 we had $55.5 million of debt outstanding, all of which was from our Senior Secured Credit Facilities, as amended. Through the end of our fiscal year, the average daily outstanding amount was $58.8 million with a low of $55.5 million and a high of $66.9 million.
The following table presents hypothetical changes in interest expense for the year ended June 30, 2016, on the outstanding credit facility borrowings as of June 30, 2016, that are sensitive to changes in interest rates (in thousands):
|
Change in interest expense given a decrease in interest rate of X bps* |
|
|
Average outstanding debt as of |
|
|
Change in interest expense given an increase in interest rate of X bps |
|
|||||||||||
|
(100 bps) |
|
|
(50 bps) |
|
|
June 30, 2016 |
|
|
100 bps |
|
|
50 bps |
|
|||||
|
$ |
(147 |
) |
|
$ |
(73 |
) |
|
$ |
58,750 |
|
|
$ |
147 |
|
|
$ |
73 |
|
46
Exchange Rate Sensitivity
Currently, the majority of our sales and our expenses are denominated in United States Dollars and, as a result, we have not experienced significant foreign exchange gains and losses to date. While we conduct sales transactions and incur certain operating expenses in foreign currencies and expect to continue to do so, we do not anticipate that foreign exchange gains or losses will be significant.
Foreign Exchange Forward Contracts
At June 30, 2016 and 2015, we did not have any forward foreign currency contracts.
Foreign currency transaction gains and losses from operations were a gain of $1.3 million in fiscal 2016 and losses of $1.0 million and $1.5 million in fiscal years 2015 and 2014, respectively.
47
Item 8. Financial Statements and Supplementary Data
INDEX TO CONSOLIDATED FINANCIAL STATEMENTS OF EXTREME NETWORKS, INC.
|
|
|
Page |
|
|
49 |
|
|
|
|
|
|
|
50 |
|
|
|
|
|
|
|
51 |
|
|
|
|
|
|
|
52 |
|
|
|
|
|
|
|
53 |
|
|
|
|
|
|
|
54 |
|
|
|
|
|
|
|
55 |
48
Report of Independent Registered Public Accounting Firm
The Board of Directors and Stockholders
Extreme Networks, Inc.:
We have audited the accompanying consolidated balance sheets of Extreme Networks, Inc. and subsidiaries (the Company) as of June 30, 2016 and 2015, and the related consolidated statements of operations, comprehensive loss, stockholders’ equity, and cash flows for each of the years in the three-year period ended June 30, 2016. We also have audited the Company’s internal control over financial reporting as of June 30, 2016, based on criteria established in Internal Control – Integrated Framework (2013) issued by the Committee of Sponsoring Organizations of the Treadway Commission (COSO). The Company’s management is responsible for these consolidated financial statements, for maintaining effective internal control over financial reporting, and for its assessment of the effectiveness of internal control over financial reporting, included in the accompanying Management’s Report on Internal Control over Financial Reporting under item 9A. Our responsibility is to express an opinion on these consolidated financial statements and an opinion on the Company’s internal control over financial reporting based on our audits.
We conducted our audits in accordance with the standards of the Public Company Accounting Oversight Board (United States). Those standards require that we plan and perform the audits to obtain reasonable assurance about whether the financial statements are free of material misstatement and whether effective internal control over financial reporting was maintained in all material respects. Our audits of the consolidated financial statements included examining, on a test basis, evidence supporting the amounts and disclosures in the financial statements, assessing the accounting principles used and significant estimates made by management, and evaluating the overall financial statement presentation. Our audit of internal control over financial reporting included obtaining an understanding of internal control over financial reporting, assessing the risk that a material weakness exists, and testing and evaluating the design and operating effectiveness of internal control based on the assessed risk. Our audits also included performing such other procedures as we considered necessary in the circumstances. We believe that our audits provide a reasonable basis for our opinions.
A company’s internal control over financial reporting is a process designed to provide reasonable assurance regarding the reliability of financial reporting and the preparation of financial statements for external purposes in accordance with generally accepted accounting principles. A company’s internal control over financial reporting includes those policies and procedures that (1) pertain to the maintenance of records that, in reasonable detail, accurately and fairly reflect the transactions and dispositions of the assets of the company; (2) provide reasonable assurance that transactions are recorded as necessary to permit preparation of financial statements in accordance with generally accepted accounting principles, and that receipts and expenditures of the company are being made only in accordance with authorizations of management and directors of the company; and (3) provide reasonable assurance regarding prevention or timely detection of unauthorized acquisition, use, or disposition of the company’s assets that could have a material effect on the financial statements.
Because of its inherent limitations, internal control over financial reporting may not prevent or detect misstatements. Also, projections of any evaluation of effectiveness to future periods are subject to the risk that controls may become inadequate because of changes in conditions, or that the degree of compliance with the policies or procedures may deteriorate.
In our opinion, the consolidated financial statements referred to above present fairly, in all material respects, the financial position of Extreme Networks, Inc. and subsidiaries as of June 30, 2016 and 2015, and the results of its operations and its cash flows for each of the years in the three-year period ended June 30, 2016, in conformity with U.S. generally accepted accounting principles. Also in our opinion, Extreme Networks, Inc. maintained, in all material respects, effective internal control over financial reporting as of June 30, 2016, based on criteria established in Internal Control – Integrated Framework (2013) issued by the Committee of Sponsoring Organizations of the Treadway Commission (COSO).
/s/ KPMG LLP
Santa Clara, California
September 2, 2016
49
EXTREME NETWORKS, INC.
(In thousands, except share and per share amounts)
|
|
|
June 30, 2016 |
|
|
June 30, 2015 |
|
||
|
ASSETS |
|
|
|
|
|
|
|
|
|
Current assets: |
|
|
|
|
|
|
|
|
|
Cash and cash equivalents |
|
$ |
94,122 |
|
|
$ |
76,225 |
|
|
Accounts receivable, net of allowances of $3,257 at June 30, 2016 and $2,396 at June 30, 2015 |
|
|
81,419 |
|
|
|
92,737 |
|
|
Inventories |
|
|
40,989 |
|
|
|
58,014 |
|
|
Deferred income taxes |
|
|
— |
|
|
|
760 |
|
|
Prepaid expenses and other current assets |
|
|
12,438 |
|
|
|
10,258 |
|
|
Total current assets |
|
|
228,968 |
|
|
|
237,994 |
|
|
Property and equipment, net |
|
|
29,580 |
|
|
|
39,862 |
|
|
Intangible assets, net |
|
|
19,762 |
|
|
|
52,132 |
|
|
Goodwill |
|
|
70,877 |
|
|
|
70,877 |
|
|
Other assets |
|
|
25,662 |
|
|
|
27,795 |
|
|
Total assets |
|
$ |
374,849 |
|
|
$ |
428,660 |
|
|
LIABILITIES AND STOCKHOLDERS’ EQUITY |
|
|
|
|
|
|
|
|
|
Current liabilities: |
|
|
|
|
|
|
|
|
|
Current portion of long-term debt |
|
$ |
17,875 |
|
|
$ |
11,375 |
|
|
Accounts payable |
|
|
30,711 |
|
|
|
40,135 |
|
|
Accrued compensation and benefits |
|
|
27,145 |
|
|
|
25,195 |
|
|
Accrued warranty |
|
|
9,600 |
|
|
|
8,676 |
|
|
Deferred revenue, net |
|
|
72,934 |
|
|
|
76,551 |
|
|
Deferred distributors revenue, net of cost of sales to distributors |
|
|
26,817 |
|
|
|
40,875 |
|
|
Other accrued liabilities |
|
|
26,691 |
|
|
|
32,623 |
|
|
Total current liabilities |
|
|
211,773 |
|
|
|
235,430 |
|
|
Deferred revenue, less current portion |
|
|
21,926 |
|
|
|
23,231 |
|
|
Long-term debt, less current portion |
|
|
37,625 |
|
|
|
55,500 |
|
|
Deferred income taxes |
|
|
4,693 |
|
|
|
2,979 |
|
|
Other long-term liabilities |
|
|
8,635 |
|
|
|
7,285 |
|
|
Commitments and contingencies (Note 8) |
|
|
|
|
|
|
|
|
|
Stockholders’ equity: |
|
|
|
|
|
|
|
|
|
Convertible preferred stock, $.001 par value, issuable in series, 2,000,000 shares authorized; none issued |
|
|
— |
|
|
|
— |
|
|
Common stock, $.001 par value, 750,000,000 shares authorized; 104,942,665 shares issued and outstanding at June 30, 2016 and 100,284,106 shares issued and outstanding at June 30, 2015 |
|
|
105 |
|
|
|
100 |
|
|
Additional paid-in-capital |
|
|
884,706 |
|
|
|
865,282 |
|
|
Accumulated other comprehensive loss |
|
|
(2,874 |
) |
|
|
(1,291 |
) |
|
Accumulated deficit |
|
|
(791,740 |
) |
|
|
(759,856 |
) |
|
Total stockholders’ equity |
|
|
90,197 |
|
|
|
104,235 |
|
|
Total liabilities and stockholders’ equity |
|
$ |
374,849 |
|
|
$ |
428,660 |
|
See accompanying notes to consolidated financial statements.
50
EXTREME NETWORKS, INC.
CONSOLIDATED STATEMENTS OF OPERATIONS
(In thousands, except per share amounts)
|
|
|
Year Ended |
|
|||||||||
|
|
|
June 30, 2016 |
|
|
June 30, 2015 |
|
|
June 30, 2014 |
|
|||
|
Net revenues: |
|
|
|
|
|
|
|
|
|
|
|
|
|
Product |
|
$ |
395,464 |
|
|
$ |
418,046 |
|
|
$ |
411,761 |
|
|
Service |
|
|
132,925 |
|
|
|
134,894 |
|
|
|
107,793 |
|
|
Total net revenues |
|
|
528,389 |
|
|
|
552,940 |
|
|
|
519,554 |
|
|
Cost of revenues: |
|
|
|
|
|
|
|
|
|
|
|
|
|
Product |
|
|
208,739 |
|
|
|
225,018 |
|
|
|
213,673 |
|
|
Service |
|
|
48,862 |
|
|
|
48,185 |
|
|
|
38,552 |
|
|
Total cost of revenues |
|
|
257,601 |
|
|
|
273,203 |
|
|
|
252,225 |
|
|
Gross profit: |
|
|
|
|
|
|
|
|
|
|
|
|
|
Product |
|
|
186,725 |
|
|
|
193,028 |
|
|
|
198,088 |
|
|
Service |
|
|
84,063 |
|
|
|
86,709 |
|
|
|
69,241 |
|
|
Total gross profit |
|
|
270,788 |
|
|
|
279,737 |
|
|
|
267,329 |
|
|
Operating expenses: |
|
|
|
|
|
|
|
|
|
|
|
|
|
Research and development |
|
|
78,721 |
|
|
|
93,447 |
|
|
|
77,146 |
|
|
Sales and marketing |
|
|
150,806 |
|
|
|
169,299 |
|
|
|
156,666 |
|
|
General and administrative |
|
|
37,675 |
|
|
|
42,092 |
|
|
|
40,812 |
|
|
Acquisition and integration costs |
|
|
1,145 |
|
|
|
10,205 |
|
|
|
25,716 |
|
|
Restructuring charge, net of reversals |
|
|
10,990 |
|
|
|
9,819 |
|
|
|
510 |
|
|
Amortization of intangibles |
|
|
17,001 |
|
|
|
17,869 |
|
|
|
16,711 |
|
|
Total operating expenses |
|
|
296,338 |
|
|
|
342,731 |
|
|
|
317,561 |
|
|
Operating loss |
|
|
(25,550 |
) |
|
|
(62,994 |
) |
|
|
(50,232 |
) |
|
Interest income |
|
|
113 |
|
|
|
541 |
|
|
|
751 |
|
|
Interest expense |
|
|
(3,098 |
) |
|
|
(3,177 |
) |
|
|
(2,085 |
) |
|
Other income (expense), net |
|
|
987 |
|
|
|
(1,206 |
) |
|
|
(1,555 |
) |
|
Loss before income taxes |
|
|
(27,548 |
) |
|
|
(66,836 |
) |
|
|
(53,121 |
) |
|
Provision for income taxes |
|
|
4,336 |
|
|
|
4,807 |
|
|
|
4,189 |
|
|
Net loss |
|
$ |
(31,884 |
) |
|
$ |
(71,643 |
) |
|
$ |
(57,310 |
) |
|
Basic and diluted net loss per share: |
|
|
|
|
|
|
|
|
|
|
|
|
|
Net loss per share - basic |
|
$ |
(0.31 |
) |
|
$ |
(0.72 |
) |
|
$ |
(0.60 |
) |
|
Net loss per share - diluted |
|
$ |
(0.31 |
) |
|
$ |
(0.72 |
) |
|
$ |
(0.60 |
) |
|
Shares used in per share calculation - basic |
|
|
103,074 |
|
|
|
99,000 |
|
|
|
95,515 |
|
|
Shares used in per share calculation - diluted |
|
|
103,074 |
|
|
|
99,000 |
|
|
|
95,515 |
|
See accompanying notes to consolidated financial statements.
51
EXTREME NETWORKS, INC.
CONSOLIDATED STATEMENTS OF COMPREHENSIVE LOSS
(In thousands)
|
|
|
Year Ended |
|
|||||||||
|
|
|
June 30, 2016 |
|
|
June 30, 2015 |
|
|
June 30, 2014 |
|
|||
|
Net loss: |
|
$ |
(31,884 |
) |
|
$ |
(71,643 |
) |
|
$ |
(57,310 |
) |
|
Other comprehensive income (loss), net of tax: |
|
|
|
|
|
|
|
|
|
|
|
|
|
Available for sale securities: |
|
|
|
|
|
|
|
|
|
|
|
|
|
Change in unrealized gains (losses) on available for sale securities, net of taxes |
|
|
— |
|
|
|
(26 |
) |
|
|
136 |
|
|
Reclassification of adjustment for realized net gains on available for sale securities included in net loss |
|
|
— |
|
|
|
— |
|
|
|
158 |
|
|
Net change in unrealized gains (losses) on available for sale securities, net of taxes |
|
|
— |
|
|
|
(26 |
) |
|
|
294 |
|
|
Net change in foreign currency translation adjustments |
|
|
(1,583 |
) |
|
|
(826 |
) |
|
|
644 |
|
|
Other comprehensive income (loss) |
|
|
(1,583 |
) |
|
|
(852 |
) |
|
|
938 |
|
|
Total comprehensive loss |
|
$ |
(33,467 |
) |
|
$ |
(72,495 |
) |
|
$ |
(56,372 |
) |
See accompanying notes to consolidated financial statements.
52
EXTREME NETWORKS, INC.
CONSOLIDATED STATEMENTS OF STOCKHOLDERS’ EQUITY
(In thousands)
|
|
Common Stock |
|
|
|
|
|
|
|
|
|
|
|
|
|
|
|
|
|
|||||
|
|
Shares |
|
|
Amount |
|
|
Additional Paid-In-Capital |
|
|
Accumulated Other Comprehesive Loss |
|
|
Accumulated Deficit |
|
|
Total Stockholders' Equity |
|
||||||
|
Balance at June 30, 2013 |
|
93,626 |
|
|
$ |
94 |
|
|
$ |
821,331 |
|
|
$ |
(1,377 |
) |
|
$ |
(630,903 |
) |
|
$ |
189,145 |
|
|
Net loss |
|
— |
|
|
|
— |
|
|
|
— |
|
|
|
— |
|
|
|
(57,310 |
) |
|
|
(57,310 |
) |
|
Other comprehensive income, net of tax: |
|
— |
|
|
|
— |
|
|
|
— |
|
|
|
938 |
|
|
|
— |
|
|
|
938 |
|
|
Comprehensive loss |
|
— |
|
|
|
— |
|
|
|
— |
|
|
|
— |
|
|
|
— |
|
|
|
(56,372 |
) |
|
Exercise of options to purchase common stock |
|
1,791 |
|
|
|
2 |
|
|
|
6,436 |
|
|
|
— |
|
|
|
— |
|
|
|
6,438 |
|
|
Issuance of employees stock purchase plan |
|
762 |
|
|
|
— |
|
|
|
3,166 |
|
|
|
— |
|
|
|
— |
|
|
|
3,166 |
|
|
Issuance of restricted stock, net of tax |
|
801 |
|
|
|
1 |
|
|
|
(1,588 |
) |
|
|
— |
|
|
|
— |
|
|
|
(1,587 |
) |
|
Share-Based payments |
|
— |
|
|
|
— |
|
|
|
15,922 |
|
|
|
— |
|
|
|
— |
|
|
|
15,922 |
|
|
Balance at June 30, 2014 |
|
96,980 |
|
|
$ |
97 |
|
|
$ |
845,267 |
|
|
$ |
(439 |
) |
|
$ |
(688,213 |
) |
|
$ |
156,712 |
|
|
Net loss |
|
— |
|
|
|
— |
|
|
|
— |
|
|
|
— |
|
|
|
(71,643 |
) |
|
|
(71,643 |
) |
|
Other comprehensive loss, net of tax: |
|
— |
|
|
|
— |
|
|
|
— |
|
|
|
(852 |
) |
|
|
— |
|
|
|
(852 |
) |
|
Comprehensive loss |
|
— |
|
|
|
— |
|
|
|
— |
|
|
|
— |
|
|
|
— |
|
|
|
(72,495 |
) |
|
Exercise of options to purchase common stock |
|
447 |
|
|
|
— |
|
|
|
1,392 |
|
|
|
— |
|
|
|
— |
|
|
|
1,392 |
|
|
Issuance of employees stock purchase plan |
|
1,138 |
|
|
|
2 |
|
|
|
3,578 |
|
|
|
— |
|
|
|
— |
|
|
|
3,580 |
|
|
Issuance of restricted stock, net of tax |
|
1,719 |
|
|
|
1 |
|
|
|
(2,756 |
) |
|
|
— |
|
|
|
— |
|
|
|
(2,755 |
) |
|
Share-Based payments |
|
— |
|
|
|
— |
|
|
|
17,801 |
|
|
|
— |
|
|
|
— |
|
|
|
17,801 |
|
|
Balance at June 30, 2015 |
|
100,284 |
|
|
$ |
100 |
|
|
$ |
865,282 |
|
|
$ |
(1,291 |
) |
|
$ |
(759,856 |
) |
|
$ |
104,235 |
|
|
Net Loss |
|
— |
|
|
|
— |
|
|
|
— |
|
|
|
— |
|
|
|
(31,884 |
) |
|
|
(31,884 |
) |
|
Other comprehensive loss, net of tax: |
|
— |
|
|
|
— |
|
|
|
— |
|
|
|
(1,583 |
) |
|
|
— |
|
|
|
(1,583 |
) |
|
Comprehensive loss |
|
— |
|
|
|
— |
|
|
|
— |
|
|
|
— |
|
|
|
— |
|
|
|
(33,467 |
) |
|
Exercise of options to purchase common stock |
|
382 |
|
|
|
— |
|
|
|
1,012 |
|
|
|
— |
|
|
|
— |
|
|
|
1,012 |
|
|
Issuance of employees stock purchase plan |
|
2,000 |
|
|
|
2 |
|
|
|
3,848 |
|
|
|
— |
|
|
|
— |
|
|
|
3,850 |
|
|
Issuance of restricted stock, net of tax |
|
2,277 |
|
|
|
3 |
|
|
|
(228 |
) |
|
|
— |
|
|
|
— |
|
|
|
(225 |
) |
|
Share-Based payments |
|
— |
|
|
|
— |
|
|
|
14,792 |
|
|
|
— |
|
|
|
— |
|
|
|
14,792 |
|
|
Balance at June 30, 2016 |
|
104,943 |
|
|
$ |
105 |
|
|
$ |
884,706 |
|
|
$ |
(2,874 |
) |
|
$ |
(791,740 |
) |
|
$ |
90,197 |
|
See accompanying notes to consolidated financial statements.
53
EXTREME NETWORKS, INC.
CONSOLIDATED STATEMENTS OF CASH FLOWS
(In thousands)
|
|
|
Year Ended |
|
|||||||||
|
|
|
June 30, 2016 |
|
|
June 30, 2015 |
|
|
June 30, 2014 |
|
|||
|
Cash flows from operating activities: |
|
|
|
|
|
|
|
|
|
|
|
|
|
Net loss |
|
$ |
(31,884 |
) |
|
$ |
(71,643 |
) |
|
$ |
(57,310 |
) |
|
Adjustments to reconcile net loss to net cash provided by operating activities: |
|
|
|
|
|
|
|
|
|
|
|
|
|
Depreciation |
|
|
10,802 |
|
|
|
12,832 |
|
|
|
10,628 |
|
|
Amortization of intangible assets |
|
|
32,370 |
|
|
|
35,951 |
|
|
|
28,771 |
|
|
Provision for doubtful accounts and allowance for product returns |
|
|
1,140 |
|
|
|
4,246 |
|
|
|
2,366 |
|
|
Stock-based compensation |
|
|
14,792 |
|
|
|
17,801 |
|
|
|
15,922 |
|
|
Non-cash restructuring charges |
|
|
4,463 |
|
|
|
— |
|
|
|
— |
|
|
Other non-cash charges |
|
|
1,020 |
|
|
|
2,323 |
|
|
|
3,666 |
|
|
Changes in operating assets and liabilities, net |
|
|
|
|
|
|
|
|
|
|
|
|
|
Accounts receivable |
|
|
10,178 |
|
|
|
27,681 |
|
|
|
(56,116 |
) |
|
Inventories |
|
|
17,025 |
|
|
|
(904 |
) |
|
|
(7,280 |
) |
|
Prepaid expenses and other assets |
|
|
100 |
|
|
|
(2,240 |
) |
|
|
2,288 |
|
|
Accounts payable |
|
|
(9,562 |
) |
|
|
2,827 |
|
|
|
(4,234 |
) |
|
Accrued compensation and benefits |
|
|
1,949 |
|
|
|
(1,482 |
) |
|
|
(570 |
) |
|
Deferred revenue |
|
|
(4,922 |
) |
|
|
2,104 |
|
|
|
18,689 |
|
|
Deferred distributor revenue, net of cost of sales to distributors |
|
|
(14,058 |
) |
|
|
8,883 |
|
|
|
13,537 |
|
|
Other current and long term liabilities |
|
|
(3,047 |
) |
|
|
(956 |
) |
|
|
2,800 |
|
|
Net cash provided by (used in) operating activities |
|
|
30,366 |
|
|
|
37,423 |
|
|
|
(26,843 |
) |
|
Cash flows from investing activities: |
|
|
|
|
|
|
|
|
|
|
|
|
|
Capital expenditures |
|
|
(5,327 |
) |
|
|
(7,205 |
) |
|
|
(22,373 |
) |
|
Acquisition, net of cash acquired |
|
|
— |
|
|
|
— |
|
|
|
(180,000 |
) |
|
Purchases of non-marketable equity investment |
|
|
— |
|
|
|
(3,000 |
) |
|
|
— |
|
|
Purchases of investments |
|
|
— |
|
|
|
— |
|
|
|
(9,045 |
) |
|
Proceeds from maturities of investments and marketable securities |
|
|
— |
|
|
|
23,321 |
|
|
|
28,722 |
|
|
Proceeds from sales of investments and marketable securities |
|
|
— |
|
|
|
9,051 |
|
|
|
56,594 |
|
|
Purchases of intangible assets |
|
|
— |
|
|
|
(569 |
) |
|
|
(87 |
) |
|
Net cash (used in) provided by investing activities |
|
|
(5,327 |
) |
|
|
21,598 |
|
|
|
(126,189 |
) |
|
Cash flows from financing activities: |
|
|
|
|
|
|
|
|
|
|
|
|
|
Borrowings under Revolving Facility |
|
|
15,000 |
|
|
|
24,000 |
|
|
|
83,000 |
|
|
Borrowings under Term Loan |
|
|
— |
|
|
|
— |
|
|
|
65,000 |
|
|
Repayment of debt |
|
|
(26,375 |
) |
|
|
(78,688 |
) |
|
|
(26,437 |
) |
|
Proceeds from issuance of common stock |
|
|
4,637 |
|
|
|
2,218 |
|
|
|
8,017 |
|
|
Net cash (used in) provided by financing activities |
|
|
(6,738 |
) |
|
|
(52,470 |
) |
|
|
129,580 |
|
|
Foreign currency effect on cash |
|
|
(404 |
) |
|
|
(3,516 |
) |
|
|
839 |
|
|
Net increase (decrease) in cash and cash equivalents |
|
|
17,897 |
|
|
|
3,035 |
|
|
|
(22,613 |
) |
|
|
|
|
|
|
|
|
|
|
|
|
|
|
|
Cash and cash equivalents at beginning of period |
|
|
76,225 |
|
|
|
73,190 |
|
|
|
95,803 |
|
|
Cash and cash equivalents at end of period |
|
$ |
94,122 |
|
|
$ |
76,225 |
|
|
$ |
73,190 |
|
|
|
|
|
|
|
|
|
|
|
|
|
|
|
|
Supplemental disclosure of cash flow information: |
|
|
|
|
|
|
|
|
|
|
|
|
|
Cash paid for interest |
|
$ |
2,613 |
|
|
$ |
2,361 |
|
|
$ |
1,852 |
|
|
Cash paid for taxes, net |
|
$ |
2,355 |
|
|
$ |
1,582 |
|
|
$ |
2,864 |
|
|
Non-cash investing activities: |
|
|
|
|
|
|
|
|
|
|
|
|
|
Unpaid capital expenditures |
|
$ |
741 |
|
|
$ |
316 |
|
|
$ |
310 |
|
See accompanying notes to the consolidated financial statements.
54
EXTREME NETWORKS, INC.
NOTES TO CONSOLIDATED FINANCIAL STATEMENTS
1. Description of Business and Basis of Presentation
Extreme Networks, Inc., together with its subsidiaries (collectively referred to as “Extreme” or “the Company”) is a leader in providing software-driven networking solutions for enterprise customers. The Company conducts its sales and marketing activities on a worldwide basis through distributors, resellers and the Company’s field sales organization. Extreme was incorporated in California in 1996 and reincorporated in Delaware in 1999.
Fiscal Year
The Company uses a fiscal calendar year ending on June 30. All references herein to "fiscal 2016" or "2016"; “fiscal 2015” or “2015”; "fiscal 2014" or "2014" represent the fiscal years ending June 30, 2016, 2015 and 2014, respectively .
Principles of Consolidation
The consolidated financial statements include the accounts of Extreme Networks and its wholly-owned subsidiaries. All inter-company accounts and transactions have been eliminated.
The Company predominantly uses the United States Dollar as its functional currency. The functional currency for certain of its foreign subsidiaries is the local currency. For those subsidiaries that operate in a local currency functional environment, all assets and liabilities are translated to United States Dollars at current month end rates of exchange; and revenue and expenses are translated using the monthly average rate.
Accounting Estimates
The preparation of financial statements and related disclosures in conformity with accounting principles generally accepted in the United States requires management to make estimates and assumptions that affect the amounts reported in the financial statements and accompanying notes. Estimates are used for, but are not limited to, the accounting for the allowances for doubtful accounts and sales returns, determining the fair value of acquired assets and assumed liabilities, estimated selling prices, inventory valuation and purchase commitments, depreciation and amortization, impairment of long-lived assets including goodwill, warranty accruals, restructuring liabilities, measurement of share-based compensation costs and income taxes. Actual results could differ materially from these estimates.
2. Business Combinations
On October 31, 2013 (the “Acquisition Date”), the Company completed the acquisition of Enterasys Networks, Inc. ("Enterasys"), a privately held provider of wired and wireless network infrastructure and security solutions, for $180.0 million, net of cash acquired. The Company also assumed outstanding options and restricted stock units of Enterasys at the Acquisition Date, all of which were unvested.
The acquisition has been accounted for using the acquisition method of accounting. The purchase price allocation as of the Acquisition Date is set forth in the table below and reflects various fair value estimates. These estimates were determined through established and generally accepted valuation techniques, including work performed by third-party valuation specialists. All valuations were considered finalized as of September 30, 2014.
55
EXTREME NETWORKS, INC.
NOTES TO CONSOLIDATED FINANCIAL STATEMENTS—(Continued)
The following table below summarizes the allocation as of September 30, 2014 of the tangible and identifiable intangible assets acquired and liabilities assumed:
|
|
|
September 30, 2014 |
|
|
|
Cash |
|
$ |
7,397 |
|
|
Receivables |
|
|
23,271 |
|
|
Inventory |
|
|
33,662 |
|
|
Other current assets |
|
|
7,374 |
|
|
Property and equipment |
|
|
21,293 |
|
|
Identifiable intangible assets |
|
|
108,900 |
|
|
In-process research and development |
|
|
3,000 |
|
|
Deferred tax assets |
|
|
9 |
|
|
Other assets |
|
|
7,343 |
|
|
Goodwill |
|
|
70,877 |
|
|
Current liabilities |
|
|
(81,535 |
) |
|
Other long-term liabilities |
|
|
(14,194 |
) |
|
Total purchase price allocation |
|
$ |
187,397 |
|
|
Less: Cash acquired from acquisition |
|
|
(7,397 |
) |
|
Total purchase price consideration, net of cash acquired |
|
$ |
180,000 |
|
There were no adjustments to the allocation of assets acquired or liabilities assumed from June 30, 2014 through the time the Company finalized the allocation as of September 30, 2014.
The fair value of the acquired intangible assets was estimated using an income approach. Under this method, an intangible asset's fair value is equal to the present value of the incremental after-tax cash flows (excess earnings) attributable solely to the intangible asset over its remaining useful life. To calculate fair value, the Company used cash flows discounted at rates considered appropriate given the inherent risks associated with each type of asset. The Company believes that the level and timing of cash flows appropriately reflect market participant assumptions. Cash flows were assumed to extend through the remaining economic useful life of each class of intangible asset.
The fair value of the acquired deferred revenue was estimated using the cost build-up approach. The cost build-up approach determines fair value using estimates of the costs required to provide the contracted deliverables plus an assumed profit. The total costs including the assumed profit were adjusted to present value using a discount rate considered appropriate. The resulting fair value approximates the amount that the Company would be required to pay a third party to assume the obligation. The fair value of the deferred revenue obligation is affected most significantly by the estimated costs required to support the obligation, but is also affected by the assumed profit and the discount rate.
The following table presents details of the identifiable intangible assets acquired as part of the acquisition (in thousands):
|
Intangible Assets |
|
Estimated Useful Life (in years) |
|
Amount |
|
|
|
Developed technology |
|
3 |
|
$ |
45,000 |
|
|
Customer relationships |
|
3 |
|
|
37,000 |
|
|
Maintenance contracts |
|
5 |
|
|
17,000 |
|
|
Trademarks |
|
3 |
|
|
2,500 |
|
|
Order backlog |
|
1 |
|
|
7,400 |
|
|
Total identifiable intangible assets |
|
3 |
|
$ |
108,900 |
|
The amortization for the developed technology is recorded in “Cost of revenues” for product and the amortization for the remaining intangibles is recorded in “Amortization of intangibles” on the consolidated statement of operations. The goodwill recognized is attributable primarily to expected synergies and the assembled workforce of Enterasys. The Company anticipates both the goodwill and intangible assets to be fully deductible for tax purposes.
56
EXTREME NETWORKS, INC.
NOTES TO CONSOLIDATED FINANCIAL STATEMENTS—(Continued)
The Company had an indefinite-lived asset of $3.0 million as of the Acquisition Date which represents the fair value of in-process research and development activities. The Company completed the research and development efforts in the fourth quarter of fiscal 2014 and has determined that the asset is an identifiable intangible asset with an estimated useful life of three years. The results of operations of Enterasys are included in the consolidated results of operations beginning October 31, 2013. For the year ended June 30, 2014, $227.7 million of revenue and $13.5 million of operating income from Enterasys are included in the consolidated statement of operations. The Company incurred $6.0 million of acquisition-related expenses for the year ended June 30, 2014. Such acquisition-related costs are included in "Acquisition and integration costs" on the consolidated statement of operations. The costs, which the Company expensed as incurred, consist primarily of professional fees payable to financial and legal advisors.
3. Summary of Significant Accounting Policies
Revenue Recognition
The Company's revenue is primarily derived from sales of networking products, which are tangible products containing software and non-software components that function together to deliver the tangible product's essential functionality. In addition to tangible products, the Company's sales arrangements may include other deliverables such as standalone software licenses, or service offerings. For multiple deliverable arrangements, the Company recognizes revenue in accordance with the accounting standard for multiple deliverable revenue arrangements, which provides guidance on whether multiple deliverables exist, how deliverables in an arrangement should be separated, and how consideration should be allocated. Software revenue recognition guidance is applied to the sales of the Company's standalone software products, including software upgrades and software that is not essential to the functionality of the hardware with which it is sold.
Pursuant to the guidance of the accounting standard for multiple deliverable revenue arrangements, when the Company's sales arrangements contain multiple elements, such as products, software licenses, maintenance agreements, or professional services, the Company determines the standalone selling price for each element based on a selling price hierarchy. The application of the multiple deliverable revenue accounting standard does not change the units of accounting for the Company's multiple element arrangements. Under the selling price hierarchy, the selling price for each deliverable is based on the Company's vendor-specific objective evidence (“VSOE”), which is determined by a substantial majority of the Company's historical standalone sales transactions for a product or service falling within a narrow range. If VSOE is not available due to a lack of standalone sales transactions or lack of pricing within a narrow range, then third party evidence (“TPE”), as determined by the standalone pricing of competitive vendor products in similar markets, is used, if available. TPE typically is difficult to establish due to the proprietary differences of competitive products and difficulty in obtaining reliable competitive standalone pricing information. When neither VSOE nor TPE is available, the Company determines its best estimate of standalone selling price (“ESP”) for a product or service and does so by considering several factors including, but not limited to, the 12-month historical median sales price, sales channel, geography, gross margin objective, competitive product pricing, and product life cycle. In consideration of all relevant pricing factors, the Company applies management judgment to determine the Company's best estimate of selling price through consultation with and formal approval by the Company's management for all products and services for which neither VSOE nor TPE is available. Generally the standalone selling price of services is determined using VSOE and the standalone selling price of other deliverables is determined by using ESP. The Company regularly reviews VSOE, TPE and ESP for all of its products and services and maintains internal controls over the establishment and updates of these estimates.
Pursuant to the software revenue recognition accounting standard, the Company continues to recognize revenue for software using the residual method for its sale of standalone software products, including optional software upgrades and other software that is not essential to the functionality of the hardware with which it is sold. After allocation of the relative selling price to each element of the arrangement, the Company recognizes revenue in accordance with the Company's policies for product, software, and service revenue recognition.
The Company derives the majority of its revenue from sales of its networking equipment, with the remaining revenue generated from service fees relating to maintenance contracts, professional services, and training for its products. The Company generally recognizes product revenue from its value-added resellers, non-stocking distributors and end-user customers at the time of shipment, provided that persuasive evidence of an arrangement exists, delivery has occurred, the price of the product is fixed or determinable, and collection of the sales proceeds is reasonably assured. In instances where the criteria for revenue recognition are not met, revenue is deferred until all criteria have been met. Sales taxes collected from customers are excluded from revenues.
57
EXTREME NETWORKS, INC.
NOTES TO CONSOLIDATED FINANCIAL STATEMENTS—(Continued)
The Company sells its products and maintenance contracts to partners in two distribution channels, or tiers. The first tier consists of a limited number of independent distributors that stock its products and sell primarily to resellers. The Company defers recognition of revenue on all sales to its stocking distributors until the distributors sell the product, as evidenced by “sales-out” reports that the distributors provide. The Company grants these distributors the right to return a portion of unsold inventory for the purpose of stock rotation and certain price protection rights. The distributor-related deferred revenue and receivables are adjusted at the time of the stock rotation return or price reduction. The Company also provides distributors with credits for changes in selling prices based on competitive conditions, and allows distributors to participate in cooperative marketing programs (See Deferred Distributors Revenue, Net of Cost of Sales to Distributors, below in this footnote for additional information). The Company maintains estimated accruals and allowances for these exposures based upon the Company's historical experience. In connection with cooperative advertising programs, if the Company does not meet the criteria for recognizing the expense as marketing expense the costs are recorded as a reduction to revenue in the same period that the related revenue is recorded.
The second tier of the distribution channel consists of a non-stocking distributors and value-added resellers that sell directly to end-users. For product sales to non-stocking distributors and value-added resellers, the Company does not grant return privileges, except for defective products during the warranty period, nor does the Company grant pricing credits. Accordingly, the Company recognizes revenue upon transfer of title and risk of loss or damage, generally upon shipment. In connection with cooperative advertising programs and certain price protection rights that may occur under contractual arrangements with its resellers, if the Company does not meet the criteria for recognizing the expense as marketing expense, the costs are recorded as a reduction to revenue in the same period that the related revenue is recorded.
Allowance for Product Returns
The Company provides an allowance for product returns based on its historical returns, analysis of credit memo data and its return policies. The allowance includes the estimates for product allowances from end customers as well as stock rotations and other returns from the Company’s stocking distributors for which it has billed the customer for the product but has yet to recognize revenue. The allowance for product returns is a reduction of accounts receivable. If the historical data that the Company uses to calculate the estimated product returns and allowances does not properly reflect future levels of product returns, these estimates will be revised, thus resulting in an impact on future net revenue. The allowance for product returns estimate is also impacted by the timing of the actual product return from the customer. The Company estimates and adjusts this allowance at each balance sheet date.
The following table is a summary of our allowance for product returns (in thousands).
|
Description |
|
Balance at beginning of period |
|
|
Additions |
|
|
(Deductions) |
|
|
Balance at end of period |
|
||||
|
Year Ended June 30, 2016: |
|
|
|
|
|
|
|
|
|
|
|
|
|
|
|
|
|
Allowance for product returns |
|
$ |
1,080 |
|
|
$ |
3,478 |
|
|
$ |
(2,949 |
) |
|
$ |
1,609 |
|
|
Year Ended June 30, 2015: |
|
|
|
|
|
|
|
|
|
|
|
|
|
|
|
|
|
Allowance for product returns |
|
|
2,700 |
|
|
|
3,306 |
|
|
|
(4,926 |
) |
|
|
1,080 |
|
|
Year Ended June 30, 2014: |
|
|
|
|
|
|
|
|
|
|
|
|
|
|
|
|
|
Allowance for product returns |
|
$ |
777 |
|
|
$ |
3,063 |
|
|
$ |
(1,140 |
) |
|
$ |
2,700 |
|
Allowance for Doubtful Accounts
The Company maintains an allowance for doubtful accounts which reflects its best estimate of potentially uncollectible trade receivables. The allowance is based on both specific and general reserves. The Company continually monitors and evaluates the collectability of its trade receivables based on a combination of factors. It records specific allowances for bad debts in general and administrative expense when it becomes aware of a specific customer’s inability to meet its financial obligation to the Company, such as in the case of bankruptcy filings or deterioration of financial position. Estimates are used in determining the allowances for all other customers based on factors such as current trends in the length of time the receivables are past due and historical collection experience. The Company mitigates some collection risk by requiring most of its customers in the Asia-Pacific region, excluding Japan and Australia, to pay cash in advance or secure letters of credit when placing an order with the Company.
58
EXTREME NETWORKS, INC.
NOTES TO CONSOLIDATED FINANCIAL STATEMENTS—(Continued)
The following table is a summary of the allowance for doubtful accounts (in thousands).
|
Description |
|
Balance at beginning of period |
|
|
Charges to bad debt expenses |
|
|
Deductions (1) |
|
|
Balance at end of period |
|
||||
|
Year Ended June 30, 2016: |
|
|
|
|
|
|
|
|
|
|
|
|
|
|
|
|
|
Allowance for doubtful accounts |
|
$ |
1,316 |
|
|
$ |
834 |
|
|
$ |
(502 |
) |
|
$ |
1,648 |
|
|
Year Ended June 30, 2015: |
|
|
|
|
|
|
|
|
|
|
|
|
|
|
|
|
|
Allowance for doubtful accounts |
|
|
918 |
|
|
|
940 |
|
|
|
(542 |
) |
|
|
1,316 |
|
|
Year Ended June 30, 2014: |
|
|
|
|
|
|
|
|
|
|
|
|
|
|
|
|
|
Allowance for doubtful accounts |
|
$ |
475 |
|
|
$ |
468 |
|
|
$ |
(25 |
) |
|
$ |
918 |
|
|
(1) |
Uncollectible accounts written off, net of recoveries |
Concentrations
The Company may be subject to concentration of credit risk as a result of certain financial instruments consisting of accounts receivable and short-term investments. The Company does not invest an amount exceeding 10% of its combined cash or cash equivalents in the securities of any one obligor or maker, except for obligations of the United States government, obligations of United States government agencies and money market accounts.
The Company performs ongoing credit evaluations of its customers and generally does not require collateral in exchange for credit.
The following table sets forth major customers accounting for 10% or more of our net revenue:
|
|
|
Year Ended |
|
|||||||||
|
|
|
June 30, 2016 |
|
|
June 30, 2015 |
|
|
June 30, 2014 |
|
|||
|
Tech Data Corporation |
|
|
17 |
% |
|
|
15 |
% |
|
|
11 |
% |
|
Westcon Group Inc. |
|
|
14 |
% |
|
|
15 |
% |
|
|
11 |
% |
|
Jenne |
|
|
14 |
% |
|
* |
|
|
* |
|
||
|
* |
Less than 10% of net revenue |
The following table sets forth major customers accounting for 10% or more of our accounts receivable balance.
|
|
|
Year Ended |
|
|||||||||
|
|
|
June 30, 2016 |
|
|
June 30, 2015 |
|
|
June 30, 2014 |
|
|||
|
Westcon Group Inc. |
|
|
19 |
% |
|
|
27 |
% |
|
|
19 |
% |
|
Tech Data Corporation |
|
|
11 |
% |
|
* |
|
|
|
13 |
% |
|
|
* |
Less than 10% of accounts receivable |
Inventory Valuation
The Company's inventory balance as of June 30, 2016 and 2015 was $41.0 million and $58.0 million, respectively. The Company values its inventory at lower of cost or market. Cost is computed using standard cost, which approximates actual cost, on a first-in, first-out basis. The Company has established inventory allowances primarily determined by the age of inventory or when conditions exist that suggest that inventory may be in excess of anticipated demand or is obsolete based upon assumptions about future demand. At the point of the loss recognition, a new, lower-cost basis for that inventory is established, and subsequent changes in facts and circumstances do not result in the restoration or increase in that newly established cost basis. Any written down or obsolete inventory subsequently sold has not had a material impact on gross margin for any of the periods disclosed.
59
EXTREME NETWORKS, INC.
NOTES TO CONSOLIDATED FINANCIAL STATEMENTS—(Continued)
The following is a summary of our inventory by category (in thousands).
|
|
|
June 30, 2016 |
|
|
June 30, 2015 |
|
||
|
Finished goods |
|
$ |
38,751 |
|
|
$ |
55,301 |
|
|
Raw materials |
|
|
2,238 |
|
|
|
2,713 |
|
|
Total Inventory |
|
$ |
40,989 |
|
|
$ |
58,014 |
|
Cash Equivalents, Short-Term Investments and Marketable Securities
The following is a summary of Cash and Available-for-Sale Securities (in thousands)
|
|
|
June 30, 2016 |
|
|
June 30, 2015 |
|
||
|
Cash |
|
$ |
89,847 |
|
|
$ |
71,455 |
|
|
|
|
|
|
|
|
|
|
|
|
Cash equivalents |
|
$ |
4,275 |
|
|
$ |
4,770 |
|
|
Total available-for-sale |
|
$ |
4,275 |
|
|
$ |
4,770 |
|
|
|
|
|
|
|
|
|
|
|
|
Total cash, cash equivalents and available for sale securities |
|
$ |
94,122 |
|
|
$ |
76,225 |
|
Available-for-Sale Securities
The following is a summary of available-for-sale securities (in thousands):
|
|
|
|
|
|
|
|
|
|
|
Unrealized |
|
|
Unrealized |
|
||
|
|
|
Amortized |
|
|
|
|
|
|
Holding |
|
|
Holding |
|
|||
|
|
|
Cost |
|
|
Fair Value |
|
|
Gains |
|
|
Losses |
|
||||
|
June 30, 2016 |
|
|
|
|
|
|
|
|
|
|
|
|
|
|
|
|
|
Money market funds |
|
$ |
4,275 |
|
|
$ |
4,275 |
|
|
$ |
— |
|
|
$ |
— |
|
|
|
|
$ |
4,275 |
|
|
$ |
4,275 |
|
|
$ |
— |
|
|
$ |
— |
|
|
Classified as: |
|
|
|
|
|
|
|
|
|
|
|
|
|
|
|
|
|
Cash equivalents |
|
$ |
4,275 |
|
|
$ |
4,275 |
|
|
$ |
— |
|
|
$ |
— |
|
|
|
|
$ |
4,275 |
|
|
$ |
4,275 |
|
|
$ |
— |
|
|
$ |
— |
|
|
June 30, 2015 |
|
|
|
|
|
|
|
|
|
|
|
|
|
|
|
|
|
Money market funds |
|
$ |
4,770 |
|
|
$ |
4,770 |
|
|
$ |
— |
|
|
$ |
— |
|
|
|
|
$ |
4,770 |
|
|
$ |
4,770 |
|
|
$ |
— |
|
|
$ |
— |
|
|
Classified as: |
|
|
|
|
|
|
|
|
|
|
|
|
|
|
|
|
|
Cash equivalents |
|
$ |
4,770 |
|
|
$ |
4,770 |
|
|
$ |
— |
|
|
$ |
— |
|
|
|
|
$ |
4,770 |
|
|
$ |
4,770 |
|
|
$ |
— |
|
|
$ |
— |
|
The Company did not have any available-for sale investments in debt securities at June 30, 2016.
The Company considers highly liquid investments with maturities of three months or less at the date of purchase to be cash equivalents. Investments with maturities of greater than three months, but less than one year at the balance sheet date are classified as Short-term Investments. Investments with maturities of greater than one year at balance sheet date are classified as Marketable Securities. Except for direct obligations of the United States government, securities issued by agencies of the United States government, and money market funds, the Company diversifies its investments by limiting its holdings with any individual issuer.
60
EXTREME NETWORKS, INC.
NOTES TO CONSOLIDATED FINANCIAL STATEMENTS—(Continued)
Investments include available-for-sale investment-grade debt securities that the Company carries at fair value. The Company accumulates unrealized gains and losses on the Company's available-for-sale debt securities, net of tax, in accumulated other comprehensive income in the stockholders' equity section of its balance sheets. Such an unrealized gain or loss does not reduce net income for the applicable accounting period. If the fair value of an available-for-sale debt instrument is less than its amortized cost basis, an other-than-temporary impairment is triggered in circumstances where (1) the Company intends to sell the instrument, (2) it is more likely than not that the Company will be required to sell the instrument before recovery of its amortized cost basis, or (3) the Company does not expect to recover the entire amortized cost basis of the instrument (that is, a credit loss exists). If the Company intends to sell or it is more likely than not that the Company will be required to sell the available-for-sale debt instrument before recovery of its amortized cost basis, the Company recognizes a other-than-temporary impairment in earnings equal to the entire difference between the debt instruments' amortized cost basis and its fair value. For available-for-sale debt instruments that are considered other-than-temporarily impaired due to the existence of a credit loss, if the Company does not intend to sell and it is not more likely than not that the Company will be required to sell the instrument before recovery of its remaining amortized cost basis (amortized cost basis less any current-period credit loss), the Company separates the amount of the impairment into the amount that is credit related and the amount due to all other factors. The credit loss component is recognized in earnings and is the difference between the debt instrument's amortized cost basis and the present value of its expected future cash flows. The remaining difference between the debt instrument's fair value and the present value of future expected cash flows is due to factors that are not credit related and is recognized in other comprehensive income.
The Company determines the basis of the cost of a security sold or the amount reclassified out of accumulated other comprehensive income into earnings using the specific identification method. Realized gains or losses recognized on the sale of investments were not significant for fiscal 2016, 2015 or 2014. As of June 30, 2016 and June 30, 2015, the Company did not hold any investment securities. For investments that were in an unrealized loss position as of June 30, 2014, the Company recorded an other-than-temporary impairment loss of $158,000 during the year ended June 30, 2014.
Fair Value of Financial Instruments
A three-tier fair value hierarchy is utilized to prioritize the inputs used in measuring fair value. The hierarchy gives the highest priority to quoted prices in active markets (Level 1) and the lowest priority to unobservable inputs (Level 3). The three levels are defined as follows:
|
|
· |
Level 1 Inputs - unadjusted quoted prices in active markets for identical assets or liabilities; |
|
|
· |
Level 2 Inputs - quoted prices for similar assets and liabilities in active markets or inputs that are observable for the asset or liability, either directly or indirectly through market corroboration, for substantially the full term of the financial instrument; and |
|
|
· |
Level 3 Inputs - unobservable inputs reflecting the Company's own assumptions in measuring the asset or liability at fair value. |
The Company did not hold any financial liabilities that required measurement at fair value on a recurring basis. The following table presents the Company’s fair value hierarchy for its financial assets measured at fair value on a recurring basis (in thousands):
|
June 30, 2016 |
|
Level 1 |
|
|
Level 2 |
|
|
Level 3 |
|
|
Total |
|
||||
|
Assets |
|
|
|
|
|
|
|
|
|
|
|
|
|
|
|
|
|
Investments: |
|
|
|
|
|
|
|
|
|
|
|
|
|
|
|
|
|
Money market funds |
|
$ |
4,275 |
|
|
$ |
— |
|
|
$ |
— |
|
|
$ |
4,275 |
|
|
Total |
|
$ |
4,275 |
|
|
$ |
— |
|
|
$ |
— |
|
|
$ |
4,275 |
|
|
June 30, 2015 |
|
Level 1 |
|
|
Level 2 |
|
|
Level 3 |
|
|
Total |
|
||||
|
Assets |
|
|
|
|
|
|
|
|
|
|
|
|
|
|
|
|
|
Investments: |
|
|
|
|
|
|
|
|
|
|
|
|
|
|
|
|
|
Money market funds |
|
$ |
4,770 |
|
|
$ |
— |
|
|
$ |
— |
|
|
$ |
4,770 |
|
|
Total |
|
$ |
4,770 |
|
|
$ |
— |
|
|
$ |
— |
|
|
$ |
4,770 |
|
Level 2 investments: the Company includes U.S. government and sovereign obligations, most government agency securities, investment-grade corporate bonds, and state, municipal and provincial obligations for which quoted prices are available as Level 2. There were no transfers of assets or liabilities between Level 1 and Level 2 during the fiscal years 2016 or 2015.
61
EXTREME NETWORKS, INC.
NOTES TO CONSOLIDATED FINANCIAL STATEMENTS—(Continued)
The fair value of the borrowings under the credit facility is estimated based on valuations provided by alternative pricing sources supported by observable inputs which are considered Level 2. The carrying amount and estimated fair value of the Company’s total long-term indebtedness, including current portion was $55.5 million and $66.9 million as of June 30, 2016 and 2015, respectively.
Level 3 investments: The Company did not hold any Level 3 investments.
Certain of the Company's assets, including intangible assets and goodwill are measured at fair value on a non-recurring basis if impairment is indicated. There were no impairments recorded for the fiscal years 2016 or 2015.
Long-Lived Assets
Long-lived assets include (a) property and equipment, (b) goodwill and intangible assets, and (c) other assets. Property and equipment, goodwill and intangible assets are reviewed for impairment whenever events or changes in circumstances indicate that the carrying amount of such assets or asset groups may not be recoverable. If such facts and circumstances exist, the Company assesses the recoverability of these assets by comparing the projected undiscounted net cash flows associated with the related asset or group of assets over their remaining lives against their respective carrying amounts. Impairments, if any, are based on the excess of the carrying amount over the fair value of those assets. The Company reduces the carrying value of service inventory to net realizable value based on expected quantities needed to satisfy contractual service requirements of customers.
(a) Property and Equipment, Net
Property and equipment are stated at cost less accumulated depreciation and amortization. Depreciation and amortization is computed using the straight-line method over the estimated useful lives of the assets. Estimated useful lives of one to four years are used for computer equipment and software. Estimated useful lives of three to seven years are used for office equipment, furniture and fixtures. Depreciation and amortization of leasehold improvements is computed using the lesser of the useful life or lease terms (ranging from two to ten years). Property and equipment consist of the following (in thousands):
|
|
|
June 30, 2016 |
|
|
June 30, 2015 |
|
||
|
Computer equipment |
|
$ |
34,657 |
|
|
$ |
32,753 |
|
|
Purchased software |
|
|
5,574 |
|
|
|
5,425 |
|
|
Office equipment, furniture and fixtures |
|
|
10,385 |
|
|
|
10,908 |
|
|
Leasehold improvements |
|
|
19,342 |
|
|
|
24,293 |
|
|
Total property and equipment |
|
|
69,958 |
|
|
|
73,379 |
|
|
Less: accumulated depreciation and amortization |
|
|
(40,378 |
) |
|
|
(33,517 |
) |
|
Property and equipment, net |
|
$ |
29,580 |
|
|
$ |
39,862 |
|
(b) Goodwill and Intangibles
As part of the acquisition of Enterasys, the Company acquired $70.9 million in goodwill which has been allocated to the Company's only reportable segment, the development and marketing of network infrastructure equipment.
The following table reflects the changes in the carrying amount of goodwill (in thousands):
|
|
|
June 30, |
|
|
June 30, |
|
||
|
|
|
2016 |
|
|
2015 |
|
||
|
Balance at beginning of period |
|
$ |
70,877 |
|
|
$ |
70,877 |
|
|
Changes during period |
|
|
— |
|
|
|
— |
|
|
Balance at end of period |
|
$ |
70,877 |
|
|
$ |
70,877 |
|
62
EXTREME NETWORKS, INC.
NOTES TO CONSOLIDATED FINANCIAL STATEMENTS—(Continued)
The following tables summarize the components of gross and net intangible asset balances (dollars in thousands):
|
|
|
Weighted Average |
|
|
|
|
|
|
|
|
|
|
|
|
|
|
|
Remaining Amortization |
|
Gross Carrying |
|
|
Accumulated |
|
|
Net Carrying |
|
|||
|
|
|
Period |
|
Amount |
|
|
Amortization |
|
|
Amount |
|
|||
|
June 30, 2016 |
|
|
|
|
|
|
|
|
|
|
|
|
|
|
|
Developed technology |
|
0.20 years |
|
$ |
48,000 |
|
|
$ |
43,028 |
|
|
$ |
4,972 |
|
|
Customer relationships |
|
0.30 years |
|
|
37,000 |
|
|
|
32,889 |
|
|
|
4,111 |
|
|
Maintenance contracts |
|
2.30 years |
|
|
17,000 |
|
|
|
9,067 |
|
|
|
7,933 |
|
|
Trademarks |
|
0.30 years |
|
|
2,500 |
|
|
|
2,222 |
|
|
|
278 |
|
|
License agreements |
|
9.70 years |
|
|
3,413 |
|
|
|
1,473 |
|
|
|
1,940 |
|
|
Other intangibles |
|
3.70 years |
|
|
1,428 |
|
|
|
900 |
|
|
|
528 |
|
|
Total intangibles, net |
|
|
|
$ |
109,341 |
|
|
$ |
89,579 |
|
|
$ |
19,762 |
|
|
|
|
Weighted Average |
|
|
|
|
|
|
|
|
|
|
|
|
|
|
|
Remaining Amortization |
|
Gross Carrying |
|
|
Accumulated |
|
|
Net Carrying |
|
|||
|
|
|
Period |
|
Amount |
|
|
Amortization |
|
|
Amount |
|
|||
|
June 30, 2015 |
|
|
|
|
|
|
|
|
|
|
|
|
|
|
|
Developed technology |
|
1.20 years |
|
$ |
48,000 |
|
|
$ |
28,194 |
|
|
$ |
19,806 |
|
|
Customer relationships |
|
1.30 years |
|
|
37,000 |
|
|
|
20,556 |
|
|
|
16,444 |
|
|
Maintenance contracts |
|
3.30 years |
|
|
17,000 |
|
|
|
5,667 |
|
|
|
11,333 |
|
|
Trademarks |
|
1.30 years |
|
|
2,500 |
|
|
|
1,389 |
|
|
|
1,111 |
|
|
Order backlog |
|
0.30 years |
|
|
7,400 |
|
|
|
6,967 |
|
|
|
433 |
|
|
License agreements |
|
10.20 years |
|
|
10,924 |
|
|
|
8,620 |
|
|
|
2,304 |
|
|
Other intangibles |
|
3.80 years |
|
|
2,684 |
|
|
|
1,983 |
|
|
|
701 |
|
|
Total intangibles, net |
|
|
|
$ |
125,508 |
|
|
$ |
73,376 |
|
|
$ |
52,132 |
|
The following table summarizes the amortization expense of intangibles for the periods presented (in thousands):
|
|
|
Year Ended |
|
|||||||||
|
|
|
June 30, 2016 |
|
|
June 30, 2015 |
|
|
June 30, 2014 |
|
|||
|
Amortization in "Cost of revenue for products" |
|
$ |
15,369 |
|
|
$ |
18,082 |
|
|
$ |
12,060 |
|
|
Amortization of intangibles |
|
|
17,001 |
|
|
|
17,869 |
|
|
|
16,711 |
|
|
Total amortization |
|
$ |
32,370 |
|
|
$ |
35,951 |
|
|
$ |
28,771 |
|
The amortization expense that is recognized in "Cost of revenues for products" is comprised of amortization for developed technology, license agreements and other intangibles.
The estimated future amortization expense to be recorded for each of the next five years is as follows (in thousands):
|
For the fiscal year ending: |
|
|
|
|
|
2017 |
|
$ |
13,323 |
|
|
2018 |
|
|
3,724 |
|
|
2019 |
|
|
1,457 |
|
|
2020 |
|
|
264 |
|
|
2021 |
|
|
139 |
|
|
Thereafter, |
|
|
855 |
|
|
Total |
|
$ |
19,762 |
|
63
EXTREME NETWORKS, INC.
NOTES TO CONSOLIDATED FINANCIAL STATEMENTS—(Continued)
(c) Other Assets
Other assets primarily consists of service inventory and long term deposits. The Company holds service inventory to support customers who have purchased service contracts with a hardware replacement element, as well as to support our warranty program. See Inventory Valuation above in this footnote for additional information. The Company held service inventory of $16.0 million and $18.1 million as of June 30, 2016 and 2015, respectively.
Deferred Revenue, Net
Deferred revenue, net represents amounts for (i) deferred maintenance revenue and (ii) deferred product revenue net of the related cost of revenue and other (professional services and training) when the revenue recognition criteria have not been met. The following table summarizes deferred revenue (in thousands):
|
|
|
June 30, 2016 |
|
|
June 30, 2015 |
|
||
|
Deferred maintenance revenue |
|
$ |
83,419 |
|
|
$ |
87,441 |
|
|
Deferred product and other revenue |
|
|
11,441 |
|
|
|
12,341 |
|
|
Total deferred revenue, net |
|
|
94,860 |
|
|
|
99,782 |
|
|
Less: current portion |
|
|
72,934 |
|
|
|
76,551 |
|
|
Non-current deferred revenue, net |
|
$ |
21,926 |
|
|
$ |
23,231 |
|
The Company offers for sale to its customers, renewable support arrangements, including extended warranty contracts that range generally from one to five years. Deferred support revenue is included within deferred revenue, net within the maintenance revenue category above. The change in the Company’s deferred maintenance revenue balance in relation to these arrangements was as follows (in thousands):
|
|
|
Year Ended |
|
|||||
|
|
|
June 30, 2016 |
|
|
June 30, 2015 |
|
||
|
Balance beginning of period |
|
$ |
87,441 |
|
|
$ |
89,657 |
|
|
New maintenance arrangements |
|
|
110,192 |
|
|
|
119,906 |
|
|
Recognition of maintenance revenue |
|
|
(114,214 |
) |
|
|
(122,122 |
) |
|
Balance end of period |
|
|
83,419 |
|
|
|
87,441 |
|
|
Less: current portion |
|
|
61,493 |
|
|
|
64,210 |
|
|
Non-current deferred revenue |
|
$ |
21,926 |
|
|
$ |
23,231 |
|
Deferred Distributors Revenue, Net of Cost of Sales to Distributors
At the time of shipment to distributors, the Company records a trade receivable at the contractual discount to list selling price since there is a legally enforceable obligation from the distributor to pay on a current basis for product delivered. The Company relieves inventory for the carrying value of goods shipped since legal title has passed to the distributor, and the Company records deferred revenue and deferred cost of sales in “Deferred distributors revenue, net of cost of sales to distributors” in the liability section of its consolidated balance sheets. Deferred distributors revenue, net of cost of sales to distributors effectively represents the gross margin on the sale to the distributor; however, the amount of gross margin the Company recognizes in future periods will frequently be less than the originally recorded deferred distributors revenue, net of cost of sales to distributors as a result of price concessions negotiated at time of sell-through to end customers. The Company sells each item in its product catalog to all of its distributors worldwide at contractually discounted prices. However, distributors resell the Company’s products to end customers at a very broad range of individually negotiated price points based on customer, product, quantity, geography, and other competitive conditions which results in the Company remitting back to the distributors a portion of their original purchase price after the resale transaction is completed. Thus, a portion of the deferred revenue balance represents a portion of distributors’ original purchase price that will be remitted back to the distributors in the future. The wide range and variability of negotiated price credits granted to distributors does not allow the Company to accurately estimate the portion of the balance in the deferred revenue that will be remitted to the distributors. Therefore, the Company does not reduce deferred revenue by anticipated future price credits; instead, price credits are recorded against revenue when incurred, which is generally at the time the distributor sells the product.
64
EXTREME NETWORKS, INC.
NOTES TO CONSOLIDATED FINANCIAL STATEMENTS—(Continued)
The following table summarizes deferred distributors revenue, net of cost of sales to distributors (in thousands):
|
|
|
June 30, 2016 |
|
|
June 30, 2015 |
|
||
|
Deferred distributors revenue |
|
$ |
35,138 |
|
|
$ |
53,366 |
|
|
Deferred cost of sales to distributors |
|
|
(8,321 |
) |
|
|
(12,491 |
) |
|
Deferred distributors revenue, net of cost of sales to distributors |
|
$ |
26,817 |
|
|
$ |
40,875 |
|
Debt
The Company's debt is comprised of the following (in thousands):
|
|
|
June 30, 2016 |
|
|
June 30, 2015 |
|
||
|
Current portion of long-term debt: |
|
|
|
|
|
|
|
|
|
Term Loan |
|
$ |
17,875 |
|
|
$ |
11,375 |
|
|
Current portion of long-term debt |
|
$ |
17,875 |
|
|
$ |
11,375 |
|
|
|
|
|
|
|
|
|
|
|
|
Long-term debt, less current portion: |
|
|
|
|
|
|
|
|
|
Term Loan |
|
$ |
27,625 |
|
|
$ |
45,500 |
|
|
Revolving Facility |
|
|
10,000 |
|
|
|
10,000 |
|
|
Total long-term debt, less current portion |
|
|
37,625 |
|
|
|
55,500 |
|
|
Total debt |
|
$ |
55,500 |
|
|
$ |
66,875 |
|
The Company's debt repayment schedule by period is as follows (in thousands):
|
For the fiscal year ending: |
|
|
|
|
|
2017 |
|
$ |
17,875 |
|
|
2018 |
|
|
21,938 |
|
|
2019 |
|
|
15,687 |
|
|
Total |
|
$ |
55,500 |
|
On October 31, 2013, the Company entered into a credit agreement which provides for a $60 million five-year Revolving Facility and a $65 million five-year Term Loan (together the “Senior Secured Credit Facilities”). The Company used the proceeds from the Term Loan and also drew $35 million of the Revolving Facility for the purchase of all of the issued and outstanding capital stock of Enterasys. The Company has availability of borrowings from the Revolving Facility of $34.1 million as of June 30, 2016.
In the fourth quarter of fiscal 2015, the Company amended the Senior Secured Credit Facilities. The amendment, among other items, reduced the lenders commitment by $10.0 million to a total of $115.0 million. The amended commitment provides for a $50 million five-year Revolving Facility. Borrowings under the Senior Secured Credit Facilities, as amended, bear interest, at the Company's election, at a rate per annum equal to an agreed to applicable margin plus (a) the higher of the prime rate in effect on such day or the federal funds effective rate in effect on such day plus 0.75% or (b) an adjusted Libor rate. In addition, the Company is required to pay a quarterly commitment fee of between 0.375% and 0.50% (currently 0.375%) on the unused portion of the Revolving Facility based on the Company’s Consolidated Leverage Ratio. Principal installments are payable on the Term Loan in varying percentages quarterly starting December 31, 2013 and to the extent not previously paid, all outstanding balances are to be paid at maturity. If not repaid before maturity, the draws on the Revolving Facility shall be repaid on the original maturity date. The Senior Secured Credit Facilities, as amended, are secured by substantially all of the Company’s assets and are jointly and severally guaranteed by the Company and certain of its subsidiaries.
65
EXTREME NETWORKS, INC.
NOTES TO CONSOLIDATED FINANCIAL STATEMENTS—(Continued)
The Senior Secured Credit Facilities, as amended contain financial covenants that require the Company to maintain a minimum Consolidated Fixed Charge Coverage Ratio and a Consolidated Quick Ratio and a maximum Consolidated Leverage Ratio as well as several other financial and non-financial covenants and restrictions that limit the Company’s ability to incur additional indebtedness, create liens upon any of its property, merge, consolidate or sell all or substantially all of its assets, etc. These covenants, which are described more fully in the Senior Secured Credit Facilities, as amended, (incorporated herein by reference on Form 8-K) to which reference is made for a complete statement of the covenants, are subject to certain exceptions. The Company is in compliance with its covenants.
The Senior Secured Credit Facilities, as amended, also includes customary events of default, including failure to pay principal, interest or fees when due, failure to comply with covenants, if any representation or warranty made by the Company is false or misleading in any material respect, certain insolvency or receivership events affecting the Company and its subsidiaries, the occurrence of certain material judgments, the occurrence of certain ERISA events, the invalidity of the loan documents or a change in control of the Company. The amounts outstanding under the Senior Secured Credit Facilities, as amended, may be accelerated upon certain events of default.
Financing costs incurred in connection with obtaining long-term financing are deferred and amortized over the term of the related indebtedness or credit agreement. The Company incurred $1.3 million of financing costs related to the initial Senior Secured Credit Facilities during the year ended June 30, 2014. During the year ended June 30, 2015, in conjunction with the amending of the Senior Secured Credit Facilities noted above, the Company incurred an additional $0.5 million of costs. Amortization of deferred financing costs is included in "Interest expense" in the consolidated statements of operations, totaled $0.5 million, $0.4 million and $0.2 million in fiscal years 2016, 2015 and 2014, respectively.
The Company had $0.9 million of outstanding letters of credit as of June 30, 2016 and 2015.
Guarantees and Product Warranties
Networking products may contain undetected hardware or software errors when new products or new versions or updates of existing products are released to the marketplace. In the past, we had experienced such errors in connection with products and product updates. The Company’s standard hardware warranty period is typically 12 months from the date of shipment to end-users and 90 days for software. For certain access products, the Company offers a limited lifetime hardware warranty commencing on the date of shipment from the Company and ending five (5) years following the Company’s announcement of the end of sale of such product. Upon shipment of products to its customers, the Company estimates expenses for the cost to repair or replace products that may be returned under warranty and accrue a liability in cost of product revenue for this amount. The determination of the Company’s warranty requirements is based on actual historical experience with the product or product family, estimates of repair and replacement costs and any product warranty problems that are identified after shipment. The Company estimates and adjusts these accruals at each balance sheet date in accordance with changes in these factors.
Upon issuance of a standard product warranty, the Company discloses and recognizes a liability for the obligations it assumes under the product warranty. The following table summarizes the activity related to the Company’s product warranty liability during the following period (in thousands):
|
|
|
Year Ended |
|
|||||
|
|
|
June 30, 2016 |
|
|
June 30, 2015 |
|
||
|
Balance beginning of period |
|
$ |
8,676 |
|
|
$ |
7,551 |
|
|
New warranties issued |
|
|
8,176 |
|
|
|
8,822 |
|
|
Warranty expenditures |
|
|
(7,252 |
) |
|
|
(7,697 |
) |
|
Balance end of period |
|
$ |
9,600 |
|
|
$ |
8,676 |
|
In the normal course of business to facilitate sales of its products, the Company indemnifies its resellers and end-user customers with respect to certain matters. The Company has agreed to hold the customer harmless against losses arising from a breach of intellectual property infringement or other claims made against certain parties. These agreements may limit the time within which an indemnification claim can be made and the amount of the claim. It is not possible to estimate the maximum potential amount under these indemnification agreements due to the limited history of prior indemnification claims and the unique facts and circumstances involved in each particular agreement. Historically, payments made by the Company under these agreements have not had a material impact on its operating results or financial position.
66
EXTREME NETWORKS, INC.
NOTES TO CONSOLIDATED FINANCIAL STATEMENTS—(Continued)
Other Accrued Liabilities
The following are the components of other accrued liabilities (in thousands):
|
|
|
June 30, 2016 |
|
|
June 30, 2015 |
|
||
|
Accrued general and administrative costs |
|
$ |
4,079 |
|
|
$ |
1,204 |
|
|
Restructuring |
|
|
2,522 |
|
|
|
5,854 |
|
|
Other accrued liabilities |
|
|
20,090 |
|
|
|
25,565 |
|
|
Total other accrued liabilities |
|
$ |
26,691 |
|
|
$ |
32,623 |
|
Advertising
Cooperative advertising expenses are recorded as marketing expenses to the extent that an advertising benefit separate from the revenue transaction can be identified and the cash paid does not exceed the fair value of that advertising benefit received. Cooperative advertising obligations with customers are accrued and the costs expensed at the time the related revenue is recognized. If the Company does not meet the criteria for recognizing such cooperative advertising obligations as marketing expense, the costs are recorded as a reduction of revenue. All other advertising costs are expensed as incurred. Advertising expenses were $0.3 million, $0.5 million and $0.5 million in fiscal years 2016, 2015 and 2014, respectively.
4. Recently Issued Accounting Pronouncements
In March 2016, the Financial Accounting Standards Board (“FASB”) issued Accounting Standards Update (“ASU”) No. 2016-09 (Topic 718), Compensation – Stock Compensation (“ASU 2016-09”) which identifies areas for simplification involving several aspects of accounting for share-based payment transactions, including the income tax consequences, classification of awards as either equity or liabilities, an option to recognize gross stock compensation expense with actual forfeitures recognized as they occur, as well as certain classifications on the statement of cash flows. The Company is currently assessing the impact that adopting this new accounting standard will have on its consolidated financial statements and footnote disclosures. This guidance will become effective for the Company beginning with its fiscal year 2018.
In March 2016, the FASB issued ASU No. 2016-06 (Topic 815), Derivatives and Hedging– Contingent Put and Call Options in Debt Instruments (“ASU 2016-06”), which will reduce diversity of practice in identifying embedded derivatives in debt instruments. ASU 2016-06 clarifies that the nature of an exercise contingency is not subject to the “clearly and closely” criteria for purposes of assessing whether the call or put option must be separated from the debt instrument and accounted for separately as a derivative. The Company is currently assessing the impact that adopting this new accounting standard will have on its consolidated financial statements and footnote disclosures. This guidance will become effective for the Company beginning with its fiscal year 2018.
In February 2016, the FASB issued ASU No. 2016-02 (Topic 842), Leases (“ASU 2016-02”) which requires the identification of arrangements that should be accounted for as leases by lessees. In general, for lease arrangements exceeding a twelve month term, these arrangements must now be recognized as assets and liabilities on the balance sheet of the lessee. Under ASU 2016-02, a right-of-use asset and lease obligation will be recorded for all leases, whether operating or financing, while the income statement will reflect lease expense for operating leases and amortization/interest expense for financing leases. The balance sheet amount recorded for existing leases at the date of adoption of ASU 2016-02 must be calculated using the applicable incremental borrowing rate at the date of adoption. In addition, ASU 2016-02 requires the use of the modified retrospective method, which will require adjustment to all comparative periods presented in the consolidated financial statements. The Company is currently assessing the impact that adopting this new accounting standard will have on its consolidated financial statements and footnote disclosures. This guidance will become effective for the Company beginning with its fiscal year 2020.
In January 2016, the FASB issued ASU No. 2016-01, Recognition and Measurement of Financial Assets and Financial Liabilities, which provides guidance for the recognition, measurement, presentation, and disclosure of financial assets and liabilities. The Company is currently assessing the impact that adopting this new accounting standard will have on its consolidated financial statements and footnote disclosures. This guidance will become effective for the Company beginning with its fiscal year 2019.
67
EXTREME NETWORKS, INC.
NOTES TO CONSOLIDATED FINANCIAL STATEMENTS—(Continued)
In May 2014, the FASB issued ASU No. 2014-09 (Topic 606)—Revenue from Contracts with Customers (“ASU 2014-09”) which provides guidance for revenue recognition. This ASU affects all contracts that the Company enters into with customers to transfer goods and services or for the transfer of nonfinancial assets. This ASU will supersede the revenue recognition requirements in Topic 605, and most industry specific guidance. This ASU also supersedes some cost guidance included in Subtopic 605-35, Revenue Recognition-Construction-Type and Production-Type Contracts. The standard's core principle is that revenue is recognized when promised goods or services are transferred to customers in an amount that reflects the consideration to which the Company expects to be entitled in exchange for those goods or services. In doing so, the Company will need to use additional judgment and estimates than under the existing guidance. These may include identifying performance obligations in the contract, estimating the amount of variable consideration to include in the transaction price and allocating the transaction price to each separate performance obligation. In August 2015, the FASB issued ASU 2015-14 which deferred the effective date of the new revenue standard from December 15, 2016 to December 15, 2017, with early adoption permitted as of annual reporting periods beginning after December 15, 2016. Accordingly, the ASU will be effective for the Company beginning fiscal year 2019. In addition, in March 2016, the FASB issued ASU No. 2016-08 (Topic 606) Revenue from Contracts with Customers: Principal versus Agent Considerations (Reporting Revenue Gross versus Net) (“ASU 2016-08”), which clarifies the principal-versus-agent guidance in Topic 606 and requires an entity to determine whether the nature of its promise to provide goods or services to a customer is performed in a principal or agent capacity and to recognize revenue in a gross or net manner based on its principal/agent designation. In April 2016, the FASB also issued ASU No. 2016-10 (Topic 606) Revenue from Contracts with Customers: Identifying Performance Obligations and Licensing (“ASU 2016-10”), which amends the revenue guidance on identifying performance obligations and accounting for licenses of intellectual property. In May 2016, the FASB also issued ASU No. 2016-12 (Topic 606) Revenue from Contracts with Customers: Narrow-Scope Improvements and Practical Expedients (“ASU 2016-12”), which amends the revenue guidance to clarify measurement and presentation as well as to include some practical expedients and policy elections. There are two transition methods available under the new standard, either cumulative effect or retrospective. ASU 2016-08, ASU 2016-10, and ASU 2016-12 must be adopted concurrently with the adoption of ASU 2014-09. The Company is currently evaluating the impact of the adoption of this standard on its Consolidated Financial Statements and disclosures.
In April 2015, the FASB issued ASU No. 2015-03 - Simplifying the Presentation of Debt Issuance Costs (“ASU 2015-03”), which requires that debt issuance costs related to a recognized debt liability be presented in the balance sheet as a direct deduction from the carrying amount of that debt liability, consistent with debt discounts. ASU 2015-03 requires retrospective adoption and will be effect for annual and interim periods in fiscal years beginning after December 15, 2015. Adoption of this standard will not have a material impact on our financial statements and footnote disclosures. This guidance will become effective for the Company beginning with its fiscal year 2017.
Recently Adopted Accounting Pronouncements
In November 2015, the FASB issued ASU No. 2015-17, Balance Sheet Classification of Deferred Taxes ("ASU 2015-17"), which simplifies the presentation of deferred tax assets and deferred tax liabilities. The new guidance no longer requires the presentation of current deferred tax assets and deferred tax liabilities on a classified balance sheet, rather requiring all to be presented as non-current. This guidance is effective for fiscal years beginning after December 15, 2016, with early adoption permitted. The Company prospectively adopted this guidance in the fourth quarter of fiscal 2016. As required by this guidance, all deferred tax assets and liabilities are classified as non-current in our consolidated balance sheet as of June 30, 2016, which is a change from our historical presentation wherein certain of our deferred tax assets and liabilities were classified as current and the remainder were classified as non-current. The June 30, 2015 balance sheet has not been retrospectively adjusted. As this guidance impacts presentation only, the adoption of ASU 2015-17 did not have an impact on the results of operations or cash flows.
5. Commitments, Contingencies and Leases
Leases
The Company currently leases its current headquarters, research and development facilities and office spaces for its various United States and international operations. Certain leases contain rent escalation clauses and renewal options. As part of the Company’s existing leased facilities, the Company has received lease incentives which take the form of a fixed allowance towards lease improvements on the respective facility. The Company used the allowance to make leasehold improvements which are being depreciated over the useful life of the assets or the lease term, whichever is shorter. The offsetting lease incentives liability is being amortized on a straight-line basis over the term of the lease as an offset to rent expense.
68
EXTREME NETWORKS, INC.
NOTES TO CONSOLIDATED FINANCIAL STATEMENTS—(Continued)
Future annual minimum lease payments under all non-cancelable operating leases having initial or remaining lease terms in excess of one year at June 30, 2016 were as follows (in thousands):
|
For the fiscal year ending: |
|
Future Lease Payments |
|
|
|
2017 |
|
$ |
9,733 |
|
|
2018 |
|
|
8,794 |
|
|
2019 |
|
|
8,322 |
|
|
2020 |
|
|
8,065 |
|
|
2021 |
|
|
7,401 |
|
|
Thereafter |
|
|
13,076 |
|
|
Total minimum payments |
|
$ |
55,391 |
|
Rent expense was $8.5 million, $11.1 million and $10.2 million in fiscal years 2016, 2015 and 2014, respectively.
Purchase Commitments
The Company currently has arrangements with contract manufacturers and suppliers for the manufacture of its products. The arrangements allow them to procure long lead-time component inventory based upon a rolling production forecast provided by the Company. The Company is obligated to the purchase of long lead-time component inventory that its contract manufacturer procures in accordance with the forecast, unless the Company gives notice of order cancellation outside of applicable component lead-times. As of June 30, 2016, the Company had non-cancelable commitments to purchase $63.7 million of such inventory, which will be received and consumed during the first half of fiscal 2017
Legal Proceedings
The Company may from time to time be party to litigation arising in the course of its business, including, without limitation, allegations relating to commercial transactions, business relationships or intellectual property rights. Such claims, even if not meritorious, could result in the expenditure of significant financial and managerial resources. Litigation in general and intellectual property and securities litigation in particular, can be expensive and disruptive to normal business operations. Moreover, the results of legal proceedings are difficult to predict.
In accordance with applicable accounting guidance, the Company records accruals for certain of its outstanding legal proceedings, investigations or claims when it is probable that a liability will be incurred and the amount of loss can be reasonably estimated. The Company evaluates, at least on a quarterly basis, developments in legal proceedings, investigations or claims that could affect the amount of any accrual, as well as any developments that would result in a loss contingency to become both probable and reasonably estimable. When a loss contingency is not both probable and reasonably estimable, the Company does not record a loss accrual. However, if the loss (or an additional loss in excess of any prior accrual) is at least a reasonable possibility and material, then the Company would disclose an estimate of the possible loss or range of loss, if such estimate can be made, or disclose that an estimate cannot be made. The assessment whether a loss is probable or a reasonable possibility, and whether the loss or a range of loss is estimable, involves a series of complex judgments about future events. Even if a loss is reasonably possible, the Company may not be able to estimate a range of possible loss, particularly where (i) the damages sought are substantial or indeterminate, (ii) the proceedings are in the early stages, or (iii) the matters involve novel or unsettled legal theories or a large number of parties. In such cases, there is considerable uncertainty regarding the ultimate resolution of such matters, including the amount of any possible loss, fine or penalty. Accordingly, for current proceedings, except as noted below, the Company is currently unable to estimate any reasonably possible loss or range of possible loss. However, an adverse resolution of one or more of such matters could have a material adverse effect on the Company's results of operations in a particular quarter or fiscal year.
69
EXTREME NETWORKS, INC.
NOTES TO CONSOLIDATED FINANCIAL STATEMENTS—(Continued)
Brazilian Tax Assessment Matters
Certain Brazilian tax authorities have made tax assessments against our Brazilian subsidiary, Enterasys Networks do Brazil Ltda., based on an alleged underpayment of taxes. The tax authorities are also seeking interest and penalties with respect to such claims (collectively, the “ICMS Tax Assessments”). The State of Sao Paolo, Brazil denied Enterasys Networks do Brazil Ltda. the use of certain tax credits granted by the State of Espirito Santo, Brazil under the terms of the FUNDAP program for the tax years of 2002 through 2009. The Company’s application to resolve the ICMS Tax Assessments at the administrative level of the Sao Paolo Tax Department under the amnesty relief program (Reference No 3.056.963-1) was denied in March, 2014, by the Sao Paolo Tax Administration. The value of the ICMS tax credits that were disallowed by the Sao Paolo Tax Administration is BRL 3.4 million (US $1.0 million), plus interest and penalties BRL 16.6 million (US $5.1 million). Possible court fees are estimated to be BRL 4.0 million (US $1.2 million). All currency conversions in this Legal Proceedings section are as of June 30, 2016. On January 10, 2014, the Company filed a lawsuit to overturn or reduce the ICMS Assessments, which lawsuit remains on-going. As part of this lawsuit, the Company made a request for a stay of execution, so that no tax foreclosure can be filed until a final ruling is made and no guarantee needs to be presented. On or about October 6, 2014, the preliminary injunction was granted with regard to the stay of execution, and in response to an appeal on the guarantee requirement, the appellant court further ruled on or about January 28, 2015 that no cash deposit (or guarantee) need be made by the Company.
On or about June 18, 2014, the State of San Paolo notified Enterasys Networks do Brazil Ltda. that it intends to audit the records of such entity for tax years 2012 and 2013. In addition, the Company received a similar notice in December 2015 with respect to an audit by the State of San Paolo of tax years 2011-2014. The audits are expected to cover the same or very similar issues as the ICMS Tax Assessments for tax years 2002-2009, however, the Company changed its ICMS procedures effective May 2009 and a similar tax assessment is not anticipated. The Company has provided the requested information for these tax years to the Brazilian tax authorities, but has received no further response from the Brazilian tax authorities.
Based on the currently available information, the Company believes the ultimate outcome of the above audits and assessments will not have a material adverse effect on the Company's financial position or overall results of operations. The Company believes that the ICMS Tax Assessments against our Brazilian subsidiary are without merit and the Company is defending the claims vigorously. While the Company believes there is no legal basis for the alleged liability, due to the complexities and uncertainty surrounding the judicial process in Brazil and the nature of the claims asserted, it is unable to determine the likelihood of an unfavorable outcome against our Brazilian subsidiary and estimate the potential tax liability related to the ICMS Tax Assessments, if any, may be up to BRL 24.0 million (US $7.3 million). The Company does not expect a final judicial determination for several years. The Company believes BRL 9.4 million (US $2.9 million) is the best estimate within the range and has recorded an accrual as of the Acquisition Date of Enterasys Networks as such matter relates to the period before the acquisition.
The Company made a demand on April 11, 2014 for a defense from, and indemnification by, the former equity holder of Enterasys Networks (“Seller”) of the ICMS Tax Assessments. Seller agreed to assume the defense of the ICMS Tax Assessments on May 20, 2014. In addition, through the settlement of the Unify Indemnification Suit on June 18, 2015, Seller has agreed to continue to defend the Company with respect to the ICMS Tax Assessments and to indemnify the Company for losses related thereto subject to certain conditions. In addition, the Seller has agreed to indemnify the Company in connection with tax assessments up to a specified cap related to the 2012 and 2013 tax years subject to certain conditions. These conditions include the offsetting of foreign income tax benefits realized by the Company in the connection with the acquisition of Enterasys. Based upon current projections of the foreign income tax benefits to be realized, the Company does not anticipate that any amounts under the indemnification will be due from the Seller in connection with either the ICMS Tax Assessments or any potential tax assessments for tax years 2012 and 2013.
In re Extreme Networks, Inc. Securities Litigation
On October 23 and 29, 2015, complaints were filed for violations of securities laws in the U.S. District Court for the Northern District of California against the Company and three of its former officers (Charles W. Berger, Kenneth B. Arola, and John T. Kurtzweil). Subsequently, the cases were consolidated. Plaintiffs allege that defendants violated the securities laws by disseminating materially false and misleading statements and concealing material adverse facts regarding Extreme Networks' current financial condition and growth prospects. Plaintiffs seek damages of an unspecified amount on behalf of a class of investors who purchased the Company's common stock from November 4, 2013 through April 9, 2015. On June 28, 2016, the court appointed a lead plaintiff. Lead plaintiff will file a consolidated complaint, which the defendants expect to move to dismiss. The Company believes the claims are without merit and intends to vigorously defend the claims.
70
EXTREME NETWORKS, INC.
NOTES TO CONSOLIDATED FINANCIAL STATEMENTS—(Continued)
On February 18, 2016, a shareholder derivative case was filed in the Superior Court of California, Santa Clara County, Shaffer v. Kispert et al., No. 16 CV 291726. The complaint names current and former officers and members of the Board of Directors as defendants and seeks recovery on behalf of the Company based on substantially the same allegations as the securities class action litigation described above. The parties have agreed to stay the case pending further activities in the securities class action litigation, and have submitted a stipulation to that effect to the court.
Indemnification Obligations
Subject to certain limitations, the Company may be obligated to indemnify its current and former directors, officers and employees. These obligations arise under the terms of its certificate of incorporation, its bylaws, applicable contracts, and Delaware law. The obligation to indemnify, where applicable, generally means that the Company is required to pay or reimburse, and in certain circumstances the Company has paid or reimbursed, the individuals' reasonable legal expenses and possibly damages and other liabilities incurred in connection with these matters. It is not possible to estimate the maximum potential amount under these indemnification agreements due to the limited history of these claims. The cost to defend the Company and the named individuals could have a material adverse effect on its consolidated financial position, results of operations and cash flows in the future. Recovery of such costs under its director and officers’ insurance coverage is uncertain. As of June 30, 2016, the Company had no outstanding indemnification claims.
6. Stockholders’ Equity
Preferred Stock
In April 2001, in connection with the entering into of the Company's Rights Agreement, the Company authorized the issuance of preferred stock. The preferred stock may be issued from time to time in one or more series. The Board of Directors is authorized to provide for the rights, preferences and privileges of the shares of each series and any qualifications, limitations or restrictions on these shares. As of June 30, 2016, no shares of preferred stock were outstanding.
Stockholders’ Rights Agreement
On April 26, 2012, the Company entered into an Amended and Restated Rights Agreement between the Company and Computershare Shareholder Services LLC as the rights agent (the “Restated Rights Plan”). The Restated Rights Plan governs the terms of each right (“Right”) that has been issued with respect to each share of Common Stock of Extreme Networks. Each Right initially represents the right to purchase one one-thousandth of a share of our Preferred Stock. The Restated Rights Plan replaces in its entirety the Rights Agreement, dated as of April 27, 2001, as subsequently amended, between us and Mellon Investor Services LLC (the “Prior Rights Plan”).
The Board adopted the Restated Rights Plan to preserve the value of our deferred tax assets, including our net operating loss carry forwards, with respect to our ability to fully use its tax benefits to offset future income which may be limited if we experience an “ownership change” for purposes of Section 382 of the Internal Revenue Code of 1986 as a result of ordinary buying and selling of our common stock. Following its review of the terms of the plan, the Board decided it was necessary and in the best interests of us and our stockholders to enter into the Restated Rights Plan. The Restated Rights Plan incorporates the Prior Rights Plan and the amendments thereto into a single agreement and extended the term of the Prior Rights Plan to April 30, 2013. Each year since 2013 our Board and shareholders have approved an amendment providing for a one year extension of the term of the Restated Rights Plan. Our Board of Directors unanimously approved an amendment to the Restated Rights Plan on May 5, 2016 to extend the Restated Rights Plan through May 31, 2017, subject to ratification by a majority of the stockholders of the Company at the next annual shareholders meeting, expected to be held on November 18, 2016.
71
EXTREME NETWORKS, INC.
NOTES TO CONSOLIDATED FINANCIAL STATEMENTS—(Continued)
Shares Reserved for Issuance
The following are shares reserved for issuance (in thousands):
|
|
|
June 30, 2016 |
|
|
June 30, 2015 |
|
||
|
2014 Employee Stock Purchase Plan |
|
|
10,001 |
|
|
|
12,000 |
|
|
Employee stock options and awards outstanding |
|
|
10,609 |
|
|
|
15,273 |
|
|
Employee stock options and awards available for grant |
|
|
5,401 |
|
|
|
5,450 |
|
|
Total shares reserved for issuance |
|
|
26,011 |
|
|
|
32,723 |
|
The following table summarizes the transfer of shares between the respective plans for the periods presented (in thousands):
|
|
|
2005 Plan |
|
|
2013 Plan |
|
|
Total |
|
|||
|
Shares available at June 30, 2014 |
|
|
— |
|
|
|
8,762 |
|
|
|
8,762 |
|
|
Granted |
|
|
— |
|
|
|
(7,060 |
) |
|
|
(7,060 |
) |
|
Canceled |
|
|
1,537 |
|
|
|
2,211 |
|
|
|
3,748 |
|
|
Transferred |
|
|
(1,537 |
) |
|
|
1,537 |
|
|
|
— |
|
|
Shares available at June 30, 2015 |
|
|
— |
|
|
|
5,450 |
|
|
|
5,450 |
|
|
Granted |
|
|
— |
|
|
|
(5,141 |
) |
|
|
(5,141 |
) |
|
Canceled |
|
|
5,803 |
|
|
|
— |
|
|
|
5,803 |
|
|
Transferred |
|
|
(5,092 |
) |
|
|
5,092 |
|
|
|
— |
|
|
Retired |
|
|
(711 |
) |
|
|
— |
|
|
|
(711 |
) |
|
Shares available at June 30, 2016 |
|
|
— |
|
|
|
5,401 |
|
|
|
5,401 |
|
7. Employee Benefit Plans (including Share-based Compensation)
As of June 30, 2016, the Company has the following share-based compensation plans:
2013 Equity Incentive Plan
The 2013 Equity Incentive Plan (the “2013 Plan”) was approved by stockholders on November 20, 2013. The 2013 Plan replaces the 2005 Equity Incentive Plan (the "2005 Plan"). Under the 2013 Plan, the Company may grant stock options, stock appreciation rights, restricted stock, restricted stock units, performance shares, performance units, and other share-based or cash-based awards to employees and consultants. The 2013 Plan also authorizes the grant of awards of stock options, stock appreciation rights, restricted stock and restricted stock units to non-employee members of the Board of Directors and deferred compensation awards to officers, directors and certain management or highly compensated employees. The 2013 Plan authorizes the issuance of 9,000,000 shares of the Company’s common stock. In addition, up to 12,709,153 shares subject to stock options and awards available for issuance under the 2005 Plan may be transferred to the 2013 Stock Plan and would be added to the number of shares available for future grant under the 2013 Plan. The 2013 Plan includes provisions upon the granting of certain awards defined by the 2013 Plan as Full Value Awards in which the shares available for grant under the 2013 Plan are decremented 1.5 shares for each such award granted. Upon forfeiture or cancellation of unvested awards, the same ratio is applied in returning shares to the 2013 Plan for future issuance as was applied upon granting. As of June 30, 2016, total options and awards to acquire 5,845,085 shares were outstanding under the 2013 Plan and 5,401,052 shares are available for grant under the 2013 Plan. Options granted under this plan have a contractual term of seven years.
Enterasys 2013 Stock Plan
Pursuant to the acquisition of Enterasys on October 31, 2013, the Company assumed the Enterasys 2013 Stock Plan (the "Enterasys Plan"). As of June 30, 2016, total options and awards to acquire 2,009,138 shares were outstanding under the Enterasys Plan. Options granted under this plan have a contractual term of seven years. If a participant terminates employment prior to the vesting dates, the non-vested shares will be forfeited and retired in the Enterasys Plan. No future grants may be made from the Enterasys Plan.
72
EXTREME NETWORKS, INC.
NOTES TO CONSOLIDATED FINANCIAL STATEMENTS—(Continued)
2005 Equity Incentive Plan
The 2005 Plan was adopted by the Company’s Board of Directors on October 20, 2005, and approved by stockholders on December 2, 2005. The 2005 Plan replaced the Amended 1996 Stock Option Plan (the “1996 Plan”), the 2000 Non-statutory Stock Option Plan and the 2001 Non-statutory Stock Option Plan. The 2005 Plan includes provisions upon the granting of certain awards defined by the 2005 Plan as Full Value Awards in which the shares available for grant under the 2005 Plan are decremented 1.5 shares for each such award granted. Upon forfeiture or cancellation of unvested awards, the same ratio is applied in returning shares to the 2005 Plan for future issuance as was applied upon granting. Effective November 20, 2013, the 2005 Plan was replaced with the 2013 Plan, and, as of June 30, 2016, total options and awards to acquire 2,754,804 shares were outstanding under the 2005 Plan. No future grants may be made from the 2005 Plan, however, outstanding options and awards forfeited or canceled were allowed to be transferred to the 2013 Plan until December 2, 2015, at which time, no further shares may be transferred. To date there have been 6,628,643 shares transferred to the 2013 Plan.
Amended 1996 Stock Option Plan
The 1996 Plan was originally adopted in September 1996, and provided for the grant of options for common stock to eligible participants. Effective December 2, 2005, the 1996 Plan was terminated, and, as of June 30, 2016, no options to acquire shares remain outstanding under the 1996 Plan. No future grants may be made from the 1996 Plan.
The following table summarizes stock option activity under all plans (shares and intrinsic value in thousands):
|
|
|
Number of Shares |
|
|
Weighted-Average Exercise Price Per Share |
|
|
Weighted-Average Remaining Contractual Term (years) |
|
|
Aggregate Intrinsic Value |
|
||||
|
Options outstanding at June 30, 2015 |
|
|
10,604 |
|
|
$ |
4.03 |
|
|
|
3.79 |
|
|
$ |
410 |
|
|
Granted |
|
|
5 |
|
|
$ |
3.79 |
|
|
|
|
|
|
|
|
|
|
Exercised |
|
|
(382 |
) |
|
$ |
3.21 |
|
|
|
|
|
|
|
|
|
|
Cancelled |
|
|
(3,842 |
) |
|
$ |
3.99 |
|
|
|
|
|
|
|
|
|
|
Options outstanding at June 30, 2016 |
|
|
6,385 |
|
|
$ |
4.10 |
|
|
|
3.70 |
|
|
$ |
1,416 |
|
|
Exercisable at June 30, 2016 |
|
|
4,676 |
|
|
$ |
4.28 |
|
|
|
2.82 |
|
|
$ |
602 |
|
|
Vested and expected to vest at June 30, 2016 |
|
|
6,122 |
|
|
$ |
4.14 |
|
|
|
3.21 |
|
|
$ |
1,254 |
|
The following table summarizes significant ranges of outstanding and exercisable options at June 30, 2016 (shares outstanding and exercisable, in thousands):
|
Options Outstanding |
|
|
Options Exercisable |
|
||||||||||||||||
|
|
|
|
|
|
|
Weighted- |
|
|
Weighted- |
|
|
|
|
|
|
Weighted- |
|
|||
|
|
|
Number |
|
|
Average |
|
|
Average |
|
|
Number |
|
|
Average |
|
|||||
|
Range of |
|
Outstanding |
|
|
Remaining |
|
|
Exercise |
|
|
Exercisable |
|
|
Exercise |
|
|||||
|
Exercise Prices |
|
(000’s) |
|
|
Contractual Life |
|
|
Price |
|
|
(000’s) |
|
|
Price |
|
|||||
|
|
|
|
|
|
|
(In years) |
|
|
|
|
|
|
|
|
|
|
|
|
|
|
|
$1.69 – $2.32 |
|
|
258 |
|
|
|
1.90 |
|
|
$ |
2.06 |
|
|
|
258 |
|
|
$ |
2.06 |
|
|
$2.51 – $2.51 |
|
|
1,006 |
|
|
|
5.84 |
|
|
$ |
2.51 |
|
|
|
107 |
|
|
$ |
2.51 |
|
|
$2.82 – $3.29 |
|
|
672 |
|
|
|
2.03 |
|
|
$ |
3.13 |
|
|
|
615 |
|
|
$ |
3.15 |
|
|
$3.38 – $3.55 |
|
|
686 |
|
|
|
2.38 |
|
|
$ |
3.51 |
|
|
|
555 |
|
|
$ |
3.50 |
|
|
$3.58 – $4.25 |
|
|
1,143 |
|
|
|
1.27 |
|
|
$ |
4.01 |
|
|
|
1,102 |
|
|
$ |
4.01 |
|
|
$4.29 – $4.29 |
|
|
2 |
|
|
|
0.69 |
|
|
$ |
4.29 |
|
|
|
2 |
|
|
$ |
4.29 |
|
|
$5.21 – $5.21 |
|
|
204 |
|
|
|
1.61 |
|
|
$ |
5.21 |
|
|
|
175 |
|
|
$ |
5.21 |
|
|
$5.30 – $5.30 |
|
|
1,923 |
|
|
|
4.25 |
|
|
$ |
5.30 |
|
|
|
1,559 |
|
|
$ |
5.30 |
|
|
$5.67 – $5.67 |
|
|
446 |
|
|
|
3.47 |
|
|
$ |
5.67 |
|
|
|
269 |
|
|
$ |
5.67 |
|
|
$6.15 – $6.15 |
|
|
45 |
|
|
|
3.39 |
|
|
$ |
6.15 |
|
|
|
34 |
|
|
$ |
6.15 |
|
|
$1.69 – $6.15 |
|
|
6,385 |
|
|
|
3.70 |
|
|
$ |
4.10 |
|
|
|
4,676 |
|
|
$ |
4.28 |
|
73
EXTREME NETWORKS, INC.
NOTES TO CONSOLIDATED FINANCIAL STATEMENTS—(Continued)
The total intrinsic value of options exercised in fiscal years 2016, 2015 and 2014 was $0.2 million, $0.4 million and $4.1 million, respectively.
Stock Awards
Stock awards may be granted under the 2013 Plan on terms approved by the Compensation Committee of the Board of Directors. Stock awards generally provide for the issuance of restricted stock units (including performance or market-based restricted stock units (“PSU”)) which vest over a fixed period of time or based upon the satisfaction of certain performance criteria. The Company recognizes compensation expense on the awards over the vesting period based on the award’s intrinsic value as of the date of grant.
During fiscal 2016 and fiscal 2015, the Company began expensing PSU’s with market or performance based conditions to senior executive officers that had been granted during fiscal 2016 and fiscal 2015. The Company uses a Monte-Carlo simulation model to determine the fair value and the derived service period of PSU’s, with market or performance conditions or combinations of those conditions with a service condition, on the date of grant.
The following table summarizes stock award activity (shares and market value in thousands):
|
|
|
Number of Shares |
|
|
Weighted- Average Grant Date Fair Value |
|
|
Aggregate Fair Market Value |
|
|||
|
Non-vested stock awards outstanding at June 30, 2015 |
|
|
4,597 |
|
|
$ |
3.82 |
|
|
|
|
|
|
Granted |
|
|
3,399 |
|
|
$ |
3.15 |
|
|
|
|
|
|
Vested |
|
|
(2,602 |
) |
|
$ |
4.20 |
|
|
|
|
|
|
Cancelled |
|
|
(1,170 |
) |
|
$ |
2.95 |
|
|
|
|
|
|
Non-vested stock awards outstanding at June 30, 2016 |
|
|
4,224 |
|
|
$ |
3.36 |
|
|
$ |
14,319 |
|
The aggregate fair value, as of the respective vesting dates of RSUs vested during the fiscal years ended June 30, 2016, 2015 and 2014 was $8.6 million, $8.9 million and $6.1 million, respectively.
For the fiscal years ended June 30, 2016, 2015 and 2014, the Company withheld an aggregate of 118,129 shares, 826,943 shares and 277,473 shares, respectively, upon the vesting of RSUs, based upon the closing share price on the vesting date to settle the employees’ minimum statutory obligation for the applicable income and other employment taxes. For fiscal years 2016, 2015 and 2014, the Company then remitted cash of $0.2 million, $2.8 million and $1.6 million, respectively, to the appropriate taxing authorities, and presented it as a financing activity within the consolidated statements of cash flows. The payment had the effect on shares issued by the Company as it reduced the number of shares that would have been issued on the vesting date and was recorded as a reduction of additional paid-in capital.
Performance Grant Activity
The following table summarizes PSU’s with market or performance based conditions granted and the number of awards that have satisfied the relevant market or performance criteria in each period (in thousands).
|
|
|
Fiscal year 2016 |
|
|
Fiscal year 2015 |
|
|
Fiscal year 2014 |
|
|||
|
Performance awards granted |
|
|
695 |
|
|
|
615 |
|
|
|
— |
|
|
Performance awards earned |
|
|
582 |
|
|
|
— |
|
|
|
— |
|
74
EXTREME NETWORKS, INC.
NOTES TO CONSOLIDATED FINANCIAL STATEMENTS—(Continued)
2014 Employee Stock Purchase Plan
In August 27, 2014, the Board of Directors approved the adoption of Extreme Network’s 2014 Employee Stock Purchase Plan (the “2014 ESPP”). On November 12, 2014, the stockholders approved the 2014 ESPP with the maximum number of shares of common stock that may be issued under the plan of 12,000,000 shares. The 2014 ESPP replaced the 1999 Employee Stock Purchase Plan. The 2014 ESPP allows eligible employees to acquire shares of the Company’s common stock through periodic payroll deductions of up to 15% of total compensation, subject to the terms of the specific offering periods outstanding. Each purchase period has a maximum duration of six (6) months. The price at which the common stock may be purchased is 85% of the lesser of the fair market value of the Company’s common stock on the first day of the applicable offering period or on the last day of the respective purchase period. The 2014 ESPP currently has offerings periods of either 6 months or 24 months, commonly referred to as "look back periods". As of June 30, 2016, there have been 1,999,625 shares issued under the 2014 ESPP.
Effective with the offering period beginning on February 1, 2016, the Company amended the 2014 ESPP to increase the maximum shares issuable for each purchase period from 1,000,000 shares to 1,500,000 shares. Effective with the offering period beginning on August 1, 2016, the Company amended the 2014 ESPP so that all future offering periods are limited to six months and to make certain other changes to the 2014 ESPP including adding new contribution limits for each offering period. Existing open offering periods prior to the effective date of the changes were unaffected by the amendments to the 2014 ESPP.
1999 Employee Stock Purchase Plan
In January 1999, the Board of Directors approved the adoption of Extreme Network’s 1999 Employee Stock Purchase Plan (the “1999 ESPP”). On December 2, 2005, the stockholders approved an amendment to the 1999 ESPP to increase the maximum number of shares of common stock that may be issued under the plan by 5,000,000 to a total of 12,000,000 shares. The 1999 ESPP was replaced by the 2014 ESPP. The 1999 ESPP allowed eligible employees to acquire shares of the Company’s common stock through periodic payroll deductions of up to 15% of total compensation. The price at which the common stock could be purchased was 85% of the lesser of the fair market value of the Company’s common stock on the first day of the applicable offering period or on the last day of the respective purchase period. Through June 30, 2015, 11,933,618 shares were purchased under the 1999 ESPP. All remaining shares available under the 1999 ESPP have been retired.
Share Based Compensation Expense
Share-based compensation expense recognized in the financial statements by line item caption is as follows (in thousands):
|
|
|
Year Ended |
|
|||||||||
|
|
|
June 30, 2016 |
|
|
June 30, 2015 |
|
|
June 30, 2014 |
|
|||
|
Cost of product revenue |
|
$ |
882 |
|
|
$ |
1,067 |
|
|
$ |
836 |
|
|
Cost of service revenue |
|
|
1,041 |
|
|
|
1,068 |
|
|
|
895 |
|
|
Research and development |
|
|
4,559 |
|
|
|
5,365 |
|
|
|
4,111 |
|
|
Sales and marketing |
|
|
4,633 |
|
|
|
5,170 |
|
|
|
6,430 |
|
|
General and administrative |
|
|
3,677 |
|
|
|
5,131 |
|
|
|
3,650 |
|
|
Total share-based compensation expense |
|
$ |
14,792 |
|
|
$ |
17,801 |
|
|
$ |
15,922 |
|
The amount of stock based compensation expense capitalized in inventory has been immaterial for each of the periods presented. As of June 30, 2016, there was $1.7 million of total unrecognized compensation cost related to unvested stock options. This cost is expected to be recognized over a weighted-average period of approximately 1.8 years. As of June 30, 2016, there were $10.1 million in unrecognized compensation costs related to non-vested stock awards. This cost is expected to be recognized over a weighted-average period of approximately 1.9 years
The weighted-average grant-date per share fair value of options granted in fiscal years 2016, 2015 and 2014, was $1.59, $1.75 and $2.36, respectively.
The average fair-value and the average derived service period on the grant-date for the performance-based option awards with market conditions, granted in fiscal 2015, was $1.21 and 1.9 years respectively.
75
EXTREME NETWORKS, INC.
NOTES TO CONSOLIDATED FINANCIAL STATEMENTS—(Continued)
The Company uses the straight-line method for expense attribution, and the Company estimates forfeitures and only recognizes expense for those shares expected to vest. The Company’s estimated forfeiture rate in fiscal 2016 based on the Company’s historical forfeiture experience is 13% for non-executives and 19% for executives.
The fair value of each stock option grant under the Company's 2013 Plan and 2005 Plan is estimated on the date of grant using the Black-Scholes-Merton option valuation model with the weighted average assumptions noted in the following table. The expected term of options granted is derived from historical data on employee exercise and post-vesting employment termination behavior. The risk-free rate is based upon the estimated life of the option and is based on the U.S. Treasury yield curve in effect at the time of grant. Expected volatility is based on a blended rate of the implied volatilities from traded options on the Company’s stock and historical volatility on the Company’s stock.
Under the 2013 Plan the Company uses a Monte-Carlo simulation model to determine the fair value and the derived service period of option grants, with market, performance or service conditions or combinations of those conditions, on the date of grant.
The fair value of each share purchase option under the Company's 2014 ESPP and 1999 ESPP is estimated on the date of grant using the Black-Scholes-Merton option valuation model with the weighted average assumptions noted in the following table. The expected term of the 2014 ESPP and the 1999 ESPP represents the term of the offering period of each option. The risk-free rate is based upon the estimated life and is based on the U.S. Treasury yield curve in effect at the time of grant. Expected volatility is based on a blended rate of the implied volatilities from traded options and historical volatility on the Company’s stock.
The weighted-average estimated per share fair value of shares purchased under the 2014 ESPP and 1999 ESPP in fiscal years 2016, 2015 and 2014, was $0.92, $0.90 and $1.64, respectively.
|
|
|
Stock Option Plan |
|
|
Employee Stock Purchase Plan |
|
||||||||||||||||||
|
|
|
Year Ended |
|
|
Year Ended |
|
||||||||||||||||||
|
|
|
June 30, 2016 |
|
|
June 30, 2015 |
|
|
June 30, 2014 |
|
|
June 30, 2016 |
|
|
June 30, 2015 |
|
|
June 30, 2014 |
|
||||||
|
Expected life |
|
4.0 years |
|
|
4.23 years |
|
|
4.40 years |
|
|
1.21 years |
|
|
0.66 years |
|
|
0.25 years |
|
||||||
|
Risk-free interest rate |
|
|
1.78 |
% |
|
|
1.17 |
% |
|
|
1.24 |
% |
|
|
0.33 |
% |
|
|
0.10 |
% |
|
|
0.08 |
% |
|
Volatility |
|
|
52 |
% |
|
|
50 |
% |
|
|
56 |
% |
|
|
58 |
% |
|
|
59 |
% |
|
|
58 |
% |
|
Dividend yield |
|
|
— |
% |
|
|
— |
% |
|
|
— |
% |
|
|
— |
% |
|
|
— |
% |
|
|
— |
% |
401(k) Plan
The Company provides a tax-qualified employee savings and retirement plan, commonly known as a 401(k) plan (the “Plan”), which covers the Company’s eligible employees. Pursuant to the Plan, employees may elect to reduce their current compensation up to the IRS annual contribution limit of $18,000 for calendar year 2016. Employees age 50 or over may elect to contribute an additional $6,000. The amount contributed to the Plan is on a pre-tax basis.
The Company provides for discretionary matching contributions as determined by the Board of Directors for each calendar year. All matching contributions vest immediately. In addition, the Plan provides for discretionary contributions as determined by the Board of Directors each year. During the year ended June 30, 2014, eligible employees from Enterasys were also added to the Plan as of the acquisition date. The program is to match $0.50 for every Dollar contributed by the employee up to the first 2.5% of pay. The Company’s matching contributions to the Plan totaled $1.2 million, $1.1 million and $0.8 million, for fiscal years 2016, 2015 and 2014, respectively. No discretionary contributions were made in fiscal years 2016, 2015 or 2014.
8. Common Stock Repurchases and Retirement
Common Stock Repurchases
On September 28, 2012, the Company's Board of Directors approved a share repurchase program for a maximum of $75 million which were to be purchased over a three year period in the open market or in privately negotiated transactions. All repurchased shares were retired and included in the Company's authorized but unissued shares. During the year ended June 30, 2013, the Company repurchased 4.1 million shares of common stock at a total cost of $14.5 million. No shares were repurchased during the years ended June 30, 2016, 2015 and 2014. On October 1, 2015 the repurchase program ended.
76
EXTREME NETWORKS, INC.
NOTES TO CONSOLIDATED FINANCIAL STATEMENTS—(Continued)
9. Income Taxes
Income before income taxes is as follows (in thousands):
|
|
|
Year Ended |
|
|||||||||
|
|
|
June 30, |
|
|
June 30, |
|
|
June 30, |
|
|||
|
|
|
2016 |
|
|
2015 |
|
|
2014 |
|
|||
|
Domestic |
|
$ |
(31,700 |
) |
|
$ |
(72,176 |
) |
|
$ |
(70,321 |
) |
|
Foreign |
|
|
4,152 |
|
|
|
5,340 |
|
|
|
17,200 |
|
|
Total |
|
$ |
(27,548 |
) |
|
$ |
(66,836 |
) |
|
$ |
(53,121 |
) |
The provision for income taxes for fiscal years 2016, 2015 and 2014 consisted of the following (in thousands):
|
|
|
Year Ended |
|
|||||||||
|
|
|
June 30, |
|
|
June 30, |
|
|
June 30, |
|
|||
|
|
|
2016 |
|
|
2015 |
|
|
2014 |
|
|||
|
Current: |
|
|
|
|
|
|
|
|
|
|
|
|
|
Federal |
|
$ |
727 |
|
|
$ |
476 |
|
|
$ |
22 |
|
|
State |
|
|
75 |
|
|
|
13 |
|
|
|
329 |
|
|
Foreign |
|
|
1,793 |
|
|
|
2,447 |
|
|
|
2,987 |
|
|
Total current |
|
|
2,595 |
|
|
|
2,936 |
|
|
|
3,338 |
|
|
Deferred: |
|
|
|
|
|
|
|
|
|
|
|
|
|
Federal |
|
|
1,659 |
|
|
|
1,507 |
|
|
|
1,632 |
|
|
State |
|
|
108 |
|
|
|
103 |
|
|
|
76 |
|
|
Foreign |
|
|
(26 |
) |
|
|
261 |
|
|
|
(857 |
) |
|
Total deferred |
|
|
1,741 |
|
|
|
1,871 |
|
|
|
851 |
|
|
Provision for income taxes |
|
$ |
4,336 |
|
|
$ |
4,807 |
|
|
$ |
4,189 |
|
The difference between the provision for income taxes and the amount computed by applying the federal statutory income tax rate (35 percent) to income before taxes is explained below (in thousands):
|
|
|
Year Ended |
|
|||||||||
|
|
|
June 30, |
|
|
June 30, |
|
|
June 30, |
|
|||
|
|
|
2016 |
|
|
2015 |
|
|
2014 |
|
|||
|
Tax at federal statutory rate |
|
$ |
(9,642 |
) |
|
$ |
(23,392 |
) |
|
$ |
(18,592 |
) |
|
State income tax, net of federal benefit |
|
|
75 |
|
|
|
13 |
|
|
|
329 |
|
|
Change in valuation allowance |
|
|
7,898 |
|
|
|
24,408 |
|
|
|
22,565 |
|
|
Research and development credits |
|
|
(1,364 |
) |
|
|
(303 |
) |
|
|
(1,836 |
) |
|
Foreign earnings taxed at other than U.S. rates |
|
|
1,678 |
|
|
|
(1,113 |
) |
|
|
(346 |
) |
|
Stock based compensation |
|
|
3,564 |
|
|
|
2,298 |
|
|
|
348 |
|
|
Goodwill amortization |
|
|
1,672 |
|
|
|
1,690 |
|
|
|
1,097 |
|
|
Other |
|
|
455 |
|
|
|
1,206 |
|
|
|
624 |
|
|
Provision for income taxes |
|
$ |
4,336 |
|
|
$ |
4,807 |
|
|
$ |
4,189 |
|
77
EXTREME NETWORKS, INC.
NOTES TO CONSOLIDATED FINANCIAL STATEMENTS—(Continued)
Significant components of the Company’s deferred tax assets are as follows (in thousands):
|
|
|
June 30, |
|
|
June 30, |
|
|
June 30, |
|
|||
|
|
|
2016 |
|
|
2015 |
|
|
2014 |
|
|||
|
Deferred tax assets: |
|
|
|
|
|
|
|
|
|
|
|
|
|
Net operating loss carry-forwards |
|
$ |
108,563 |
|
|
$ |
114,151 |
|
|
$ |
97,630 |
|
|
Tax credit carry-forwards |
|
|
32,730 |
|
|
|
30,824 |
|
|
|
30,019 |
|
|
Depreciation |
|
|
— |
|
|
|
— |
|
|
|
129 |
|
|
Intangible amortization |
|
|
28,480 |
|
|
|
17,978 |
|
|
|
6,061 |
|
|
Deferred revenue (net) |
|
|
7,955 |
|
|
|
7,811 |
|
|
|
10,540 |
|
|
Warrant amortization |
|
|
— |
|
|
|
1,355 |
|
|
|
2,723 |
|
|
Inventory write-downs |
|
|
6,207 |
|
|
|
6,048 |
|
|
|
3,265 |
|
|
Other allowances and accruals |
|
|
10,568 |
|
|
|
8,645 |
|
|
|
6,380 |
|
|
Stock based compensation |
|
|
4,048 |
|
|
|
6,783 |
|
|
|
6,257 |
|
|
Other |
|
|
4,275 |
|
|
|
5,902 |
|
|
|
10,772 |
|
|
Total deferred tax assets |
|
|
202,826 |
|
|
|
199,497 |
|
|
|
173,776 |
|
|
Valuation allowance |
|
|
(201,405 |
) |
|
|
(197,576 |
) |
|
|
(172,475 |
) |
|
Total net deferred tax assets |
|
|
1,421 |
|
|
|
1,921 |
|
|
|
1,301 |
|
|
Deferred tax liabilities: |
|
|
|
|
|
|
|
|
|
|
|
|
|
Depreciation |
|
|
(343 |
) |
|
|
(707 |
) |
|
|
— |
|
|
Goodwill amortization |
|
|
(4,459 |
) |
|
|
(2,787 |
) |
|
|
(1,097 |
) |
|
Foreign exchange gain |
|
|
— |
|
|
|
— |
|
|
|
(2,670 |
) |
|
Deferred tax liability on foreign withholdings |
|
|
(235 |
) |
|
|
(194 |
) |
|
|
(167 |
) |
|
Total deferred tax liabilities |
|
|
(5,037 |
) |
|
|
(3,688 |
) |
|
|
(3,934 |
) |
|
Net deferred tax assets (liabilities) |
|
$ |
(3,616 |
) |
|
$ |
(1,767 |
) |
|
$ |
(2,633 |
) |
|
Recorded as: |
|
|
|
|
|
|
|
|
|
|
|
|
|
Net current deferred tax assets |
|
$ |
— |
|
|
$ |
760 |
|
|
$ |
1,058 |
|
|
Net non-current deferred tax assets |
|
|
1,077 |
|
|
|
452 |
|
|
|
230 |
|
|
Net current deferred tax liabilities |
|
|
— |
|
|
|
— |
|
|
|
(2,657 |
) |
|
Net non-current deferred tax liabilities |
|
|
(4,693 |
) |
|
|
(2,979 |
) |
|
|
(1,264 |
) |
|
Net deferred tax assets (liabilities) |
|
$ |
(3,616 |
) |
|
$ |
(1,767 |
) |
|
$ |
(2,633 |
) |
The Company's global valuation allowance increased by $3.8 million in the fiscal year ended June 30, 2016 and $25.1 million in the fiscal year ended June 30, 2015. The Company has provided a full valuation allowance against all of its U.S. federal and state deferred tax assets, as well as valuation allowances against non-U.S. deferred tax assets in Australia, Brazil, Japan and Singapore. The valuation allowance is determined by assessing both negative and positive available evidence to assess whether it is more likely than not that the deferred tax assets will be recoverable. The Company's inconsistent earnings in recent periods, including a cumulative loss over the last three years, coupled with its difficulty in forecasting future revenue trends as well as the cyclical nature of the Company's business provides sufficient negative evidence to require a full valuation allowance against its U.S. federal and state net deferred tax assets. The valuation allowance is evaluated periodically and can be reversed partially or in full if business results and the economic environment have sufficiently improved to support realization of the Company's deferred tax assets.
On December 18, 2015 President Barack Obama signed H.R. 2029, the Protecting Americans from Tax Hikes (“PATH”) Act of 2015, which makes the Section 41 research credit, which expired on December 31, 2014, a permanent provision of the Internal Revenue Code. The law extends the research credit permanently and retroactively to January 1, 2015. This change has been reflected in our tax credit carryforwards with an offsetting adjustment to our US valuation allowance.
78
EXTREME NETWORKS, INC.
NOTES TO CONSOLIDATED FINANCIAL STATEMENTS—(Continued)
As of June 30, 2016, the Company had net operating loss carry-forwards for U.S. federal and state tax purposes of $322.7 million and $138.3 million, respectively, of which $38.6 million and $36.0 million, respectively, represent deductions from share-based compensation for which a benefit would be recorded in additional paid-in capital when realized. As of June 30, 2016, the Company also had foreign net operating loss carry-forwards in Ireland, Australia and Japan of $41.4 million, $9.4 million and $0.4 million, respectively. As of June 30, 2016, the Company also had federal and state tax credit carry-forwards of $22.1 million and $16.2 million, respectively. These credit carry-forwards consist of research and development tax credits as well as foreign tax credits with a small portion representing Alternative Minimum Tax Credits. The U.S. federal net operating loss carry-forwards of $322.7 million will begin to expire in the fiscal year ending June 30, 2021 and state net operating losses of $138.3 million began to partially expire in the fiscal year ending June 30, 2016. The foreign net operating losses can generally be carried forward indefinitely. Federal research and development tax credits of $14.2 million will expire beginning in fiscal 2019, if not utilized and foreign tax credits of $7.5 million will expire beginning in fiscal 2020. North Carolina state research and development tax credits of $0.9 million will expire beginning in the fiscal year ending June 30, 2023, if not utilized. California state research and development tax credits of $15.3 million do not expire and can be carried forward indefinitely.
As of January 2016, the Company performed an Internal Revenue Code section 382 analysis with respect to its net operating loss and credit carry-forwards to determine whether a potential ownership change had occurred that would place a limitation on the annual utilization of tax attributes. It was determined that no ownership change had occurred during the fiscal year ended June 30, 2016, however, it is possible a subsequent ownership change could limit the utilization of the Company's tax attributes.
As of June 30, 2016, the Company intends to indefinitely reinvest the earnings of approximately $10.3 million of certain foreign corporations. The unrecognized deferred tax liability associated with these earnings is approximately $0.3 million.
The Company conducts business globally and as a result, most of its subsidiaries file income tax returns in various domestic and foreign jurisdictions. In the normal course of business the Company is subject to examination by taxing authorities throughout the world. Its major tax jurisdictions are the U.S., Ireland, Brazil, India, California, New Hampshire and North Carolina. The Company is not currently under examination by any federal, state or foreign tax authority with respect to income taxes. The Company recently settled an income tax examination of one of its subsidiaries with the Malaysian tax authorities for the 2012, 2013 and 2014 years of assessment resulting in a minimal amount of tax due. The tax reserves were adjusted appropriately to reflect this settlement.
In general, the Company's U.S. federal income tax returns are subject to examination by tax authorities for fiscal years 2001 forward due to net operating losses and the Company's state income tax returns are subject to examination for fiscal years 2000 forward due to net operating losses.
During the fiscal year ended June 30, 2014, the Company acquired the stock of Enterasys Networks, Inc. and as such they became a wholly owned subsidiary of Extreme Networks. With respect to this acquisition, the Company made an election under Internal Revenue Code section 338(h)(10) to treat the acquisition as an asset purchase from a tax perspective. Under this election the tax basis of all assets is effectively reset to that of fair market value and therefore the transaction did not result in the recording of an opening net deferred tax position as the Company's tax basis in the acquired assets equaled its book basis.
As of June 30, 2016, the Company had $11.7 million of unrecognized tax benefits. If fully recognized in the future, there would be no impact to the effective tax rate, and $11.7 million would result in adjustments to deferred tax assets and corresponding adjustments to the valuation allowance. The Company does not reasonably expect the amount of unrealized tax benefits to decrease during the next twelve months.
79
EXTREME NETWORKS, INC.
NOTES TO CONSOLIDATED FINANCIAL STATEMENTS—(Continued)
A reconciliation of the beginning and ending amount of total unrecognized tax benefits is as follows (in thousands):
|
Balance at June 30, 2013 |
|
$ |
10,898 |
|
|
Decrease related to prior year tax positions |
|
|
— |
|
|
Increase related to prior year tax positions |
|
|
415 |
|
|
Increase related to current year tax positions |
|
|
464 |
|
|
Lapse of statute of limitations |
|
|
(177 |
) |
|
Balance at June 30, 2014 |
|
$ |
11,600 |
|
|
Decrease related to prior year tax positions |
|
|
(225 |
) |
|
Increase related to prior year tax positions |
|
|
288 |
|
|
Increase related to current year tax positions |
|
|
254 |
|
|
Lapse of statute of limitations |
|
|
(158 |
) |
|
Settlements with tax authorities |
|
|
(400 |
) |
|
Balance at June 30, 2015 |
|
$ |
11,359 |
|
|
Increase related to prior year tax positions |
|
|
174 |
|
|
Increase related to current year tax positions |
|
|
120 |
|
|
Balance at June 30, 2016 |
|
$ |
11,653 |
|
Estimated interest and penalties related to the underpayment of income taxes are classified as a component of tax expense in the consolidated statement of operations and totaled less than $0.1 million for each of the fiscal years 2016, 2015 and 2014.
10. Disclosure about Segments of an Enterprise and Geographic Areas
We conduct business globally and are primarily managed on a geographic theater basis. Our chief operating decision maker ("CODM"), who is our CEO, reviews financial information presented on a consolidated basis for purposes of allocating resources and evaluating financial performance.
Operating segments are defined as components of an enterprise about which separate financial information is available that is evaluated regularly by the CODM with respect to the allocation of resources and performance.
The Company operates in one segment, the development and marketing of network infrastructure equipment. Revenue is attributed to a geographical area based on the location of the customers. The Company operates in three geographic theaters: Americas, which includes the United States, Canada, Mexico, Central America and South America; EMEA, which includes Europe, Russia, Middle East and Africa; and APAC which includes Asia Pacific, China, South Asia and Japan.
The Company attributes revenues to geographic regions based on the customer's ship-to location. Information regarding geographic areas is as follows (in thousands):
|
|
|
Year Ended |
|
|||||||||
|
Net Revenues: |
|
June 30, 2016 |
|
|
June 30, 2015 |
|
|
June 30, 2014 |
|
|||
|
Americas: |
|
|
|
|
|
|
|
|
|
|
|
|
|
United States |
|
$ |
237,933 |
|
|
$ |
238,748 |
|
|
$ |
211,734 |
|
|
Other |
|
|
44,455 |
|
|
|
31,931 |
|
|
|
45,790 |
|
|
Total Americas |
|
|
282,388 |
|
|
|
270,679 |
|
|
|
257,524 |
|
|
EMEA: |
|
|
|
|
|
|
|
|
|
|
|
|
|
Germany |
|
|
65,799 |
|
|
|
67,316 |
|
|
|
66,099 |
|
|
Other |
|
|
130,789 |
|
|
|
156,052 |
|
|
|
136,456 |
|
|
Total EMEA |
|
|
196,588 |
|
|
|
223,368 |
|
|
|
202,555 |
|
|
APAC: |
|
|
49,413 |
|
|
|
58,893 |
|
|
|
59,475 |
|
|
Total net revenues |
|
$ |
528,389 |
|
|
$ |
552,940 |
|
|
$ |
519,554 |
|
80
EXTREME NETWORKS, INC.
NOTES TO CONSOLIDATED FINANCIAL STATEMENTS—(Continued)
The Company's long-lived assets are attributed to the geographic regions as follows (in thousands):
|
Long Lived Assets: |
|
June 30, 2016 |
|
|
June 30, 2015 |
|
||
|
Americas |
|
$ |
58,277 |
|
|
$ |
87,071 |
|
|
EMEA |
|
|
14,234 |
|
|
|
29,610 |
|
|
APAC |
|
|
2,493 |
|
|
|
3,108 |
|
|
Total long lived assets |
|
$ |
75,004 |
|
|
$ |
119,789 |
|
11. Net Loss Per Share
Basic earnings per share is calculated by dividing net income by the weighted average number of common shares outstanding during the period, less shares subject to repurchase, and excludes any dilutive effects of options, warrants and unvested restricted stock. Dilutive earnings per share is calculated by dividing net income by the weighted average number of common shares used in the basic earnings per share calculation plus the dilutive effect of shares subject to options, warrants and unvested restricted stock. The following table presents the calculation of basic and diluted net loss per share (in thousands, except per share data):
|
|
|
Year Ended |
|
|||||||||
|
|
|
June 30, 2016 |
|
|
June 30, 2015 |
|
|
June 30, 2014 |
|
|||
|
Net loss |
|
$ |
(31,884 |
) |
|
$ |
(71,643 |
) |
|
$ |
(57,310 |
) |
|
Weighted-average shares used in per share calculation - basic and diluted |
|
|
103,074 |
|
|
|
99,000 |
|
|
|
95,515 |
|
|
Net loss per share - basic and diluted |
|
$ |
(0.31 |
) |
|
$ |
(0.72 |
) |
|
$ |
(0.60 |
) |
Potentially dilutive common shares from employee incentive plans are determined by applying the treasury stock method to the assumed exercise of outstanding stock options, the assumed vesting of outstanding restricted stock units, and the assumed issuance of common stock under the ESPP. Weighted stock options outstanding with an exercise price higher than the Company's average stock price for the periods presented are excluded from the calculation of diluted net loss per share since the effect of including them would have been anti-dilutive due to the net loss position of the Company during the periods presented.
The following securities were excluded from the computation of outstanding diluted earnings per common share because they would have been anti-dilutive (in thousands).
|
|
|
June 30, 2016 |
|
|
June 30, 2015 |
|
|
June 30, 2014 |
|
|||
|
Options to purchase common stock |
|
|
6,937 |
|
|
|
7,542 |
|
|
|
7,595 |
|
|
Restricted stock units |
|
|
353 |
|
|
|
133 |
|
|
|
1,580 |
|
|
Total shares excluded |
|
|
7,290 |
|
|
|
7,675 |
|
|
|
9,175 |
|
12. Foreign Exchange Forward Contracts
The Company has used derivative financial instruments to manage exposures to foreign currency. The Company’s objective for holding derivatives is to use the most effective methods to minimize the impact of these exposures. The Company does not enter into derivatives for speculative or trading purposes.
At June 30, 2016 and 2015, the Company did not have any forward foreign currency contracts.
Foreign currency transaction gains and losses from operations were a gain of $1.3 million in fiscal 2016 and losses of $1.0 million and $1.5 million in fiscal years 2015 and 2014, respectively.
81
EXTREME NETWORKS, INC.
NOTES TO CONSOLIDATED FINANCIAL STATEMENTS—(Continued)
13. Restructuring Charges
As of June 30, 2016, restructuring liabilities were $4.6 million and consisted primarily of obligations pertaining to the estimated future obligations for non-cancelable lease payments, of which, payments will continue through fiscal year 2023, due to the length of the lease agreements. The restructuring liability is recorded in "Other accrued liabilities" and “Other long-term liabilities” in the consolidated balance sheets. During fiscal years 2016, 2015 and 2014, the Company recorded restructuring charges, net of reversals, of $11.0 million, $9.8 million and $0.5 million, respectively.
Fiscal 2016
During fiscal 2016, the Company continued its initiative to realign its operations with a second phase by abandoning excess facilities, primarily in San Jose, California; Salem, New Hampshire; Research Triangle Park, North Carolina and other smaller leased locations. The abandoned facilities represented approximately 32% of the floor space in the aggregate at these locations and included general office and warehouse space.
In conjunction with the exiting of facilities noted above, we incurred $11.0 of restructuring charges. Excess facilities charges included accrued lease costs pertaining to the estimated future obligations for non-cancelable lease payments for excess facilities and contract termination charges of $5.4 million, acceleration of depreciation of leasehold improvements of $4.5 million, professional fees of $1.0 million and other of $0.1 million.
Significant restructuring charges incurred during 2016, by location, included $1.8 million of charges for excess facilities pertaining to the estimated future obligations for non-cancelable lease payments at our San Jose location. This represented 39% of the San Jose leased space. The Company amended its facility lease at its North Carolina location and exited excess space while recording $4.1 million of charges, which included $3.1 million in accelerated depreciation of leasehold improvements. This action represented 36% of the North Carolina location lease space. The Company recorded $4.4 million of charges for excess facilities at its Salem location, which included $1.3 million in accelerated depreciation of leasehold improvements. This action represented 27% of the Salem lease space. The excess facilities payments will continue through fiscal year 2023, due to the length of the lease agreements.
Fiscal 2015
During the fourth quarter of fiscal 2015, the Company reduced costs through targeted restructuring activities intended to reduce operating costs and realign our organization in the current competitive environment. We initiated a plan to reduce worldwide headcount by more than 225 employees, primarily in sales and marketing, as well as research and development, consolidate specific global administrative functions, and shift certain operating costs to lower cost regions, among other actions. The Company recorded $9.7 million of charges associated with its Phase One initiative.
Fiscal 2014
In fiscal 2014, the Company incurred an additional $0.5 million of expenses related to a restructuring plan originating in 2013. As part of its restructuring efforts in the second quarter of fiscal 2013, the Company initiated a plan to reduce its worldwide headcount by 13%, consolidate specific global administrative functions, and shift certain operating costs to lower cost regions, among other actions. There were no outstanding liabilities as of June 30, 2015.
82
EXTREME NETWORKS, INC.
NOTES TO CONSOLIDATED FINANCIAL STATEMENTS—(Continued)
Restructuring liabilities consist of (in thousands):
|
|
|
Excess Facilities |
|
|
Severance Benefits |
|
|
Other |
|
|
Total |
|
||||
|
Balance as of June 30, 2013 |
|
$ |
— |
|
|
$ |
1,217 |
|
|
$ |
249 |
|
|
$ |
1,466 |
|
|
Period charges |
|
|
628 |
|
|
|
119 |
|
|
|
86 |
|
|
|
833 |
|
|
Period reversals |
|
|
(11 |
) |
|
|
(309 |
) |
|
|
(4 |
) |
|
|
(324 |
) |
|
Addition from acquisition |
|
|
(20 |
) |
|
|
— |
|
|
|
— |
|
|
|
(20 |
) |
|
Period payments |
|
|
(275 |
) |
|
|
(1,027 |
) |
|
|
(331 |
) |
|
|
(1,633 |
) |
|
Balance as of June 30, 2014 |
|
|
322 |
|
|
|
— |
|
|
|
— |
|
|
|
322 |
|
|
Period charges |
|
|
0 |
|
|
|
9,694 |
|
|
|
125 |
|
|
|
9,819 |
|
|
Period payments |
|
|
(322 |
) |
|
|
(3,957 |
) |
|
|
(8 |
) |
|
|
(4,287 |
) |
|
Balance as of June 30, 2015 |
|
|
— |
|
|
|
5,737 |
|
|
|
117 |
|
|
|
5,854 |
|
|
Period charges |
|
|
10,811 |
|
|
|
668 |
|
|
|
237 |
|
|
|
11,716 |
|
|
Period reversals |
|
|
(18 |
) |
|
|
(618 |
) |
|
|
(90 |
) |
|
|
(726 |
) |
|
Non cash adjustments |
|
|
(4,463 |
) |
|
|
— |
|
|
|
— |
|
|
|
(4,463 |
) |
|
Period payments |
|
|
(1,686 |
) |
|
|
(5,787 |
) |
|
|
(264 |
) |
|
|
(7,737 |
) |
|
Balance as of June 30, 2016 |
|
$ |
4,644 |
|
|
$ |
— |
|
|
$ |
— |
|
|
$ |
4,644 |
|
|
Less: current portion included in Other accrued liabilities |
|
|
|
|
|
|
|
|
|
|
|
|
|
|
2,522 |
|
|
Restructuring accrual included in Other long-term liabilities |
|
|
|
|
|
|
|
|
|
|
|
|
|
$ |
2,122 |
|
Item 9. Changes in and Disagreements with Accountants on Accounting and Financial Disclosure
None.
Item 9A. Controls and Procedures
Evaluation of Disclosure Controls and Procedures
Disclosure controls and procedures are controls and procedures designed to reasonably assure that information required to be disclosed in our reports filed under the Securities Exchange Act of 1934 as amended, such as this Report, is recorded, processed, summarized and reported within the time periods specified in the SEC's rules and forms and to reasonably assure that such information is accumulated and communicated to our management, including the Chief Executive Officer (“CEO”) and the Chief Financial Officer (“CFO”), as appropriate to allow timely decisions regarding required disclosure.
Under the supervision and with the participation of our management, including our Chief Executive Officer and Chief Financial Officer, we evaluated the effectiveness of the design and operation of our disclosure controls and procedures as of the end of the period covered by this Report. Based on this evaluation, our Chief Executive Officer and Chief Financial Officer concluded that our disclosure controls and procedures were effective as of June 30, 2016.
Management’s Report on Internal Control over Financial Reporting
Our management is responsible for establishing and maintaining adequate internal control over our financial reporting. There are inherent limitations in the effectiveness of any system of internal control, including the possibility of human error and the circumvention or overriding of controls. Accordingly, even effective internal controls can provide only reasonable assurances with respect to financial statement preparation. Further because of changes in conditions, the effectiveness of internal control may vary over time.
We assessed the effectiveness of our internal control over financial reporting as of June 30, 2016. In making this assessment, we used the criteria set forth by the Committee of Sponsoring Organizations of the Treadway Commission ("COSO") in Internal Control-Integrated Framework (2013).
Based on our assessment using those criteria, we concluded that, as of June 30, 2016 our internal control over financial reporting is effective.
83
EXTREME NETWORKS, INC.
NOTES TO CONSOLIDATED FINANCIAL STATEMENTS—(Continued)
Our independent registered public accounting firm, KPMG LLP, has audited the financial statements included in this Annual Report on Form 10-K and has issued its report on our internal control over financial reporting as of June 30, 2016.
Changes in Internal Control over Financial Reporting
There were no changes in our internal control over financial reporting during the quarter ended June 30, 2016 that have materially affected, or are reasonably likely to materially affect, our internal control over financial reporting.
Inherent Limitations on Effectiveness of Controls
Our management, including the CEO and CFO, does not expect that our disclosure controls or our internal control over financial reporting will prevent or detect all error and all fraud. A control system, no matter how well designed and operated, can provide only reasonable, not absolute, assurance that the control system’s objectives will be met. Our controls and procedures are designed to provide reasonable assurance that our control system’s objective will be met and our CEO and CFO have concluded that our disclosure controls and procedures are effective at the reasonable assurance level. The design of a control system must reflect the fact that there are resource constraints, and the benefits of controls must be considered relative to their costs. Further, because of the inherent limitations in all control systems, no evaluation of controls can provide absolute assurance that misstatements due to error or fraud will not occur or that all control issues and instances of fraud, if any, within Extreme Networks have been detected. These inherent limitations include the realities that judgments in decision-making can be faulty and that breakdowns can occur because of simple error or mistake. Controls can also be circumvented by the individual acts of some persons, by collusion of two or more people, or by management override of the controls. The design of any system of controls is based in part on certain assumptions about the likelihood of future events. Projections of any evaluation of the effectiveness of controls in future periods are subject to risks. Over time, controls may become inadequate because of changes in conditions or deterioration in the degree of compliance with policies or procedures. Notwithstanding these limitations, our disclosure controls and procedures are designed to provide reasonable assurance of achieving their objectives. Our CEO and CFO have concluded that our disclosure controls and procedures are, in fact, effective at the “reasonable assurance” level.
None.
84
Certain information required by Part III is incorporated by reference from our definitive Proxy Statement to be filed with the Securities and Exchange Commission in connection with the solicitation of proxies for our 2016 Annual Meeting of Stockholders (the “Proxy Statement”) not later than 120 days after the end of the fiscal year covered by this report, and certain information therein is incorporated in this report by reference.
Item 10. Directors, Executive Officers and Corporate Governance
The information required by this section for our directors is incorporated by reference from the information in the section entitled “Proposal 1 – Election of Directors” in the Proxy Statement. The information required by this section for our executive officers is incorporated by reference from the information in the section entitled “Executive Compensation and Other Matters” in the Proxy Statement.
Item 405 of Regulation S-K calls for disclosure of any known late filing or failure by an insider to file a report required by Section 16 of the Exchange Act. This disclosure is contained in the section entitled “Section 16(a) Beneficial Ownership Reporting Compliance” in the Proxy Statement and is incorporated herein by reference.
Information with respect to Item 406 of Regulation S-K is incorporated by reference to the information contained in the section captioned “Code of Ethics and Corporate Governance Materials” in the Proxy Statement.
Item 11. Executive Compensation
The information required by this section is incorporated by reference from the information in the sections entitled “Directors’ Compensation”, “Executive Compensation and Other Matters” and “Report of the Compensation Committee” in the Proxy Statement.
Item 12. Security Ownership of Certain Beneficial Owners and Management and Related Stockholder Matters
The information required by this section is incorporated by reference from the information in the section entitled “Security Ownership of Certain Beneficial Owners and Management” in the Proxy Statement.
The information required by this section regarding securities authorized for issuance under equity compensation plans is incorporated by reference from the information in the section entitled “Equity Compensation Plan Information” in the Proxy Statement.
Item 13. Certain Relationships and Related Transactions, and Director Independence
The information required by this section is incorporated by reference from the information in the section titled “Certain Relationships and Related Transactions” in the Proxy Statement.
Item 14. Principal Accounting Fees and Services
The information required by this section is incorporated by reference from the information in the section titled “Principal Accountant Fees and Services” in the Proxy Statement.
85
Item 15. Exhibits and Financial Statement Schedules
|
· |
The following documents are filed as a part of this Form 10-K: |
|
|
(1) |
Financial Statements: |
Reference is made to the Index to Consolidated Financial Statements of Extreme Networks, Inc. under Item 8 in Part II of this Form 10-K.
|
|
· |
Financial Statement Schedules: |
All required schedules are omitted because either they are not applicable or the required information is shown in the financial statements or notes thereto.
|
|
· |
Exhibits: |
Incorporated herein by reference is a list of the Exhibits contained in the Exhibit Index.
86
Pursuant to the requirements of Section 13 or 15(d) of the Securities Exchange Act of 1934, the Registrant has duly caused this report to be signed on its behalf by the undersigned, thereunto duly authorized, on September 2, 2016.
|
|
EXTREME NETWORKS, INC. (Registrant) |
|
|
|
|
|
|
|
By: |
/s/ B. DREW DAVIES |
|
|
|
B. Drew Davies |
|
|
|
Executive Vice President, Chief Financial Officer, (Principal Accounting Officer) |
|
|
|
September 2, 2016 |
POWER OF ATTORNEY
KNOW ALL PERSONS BY THESE PRESENTS, that each person whose signature appears below constitutes and appoints B. Drew Davies, his true and lawful attorneys-in-fact, with full power of substitution, for him in any and all capacities, to sign any amendments to this report on Form 10-K and to file the same, with exhibits thereto and other documents in connection therewith, with the Securities and Exchange Commission, hereby ratifying and confirming all that each of said attorneys-in-fact or their substitute or substitutes may do or cause to be done by virtue hereof.
Pursuant to the requirements of the Securities Exchange Act of 1934, this report has been signed below by the following persons on behalf of the Registrant and in the capacities and on the date indicated:
|
/s/ JOHN H. KISPERT |
|
/s/ EDWARD B. MEYERCORD III |
|
John H. Kispert |
|
Edward B. Meyercord III |
|
Chairman of the Board |
|
President and Chief Executive Officer, Director |
|
September 2, 2016 |
|
(Principal Executive Officer) |
|
|
|
September 2, 2016 |
|
|
|
|
|
/s/ B. DREW DAVIES |
|
/s/ CHARLES CARINALLI |
|
B. Drew Davies |
|
Charles Carinalli |
|
Executive Vice President, Chief Financial Officer |
|
Director |
|
(Principal Accounting Officer) |
|
September 2, 2016 |
|
September 2, 2016 |
|
|
|
|
|
|
|
/s/ KATHLEEN M. HOLMGREN |
|
/s/ EDWARD H. KENNEDY |
|
Kathleen M. Holmgren |
|
Edward H. Kennedy |
|
Director |
|
Director |
|
September 2, 2016 |
|
September 2, 2016 |
|
|
|
|
|
/s/ RAJ KHANNA |
|
/s/ JOHN C. SHOEMAKER |
|
Raj Khanna |
|
John C. Shoemaker |
|
Director |
|
Director |
|
September 2, 2016 |
|
September 2, 2016 |
87
EXHIBIT INDEX
The exhibits listed below are required by Item 601 of Regulation S-K. Each management contract or compensatory plan or arrangement required to be filed as an exhibit to this Form 10-K has been identified.
|
Exhibit Number |
|
|
|
Incorporated by Reference |
|
Filed Herewith |
||||
|
Description of Document |
|
Form |
|
Filing Date |
|
Number |
|
|||
|
2.1 |
|
Stock Purchase Agreement, dated September 12, 2013 between Enterprise Network Holdings, Inc. and Extreme Networks, Inc. |
|
8-K |
|
9/13/2013 |
|
2.1 |
|
|
|
3.1 |
|
Amended and Restated Certificate of Incorporation of Extreme Networks, Inc. |
|
8-K |
|
12/17/2010 |
|
3.2 |
|
|
|
3.2 |
|
Amended and Restated Bylaws of Extreme Networks, Inc. |
|
8-K |
|
3/31/2011 |
|
3.1 |
|
|
|
3.3 |
|
Certificate of Designation, Preferences and Rights of the Terms of the Series A Preferred Stock |
|
10-K |
|
9/26/2001 |
|
3.7 |
|
|
|
4.1 |
|
Amended and Restated Rights Agreement dated April 26, 2012 between Extreme Networks, Inc. and Computershare Shareowner Services LLC. |
|
8-K |
|
4/30/2012 |
|
4.1 |
|
|
|
4.2 |
|
Amendment No. 2 to the Amended and Restated Rights Agreement effective April 30, 2014. |
|
8-K |
|
5/20/2014 |
|
4.1 |
|
|
|
4.3 |
|
Amendment No. 3 to the Amended and Restated Rights Agreement effective May 14, 2015. |
|
8-K |
|
5/19/2015 |
|
4.1 |
|
|
|
4.4 |
|
Amendment No. 4 to the Amended and Restated Rights Agreement effective May 5, 2016 |
|
8-K |
|
5/9/2016 |
|
4.1 |
|
|
|
10.1 |
|
Form of Indemnification Agreement for directors and officers. |
|
8-K |
|
10/24/2011 |
|
99.1 |
|
|
|
10.2* |
|
2000 Nonstatutory Stock Option Plan. |
|
10-K |
|
9/24/2000 |
|
10.7 |
|
|
|
10.3* |
|
2001 Nonstatutory Stock Option Plan. |
|
Schedule TO |
|
10/31/2001 |
|
(d)(9) |
|
|
|
10.4 |
|
Lease Agreement by and between RDU Center III LLC and Extreme Networks, Inc. dated October 15, 2012. |
|
8-K |
|
10/19/2012 |
|
10.1 |
|
|
|
10.5 |
|
First Amendment to Lease Agreement by and between RDU Center III LLC and Extreme Networks, Inc. dated December 31, 2012. |
|
8-K |
|
1/7/2013 |
|
10.1 |
|
|
|
10.6 |
|
Office Space Lease Agreement by and between W3 Ridge Rio Robles Property LLC and Extreme Networks, Inc., dated December 31, 2012. |
|
8-K |
|
1/7/2013 |
|
10.2 |
|
|
|
10.7 |
|
Credit Agreement, dated as of October 31, 2013, among Extreme Networks Inc., as borrower, Silicon Valley Bank, as administrative agent and collateral agent, Bank of America, N.A. and PNC Bank, National Association as co-syndication agents and the lenders party thereto. |
|
8-K |
|
11/1/2013 |
|
10.1 |
|
|
|
10.8* |
|
Enterasys Networks, Inc. 2013 Stock Plan. |
|
S-8 |
|
11/22/2013 |
|
99.1 |
|
|
|
10.9* |
|
Offer Letter executed May 2, 2014, between Extreme Networks, Inc. and Ken Arola. |
|
8-K |
|
5/8/2014 |
|
10.1 |
|
|
|
10.10 |
|
Second Amendment to the Credit Agreement dated November 18, 2014, among Extreme Networks, Inc., a Delaware Corporation, the Lenders party thereto and Silicon Valley Bank, as the Issuing Lender and Swingline Lender and Administrative Agent. |
|
8-K |
|
11/20/2014 |
|
10.1 |
|
|
|
10.11* |
|
Extreme Networks, Inc. 2014 Employee Stock Purchase Plan as amended and restated June 2016. |
|
|
|
|
|
|
|
X |
|
10.12* |
|
Extreme Networks, Inc. 2014 Employee Stock Purchase Plan as amended and restated November 2015. |
|
|
|
|
|
|
|
X |
|
10.13* |
|
Extreme Networks, Inc. 2013 Equity Incentive Plan. |
|
10-K/A |
|
10/07/2015 |
|
10.18 |
|
|
|
10.14* |
|
Form of market based restricted stock units award agreement under Extreme Networks, Inc. 2013 Equity Incentive Plan. |
|
10-Q |
|
1/30/2015 |
|
99.1 |
|
|
|
10.15* |
|
Form of restricted stock unit award agreement under Extreme Networks, Inc. 2013 Equity Incentive Plan. |
|
|
|
|
|
|
|
X |
88
|
Exhibit Number |
|
|
|
Incorporated by Reference |
|
Filed Herewith |
||||
|
Description of Document |
|
Form |
|
Filing Date |
|
Number |
|
|||
|
10.16* |
|
Form of performance based restricted stock unit award agreement under Extreme Networks, Inc. 2013 Equity Incentive Plan. |
|
|
|
|
|
|
|
X |
|
10.17* |
|
Form of option award agreement under Extreme Networks, Inc. 2013 Equity Incentive Plan. |
|
|
|
|
|
|
|
X |
|
10.18* |
|
Offer Letter, executed April 30, 2015, between Extreme Networks, Inc. and Edward B. Meyercord. |
|
8-K |
|
4/30/2015 |
|
10.1 |
|
|
|
10.19 |
|
Third Amendment to the Credit Agreement and First Amendment to Guarantee and Collateral Agreement dated June 26, 2015, among Extreme Networks, Inc., a Delaware Corporation, the Lenders party thereto and Silicon Valley Bank, as the Issuing Lender and Swingline Lender and Administrative Agent. |
|
8-K |
|
6/30/2015 |
|
10.1 |
|
|
|
10.20 |
|
Second Amendment to Lease Agreement by and between TDC Blue II, LLC and Extreme Networks, Inc. dated December 17, 2015. |
|
10-Q |
|
2/2/2016 |
|
10.1 |
|
|
|
10.21* |
|
Promotion Letter between Robert Gault and Extreme Networks, Inc. dated June 2, 2015. |
|
10-Q |
|
4/29/2016 |
|
10.2 |
|
|
|
10.22* |
|
Supplemental Letter between Robert Gault and Extreme Networks, Inc. dated August 4, 2015. |
|
10-Q |
|
4/29/2016 |
|
10.3 |
|
|
|
10.23* |
|
Offer Letter, executed May 15, 2016, between Extreme Networks, Inc. and Drew Davies. |
|
8-K |
|
5/19/2016 |
|
10.1 |
|
|
|
10.24* |
|
Separation Agreement and Release of Claims, executed May 18, 2016, between Extreme Networks, Inc. and Kenneth Arola. |
|
8-K |
|
5/19/2016 |
|
10.2 |
|
|
|
10.25* |
|
Extreme Networks, Inc. Executive Change in Control Severance Plan Amended and Restated May 4, 2016. |
|
|
|
|
|
|
|
X |
|
10.26* |
|
Agreement to Participate in the Extreme Networks, Inc. Executive Change in Control Severance Plan as Amended and Restated May 4, 2016. |
|
|
|
|
|
|
|
X |
|
10.27* |
|
Amended and restated Offer Letter, executed August 31, 2016, between Extreme Networks, Inc. and Edward B. Meyercord. |
|
|
|
|
|
|
|
X |
|
10.28* |
|
Summary of FY17 Executive Officer Compensation Arrangements. |
|
|
|
|
|
|
|
X |
|
10.29* |
|
Extreme Networks, Inc. 2005 Equity Incentive Plan |
|
8-K |
|
10/23/2009 |
|
10.6 |
|
|
|
10.30* |
|
Form of Option agreement under the Extreme Networks, Inc. 2005 Equity Incentive Plan |
|
|
|
|
|
|
|
X |
|
21.1 |
|
Subsidiaries of Registrant. |
|
|
|
|
|
|
|
X |
|
23.1 |
|
Consent of KPMG LLP, Independent Registered Public Accounting Firm. |
|
|
|
|
|
|
|
X |
|
24.1 |
|
Power of Attorney (see the signature page of this Form 10-K). |
|
|
|
|
|
|
|
X |
|
31.1 |
|
Section 302 Certification of Chief Executive Officer. |
|
|
|
|
|
|
|
X |
|
31.2 |
|
Section 302 Certification of Chief Financial Officer. |
|
|
|
|
|
|
|
X |
|
32.1 |
|
Section 906 Certification of Chief Executive Officer. |
|
|
|
|
|
|
|
X |
|
32.2 |
|
Section 906 Certification of Chief Financial Officer. |
|
|
|
|
|
|
|
X |
|
* |
Indicates management or board of directors contract or compensatory plan or arrangement. |
|
** |
Pursuant to Rule 406T of Regulation S-T, these interactive data files are furnished and not filed or a part of a registration statement or prospectus for purposes of sections 11 or 12 of the Securities Act of 1933, as amended; are deemed not filed for purposes of section 18 of the Securities Exchange Act of 1934, as amended; and otherwise are not subject to liability under these sections. |
89