Attached files
| file | filename |
|---|---|
| 8-K - FORM 8-K - American Finance Trust, Inc | v448403_8-k.htm |
Exhibit 99.1

2 nd Quarter 2016 Webinar Series

A Public Non - Traded Real Estate Investment Trust* Second Quarter 2016 Investor Presentation Platform Advisor To Investment Programs

3 Risk Factors Investing in our common stock involves a high degree of risk . See the section entitled “Risk Factors” in our most recent Annual Report on Form 10 - K for a discussion of the risks which should be considered in connection with American Finance Trust, Inc . (“AFIN” or the “Company”) . Forward - Looking Statements This presentation may contain forward - looking statements . You can identify forward - looking statements by the use of forward - looking terminology such as “believes,” “expects,” “may,” “will,” “would,” “could,” “should,” “seeks,” “intends,” “plans,” “projects,” “estimates,” “anticipates,” “predicts,” or “potential” or the negative of these words and phrases or similar words or phrases . Please review the end of this presentation and the Company’s most recent Annual Report on Form 10 - K for a more complete list of risk factors, as well as a discussion of forward - looking statements and other details. American Finance Trust, Inc. IMPORTANT INFORMATION 3

4 American Finance Trust, Inc. PORTFOLIO UPDATE

American Finance Trust, Inc. PORTFOLIO UPDATE: AS OF 6/30/2016 ▪ Strong Portfolio: 459 net lease assets with over 71% investment grade (1) tenants and 1 senior commercial mortgage loan as of June 30, 2016 ▪ Leverage: 48.0% total debt to total assets with a weighted average effective interest rate of 4.76% ▪ Flexible Cash Position: Cash balance of $149.0 million provides operational flexibility ▪ Selective Acquisitions: Management will continue to evaluate real estate properties and real estate debt investments throughout 2016 ▪ Net Asset Value: On March 17, 2016, the Company’s independent directors unanimously reaffirmed an estimated per - share net asset value (“Estimated Per - Share NAV”) equal to $24.17 as of December 31, 2015 ▪ Distribution Rate: AFIN continues to pay an annualized distribution per share of $1.65, or 6.83% based on the most recent Estimated Per - Share NAV ▪ 2 nd Quarter Activity: ▪ Sold 8 SunTrust Bank (“SunTrust”) properties for a total contact price of $28.9 million, resulting in a gain of $0.5 million ▪ Amended lease terms on 160 SunTrust leases, increasing overall weighted average remaining lease term and annualized straight - line rent (“SLR”) in SunTrust portfolio (1) Includes actual and implied ratings; please see following slide. Calculations based on annualized SLR on a weighted - average basis. 5

American Finance Trust, Inc. SUNTRUST UPDATE 1) For 209 properties, the lease agreements were set to expire December 31, 2017; the remaining 4 properties had lease expiratio ns on March 31, 2018. » AFIN had leasing agreements with SunTrust that were set to expire on December 31, 2017 (1) ▪ As of March 31, 2016 AFIN owned 213 SunTrust properties, and its leases represented 18% of total annualized SLR – AFIN’s largest tenant » On May 12, 2016, AFIN and SunTrust executed various agreements to extend leases for the majority of the 213 SunTrust properties In May 2016, AFIN and SunTrust Executed Agreements to Extend the Majority of SunTrust Leases for 10+ years Lease Extensions Include x Long - term lease extensions with significant annual rent increases x 1.50% annually for 10+ years Increases WAVG Remaining Lease Term x Increases the overall AFIN weighted average lease term profile x Weighted average remaining lease term increased to 9.6 years as of June 30, 2016, compared to 8.4 years as of March 31, 2016 Mitigates Risk x Effectively eliminates significant uncertainty associated with SunTrust x SunTrust is a key tenant and an investment grade credit 6

American Finance Trust, Inc. AFIN PORTFOLIO STRENGTH: AS OF JUNE 30, 2016 Property Type (1) Tenant Credit Rating (1)(2)(3) » Diverse, retail focused property mix » Over 71% Actual & Implied Investment Grade Tenant Ratings Tenant Industry (1) 1) Graphs percentages are based on annualized SLR as of June 30, 2016. 2) Actual ratings reflect the tenant rating. Implied Ratings are determined using a proprietary Moody’s analytical tool which compares the risk metrics of the non - rated company to those of a company with an Actual Rating. A tenant with a parent that has an investment grade rating is included in implied investment grade. Ratings information is as of June 30, 2016. 3) Implied Non - IG includes companies that are not rated by the Company’s Implied Ratings system. » AFIN’s tenants operate in 18 different industries Retail 45.3% Office 29.3% Distribution 25.4% Retail Banking 19.0% Healthcare 15.2% Distribution 12.5% Financial Services 12.1% Refrigerated Warehousing 7.7% Supermarket 6.7% Restaurant 6.6% Home Maintenance 6.5% Pharmacy 3.8% Other 9.9% Actual IG 67.4% Implied IG 4.1% Actual Non - IG 20.2% Implied Non - IG 8.3% 7

□ Review opportunities to extend leases on existing properties in order to increase average lease term across entire portfolio . □ Continue to market certain properties in order to maximize value through sales and maintain portfolio level NOI through newly executed leases. □ Evaluate current portfolio for dispositions and/or joint venture opportunities. □ Investment team conducts on - going analysis to identify key markets in which AFIN can harvest maximum value of assets. □ Monitor the publicly traded REIT market and evaluate liquidity options. KEY INITIATIVES American Finance Trust, Inc. 8
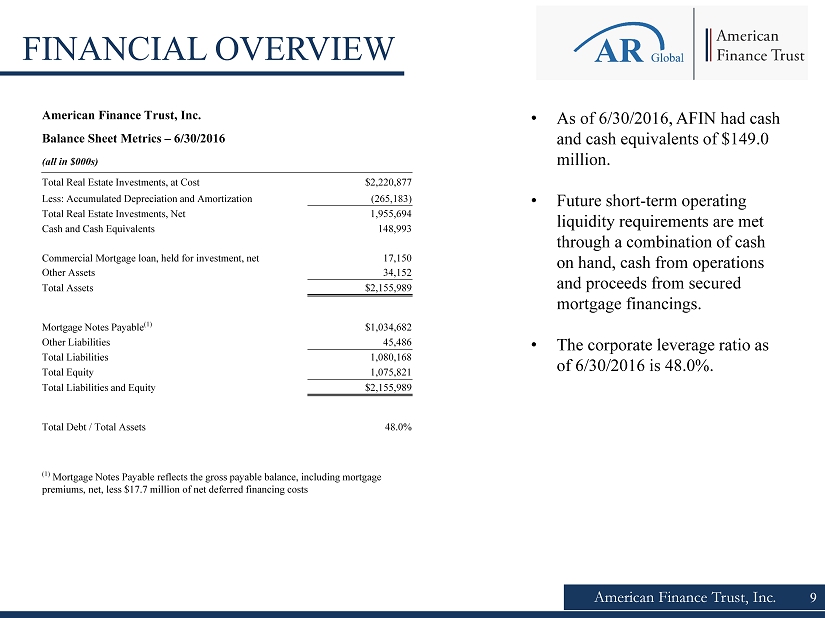
American Finance Trust, Inc. FINANCIAL OVERVIEW • As of 6/30/2016, AFIN had cash and cash equivalents of $149.0 million. • Future short - term operating liquidity requirements are met through a combination of cash on hand, cash from operations and proceeds from secured mortgage financings. • The corporate leverage ratio as of 6/30/2016 is 48.0%. 9 American Finance Trust, Inc. Balance Sheet Metrics – 6/30/2016 (all in $000s) Total Real Estate Investments, at Cost $2,220,877 Less: Accumulated Depreciation and Amortization (265,183) Total Real Estate Investments, Net 1,955,694 Cash and Cash Equivalents 148,993 Commercial Mortgage loan, held for investment, net 17,150 Other Assets 34,152 Total Assets $2,155,989 Mortgage Notes Payable (1) $1,034,682 Other Liabilities 45,486 Total Liabilities 1,080,168 Total Equity 1,075,821 Total Liabilities and Equity $2,155,989 Total Debt / Total Assets 48.0% (1) Mortgage Notes Payable reflects the gross payable balance, including mortgage premiums, net, less $17.7 million of net deferred financing costs

10 American Finance Trust, Inc. MARKET OVERVIEW

American Finance Trust, Inc. • On August 31, equity REITS were moved out of the GICS financial sector into its own industry code. • This marks the first change to the GICS structure since its introduction in 1999. • This change validates REITs as an asset class and potentially will lead to increased coverage and fund flows for listed REITs that are included in an index. (1) Nuveen Asset Management, “Real Estate to Join GICS Sectors”. FactSet as of 9/30/15. Data represents the S&P 1500 Index, a broad reaching index covering approximately 90% of the U.S. market capitalization, to demonstrate how the addition of the real estate sector will change th e G ICS sector breakdown. The future breakdown is based on guidance from MSCI and Standard & Poor's. Indices are unmanaged and unavailable for investment. REAL ESTATE AS AN ASSET CLASS 11 (1) Following the reclassification of REITs out of financials, the real estate sector will represent approximately 3.4% of the S&P 1500 index, larger that utilities, materials, and telecom

American Finance Trust, Inc. • Although we are still at a sub 2% 10 - year Treasury, investors have expressed concern over potential rising rates in the near term • Contrary to popular belief, REITs can perform well during Fed tightening periods • Rising Treasury yields and Fed tightening typically indicate a recovering economy and positive conditions for real estate tha t drive occupancy and rent growth. • Even with potential rate hikes, we are still in a period of historically low borrowing costs and cap rate spreads remain attractive • As shown in this chart, over the past 20 years, REITs outperformed stocks and bonds during periods of a rising federal funds rate. Since 1994, there have been 46 months of during which the Fed increased the fed funds rate. Over those 46 months, annualized returns for the 3 major asset classes were as follows: Source: Cohen and Steers, “What History Tells us About REIT’s and Rising Rates”. REITs are represented by the FTSE NAREIT Equ ity REIT index. Stocks are represented by the S&P 500 Index. Bonds are represented by the Barclays Capital U.S. Aggregate Bond Index. Federal funds rate hi ke periods include: 2/4/94 – 2/1/95; 6/30/99 – 6/16/00; 6/30/04 - 6/30/06 WHAT ABOUT RISING RATES? 12

American Finance Trust, Inc. Transaction volumes are returning to 3 - year averages after peaking in 2015, while cap rates continue to compress nationwide, decreasing 25 bps from the 2015 average to 6.4% . 1031 buyers and private institutional investors are expected to remain active through the remainder of the year. Assets with strong credit and term will remain key for these increasingly risk - averse buyers. During the 2 nd quarter of 2016 approximately $10.0 billion was invested in the Net Lease Sector ($18.8 billion YTD), a 13% increase from the 1 st quarter. Net - lease buyers continue to operate in a market with favorable cost of borrowing, with the 10 year treasury rate under 2.0% since February 2016. Foreign investors continue to remain active in the net lease sector, increasing their acquisitions 27.5% year - over - year – most notably in secondary markets . Sources: The Boulder Group: The Net Lease Market Report Q2 2016 JLL: Net Lease Investment Outlook Q2 2016 DEMAND FOR NET - LEASE CONTINUES 13

14 American Finance Trust, Inc. Nicholas Radesca Chief Financial Officer, Treasurer and Secretary ▪ Formerly CFO & Corporate Secretary for Solar Capital Ltd. And Solar Senior Capital Ltd. ▪ Previously served as Chief Accounting Officer at iStar Financial, Inc. Michael Weil Chief Executive Officer, President and Chairman of the Board of Directors ▪ Founding partner of AR Global ▪ Supervised the origination of investment opportunities for all AR Global - sponsored investment programs ▪ Previously served as Senior VP of sales and leasing for American Financial Realty Trust (AFRT) ▪ Served as president of the Board of Directors of the Real Estate Investment Securities Association (REISA) Jason Slear Senior Vice President of Real Estate Acquisitions/Dispositions ▪ Responsible for sourcing, negotiating, and closing AR Global's real estate acquisitions ▪ Formerly east coast territory director for American Financial Realty Trust (AFRT) where he was responsible for the dispositio n a nd leasing activity for a portion of AFRT's 37.3 million square foot portfolio EXPERIENCED MANAGEMENT 14

Since inception, AFIN has paid out $5.09 per share of regular distributions in cash and DRIP. CONSISTENT DISTRIBUTIONS American Finance Trust, Inc. 15 (1) Totals as of each period presented represent cumulative distributions per share paid to stockholders of record who have held sh ares since May 13, 2013, the date when our distributions began to accrue. On April 9, 2013, our board of directors authorized, and we declared, distributions of $1.65 p er annum, per share of common stock. $5.09 per share (Cumulative) (1) $- $1.00 $2.00 $3.00 $4.00 $5.00 $6.00

American Finance Trust, Inc. 16 Strategic Review: We have announced that a special committee comprised entirely of independent directors (the "Special Committee") has initiate d a strategic review process to identify, examine and consider a range of strategic alternatives available to us with the objecti ve of maximizing shareholder value, including potential strategic transactions involving us and one or more entities sponsored by affiliates of AR Global Investments, LLC (the successor business to AR Capital, LLC, "AR Global" or our "Sponsor"). The Speci al Committee has not made a decision whether to recommend to our board of directors that we enter into any proposed transaction, and there can be no assurance that any of these preliminary discussions will result in a definitive agreement or that any suc h transactions would be approved by stockholders. Share Repurchase Plan: On June 28, 2016, in consideration of the strategic review process, the board of directors of the Company determined to amend th e Company’s existing share repurchase program (the “SRP” and the “SRP Amendment”) to provide for one twelve - month repurchase period for calendar year 2016 (the “2016 Repurchase Period”) instead of two semi - annual periods ending June 30 and December 31. The annual limit on repurchases under the SRP remains unchanged and continues to be limited to a maximum of 5.0% of the weighted average number of shares of common stock of the Company outstanding during its prior fiscal year (the “2015 Outstanding Shares”) and is subject to the terms and limitations set forth in the SRP. Accordingly, the 2016 Repurchase Perio d w ill be limited to a maximum of 5.0% of the 2015 Outstanding Shares and continue to be subject to the terms and conditions set for th in the SRP, as amended. Following calendar year 2016, the repurchase periods will return to two semi - annual periods and applicable limitations set forth in the SRP. The SRP Amendment also provides, for calendar year 2016 only, that any amendment s, suspensions or terminations of the SRP will become effective on the day following the Company’s public announcement of such amendments, suspension or termination. The SRP Amendment became effective on July 30, 2016 and only applies to repurchase periods in calendar year 2016. Dividend Reinvestment Program: On August 30, 2016, in consideration of the strategic review, the board of directors of the Company determined to suspend the Company’s distribution reinvestment plan effective immediately upon mailing a notice of the suspension to each distribution reinvestment plan participant. SUPPLEMENTAL INFORMATION

17 American Finance Trust, Inc. RISK FACTORS Our potential risks and uncertainties are presented in the section titled “Item 1 A . Risk Factors” disclosed in our Annual Report on Form 10 - K for the year ended December 31 , 2015 and our Quarterly Reports on Form 10 - Q filed from time to time . The following are some of the risks and uncertainties, although not all risks and uncertainties, that could cause our actual results to differ materially from those presented in our forward - looking statements : ▪ We have announced that the Special Committee has initiated a strategic review process to identify, examine and consider a range of strategic alternatives available to us with the objective of maximizing shareholder value, including potential strategic transactions involving us and one or more entities sponsored by affiliates of AR Global . The Special Committee has not made a decision whether to recommend to our board of directors that we enter into any proposed transaction, and there can be no assurance that any of these preliminary discussions will result in a definitive agreement or that any such transactions would be approved by stockholders . ▪ All of our executive officers are also officers, managers or holders of a direct or indirect controlling interest in American Finance Advisors, LLC (our "Advisor") or other entities under common control with AR Global . As a result, our executive officers, our Advisor and its affiliates face conflicts of interest, including significant conflicts created by our Advisor's compensation arrangements with us and other investment programs advised by affiliates of our Sponsor and conflicts in allocating time among these entities and us, which could negatively impact our operating results . ▪ Although we previously announced our intention to list our shares of common stock on the New York Stock Exchange, there can be no assurance that our shares of common stock will be listed . No public market currently exists, or may ever exist, for shares of our common stock and our shares are, and may continue to be, illiquid . ▪ We depend on tenants for our rental revenue and, accordingly, our rental revenue is dependent upon the success and economic viability of our tenants . ▪ Our tenants may not achieve our rental rate incentives and our expenses could be greater, which may impact our results of operations . 17

18 American Finance Trust, Inc. RISK FACTORS ▪ We have not generated, and in the future may not generate, operating cash flows sufficient to cover 100 % of our distributions, and, as such, we may be forced to source distributions from borrowings, which may be at unfavorable rates, or depend on our Advisor to waive reimbursement of certain expenses or fees . There is no assurance that our Advisor will waive reimbursement of expenses or fees . ▪ We may be unable to pay or maintain cash distributions at the current rate or increase distributions over time . ▪ We are obligated to pay fees, which may be substantial, to our Advisor and its affiliates . ▪ We are subject to risks associated with any dislocation or liquidity disruptions that may exist or occur in the credit markets of the United States of America . ▪ We may fail to continue to qualify to be treated as a real estate investment trust for U . S . federal income tax purposes, which would result in higher taxes, may adversely affect our operations and would reduce the value of an investment in our common stock and our cash available for distributions . ▪ We may be deemed by regulators to be an investment company under the Investment Company Act of 1940 , as amended (the "Investment Company Act"), and thus subject to regulation under the Investment Company Act . 18

AmericanFinanceTrust.com ▪ For account information, including balances and the status of submitted paperwork, please call us at (866) 902 - 0063 ▪ Financial Advisors may view client accounts, statements and tax forms at www.dstvision.com ▪ Shareholders may access their accounts at www.ar - global.com