Attached files
| file | filename |
|---|---|
| 8-K - 2018 GRC 8-K - EDISON INTERNATIONAL | eix-sceform8xkregrcfiling.htm |
September 1, 2016
2018 SCE General Rate Case Overview

September 1, 2016 1
Forward-Looking Statements
Statements contained in this presentation about future performance, including, without limitation,
operating results, capital expenditures, rate base growth, dividend policy, financial outlook, and other
statements that are not purely historical, are forward-looking statements. These forward-looking
statements reflect our current expectations; however, such statements involve risks and uncertainties.
Actual results could differ materially from current expectations. These forward-looking statements
represent our expectations only as of the date of this presentation, and Edison International assumes
no duty to update them to reflect new information, events or circumstances. Important factors that
could cause different results include, but are not limited to the:
• ability of SCE to recover its costs in a timely manner from its customers through regulated rates,
including regulatory assets related to San Onofre and proposed spending on grid modernization;
• decisions and other actions by the CPUC, the FERC, the NRC and other regulatory authorities,
including the determinations of authorized rates of return or return on equity, approval of proposed
spending on grid modernization, the outcome of San Onofre CPUC proceedings and delays in
regulatory actions;
• risks inherent in the construction of transmission and distribution infrastructure replacement and
expansion projects, including those related to project site identification, public opposition,
environmental mitigation, construction, permitting, power curtailment costs (payments due under
power contracts in the event there is insufficient transmission to enable acceptance of power
delivery), and governmental approvals; and
• risks associated with the retirement and decommissioning of nuclear generating facilities.
Other important factors are discussed under the headings “Risk Factors” and “Management’s
Discussion and Analysis” in Edison International’s Form 10-K, most recent Form 10-Q, and other reports
filed with the Securities and Exchange Commission, which are available on our website:
www.edisoninvestor.com. These filings also provide additional information on historical and other
factual data contained in this presentation.
September 1, 2016 2
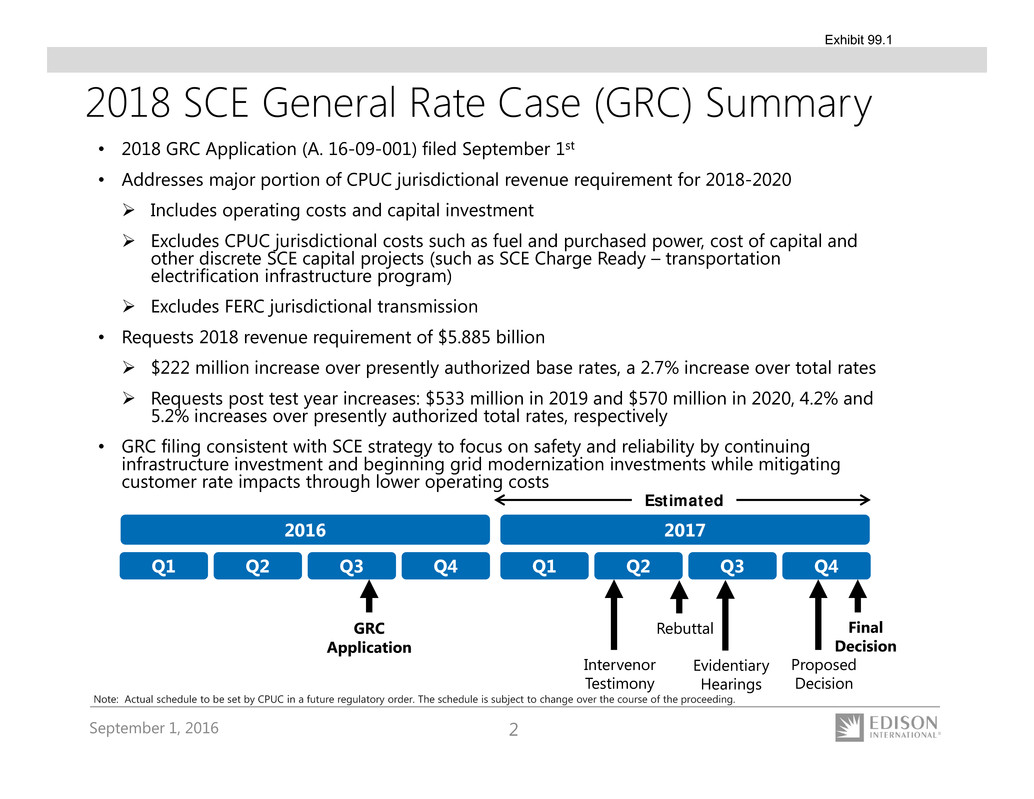
• 2018 GRC Application (A. 16-09-001) filed September 1st
• Addresses major portion of CPUC jurisdictional revenue requirement for 2018-2020
Includes operating costs and capital investment
Excludes CPUC jurisdictional costs such as fuel and purchased power, cost of capital and
other discrete SCE capital projects (such as SCE Charge Ready – transportation
electrification infrastructure program)
Excludes FERC jurisdictional transmission
• Requests 2018 revenue requirement of $5.885 billion
$222 million increase over presently authorized base rates, a 2.7% increase over total rates
Requests post test year increases: $533 million in 2019 and $570 million in 2020, 4.2% and
5.2% increases over presently authorized total rates, respectively
• GRC filing consistent with SCE strategy to focus on safety and reliability by continuing
infrastructure investment and beginning grid modernization investments while mitigating
customer rate impacts through lower operating costs
GRC
Application
Rebuttal Final
Decision
2016 2017
Q1 Q2 Q3 Q4 Q1 Q2 Q3 Q4
Estimated
Intervenor
Testimony
Proposed
Decision
2018 SCE General Rate Case (GRC) Summary
Evidentiary
Hearings
Note: Actual schedule to be set by CPUC in a future regulatory order. The schedule is subject to change over the course of the proceeding.
September 1, 2016 3
• Capital expenditures include $2.1 billion of
proposed grid modernization capital to
support improved safety and reliability and
increased levels of distributed energy
resources (DER)
Requested approval to establish a
memorandum account to facilitate $210
million of grid modernization capital
expenditures in 2016-2017; these
expenditures support 2018 GRC grid
modernization capital request
May need to evaluate grid modernization
capital plan if memorandum account is
not approved
• Need to increase depreciation expense to
reflect updated cost of removal estimates1
Limiting cost of removal request to
mitigate customer rate impact beginning
with $84 million increase in 2018
Further increases will likely be required
over multiple GRC cycles
Items Carried Over from 2015 GRC New Items from 2018 GRC
• Requests continuation of Tax Accounting
Memorandum Account (TAMA) to adjust
revenues annually for over and
undercollection of specified tax items
• Forecasting over $85 million in 2018 O&M
savings from Operational Excellence
initiatives
• Requests recovery for short-term incentive
compensation plans for full-time employees
($41 million disallowance in 2015 GRC
decision)
• Requests continuation of pole loading
capital recovery through balancing account
1. Cost of removal is the cost to remove existing equipment that is being replaced
2018 SCE GRC Summary (cont.)
September 1, 2016 4
SCE Capital Expenditure Forecast
Note: Forecasted capital spending includes CPUC, FERC and other spending. See “Capital Expenditure/Rate Base Detailed Forecast” in Appendix.
($ billions)
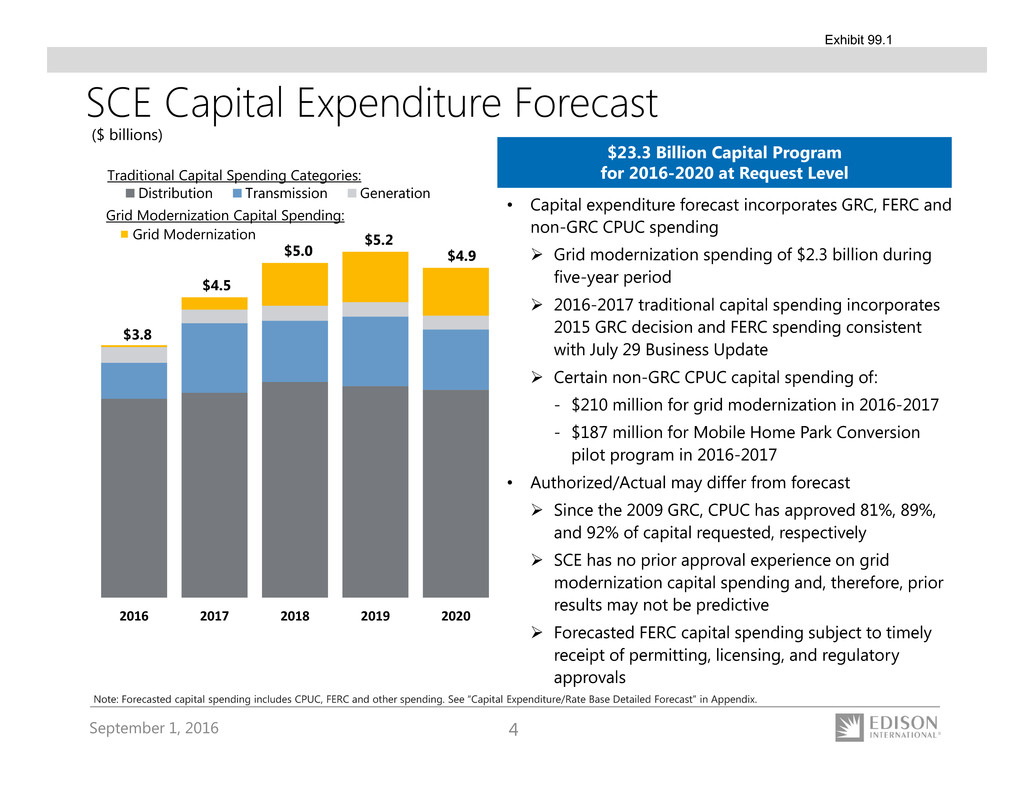
$3.8
$4.5
$5.0
$5.2
$4.9
2016 2017 2018 2019 2020
Distribution Transmission Generation
Traditional Capital Spending Categories:
Grid Modernization Capital Spending:
Grid Modernization
$23.3 Billion Capital Program
for 2016-2020 at Request Level
• Capital expenditure forecast incorporates GRC, FERC and
non-GRC CPUC spending
Grid modernization spending of $2.3 billion during
five-year period
2016-2017 traditional capital spending incorporates
2015 GRC decision and FERC spending consistent
with July 29 Business Update
Certain non-GRC CPUC capital spending of:
- $210 million for grid modernization in 2016-2017
- $187 million for Mobile Home Park Conversion
pilot program in 2016-2017
• Authorized/Actual may differ from forecast
Since the 2009 GRC, CPUC has approved 81%, 89%,
and 92% of capital requested, respectively
SCE has no prior approval experience on grid
modernization capital spending and, therefore, prior
results may not be predictive
Forecasted FERC capital spending subject to timely
receipt of permitting, licensing, and regulatory
approvals
September 1, 2016 5
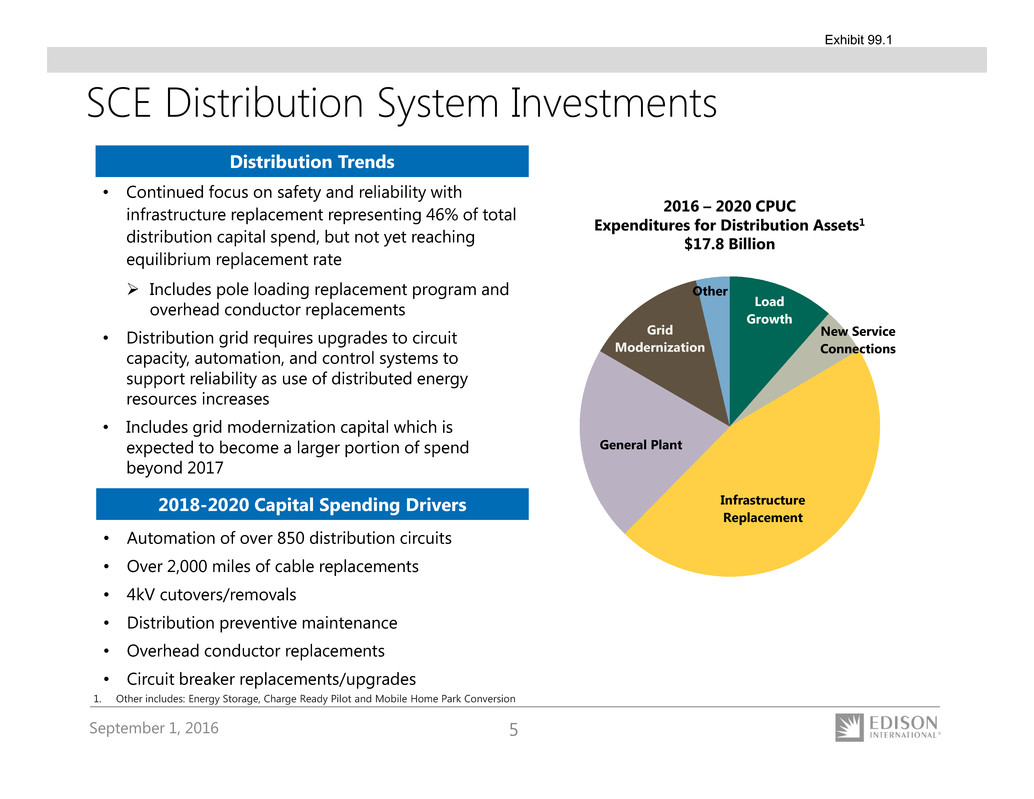
SCE Distribution System Investments
1. Other includes: Energy Storage, Charge Ready Pilot and Mobile Home Park Conversion
Distribution Trends
• Continued focus on safety and reliability with
infrastructure replacement representing 46% of total
distribution capital spend, but not yet reaching
equilibrium replacement rate
Includes pole loading replacement program and
overhead conductor replacements
• Distribution grid requires upgrades to circuit
capacity, automation, and control systems to
support reliability as use of distributed energy
resources increases
• Includes grid modernization capital which is
expected to become a larger portion of spend
beyond 2017
2016 – 2020 CPUC
Expenditures for Distribution Assets1
$17.8 Billion
2018-2020 Capital Spending Drivers
• Automation of over 850 distribution circuits
• Over 2,000 miles of cable replacements
• 4kV cutovers/removals
• Distribution preventive maintenance
• Overhead conductor replacements
• Circuit breaker replacements/upgrades
Load
Growth
New Service
Connections
Infrastructure
Replacement
General Plant
Grid
Modernization
Other
September 1, 2016 6
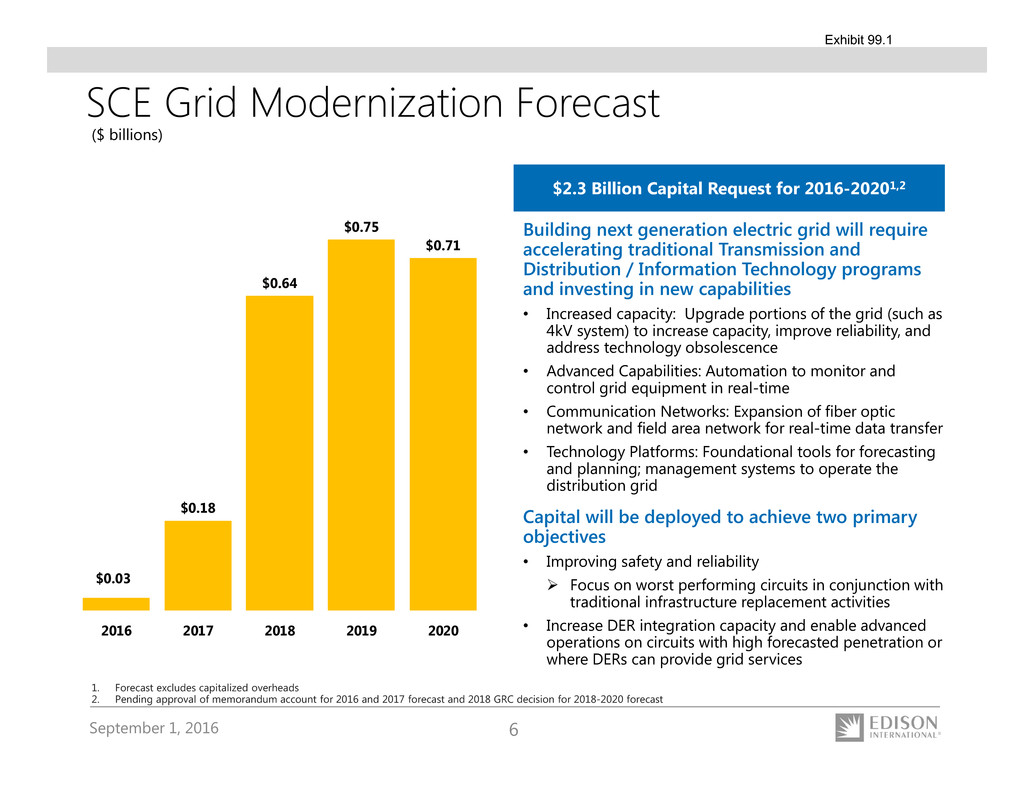
$0.03
$0.18
$0.64
$0.75
$0.71
2016 2017 2018 2019 2020
Building next generation electric grid will require
accelerating traditional Transmission and
Distribution / Information Technology programs
and investing in new capabilities
• Increased capacity: Upgrade portions of the grid (such as
4kV system) to increase capacity, improve reliability, and
address technology obsolescence
• Advanced Capabilities: Automation to monitor and
control grid equipment in real-time
• Communication Networks: Expansion of fiber optic
network and field area network for real-time data transfer
• Technology Platforms: Foundational tools for forecasting
and planning; management systems to operate the
distribution grid
Capital will be deployed to achieve two primary
objectives
• Improving safety and reliability
Focus on worst performing circuits in conjunction with
traditional infrastructure replacement activities
• Increase DER integration capacity and enable advanced
operations on circuits with high forecasted penetration or
where DERs can provide grid services
1. Forecast excludes capitalized overheads
2. Pending approval of memorandum account for 2016 and 2017 forecast and 2018 GRC decision for 2018-2020 forecast
SCE Grid Modernization Forecast
($ billions)
$2.3 Billion Capital Request for 2016-20201,2
September 1, 2016 7
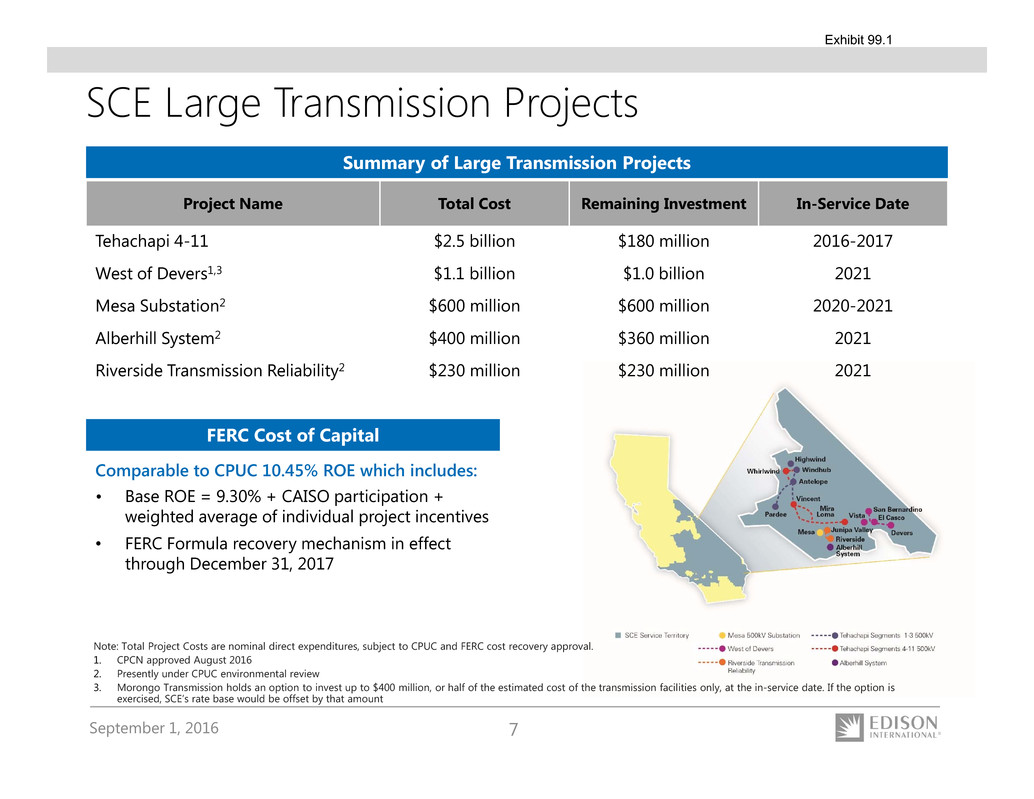
SCE Large Transmission Projects
Note: Total Project Costs are nominal direct expenditures, subject to CPUC and FERC cost recovery approval.
1. CPCN approved August 2016
2. Presently under CPUC environmental review
3. Morongo Transmission holds an option to invest up to $400 million, or half of the estimated cost of the transmission facilities only, at the in-service date. If the option is
exercised, SCE’s rate base would be offset by that amount
FERC Cost of Capital
Comparable to CPUC 10.45% ROE which includes:
• Base ROE = 9.30% + CAISO participation +
weighted average of individual project incentives
• FERC Formula recovery mechanism in effect
through December 31, 2017
Summary of Large Transmission Projects
Project Name Total Cost Remaining Investment In-Service Date
Tehachapi 4-11 $2.5 billion $180 million 2016-2017
West of Devers1,3 $1.1 billion $1.0 billion 2021
Mesa Substation2 $600 million $600 million 2020-2021
Alberhill System2 $400 million $360 million 2021
Riverside Transmission Reliability2 $230 million $230 million 2021
September 1, 2016 8
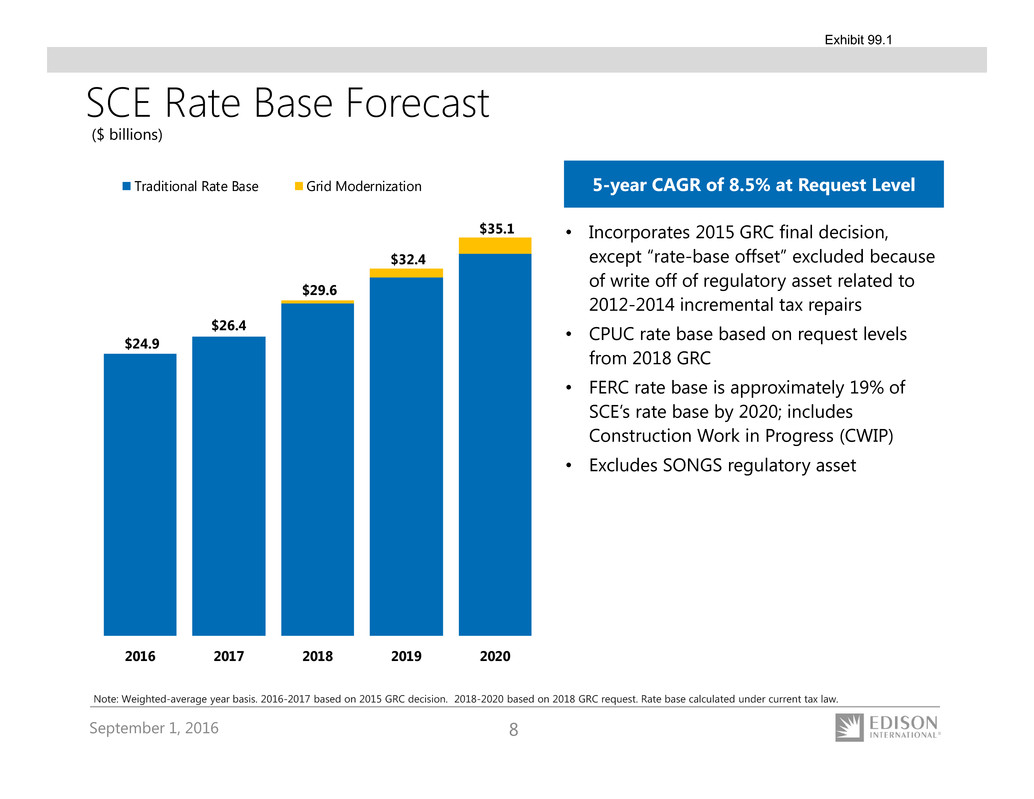
SCE Rate Base Forecast
• Incorporates 2015 GRC final decision,
except “rate-base offset” excluded because
of write off of regulatory asset related to
2012-2014 incremental tax repairs
• CPUC rate base based on request levels
from 2018 GRC
• FERC rate base is approximately 19% of
SCE’s rate base by 2020; includes
Construction Work in Progress (CWIP)
• Excludes SONGS regulatory asset
($ billions)
Note: Weighted-average year basis. 2016-2017 based on 2015 GRC decision. 2018-2020 based on 2018 GRC request. Rate base calculated under current tax law.
5-year CAGR of 8.5% at Request Level
$24.9
$26.4
$29.6
$32.4
$35.1
2016 2017 2018 2019 2020
Traditional Rate Base Grid Modernization
September 1, 2016 9
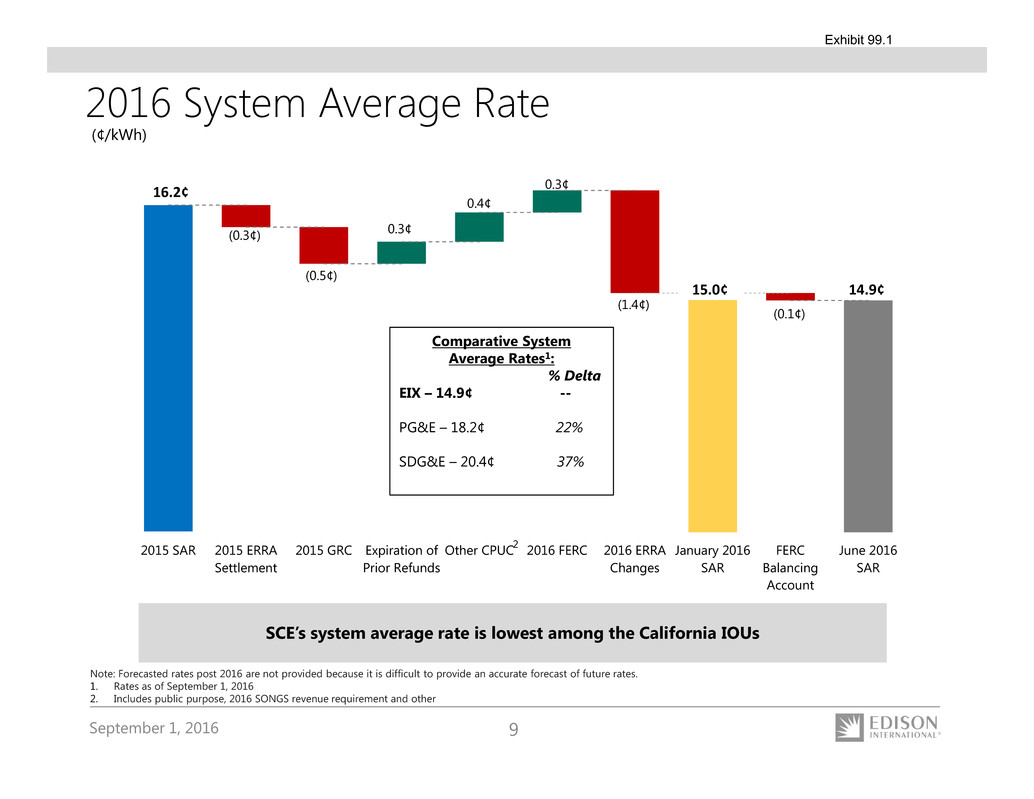
(0.3¢)
(0.5¢)
(1.4¢)
(0.1¢)
0.3¢
0.4¢
0.3¢
2015 SAR 2015 ERRA
Settlement
2015 GRC Expiration of
Prior Refunds
Other CPUC 2016 FERC 2016 ERRA
Changes
January 2016
SAR
FERC
Balancing
Account
June 2016
SAR
16.2¢
14.9¢15.0¢
2016 System Average Rate
SCE’s system average rate is lowest among the California IOUs
(¢/kWh)
2
Comparative System
Average Rates1:
% Delta
EIX – 14.9¢ --
PG&E – 18.2¢ 22%
SDG&E – 20.4¢ 37%
Note: Forecasted rates post 2016 are not provided because it is difficult to provide an accurate forecast of future rates.
1. Rates as of September 1, 2016
2. Includes public purpose, 2016 SONGS revenue requirement and other

September 1, 2016 10
Appendix
September 1, 2016 11
SCE Tax Memorandum Account
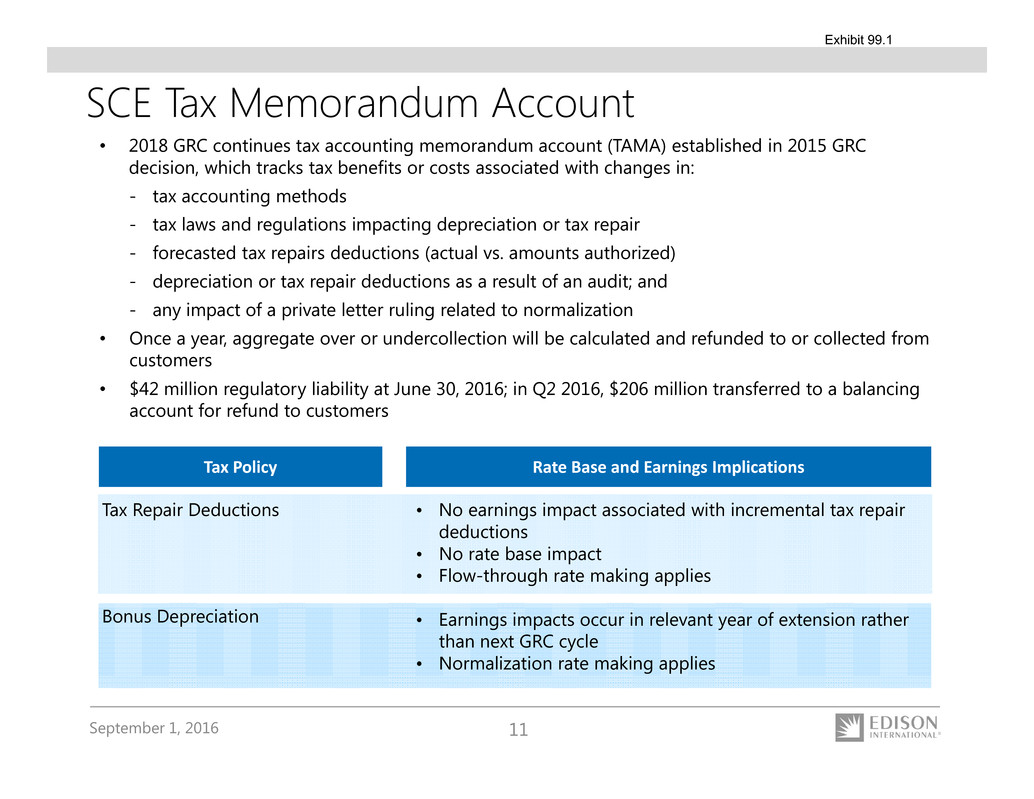
• 2018 GRC continues tax accounting memorandum account (TAMA) established in 2015 GRC
decision, which tracks tax benefits or costs associated with changes in:
- tax accounting methods
- tax laws and regulations impacting depreciation or tax repair
- forecasted tax repairs deductions (actual vs. amounts authorized)
- depreciation or tax repair deductions as a result of an audit; and
- any impact of a private letter ruling related to normalization
• Once a year, aggregate over or undercollection will be calculated and refunded to or collected from
customers
• $42 million regulatory liability at June 30, 2016; in Q2 2016, $206 million transferred to a balancing
account for refund to customers
Tax Repair Deductions
Bonus Depreciation
• No earnings impact associated with incremental tax repair
deductions
• No rate base impact
• Flow-through rate making applies
• Earnings impacts occur in relevant year of extension rather
than next GRC cycle
• Normalization rate making applies
Tax Policy Rate Base and Earnings Implications
September 1, 2016 12
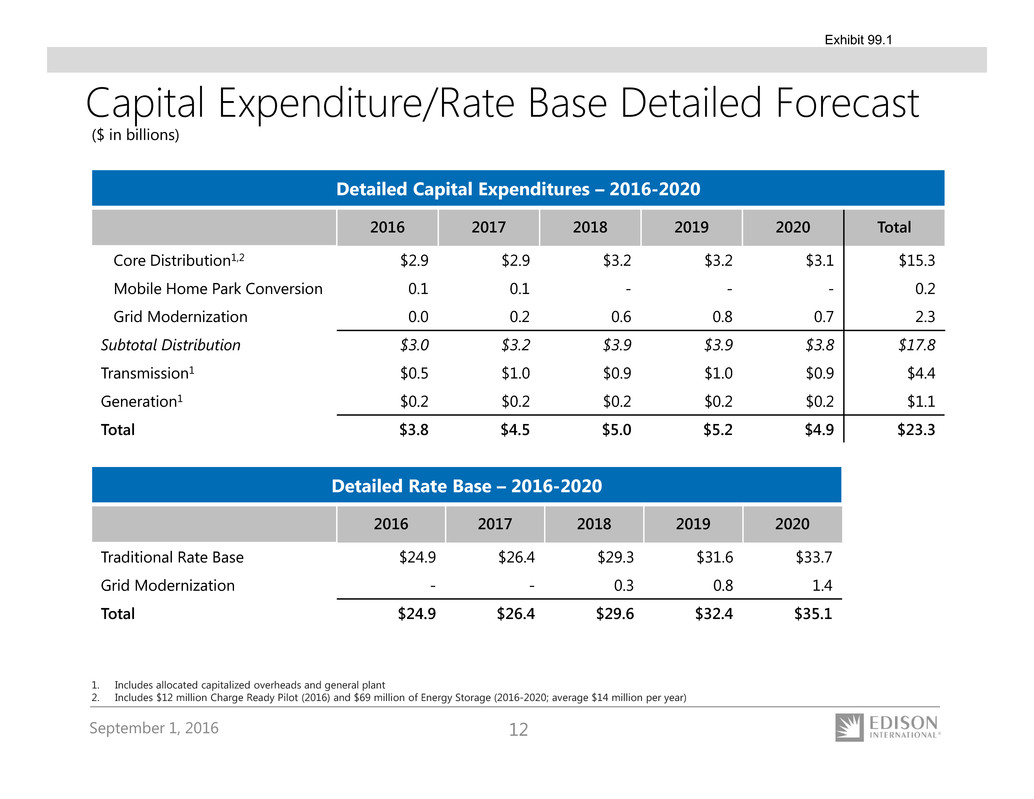
Detailed Capital Expenditures – 2016-2020
2016 2017 2018 2019 2020 Total
Core Distribution1,2 $2.9 $2.9 $3.2 $3.2 $3.1 $15.3
Mobile Home Park Conversion 0.1 0.1 - - - 0.2
Grid Modernization 0.0 0.2 0.6 0.8 0.7 2.3
Subtotal Distribution $3.0 $3.2 $3.9 $3.9 $3.8 $17.8
Transmission1 $0.5 $1.0 $0.9 $1.0 $0.9 $4.4
Generation1 $0.2 $0.2 $0.2 $0.2 $0.2 $1.1
Total $3.8 $4.5 $5.0 $5.2 $4.9 $23.3
Capital Expenditure/Rate Base Detailed Forecast
Detailed Rate Base – 2016-2020
2016 2017 2018 2019 2020
Traditional Rate Base $24.9 $26.4 $29.3 $31.6 $33.7
Grid Modernization - - 0.3 0.8 1.4
Total $24.9 $26.4 $29.6 $32.4 $35.1
1. Includes allocated capitalized overheads and general plant
2. Includes $12 million Charge Ready Pilot (2016) and $69 million of Energy Storage (2016-2020; average $14 million per year)
($ in billions)
